Embed Size (px)
Citation preview

8-1
8-2
Chapter 8
MetricsMetrics
McGraw-Hill/Irwin Copyright © 2004 by The McGraw-Hill Companies, Inc. All rights reserved.
8-3Chapter 8: MetricsChapter 8: Metrics
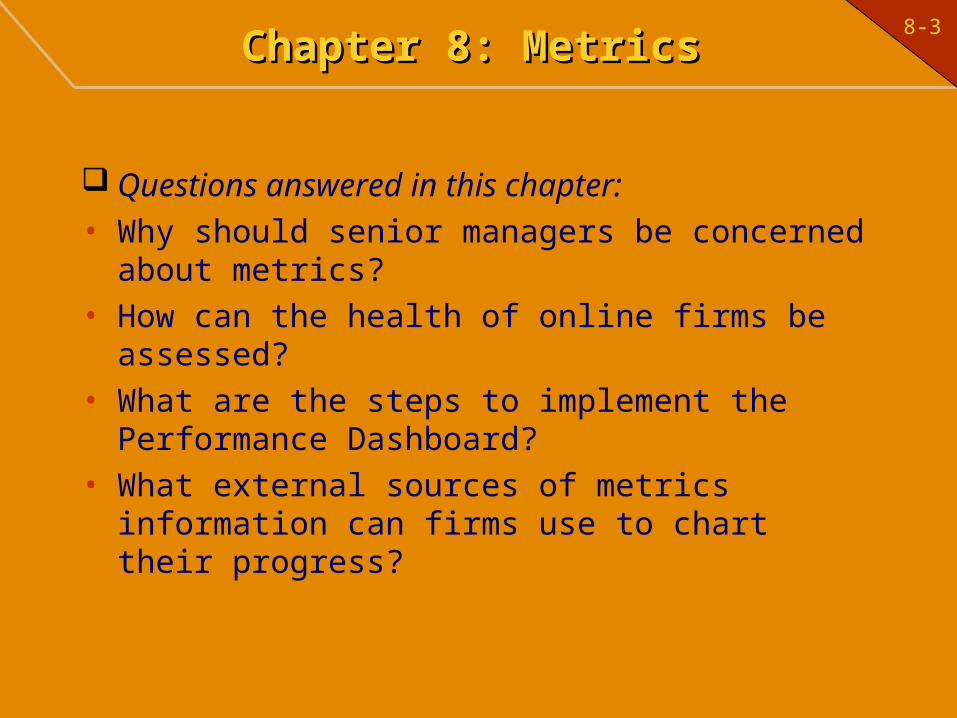
Questions answered in this chapter:• Why should senior managers be concerned about
metrics?• How can the health of online firms be assessed?• What are the steps to implement the Performance
Dashboard?• What external sources of metrics information can
firms use to chart their progress?
8-4Why Senior Managers Should Why Senior Managers Should Be Concerned About MetricsBe Concerned About Metrics
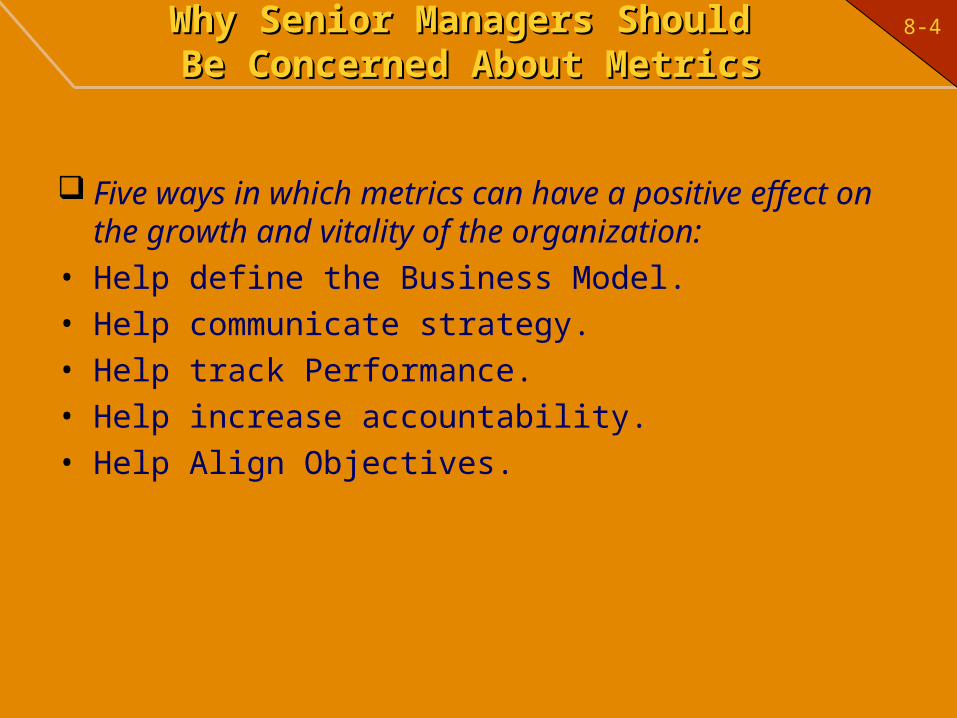
Five ways in which metrics can have a positive effect on the growth and vitality of the organization:
• Help define the Business Model.• Help communicate strategy.• Help track Performance.• Help increase accountability.• Help Align Objectives.
8-5Current Challenges to Specifying Current Challenges to Specifying Metrics for Online BusinessesMetrics for Online Businesses
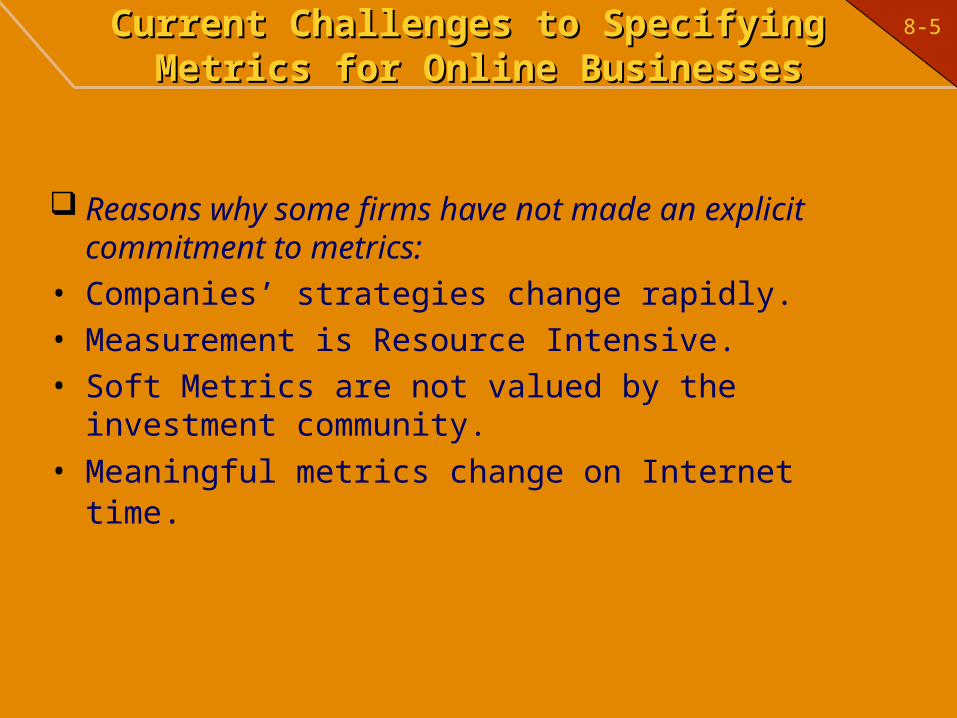
Reasons why some firms have not made an explicit commitment to metrics:
• Companies’ strategies change rapidly.• Measurement is Resource Intensive.• Soft Metrics are not valued by the investment community.
• Meaningful metrics change on Internet time.
8-6Assessing the Health of Online FirmsAssessing the Health of Online Firms
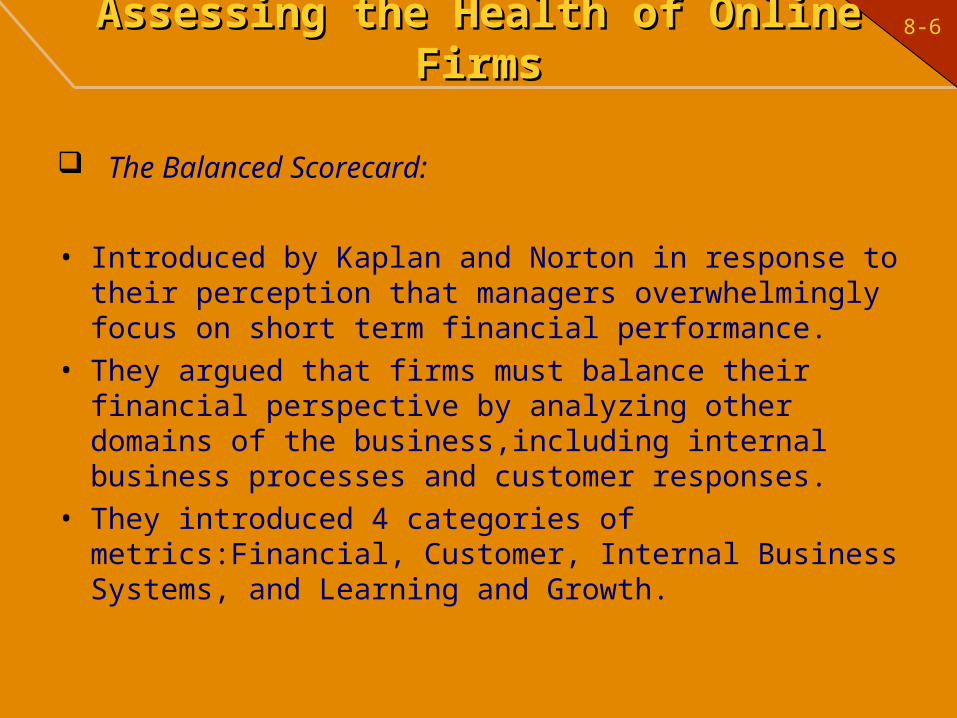
The Balanced Scorecard:
• Introduced by Kaplan and Norton in response to their perception that managers overwhelmingly focus on short term financial performance.
• They argued that firms must balance their financial perspective by analyzing other domains of the business,including internal business processes and customer responses.
• They introduced 4 categories of metrics:Financial, Customer, Internal Business Systems, and Learning and Growth.
8-7Assessing the Health of Online Firms (cont’d)Assessing the Health of Online Firms (cont’d)
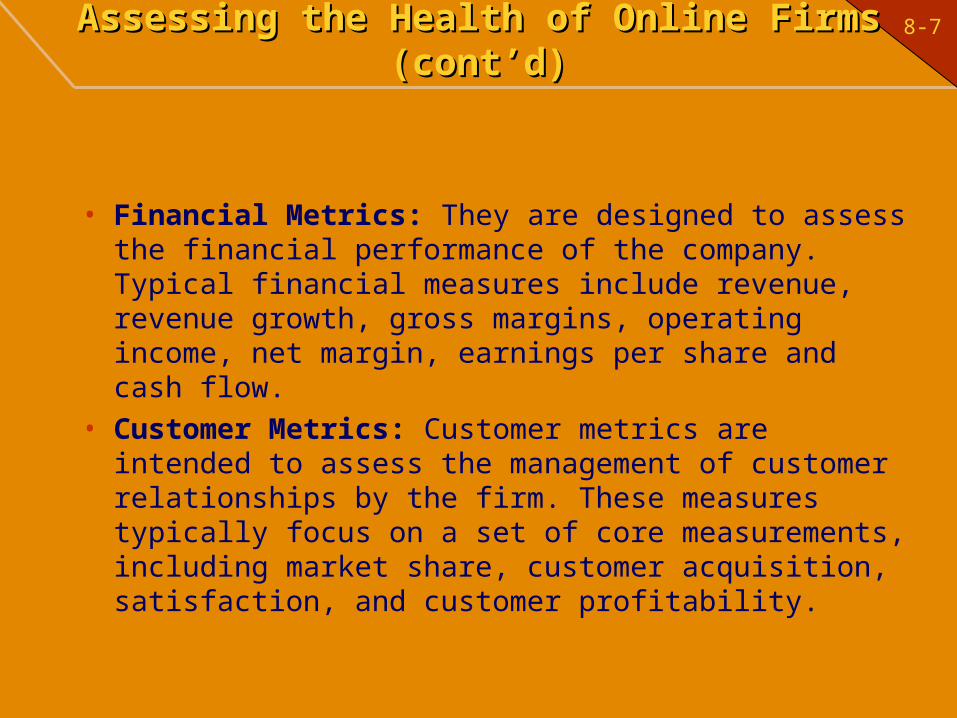
• Financial Metrics: They are designed to assess the financial performance of the company. Typical financial measures include revenue, revenue growth, gross margins, operating income, net margin, earnings per share and cash flow.
• Customer Metrics: Customer metrics are intended to assess the management of customer relationships by the firm. These measures typically focus on a set of core measurements, including market share, customer acquisition, satisfaction, and customer profitability.
8-8Exhibit 8-1: The Balanced Scorecard – Exhibit 8-1: The Balanced Scorecard – Strategy Into Operational TermsStrategy Into Operational Terms
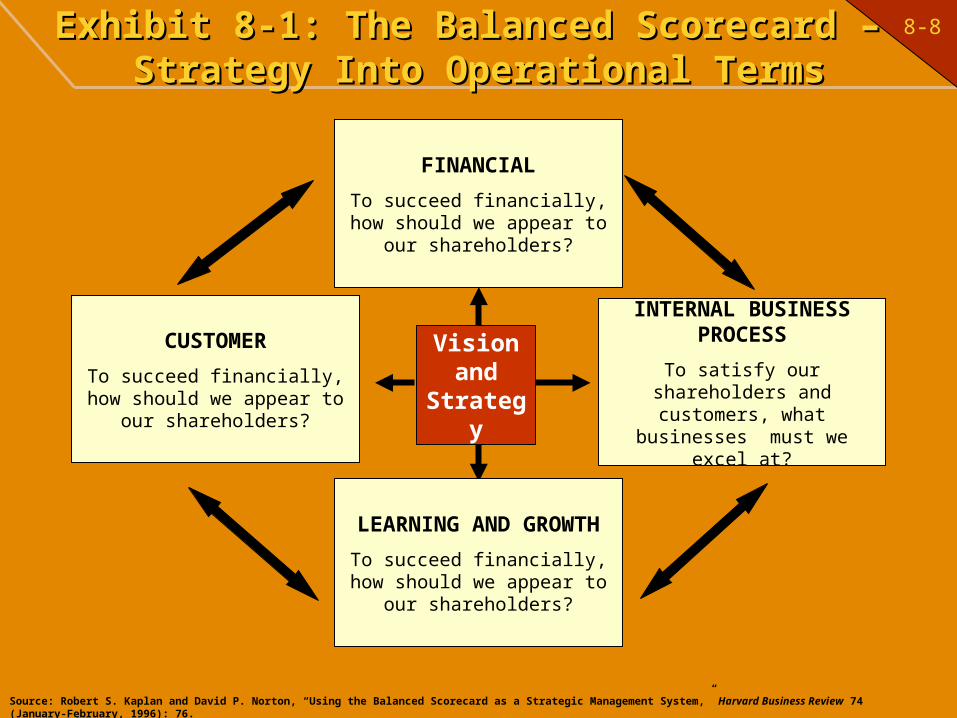
FINANCIAL
To succeed financially, how should we appear to our
shareholders?
INTERNAL BUSINESS PROCESS
To satisfy our shareholders and customers, what businesses
must we excel at?
CUSTOMER
To succeed financially, how should we appear to our
shareholders?
LEARNING AND GROWTH
To succeed financially, how should we appear to our
shareholders?
Visionand
Strategy
Source: Robert S. Kaplan and David P. Norton, “Using the Balanced Scorecard as a Strategic Management System,” Harvard Business Review 74 (January-February, 1996): 76.
8-9Assessing the Health of Online Firms Assessing the Health of Online Firms (cont’d)(cont’d)
• Internal Business Process Metrics: These focus on operations inside the company. Kaplan and Norton divided them into three groups: – Innovation – Operations– Postsale service
• Learning and Growth Metrics: These broadly cover employee, information systems, and motivation metrics.
8-10Limitations of the Balanced ScorecardLimitations of the Balanced Scorecard
• No clear definition of strategy or business models.
• Unclear location of organizational capabilities or resources in the framework.
• Unclear where partnerships reside in the framework.
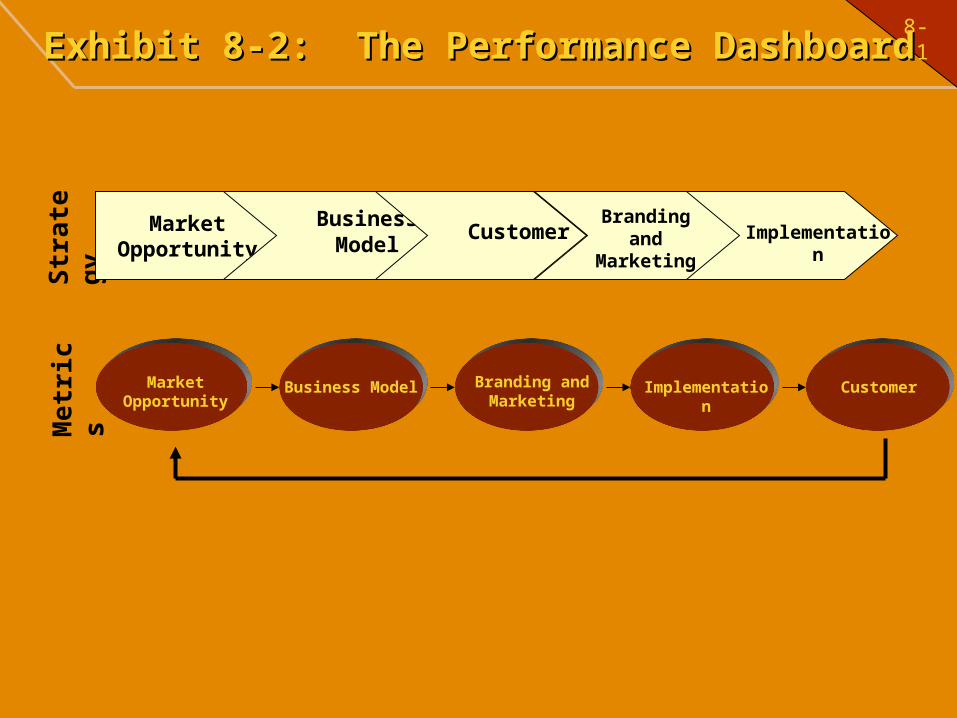
8-11Exhibit 8-2: The Performance DashboardExhibit 8-2: The Performance Dashboard
Str
ate
gy
Me
tric
s
Market Opportunity
Business Model
Customer Branding
and Marketing
Market Opportunity
Business Model Branding and Marketing
Implementation Customer
Implementation
8-12The Performance DashboardThe Performance Dashboard
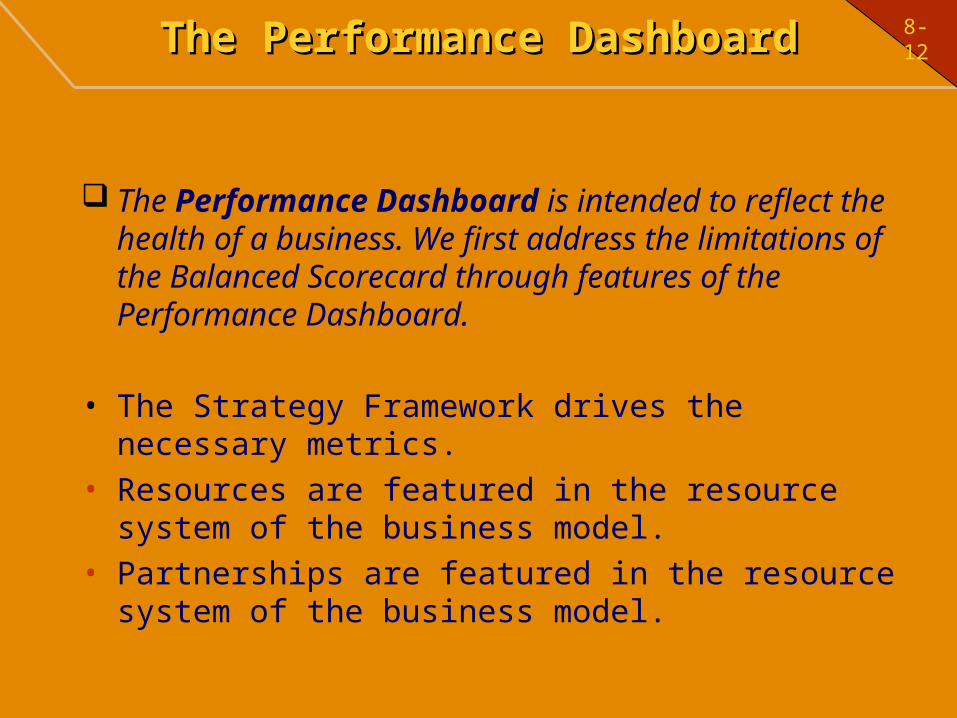
The Performance Dashboard is intended to reflect the health of a business. We first address the limitations of the Balanced Scorecard through features of the Performance Dashboard.
• The Strategy Framework drives the necessary metrics.• Resources are featured in the resource system of the
business model.• Partnerships are featured in the resource system of the
business model.
8-13Components of the Performance DashboardComponents of the Performance Dashboard
The Performance Dashboard is composed of five categories of metrics:
- Market Opportunity Metrics: Market opportunity metrics assess the degree to which the firm can accurately gauge the market opportunity. Generic indicators include the ability of the firm to include the most attractive segments, the ability of the firm to understand and map the competitors’ strategy evolution and the ability of the firm to track the evolution of target segment needs.
8-14Components of the Performance Components of the Performance Dashboard (cont’d)Dashboard (cont’d)
- Business Model Metrics: Business model metrics capture the subcomponents of the business model: the value proposition, egg diagram, resource system, and financial metrics.
– Value proposition or Cluster Benefits: The value proposition is composed of three parts: target segment, benefits offered, and capabilities that drive the benefits. Metrics for this assessment would focus on customer perceptions of the benefits that a given site offers relative to competitors.
8-15Components of the Performance Components of the Performance Dashboard (cont’d)Dashboard (cont’d)
– Online Offering Metrics: Metrics should reflect the entire decision process from pre- purchase to post purchase. Offering metrics focus more on the nuts-and-bolts features, attributes and functionality of the site.
– Resource System Metrics: The resource system is based on the benefits offered to consumers. From these benefits, the firm would analyze the capabilities that are necessary to supply the benefits.
– Financial Metrics: Captures the revenues, costs, profits, and balance-sheet metrics of the firm

8-16
- Marketing and Branding Metrics- Marketing and Branding Metrics: These focus on
marketing communications and branding effectiveness.
- Implementation Metrics- Implementation Metrics: These focus on the
effectiveness of a company’s human resources program as well as its processes, organizational structure, systems (including information, incentives, and rewards), coordination mechanisms, culture and management style, and technology systems.
Components of the Performance Components of the Performance Dashboard (cont’d)Dashboard (cont’d)
8-17
- Customer Metrics– Customer Interface Metrics: Measures the
customer’s experience with the technology interface; that is, the customer’s response to the 7C’s of the interface.
– Customer Outcome Metrics: This captures output metrics such as overall costs of satisfaction, average order size, and customer profitability.
Components of the Performance Components of the Performance Dashboard (cont’d)Dashboard (cont’d)
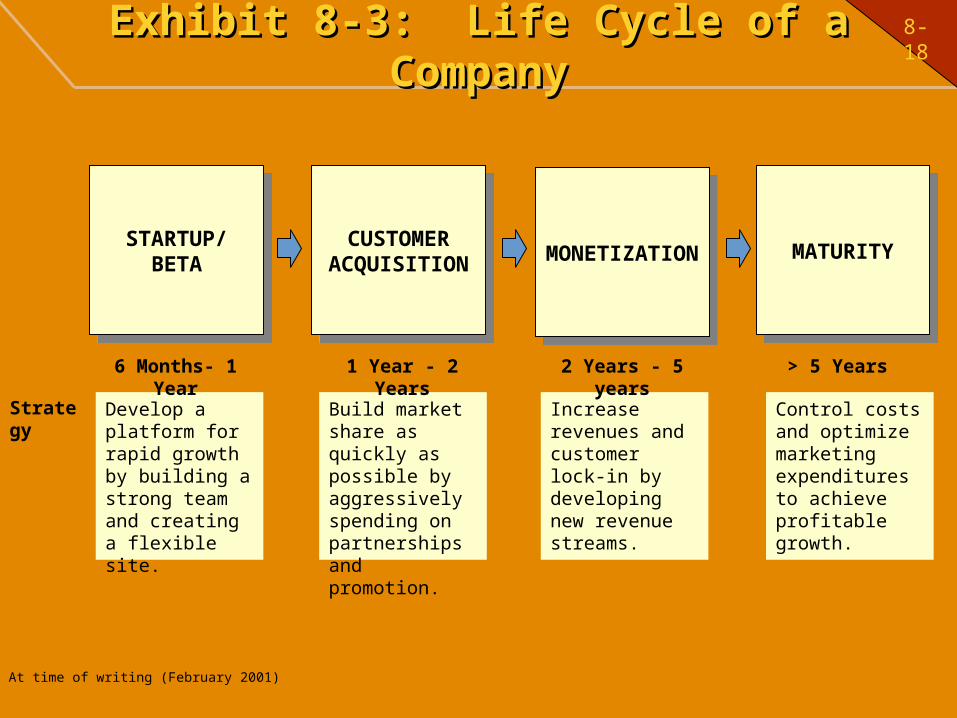
8-18Exhibit 8-3: Life Cycle of a CompanyExhibit 8-3: Life Cycle of a Company
STARTUP/BETA
STARTUP/BETA
CUSTOMERACQUISITION
CUSTOMERACQUISITION MONETIZATIONMONETIZATION MATURITYMATURITY
Develop a platform for rapid growth by building a strong team and creating a flexible site.
Build market share as quickly as possible by aggressively spending on partnerships and promotion.
Increase revenues and customer lock-in by developing new revenue streams.
Control costs and optimize marketing expenditures to achieve profitable growth.
6 Months- 1 Year 1 Year - 2 Years 2 Years - 5 years > 5 Years
Strategy
* At time of writing (February 2001)
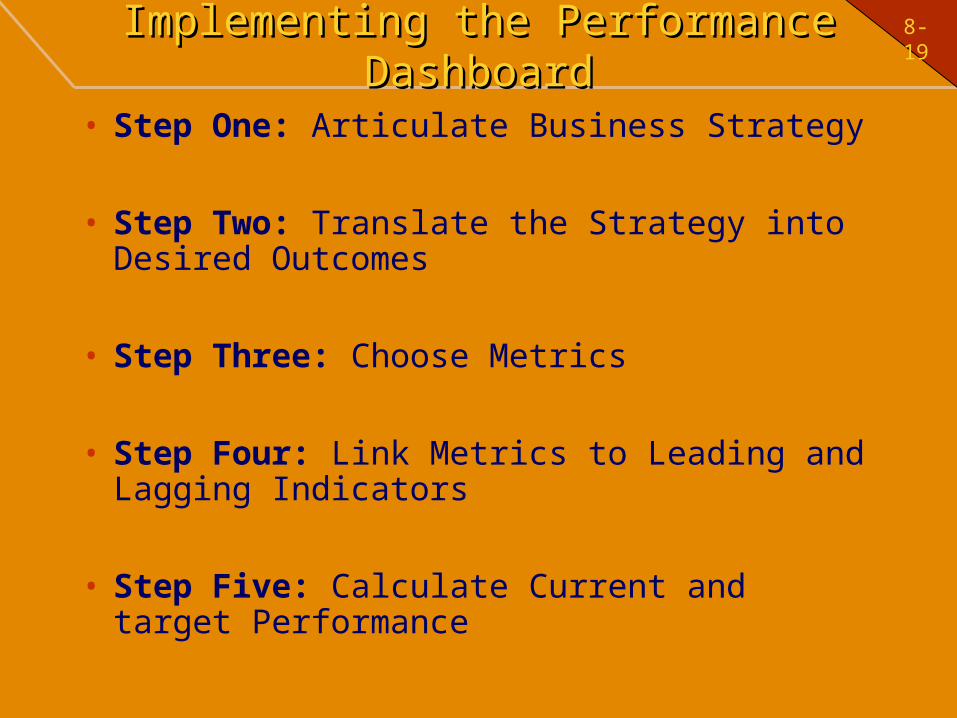
8-19Implementing the Performance DashboardImplementing the Performance Dashboard
• Step One: Articulate Business Strategy
• Step Two: Translate the Strategy into Desired Outcomes
• Step Three: Choose Metrics
• Step Four: Link Metrics to Leading and Lagging Indicators
• Step Five: Calculate Current and target Performance
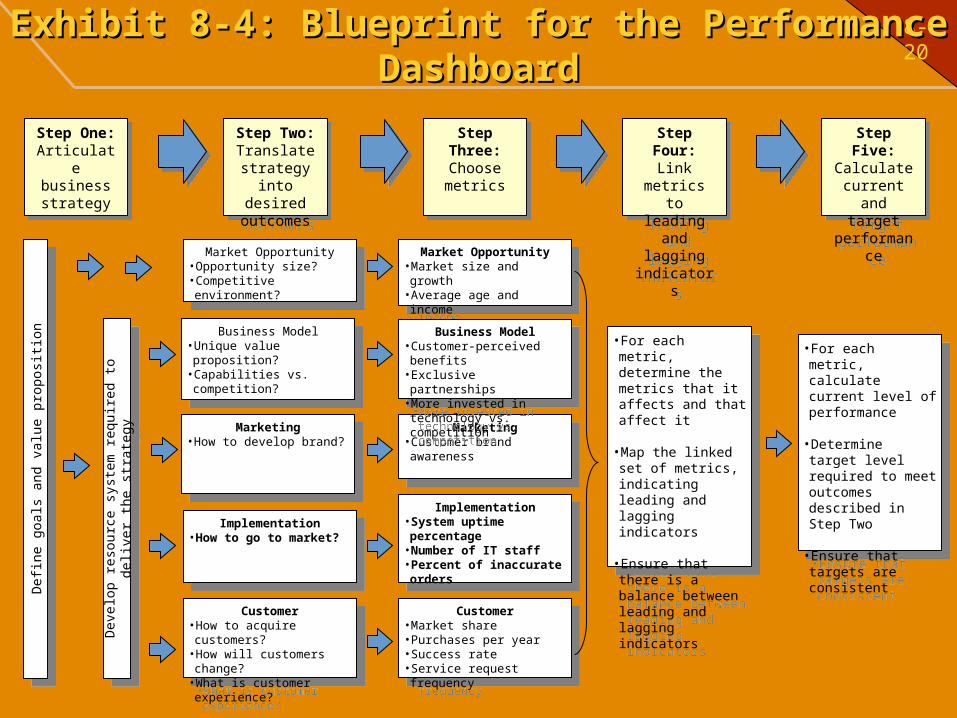
8-20Exhibit 8-4: Blueprint for the Performance Exhibit 8-4: Blueprint for the Performance DashboardDashboard
Step One: Articulate business strategy
Step One: Articulate business strategy
Step Two: Translate
strategy into desired
outcomes
Step Two: Translate
strategy into desired
outcomes
Step Three: Choose metrics
Step Three: Choose metrics
Step Four: Link metrics
to leading and lagging
indicators
Step Four: Link metrics
to leading and lagging
indicators
Step Five: Calculate
current and target
performance
Step Five: Calculate
current and target
performance
Def
ine
goal
s an
d va
lue
prop
ositi
onD
efin
e go
als
and
valu
e pr
opos
ition
Market Opportunity• Opportunity size?• Competitive environment?
Market Opportunity• Opportunity size?• Competitive environment?
Customer• How to acquire customers?• How will customers change?• What is customer experience?
Customer• How to acquire customers?• How will customers change?• What is customer experience?
Marketing• How to develop brand?
Marketing• How to develop brand?
Implementation• How to go to market?
Implementation• How to go to market?
Market Opportunity• Market size and growth• Average age and income• Competitor concentration
Market Opportunity• Market size and growth• Average age and income• Competitor concentration
Customer• Market share• Purchases per year• Success rate• Service request frequency
Customer• Market share• Purchases per year• Success rate• Service request frequency
Marketing• Customer brand awareness
Marketing• Customer brand awareness
Implementation• System uptime percentage• Number of IT staff• Percent of inaccurate orders
Implementation• System uptime percentage• Number of IT staff• Percent of inaccurate orders
•For each metric, determine the metrics that it affects and that affect it
•Map the linked set of metrics, indicating leading and lagging indicators
•Ensure that there is a balance between leading and lagging indicators
•For each metric, determine the metrics that it affects and that affect it
•Map the linked set of metrics, indicating leading and lagging indicators
•Ensure that there is a balance between leading and lagging indicators
Dev
elop
res
ourc
e sy
stem
req
uire
d to
del
iver
the
stra
tegy
Dev
elop
res
ourc
e sy
stem
req
uire
d to
del
iver
the
stra
tegy
•For each metric, calculate current level of performance
•Determine target level required to meet outcomes described in Step Two
•Ensure that targets are consistent
•For each metric, calculate current level of performance
•Determine target level required to meet outcomes described in Step Two
•Ensure that targets are consistent
Business Model• Unique value proposition?• Capabilities vs. competition?
Business Model• Unique value proposition?• Capabilities vs. competition?
Business Model• Customer-perceived benefits• Exclusive partnerships• More invested in technology vs. competition
Business Model• Customer-perceived benefits• Exclusive partnerships• More invested in technology vs. competition
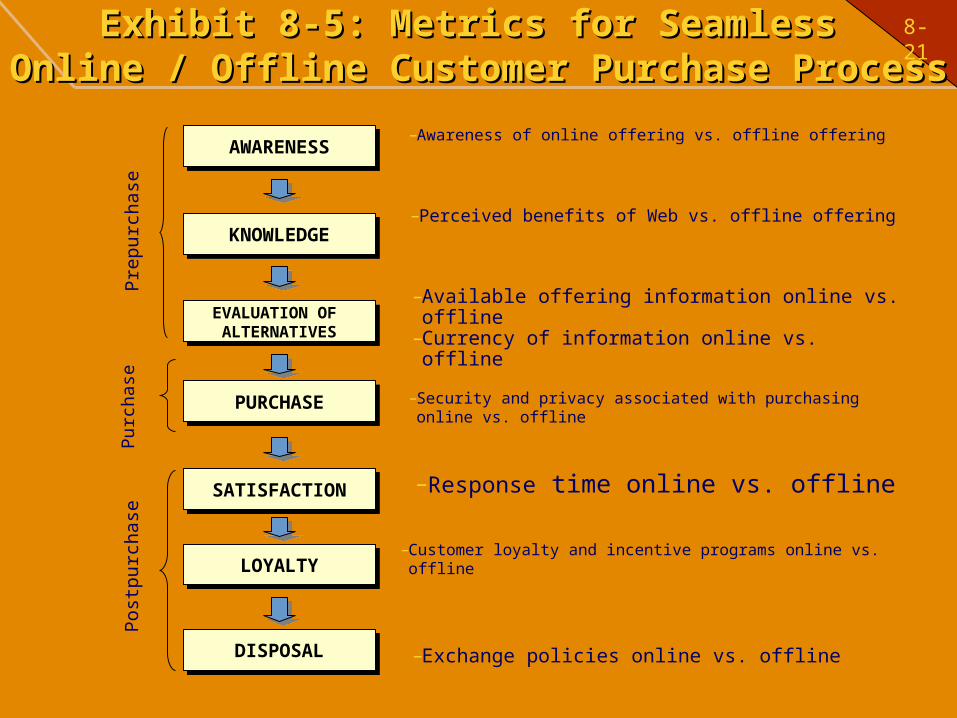
8-21Exhibit 8-5: Metrics for Seamless Exhibit 8-5: Metrics for Seamless Online / Offline Customer Purchase ProcessOnline / Offline Customer Purchase Process
–Awareness of online offering vs. offline offering
–Perceived benefits of Web vs. offline offering
–Available offering information online vs. offline
–Currency of information online vs. offline
–Security and privacy associated with purchasing online vs. offline
–Response time online vs. offline
–Customer loyalty and incentive programs online vs. offline
–Exchange policies online vs. offline
AWARENESSAWARENESS
KNOWLEDGEKNOWLEDGE
EVALUATION OF ALTERNATIVES
EVALUATION OF ALTERNATIVES
PURCHASEPURCHASE
SATISFACTIONSATISFACTION
LOYALTYLOYALTY
DISPOSALDISPOSAL
Pre
purc
hase
Po
stpu
rcha
seP
urch
ase
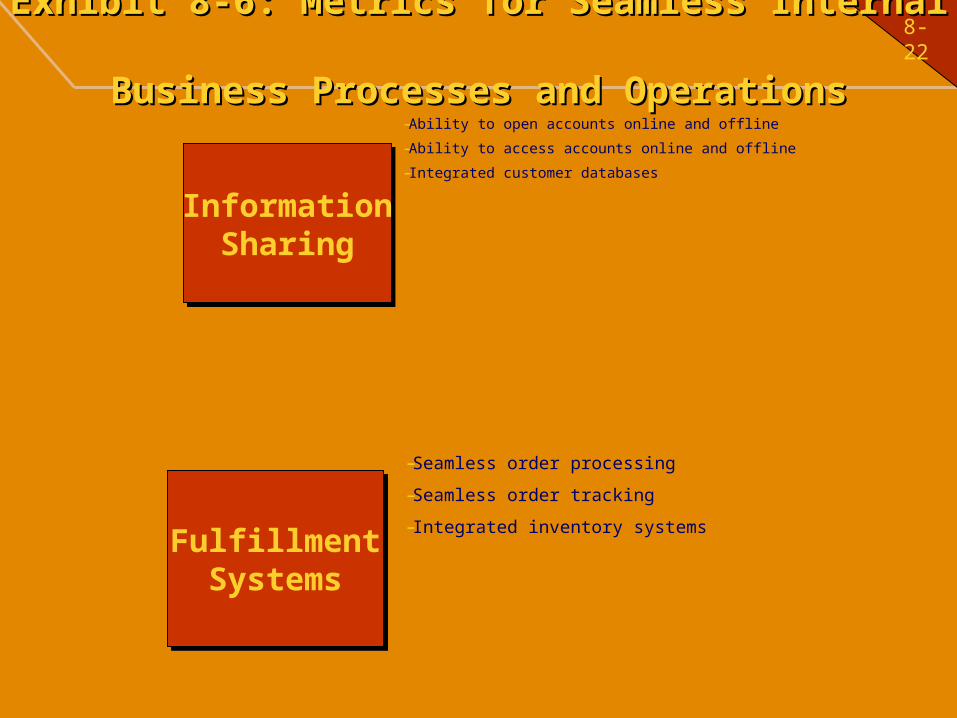
8-22Exhibit 8-6: Metrics for Seamless Internal Exhibit 8-6: Metrics for Seamless Internal Business Processes and OperationsBusiness Processes and Operations
–Ability to open accounts online and offline
–Ability to access accounts online and offline
–Integrated customer databasesInformation
SharingInformation
Sharing
FulfillmentSystems
FulfillmentSystems
–Seamless order processing
–Seamless order tracking
–Integrated inventory systems
8-23External Sources of Metrics InformationExternal Sources of Metrics Information
Firms are likely to track their value proposition versus competition, customer satisfaction with the site, site usability and financial outcomes.
Online Information:• Market Research: Online market research firms collect primarily
customer data through online surveys or customer submissions.
• Analyst Reports: Analyst reports are data sources that blend primary market data on a particular topic with an analyst’s view of the market.
• Financial Information: These data sources principally provide statutory filings of financial information on particular companies or aggregated financial data across industries. The data collected generally includes income statement, balance sheet and statement of cash flow information.
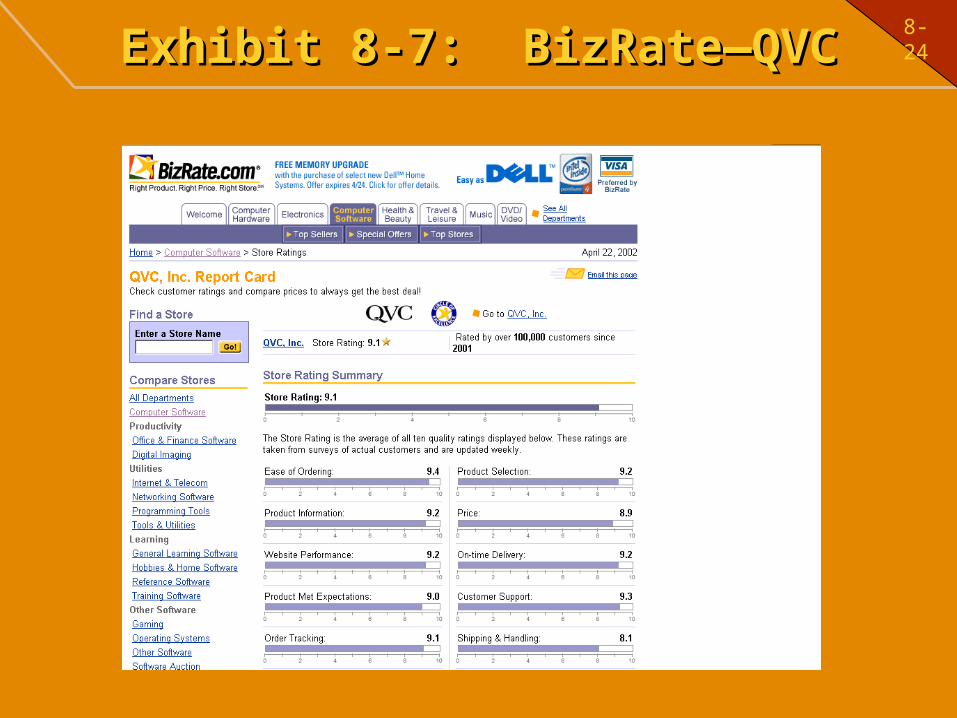
8-24
Exhibit 8-7: BizRate—QVCExhibit 8-7: BizRate—QVC
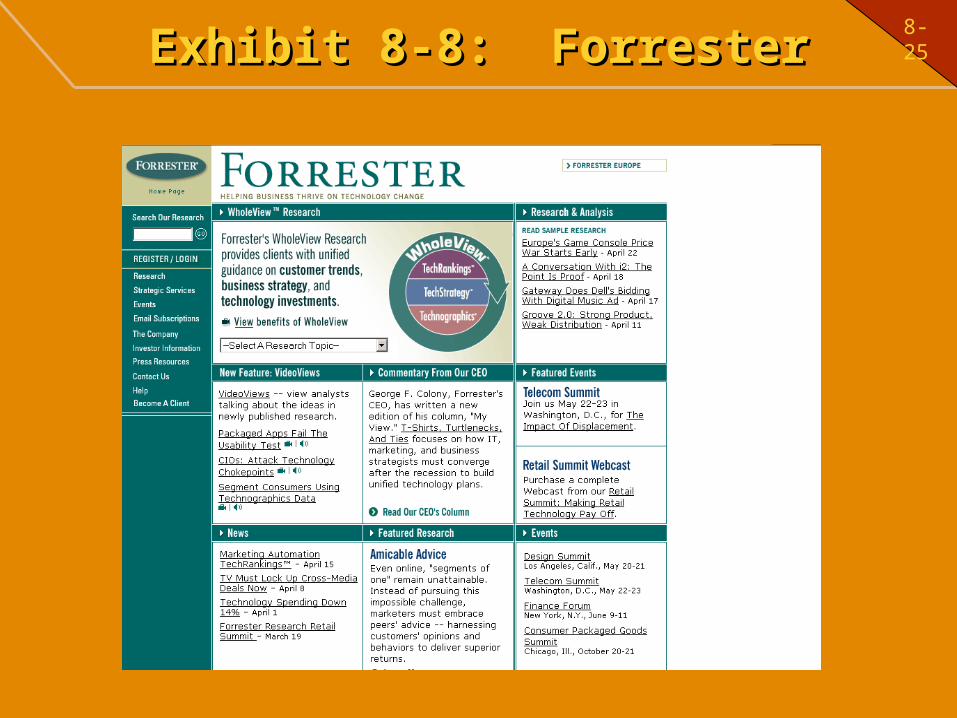
8-25
Exhibit 8-8: ForresterExhibit 8-8: Forrester
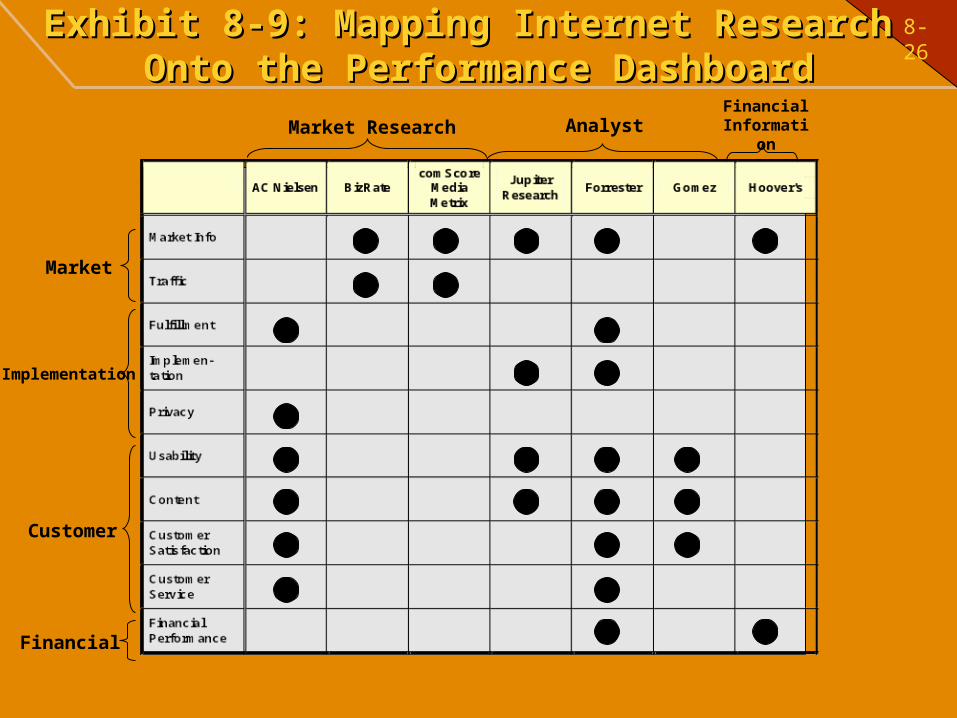
8-26Exhibit 8-9: Mapping Internet Research Exhibit 8-9: Mapping Internet Research Onto the Performance DashboardOnto the Performance Dashboard
Market
Implementation
Customer
Financial
Market Research AnalystFinancial
Information
8-27Marketwatch.com Metrics ApplicationMarketwatch.com Metrics Application
- Step one: Articulate the Marketwatch.com Strategy
• Value proposition: “To be a leading Web-based provider of comprehensive, real-time business news, financial programming and analytic tools.”
• Marketwatch.com Offer: The aim is to deliver three key benefits to users: real-time information, comprehensive and in-depth analysis and tools and multimedia access.
• Resource System: Consists of three layers.a) Core benefits delivered to users as described in the
company’s offer.b) Capabilities that must be in place to deliver the core
benefits. c) The activities and resources that need to be retained to
deliver these capabilities.
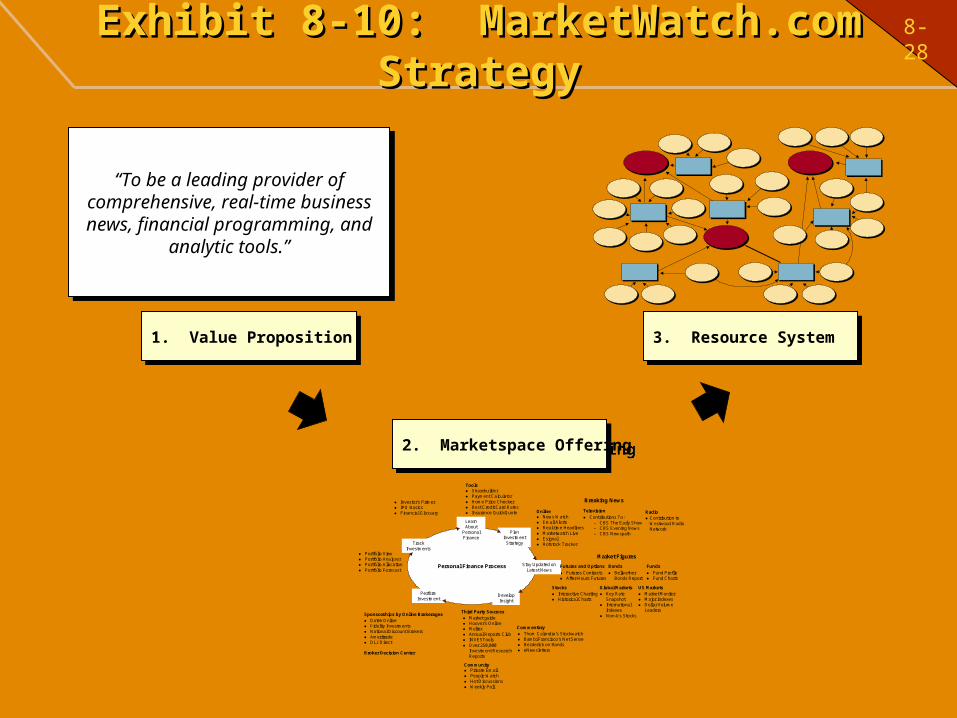
8-28Exhibit 8-10: MarketWatch.com StrategyExhibit 8-10: MarketWatch.com Strategy
Personal Finance Process
Investor’s Primer IPO Basics Financial Glossary
Broker Decision Center
Datek Online Fidelity Investments National Discount Brokers Ameritrade DLJ Direct
Sharebuilder Payment Calculator Home Price Checker Best Credit Card Rates Insurance QuickQuote
Private Email People Watch Hot Discussions Weekly Poll
Market guide Hoover’s Online Multex Annual Reports Club INVESTools Over 250,000
Investment ResearchReports
Interactive Charting Historical Charts
Fund Profile Fund Charts
Market Monitor Major Indexes Dollar Volume
Leaders
BellwetherBonds Report
Futures Contracts After-Hours Futures
Key RateSnapshot
InternationalIndexes
Non-Us Stocks
Thom Calandra’s Stockwatch Bambi Francisco’s Net Sense Bezderick on Bonds eNewsletters
News Watch Email Alerts Real-time Headlines Marketwatch Live Esignal Hotstock Tracker
Contributions To:– CBS The Early Show– CBS Evening News– CBS Newspath
Contribution toWestwood RadioNetwork
LearnAbout
PersonalFinance
PlanInvestment
Strategy
Stay Updated onLatest News
DevelopInsight
PerformInvestment
TrackInvestments
Television Radio
Stocks
Funds
US Markets
Bonds
Global Markets
Futures and Options
Commentary
Third Party Sources
Tools
Community
Sponsorships by Online Brokerages
Online
Portfolio View Portfolio Analyzer Portfolio Allocation Portfolio Forecast
Breaking News
Market Figures
“To be a leading provider of comprehensive, real-time business news, financial programming, and
analytic tools.”
“To be a leading provider of comprehensive, real-time business news, financial programming, and
analytic tools.”
1. Value Proposition1. Value Proposition
2. Marketspace Offering2. Marketspace Offering
3. Resource System3. Resource System
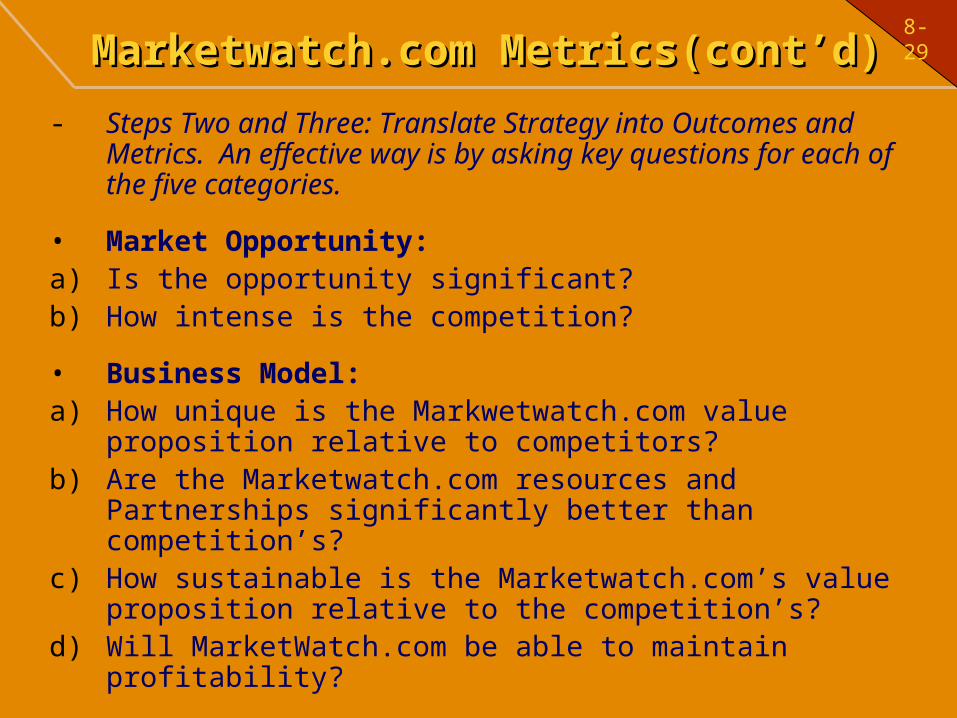
8-29
Marketwatch.com Metrics(cont’d)Marketwatch.com Metrics(cont’d)
- Steps Two and Three: Translate Strategy into Outcomes and Metrics. An effective way is by asking key questions for each of the five categories.
• Market Opportunity:a) Is the opportunity significant?b) How intense is the competition?
• Business Model:a) How unique is the Markwetwatch.com value proposition
relative to competitors?b) Are the Marketwatch.com resources and Partnerships
significantly better than competition’s?c) How sustainable is the Marketwatch.com’s value
proposition relative to the competition’s?d) Will MarketWatch.com be able to maintain profitability?
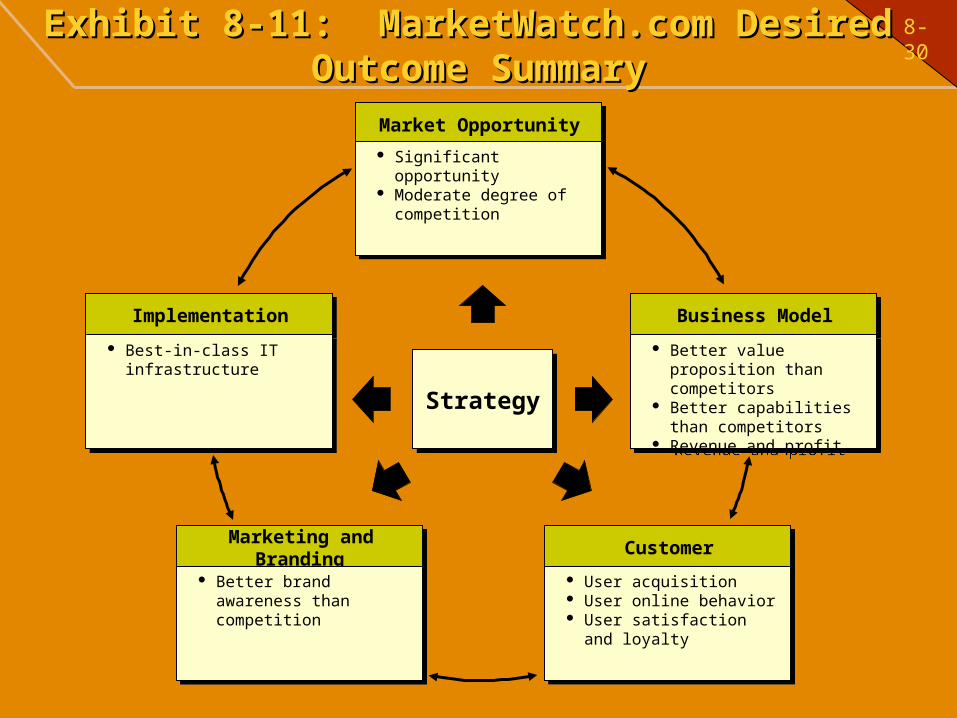
8-30Exhibit 8-11: MarketWatch.com Desired Exhibit 8-11: MarketWatch.com Desired Outcome SummaryOutcome Summary
Customer Customer
Market Opportunity Market Opportunity
Business Model Business Model
Marketing and Branding Marketing and Branding
Implementation Implementation
Significant opportunity Moderate degree of
competition
Significant opportunity Moderate degree of
competition
Best-in-class IT infrastructure
Best-in-class IT infrastructure
Better brand awareness than competition
Better brand awareness than competition
User acquisition User online behavior User satisfaction and
loyalty
User acquisition User online behavior User satisfaction and
loyalty
Better value proposition than competitors
Better capabilities than competitors
Revenue and profit
Better value proposition than competitors
Better capabilities than competitors
Revenue and profitStrategyStrategy
8-31
Marketwatch.com Metrics(cont’d)Marketwatch.com Metrics(cont’d)
• Marketing and Branding:
a) How effective and efficient is the Marketwatch.com’s marketing efforts at attracting new users?
b) How is the MarketWatch.com brand perceived in the market?
• Implementation:
a) Does Marketwatch.com have an infrastructure that enables it to reliably distribute financial content across multiple platforms?
8-32
Marketwatch.com Metrics(cont’d)Marketwatch.com Metrics(cont’d)
• Customer: a) What is the perception of the online user experience?
a) How satisfied and loyal is the user base?
8-33
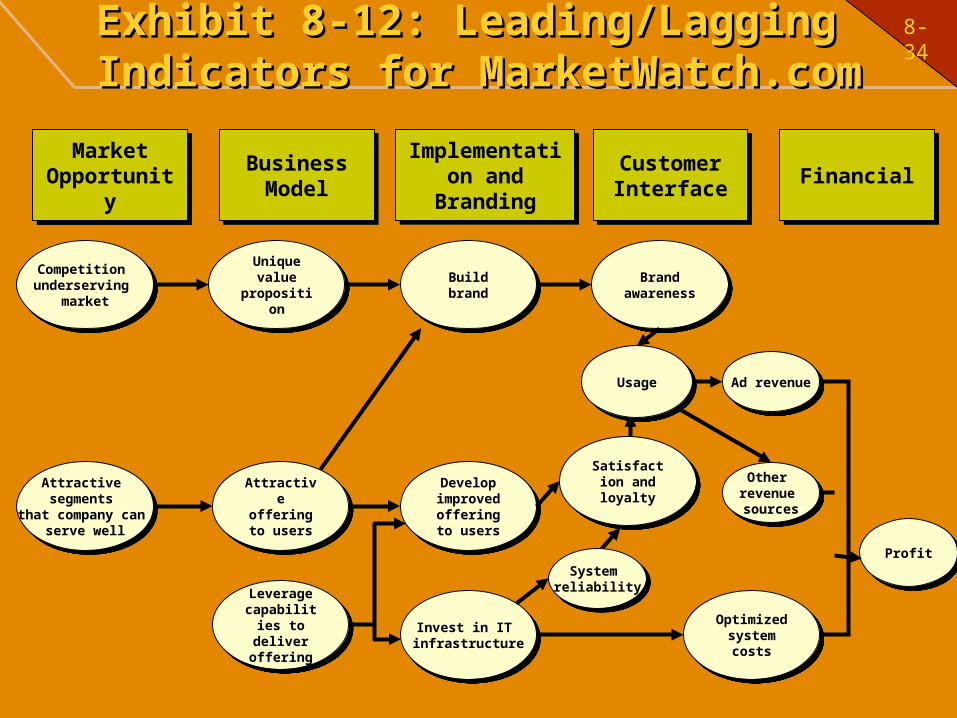
- Step Four: Link Metrics to leading and Lagging indicators.
• The fundamental question is “How do we link the metrics to each other?”
• Knowledge of this interrelation will help management understand which groups of leading indicators it needs to focus on in order to achieve its target performance on lagging indicators.
• A unique value proposition that is marketed successfully will lead to creation of a strong brand and high brand awareness among users. This will stimulate usage which will lead to an increase in ad revenue because there will be more users viewing more pages resulting in profitability.
Marketwatch.com Metrics(cont’d)Marketwatch.com Metrics(cont’d)
8-34Exhibit 8-12: Leading/Lagging Exhibit 8-12: Leading/Lagging Indicators for MarketWatch.comIndicators for MarketWatch.com
Market Opportunity
Market Opportunity
Business Model
Business Model
Implementation and Branding
Implementation and Branding
Customer Interface
Customer Interface FinancialFinancial
Competition underserving
market
Competition underserving
market
Unique value
proposition
Unique value
propositionBuild brandBuild brand Brand
awareness
Brand awareness
Attractive segments
that company can serve well
Attractive segments
that company can serve well
Attractive offering to
users
Attractive offering to
users
Develop improved offering to
users
Develop improved offering to
users
Satisfaction and loyalty
Satisfaction and loyalty
Leverage capabilities to deliver offering
Leverage capabilities to deliver offering
Invest in IT infrastructure
Invest in IT infrastructure
Optimized system costs
Optimized system costs
Ad revenueAd revenue
Other revenue sources
Other revenue sources
UsageUsage
ProfitProfit
System reliability
System reliability
8-35
- Step Five- Calculate Current and Target Performance.
• A successful strategy needs to be implemented by setting targets and taking actions to reach those targets.
• In many cases, the target performance is to become the best performer in a metric.
Marketwatch.com Metrics(cont’d)Marketwatch.com Metrics(cont’d)
8-36
17
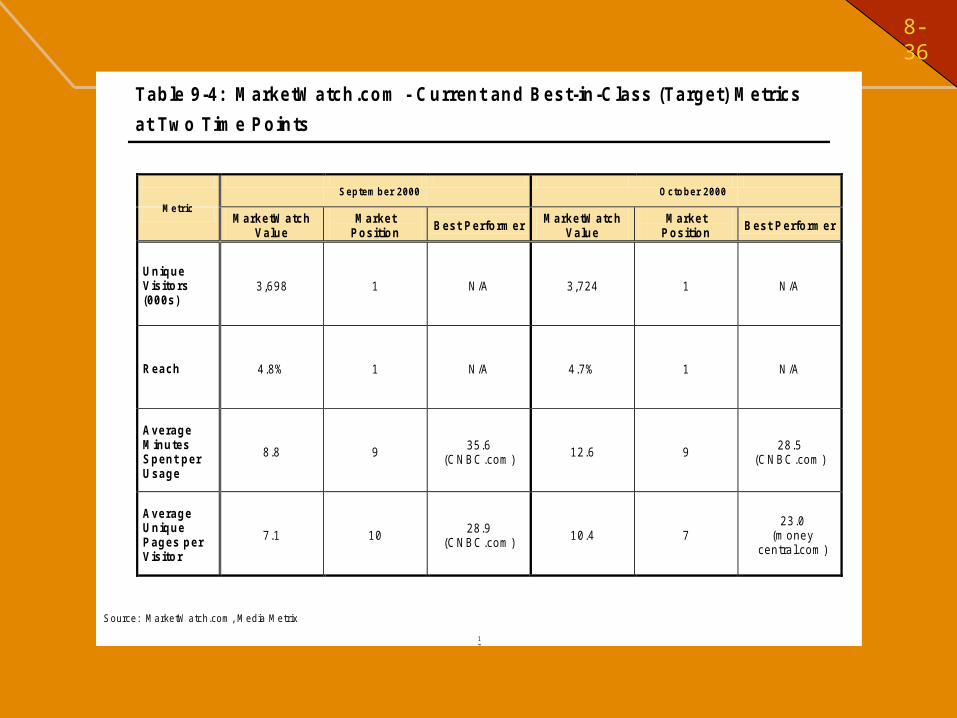
T a b le 9 -4 : M a rk e tW atc h .c o m - C u rren t a n d B es t-in -C las s (T a rg e t) M e tric s
a t Tw o T im e P o in ts
M a rk e tW a tc h V a lu e
M a rk e t P o s itio n
B e s t P e rfo rm e r M a rk e tW a tc h
V a lu e M a rk e t
P o s itio n B e s t P e rfo rm e r
U n iq u e V is ito rs (0 0 0 s )
3 ,6 98 1 N /A 3 ,7 24 1 N /A
R e a c h 4 .8 % 1 N /A 4 .7 % 1 N /A
A ve ra g e M in u te s S p e n t p e r U s a g e
8 .8 9 3 5 .6
(C N B C .co m ) 1 2 .6 9
2 8 .5 (C N B C .co m )
A ve ra g e U n iq u e P a g e s p e r V is ito r
7 .1 1 0 2 8 .9
(C N B C .co m ) 1 0 .4 7
2 3 .0 (m o ne y
ce n tra l.com )
M etr ic
S ep tem b er 2000 O cto b er 2000
S ource : M arke tW atch.com , M ed ia M e tr ix
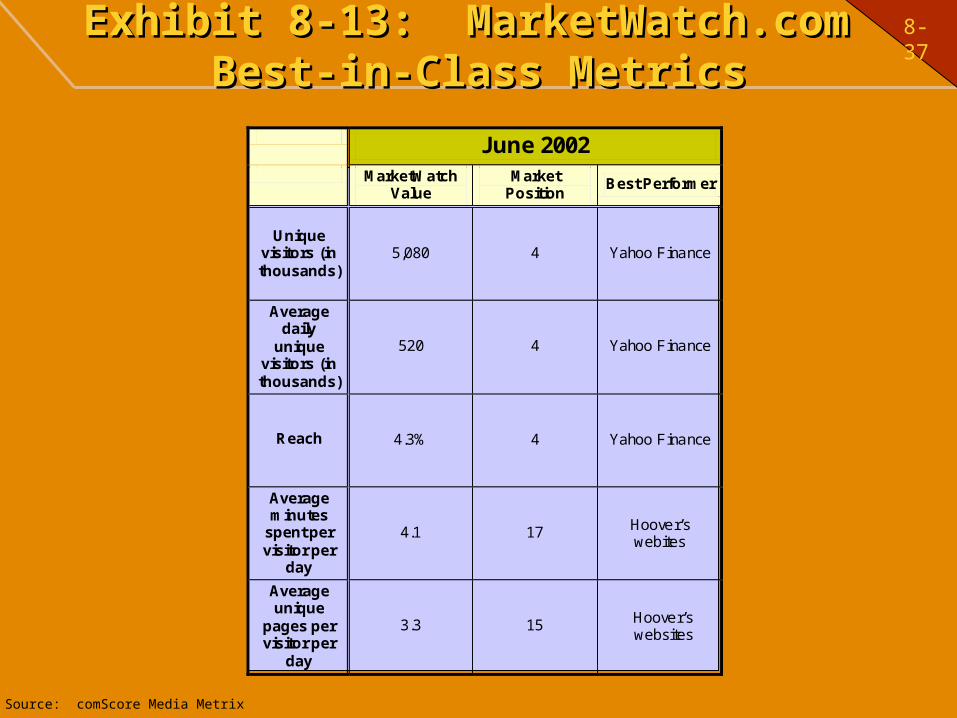
8-37Exhibit 8-13: MarketWatch.com Exhibit 8-13: MarketWatch.com Best-in-Class MetricsBest-in-Class Metrics
Source: comScore Media Metrix
June 2002 MarketWatch
Value Market
Position Best Performer
Unique visitors (in thousands)
5,080 4 Yahoo Finance
Average daily
unique visitors (in thousands)
520 4 Yahoo Finance
Reach 4.3% 4 Yahoo Finance
Average minutes
spent per visitor per
day
4.1 17 Hoover’s webites
Average unique
pages per visitor per
day
3.3 15 Hoover’s websites