Embed Size (px)
Citation preview

7th AnnualAssociation for Clinical Documentation
Improvement SpecialistsConference
2
Integrating Quality Into Your CDI Program: The Case for All-Payer Review
Katy Good, RN, BSN, CCDS, CCS
CDI Program Coordinator
Flagstaff Medical Center
Flagstaff, Ariz.
Benjamin Keeler, RN, BSN, PCCN, MHI
Quality Manager
Flagstaff Medical Center
Flagstaff, Ariz.

3
Learning Objectives
• At the completion of this educational activity, the learner will:– Explain the benefits of an all-payer CDI program
– Identify areas of focus.
– Describe model for integrating with the Quality (and other departments) staff to provide best outcomes for the hospital.
– Recognize several potential pitfalls and methods to manage fallout
4
Background: Our Hospital
• Mid-sized rural hospital– 267 beds
– Level 1 trauma center
– Large joint program
– Cardiothoracic surgery
– Tertiary referral center
– Bariatric surgery center of excellence
– Certified stroke center

5
Background: Our Program
• Initially housed in care coordination– UR– Case management– Disease management
• Moved to clinical value department in Jan 2013– Quality management RNs– Patient safety program– Geriatric fracture program– ICD-10 implementation– Infection prevention
• In December 2012 we had 2.5 FTEs dedicated primarily to Medicare• In January 2013 we expanded to 8 FTEs dedicated to all-payer
review
6
A Changing Marketplace
• Affordable Care Act
• Pay for performance
• Value-based purchasing
• Readmissions Reduction Program
• ICD-10
It’s still difficult to predict the long-term impact of these changes. More changes are inevitable!

7
Mitigating Risk
• A well-staffed, well-trained, and well-educated CDI team allows facilities to respond quickly to changes as they occur– Eyes in the charts (regardless of payer)– Relationships with the physicians– Ability to work interdisciplinarily with other
departments– Quality needs concurrent, real-time review on
every patient to meet the numerous mandated objectives
8
Is Your Program Focused Only on the Dollars?
• Many hospitals begin their CDI programs as a way to secure accurate reimbursement for services provided– Focus on DRG payers where impact is easily
recognizable
– As programs develop, they begin to see other areas of potential impact in the facility

9
Moving Forward
• Shift in mind-set?– As reimbursement is increasingly tied to quality,
CDI programs need to expand their programs and knowledge base to work closely with other departments to ensure the best documentation across all patients seen in the facility
10
Initiatives to Improve Quality

11
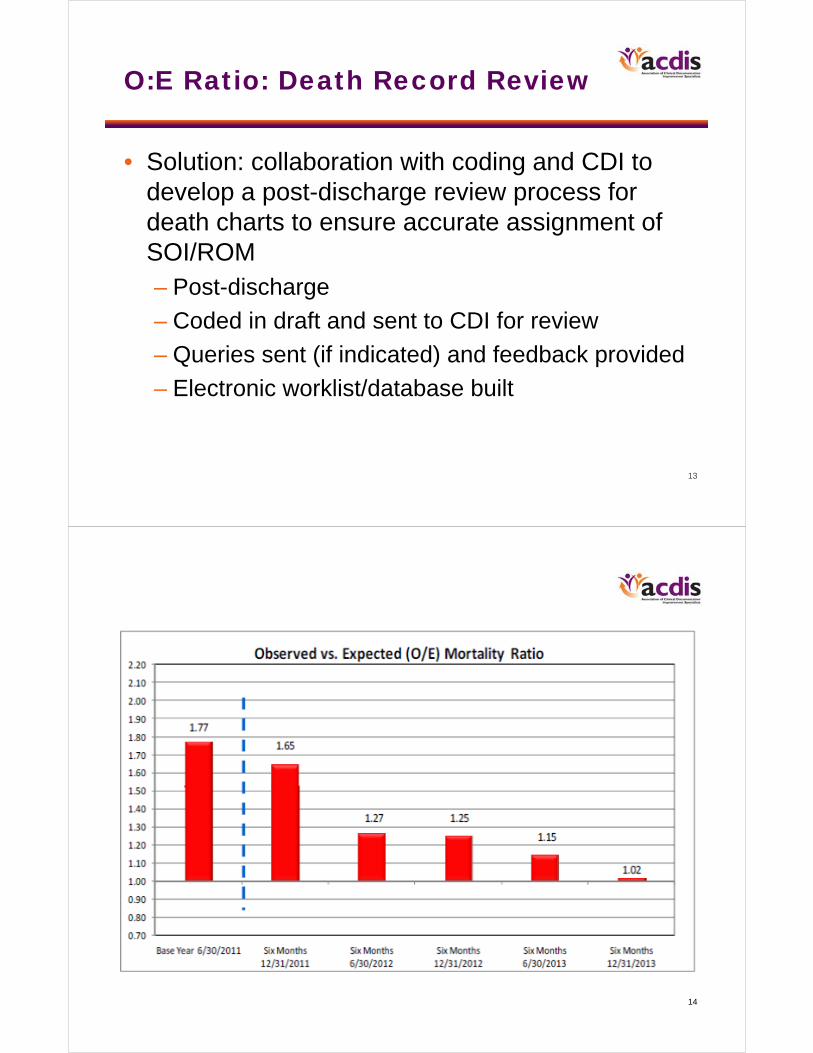
O:E Ratio: Death Record Review
• Problem: unfavorable Observed:Expectedmortality rate identified
• O:E ratio is based off all patients
• Actual and expected mortality rate publically reported on HealthGrades and HospitalCompare
• May indicate that SOI/ROM is not accurately reflected in the coded data
12
O:E Ratio: Death Record Review
• Assessment: – No quality of care issues identified.
– Assumed to be a documentation/coding issue.
– O:E ratio is based off of all payers, so reviewing any segment of complex patients would likely garner results. However, reviewing expired patients is the obvious choice.• Easy to identify
• Highly scrutinized
13
O:E Ratio: Death Record Review
• Solution: collaboration with coding and CDI to develop a post-discharge review process for death charts to ensure accurate assignment of SOI/ROM– Post-discharge
– Coded in draft and sent to CDI for review
– Queries sent (if indicated) and feedback provided
– Electronic worklist/database built
14

15
O:E Ratio: Death Record Review
• Promoting buy-in from key groups– Coding
• Coding summaries on expired patients often receive extra scrutiny. Accurate coding to the highest severity is essential.
– Physicians• O:E ratio is an important quality indicator used to
assess physician performance (OPPE).
– Billing• Complete and accurate coding ensures accurate
reimbursement.
16
Malnutrition

17
Quality of Care: Early Identification of At-Risk Patients
• Problem– Malnutrition: Often unidentified diagnosis that
adds significant complexity to patient picture• Delayed healing
• Increased staffing demands (feeding, physical therapy)
18
Quality of Care: Early Identification of At-Risk Patients
• Assessment– Often dietitians were not consulted on at-risk patients
– Physicians are uncomfortable providing documentation specificity (severity) for malnutrition without input from dietitian
– When consulted, documentation between physicians and dietitians does not match
• Greater specificity provided by dietitian
– Denial risk as significant clinical indicators are often not identified in physician documentation

19
Quality of Care: Early Identification of At-Risk Patients
• Solution: work with nutrition department and IT team to develop system to promote consistency– CDI notified by nutrition each time they make a diagnosis of
malnutrition• CDI ensures this documentation is transferred into progress notes
– Query if indicated
– Nutrition notified by CDI when they see potential indicators of malnutrition but the physician has not consulted dietary
• Early identification = better patient care!
– IT team consulted to develop system in which the nutrition department is automatically notified when a patient PREVIOUSLY diagnosed with malnutrition is readmitted to the facility so they can assess for nutrition needs
• Early identification = better patient care!
20
Intervention

21
Quality of Care: Early Identification of At-Risk Patients
• Promoting buy-in from key groups– Dietary:
• Better patient care: Early identification means more time to treat patients in house
• Better data capture: Coding of malnutrition showcases the work they did
– Proves value to the hospital– Supports FTEs
– Physicians:• Better patient care• Better transfer of information between providers
– Ensures that they have the appropriate clinical indicators to make a diagnosis
• Reduces RAC/denial risk
22
Quality Initiative: Core Measures
The Quality/CDI Collaborative

23
Core Measures: Identifying Patients
• Concurrent, real-time review has become the only way to reach 100% on our quality measures
• Finding these patients while in hospital was the challenge
24
Core Measure: Stroke
• Problem– Monthly “fallouts” in the stroke core measure
– FMC is a certified stroke center
– Level 1 trauma center
– Stroke will be a part of value-based purchasing

25
Core Measure: Stroke
• Assessment– Difficulty identifying hemorrhagic patients which
eventually code to a stroke DRG• Traumas, spontaneous bleeds
– Frequently finding stroke patients after discharge once chart has been coded and dropped• Too late to impact the patient or coding
– CDIs in every inpatient chart, quality is not• Examined how to incorporate quality needs into
their workflow
26
Core Measure: Stroke
• Solution– Involved the CDI team to assign a working DRG
• Automated list generated daily with these patients
– CDIs started to flag these patients and alert the quality management RNs
– The QMRN then engages to ensure the best quality care for the patient
– Daily automated list now goes to QMRNs, care coordinators, disease management RNs, stroke team

27
Core Measure: Stroke
• Results– 100% for stroke core measure for first time in
November with continued strong results
– Notification to a large team for a wide range of high-risk patients
28
0
10
20
30
40
50
60
70
80
90
100
Apr-11
May-11
Jun-11
Jul-11
Aug-11
Sep-11
Oct-11
Nov-11
Dec-11
Jan-12
Feb-12
Mar-12
Apr-12
May-12
Jun-12
Jul-12
Aug-12
Sep-12
Oct-12
Nov-12
Dec-12
Jan-13
Feb-13
Mar-13
Apr-13
May-13
Jun-13
Jul-13
Aug-13
Sep-13
Oct-13
Nov-13
Dec-13
Jan-13
FMC Core Stroke All-or-None BundleApril 2011–January 2014 Intervention
29
Core Measures: Heart Failure
• Problem– Heart failure population identification
– Significantly impacts CMS Readmissions Reduction Program, value-based purchasing, and core measures (IQR)
30
Core Measures: Heart Failure
• Assessment– Difficulty identifying the heart failure population
– Difficulty monitoring this population
– Care coordination frequently missing inpatients that are a part of the heart failure population• Missing opportunities for follow-up, creating
appointments
31
Core Measures: Heart Failure
• Solution– CDIs started to flag these patients and alert the
quality management RNs• The QMRN then engages to ensure the best
quality care for the patient
– Daily automated list goes to QMRNs, care coordinators, and disease management RNs
32
Core Measures: Heart Failure
• Results– The lowest readmission rate in Arizona
– Actively identifying patients with heart failure often in the emergency department
– 100% in the heart failure core measure for 9 months for the calendar year 2013

33
Arizona Readmission Rate
Source: HSAG
Figure 3 compares your hospital’s all-cause readmission rate to other Arizona hospitals with a similar number of discharges. Results are displayed from lowest readmission rate (far left side of the graph) to the highest readmission rate (far right side of the graph). Your hospital is shown in red in the figure.
34
Core Measures: Promoting Buy-In
• Quality department– Improvements in the core measures
– Core measures are primarily based on coded data
• Physicians– Improve individual quality scores for OPPE
– Many physician groups have bonuses tied to core measures
• Senior management/the board– Value-based purchasing
– Readmission Reduction Program
– Bragging rights
• Nursing– Best care for their patients
– Evidence-based practice

35
0
10
20
30
40
50
60
70
80
90
100
Jul‐08
Aug‐08
Sep‐08
Oct‐08
Nov‐08
Dec‐08
Jan‐09
Feb‐09
Mar‐09
Apr‐09
May‐09
Jun‐09
Jul‐09
Aug‐09
Sep‐09
Oct‐09
Nov‐09
Dec‐09
Jan‐10
Feb‐10
Mar‐10
Apr‐10
May‐10
Jun‐10
Jul‐10
Aug‐10
Sep‐10
Oct‐10
Nov‐10
Dec‐10
Jan‐11
Feb‐11
Mar‐11
Apr‐11
May‐11
Jun‐11
Jul‐11
Aug‐11
Sep‐11
Oct‐11
Nov‐11
Dec‐11
Jan‐12
Feb‐12
Mar‐12
Apr‐12
May‐12
Jun‐12
Jul‐12
Aug‐12
Sep‐12
Oct‐12
Nov‐12
Dec‐12
Jan‐13
Feb‐13
Mar‐13
Apr‐13
May‐13
Jun‐13
Jul‐13
Aug‐13
Sep‐13
Oct‐13
Nov‐13
Dec‐13
Jan‐14
Percent
FMC All‐or‐None BundleJuly 2008–January 2014
FY 2010
FY 2011
FY 2012
FY 2013
Goal is 100%
FY 2014
FY 2009
36
Quality Initiative: Hospital-Acquired Conditions (HACs)

37
Quality Initiative: HACs
• Problem– Identification of HACs is not accurate
– Coding not catching all HACs due to inadequate documentation by medical providers
38
Quality Initiative: HACs
• Assessment– Medical providers are not documenting HACs
correctly
– Lack of knowledge regarding what counts as a HAC and how to accurately document

39
Quality Initiative: HACs
• Solution– CDIs just starting to identify certain HACs
• CAUTIs, VAEs, BSIs
– Working with coding to understand need to code HACs
– Help medical providers with charting of HACs
– Created separate “query” for infection prevention
40
Quality Initiative: HACs
• Results– Initial increase in the number of CAUTIs
– Followed by a dramatic reduction and sustaining• CUSP CAUTI Initiative
– Need to further refine and expand our HAC quality efforts

41
CAUTI at FMC: IP vs. Coding
0 0
4.4
0
3.4
0 0
2.2
0
2.3
5.6
1.8
0 0
1.7
0
5.8
1.82.0
0.4 0.5 0.5
0 0
1.8
0 0 0 0
1.7 1.7
0 0 0 0 0
0.8
0 0 0
0.8
0 0 0
0
1
2
3
4
5
6
Feb2012
Mar2012
Apr2012
May2012
Jun2012
Jul2012
Aug2012
Sep2012
Oct2012
Nov2012
Dec2012
Jan2013
Feb2013
Mar2013
Apr2013
May2013
Jun2013
Jul2013
Aug2013
Sept2013
Oct2013
Nov2013
Rate
Catheter‐Associated UTIs—Per 1000 Inpatients
Infection Prevention Data Coded Data
42
A How-To Guide to Integrating Quality and CDI
A Starter’s Guide …

43
How to Bridge the Gap
• Identify areas of focus– Core measure data
• Assess for areas of focus
– O:E ratio– HACs
• Identify key players– Managers– Database analysts– Physician leadership– Senior management– The board
44
How to Bridge the Gap
• Educate! Get out there!– What is CDI?
– Unique view of the record• Concurrent review of all payers
• Understanding of how documentation drives coding– Quality measures driven by coded data
• Offer support:– Communication
– Identification
– Other?

45
How to Bridge the Gap
• Maintain distinct roles– We do not recommend that CDI be responsible
for core measures or other quality data – Find EASY ways to communicate data that can
be absorbed into your workflow• Crystal Reports• Excel• CCL Reports
• Keep CDI and quality distinct– Mergeloss in identity
46
Thank you. Questions?
In order to receive your continuing education certificate(s) for this program, you must complete the online evaluation. The link can be found in the continuing education section at the front of the workbook.