Embed Size (px)
Citation preview
134
Chapter 7
RELATIVE STRENGTH INDEX - A CRITERION
7.1 Introduction
Revolutionary changes have taken place in the modern financial market and it
has created a greater competitive and complex situation as never before. Investment
opportunities have also increased and as a result, investors look for better returns.
Consequently, fund managers and financial intermediaries also try to provide better
return for their investments. As a part of the globalization and liberalization policy,
nations have opened up to offer better investment opportunities. To exploit this
opportunity in various financial markets, timing and information are extremely
important.
A paradoxical relationship exists between market efficiency and market
analysis because once the market is efficient, it reflects the true price of securities and
there is no point in analyzing the stock to earn the superior return. The question of
market efficiency has been much discussed in the academic literature. According to
efficient market theory, market is efficient and nobody can outperform the market. On
the other hand, technical trading school, which emerged years before the modern
financial theory, has questioned the existence of efficient market theory. According to
technical analysts, the analysis of stocks or index is beneficial when technical
indicators outperform the simple buy and hold strategies. But most of the academic
literatures are extremely skeptical about technical analysis and its effectiveness in the
market.
The concept of fair value has also been criticized by the market participants.
The concept of fair value or intrinsic value states that a share or scrip should be
135
purchased when its price is below the fair value and sells it when its price is above its
fair value. However, in real market situation, calculation of intrinsic value is very
difficult and time consuming. During the Bull Run, the actual market price will
always be above the fair value and during the Bear Run it will be always below the
fair value. Hence, it is illogical to use this yardstick for a dynamic financial
environment. It is technical analysis which can easily identify the movement of the
market by using charts, pattern and technical indicators.
7.2 Review of Literature
Most of the earlier literatures argue that technical analysis is futile. These
studies are based on the U.S financial data before the introduction of financial
deregulation during the late 70s and early 80s. However, studies after the financial
deregulation hold that technical trading is beneficial. Brock, Lakonishok and LeBaron
(1992) show that simple technical trading rules can outperform the buy and hold
strategy. The study uses the moving average trading rule and trading range breakouts
for the analysis purpose. This particular work resulted in a paradigm shift from the
existing belief. In their (1992) survey of technical analysis, Taylor and Allen found
that 90% of the respondents use some form of technical trading strategies. Isakov and
Hollistein’s (1999) study on the profitability of technical trading rules shows that in
the Swiss stock market, the most profitable rules appear to be the double moving
averages with one and five days. The analysis uses moving average with band,
relative strength index and stochastic indicator. The study examines moving average
with Oscillators like Relative strength index stochastic indicators and finds that the
simple moving average rules perform better than the oscillators. Financial advisors,
according to Twibell (2005), employ technical analysis not because of scholarly
136
studies but because of their viability in the market (qtd.in Ming and Hwa). The
profitability of technical trading strategies is examined by Nam, Washer and Chu
(2005) by identifying the asymmetric dynamic process of stock returns. The daily
return series of S&P 500 market index from 1/3/1929 to 31/12/1998 is used in the
study. The study finds that the asymmetry in the return is the main cause for
profitability of trading strategies. Market professionals cannot negate the usefulness
of technical trading strategies in the stock market investment.
7.3 Trading Rules
Technical trading rules have significant role to play in technical analysis.
According to Stephan .J. Taylor, trading rules are the method of converting the history
of prices into investment decision. It provides an insight into future price movements
and also shows when to buy and sell and thereby take a healthy trading decision.
Fama (1970) argues that technical analysis has no practical value since the market is
efficient. He points out that those trading rules have no practical value.
7.4 Relative Strength Index
Analyzing the relative strength of the securities in the markets started much
earlier. The relative strength index helps the traders identify the price continuation
and reversal. The basic concept behind the relative strength analysis is that certain
securities or scripts perform better than the other securities in the market. Levy (1967)
has found that the return generated by using this strategy is better than the simple buy
and hold strategy.
Relative strength index, developed by Welles Wilder in his book ‘New
Concept in Technical Trading System’ (1978) is completely different from relative
137
strength analysis. It is price momentum indicator and a kind of Oscillator that
provides a complete picture of the market by analyzing the velocity of the price
movements. It compares the internal strength of the securities and not the relative
strength of the different securities. It is also called internal strength index. Generally,
14 days relative strength index is calculated. It is calculated by using the following
formula
RSI = 100-100/(1+RS)
Relative Strength = (average gain/average loss)
When average gain is greater than the average loss, Relative Strength will be
greater than one and RSI will increase always. If the average gain is less than the
average loss, RS will be less than one and RSI will decline. Usually Relative Strength
Index is measured on 0 to 100 Scales. If the relative strength index is above 70, it is
an indication of the over bought position. When the RSI value is less than 30, it is
indicative of the oversold position. During the over bought positions, the traders have
to sell the security but in oversold position the traders have to buy the securities.
7.5 Methodology
The study uses both primary and secondary data to verify the importance of
relative strength index as a technical indicator. The primary data has been collected
from brokers through survey and the secondary data (only the price statistics of the
respective stocks) is collected from the National Stock Exchange.
7.6 Primary Data Analysis
The primary data is collected in order to study the importance of moving
average as a technical indicator and for their analysis, the techniques of Pearson’s
Chi-square test and ANOVA are used.
138
7.6.1 Relative Strength Index and Trend Identification
Relative strength index is one of the stock specific indicators used to measure
the relative strength of the individual security. It is widely used by the market
professionals to understand the buy or sell signals. It also provides an indication of
price oscillation of a particular period of time. The opinion regarding the trend
identification by using the relative strength index is explained in table 7.1
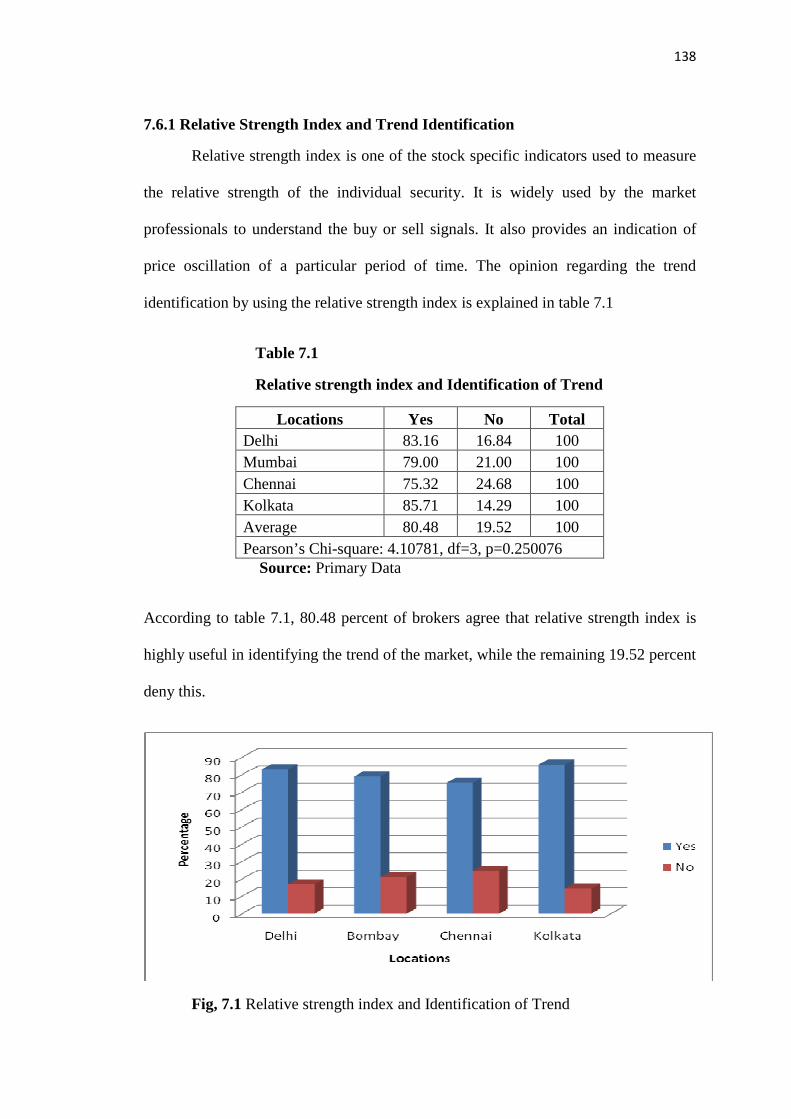
Table 7.1
Relative strength index and Identification of Trend
Locations Yes No Total Delhi 83.16 16.84 100 Mumbai 79.00 21.00 100 Chennai 75.32 24.68 100 Kolkata 85.71 14.29 100 Average 80.48 19.52 100 Pearson’s Chi-square: 4.10781, df=3, p=0.250076
Source: Primary Data
According to table 7.1, 80.48 percent of brokers agree that relative strength index is
highly useful in identifying the trend of the market, while the remaining 19.52 percent
deny this.
Fig, 7.1 Relative strength index and Identification of Trend
139
While 83.16 percent in Delhi believe that RSI shows the clear trend of the market,
16.84 percent do not. In Mumbai, the former form 79.00 percent, while the latter form
21.00 percent. In Chennai, the corresponding percentages are 75.32 and 24.68, and in
Kolkata, they are 85.71 and 14.29.
Pearson’s Chi-square test is used to test the significance of different opinion
by different brokers at different places regarding the trend identification, by using the
relative strength index. The test has found that there is no significant difference
between the opinion among the different participants at different places at five
percentage level of significance, since the p value (0.250076) is greater than 0.05. So
the study identifies that Relative strength index has been used by the brokers at
different places to identify the clear trend in the market.
7.6.2 Relative Strength Index Analysis: Different Responses
Relative strength index is a stock specific indicator that shows the movement
of price of a stock and identifies the overbought and oversold position of a particular
security. Moreover, relative strength index helps the investors to take correct
investment decision. The opinion of brokers about whether they benefited in and the
benefit from of relative strength index analysis are explained in Table 7.2.
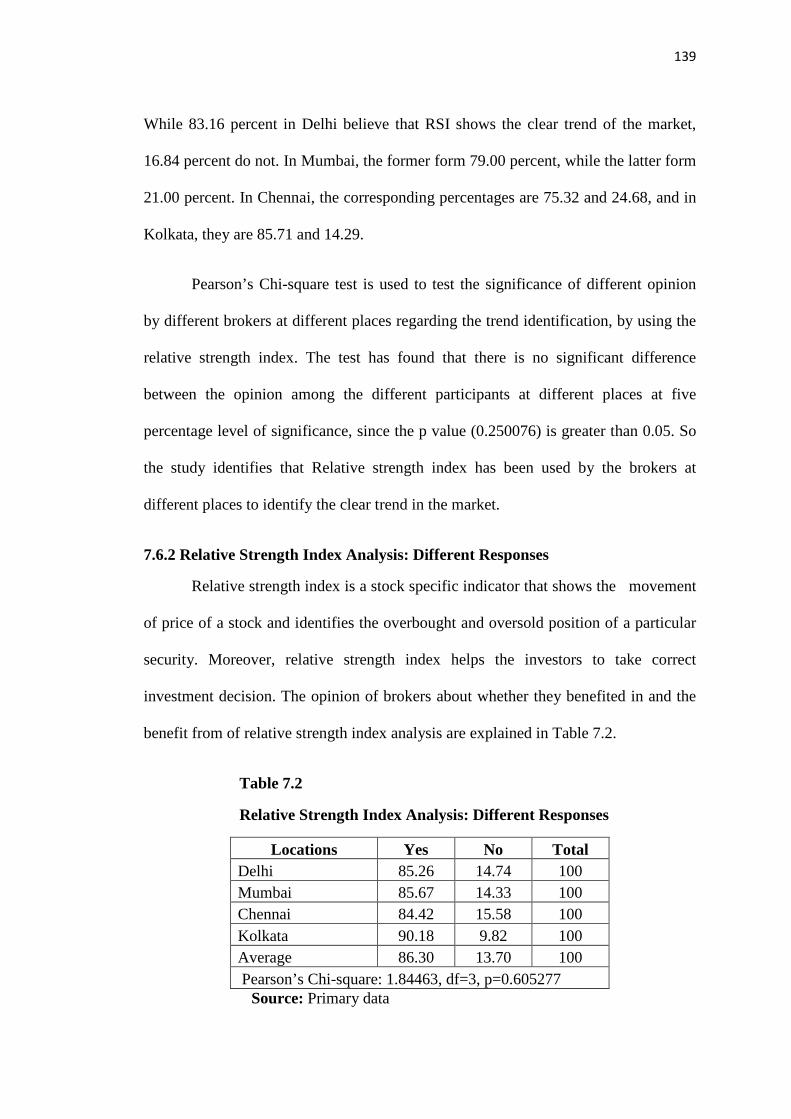
Table 7.2
Relative Strength Index Analysis: Different Responses
Locations Yes No Total Delhi 85.26 14.74 100 Mumbai 85.67 14.33 100 Chennai 84.42 15.58 100 Kolkata 90.18 9.82 100 Average 86.30 13.70 100 Pearson’s Chi-square: 1.84463, df=3, p=0.605277
Source: Primary data
140
86.30 percent of the brokers in the table 7.2 consider RSI as beneficial, whereas the
remaining do not.
Fig, 7.2 Relative Strength Index Analyses: Different Responses
In Delhi, Mumbai, Chennai, and Kolkata the corresponding percentages are 85.26 and
14.74, 85.67 and 14.33, 84.42 and 15.58, and 90.18 and 9.82 respectively.
Pearson’s Chi-square test is used to test the significance of different opinion
by different brokers at different places regarding whether they receive any benefit
from relative strength index analysis. The test finds that there is no significant
difference between the opinion among the different participants at different places at
five percentage level of significance, since the p value (0.605277) is greater than 0.05.
The study has found that relative strength index is beneficial to brokers in predicting
the trend of the market.
7.6.3 Usefulness of Relative Strength Index in Different Markets
Relative strength index is used to identify the trend in the market. The opinion
regarding the usefulness of relative strength index is explained in table 7.3
141
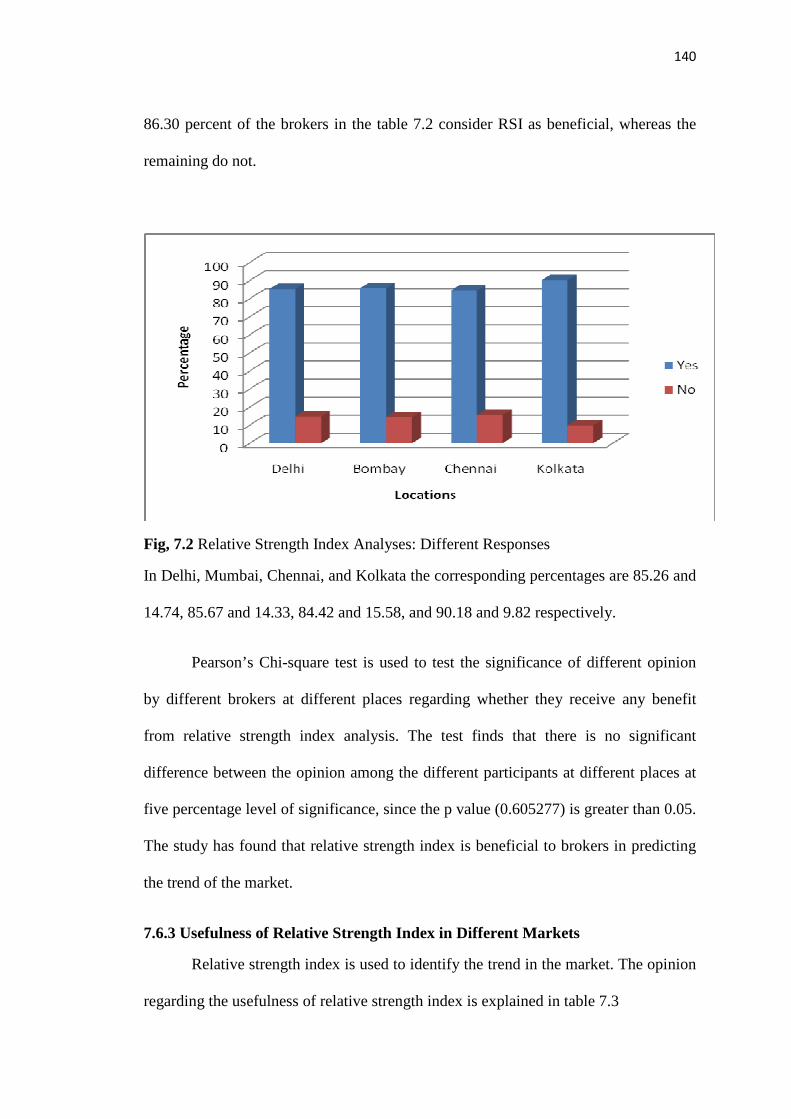
Table 7.3
Usefulness of Relative Strength Index in Different Markets
Source: Primary data
As is evident, among the brokers, 42.81 percent regard RSI as useful in equity
markets, 3.60 percent consider it to be useful in Futures markets, 19.18 percent think
that it is useful in commodity markets, 1.54 percent believe that it is useful in
commodity and future markets, and 32.88 percent maintain that it is useful in equity,
futures and commodity market.
Fig, 7.3 Usefulness of Relative Strength Index in Different Markets
Locations Equity Market
Futures Market
Commodity Market
Futures and Commodity All the three Total
Delhi 34.74 2.11 26.32 0.00 36.84 100.00
Mumbai 47.33 4.00 17.33 1.33 30.00 100.00
Chennai 44.16 2.60 16.88 3.90 32.47 100.00
Kolkata 36.61 4.46 19.64 1.79 37.50 100.00
Average 42.81 3.60 19.18 1.54 32.88 100.00
Pearson’s Chi-square:14.6759, df= 12, p=0.2608
142
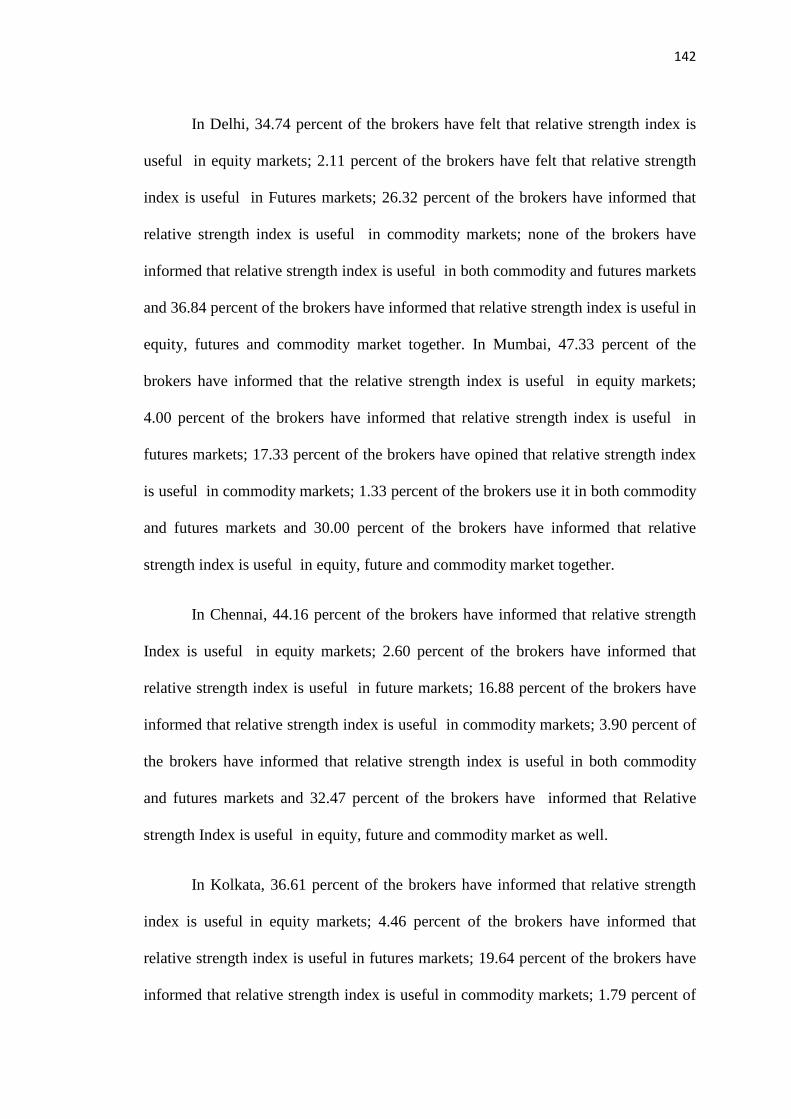
In Delhi, 34.74 percent of the brokers have felt that relative strength index is
useful in equity markets; 2.11 percent of the brokers have felt that relative strength
index is useful in Futures markets; 26.32 percent of the brokers have informed that
relative strength index is useful in commodity markets; none of the brokers have
informed that relative strength index is useful in both commodity and futures markets
and 36.84 percent of the brokers have informed that relative strength index is useful in
equity, futures and commodity market together. In Mumbai, 47.33 percent of the
brokers have informed that the relative strength index is useful in equity markets;
4.00 percent of the brokers have informed that relative strength index is useful in
futures markets; 17.33 percent of the brokers have opined that relative strength index
is useful in commodity markets; 1.33 percent of the brokers use it in both commodity
and futures markets and 30.00 percent of the brokers have informed that relative
strength index is useful in equity, future and commodity market together.
In Chennai, 44.16 percent of the brokers have informed that relative strength
Index is useful in equity markets; 2.60 percent of the brokers have informed that
relative strength index is useful in future markets; 16.88 percent of the brokers have
informed that relative strength index is useful in commodity markets; 3.90 percent of
the brokers have informed that relative strength index is useful in both commodity
and futures markets and 32.47 percent of the brokers have informed that Relative
strength Index is useful in equity, future and commodity market as well.
In Kolkata, 36.61 percent of the brokers have informed that relative strength
index is useful in equity markets; 4.46 percent of the brokers have informed that
relative strength index is useful in futures markets; 19.64 percent of the brokers have
informed that relative strength index is useful in commodity markets; 1.79 percent of
143
the brokers have informed that relative strength index is useful in both commodity
and futures markets and 37.50 percent of the brokers have informed that relative
strength index is useful in equity, futures and commodity market together.
Pearson’s Chi-square test has been used to test the significance of different
opinions of different brokers at different places regarding the usefulness of relative
strength index. The test has found that there is no significant difference between the
opinion among the different participants at different places at five percentage level of
significance since the p value (0.2608) is greater than 0.05. Hence, the study
concludes that relative strength index is more useful in equity markets compared to
future and commodity market.
7.6.4 Weight Given to Relative Strength Index as a Stock Specific Indicator
Relative Strength index shows the price oscillation in the market. The opinion
of brokers regarding the significance accorded by them to relative strength index as a
stock specific indicator is explained in table 7.4
Table 7.4
Weight given to Relative Strength index as a Stock Specific Indicator
Source: Primary data
The table shows that an average weight of 49.93 is given to relative strength
index as a stock specific indicator with a standard deviation of 18.66.
Locations Number Mean SD Delhi 95 50.84 18.59 Mumbai 300 49.89 18.56 Chennai 77 47.99 19.84 Kolkata 112 50.63 18.31 Total 584 49.93 18.66 Sum of squares 424.3803 df =3 Mean Square= 141.4601 F=0.405018 p=0.74945
144
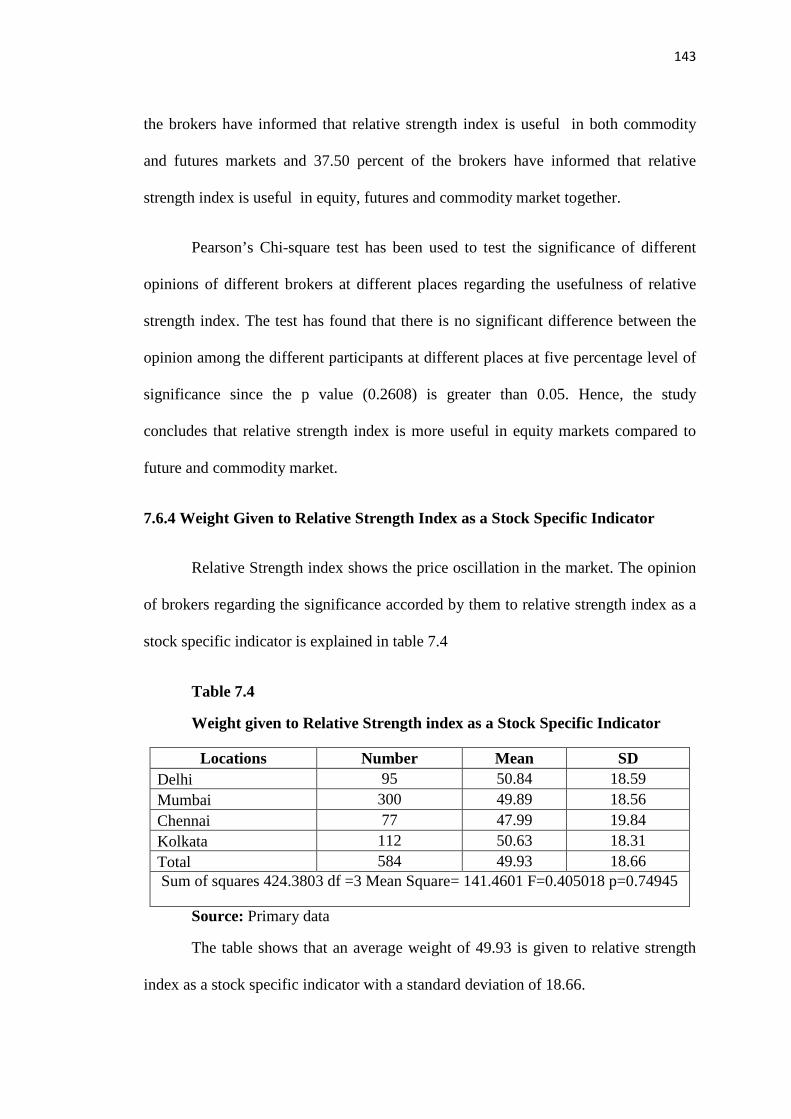
Fig, 7.4 Weight given to Relative Strength index as a Stock Specific Indicator
In Delhi, the average weight given to the relative strength index as a stock specific
indicator is 50.84with a standard deviation of 18.59. In Mumbai, the average weight
given to the relative strength index as a stock specific indicator is 49.89, with a
standard deviation of 18.56. In Chennai, the average weight given to relative strength
index as a stock specific indicator is 47.99 with a standard deviation of 19.84. In
Kolkata, the average weight given to the relative strength index as a stock specific
indicator is 50.63with a standard deviation of 18.31.
ANOVA test has been applied to test the significance of the opinion of
different brokers regarding the average weight given to the relative strength index as a
stock specific indicator. The test has found that there is no significant difference
among the opinion of different brokers at five percent level of significance, since the
p value (0.74945) is higher than the 0.05.
7.6.5 Accuracy of Relative Strength Index
The success of a technical indicator lies in the accuracy of predicting the
market. The opinion of brokers regarding the accuracy of relative strength index is
explained in table 7.5.
145
Table 7.5 Accuracy of Relative strength index
Source: Primary data
The table shows the average rate of accuracy of 59.27 shows by RSI in identifying
the trend in the market with a standard deviation of 18.4.
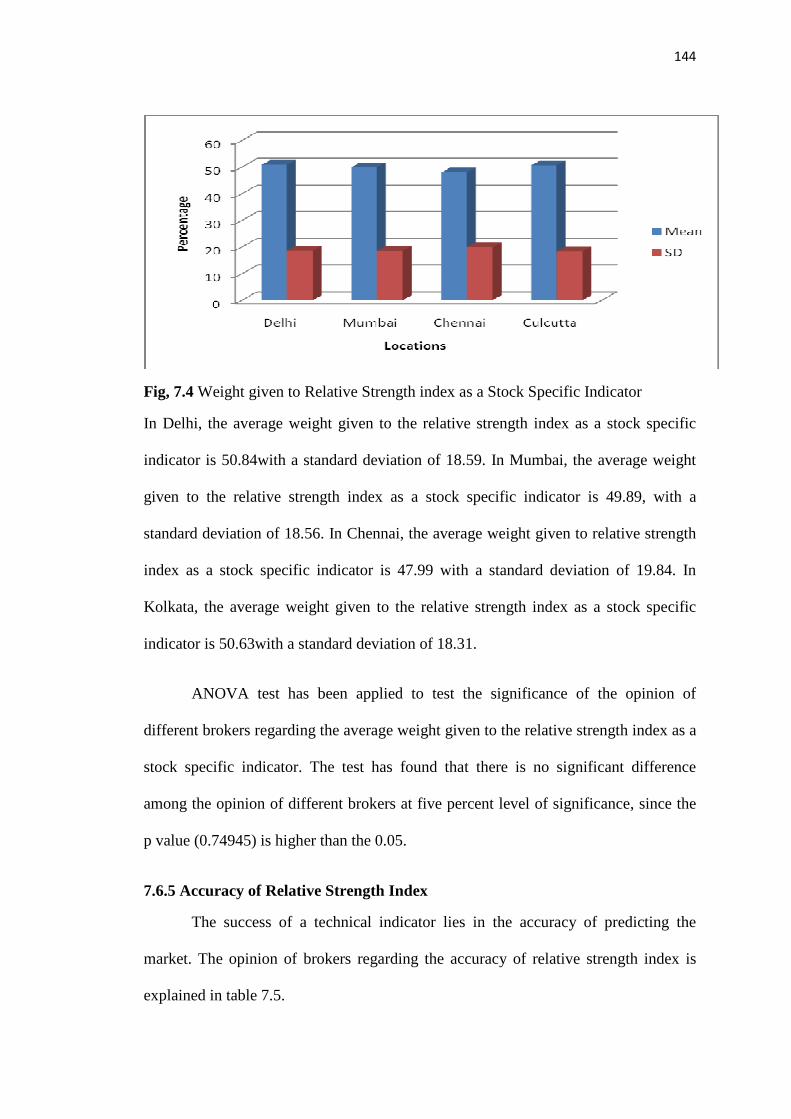
Fig, 7.5 Accuracy of Relative strength index
In Delhi, the average rate of accuracy shown by RSI in identifying the trend in
the market is 59.45, with a standard deviation of 17.59. In Mumbai, the average rate
of accuracy shown by RSI in identifying the trend in the market is 59.04 with a
standard deviation of 17.82. In Chennai, it is 59.29 with a standard deviation of 19.83,
while in Kolkata, it is 59.71 with a standard deviation of 19.78.
Locations Number Mean SD Delhi 95 59.45 17.59 Mumbai 300 59.04 17.82 Chennai 77 59.29 19.83 Kolkata 112 59.71 19.78 Total 584 59.27 18.4 Sum of squares=40.70849, df =3, Mean Square=13.5695, F=0.039887, p=0.989366
146
ANOVA test has been applied to analyze the significance of difference of opinions of
different brokers regarding the average rate of accuracy shown by RSI in identifying
the trend in the market. The test has found that there is no significant difference
among the opinion of different brokers at five percent level of significance, since the
p value (0.989366) is higher than the 0.05.
The primary data analysis shows that relative strength index is used as an
important stock specific indicator in stock market. Moreover, it is seen that RSI is
used in different sub markets of stock exchanges and has been proved useful but the
degree of usage differs from market to market. The study also found that Relative
strength index is beneficial to the brokers in predicting the trend of the market. It is
used to identify the trend with a considerable amount of accuracy. However, brokers
give considerable weight to relative strength index as a stock specific indicator while
analyzing the stocks.
7.7 Secondary Data Analysis
The study is based on National Stock Exchange’s nifty for a period of five
years starting from 2002-03 to 2006-07. The study takes only thirty six stocks to
facilitate continuous analysis of stocks. The closing price data of each security has
been taken for and it constitutes a total observation of 1259 for each stock. The data
has been collected from the NSE website. The constituents of nifty have been taken
because of their market value, capitalization, good return and consistence
performance in the market.
T ratio has been calculated to test the mean difference between relative
strength index trading rule with the strategy of buy and hold. The study took the same
147
methodology of Brock et al (1992) to analyze the mean difference. The study
assumes that the population has equal variances
µr - µ
_____________
(σ2/N+σ2/Nr) 1/2
Whereas µr and Nr are the mean return and number of signals of the buys and sells,µ
and N are the unconditional mean and number of observations. σ2 is the estimated
variance for the entire sample.
7.7.1 Empirical Analysis
In the analysis, the study explains the basic statistics of companies selected for
the study and. Table 6.1(Chapter six) contains the buy and hold returns of various
companies and their standard deviations and variances. The return is calculated using
the following equation.
Rt = [In (Pt)-In (Pt-1)]
Here, In (Pt) denotes the logarithm of closing price at the time of t. The analysis is
arranged into two parts and is explained in tables no 7.6, 7.7 respectively. The return
generated for almost all companies are positive. At the same time, companies also
show negative return.
148
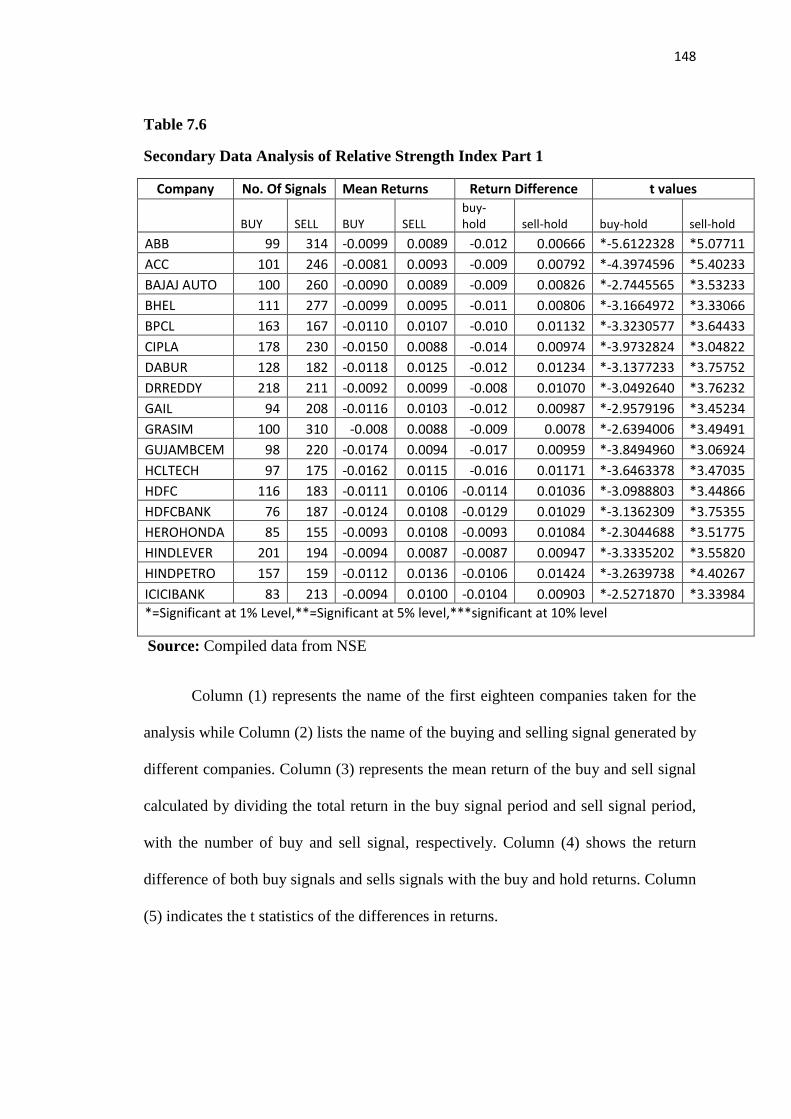
Table 7.6
Secondary Data Analysis of Relative Strength Index Part 1
Company No. Of Signals Mean Returns Return Difference t values
BUY SELL BUY SELL
buy-
hold sell-hold buy-hold sell-hold
ABB 99 314 -0.0099 0.0089 -0.012 0.00666 *-5.6122328 *5.07711
ACC 101 246 -0.0081 0.0093 -0.009 0.00792 *-4.3974596 *5.40233
BAJAJ AUTO 100 260 -0.0090 0.0089 -0.009 0.00826 *-2.7445565 *3.53233
BHEL 111 277 -0.0099 0.0095 -0.011 0.00806 *-3.1664972 *3.33066
BPCL 163 167 -0.0110 0.0107 -0.010 0.01132 *-3.3230577 *3.64433
CIPLA 178 230 -0.0150 0.0088 -0.014 0.00974 *-3.9732824 *3.04822
DABUR 128 182 -0.0118 0.0125 -0.012 0.01234 *-3.1377233 *3.75752
DRREDDY 218 211 -0.0092 0.0099 -0.008 0.01070 *-3.0492640 *3.76232
GAIL 94 208 -0.0116 0.0103 -0.012 0.00987 *-2.9579196 *3.45234
GRASIM 100 310 -0.008 0.0088 -0.009 0.0078 *-2.6394006 *3.49491
GUJAMBCEM 98 220 -0.0174 0.0094 -0.017 0.00959 *-3.8494960 *3.06924
HCLTECH 97 175 -0.0162 0.0115 -0.016 0.01171 *-3.6463378 *3.47035
HDFC 116 183 -0.0111 0.0106 -0.0114 0.01036 *-3.0988803 *3.44866
HDFCBANK 76 187 -0.0124 0.0108 -0.0129 0.01029 *-3.1362309 *3.75355
HEROHONDA 85 155 -0.0093 0.0108 -0.0093 0.01084 *-2.3044688 *3.51775
HINDLEVER 201 194 -0.0094 0.0087 -0.0087 0.00947 *-3.3335202 *3.55820
HINDPETRO 157 159 -0.0112 0.0136 -0.0106 0.01424 *-3.2639738 *4.40267
ICICIBANK 83 213 -0.0094 0.0100 -0.0104 0.00903 *-2.5271870 *3.33984
*=Significant at 1% Level,**=Significant at 5% level,***significant at 10% level
Source: Compiled data from NSE
Column (1) represents the name of the first eighteen companies taken for the
analysis while Column (2) lists the name of the buying and selling signal generated by
different companies. Column (3) represents the mean return of the buy and sell signal
calculated by dividing the total return in the buy signal period and sell signal period,
with the number of buy and sell signal, respectively. Column (4) shows the return
difference of both buy signals and sells signals with the buy and hold returns. Column
(5) indicates the t statistics of the differences in returns.
149
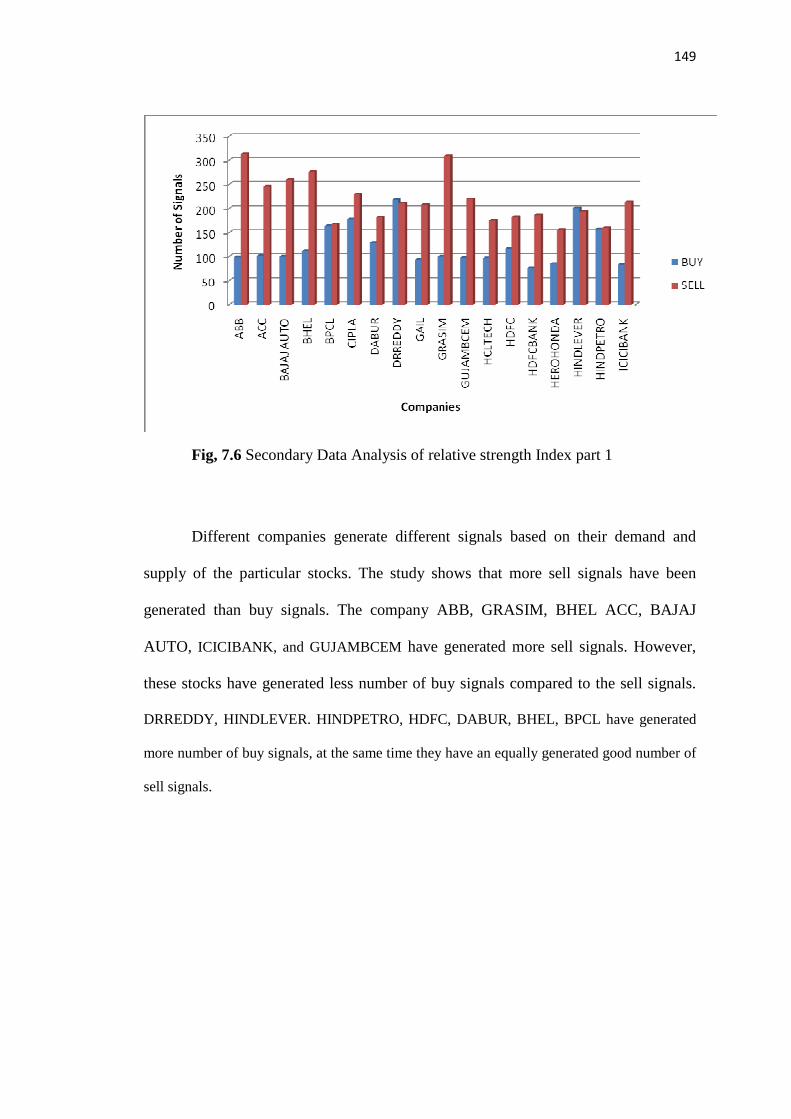
Fig, 7.6 Secondary Data Analysis of relative strength Index part 1
Different companies generate different signals based on their demand and
supply of the particular stocks. The study shows that more sell signals have been
generated than buy signals. The company ABB, GRASIM, BHEL ACC, BAJAJ
AUTO, ICICIBANK, and GUJAMBCEM have generated more sell signals. However,
these stocks have generated less number of buy signals compared to the sell signals.
DRREDDY, HINDLEVER. HINDPETRO, HDFC, DABUR, BHEL, BPCL have generated
more number of buy signals, at the same time they have an equally generated good number of
sell signals.
150
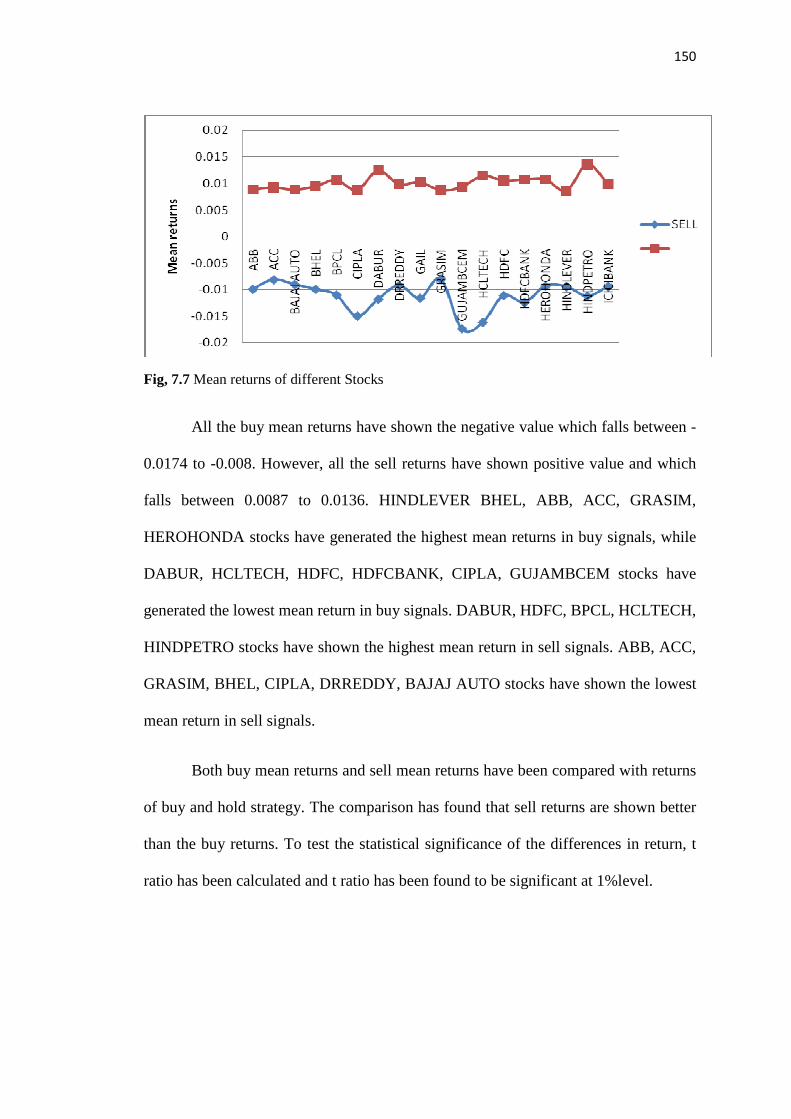
Fig, 7.7 Mean returns of different Stocks
All the buy mean returns have shown the negative value which falls between -
0.0174 to -0.008. However, all the sell returns have shown positive value and which
falls between 0.0087 to 0.0136. HINDLEVER BHEL, ABB, ACC, GRASIM,
HEROHONDA stocks have generated the highest mean returns in buy signals, while
DABUR, HCLTECH, HDFC, HDFCBANK, CIPLA, GUJAMBCEM stocks have
generated the lowest mean return in buy signals. DABUR, HDFC, BPCL, HCLTECH,
HINDPETRO stocks have shown the highest mean return in sell signals. ABB, ACC,
GRASIM, BHEL, CIPLA, DRREDDY, BAJAJ AUTO stocks have shown the lowest
mean return in sell signals.
Both buy mean returns and sell mean returns have been compared with returns
of buy and hold strategy. The comparison has found that sell returns are shown better
than the buy returns. To test the statistical significance of the differences in return, t
ratio has been calculated and t ratio has been found to be significant at 1%level.
151
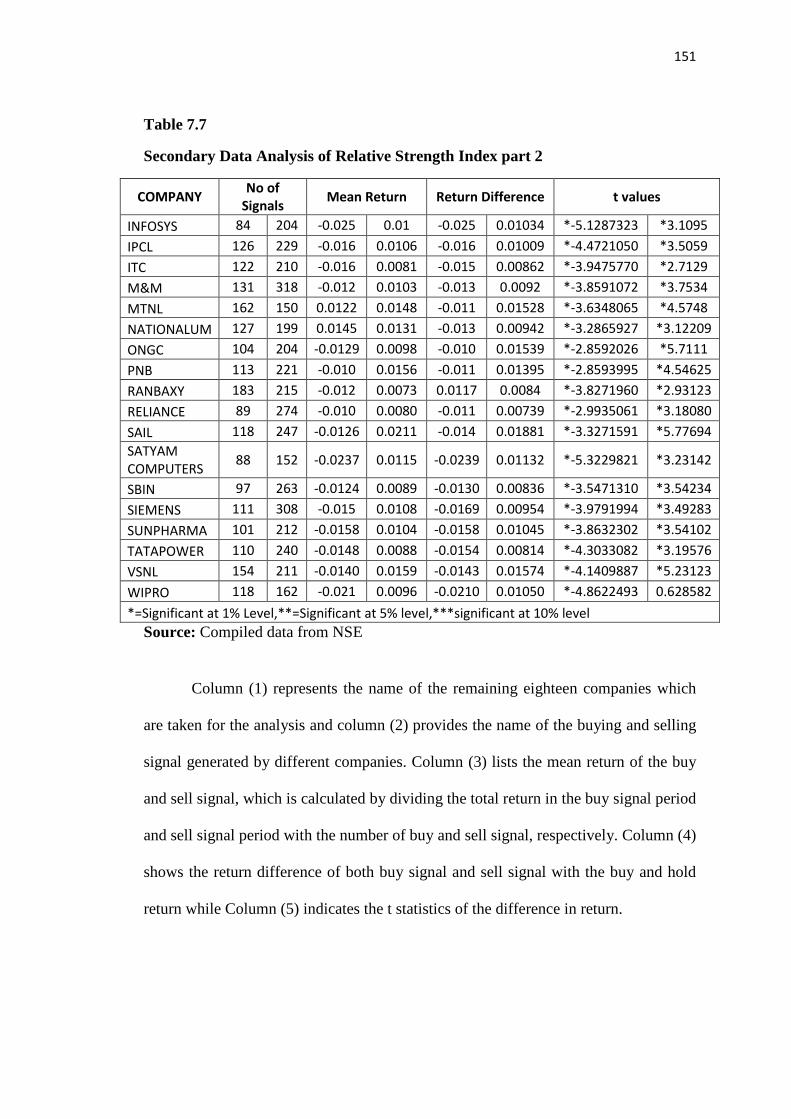
Table 7.7
Secondary Data Analysis of Relative Strength Index part 2
COMPANY No of
Signals Mean Return Return Difference t values
INFOSYS 84 204 -0.025 0.01 -0.025 0.01034 *-5.1287323 *3.1095
IPCL 126 229 -0.016 0.0106 -0.016 0.01009 *-4.4721050 *3.5059
ITC 122 210 -0.016 0.0081 -0.015 0.00862 *-3.9475770 *2.7129
M&M 131 318 -0.012 0.0103 -0.013 0.0092 *-3.8591072 *3.7534
MTNL 162 150 0.0122 0.0148 -0.011 0.01528 *-3.6348065 *4.5748
NATIONALUM 127 199 0.0145 0.0131 -0.013 0.00942 *-3.2865927 *3.12209
ONGC 104 204 -0.0129 0.0098 -0.010 0.01539 *-2.8592026 *5.7111
PNB 113 221 -0.010 0.0156 -0.011 0.01395 *-2.8593995 *4.54625
RANBAXY 183 215 -0.012 0.0073 0.0117 0.0084 *-3.8271960 *2.93123
RELIANCE 89 274 -0.010 0.0080 -0.011 0.00739 *-2.9935061 *3.18080
SAIL 118 247 -0.0126 0.0211 -0.014 0.01881 *-3.3271591 *5.77694
SATYAM
COMPUTERS 88 152 -0.0237 0.0115 -0.0239 0.01132 *-5.3229821 *3.23142
SBIN 97 263 -0.0124 0.0089 -0.0130 0.00836 *-3.5471310 *3.54234
SIEMENS 111 308 -0.015 0.0108 -0.0169 0.00954 *-3.9791994 *3.49283
SUNPHARMA 101 212 -0.0158 0.0104 -0.0158 0.01045 *-3.8632302 *3.54102
TATAPOWER 110 240 -0.0148 0.0088 -0.0154 0.00814 *-4.3033082 *3.19576
VSNL 154 211 -0.0140 0.0159 -0.0143 0.01574 *-4.1409887 *5.23123
WIPRO 118 162 -0.021 0.0096 -0.0210 0.01050 *-4.8622493 0.628582
*=Significant at 1% Level,**=Significant at 5% level,***significant at 10% level
Source: Compiled data from NSE
Column (1) represents the name of the remaining eighteen companies which
are taken for the analysis and column (2) provides the name of the buying and selling
signal generated by different companies. Column (3) lists the mean return of the buy
and sell signal, which is calculated by dividing the total return in the buy signal period
and sell signal period with the number of buy and sell signal, respectively. Column (4)
shows the return difference of both buy signal and sell signal with the buy and hold
return while Column (5) indicates the t statistics of the difference in return.
152
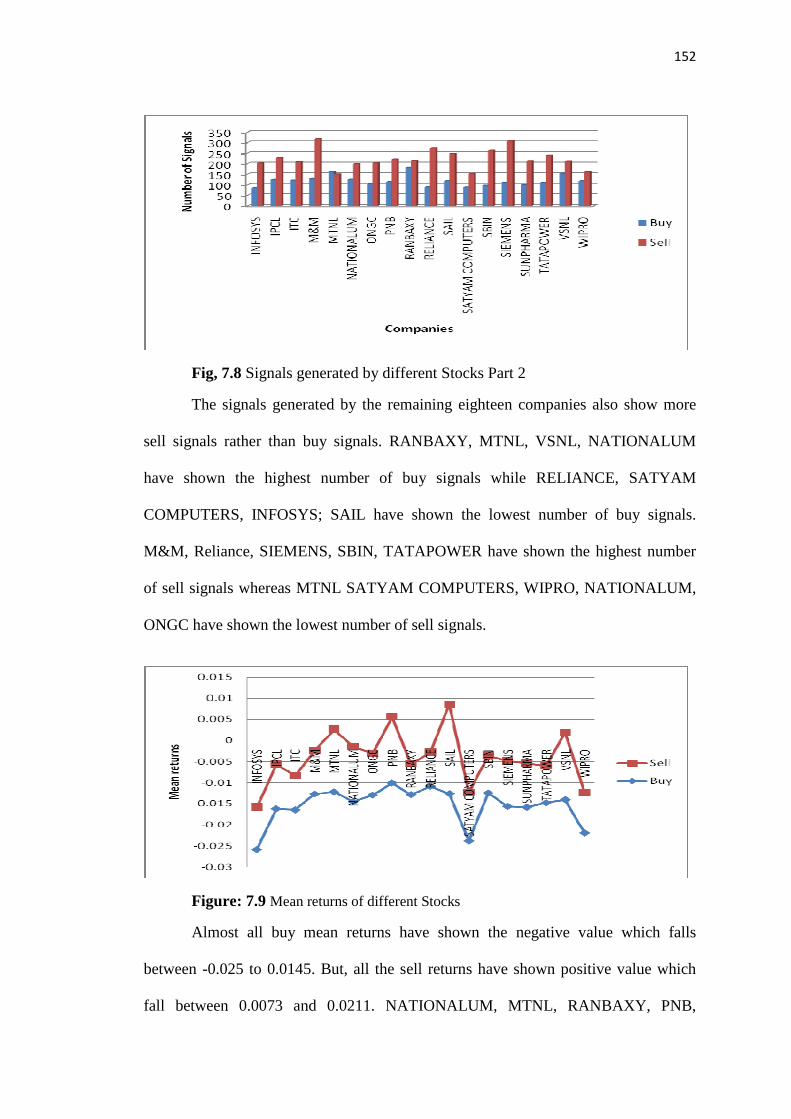
Fig, 7.8 Signals generated by different Stocks Part 2
The signals generated by the remaining eighteen companies also show more
sell signals rather than buy signals. RANBAXY, MTNL, VSNL, NATIONALUM
have shown the highest number of buy signals while RELIANCE, SATYAM
COMPUTERS, INFOSYS; SAIL have shown the lowest number of buy signals.
M&M, Reliance, SIEMENS, SBIN, TATAPOWER have shown the highest number
of sell signals whereas MTNL SATYAM COMPUTERS, WIPRO, NATIONALUM,
ONGC have shown the lowest number of sell signals.
Figure: 7.9 Mean returns of different Stocks
Almost all buy mean returns have shown the negative value which falls
between -0.025 to 0.0145. But, all the sell returns have shown positive value which
fall between 0.0073 and 0.0211. NATIONALUM, MTNL, RANBAXY, PNB,
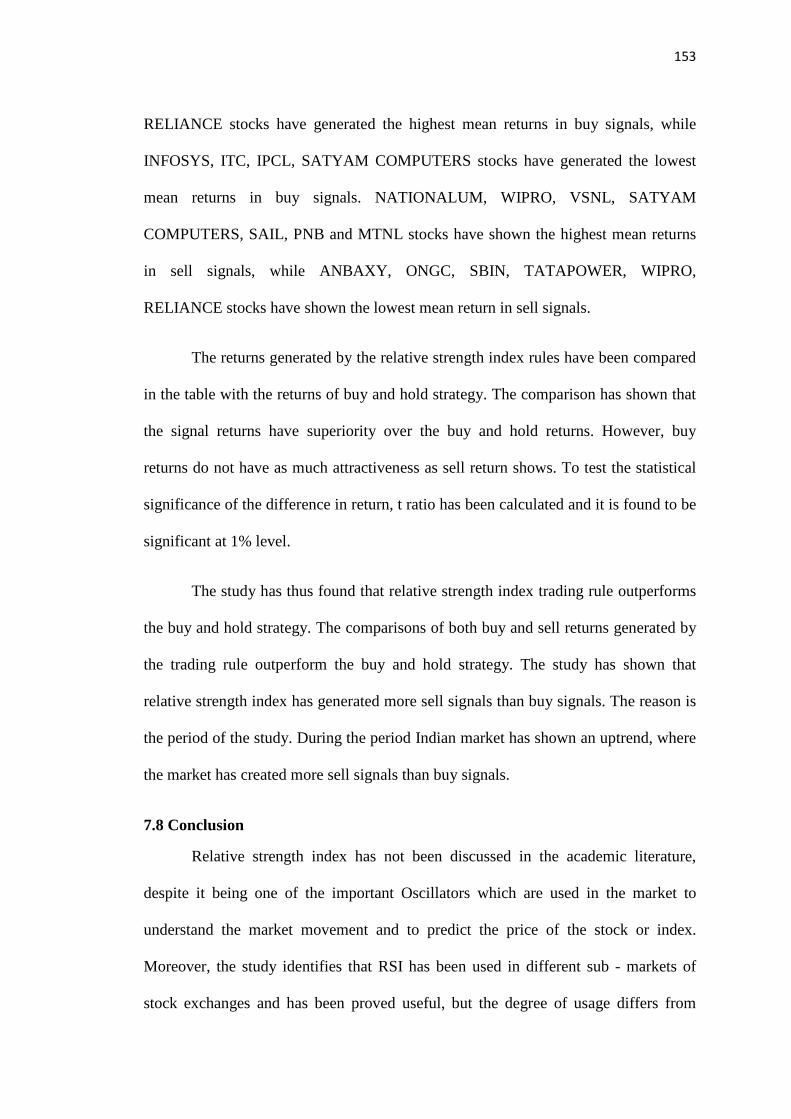
153
RELIANCE stocks have generated the highest mean returns in buy signals, while
INFOSYS, ITC, IPCL, SATYAM COMPUTERS stocks have generated the lowest
mean returns in buy signals. NATIONALUM, WIPRO, VSNL, SATYAM
COMPUTERS, SAIL, PNB and MTNL stocks have shown the highest mean returns
in sell signals, while ANBAXY, ONGC, SBIN, TATAPOWER, WIPRO,
RELIANCE stocks have shown the lowest mean return in sell signals.
The returns generated by the relative strength index rules have been compared
in the table with the returns of buy and hold strategy. The comparison has shown that
the signal returns have superiority over the buy and hold returns. However, buy
returns do not have as much attractiveness as sell return shows. To test the statistical
significance of the difference in return, t ratio has been calculated and it is found to be
significant at 1% level.
The study has thus found that relative strength index trading rule outperforms
the buy and hold strategy. The comparisons of both buy and sell returns generated by
the trading rule outperform the buy and hold strategy. The study has shown that
relative strength index has generated more sell signals than buy signals. The reason is
the period of the study. During the period Indian market has shown an uptrend, where
the market has created more sell signals than buy signals.
7.8 Conclusion
Relative strength index has not been discussed in the academic literature,
despite it being one of the important Oscillators which are used in the market to
understand the market movement and to predict the price of the stock or index.
Moreover, the study identifies that RSI has been used in different sub - markets of
stock exchanges and has been proved useful, but the degree of usage differs from
154
market to market. The study also identifies that relative strength index is beneficial to
the brokers in predicting the trend of the market. It is used to identify the trend with a
considerable amount of accuracy. However, brokers give considerable weight to
relative strength index as a stock specific indicator while analyzing the stocks. The
analysis agrees that signal returns generated by the relative strength index
outperforms the buy and hold strategy. Both primary data analysis and secondary
data analysis have shown that brokers use relative strength index in the market for
analyzing the stocks and it outperforms the buy and hold strategy. Hence, the study
does not reject the hypothesis that relative strength index plays an important role as
stock specific indicator.