Embed Size (px)
Citation preview

7MW Levenmouth Demonstration Turbine - Managing data and the asset to develop research and demonstration projects during turbine operation
16 January 2020 Paul McKeever – Head of Electrical Research

GLASGOWORE Catapult
Agenda
• 7MW Levenmouth Demonstration Turbine (LDT) Summary
• The LDT in numbers
• Operation of the LDT - Challenges
• LDT Asset Usage
• Management & Utilisation of Data
• The Platform for Operational Data (POD) Service
• Developing a Turbine Model
• The LDT Model
• LDT as a Demonstration Platform
• Case Studies
– Non-intrusive demonstrations
– Offshore Demonstration Blade (ODB) and TotalControl Projects
• Conclusions

• Short Video - https://youtu.be/-j3hZvQIEWI
• Located in Fife, Scotland
• Acquired by ORE Catapult in November, 2015
• One of the world’s most advanced open access offshore wind turbines
• Dedicated to research and product validation/demonstration
7MW Levenmouth Demonstration Turbine (LDT) Summary

The LDT in numbers

Operation of the LDT
List of Activities (non-exhaustive)
• Product validation of new concepts and technology (including power performance measurements)
• Demonstrate remote inspection methods and technologies
• Improve wind resource estimation and standardisation
• Holistic control system development, including control algorithm optimisation
• Prognostic condition monitoring system (CMS) development
• Measurement system development (DAQ, sensors)
• Measure and compare real-life data against a controlled test programme
• Structural mechanics
• Aeroelastic modelling
• Aerodynamic modelling
• Design and analysis tool evaluation
• Evaluate environmental conditions, data and/or impact
Enables vital testing, verification and validation of remote sensing and otherinnovative technologies in order to prove reliability and performance (andfacilitate data availability) for next generation offshore wind turbine technologies.

1. Proximity to land
1. Great for turbine access
2. Still provides offshore environment
3. Care regarding interaction with local community
4. Effects on wind resource assessment
Operation of the LDT - Challenges
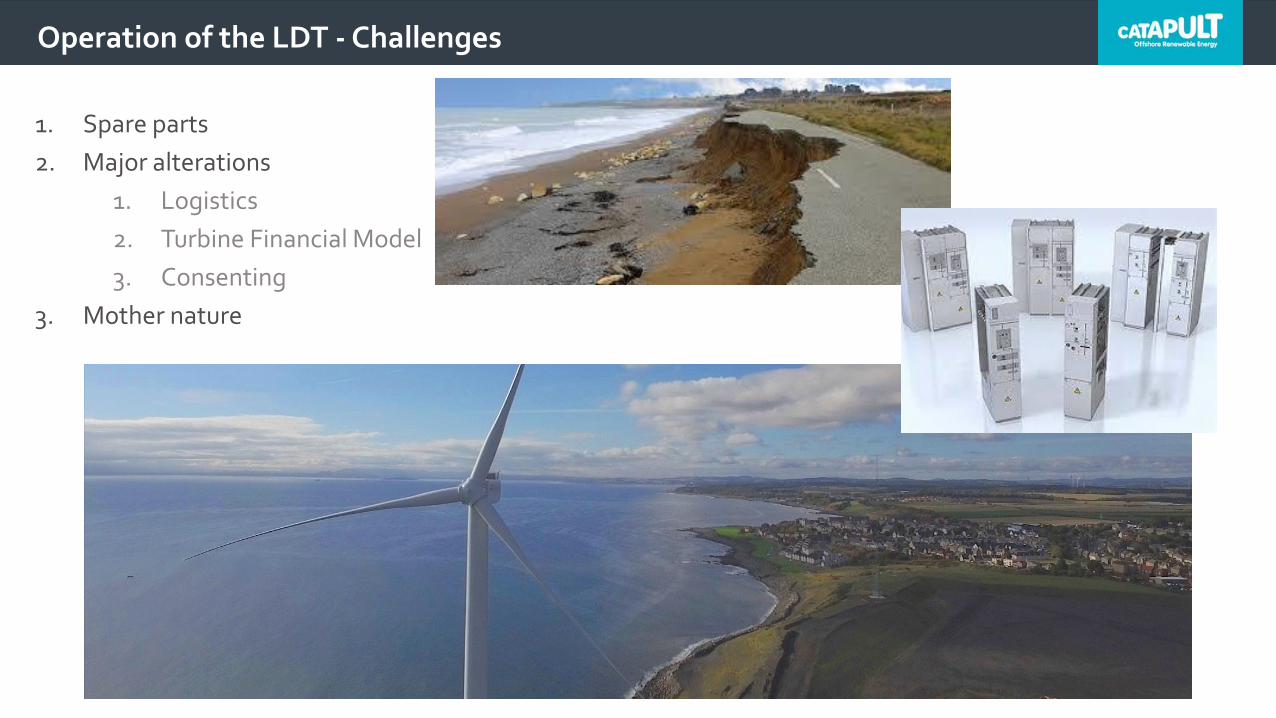
1. Spare parts
2. Major alterations
1. Logistics
2. Turbine Financial Model
3. Consenting
3. Mother nature
Operation of the LDT - Challenges

ore.catapult.org.uk@orecatapult
LDT Asset Usage

In addition to standard SCADA controller signals and existingcondition monitoring systems (see summary table below), ORECatapult has been working on the CLOWT (Clone of the LevenmouthOffshore Wind Turbine) Project.
• Project ultimately aims to develop a validated virtual model ofthe Levenmouth Demonstration Turbine (LDT)
• Validated using measurement campaign data from acomprehensive package of instrumentation
Management & Utilisation of Data
Component High-Level Measurement DescriptionHub Temperature, rotational speed, azimuthPitch Pitch position, pitch rate, pitch demand, motor current, motor temperature
Nacelle Yaw position, wind direction, wind speed, yaw error, yaw speed, temperature
(inside and outside), vibrations (accelerations)Drive-train Oil pressure, oil temperature, vibrations (accelerations), gearbox temperature
Main bearing TemperatureTower Vibrations (accelerations)Electrical IGCT temperature, current (generator, grid), voltage (grid, generator),
temperature (generator), reactive power (generator, grid), torque, generator
speed, active power (grid, generator), grid frequency, grid phase, power factorProtective relay
(IPR)
Line current, frequency, power (real, reactive and apparent)

CLOWT Project Sensors
Component Sensors Location QttyJacket Strain Gauge Jacket Brace 1 2
Jacket Brace 2 2Jacket Leg 2Jacket Brace 1
(alternate side)2
Jacket Brace 2
(alternate side)2
Component Sensor Location QttyTransition
PieceStrain Gauge Diagonal Leg (side 1) 2
Horizontal Leg (side 1) 2Tower 3Diagonal Leg (Side 2) 2Horizontal Leg (Side 2) 2
Component Sensor Location QttyTower Strain Gauge Tower top 2
Tower base 2Tower middle 2
Accelerometer Tower top 11/3 from top 1
Component Sensor Location Qtty
Blade Strain Gauge Blade root4 x 3
blades¼ Blade length 4.4 Blade length 4½ Blade length 4.6 Blade length 4¾ Blade length 4
Component Equipment Location QttyWind Resource ZephIR Lidar Nacelle (Forward Facing) 1
Component Sensor Location QttyPower Train Speed
Various Multiple
TorqueTemperature
CurrentVoltage
HumidityPitch System Temperature
CurrentVoltage
Humidity

What is POD?• POD enables you to access and request data sets for the LDT
How does it work?• Browse the POD catalogue and request your required datasets
• Samples of each data collection are available for you to view• Choose the data collections/time periods you are interested in• Briefly describe your intended use of the data*There is a small charge to cover the data retrieval, depending on the size or complexity of the request, and this will be calculated after receipt of the request and discussion around an appropriate solution.
Data Storage & Availability
The Platform for Operational Data (POD) Service
Data Set Frequency of Capture
LDT Met Mast SCADA 1 sec & 10 min
LDT Substation SCADA 1 sec & 10 min
LDT Turbine SCADA 1 sec & 10 min
LDT Alarm Log
All data sources are collectedin a bespoke Data AcquisitionSystem (DAQ) and are storedon a local server at the LDTsite. Data transfer to remoteusers can be provided whereappropriate.

ore.catapult.org.uk@orecatapult
Developing a Turbine Model
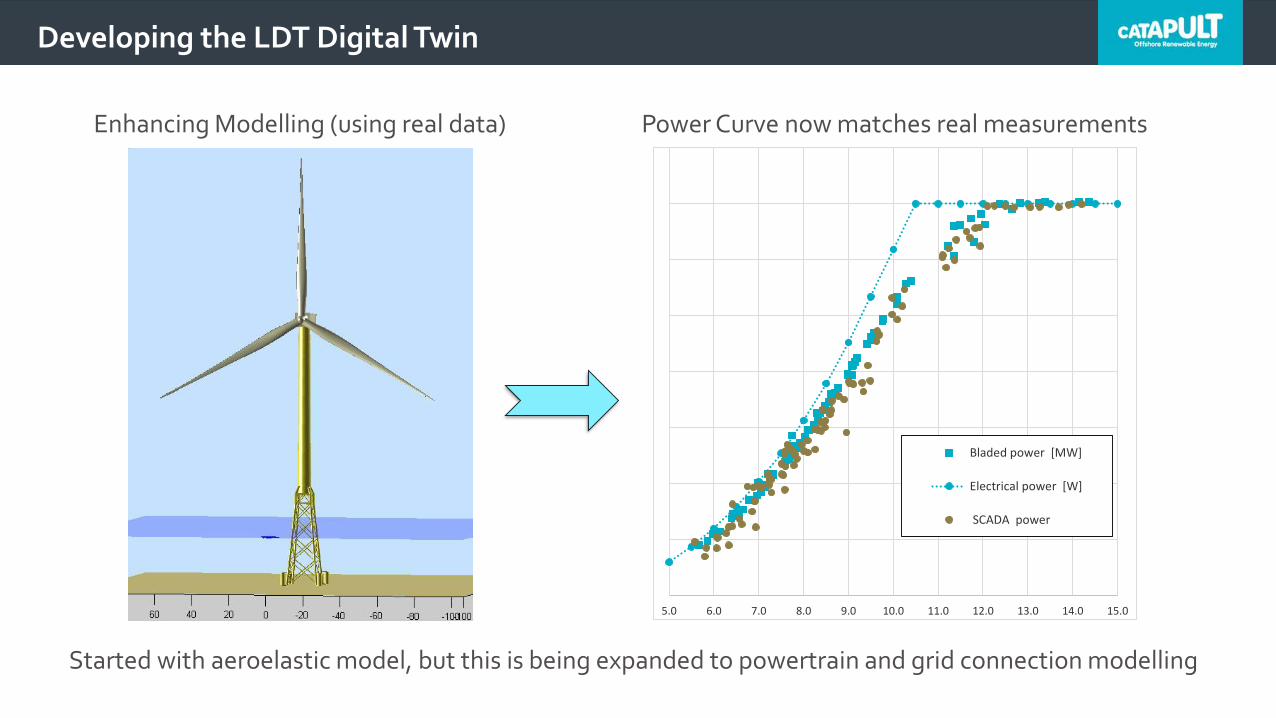
Enhancing Modelling (using real data) Power Curve now matches real measurements
Started with aeroelastic model, but this is being expanded to powertrain and grid connection modelling
Developing the LDT Digital Twin
5.0 6.0 7.0 8.0 9.0 10.0 11.0 12.0 13.0 14.0 15.0
Bladed power [MW]
Electrical power [W]
SCADA power

• 1st step in process: choose your data
• We have filtered SCADA samples where wind direction is aligned with the met mast
• Using only samples where all wind measurements (met mast, WT) coincide
Managing Data on the Project

• 2nd step: run some simulations
• Used a bespoke python script - wind measurements are being easily translated into simulations:
Managing Data on the Project
Time(GMT) Hour Unit T01 (Power Real -
Mean (SHI 7.0MW)
[MW])
Unit Met01:Anemo1
(Sensor Mean
(Anemometer) [m/s])
Unit Met01:Anemo2
(Sensor Mean
(Anemometer) [m/s])
Unit Met01:Anemo3
(Sensor Mean
(Anemometer) [m/s])
Unit Met01:Turbine wind
direction (Sensor Mean
(Wind vane) [deg N])
Unit T01 (Wind Direction
at Reference Met (SHI
7.0MW) [deg])
7.4.17 02:55:00 2.7 8.1 8.1 6.9 250.3 250.3
7.4.17 03:15:00 2.6 8.0 8.0 6.7 250.3 250.3
7.4.17 16:15:00 3.6 9.0 8.9 8.2 248.1 248.1
7.4.17 19:15:00 2.1 7.5 7.4 6.3 245.1 245.1
7.4.17 23:15:00 1.9 7.3 7.3 6.9 256.6 256.6
8.4.17 02:35:00 0.7 5.7 5.7 4.8 254.7 254.7
8.4.17 05:35:00 1.2 6.5 6.5 5.6 242.4 242.4
9.4.17 14:45:00 3.0 8.5 8.4 7.8 249.8 249.8
9.4.17 20:15:00 3.1 8.6 8.5 7.2 256.6 256.6
10.4.17 23:15:00 2.6 8.0 8.0 7.0 249.7 249.7
11.4.17 07:45:00 6.0 11.4 11.4 10.2 242.1 242.1
11.4.17 09:55:00 6.6 12.1 12.0 11.4 249.1 249.1
13.4.17 01:25:00 3.3 8.8 8.7 7.4 255.3 255.3
13.4.17 05:15:00 2.4 7.9 7.9 6.6 256.4 256.4
13.4.17 05:45:00 4.7 10.1 10.0 8.9 253.3 253.3
13.4.17 21:55:00 3.8 9.2 9.1 7.9 252.2 252.2
14.4.17 01:25:00 3.5 8.9 8.9 7.6 245.1 245.1
14.4.17 09:35:00 0.9 6.1 6.0 5.4 249.4 249.4
14.4.17 10:55:00 0.9 6.0 5.9 5.6 254.8 254.8
14.4.17 11:55:00 1.1 6.4 6.3 6.1 254.7 254.7
14.4.17 14:15:00 1.0 6.1 6.1 5.2 244.9 244.9
14.4.17 15:25:00 1.9 7.3 7.3 7.1 248.9 248.9
14.4.17 19:25:00 3.8 9.2 9.2 8.0 250.1 250.1
14.4.17 22:45:00 2.6 8.1 8.0 6.9 255.0 255.0
19.4.17 09:35:00 2.0 7.4 7.3 6.7 242.8 242.8
19.4.17 14:25:00 1.9 7.3 7.2 7.0 249.9 249.9
19.4.17 16:05:00 3.3 8.7 8.7 8.4 247.9 247.9
19.4.17 19:35:00 2.9 8.4 8.4 7.5 245.3 245.3
19.4.17 22:25:00 1.6 7.0 7.0 5.8 242.2 242.2
Filter SCADA samples in 240°direction (or any other criteria)
Read SCADA wind measurements Re-create them in .bts and .wnd format
Simulate with these winds
4.0
5.0
6.0
7.0
8.0
9.0
10.0
11.0
12.0
13.0
14.0
0 100 200 300 400 500
Wind speed - Tool A vs Tool B vs SCADA
Tool B - Wind ABS
Tool A - Wind speed [m/s]
SCADA - WindSpeed_mps
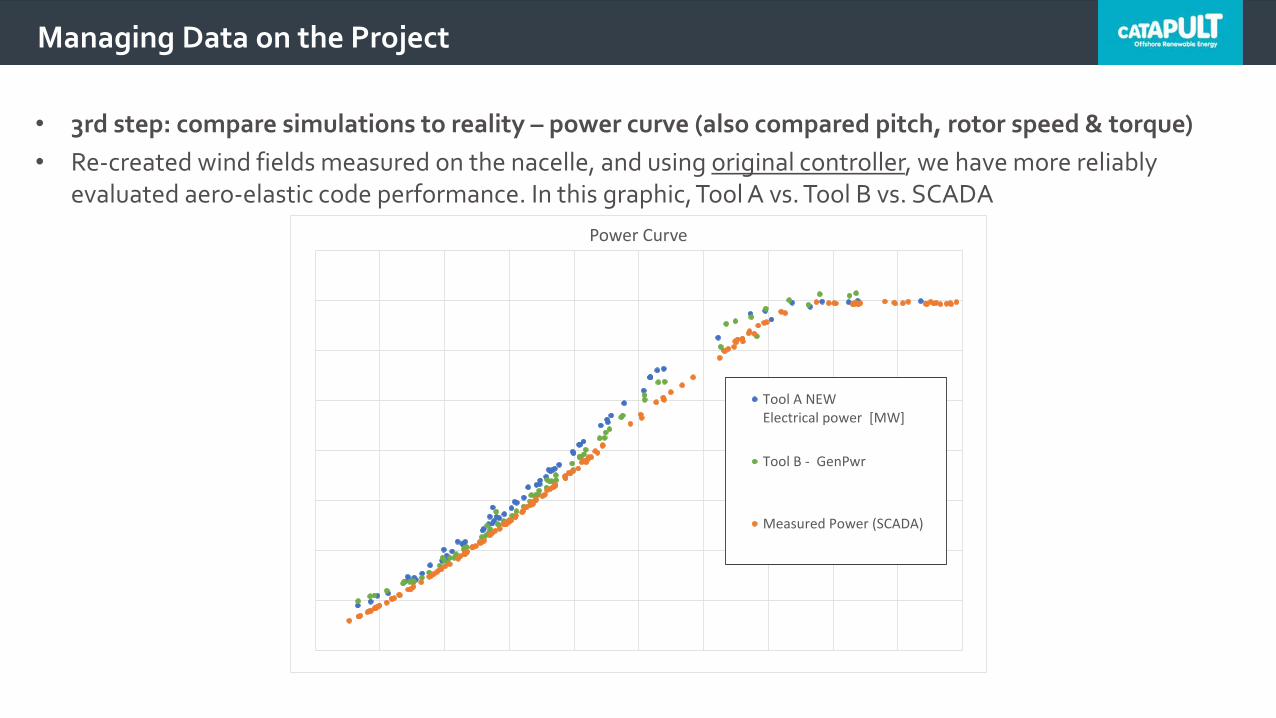
• 3rd step: compare simulations to reality – power curve (also compared pitch, rotor speed & torque)
• Re-created wind fields measured on the nacelle, and using original controller, we have more reliably evaluated aero-elastic code performance. In this graphic, Tool A vs. Tool B vs. SCADA
Managing Data on the Project
Power Curve
Tool A NEWElectrical power [MW]
Tool B - GenPwr
Measured Power (SCADA)

• CLOWT Sensors – Additional sensors recently fitted to the LDT will enable a number of new R&D projects
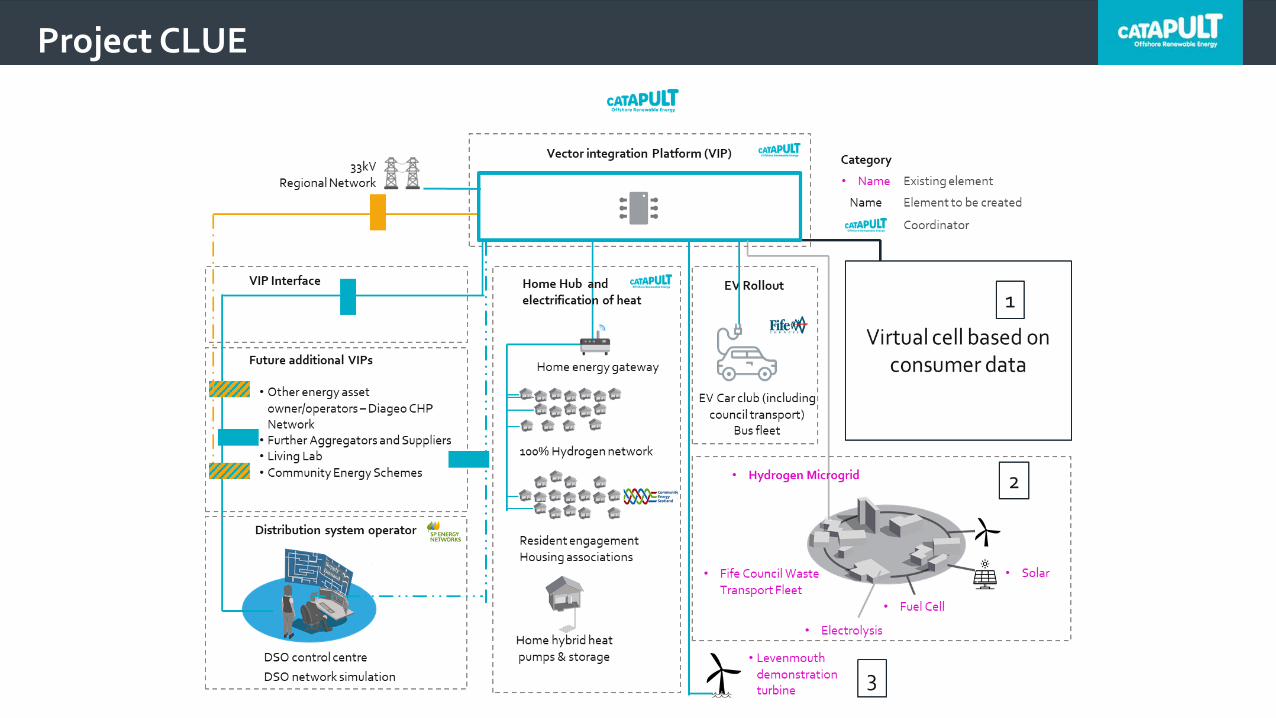
• Expansion into Energy Systems Research – Project CLUE
• Concepts, Planning, Demonstration and Replication of Local User-friendly Energy Communities (CLUE) - €7million project delivered over 3 years from December 2019
• CLUE will develop and validate a tool kit supporting the implementation of sustainable local energy systems and will close the gap of missing control and monitoring tools
• The different types of Local Energy Community (LEC) stakeholders (cooperatives, project developers, DSOs, owners, operators of LECs, utilities, supplier) will participate in CLUE
Future Use of the LDT
Project CLUE

ore.catapult.org.uk@orecatapult
LDT as a Demonstration Platform

Non-Intrusive Demonstrations
List of Activities (non-exhaustive)
• Product validation of new concepts and technology (including power performance measurements)
• Demonstrate remote inspection methods and technologies
• Improve wind resource estimation and standardisation
• Holistic control system development, including control algorithm optimisation
• Prognostic condition monitoring system (CMS) development
• Measurement system development (DAQ, sensors)
• Measure and compare real-life data against a controlled test programme
• Structural mechanics
• Aeroelastic modelling
• Aerodynamic modelling
• Design and analysis tool evaluation
• Evaluate environmental conditions, data and/or impact
Enables vital testing, verification and validation of remote sensing and otherinnovative technologies in order to prove reliability and performance (andfacilitate data availability) for next generation offshore wind turbine technologies.

• Getting onto and off the turbines from a boat is among the most stressful and dangerous parts of offshore turbine maintenance
• When waves are higher than 1.5 metres, transfers are considered too risky
• Failed transfers and lost energy production are hugely expensive for operators
• Problem is set to become worse as the industry pushes into sites that are further from shore
• Limpet Technology has developed an offshore personnel transfer system aimed at alleviating this problem
• Dynamic hoist and fall arrest system uses in-built lasers to track the vessel’s deck, adjusting the height of the hoist in real time
• Compensates for the motion of the vessel and allows the technician to clip in and transfer onto the turbine more easily
• Limpet’s system can make safe transfers possible in 3m waves
• Aims to increase access to far offshore turbines from 50% of the year to 80%
Limpet – Height Safety and Access Systems

Synaptec –Cable Monitoring Utilising Existing Cable Optical Fibres
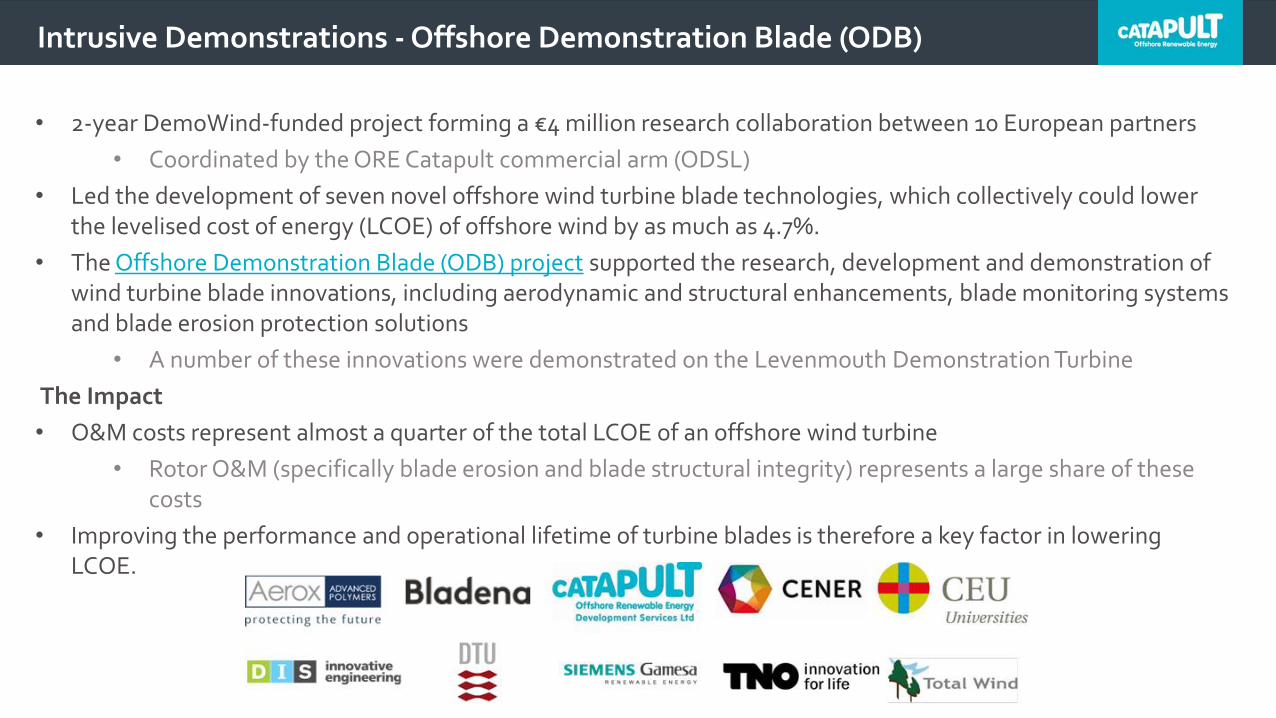
• 2-year DemoWind-funded project forming a €4 million research collaboration between 10 European partners
• Coordinated by the ORE Catapult commercial arm (ODSL)
• Led the development of seven novel offshore wind turbine blade technologies, which collectively could lower the levelised cost of energy (LCOE) of offshore wind by as much as 4.7%.
• The Offshore Demonstration Blade (ODB) project supported the research, development and demonstration of wind turbine blade innovations, including aerodynamic and structural enhancements, blade monitoring systems and blade erosion protection solutions
• A number of these innovations were demonstrated on the Levenmouth Demonstration Turbine
The Impact
• O&M costs represent almost a quarter of the total LCOE of an offshore wind turbine
• Rotor O&M (specifically blade erosion and blade structural integrity) represents a large share of these costs
• Improving the performance and operational lifetime of turbine blades is therefore a key factor in lowering LCOE.
Intrusive Demonstrations - Offshore Demonstration Blade (ODB)

• Aerox Advanced Polymers - Leading Edge Protection Coating
• Installed on LDT in May 2019
• Applied successfully to blade area that had previously had a repair due to some minor lightning damage
• Performance of the coating continues to be monitored
• GEV Windpower – X-Stiffener
• Installed on LDT in May 2019 with support from Bladena
• Explain where fitted inside the blade
• TNO – Cross Sectional Shear Distortion Sensor (CSSDS)
• Installed on LDT in May 2019 with support from GEV Windpower
• Designed to monitor X-Stiffener performance
• X-Stiffener and the CSSDS were decommissioned in late 2019 after a few months of trial
ODB Demonstrations at Levenmouth (LDT)

• TotalControl is a project within the Horizon 2020 framework funded by the European Union (Project Number 727680)
• The project runs for four years, from 1 January 2018 to 31 December 2021
• The total project budget is EUR 4 876 482,50
• The ambition of the TotalControl project is to develop the next generation of wind power plant (WPP) control tools, improving both WPP control itself and the link between wind turbine (WT) and WPP control
• TotalControl uses high-fidelity simulation and design environments including time resolved flow field modelling, nonlinear flexible multi-body representations of turbines, and detailed power grid models
Intrusive Demonstrations - The TotalControl Project

TotalControl –Use of LDT
List of Activities (non-exhaustive)
• Product validation of new concepts and technology (including power performance measurements)
• Demonstrate remote inspection methods and technologies
• Improve wind resource estimation and standardisation
• Holistic control system development, including control algorithm optimisation
• Prognostic condition monitoring system (CMS) development
• Measurement system development (DAQ, sensors)
• Measure and compare real-life data against a controlled test programme
• Structural mechanics
• Aeroelastic modelling
• Aerodynamic modelling
• Design and analysis tool evaluation
• Evaluate environmental conditions, data and/or impact
Enables vital testing, verification and validation of remote sensing and otherinnovative technologies in order to prove reliability and performance (andfacilitate data availability) for next generation offshore wind turbine technologies.

• Controller development
• Adaptability & operational flexibility (turbulence-based de-rating/up-rating)
• Ancillary services (active power control)
• Load reduction and damping (IPC and Lidar assisted control)
Developing/Demonstrating Improved Wind Turbine/Farm Control

• Lidar Assisted Control
• Installation of DTU SpinnerLidars planned in early 2020 – One forward and one rear facing
• Forward facing measures detailed inflow wind conditions
• Rear facing measures detailed wake dynamics behind the turbine
• Allows development of feed forward/model predictive controllers and turbine wake controllers
Developing/Demonstrating Improved Wind Turbine/Farm Control

TotalControl Schedule –Activity in 2020/21

• 7MW Levenmouth Demonstration Turbine (LDT) Summary
• Size matters
• Operating environment and consenting
• LDT Asset Usage
• Operational data vs. design data
• Use online POD service or direct contact –[email protected]
• Developing a Turbine Model
• Model validation, maximising simulation capability, recreating events, pushing boundaries
• LDT as a Demonstration Platform
• Case Studies
– Wide range of projects; flexible asset usage
– Significant research and demonstration platform – enabling meaningful stakeholder engagement and collaboration
Conclusions

Contact us
ore.catapult.org.uk@orecatapult
GLASGOW BLYTH LEVENMOUTH HULL ABERDEEN CORNWALL PEMBROKESHIRE CHINA
Email us: [email protected] Visit us: ore.catapult.org.uk
Engage with us: