Embed Size (px)
Citation preview
Copyright © 2019 IQVIA. All rights reserved.
Drug Delivery & Formulations Summit 2019
Global Pharma Trends & Opportunities for the Packaging
Industry
19 September 2019
Yasemin Karanis, ConsultantThought Leadership, IQVIA

Agenda
1
+ Trends in Global Pharma
+ The shift to specialty & targeted products
+ Opportunities for the packaging industry

2
US42%
EU511%
Japan6%
Pharmerging25%
ROW16%
Global pharma sales forecast 2023
Global pharma to grow at 4-5% CAGR at ex-manufacturer prices and 2-3% at net prices
Notes: *Subject to PPRS rebate; Ex-manufacturer price levels, not including rebates and discounts. Contains Audited + Unaudited data; Growth considered on par if the there is overlap between country and region CAGR rangesSource: IQVIA Thought Leadership Analysis; Market Prognosis March 2019
1,119 1,184 1,233 1,289 1,351 1,419 1,4850.0%
1.0%
2.0%
3.0%
4.0%
5.0%
6.0%
7.0%
0
200
400
600
800
1,000
1,200
1,400
1,600
2017 (a) 2018 (a) 2019 (f) 2020 (f) 2021 (f) 2022 (f) 2023 (f)
LC$
Ann
ual G
row
th (%
)
Sale
s (U
S$, b
illio
n)
World Sales - 2019-2023 Current Forecast (Published: March 2019)% Annual Growth - 2017-2023 Current Forecast (Published: March 2019)
2023 Market Share (US$) based on March 2019 Forecast
World Sales (actual) Published: March 2019
3
2017-18growth
bn LCUSD
2018Growth
(%)
Contribution to positive global
growth (%)
17 16% 34%
8 10% 16%
9 13% 18%
3 7% 6%
-6 -1% -
4 14% 8%
-5 -2% -
-3 -1% -
2 7% 4%
1 4% 2%
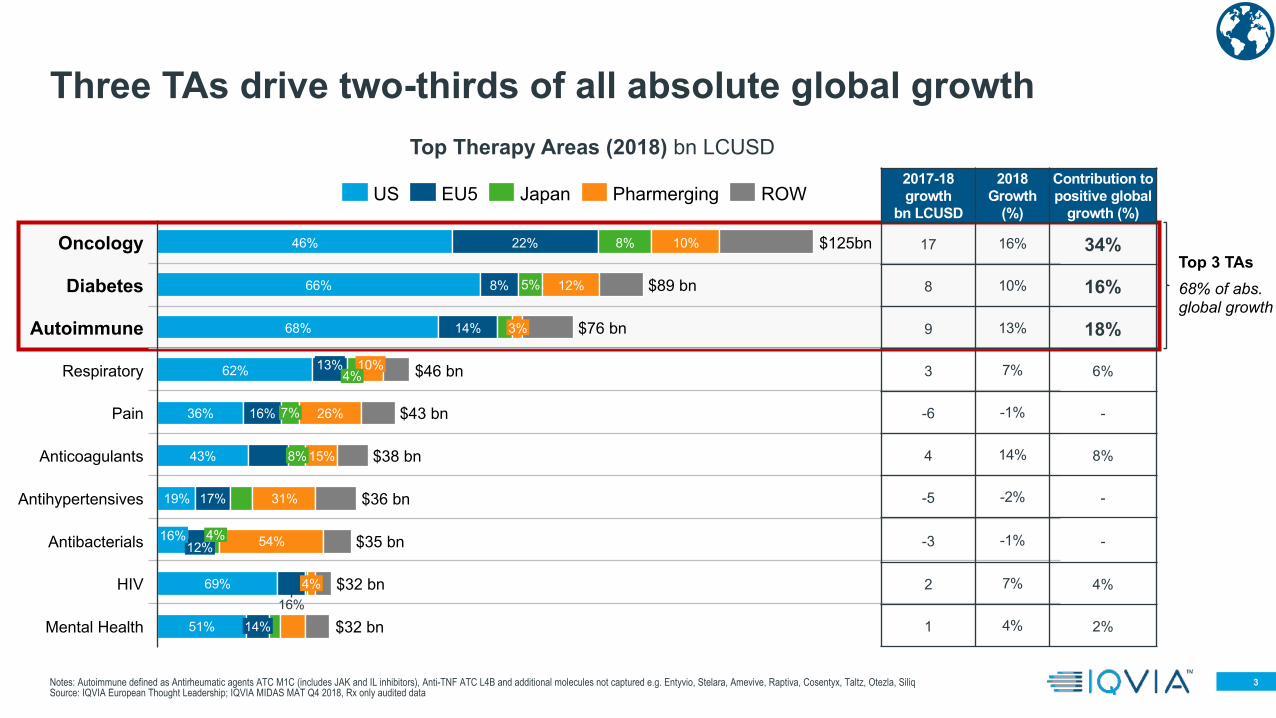
Three TAs drive two-thirds of all absolute global growth
Notes: Autoimmune defined as Antirheumatic agents ATC M1C (includes JAK and IL inhibitors), Anti-TNF ATC L4B and additional molecules not captured e.g. Entyvio, Stelara, Amevive, Raptiva, Cosentyx, Taltz, Otezla, SiliqSource: IQVIA European Thought Leadership; IQVIA MIDAS MAT Q4 2018, Rx only audited data
22%
4%
7%
Mental Health
5%
12%
Anticoagulants
12%
Oncology
Antihypertensives
10%
Pain
8%
3%
46%
8%66%Diabetes
14%68%Autoimmune
19%
Respiratory 10%13%4%
69%
17%
62%
26%16%
$32 bn
$38 bn
36%
15%8%
16%
43%
$36 bn
14%
4% 54%
$76 bn
HIV
16%Antibacterials
31%
51%
$89 bn
$125bn
$46 bn
$43 bn
$35 bn
$32 bn
US EU5 ROWJapan Pharmerging
Top Therapy Areas (2018) bn LCUSD
Top 3 TAs68% of abs. global growth

4
0%
10%
20%
30%
40%
50%
60%
2008
2009
2010
2011
2012
2013
2014
2015
2016
2017
2018
2019
2020
2021
2022
2023
2008
2009
2010
2011
2012
2013
2014
2015
2016
2017
2018
2019
2020
2021
2022
2023
2008
2009
2010
2011
2012
2013
2014
2015
2016
2017
2018
2019
2020
2021
2022
2023
2008
2009
2010
2011
2012
2013
2014
2015
2016
2017
2018
2019
2020
2021
2022
2023
Specialty ~90% of abs. growth in US, Europe
The unstoppable rise of Specialty: set to become dominant segment in the developed markets by 2023
Source: IQVIA Market Prognosis, Sep 2018; IQVIA Institute, Dec 2018
USGermanyU.K.France
ItalySpain
EU5 Japan PharmergingChinaRussiaOther Pharmerging
BrazilIndia
Forecast2019–2023
Forecast2019–2023
Forecast2019–2023
Forecast2019–2023
Spec
ialit
y sp
endi
ng a
s a
prop
ortio
n of
tota
l spe
nd (%
)

5
Global volume growth is moderate, delivery form growth comes from oral solids
Source: IQVIA European Thought Leadership, Excludes Hospital Solutions, Imaging and traditional Chinese medicines, MIDAS MAT Q1 2014 – MAT Q1 2019. Standard Units
Regional Market Share 2019 (SU) Global Rx Volume (SU Bn)
3659
519
21110861
2.859
632
715
2014
40 6275 140244
645
759
777
2019
2.446
+3%CAGR 2014-19
46%
11%
10%
8%
8%
18% Most volume still in oral solid - ~58% volume comes
from tablets and capsules
primarily used in mass markets to
treat symptoms as thyroid
insufficiency, hypertension or
pain
Powders
Other
Gels, Creams
Tablets
Coated Tabs
Aerosol
Injectables
Capsules
Liquids
ChinaPharmerging JapanEU5
USRoW
6
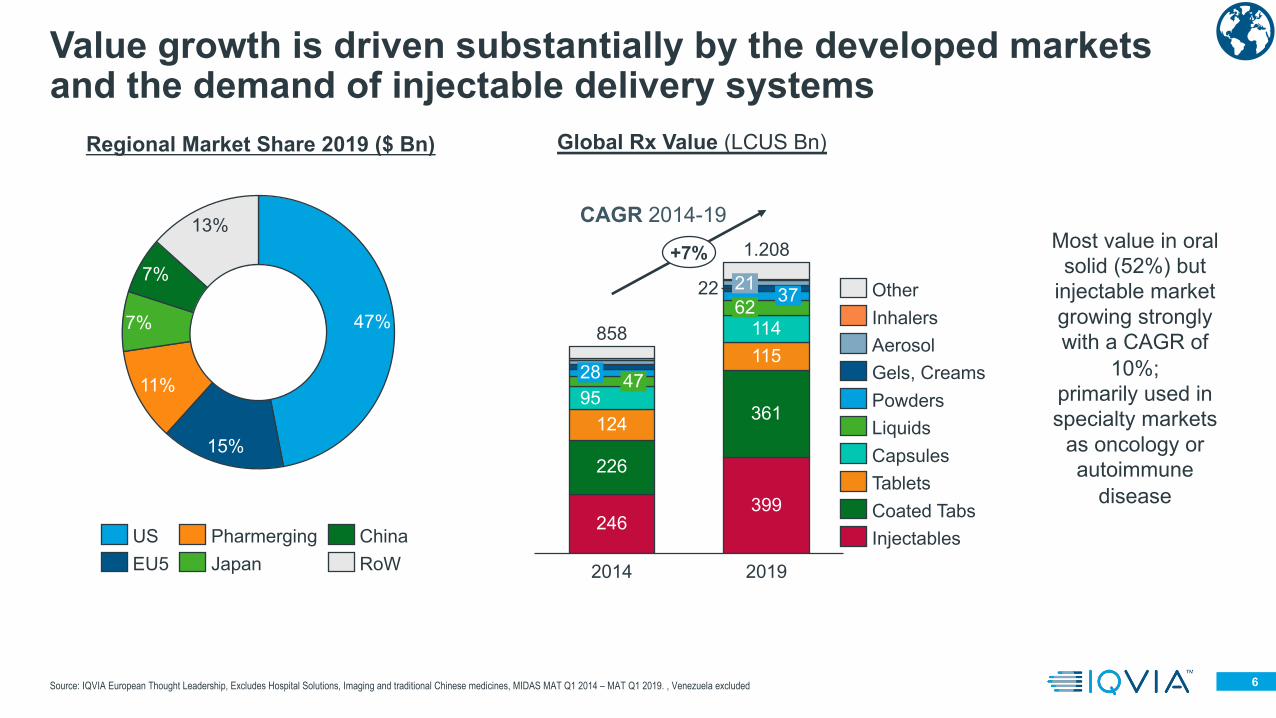
Value growth is driven substantially by the developed markets and the demand of injectable delivery systems
Source: IQVIA European Thought Leadership, Excludes Hospital Solutions, Imaging and traditional Chinese medicines, MIDAS MAT Q1 2014 – MAT Q1 2019. , Venezuela excluded
Regional Market Share 2019 ($ Bn) Global Rx Value (LCUS Bn)
47
115
95
114
226
28
124
62
2014
212237
361
2019
858
1.208
246
399
+7%
CAGR 2014-19
47%
15%
11%
7%
7%
13%
Aerosol
Other
Capsules
Powders
Inhalers
Gels, Creams
Liquids
Tablets
Coated Tabs
InjectablesChinaUS
JapanEU5
Pharmerging
RoW
Most value in oral
solid (52%) but
injectable market
growing strongly
with a CAGR of
10%;
primarily used in
specialty markets
as oncology or
autoimmune
disease

Agenda
7
+ Trends in Global Pharma
+ The shift to specialty & targeted products
+ Opportunities for the packaging industry

8
Biologics account for a high proportion of the future pipeline which should sustain strong growth
Source: IQVIA NSP Dataset (January 2018 – December 2018); IQVIA Analysis; IQVIA Pipeline Intelligence (April 2019)
Preclinical
Phase-I
Phase-II
Phase-III
Pre-reg / registration
1455
Biologic Small molecule
780
861
316
114
1328
888
932
372
150
Biologic sales are 32% of total market but pipeline is 45% biologics
Biologics and small molecules(Q2 2009-19) US$ Bn
Global Pharmaceutical Pipeline (2019)
19%
68%
32%
81%
2009 2019
661
1,035
Non-BiologicBiologic

9
Injectables fastest growing due to shift to specialised medicines
Source: IQVIA European Thought Leadership Analysis; IQVIA MIDAS MAT Q1 2019; Rx only
Combinations (2019) Volume (SU) Forms of Administration (2019)
53%
35%
5%
Oral
Parenteral
Ophthalmic
LungTopical
2%
2%
Other
2%
80%
20%Combination
Plain
Admin route, Global (2019) LCUSD
Injectables 5y CAGR 10%
Form Sales LCUSD(MAT Q1 2019)
5y CAGR%(2014-19)
Coated Tabs 361 10%
Infusion 128 12%
Prefilled Syringes 127 14%
Tablets 115 -1%
Capsules 114 4%
Vials 100 5%
Liquids 62 6%
Powders 37 6%
Pens & Cartridges 25 14%
Other 138 5%

10
Pre-Filled Syringes are the fastest growing injectables segment
Notes: Notes: Injectables defined as NFC2: Ampoules, Infusions, Pens & Cartridges, Prefilled Syringes and Vials;Source: IQVIA European Thought Leadership; IQVIA MIDAS MAT Q1 2019; Rx only, Venezuela excluded.
Global Injectables split, LCUSD 5y Injectables Positive Contribution to growth (2014-19), LCUSD
47%
17%
12%
12%
6%6%
China
PharmergingJapan
EU5
RoW
US
5%
27%
6%5%
25%
6%
32%
30%
2014
32%
32%
2019
$246 bn
$399 bn+10%
Vials
Ampoules Prefilled SyringesPens & Cartridges Infusion
CAGR %
5%14%
5%
14%
12%

11
Only 22% of products in late-stage pipeline belong to large pharma
Innovation in oncology will continue with a diverse range of companies driving it
Source: IQVIA, ARK R&D Intelligence; IQVIA Institute; IQVIA Thought Leadership Analysis Q1 2019
• 506 smaller companies, with just 1 product in clinical development
Total:711 companies
0
10
20
30
40
50
60
70
60300 5 2510 15 20 35 40 45 9550 10055 65 70 75 80 85 90
Pfizer
GSK / Tesaro
Celgene
Oncology % of late stage pipeline
Onc
olog
y in
dica
tions
in la
te-s
tage
pip
elin
e
AstraZeneca
Lilly
Merck & Co
Novartis
Roche
Top-10 oncology companiesOther large pharma companies (<$10bn) Academic Institutions
Smaller companies with an oncology pipeline
BMS

12Notes: Bubble size represents 2018 sales in US$; Products without 5-years sales excluded from CAGR average. Definitions hormonal therapies: ATC LO2: AA, AB, AE, AX, BA, BB, BG, BX; Checkpoint inhibitors include PD-1/L1 and CTLA-4 targeted therapies: nivolumab, pembrolizumab, atezolizumab, avelumab, durvalumab and ipilimumab. Source: IQVIA MIDAS MAT Q4 2018 (Rx only)
0 44186
50
42
400
-8 36 404 10 12-50
14 16 20 24 26 28
200
30 328 38
0
250
300
350
34
450
500
550
600
2
650
22
Long term growth (2013-18) CAGR (%)
mAbs
Shor
t ter
m g
row
th (2
017-
18)
Checkpoint inhibitors
Cytotoxics
Haematological
mAbs(solid tumors)
Targeted small molecules
Targeted small molecules (solid tumours)
Hormonal
Targeted therapies in oncology, biologic or small molecule, dominate the high value growth areas
Oncology PPG = 15.9%
Onc
olog
y 5y
r CA
GR
= 1
3.8%
3-year Oncology growth dynamicsInjectablesMixOrals
Agenda
13
+ Trends in Global Pharma
+ The shift to specialty & targeted products
+ Opportunities for the packaging industry

14
The importance of focusing on the patient is increasingly recognised by companies
Source: IQVIA Patient centricity: measuring impact; *incl. external HC system stakeholders, joint ventures and non-traditional / innovative co-development
The 2000s
Multi-stakeholder go-to-market approach
• Coordinated many-to-many approach
• Multiple in-field roles engaging with a large variety of stakeholders
Evolving Model
Patient-centric go-to-market approach
• Patient at the centre of the engagement
• Value-based partnerships* with other stakeholders to create patient benefit
The 1990s
Traditional go-to-market approach
• One-to-one relationship between sales rep and physician
• Push strategy
Reps Patient relationsMSLs
Market Access Regulatory KAMs

15
Compliance is undoubtedly the biggest source of inefficiency
• Adherence decreases with the frequency of the regimen:
Source: IQVIA European Thought Leadership; IQVIA Institute 2012 “Responsible use of Medicine; https://www.ncbi.nlm.nih.gov/pmc/articles/PMC3711878/; http://annals.org/aim/fullarticle/1357338
57%Non-adherence
9%
Delayed evidence-basedtreatment practise 13%
11%Antibiotic misuse
Medication errors
62
6%Suboptimal generic use
269
4%Mismanaged polypharmacyin the elderly
42
100%Total avoidable costs
18
54
30
475
USA Estimated avoidable costs (2012) bn USD
72%1x
69%2x
65%3x
51%4xDaily dosing
Adherence rate
• Packaging is important: A study on using calendar packaging in 7 trials showed 6 showed positive results
• Therapy areas matter:- Adherence is greatest in patients with HIV, arthritis,
gastro or cancer.- Lowest in pulmonary, diabetes or sleep disorders.

16Key findings from IQVIA project on case studies for value added medicines
Innovation in drug delivery & formulations can provide a range of benefits to patients and healthcare systems e.g. VAMs
Reduced opioid induced constipation
Improved inhaler
Simplified and safer administration
Superior Efficacy Reduced Side Effects Improved Patient Experience
Value Added Medicine Benefit
Additional Therapeutic Option
Improved progression free
survival
Non-stimulant treatment optionMetex PEN
Not exhaustive

17
Value Added Medicines products fall on a spectrum of innovation
Source: IQVIA European Thought Leadership
Lower level innovation• Combination• Formulation• Dermal patches
Incremental innovation• Inhalers• Auto-injectors
Novel delivery tech• Nanoparticles• Microchips• Minipumps
Continuous innovation• Lower barrier to entry
• Broader patient reach
• Established solutionsBreakthrough innovation
• Higher barrier to entry
• Narrower patient reach
• Higher differentiation
Innovation at many levels
Network effects
Broader patient reach
Higher differentiationDigital
Digital pill• Novel tech• Holy grail of
adherence• Not yet perfect
Digital therapeutics• Gamification• Telehealth
Integration with smart devices• Large userbase• Established platforms

18
Strong forces are driving changes in healthcare
Global pharma seeing
decelerating growth and
squeezed budgets
Specialty set to become
dominant segment by
value
Innovation in delivery and
formulations key in creating product
differentiation
Pharma companies increasingly
require patient centric delivery
solutions

19
Prescription launch offering types have multiplied since 2010- a changing landscape
Synthetic small molecule therapeutics since 1899 (Aspirin)
Recombinant biologics since 1982 (Humulin)
Prescription digital therapeutics since 2010 (BlueStar)**
*Gendicine was approved in China in 2003, but Glybera was first gene therapy approved by EMA and FDA**First standalone prescription digital therapeutic (re-Set) approved by FDA November 2018
Cell Therapy since 2011 (Provenge)
Controlled substances for psychiatric disorders 2019
(Spravato) Until 2010 there were only two types of innovative prescription medicine to launch: small molecule of biologic, into systems designed to approve, provide and pay for them
Now an accelerating number of new types of prescription therapeutic are being approved –systems need to catch up
Gene Therapy since 2012 (Glybera)*

Thank you
Yasemin Karanis
Consultant, European Thought LeadershipIQVIA