Embed Size (px)
Citation preview

8/12/2019 7Accelerated.math.YLP
http://slidepdf.com/reader/full/7acceleratedmathylp 1/10
©2013 by National Heritage Academies, Inc. 1 of 10 Grade Seven Accelerated CCSS Math Year-Long Planner
GRADE SEVEN ACCELERATED CCCS YEAR-LONG PLANNER
Ratios and Proportional RelationshipsAnalyze proportional relationships and use them to solve real-world and mathematical problems.
7.RP.A.1 Compute unit rates associated with ratios of fractions, including ratios of lengths, areasand other quantities measured in like or different units. For example, if a person walks 1/2mile in each 1/4 hour, compute the unit rate as the complex fraction (1/2)/(1/4) miles perhour, equivalently 2 miles per hour.
7.RP.A.2 Recognize and represent proportional relationships between quantities.
a. Decide whether two quantities are in a proportional relationship, e.g., by testing forequivalent ratios in a table or graphing on a coordinate plane and observing whether thegraph is a straight line through the origin.
b. Identify the constant of proportionality (unit rate) in tables, graphs, equations, diagrams,
and verbal descriptions of proportional relationships.
c. Represent proportional relationships by equations. For example, if total cost t isproportional to the number n of items purchased at a constant price p, the relationshipbetween the total cost and the number of items can be expressed as t = pn.
d. Explain what a point (x, y) on the graph of a proportional relationship means in terms of thesituation, with special attention to the points (0, 0) and (1, r) where r is the unit rate.
7.RP.A.3 Use proportional relationships to solve multistep ratio and percent problems. Examples:simple interest, tax, markups and markdowns, gratuities and commissions, fees, percentincrease and decrease, percent error.
8/12/2019 7Accelerated.math.YLP
http://slidepdf.com/reader/full/7acceleratedmathylp 2/10
©2013 by National Heritage Academies, Inc. 2 of 10 Grade Seven Accelerated CCSS Math Year-Long Planner
GRADE SEVEN ACCELERATED CCCS YEAR-LONG PLANNER
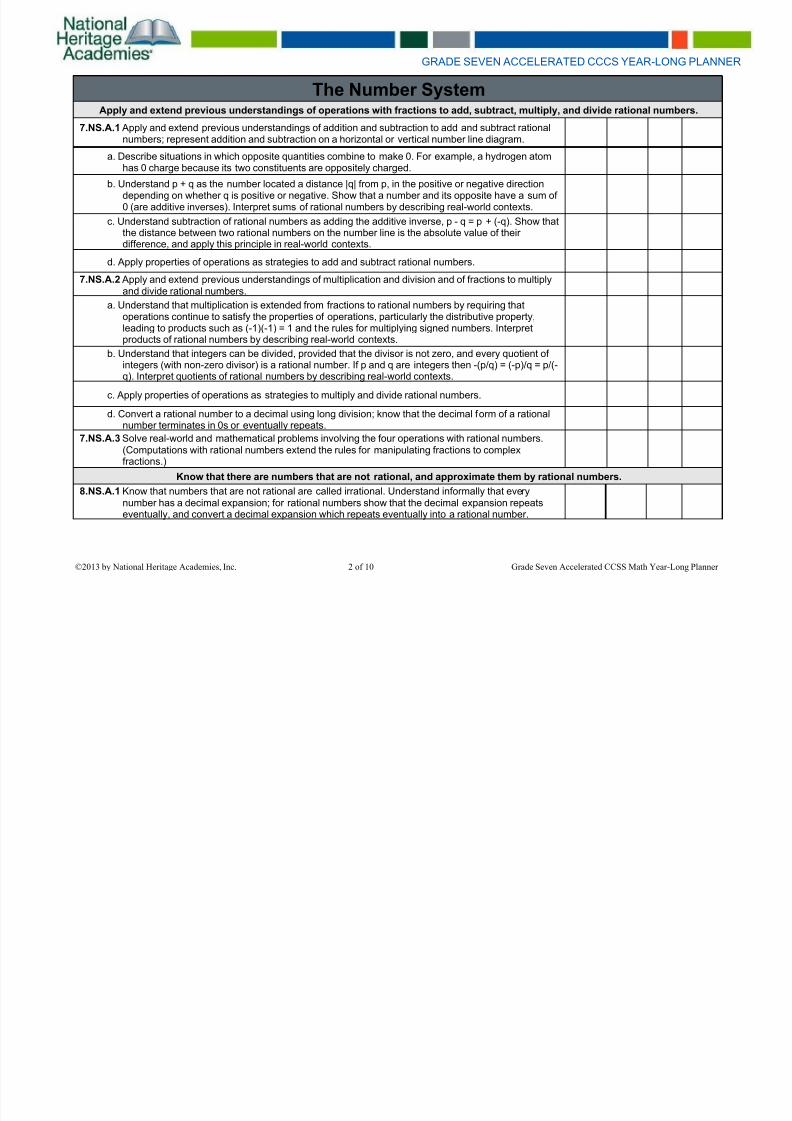
The Number SystemApply and extend previous understandings of operations with fractions to add, subtract, multiply, and divide rational numbers.
7.NS.A.1 Apply and extend previous understandings of addition and subtraction to add and subtract rational
numbers; represent addition and subtraction on a horizontal or vertical number line diagram.
a. Describe situations in which opposite quantities combine to make 0. For example, a hydrogen atomhas 0 charge because its two constituents are oppositely charged.
b. Understand p + q as the number located a distance |q| from p, in the positive or negative directiondepending on whether q is positive or negative. Show that a number and its opposite have a sum of0 (are additive inverses). Interpret sums of rational numbers by describing real-world contexts.
c. Understand subtraction of rational numbers as adding the additive inverse, p - q = p + (-q). Show thatthe distance between two rational numbers on the number line is the absolute value of theirdifference, and apply this principle in real-world contexts.
d. Apply properties of operations as strategies to add and subtract rational numbers.
7.NS.A.2 Apply and extend previous understandings of multiplication and division and of fractions to multiplyand divide rational numbers.
a. Understand that multiplication is extended from fractions to rational numbers by requiring thatoperations continue to satisfy the properties of operations, particularly the distributive property,leading to products such as (-1)(-1) = 1 and the rules for multiplying signed numbers. Interpretproducts of rational numbers by describing real-world contexts.
b. Understand that integers can be divided, provided that the divisor is not zero, and every quotient ofintegers (with non-zero divisor) is a rational number. If p and q are integers then -(p/q) = (-p)/q = p/(-q). Interpret quotients of rational numbers by describing real-world contexts.
c. Apply properties of operations as strategies to multiply and divide rational numbers.
d. Convert a rational number to a decimal using long division; know that the decimal form of a rationalnumber terminates in 0s or eventually repeats.
7.NS.A.3 Solve real-world and mathematical problems involving the four operations with rational numbers.(Computations with rational numbers extend the rules for manipulating fractions to complexfractions.)
Know that there are numbers that are not rational, and approximate them by rational numbers.
8.NS.A.1 Know that numbers that are not rational are called irrational. Understand informally that everynumber has a decimal expansion; for rational numbers show that the decimal expansion repeatseventually, and convert a decimal expansion which repeats eventually into a rational number.
8/12/2019 7Accelerated.math.YLP
http://slidepdf.com/reader/full/7acceleratedmathylp 3/10
©2013 by National Heritage Academies, Inc. 3 of 10 Grade Seven Accelerated CCSS Math Year-Long Planner
GRADE SEVEN ACCELERATED CCCS YEAR-LONG PLANNER
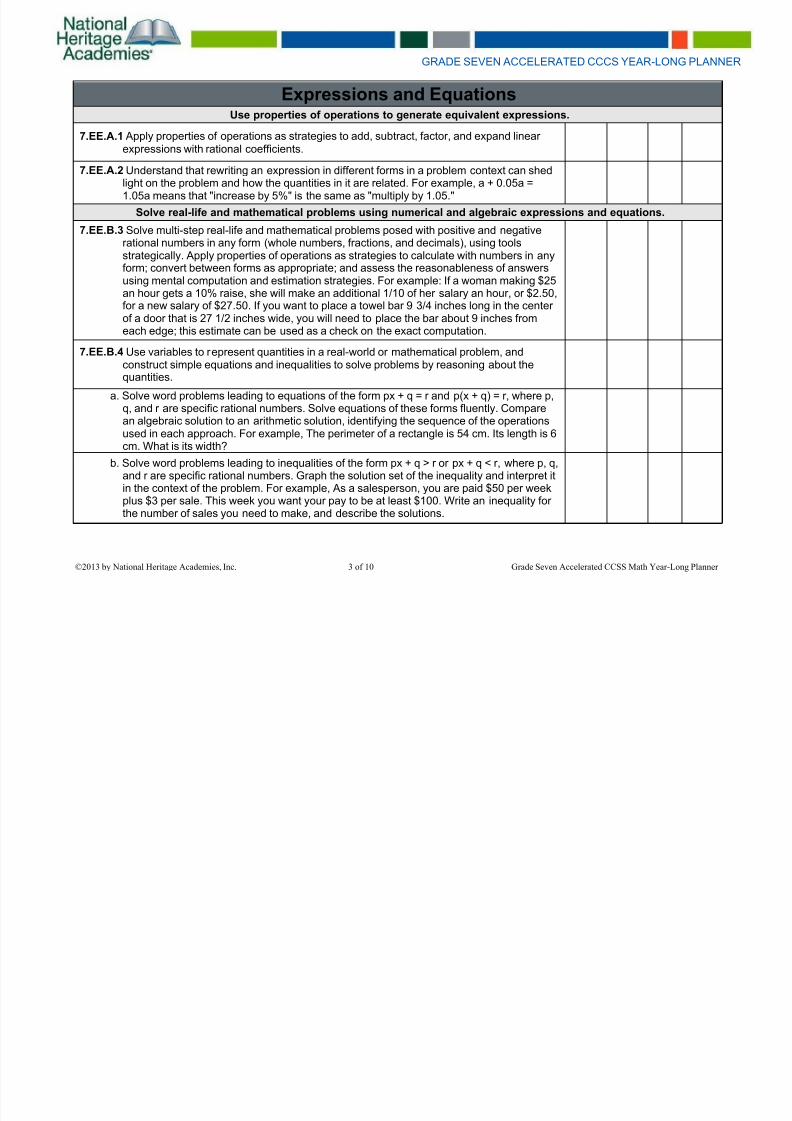
Expressions and EquationsUse properties of operations to generate equivalent expressions.
7.EE.A.1 Apply properties of operations as strategies to add, subtract, factor, and expand linearexpressions with rational coefficients.
7.EE.A.2 Understand that rewriting an expression in different forms in a problem context can shedlight on the problem and how the quantities in it are related. For example, a + 0.05a =1.05a means that "increase by 5%" is the same as "multiply by 1.05."
Solve real-life and mathematical problems using numerical and algebraic expressions and equations.
7.EE.B.3 Solve multi-step real-life and mathematical problems posed with positive and negativerational numbers in any form (whole numbers, fractions, and decimals), using toolsstrategically. Apply properties of operations as strategies to calculate with numbers in anyform; convert between forms as appropriate; and assess the reasonableness of answersusing mental computation and estimation strategies. For example: If a woman making $25an hour gets a 10% raise, she will make an additional 1/10 of her salary an hour, or $2.50,for a new salary of $27.50. If you want to place a towel bar 9 3/4 inches long in the centerof a door that is 27 1/2 inches wide, you will need to place the bar about 9 inches fromeach edge; this estimate can be used as a check on the exact computation.
7.EE.B.4 Use variables to represent quantities in a real-world or mathematical problem, andconstruct simple equations and inequalities to solve problems by reasoning about thequantities.
a. Solve word problems leading to equations of the form px + q = r and p(x + q) = r, where p,
q, and r are specific rational numbers. Solve equations of these forms fluently. Comparean algebraic solution to an arithmetic solution, identifying the sequence of the operationsused in each approach. For example, The perimeter of a rectangle is 54 cm. Its length is 6cm. What is its width?
b. Solve word problems leading to inequalities of the form px + q > r or px + q < r, where p, q,and r are specific rational numbers. Graph the solution set of the inequality and interpret itin the context of the problem. For example, As a salesperson, you are paid $50 per weekplus $3 per sale. This week you want your pay to be at least $100. Write an inequality forthe number of sales you need to make, and describe the solutions.
8/12/2019 7Accelerated.math.YLP
http://slidepdf.com/reader/full/7acceleratedmathylp 4/10
©2013 by National Heritage Academies, Inc. 4 of 10 Grade Seven Accelerated CCSS Math Year-Long Planner
GRADE SEVEN ACCELERATED CCCS YEAR-LONG PLANNER
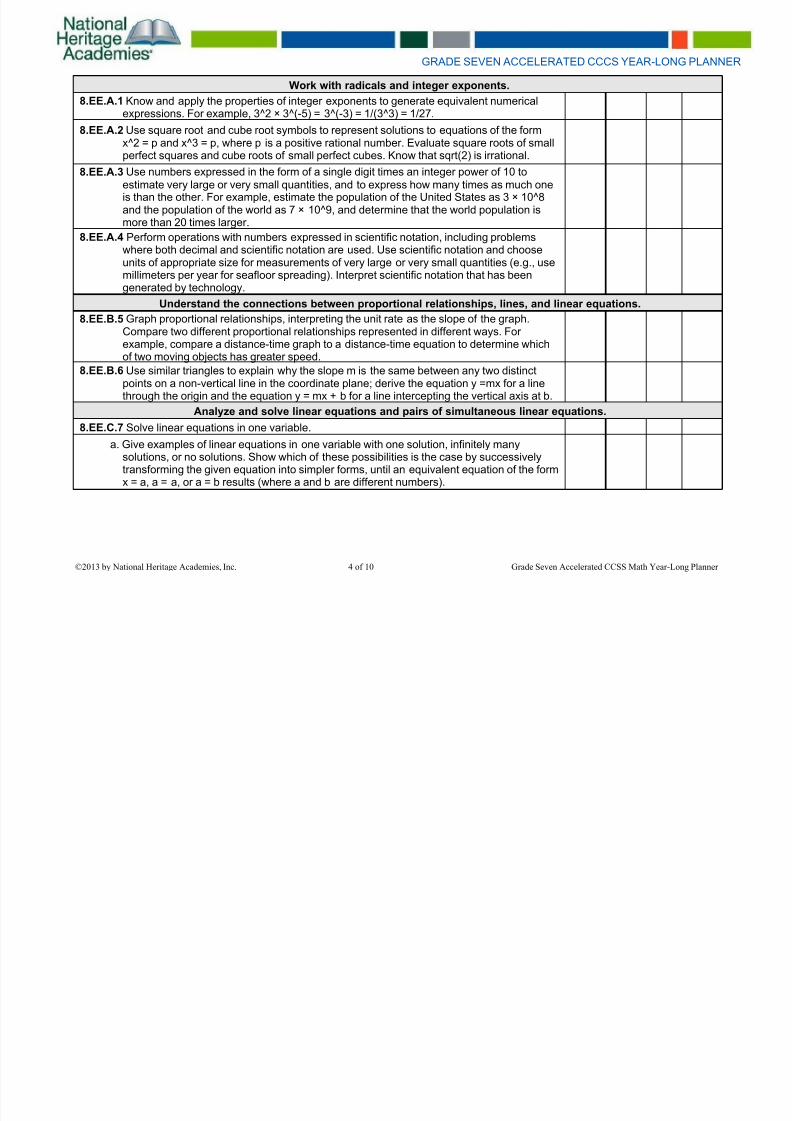
Work with radicals and integer exponents.
8.EE.A.1 Know and apply the properties of integer exponents to generate equivalent numericalexpressions. For example, 3^2 × 3^(-5) = 3^(-3) = 1/(3^3) = 1/27.
8.EE.A.2 Use square root and cube root symbols to represent solutions to equations of the formx^2 = p and x^3 = p, where p is a positive rational number. Evaluate square roots of smallperfect squares and cube roots of small perfect cubes. Know that sqrt(2) is irrational.
8.EE.A.3 Use numbers expressed in the form of a single digit times an integer power of 10 toestimate very large or very small quantities, and to express how many times as much oneis than the other. For example, estimate the population of the United States as 3 × 10^8and the population of the world as 7 × 10^9, and determine that the world population ismore than 20 times larger.
8.EE.A.4 Perform operations with numbers expressed in scientific notation, including problemswhere both decimal and scientific notation are used. Use scientific notation and chooseunits of appropriate size for measurements of very large or very small quantities (e.g., use
millimeters per year for seafloor spreading). Interpret scientific notation that has beengenerated by technology.
Understand the connections between proportional relationships, lines, and linear equations.
8.EE.B.5 Graph proportional relationships, interpreting the unit rate as the slope of the graph.Compare two different proportional relationships represented in different ways. Forexample, compare a distance-time graph to a distance-time equation to determine whichof two moving objects has greater speed.
8.EE.B.6 Use similar triangles to explain why the slope m is the same between any two distinctpoints on a non-vertical line in the coordinate plane; derive the equation y =mx for a linethrough the origin and the equation y = mx + b for a line intercepting the vertical axis at b.
Analyze and solve linear equations and pairs of simultaneous linear equations.8.EE.C.7 Solve linear equations in one variable.
a. Give examples of linear equations in one variable with one solution, infinitely manysolutions, or no solutions. Show which of these possibilities is the case by successivelytransforming the given equation into simpler forms, until an equivalent equation of the formx = a, a = a, or a = b results (where a and b are different numbers).
8/12/2019 7Accelerated.math.YLP
http://slidepdf.com/reader/full/7acceleratedmathylp 5/10
©2013 by National Heritage Academies, Inc. 5 of 10 Grade Seven Accelerated CCSS Math Year-Long Planner
GRADE SEVEN ACCELERATED CCCS YEAR-LONG PLANNER
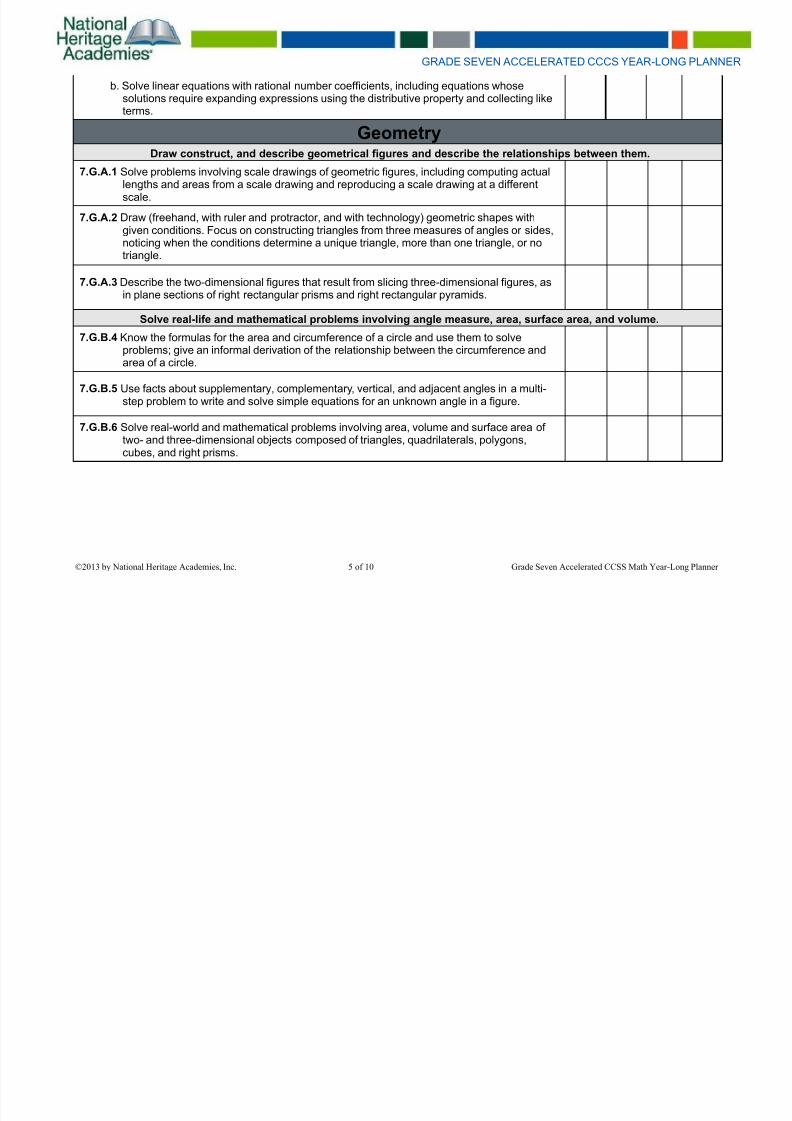
b. Solve linear equations with rational number coefficients, including equations whosesolutions require expanding expressions using the distributive property and collecting liketerms.
GeometryDraw construct, and describe geometrical figures and describe the relationships between them.
7.G.A.1 Solve problems involving scale drawings of geometric figures, including computing actuallengths and areas from a scale drawing and reproducing a scale drawing at a differentscale.
7.G.A.2 Draw (freehand, with ruler and protractor, and with technology) geometric shapes withgiven conditions. Focus on constructing triangles from three measures of angles or sides,noticing when the conditions determine a unique triangle, more than one triangle, or notriangle.
7.G.A.3 Describe the two-dimensional figures that result from slicing three-dimensional figures, asin plane sections of right rectangular prisms and right rectangular pyramids.
Solve real-life and mathematical problems involving angle measure, area, surface area, and volume.
7.G.B.4 Know the formulas for the area and circumference of a circle and use them to solveproblems; give an informal derivation of the relationship between the circumference andarea of a circle.
7.G.B.5 Use facts about supplementary, complementary, vertical, and adjacent angles in a multi-step problem to write and solve simple equations for an unknown angle in a figure.
7.G.B.6 Solve real-world and mathematical problems involving area, volume and surface area oftwo- and three-dimensional objects composed of triangles, quadrilaterals, polygons,cubes, and right prisms.
8/12/2019 7Accelerated.math.YLP
http://slidepdf.com/reader/full/7acceleratedmathylp 6/10
©2013 by National Heritage Academies, Inc. 6 of 10 Grade Seven Accelerated CCSS Math Year-Long Planner
GRADE SEVEN ACCELERATED CCCS YEAR-LONG PLANNER
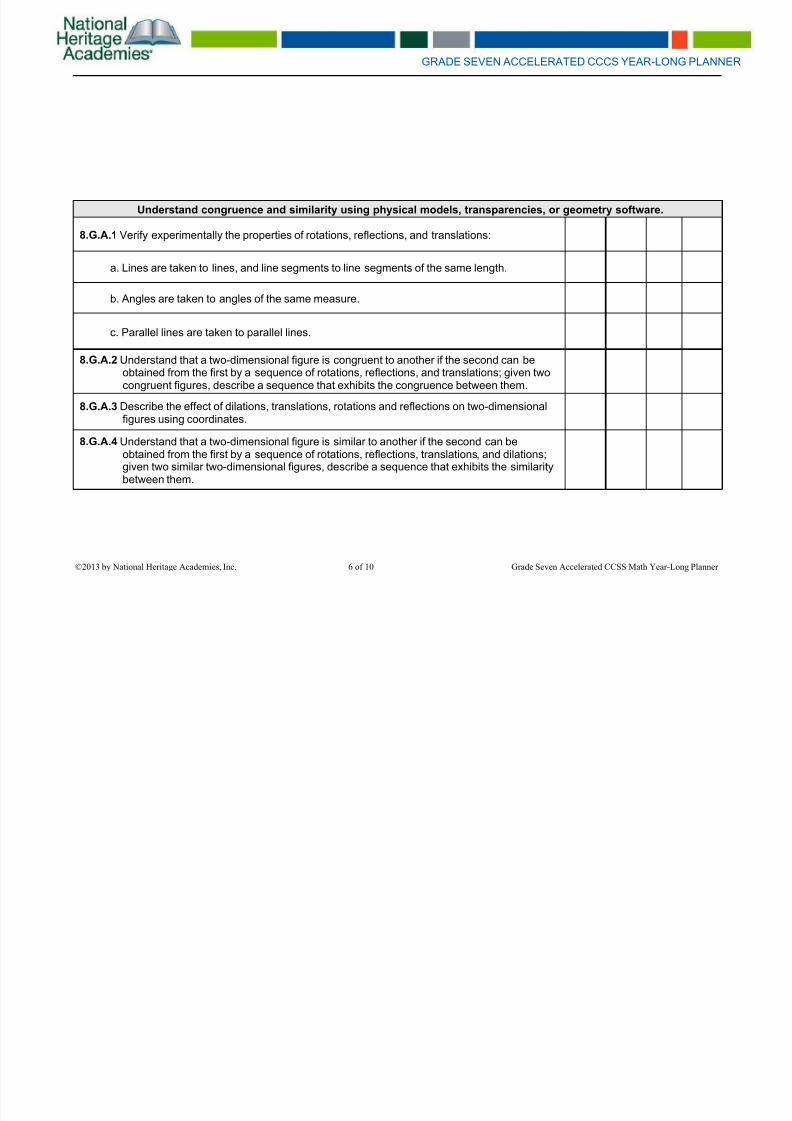
Understand congruence and similarity using physical models, transparencies, or geometry software.
8.G.A.1 Verify experimentally the properties of rotations, reflections, and translations:
a. Lines are taken to lines, and line segments to line segments of the same length.
b. Angles are taken to angles of the same measure.
c. Parallel lines are taken to parallel lines.
8.G.A.2 Understand that a two-dimensional figure is congruent to another if the second can beobtained from the first by a sequence of rotations, reflections, and translations; given twocongruent figures, describe a sequence that exhibits the congruence between them.
8.G.A.3 Describe the effect of dilations, translations, rotations and reflections on two-dimensionalfigures using coordinates.
8.G.A.4 Understand that a two-dimensional figure is similar to another if the second can beobtained from the first by a sequence of rotations, reflections, translations, and dilations;given two similar two-dimensional figures, describe a sequence that exhibits the similaritybetween them.

8/12/2019 7Accelerated.math.YLP
http://slidepdf.com/reader/full/7acceleratedmathylp 7/10
©2013 by National Heritage Academies, Inc. 7 of 10 Grade Seven Accelerated CCSS Math Year-Long Planner
GRADE SEVEN ACCELERATED CCCS YEAR-LONG PLANNER
8.G.A.5 Use informal arguments to establish facts about the angle sum and exterior angle oftriangles, about the angles created when parallel lines are cut by a transversal, and theangle-angle criterion for similarity of triangles. For example, arrange three copies of thesame triangle so that the three angles appear to form a line, and give an argument in
terms of transversals why this is so.Solve real-world and mathematical problems involving volume of cylinders, cones, and spheres.
8.G.C.9 Know the formulas for the volume of cones, cylinders, and spheres and use them to solvereal-world and mathematical problems.

8/12/2019 7Accelerated.math.YLP
http://slidepdf.com/reader/full/7acceleratedmathylp 8/10
©2013 by National Heritage Academies, Inc. 8 of 10 Grade Seven Accelerated CCSS Math Year-Long Planner
GRADE SEVEN ACCELERATED CCCS YEAR-LONG PLANNER
Statistics and Probability
Use random sampling to draw inferences about a population.
7.SP.A.1 Understand that statistics can be used to gain information about a population byexamining a sample of the population; generalizations about a population from a sampleare valid only if the sample is representative of that population. Understand that randomsampling tends to produce representative samples and support valid inferences.
7.SP.A.2 Use data from a random sample to draw inferences about a population with an unknowncharacteristic of interest. Generate multiple samples (or simulated samples) of the same
size to gauge the variation in estimates or predictions. For example, estimate the meanword length in a book by randomly sampling words from the book; predict the winner of aschool election based on randomly sampled survey data. Gauge how far off the estimateor prediction might be.
Draw informal comparative inferences about two populations.
7.SP.B.3 Informally assess the degree of visual overlap of two numerical data distributions withsimilar variabilities, measuring the difference between the centers by expressing it as amultiple of a measure of variability. For example, the mean height of players on thebasketball team is 10 cm greater than the mean height of players on the soccer team,
about twice the variability (mean absolute deviation) on either team; on a dot plot, theseparation between the two distributions of heights is noticeable.
7.SP.B.4 Use measures of center and measures of variability for numerical data from randomsamples to draw informal comparative inferences about two populations. For example,decide whether the words in a chapter of a seventh-grade science book are generallylonger than the words in a chapter of a fourth-grade science book.

8/12/2019 7Accelerated.math.YLP
http://slidepdf.com/reader/full/7acceleratedmathylp 9/10
©2013 by National Heritage Academies, Inc. 9 of 10 Grade Seven Accelerated CCSS Math Year-Long Planner
GRADE SEVEN ACCELERATED CCCS YEAR-LONG PLANNER
Investigate chance processes and develop, use, and evaluate probability models.
7.SP.C.5 Understand that the probability of a chance event is a number between 0 and 1 that expresses thelikelihood of the event occurring. Larger numbers indicate greater likelihood. A probability near 0indicates an unlikely event, a probability around 1/2 indicates an event that is neither unlikely nor
likely, and a probability near 1 indicates a likely event.7.SP.C.6 Approximate the probability of a chance event by collecting data on the chance process that
produces it and observing its long-run relative frequency, and predict the approximate relativefrequency given the probability. For example, when rolling a number cube 600 times, predict that a3 or 6 would be rolled roughly 200 times, but probably not exactly 200 times.
7.SP.C.7 Develop a probability model and use it to find probabilities of events. Compare probabilities from amodel to observed frequencies; if the agreement is not good, explain possible sources of thediscrepancy.
a. Develop a uniform probability model by assigning equal probability to all outcomes, and use themodel to determine probabilities of events. For example, if a student is selected at random from aclass, find the probability that Jane will be selected and the probability that a girl will be selected.
b. Develop a probability model (which may not be uniform) by observing frequencies in data generatedfrom a chance process. For example, find the approximate probability that a spinning penny willland heads up or that a tossed paper cup will land open-end down. Do the outcomes for thespinning penny appear to be equally likely based on the observed frequencies?
7.SP.C.8 Find probabilities of compound events using organized lists, tables, tree diagrams, and simulation.
a. Understand that, just as with simple events, the probability of a compound event is the fraction ofoutcomes in the sample space for which the compound event occurs.
b. Represent sample spaces for compound events using methods such as organized lists, tables andtree diagrams. For an event described in everyday language (e.g., "rolling double sixes"), identify
the outcomes in the sample space which compose the event.c. Design and use a simulation to generate frequencies for compound events. For example, use
random digits as a simulation tool to approximate the answer to the question: If 40% of donors havetype A blood, what is the probability that it will take at least 4 donors to find one with type A blood?
Investigate patterns of association in bivariate data.
8.SP.A.2 Know that straight lines are widely used to model relationships between two quantitativevariables. For scatter plots that suggest a linear association, informally fit a straight line,and informally assess the model fit by judging the closeness of the data points to the line.

8/12/2019 7Accelerated.math.YLP
http://slidepdf.com/reader/full/7acceleratedmathylp 10/10
©2013 by National Heritage Academies, Inc. 10 of 10 Grade Seven Accelerated CCSS Math Year-Long Planner
GRADE SEVEN ACCELERATED CCCS YEAR-LONG PLANNER


