Embed Size (px)
Citation preview
housing
Lessons from thepast, challengesfor the future forhousing policy

Lessons from the past,challenges for the future
for housing policy
An evaluation of English housing policy 1975-2000
January 2005
Mark StephensUniversity of York
Christine WhiteheadCambridge University and
London School of Economics
Moira MunroHeriot Watt University
Office of the Deputy Prime Minister: London

The findings and recommendations in this report are those of the consultant authors and do notnecessarily represent the views or proposed policies of the Office of the Deputy Prime Minister.
Office of the Deputy Prime MinisterEland HouseBressenden PlaceLondon SW1E 5DUTel: 020 7944 4400Web site: www.odpm.gov.uk
© Queen’s Printer and Controller of Her Majesty’s Stationery Office, 2005
Copyright in the typographical arrangement rests with the Crown.
This publication, excluding logos, may be reproduced free of charge in any format or mediumfor research, private study or for internal circulation within an organisation.This is subjectto it being reproduced accurately and not used in a misleading context.The material must beacknowledged as Crown copyright and the title of the publication specified.
For any other use of this material, please write to HMSO Licensing, St Clements House,2-16 Colegate, Norwich NR3 1BQ Fax: 01603 723000 or e-mail: [email protected]
This is a value added publication which falls outside the scope of the HMSO Class Licence.
Further copies of this publication are available from:
ODPM PublicationsPO Box 236WetherbyWest YorkshireLS23 7NBTel: 0870 1226 236Fax: 0870 1226 237Textphone: 0870 1207 405E-mail: [email protected] online via www.odpm.gov.uk
ISBN 1 85112 753 4
Printed in Great Britain on material containing 75% post-consumer waste and 25% ECF pulp.
January 2005
Reference no. 04HC02678
CONTENTS
Summary 5
SECTION 1:Housing policy 1975-2000 15
SECTION 2:Housing policy today 39
SECTION 3:Housing futures 61
APPENDIX I:Table of key policies 1975-2000 72

EVALUATION OF ENGLISH HOUSING POLICY 1975-2000
The Evaluation of English Housing Policy 1975-2000 was conducted by a consortium of universitiesbetween January 2003 and November 2004. The project was managed by Mark Stephens, who wasthen based at the Department of Urban Studies, University of Glasgow in conjunction with ChristineWhitehead of the Cambridge Centre for Housing and Planning Research and Moira Munro ofHeriot-Watt University. Alison More is on secondment at South Lanarkshire Council and Suzie Scottnow works at the Glasgow Housing Association.
This report is informed by two contextual reports and five theme reports, which are published onthe web site of the Office of the Deputy Prime Minister.
Housing and Housing Policy in England 1975-2002: Chronology and CommentaryAlan Holmans1
The Context for Housing Policy Since 1975: Statistical Time Series With Commentary and SelectedStatistical Times SeriesAlan Holmans1
Theme 1. Supply, Need and AccessGlen Bramley 2, Suzanne Fitzpatrick4, Noah Kofi Karley 2, Sarah Monk 1 and Nicholas Pleace 4
Theme 2. Finance and AffordabilityChristine Whitehead1, Kenneth Gibb 3 and Mark Stephens 4
Theme 3. Housing and Neighbourhood QualityKeith Kintrea 3 and Jimmy Morgan 2
Theme 4. Widening ChoiceMoira Munro 2, Hal Pawson 2 and Sarah Monk 1
Theme 5. Management EffectivenessAlison More 3, Hal Pawson 2 and Suzie Scott 3
ACKNOWLEDGEMENTS
The project team would like to thank members of the Project Board, chaired by Lord Richard Bestfor their advice and comments, and Keith Kirby, the research manager responsible for the projectat the Office of the Deputy Prime Minister.
The authors of this report would like to acknowledge the help of Nicholas Pleace of the Centrefor Housing Policy on whose briefing the section on Supporting People is based.
The authors are responsible for the final draft.
1 Cambridge Centre for Housing and Planning Research2 Heriot-Watt University, School of the Built Environment3 Department of Urban Studies, University of Glasgow4 Centre for Housing Policy, University of York
Summary
INTRODUCTION
The report provides an evaluation of housing policy over the period 1975-2000.It also draws on the lessons from this period in order to assess present and futurehousing policies, which cannot yet be subjected to a results-based evaluation.
HOUSING POLICY 1975-2000
The research team conducted an evaluation of five high-level housing policy themesover the period 1975-2000. The themes were derived from an analysis of policystatements over the period. The team selected the following themes: Supply, Needand Access; Finance and Affordability; Housing & Neighbourhood Quality; WideningChoice; and Management Effectiveness. These evaluations demonstrated that:
● Individual policy instruments are most successful when judged in their ownterms. For example, Right to Buy raised the level of home-ownership, thehomelessness legislation provided a safety net for eligible families, and theplanning system helped to protect the countryside. A series of policies reducedgovernment funding and improved its targeting.
● Policies often had unintended consequences. Frequently these were undesirableones. Along with economic change and wider housing market restructuring,Right to Buy and the homelessness legislation contributed to the residualisationof social rented housing which in turn created concentrations of poverty andexclusion. Targeting subsidies on the poorest tenants reduced incentives to work.
● Policies often also presented trade-offs. For example, the greater choice forborrowers that arose from the liberalisation of the mortgage market also resultedin greater risks for certain households, as did changes in the safety nets. Theplanning system may have protected the countryside, but it has also contributedto housing shortages and higher prices. Transferring social rented housing to thehousing association sector has fragmented management and increased the costsof funding. It has also fragmented ownership and therefore made regenerationand renewal more complex.
● Policies are most successful when they follow the grain of economic and socialchange, and least successful when they do not. On the positive side the stagedremoval of mortgage interest relief occurred during a period of falling interestrates that tended to outweigh the loss of subsidy. On the negative side policiesaimed at neighbourhood regeneration have often produced disappointing resultsbecause they have been overwhelmed by unfavourable economic circumstances.
5
Lessons from the past, challenges for the future for housing policy: An evaluation of English housing policy 1975-2000
6
● Overall, there is considerable evidence of good governance with few instancesof direct wastage of government funding and little large-scale dead-weight loss.Few policies have been almost entirely unsuccessful.
● Housing policies are clearly only one factor in shaping wider housing systems.Institutional, economic and social contexts are fundamental to shaping bothpolicies and outcomes.
Three policy clusters were identified as being of particular importance during theevaluation period:
● Deregulation and liberalisation. The deregulation of the financial systemcombined with housing privatisation mainly through the Right to Buy, were keyto promoting the growth of owner-occupation from about 58 to 70 per cent ofhouseholds. The deregulation of private sector rents laid the foundations for thesuccessful growth and reorientation of the private rented sector towards the endof the period. However, despite the emphasis on the independence of sociallandlords, policies in the social rented sector became more centralised anddetailed, as governments attempted to improve management performance.
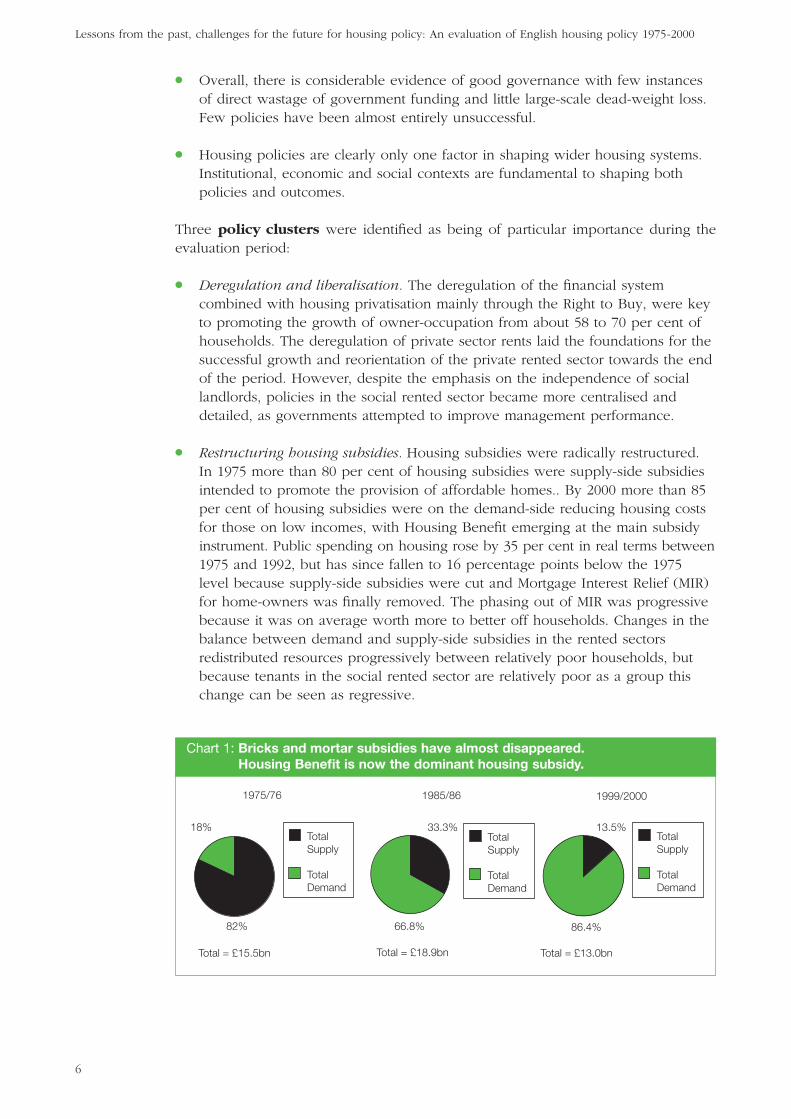
● Restructuring housing subsidies. Housing subsidies were radically restructured.In 1975 more than 80 per cent of housing subsidies were supply-side subsidiesintended to promote the provision of affordable homes.. By 2000 more than 85per cent of housing subsidies were on the demand-side reducing housing costsfor those on low incomes, with Housing Benefit emerging at the main subsidyinstrument. Public spending on housing rose by 35 per cent in real terms between1975 and 1992, but has since fallen to 16 percentage points below the 1975level because supply-side subsidies were cut and Mortgage Interest Relief (MIR)for home-owners was finally removed. The phasing out of MIR was progressivebecause it was on average worth more to better off households. Changes in thebalance between demand and supply-side subsidies in the rented sectorsredistributed resources progressively between relatively poor households, butbecause tenants in the social rented sector are relatively poor as a group thischange can be seen as regressive.
1985/86 1999/20001975/76
18%
82%
Total Supply
Total Demand
Total = £15.5bn
Total Supply
Total Demand
Total Supply
Total Demand
66.8%
33.3%
Total = £18.9bn Total = £13.0bn
13.5%
86.4%
Chart 1: Bricks and mortar subsidies have almost disappeared. Housing Benefit is now the dominant housing subsidy.
Summary
7
PrivateHouse building(Starts)
House Prices(real)% change
200
180
160
140
120
100
80
60
40
20
0
30
25
20
15
10
5
0
-5
-10
-15
-20
Per
cent
age
chan
ge
Thou
sand
s
Year
1971
1973
1975
1977
1979
1981
1983
1985
1987
1989
1991
1993
1995
1997
1999
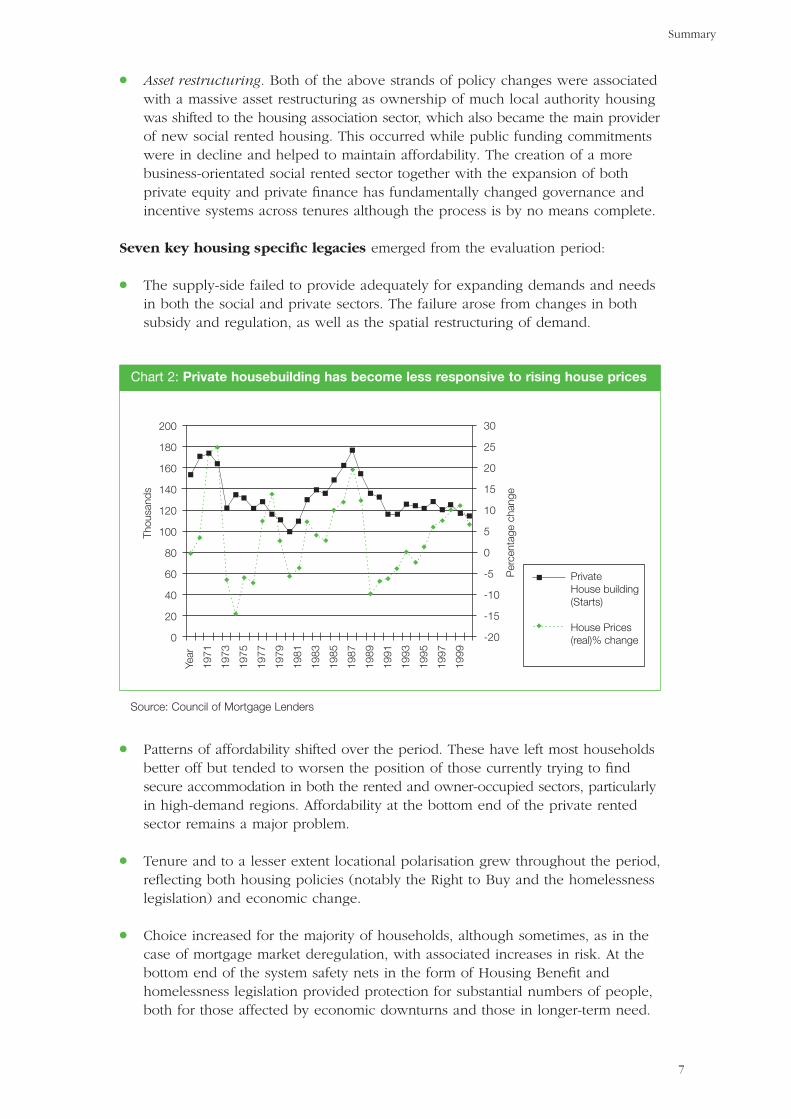
Chart 2: Private housebuilding has become less responsive to rising house prices
Source: Council of Mortgage Lenders
● Asset restructuring. Both of the above strands of policy changes were associatedwith a massive asset restructuring as ownership of much local authority housingwas shifted to the housing association sector, which also became the main providerof new social rented housing. This occurred while public funding commitmentswere in decline and helped to maintain affordability. The creation of a morebusiness-orientated social rented sector together with the expansion of bothprivate equity and private finance has fundamentally changed governance andincentive systems across tenures although the process is by no means complete.
Seven key housing specific legacies emerged from the evaluation period:
● The supply-side failed to provide adequately for expanding demands and needsin both the social and private sectors. The failure arose from changes in bothsubsidy and regulation, as well as the spatial restructuring of demand.
● Patterns of affordability shifted over the period. These have left most householdsbetter off but tended to worsen the position of those currently trying to findsecure accommodation in both the rented and owner-occupied sectors, particularlyin high-demand regions. Affordability at the bottom end of the private rentedsector remains a major problem.
● Tenure and to a lesser extent locational polarisation grew throughout the period,reflecting both housing policies (notably the Right to Buy and the homelessnesslegislation) and economic change.
● Choice increased for the majority of households, although sometimes, as in thecase of mortgage market deregulation, with associated increases in risk. At thebottom end of the system safety nets in the form of Housing Benefit andhomelessness legislation provided protection for substantial numbers of people,both for those affected by economic downturns and those in longer-term need.
Lessons from the past, challenges for the future for housing policy: An evaluation of English housing policy 1975-2000
8
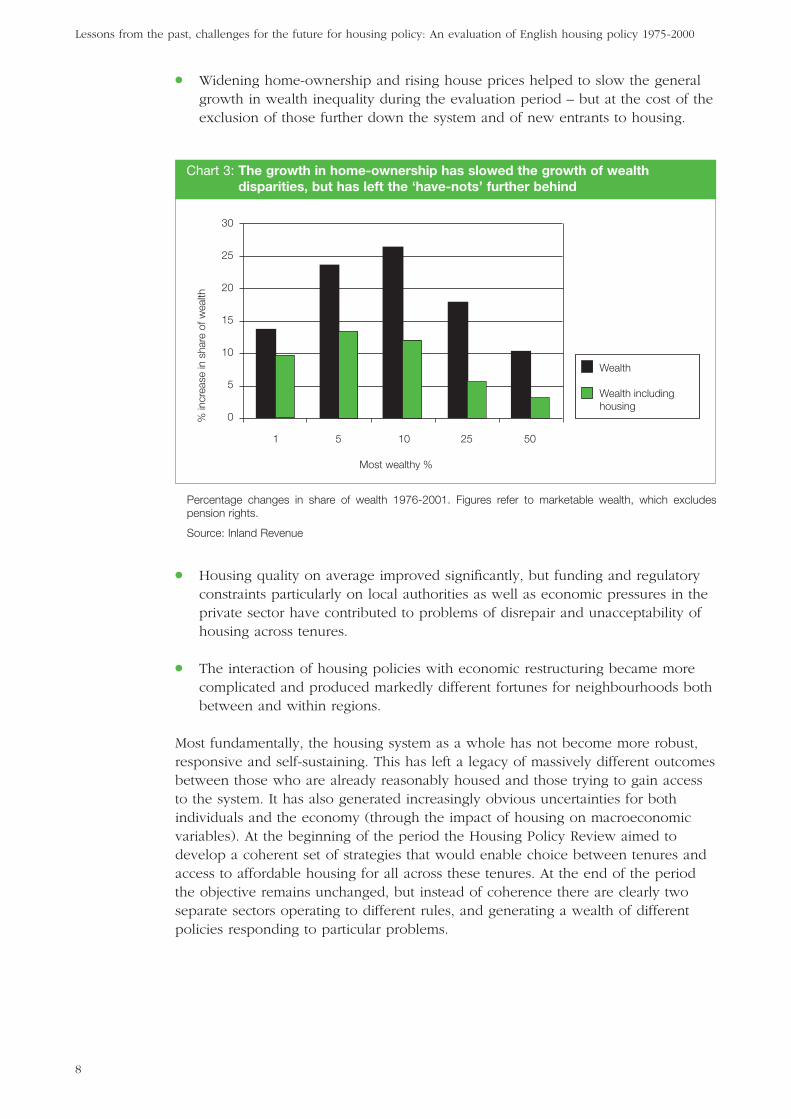
● Widening home-ownership and rising house prices helped to slow the generalgrowth in wealth inequality during the evaluation period – but at the cost of theexclusion of those further down the system and of new entrants to housing.
● Housing quality on average improved significantly, but funding and regulatoryconstraints particularly on local authorities as well as economic pressures in theprivate sector have contributed to problems of disrepair and unacceptability ofhousing across tenures.
● The interaction of housing policies with economic restructuring became morecomplicated and produced markedly different fortunes for neighbourhoods bothbetween and within regions.
Most fundamentally, the housing system as a whole has not become more robust,responsive and self-sustaining. This has left a legacy of massively different outcomesbetween those who are already reasonably housed and those trying to gain accessto the system. It has also generated increasingly obvious uncertainties for bothindividuals and the economy (through the impact of housing on macroeconomicvariables). At the beginning of the period the Housing Policy Review aimed todevelop a coherent set of strategies that would enable choice between tenures andaccess to affordable housing for all across these tenures. At the end of the periodthe objective remains unchanged, but instead of coherence there are clearly twoseparate sectors operating to different rules, and generating a wealth of differentpolicies responding to particular problems.
Most wealthy %
% in
crea
se in
sha
re o
f wea
lth
30
25
20
15
10
5
0
1 5 10 25 50
Wealth
Wealth including housing
Percentage changes in share of wealth 1976-2001. Figures refer to marketable wealth, which excludespension rights.
Source: Inland Revenue
Chart 3: The growth in home-ownership has slowed the growth of wealthdisparities, but has left the ‘have-nots’ further behind

HOUSING POLICY TODAY
Although the evidence does not yet exist to evaluate current housing policies, thefollowing assessment is based on the lessons derived from the evaluation of policyduring the 1975-2000 period.
The Government is faced with seven broad areas where the housing system is notworking properly:
● Supply mechanisms are not providing sufficient amounts of new housing, forthe market, intermediate (‘affordable’) or social rented sectors. In particular theprivate sector has not filled the gap left by the limitation on supply subsidies tosupport the provision of social rented housing.
● The deregulated finance market combines with a highly regulated land marketto produce housing market instability. In turn the unstable housing market canexacerbate macro-economic instability and affect competitiveness. On the otherhand a flexible housing sector can make macro-economic policies more effective,for example by facilitating mobility.
● Social sector tenants in high demand areas can usually only obtain accommodationor move when presenting with specific and serious housing needs and aregenerally unable to exert consumer preferences.
● The management of the social rented sector is increasingly complex as it becomesmore closely linked with wider neighbourhood management objectives, suchas tackling crime and anti-social behaviour. It is also open to greater risks as ittakes on different responsibilities and is more dependent on private financewhile at the same time facing greater regulation.
● There are growing concerns about the viability of deprived neighbourhoodsacross the country but particularly in low demand areas, as well as about theacceptability of traditional social rented housing to those who have otherhousing options.
● The housing needs of some groups, including particularly larger Black andMinority Ethnic (BME) households and those in need of residentially-basedsupport, are not being met by general housing policies.
● Disrepair persists in parts of all sectors, together with inadequate renovationprogrammes to maintain properties in effective use. The capacity to modifyexisting stock particularly with respect to insulation to meet broaderenvironmental requirements is an important element in this context.
The research team’s assessment of current policies at the end of the periodconcluded that:
● Mechanisms to secure an adequate supply of new housing in high demandareas are inadequate. The root of the problem lies in the difficulties in bringingappropriate land forward for development, but also in the costs of provision thatinhibits demand as well as the lack of funding for affordable housing. Thesefactors reduce the private sector’s ability to fill the gaps left by reduced socialsector investment.
Summary
9
Lessons from the past, challenges for the future for housing policy: An evaluation of English housing policy 1975-2000
10
● The housing market remains unstable and inadequately robust with marginalowner-occupiers especially at risk if the economy turns down. Equally, fluctuatinghousing wealth continues to affect demand in the economy through equitywithdrawal. This demand has so far been managed successfully, although it doesmean that general interest rates are higher than would otherwise be the case. Itwould be more difficult to prevent an inflationary housing market spilling overinto higher general inflation should the UK join the Euro.
● Some longer-term financial questions, notably the development of a frameworkto facilitate broader-based institutional investment in both private renting andowner-occupation, and the improvement of conditions under which equity releasecan smooth lifetime payments and income, have yet to be addressed fully.
● The housing and social security systems inhibit employment by promotingspatial polarisation and weakening financial incentives to find work. Regionalvariations in housing costs and in house price inflation inhibit both labourmobility and the capacity to build a coherent demand-side housing subsidy.
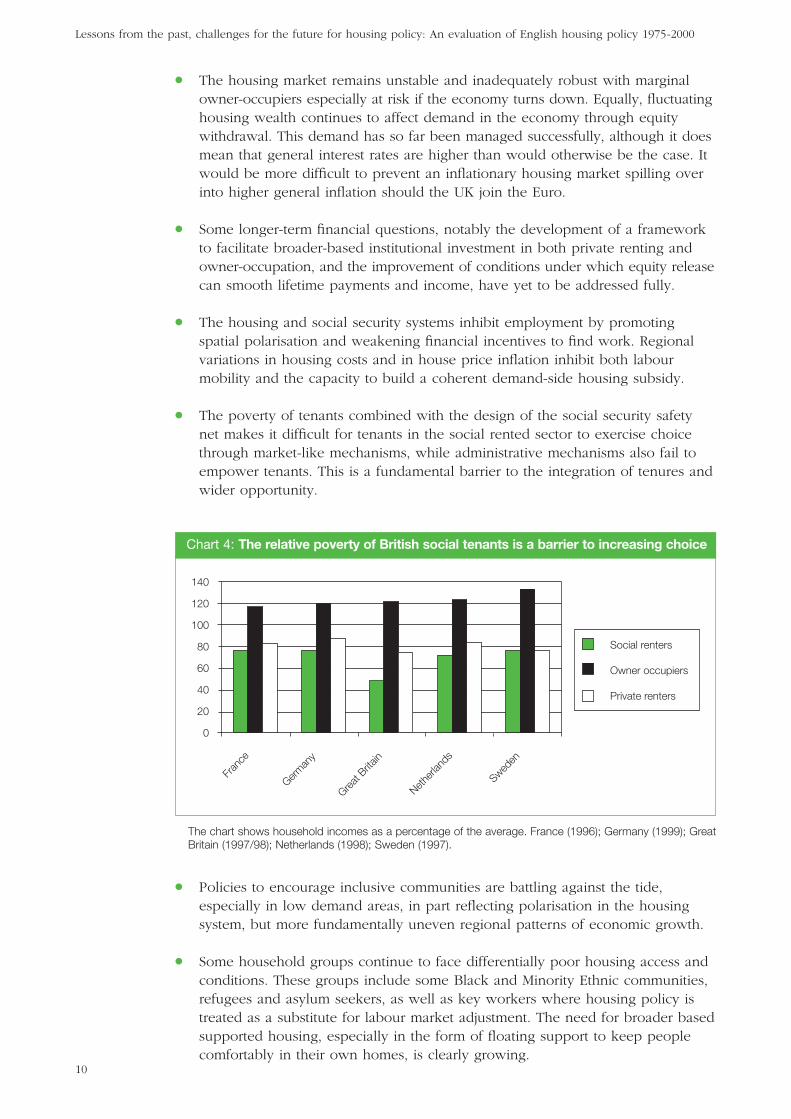
● The poverty of tenants combined with the design of the social security safetynet makes it difficult for tenants in the social rented sector to exercise choicethrough market-like mechanisms, while administrative mechanisms also fail toempower tenants. This is a fundamental barrier to the integration of tenures andwider opportunity.
● Policies to encourage inclusive communities are battling against the tide,especially in low demand areas, in part reflecting polarisation in the housingsystem, but more fundamentally uneven regional patterns of economic growth.
● Some household groups continue to face differentially poor housing access andconditions. These groups include some Black and Minority Ethnic communities,refugees and asylum seekers, as well as key workers where housing policy istreated as a substitute for labour market adjustment. The need for broader basedsupported housing, especially in the form of floating support to keep peoplecomfortably in their own homes, is clearly growing.
The chart shows household incomes as a percentage of the average. France (1996); Germany (1999); GreatBritain (1997/98); Netherlands (1998); Sweden (1997).
Fran
ce
German
y
Great B
ritain
Netherl
ands
Sweden
140
120
100
80
60
40
20
0
Social renters
Owner occupiers
Private renters
Chart 4: The relative poverty of British social tenants is a barrier to increasing choice
● Policies to support environmental sustainability and increase housing densitysimilarly battle against the tide as a result of current pricing structures andunderlying demand pressures, as well as the lack of appropriate instrumentsto address improvement in the existing stock.
● Improvements in the management of social rented housing have been limited bythe pursuit of managerial objectives, continued shifts in policy and requirements;and by the regulatory framework. There are, however, more fundamental concernsthat there is an inherent tendency for management costs to rise.
● The Decent Homes standard is achievable in the bulk of the social rented sector,although probably not to timetable in areas where management is relatively poor.Financial rules regarding rent setting may endanger longer-term maintenance.Maintenance problems in the owner-occupied sector are likely to worsen as thepopulation of elderly homeowners, with fewer resources and less interest inmaintenance, grows. Regulatory mechanisms in the private rented sector cannotbring about acceptable standards particularly because quality and therefore theadditional costs of raising these standards are not reflected in higher rents eitherin low or high demand areas.
HOUSING FUTURES
The evaluation has shown that many policies pursued over the past 25 years havebeen successful in their own terms, yet many of the problems identified at thebeginning of the period have not been addressed effectively because:
● Emerging challenges remain unanticipated because policies are formulated asreactions to particular problems.
● Policies are often narrowly conceived because they deal with the symptoms ofparticular problems and ignore wider contextual influences.
● Consequent unanticipated behavioural responses to policy instruments sometimesspawn an array of follow-up policies leading to excessive micro-management.
● There is little vision of what a coherent and robust system would look like, andtherefore little attempt to test policies against achievement of this system.
There are four key requirements for the housing system to function well over thecoming decades:
● It must exhibit robustness to changing economic conditions and shocks.
● It must be flexible in response to economic needs.
● It must be able to respond to demographic changes.
● It must adapt to rising aspirations in terms of both demand and the capacity toadjust existing stock and sustain neighbourhoods.
Summary
11

Lessons from the past, challenges for the future for housing policy: An evaluation of English housing policy 1975-2000
12
Although a decent home for everyone at a price within their means should remainthe key housing objective, the way in which housing policy is conceived mustchange if these problems are to be overcome:
● The first challenge is to achieve policy coherence. Housing policy has becomeincreasingly fragmented, with the department responsible for housing losinginfluence both to what is now the Department of Work and Pensions and tothe Treasury. The development of regional level policy making risks furtherfragmentation of the system. A mechanism for coherent cross-governmentalpolicy development for housing, with a pre-evaluation element, is missing.
This is emphatically not a call for policy to be based on rigid planning mechanisms,whether they are conceived at a national, regional or local level, although ofcourse high quality information systems are a part of any well-functioning system.
● The second challenge is to consider demand and supply sides together andwithin the context of uneven regional economic development. This challengearises from the recognition that the relatively efficient financial market combineswith an inefficient supply side resulting in access and affordability problems,market instability and labour market immobility. Better pricing of the costs andbenefits to society would help to achieve a more efficient level of land releasewithin the current planning gain framework and would support thesustainability agenda.
● The third challenge is to renew the emphasis placed on subsidised building.Demand-side subsidies alone have clearly failed in this context. The costs togovernment over time can be limited by the development of better financialinstruments including greater use of equity finance. More fundamentally there isa strong case for more balanced regional economic growth which needs to beaddressed in the broader policy arena.
● The fourth challenge is to recognise that the nature of housing system and of housing policy is constrained by the social and economic context.Macroeconomic instability has disproportionate impacts on the housing systembecause of the importance of wealth and debt within it. This in turn feeds back onthe achievement of macro objectives. Housing contributes to flexibility in macro-management, but similarly takes the blame for macro-mismanagement. Thissymbiosis needs to be recognised directly in policy development.
● The fifth challenge is to create greater choice in the social rented sector. Thiswill be hard to achieve partly because of the poverty of tenants, partly becauseof over-regulation and partly because of under-supply. Yet the safety net role of the social rented sector is needed to respond to labour market polarisation,inequality and the nature of social security system. Crucially there is a need toreform the Housing Benefit system, in parallel with the new welfare state,particularly with respect to the tax credit system. This is a necessary first step forproviding the basis of a viable social rented sector, as well as work incentives.
● The sixth challenge is to create a viable social rented sector, that is a tenure ofchoice. This challenge can be tackled only once the fifth challenge has beenmet. Only then would the social rented sector stand some chance of becomingviable, i.e. not trapped as a low-aspiration tenure subjected to excessive micro-
management. The key is to promote its simultaneous disassociation from directstate ownership and management, to allow flexible response while promotingsolidarity within the sector. Some redistribution of financial surpluses betweensocial landlords is needed, but the incentive to create them too must be retainedto allow reinvestment to meet long-term sustainability objectives. A degree ofrisk for social landlords is probably necessary to provide incentives to anticipatefuture demands and aspirations.
● The seventh challenge is to reduce the barriers between the social rentedsector and the market sector. Once again the achievement of this objective isdependent on the achievement of the previous one. So far only the Right to Buyand to a far lesser extent low-cost homeownership schemes do this. Opening upsubsidies to competition from private sector landlords would be one possibleway in which barriers could be reduced. Equally, the potential for introducingequity into both social and private housing institutions should be addressed.
● The eighth challenge is to devise mechanisms for collective repairs withinbuildings in multiple ownership and for renewal in neighbourhoods whereownership structures are fragmented.
● The final challenge is to reconsider the distributive impact of housing subsidiesalongside their wider social consequences. Inconsistencies in the distributionof subsidies are well recognised, especially the lack of support for low-incomehomeowners and the failure of Housing Benefit to provide adequate assistancefor many of those at the bottom of the private rented sector. But the growingimportance of housing wealth also needs consideration. Housing will increasinglyprovide a key link to wider social policy, including smoothing income over thelife cycle (e.g. reverse mortgages in retirement and paying for long-term care);and intergenerational life chances (paying for children’s education and inheritance).Housing raises new questions of equality of opportunity and outcome, as wellas public spending.
Summary
13

SECTION 1
Housing policy 1975–2000
INTRODUCTION
1.1 During the period of this evaluation (1975-2000) housing policies were developedto meet fundamental housing objectives. The basic objectives of housing policiesare reflected in the phrase: a decent home for every family at a price within theirmeans. But governments also attached greater importance to extending housingchoice and improving the effectiveness of housing management during this period.These high-level housing objectives have been examined in detail in the five theme reports.
1.2 This section examines whether housing policies during the evaluation period weresuccessful in their own terms. In doing this it builds on the individual theme reportsthat examined different aspects of housing policy, to provide a synthesis. It clarifieshow the situation at the end of the period differed from that at the beginning. Itasks whether policies were successful in their own right, but goes beyond this toexamine how policies interacted with one another and with wider social andeconomic changes. This is intended to unravel some of the dynamics that determinehow today’s housing system works. It sets the scene for the rest of this report. InSection 2 we examine the extent to which selected current policies are likely toaddress some of the failings of the housing system inherited from the evaluationperiod. The concluding section looks forward to the challenges facing housingpolicy in the decades ahead.
1.3 This section begins by identifying the major policy shifts that occurred in theevaluation period and examines what drove these changes. These have beenbrought together into three ‘policy clusters’. We then examine summary evidenceof the outcomes in terms of basic housing objectives. Finally we identify the mainlegacies that have been left by the interface of policy and environment over theevaluation period. The three key policy clusters and seven key legacies aresummarised in Table 1.1.
15

Lessons from the past, challenges for the future for housing policy: An evaluation of English housing policy 1975-2000
16
Table 1.1: Key policy clusters and legacies 1975-2000
Key policy clusters
Deregulation, privatisationand performance-basedcontrols
Restructuring housingsubsidies
Asset restructuring
Key legacies
Failure of supply
Tenure polarisation
Choice and risk
Wealth and redistribution
Housing quality andacceptability
Regions andneighbourhoods
One of the key themes of the evaluation period was Government deregulation of the privatesector. The financial system was deregulated in the 1980s, leading to an increase in theavailability of mortgage finance, which in turn helped more people to become homeowners.Rents in the private rented sector were also decontrolled, a policy that happened only graduallybut laid the foundations for the recent success of ‘buy to let’ and even limited institutionalinvestment. Meanwhile Governments increased controls over local authorities and other sociallandlords. Subsidy systems were used to shape the activities of social landlords, while aregulatory and supervisory system was also developed.
At the start of the evaluation period supply-side subsidies made up more than 80% of thetotal. By the end of the period the situation had been reversed, with around 85% of housingsubsidies now being demand-sided. The total level of subsidies also fell by 16% in real terms.The largest falls in subsidies were in capital and revenue subsidies, and eventually the phasingout of mortgage interest relief. Housing Benefit emerged as by far the biggest housing subsidy.
As the debts of the era of rapid housebuilding were repaid or eroded by inflation and rentsrose, more and more local authorities found that they were generating surpluses. One of thebiggest choices faced by Government was what to do, as the social rented sector became‘mature’. The Government could have established an ‘independent’ social rented sector, ableto recycle surpluses to generate new investment under a looser regulatory framework. Insteadthe Government undertook a huge asset restructuring exercise involving the Right to Buy andLarge Scale Voluntary Transfers.
Although crude housing shortages disappeared in the 1970s, new shortages emerged in thesouth of the country towards the end of the evaluation period. These were attributable, inpart, to the failure of the planning system to release sufficient land for new building within thecontext of regional economic balances, as well as the general reductions in the supply of newsocial rented housing.
As home-ownership rose throughout the evaluation period, so tenure patterns becamemore polarised. Policies, such as the Right to Buy and the Homeless Persons Act certainlycontributed to tenure polarisation, but the period was also one of social and economicrestructuring and these contextual changes also help to explain why the poorest householdsare now so heavily concentrated in the social rented sector.
As Government expanded choice, so many risks were shifted on to households. Mortgagemarket deregulation provides a good example of this change, as households could borrow more,but also carried greater risks of arrears or possession when interest rates or unemploymentrose. Safety nets at the bottom of the system were, however, strengthened, notably throughthe homelessness legislation and the development of the Housing Benefit system.
Homeownership grew at a time when income and wealth inequalities were also growing rapidly.The growth in home-ownership helped to broaden the wealth base of the country and seemsto have slowed down the growth in wealth inequality. However, its growth also marked thewidening in the gap between households at the ‘bottom’ of the system and those in the middle.
Housing quality improved during the evaluation period, although expectations are alwaysmoving upwards. Proportionately the worst housing is still found in the private rented sector,although poor standards are also found in parts of the owner-occupied sector. The quality oflocal authority housing improved but this should be expected given the sums of money spenton it. Ownership fragmentation will make future area regeneration more problematic.
Regional variations tend to widen when the economy is expanding rapidly and diminish duringrecessions. More intractable differences between locations occur at a neighbourhood level,and it is this that has greater social consequences than tenure polarisation, although the twoare closely associated. Governments have found repeatedly that it is easier to improve thehousing quality within neighbourhoods, whether they be in the public or private sectors, thanit is to remove wider social and economic disadvantage.

What drove changes in the housing system?1.4 The housing system that exists today reflects four main influences: demographic
trends, social change, macro economic variables, notably income growth, inflationand economic restructuring, and housing policy itself. Housing policy was, in turn,affected by two further influences: wider government objectives and their associatednon-housing specific policies which impacted on housing and the opportunities thatarose from the growing maturity of the local authority sector.
1.5 During the evaluation period (1975-2000) England’s population grew and generatedlarger than proportional increases in the number of households. Social changes,such as the rise in divorce and greater sexual freedom, created more single andlone parent households. The population aged and became more diverse ethnicallyespecially in London. Generally, these trends resulted in more pressure beingplaced on the housing system than had been anticipated. Pressures on the housingsystem varied regionally, with the South and particularly London and the South Eastexperiencing the greatest increased demand.
1.6 The country became much more prosperous as real incomes doubled, increasingdemand for housing as well as for a broader range of housing related aspirationalgoods. However, this prosperity was distributed unevenly in part as a result ofhousing market outcomes. Large-scale increases in income inequality occurredin the 1980s as higher incomes increased more rapidly and the tax system wasrestructured. This trend continued in the 1990s albeit at a slower rate. Moreover,beneath the huge rise in unemployment in the first half of the 1980s, and ultimatelyits return to levels similar to those that existed in the mid-1970s, the labour marketbecame more polarised. England experienced the simultaneous growth of ‘dualearner’ households, reflecting the expansion of female employment, and ‘no earner’households, reflecting the loss of mainly semi and un-skilled jobs, particularlyamong men. Polarisation in the labour market altered the pattern of demand forhousing as well as the need for assistance in securing a decent home. Once againthere was a pronounced regional pattern to these changes.
1.7 Throughout the evaluation period housing policy was shaped by wider Governmentimperatives. The housing system in the 1970s was determined as much by theGovernment’s need to respond to inflationary pressures and poor economic performanceas by housing pressures. External borrowing and the impact of InternationalMonetary Fund (IMF) intervention affected housing directly and indirectly. Thisadverse macroeconomic environment led to a high level of regulation throughoutthe economy as well as a massive redistribution of wealth between borrowers andlenders. It also provided the opportunity for restructuring local authority housingas capital values increased and the real cost of borrowing fell.
1.8 In the 1980s, the emphasis shifted to the control of government spending, thewithdrawal of government from traditional areas of provision as well as financialand economic deregulation. These priorities strongly influenced housing policy andwere reflected most clearly in the shifting patterns of housing subsidy; in increasingopportunities for owner-occupation, which took place within the wider context offinancial market liberalisation; and in increased regulation and the reduction inopportunity in the local authority sector.
Housing policy 1975-2000
17
Lessons from the past, challenges for the future for housing policy: An evaluation of English housing policy 1975-2000
18
1.9 Meanwhile two housing restructuring policies, the Right to Buy and Stock Transfers,were made possible by the growing maturity of the local authority sector. Thesector grew up in the decades following the First World War and was given anenormous boost after the Second World War through both slum clearance and large-scale additional provision, financed by local authority borrowing but supported bycentral government revenue subsidies. The slowdown in the 1970s, and the eventualvirtual halt, in new building combined with inflation and rising rents to bring muchof the sector into surplus. In the sector as a whole, rental income exceeded loancosts, and marketable value exceeded outstanding debt. It was this ‘maturation’ ofthe sector that underpinned both the Right to Buy and the transfer of local authorityhousing to housing associations. Together these marked a huge asset restructuringas well as significant changes in governance structures and risk allocation.
1.10 Some of these pressures continued into the 1990s as the deregulated private rentedsector started to respond to new opportunities and the role of private finance insocial housing increased. An adverse economic environment in the early part ofthe decade once again impeded progress. Thereafter, however, a far more benignenvironment enabled further subsidy restructuring and greater private involvementin housing with little outward sign of tension although underlying risks remained.
1.11 The overall impact of these policies was severely to weaken the supply responsivenessof the housing system with respect to both new supply and investment in the existingstock. These were: the restructuring of housing subsidies; the use of publicly ownedland and the growing maturity of the local authority sector to finance asset restructuringinstead of new housing; and the increasingly severe restrictions on the supply ofland through the planning system in the South of the country. This in turn haddirect and indirect impacts on affordability and access to housing across the incomeand tenure spectrum. Combined with other key policies, this has left a legacy whichhas modified the role of the social rented sector; produced new trade-offs betweenchoice and risk; changed the distribution of wealth; restructured housing opportunity;and produced marked regional and neighbourhood patterns.
Key policy clusters1.12 The five theme reports provide a detailed examination of housing policies during
the evaluation period. The main individual policies are listed in Appendix I. Herewe have identified three key policy clusters that drove fundamental changes in thehousing system during the evaluation period.
DEREGULATION, PRIVATISATION AND PERFORMANCE-BASED CONTROLS
1.13 Housing policy followed the grain of wider government policy in concentratingon deregulation and privatisation, shifting patterns of governance of housing andenabling the private sector to increase provision. Housing specific finance policiesconcentrated on enabling banks to provide finance and building societies torespond to this increased competition. They also provided the framework thatenabled private finance to help fund the social sector.

1.14 The results here are mainly reflected in the increased proportions of owner-occupiers and the growth in the numbers of mortgagors. Owner-occupation grewfrom around 55 per cent in 1975 to almost 70 per cent, increasing the number ofowner-occupiers by more than 50 per cent. Equally, the numbers of loans issued tofirst time buyers rose from 305,000 in 1975 to 568,000 in 2001. Private financingonly became possible in the social sector from the mid-1980s. It helped to fund 14per cent of new dwellings during the evaluation period and enabled the realisationof public sector assets through large-scale voluntary transfer.
1.15 In its own terms this policy has proved extremely successful. It enabled otherpolicies such as the Right to Buy to operate effectively as well as funding a similarnumber of households directly into owner-occupation by removing fundingshortages and liberalising eligibility. The associated costs have been in terms ofgreater openness to volatility in the broader finance market and to the risks ofvariation in income and employment.
1.16 In the social sector introducing private finance and deregulating rents opened upthe sector to market pressures. Consequently, housing associations had to operatemore as businesses, at the cost of increases in rents to pay for the funding and tobuild up reserves to support borrowing capacity.
1.17 A second major area of deregulation has liberalised rent setting and reformedsecurity of tenure in the private rented sector. The decline of this sector wasreversed, although significant expansion did not occur until the last few years ofthe period. More importantly the sector has been completely restructured from onewhere perhaps only about 3 per cent of the housing stock was generally availableto new entrants to one where the vast majority of new lettings are let on the freemarket. Private finance has become available for individual investors in the sector,although there remains little demand from institutions. Inevitably, the cost has beenhigher rents and lesser security mediated by the availability of Housing Benefit atthe bottom end of the market. More fundamentally rents still appear to have littlerelationship to quality and there is evidence of a growing problem of poor qualityprivate renting in deprived areas.
1.18 The policies in the social and particularly in the local authority sectors have beenvery different. They have involved greater central direction and constraints in orderto increase the incentives to transfer ownership to independent owners. Thesepolicies have included in particular the introduction of Housing Investment Plans(HIPs) (controlling the capacity to raise funds); allocations of funding based onneeds indices; prioritising those in the greatest housing need; and a subsidy systemwhich constrained output and particularly investment within the existing stock. Overthe last decade the emphasis has moved to individual performance monitoring andinspection generating a system where in principle those who are proved efficientcan free themselves from the complex regulatory framework. Evidence on efficiencyand cost control is difficult to assess not least because of the changing populationof organisations included in the assessment. Those with the worst problems, andpossibly the least efficient, have inherently been left under the greatest control. Tothe extent that evidence can be adduced it suggests that costs have not declined,although the quality of management may have increased.
Housing policy 1975-2000
19
Lessons from the past, challenges for the future for housing policy: An evaluation of English housing policy 1975-2000
20
THE RESTRUCTURING OF HOUSING SUBSIDIES
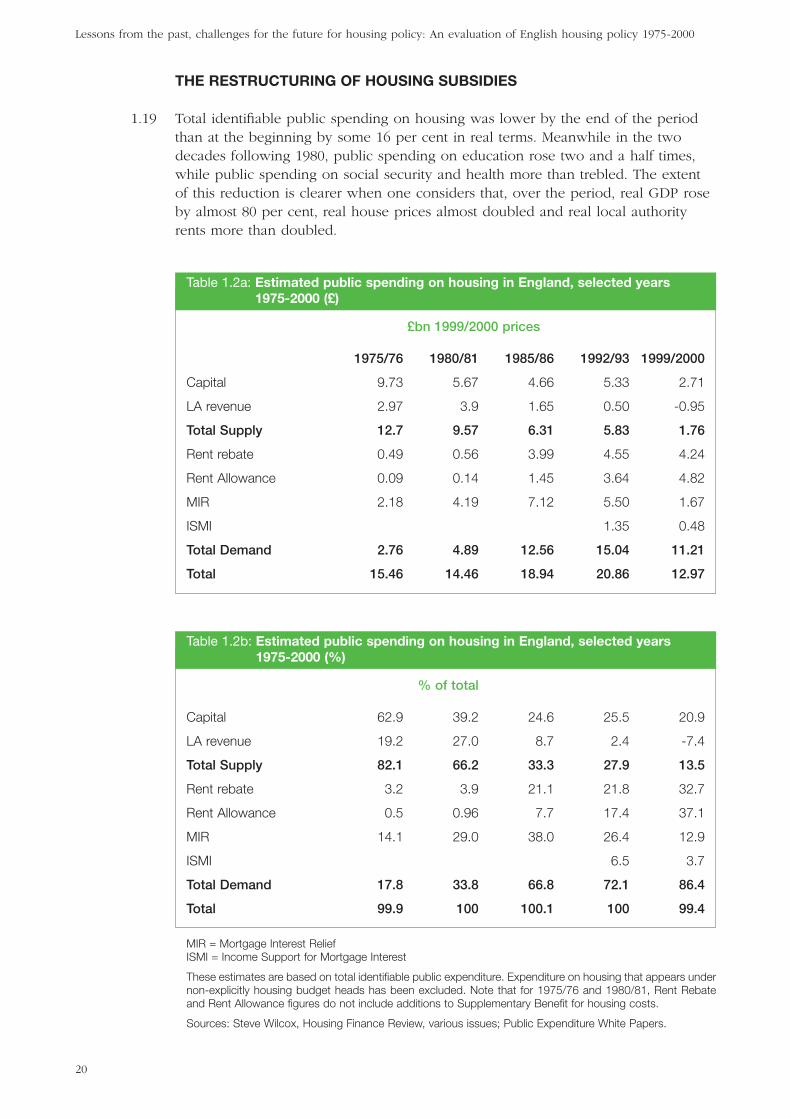
1.19 Total identifiable public spending on housing was lower by the end of the periodthan at the beginning by some 16 per cent in real terms. Meanwhile in the twodecades following 1980, public spending on education rose two and a half times,while public spending on social security and health more than trebled. The extentof this reduction is clearer when one considers that, over the period, real GDP roseby almost 80 per cent, real house prices almost doubled and real local authorityrents more than doubled.
£bn 1999/2000 prices
1975/76 1980/81 1985/86 1992/93 1999/2000
Capital 9.73 5.67 4.66 5.33 2.71
LA revenue 2.97 3.9 1.65 0.50 -0.95
Total Supply 12.7 9.57 6.31 5.83 1.76
Rent rebate 0.49 0.56 3.99 4.55 4.24
Rent Allowance 0.09 0.14 1.45 3.64 4.82
MIR 2.18 4.19 7.12 5.50 1.67
ISMI 1.35 0.48
Total Demand 2.76 4.89 12.56 15.04 11.21
Total 15.46 14.46 18.94 20.86 12.97
Table 1.2a: Estimated public spending on housing in England, selected years1975-2000 (£)
MIR = Mortgage Interest ReliefISMI = Income Support for Mortgage Interest
These estimates are based on total identifiable public expenditure. Expenditure on housing that appears undernon-explicitly housing budget heads has been excluded. Note that for 1975/76 and 1980/81, Rent Rebateand Rent Allowance figures do not include additions to Supplementary Benefit for housing costs.
Sources: Steve Wilcox, Housing Finance Review, various issues; Public Expenditure White Papers.
% of total
Capital 62.9 39.2 24.6 25.5 20.9
LA revenue 19.2 27.0 8.7 2.4 -7.4
Total Supply 82.1 66.2 33.3 27.9 13.5
Rent rebate 3.2 3.9 21.1 21.8 32.7
Rent Allowance 0.5 0.96 7.7 17.4 37.1
MIR 14.1 29.0 38.0 26.4 12.9
ISMI 6.5 3.7
Total Demand 17.8 33.8 66.8 72.1 86.4
Total 99.9 100 100.1 100 99.4
Table 1.2b: Estimated public spending on housing in England, selected years1975-2000 (%)

1.20 Comparing public spending at the end of the evaluation period with that at the startdisguises the large rise in total spending that occurred in the 1980s and early 1990sin response to the changing economic environment.
1.21 Table 1.2a shows clearly that public spending on supply-side subsidies was effectivelycurtailed from the mid 1970s, reflecting in large part the ability of central governmentto use the Housing Investment Programme (HIP) system. Originally, the HIP systemwas established to assist planning but overtaken by the implementation of IMFsponsored controls, to contain local government spending. Capital spending fell veryquickly over the period between the mid-1970s and the early 1980s. It then stabilisedfor a time before falling again in the closing years of the evaluation period.
1.22 The dramatic rise in public expenditure on housing in the 1980s occurred in alldemand-side subsidies. To some extent the rise in Rent Rebate and Allowanceexpenditure between the mid 1970s and the mid 1980s is a reflection of the shiftingSupplementary Benefit payments for housing costs (mainly but not exclusively fortenants) to the Housing Benefit system in 1983. But the rapid rise in payments continuedafter this date as a result first of rising council house rents (as local authority revenuesubsidies were cut), then through deregulation of housing association and privatesector rents and finally through rising unemployment and non-participation in thelabour market. The demand-led nature of subsidies is also illustrated by the risingcosts of mortgage interest tax relief as the numbers of owner-occupiers increasedand, for much of the period to the early 1990s, interest rates rose.
1.23 So there are two stories. First, the cut in supply-side subsidies coinciding with (andto some extend causing) the rapid expansion in the cost of demand-side subsidies.This was followed by the second involving measures to curtail the cost of demand-side subsidies, most notably the phasing out of Mortgage Interest Relief (MIR).While these subsidies acted as effective counter-cyclical automatic stabilisers overthe economic cycle Housing Benefit and Income Support for Mortgage Interest(ISMI) also became subject to much tougher eligibility controls. The current positionthus reflects lower interest rates and moderating rent increases, higher employmentas well as tighter eligibility requirements and the complete phasing out of MIR.
1.24 Plainly a large shift in the type of subsidy available occurred: at the start of theperiod more than 80 per cent of housing subsidies were supply-sided. By the endof the period more than 85 per cent of housing subsidies were demand-sided(Table 1.2b). While it would be naïve to assume that demand-side subsidies haveno supply impact, such a shift in the composition of subsidies inevitably helpedcurtail the supply of new housing.
Housing policy 1975-2000
21

Lessons from the past, challenges for the future for housing policy: An evaluation of English housing policy 1975-2000
22
One of the biggest and most successfully implemented policies was the gradual withdrawalof mortgage interest relief (MIR) for owner-occupiers. This subsidy was initially unlimited. Theintroduction of a £25,000 ceiling on eligible loans in 1974 did not make much differencebecause the average house price was then £10,000. The ceiling was raised to £30,000 in1982 when fewer than four per cent of mortgages advanced exceeded the limit. House priceinflation began to erode the value of the limit in the 1980s, but this didn’t stop the cost ofmortgage interest relief from rising rapidly.
The Rise and Fall of Mortgage Interest Relief
MIR was criticised for pushing up house prices, so favouring existing homeowners at theexpense of new purchasers, the very people it was meant to help. It was also a highly regressivesubsidy, being worth far more to better off homeowners. This was mainly because high-incomehomeowners received tax relief at the top rate of tax, which was still 40 per cent after the1988 budget. Everyone else received it at the basic rate of tax, which was then 25 per cent.
Distributional Impacts of Mortgage Interest Relief
In 1990-91 MIR was worth more than 2.5 times as much to a high-income family comparedto a low income household. When MIR was restricted to the basic rate of tax for everyonethe gap narrowed to 1.4. The gap didn’t disappear because low income homeowners werestill far more likely to have mortgages below the £30,000 ceiling.
This marked the beginning of the end for MIR. Successive governments phased out MIR byprogressively reducing the rate at which interest payments were deducted: to 20 per cent in1994, 15 per cent in 1995 and 10 per cent in 1998. What had been the largest housingsubsidy was finally abolished in 2000.
There are two main reasons why it was possible to phase out this subsidy without causingadverse consequences:
● The house price boom had already eroded the ceiling in the 1980s.
● Interest rates generally fell through the 1990s and a consequent reduction in mortgageinterest rates more than compensated for losses in MIR.
Nevertheless, when it was abolished MIR made the biggest proportionate difference to lowincome homeowners, and has left all households with mortgages exposed to the full impactof mortgage rate changes.
Box 1: The abolition of mortgage interest relief
12,000
10,000
8,000
6,000
4,000
2,000
0
1975
/76
1980
/81
1985
/86
1990
/91
1995
/96
2000
/01
Cost (£millions)
No. Recipients
(thousands)
1,500
1,000
500
0
1990/91 1991/92
Year
£High Income> £40,000
Low Income< £5,000
Source: Steve Wilcox Housing Finance Review
Source: Steve Wilcox Housing Finance Review
Housing policy 1975-2000
23
ASSET RESTRUCTURING
1.25 At the start of the evaluation period, around one in three households lived incouncil housing. The pressures to expand the sector declined in the mid 1970s andconsequently its expansion came to an end. At the same time in part because ofinflation, which reduced the real value of outstanding debt, local authority housingbegan to reach maturity. This took two forms. First the value of the stock exceededthe outstanding debt associated with it. Second, the revenues generated by rentsbegan to exceed expenditure on the sector.
1.26 The Government had choices about how these could be distributed. Threepossibilities existed:
● The tenants themselves could benefit (as was much under discussion at the timeof the Housing Policy Review in the 1970s).
● The Government could attempt to recoup the surpluses to finance other priorities;or the surpluses could be used to subsidise the provision of new social rentedhousing – the so-called ‘revolving door’ principle.
● Assets could be restructured through measures such as the Right to Buy andLarge Scale Voluntary Transfers.
1.27 The Right to Buy, under which tenants could purchase their council house with adiscount based on the length of their tenancy, was made possible by the current openmarket value of the stock greatly exceeding the outstanding debt for most properties.This equity, rather than directly measured public spending, paid for the discounts.
1.28 In its own terms the Right to Buy was a great success, both in political terms and inwidening access to owner occupation. Indeed Right to Buy accounted for approximatelyone-third of the increase in the level of owner-occupation during the evaluationperiod (although some of this would have happened by other means if the policyhad not been in place). Generally, its impacts on the supply of social housing werefelt only gradually, as most tenants would have remained as tenants in the samehouse anyway. Indeed relets continued to increase until the very end of the centuryeven in London and the South East. However it had a large impact on the profile ofthe council sector, on those who lived in it (better off tenants were more likely tobuy) and the type of houses themselves (more houses were sold relative to flats).
1.29 The Large Scale Voluntary Transfers became attractive to local authorities and tenantsas a means of accessing new private finance in order to renovate the sector andbecause of the constraints placed on local authorities through the subsidy framework.The scheme worked initially in the low debt shire counties but later more broadly,once again because the value of the stock, for these purposes measured as the currentvalue of future rental income, exceeded outstanding debt. The price of housingsold to new housing associations was sufficient to repay the debt and the housingassociations, unlike the local authorities, were free to borrow from the private sectorto improve the stock. An additional incentive arose from the way in which, after1988, Rent Rebate subsidy was reduced in authorities with revenue surpluses, a kindof negative subsidy and a way for the government to recoup surpluses on HousingRevenue Accounts.
Lessons from the past, challenges for the future for housing policy: An evaluation of English housing policy 1975-2000
24
1.30 In both cases these policies succeeded because the underlying economic conditionswere highly favourable. A second factor was the power of central government overlocal authorities. This was vital in the case of Right to Buy because without compulsionmany authorities would not have been willing to sell housing, at least not on theterms that were imposed. But in each case central government’s ability to constrainlocal authorities’ borrowing in order to finance new housing or other major investmentwas central to success. Equally it only worked in areas where price rises did meanthat there was positive value. This left particular types of dwelling, notably flats andunpopular dwellings in poor condition outside the policies. Their exclusion has inturn led to the development of incremental transfer and other policies to enable theownership restructuring with the assistance of debt write-offs. It is also one of themajor reasons for the introduction of the decent homes standard. Thus the policieswere successful in their own terms, but left large rumps of stock where problemscould not be addressed without further subsidy.
1.31 One policy noticeably not pursued by central government was the establishment ofa ‘revolving door’ system of housing finance. Such a system could have contributedto the supply of new social rented housing without recourse to the per unit levelsof additional measured public spending required under the system of capital grantsused to promote housing association new developments. Equally no mechanismwas put in place to reallocate such funding to areas and property types thatrequired additional assistance. This was reflected in the funding arrangements thathad to be put in place to meet the Labour government’s manifesto commitment torecycle certain of the receipts from Right to Buy.
Key legacies1.32 These and other policies have interacted with social and economic change
to create seven key legacies that form the background to current housing policyobjectives. These legacies relate to the fundamentals of quantity, cost to consumers,choice, with respect to tenure, dwelling and location, security, quality, the effecton wealth and income distribution and the spatial impact of policy in terms of bothneighbourhood and regional sustainability. At the same time changes in policy havehad major implications for the governance of housing and thus the nature of thelevers that can be effectively employed in meeting these objectives in the future.
LEGACY 1: FAILURE OF SUPPLY
1.33 One of the clear failures of the housing system during the evaluation periodconcerned its inability to supply sufficient new houses in relation to need. By thestart of the period crude shortages had been removed and between 1975 and 1980the number of new dwellings greatly exceeded the growth in households. Between1980 and 1985 performance declined markedly in the south of the country, steadiedfor the next decade before once again deteriorating towards the end of theevaluation period.
Housing policy 1975-2000
25
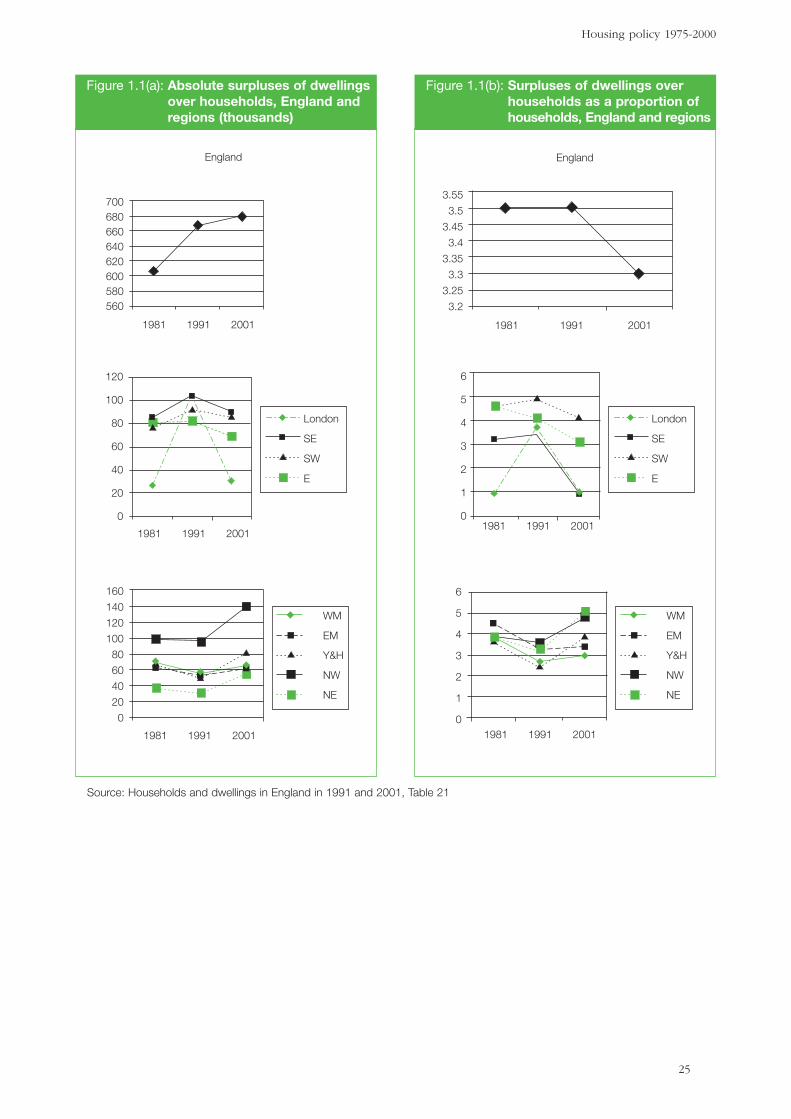
Source: Households and dwellings in England in 1991 and 2001, Table 21
England
700680660640620600580560
1981 1991 2001
1981 1991 2001
1981 1991 2001
120
100
80
60
40
20
0
London
SE
SW
E
160
140
120
100
80
60
40
20
0
WM
EM
Y&H
NW
NE
Figure 1.1(a): Absolute surpluses of dwellingsover households, England andregions (thousands)
England
1981 1991 2001
3.55
3.5
3.45
3.4
3.35
3.3
3.25
3.2
1981 1991 2001
6
5
4
3
2
1
0
London
SE
SW
E
1981 1991 2001
WM
EM
Y&H
NW
NE
6
5
4
3
2
1
0
Figure 1.1(b): Surpluses of dwellings overhouseholds as a proportion ofhouseholds, England and regions
Lessons from the past, challenges for the future for housing policy: An evaluation of English housing policy 1975-2000
26
1.34 Figure 1.1 shows that the national trend was of a growth in the excess of dwellingsover households in numerical terms between 1981 and 1991, but of stagnationproportionately. Thereafter the surplus grew very slightly numerically, but beganto fall proportionately.
1.35 However, these figures for England disguise marked regional variations. In Londonand the South East the surplus grew both numerically and proportionately in thedecade up to 1991, but then collapsed to around one per cent of households. Butin the Midlands and the three northern regions both numerically and proportionatelythe surplus fell between 1981 and 1991, but grew thereafter. So we get a ‘^’ shapedpattern in the south and a ‘V’ shaped pattern in the north, translating into a flat linefor the country as a whole.
1.36 How do we explain the marked tightening of the housing market in the south? Wehave seen how the reduction in supply-side subsidies and restrictions on local authorityspending diminished the supply of new social housing. Indeed, housing starts in thesocial sector fell from 145,000 in 1975 to 13,000 in 2000. As Theme Report 1 showed,the allocation of capital grants to fund housing association developments alsosuggests that subsidies were directed disproportionately to areas of low demand,due to the weight given to poverty-related indicators in allocation criteria.
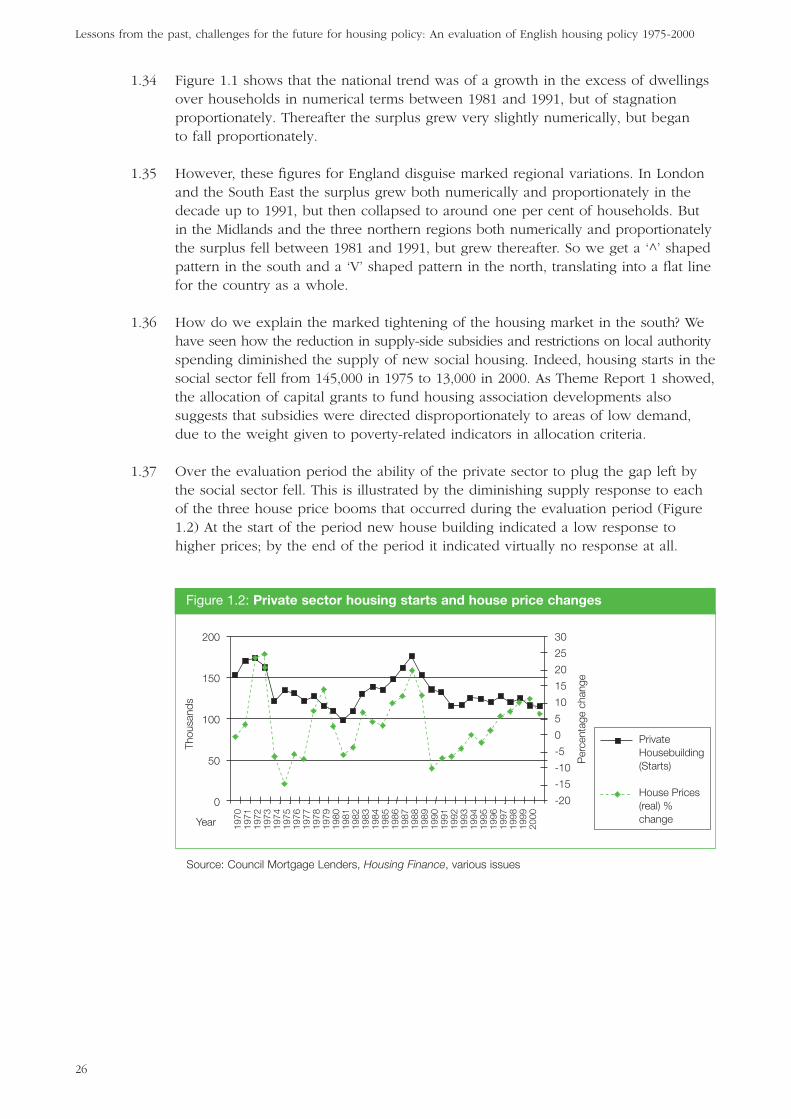
1.37 Over the evaluation period the ability of the private sector to plug the gap left bythe social sector fell. This is illustrated by the diminishing supply response to eachof the three house price booms that occurred during the evaluation period (Figure1.2) At the start of the period new house building indicated a low response tohigher prices; by the end of the period it indicated virtually no response at all.
Thou
sand
s
Per
cent
age
chan
ge
200
150
100
50
0
30
25
20
15
10
5
0
-5
-10
-15
-20
PrivateHousebuilding(Starts)
House Prices(real) % changeYear 19
7019
7119
7219
7319
7419
7519
7619
7719
7819
7919
8019
8119
8219
8319
8419
8519
8619
8719
8819
8919
9019
9119
9219
9319
9419
9519
9619
9719
9819
9920
00
Source: Council Mortgage Lenders, Housing Finance, various issues
Figure 1.2: Private sector housing starts and house price changes
Housing policy 1975-2000
27
1.38 While delays in the planning system have received official criticism, Theme Report 1shows that a fundamental reason for the lack of new housing in growth areas hasbeen the mechanisms by which regional planning guidance, structure plans andlocal plans have restricted the capacity to provide additional land in the south ofthe country, especially since 1991. Within this system the degree of local discretionin the implementation of higher level objectives is unsurprising given the lack ofincentives for new development. The influence of the preferences of existinghouseholds over local authorities, is always likely to be stronger than the influenceof hypothetical households, who will often be or be perceived as being outsiders.
1.39 The consequences of the failure to provide sufficient new housing are clear. Houseprices have risen, favouring existing owners above new households. Housingaffordability has worsened for new households and this has wider social andeconomic consequences, notably the difficulty of both public and private sectorsin recruiting ‘key’ workers.
LEGACY 2: CHANGES IN AFFORDABILITY
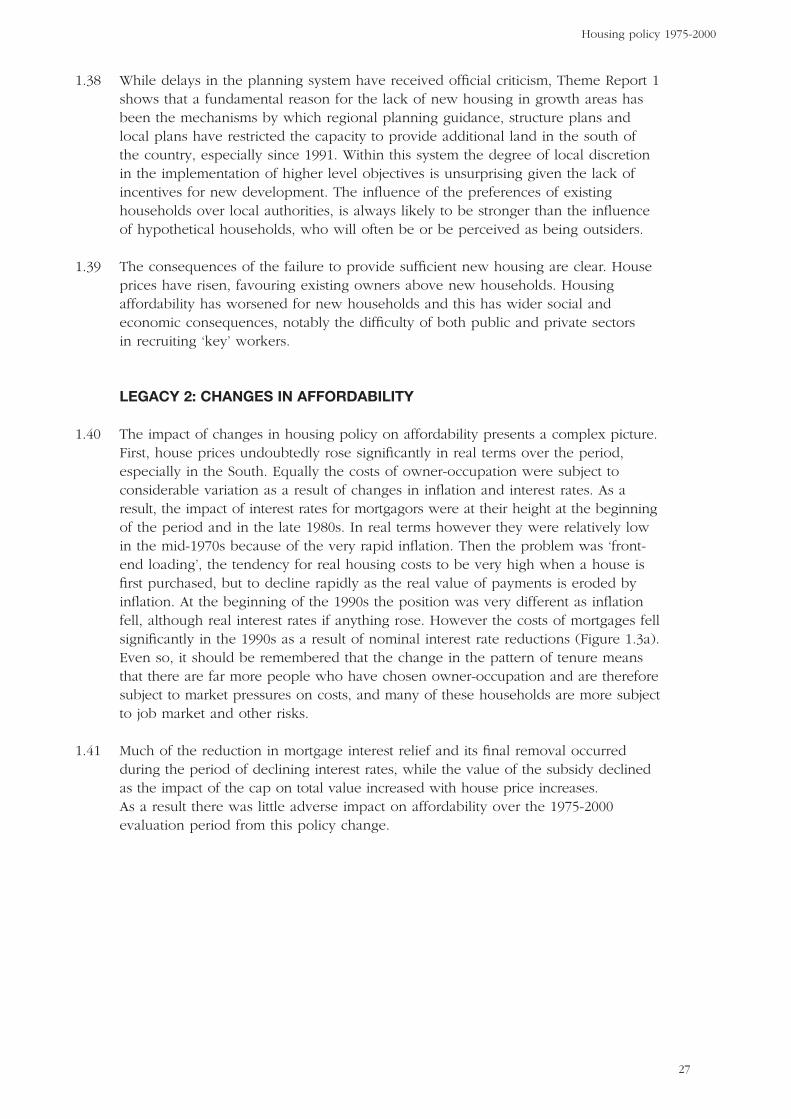
1.40 The impact of changes in housing policy on affordability presents a complex picture.First, house prices undoubtedly rose significantly in real terms over the period,especially in the South. Equally the costs of owner-occupation were subject toconsiderable variation as a result of changes in inflation and interest rates. As aresult, the impact of interest rates for mortgagors were at their height at the beginningof the period and in the late 1980s. In real terms however they were relatively lowin the mid-1970s because of the very rapid inflation. Then the problem was ‘front-end loading’, the tendency for real housing costs to be very high when a house isfirst purchased, but to decline rapidly as the real value of payments is eroded byinflation. At the beginning of the 1990s the position was very different as inflationfell, although real interest rates if anything rose. However the costs of mortgages fellsignificantly in the 1990s as a result of nominal interest rate reductions (Figure 1.3a).Even so, it should be remembered that the change in the pattern of tenure meansthat there are far more people who have chosen owner-occupation and are thereforesubject to market pressures on costs, and many of these households are more subjectto job market and other risks.
1.41 Much of the reduction in mortgage interest relief and its final removal occurredduring the period of declining interest rates, while the value of the subsidy declinedas the impact of the cap on total value increased with house price increases.As a result there was little adverse impact on affordability over the 1975-2000evaluation period from this policy change.
Lessons from the past, challenges for the future for housing policy: An evaluation of English housing policy 1975-2000
28
£140.00
£120.00
£100.00
£80.00
£60.00
£40.00
£20.00
£0.00
1989
/90
1990
/91
1991
/92
1992
/93
1993
/94
1994
/95
1995
/96
1996
/97
1997
/98
1998
/99
1999
/00
2000
/01
Local AuthorityTenants
HousingAssociation/RSLtenants
Private Tenants
Owner-occupiers
Source: Dataspring
Figure 1.3(a): Average weekly housing costs 1989/90-2002/03
100
80
60
40
20
0
1 2 3 4 5 6 7 8 9
Income Band
£ pe
r w
eek
LocalAuthorityTenants
OwnerOccupiers
Income Bands: 1 = under £3,000; 2 = £3,000-£3999; 3 = £4,000-5,999;4 = £6,000-£7,999; 5 = £8,000-£9,999; 6 = £10,000-£11,999;7 = £12,000-£14,999; 8 = £15,000-£19,000; 9 = £20,000 and above
* Mean net rent or mortgage payment as percentage of mean disposable income of head of householdsand spouse, Great Britain, 1989.
Source: Housing and Construction Statistics 1980-1990, Tables 12.9 and 12.10. (Original Source: FamilyExpenditure Survey.)
Figure 1.3(b): Housing costs as percentage of disposable household income 1989*
Housing policy 1975-2000
29
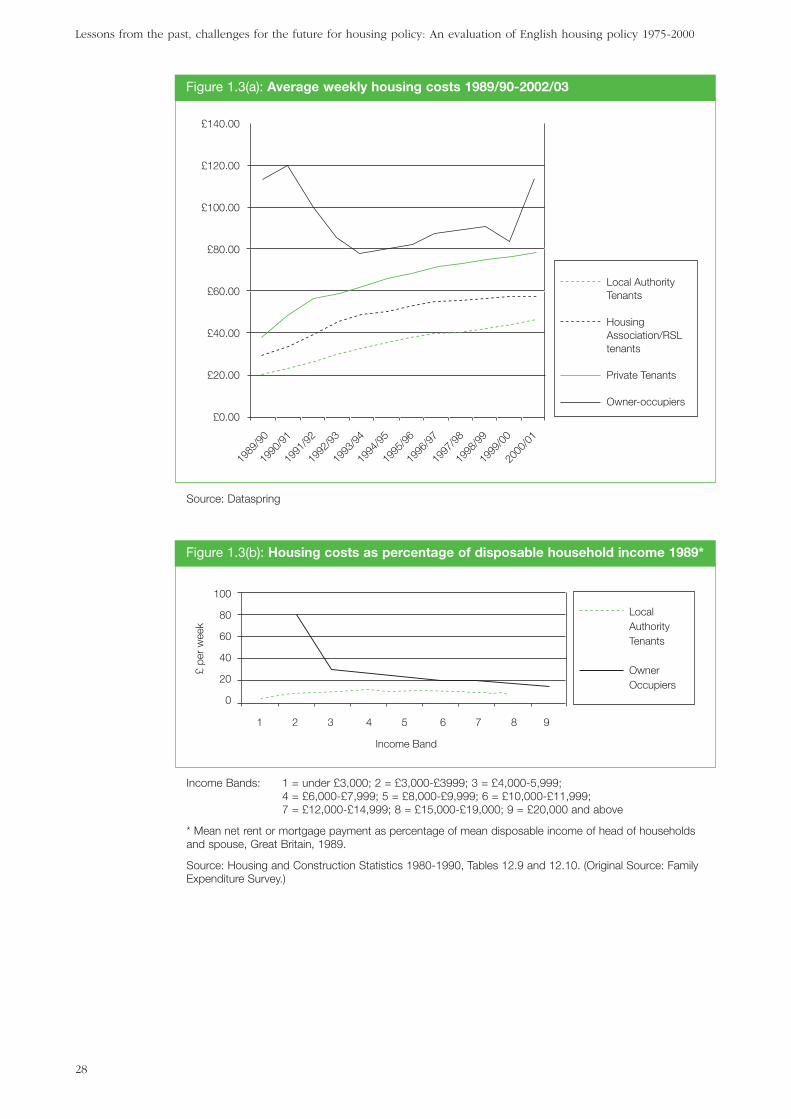
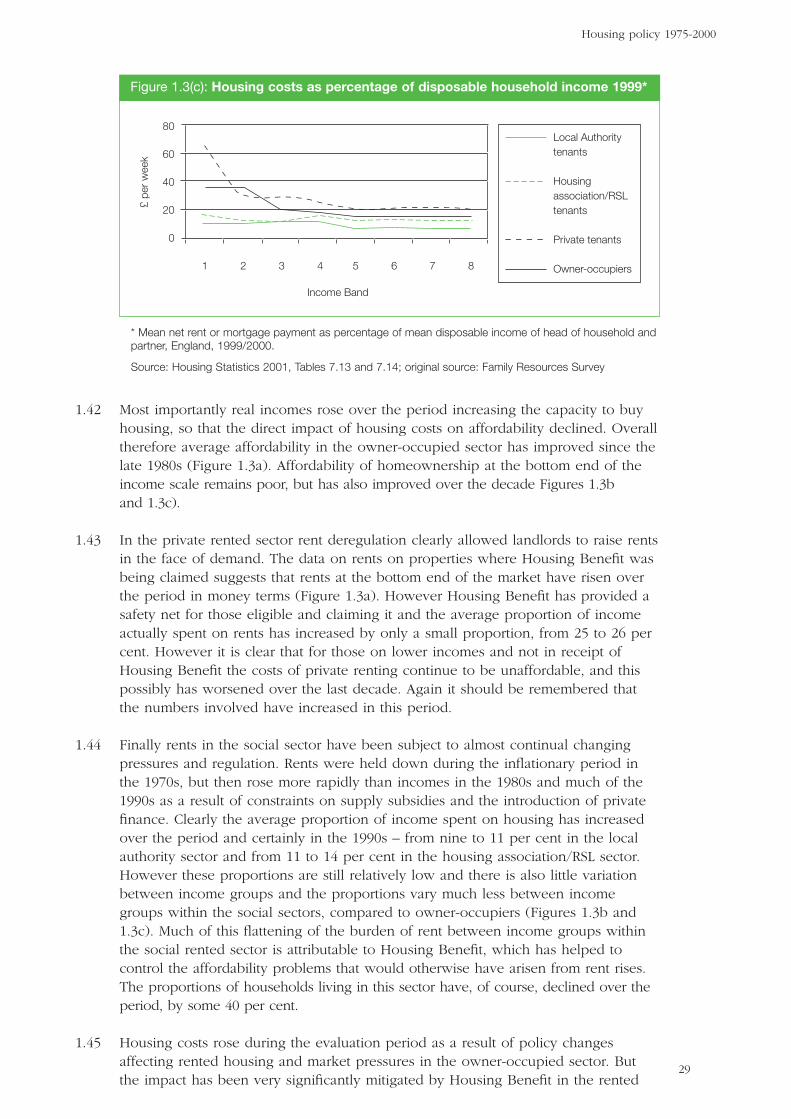
1.42 Most importantly real incomes rose over the period increasing the capacity to buyhousing, so that the direct impact of housing costs on affordability declined. Overalltherefore average affordability in the owner-occupied sector has improved since thelate 1980s (Figure 1.3a). Affordability of homeownership at the bottom end of theincome scale remains poor, but has also improved over the decade Figures 1.3b and 1.3c).
1.43 In the private rented sector rent deregulation clearly allowed landlords to raise rentsin the face of demand. The data on rents on properties where Housing Benefit wasbeing claimed suggests that rents at the bottom end of the market have risen overthe period in money terms (Figure 1.3a). However Housing Benefit has provided asafety net for those eligible and claiming it and the average proportion of incomeactually spent on rents has increased by only a small proportion, from 25 to 26 percent. However it is clear that for those on lower incomes and not in receipt ofHousing Benefit the costs of private renting continue to be unaffordable, and thispossibly has worsened over the last decade. Again it should be remembered thatthe numbers involved have increased in this period.
1.44 Finally rents in the social sector have been subject to almost continual changingpressures and regulation. Rents were held down during the inflationary period inthe 1970s, but then rose more rapidly than incomes in the 1980s and much of the1990s as a result of constraints on supply subsidies and the introduction of privatefinance. Clearly the average proportion of income spent on housing has increasedover the period and certainly in the 1990s – from nine to 11 per cent in the localauthority sector and from 11 to 14 per cent in the housing association/RSL sector.However these proportions are still relatively low and there is also little variationbetween income groups and the proportions vary much less between incomegroups within the social sectors, compared to owner-occupiers (Figures 1.3b and1.3c). Much of this flattening of the burden of rent between income groups withinthe social rented sector is attributable to Housing Benefit, which has helped tocontrol the affordability problems that would otherwise have arisen from rent rises.The proportions of households living in this sector have, of course, declined over theperiod, by some 40 per cent.
1.45 Housing costs rose during the evaluation period as a result of policy changesaffecting rented housing and market pressures in the owner-occupied sector. Butthe impact has been very significantly mitigated by Housing Benefit in the rented
80
60
40
20
0
Income Band
£ pe
r w
eek
1 2 3 4 5 6 7 8
Local Authoritytenants
Housing association/RSLtenants
Private tenants
Owner-occupiers
* Mean net rent or mortgage payment as percentage of mean disposable income of head of household andpartner, England, 1999/2000.
Source: Housing Statistics 2001, Tables 7.13 and 7.14; original source: Family Resources Survey
Figure 1.3(c): Housing costs as percentage of disposable household income 1999*
sectors and by falling nominal interest rates in the owner-occupied sector. Theproblems remaining at the end of the evaluation period are therefore those of accessto owner-occupied housing, for example where households face the full impact ofrising house prices especially in the south and those who suffer a decline in incomeafter they have made mortgage commitments. These households receive far less helpthan they would have done earlier in the period. Households in the rented sectorwhose incomes are limited, yet are too high to qualify for Housing Benefit also faceproblems. They include households in low-paid work who may also be subject to avery high marginal tax rate as a result of the withdrawal of Working (Families) TaxCredit. Others are single income households, particularly single person householdsfor whom the limits are tighter; and those who for one reason or another do notclaim the Housing Benefit for which they are eligible, or whose eligible rent hasbeen restricted. These groups are concentrated in the private rented sector and areamong those either just but riskily able or unable to enter owner-occupation. Bothhousing market and job market risks are concentrated among the same groups.
Lessons from the past, challenges for the future for housing policy: An evaluation of English housing policy 1975-2000
30
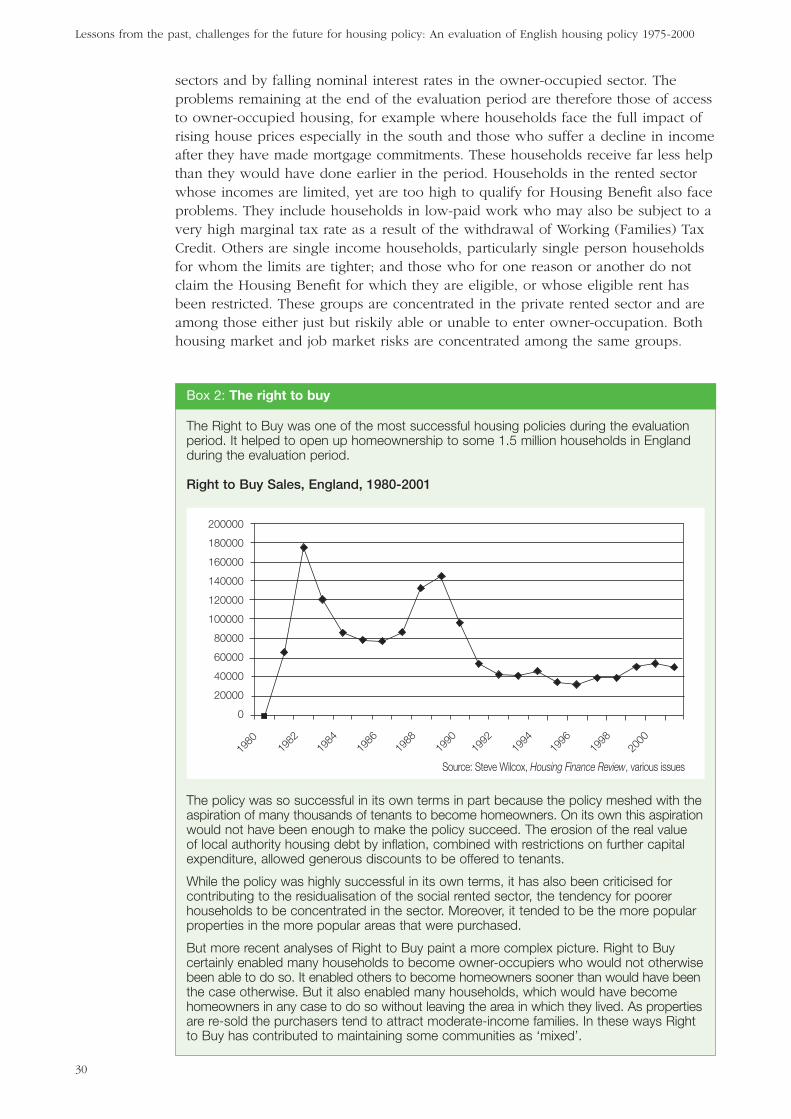
The Right to Buy was one of the most successful housing policies during the evaluationperiod. It helped to open up homeownership to some 1.5 million households in Englandduring the evaluation period.
Right to Buy Sales, England, 1980-2001
The policy was so successful in its own terms in part because the policy meshed with theaspiration of many thousands of tenants to become homeowners. On its own this aspirationwould not have been enough to make the policy succeed. The erosion of the real valueof local authority housing debt by inflation, combined with restrictions on further capitalexpenditure, allowed generous discounts to be offered to tenants.
While the policy was highly successful in its own terms, it has also been criticised forcontributing to the residualisation of the social rented sector, the tendency for poorerhouseholds to be concentrated in the sector. Moreover, it tended to be the more popularproperties in the more popular areas that were purchased.
But more recent analyses of Right to Buy paint a more complex picture. Right to Buycertainly enabled many households to become owner-occupiers who would not otherwisebeen able to do so. It enabled others to become homeowners sooner than would have beenthe case otherwise. But it also enabled many households, which would have becomehomeowners in any case to do so without leaving the area in which they lived. As propertiesare re-sold the purchasers tend to attract moderate-income families. In these ways Rightto Buy has contributed to maintaining some communities as ‘mixed’.
Box 2: The right to buy
200000
180000
160000
140000
120000
100000
80000
60000
40000
20000
0
1980
1982
1984
1986
1988
1990
1992
1994
1996
1998
2000
Source: Steve Wilcox, Housing Finance Review, various issues
LEGACY 3: TENURE POLARISATION
1.46 One of the key legacies of the evaluation period is the so-called ‘residualisation’ ofthe social rented sector. ‘Residualisation’ describes the tendency for the sector tohouse greater concentrations of the poorest and most disadvantaged households.
1.47 Residualisation has at least four contributory factors:
● A wider assessment of Right to Buy is explored in Box 2, but the exit from thesector of better off households who purchased their houses under the Right toBuy after 1980 was clearly a cause of residualisation.
● The Homeless Persons Act, which required local authorities to house certaingroups of homeless household from 1978, formed part of a process wherebylocal authorities’ allocation policies became increasingly professionalised,reducing or removing elected members’ direct involvement and placing greateremphasis on need above desert.
● Income and employment inequality grew. Those who were housed in the socialrented sector also became relatively poorer and less likely to be employed.
● Changes in the wider housing market, such as the decline in the private rentedsector, have squeezed out alternatives so that people with acute housing needshave been increasingly housed by local authorities and housing associations.
Residualisation is clearly demonstrated in the following graphs and tables.
1.48 Having adjusted for size, the British social rented sector houses much greaterconcentrations of households from the lowest income deciles compared to otherEuropean countries. Figure 1.4 confirms that the British social rented sector places amuch greater emphasis on its safety net role than the wider affordability role that itstill plays in other countries.
Housing policy 1975-2000
31
Great Britain 1998/99
France 1996
Netherlands 1998
Germany 1999
1
0.5
0
1.0
1.5
2.0
2.5
3.0
2 3 4 5 6 7 8 9 10
* 1 = lowest
Note: the % of households in each income decile is divided by the size of the social rented sector. So thatif 10% of people in the lowest income decile, and 10% of the housing stock is socially rented, the figure is1, the groups is neither over nor under-represented. Numbers > 1 represent over-representation and those<1 underrepresentation.
Source: Mark Stephens, Nicky Burns and Lisa MacKay (2002) Social Market or Safety Net? British SocialRented Housing in a European Context, Policy Press: Bristol
Figure 1.4: Representation of income groups* in social rented housing
1.49 The relative poverty of tenants in the British social rented sector can be demonstratedin two ways: by contrasting their incomes with households in other tenures and bycomparing their position with their counterparts in other countries (Table 1.3).
1.50 On each of these indicators the relatively low incomes of British social tenants isstriking. Whereas social renters in France, Germany, the Netherlands and Swedenhave incomes at least 70 per cent of the average, British social renters have lessthan half. For every pound that a tenant in these other countries has, an owner-occupier has between £1.50 and £1.70. In Britain for every £1 that a tenant has, anowner-occupier has £2.40.
1.51 This situation reflects two underlying differences: first, greater levels of incomeinequality in Britain and, second, greater concentrations of households from thelowest income deciles live in the British social rented sector. It is important torecognise, therefore, that residualisation in part reflects a greater commitment inBritain to house the most disadvantaged groups in the social rented sector. Theexclusion of such households from the tenure would have severe social consequences,and this provides a crucial dilemma for policy makers (see 2.59-2.64 below).
1.52 It is unsurprising that the British social rented sector also contains much greaterconcentrations of workless households, and the higher proportions of retiredhouseholds in the sector alone cannot explain this (Table 1.4). Whereas more than60 per cent of owner occupied households are headed by someone in full-timework, more than 60 per cent of local authority households have no one in work.
Lessons from the past, challenges for the future for housing policy: An evaluation of English housing policy 1975-2000
32
Owneroccupiers:
Social Ownerb Private All socialrenters occupiersb renters households renters
France (1996) 76.2 116.8b 82.4 100 1.5
Germany (1999) 76.7 120.6b 88.1 100 1.6
Great Britain (1997/98) 49.6 120.7b 74.9 100 2.4
Netherlands (1998) 72.2 123.0b 84.1 100 1.7
Sweden (1997) 76.5 132.7b 76.5 100 1.7
Table 1.3: Incomes as percentage of averagea
Notes:
a. After tax, except for France
b. The relatively high incomes for Swedish owner occupiers is misleading as ‘owner occupation’ is legallypossible only for those living in houses. De facto ownership of flats is possible for ‘co-operative owners’whose incomes are around the average.
Source: Stephens et al (2002), ibid.
LEGACY 4: CHOICE AND RISK
1.53 Another legacy arising from the interaction of policies with wider social andeconomic changes has been the expansion of choice and risk.
1.54 The deregulation of the financial sector undoubtedly did result in an expansion ofchoice at the expense of greater risk. In the 1970s the building societies enjoyed anear monopoly in the mortgage market and were able to set interest rates using astate-favoured cartel. The system was used to contain costs to home-owners, boththrough low interest rates and generous mortgage interest tax relief. Periodically, the Government made large loans to the building societies to enable them to avoidinterest rate rises. Access to mortgages was rationed through the use of queues andhighly conservative lending criteria, sometimes with direct and indirectdiscriminatory overtones.
1.55 Deregulation occurred progressively throughout the 1980s, a crucial event being theremoval of regulatory barriers that had kept banks out of the market. The erosion oftax advantages that had given the building societies a competitive advantage in thesavings market followed this. In turn the building societies were allowed to broadentheir activities and funding base as well as being able to convert into banks.
1.56 Competition in the mortgage market widened access to mortgage finance and toowner occupation. Applicants could borrow more in relation to their earnings, thesecond earner’s income was fully taken into account, and maximum loan to valueratios rose to 100 per cent or more. Formal ‘red lining’, the practice of refusing tolend on properties in areas that were perceived as being in decline, usually in theurban inner cities, came to an end.
Housing policy 1975-2000
33
OtherFull-time Part-time economically
% 2000/01 employment employment Unemployed Retired inactive
Owner occupiers 61.9 5.2 1.0 27.4 4.5
Social Renters 23.2 8.5 6.1 36.3 26.0
All households 53.5 6.2 2.4 27.7 10.2(including privaterenters)
Table 1.4a: Employment status of households heads by tenure
Source: Housing in England 2000/01, Table 1.8
Three% 2000/01 None One Two or more
Owner occupiers 27 28 36 9
Local authority tenants 62 24 10 3
All households 35 28 30 7
Table 1.4b: Number of earning members in households by tenure
Source: Housing in England 2000/01, Table 1.8
1.57 But deregulation also increased the risks facing owner-occupiers. By the early 1990s,borrowers were much more exposed to interest rate fluctuations, first becausemortgage rates became more responsive to changes in market rates, and seconddue to the gradual erosion of the insulation provided by mortgage interest tax relief,as house prices soared above the £30,000 limit. New borrowers were also morehighly geared, leaving them exposed to negative equity when nominal prices fell.The level of arrears and possessions in the early 1990s prompted a relatively limitedand short-term Government response. The Housing Market Package helped toreduce the levels of possessions, although long-term term the Government soughtto encourage owner-occupiers to take out private insurance policies.
1.58 In one important respect today’s owner-occupiers are better protected than theircounterparts in the early 1990s: they have more equity. But they are still moreexposed to interest rate fluctuations. In the early 1990s, mortgage interest tax reliefwould still absorb 15 per cent of any interest rate rise on the first £30,000 of theloan. That protection has now been removed. This affects the poorest home-ownersthe most relatively, as they are more likely to have smaller mortgages and mortgageinterest tax relief represented a greater contribution to their housing costs and totheir household income. Moreover, the coverage of the state safety net, IncomeSupport for Mortgage Interest, has been reduced since the mid-1990s, althoughtake-up of private insurance has widened. The new system of state protection hasnot been tested during a recession, only in the benign environment of falling orrelatively low interest rates, falling or low unemployment and generally rising houseprices. Although possessions have fallen to the lowest levels since the early 1980shomeowners face both more actual and latent risk than in the mid-1970s.
1.59 Financial deregulation is the clearest example of the choice-risk trade-off. Otherdistributions of choice and risk are more complex due to the role of the state. TheRight to Buy represented a unique blend of expanding choice for a particular groupat relatively low risk, thanks to the dowry in the form of the discount. The Right toBuy combined with much reduced provision of new social rented housing indicatedthat the Government had very much reduced its direct responsibility for meeting thehousing needs of ‘intermediate’ households.
1.60 However, during the evaluation period, the Government’s role as provider of safetynets actually increased. The Homeless Persons Act introduced at the start of theperiod undoubtedly increased the safety net, at least for some groups, and wasfurther though moderately strengthened towards the end of the period. To someextent the formal state safety net has replaced the informal safety net previouslyprovided by the bottom end of the private rented sector. But it is notable that theHomeless Persons Act provided a safety net for many former home-owning householdswho had their homes taken into possession in the 1990s recession. Indeed theyaccounted for some 10 per cent of acceptances at its worst.
1.61 The development of Housing Benefit also represented the strengthening of abottom-end safety net within the housing system, while providing less assistance tointermediate groups. The particular structure of Housing Benefit adopted after 1988mirrored a wider reform of social security. Its design was intended to preventincomes after rent falling below social assistance levels. In principle it also insulatesentirely many tenants from changes in their rent. The cost of Housing Benefitincreased especially in the private rented sector as rents rose. Measures to containits cost weakened Housing Benefit’s effectiveness as a safety net, especially in theprivate rented sector.
Lessons from the past, challenges for the future for housing policy: An evaluation of English housing policy 1975-2000
34

LEGACY 5: WEALTH AND REDISTRIBUTION
1.62 The shifts in public spending have had some important, though complex, impactson different income groups, and on people in different tenures.
1.63 First, for much of the period mortgage interest tax relief was a large, regressiveand reputedly ineffective element in the subsidy system. The abolition of top-raterelief and the gradual phasing out of mortgage interest tax relief was undoubtedlyprogressive in distributional terms. The main caveat is that when it was finallyabolished at the end of the period it met a higher proportion of poorer homeowners’interest payments and there has been no compensation for such households.
1.64 Second, the growth in owner occupation and the abolition of the main subsidy hasleft the majority of households outside the subsidy system, with the exception ofthe partial safety net provided by Income Support for Mortgage Interest. The growthof owner-occupation down the income scale means that many low-income householdsreceive no assistance with their housing costs. This can be seen as a breach ofhorizontal equity, since similarly poor renters would receive assistance with theirhousing costs through the Housing Benefit system. However, the inescapable factthat subsidies to home owners would assist them in the acquisition of a partiallyliquid and marketable asset remains an important consideration if the objective is tocreate fairness between renters and owners.
1.65 Third, the shift from bricks and mortar subsidies to demand-side subsidies wasprogressive, at least between tenants. But given the lack of income diversity amongthis group, the best that can be said that it was distributive from poor to very poor.However, since tenants are drawn disproportionately from the lowest income decilesand very few now come from middle income groups, the shift may have beengenerally regressive.
1.66 Fourth, the Right to Buy, although not strictly an expenditure programme, distributedhousing wealth from ‘society’ and future potential tenants to people who, as agroup, had below-average incomes. The growth of home-ownership has spreadwealth more widely, but this has worsened the relative position of non-owners.However, broader changes in the housing market have produced complex regional,inter-generational as well as income-related patterns of housing wealth. Althoughclass and income affect the size of gains among households who buy houses at thesame time, in the long-term the date of purchase is the most important determinantof capital gains.
Housing policy 1975-2000
35

1.67 During the evaluation period the distribution of wealth as well as income becamemore unequal. However, the spread of home-ownership has slowed the growth inwealth inequality (Figure 1.5). Without housing the wealthiest 1 per cent saw theirshare of wealth grow by 14 per cent, but once housing is included their share grewby 9.5 per cent. This pattern occurs throughout the wealthiest 50 per cent whoseshare of wealth without housing grew by 10 per cent, but whose share grew by only3 per cent once housing is included. This reflects the spread of home-ownershipbelow the wealthiest 50 per cent of the population. Inevitably these patterns also implythat those households excluded from home-ownership have been left further behind.
LEGACY 6: HOUSING QUALITY AND ACCEPTABILITY
1.68 Rising aspirations is a key reason why, as Theme Report 3 concluded acceptablehousing quality represents a relative and upward moving standard. Objectives ofsecuring basic amenities such as inside toilets were followed by greater attentionpaid to securing central heating, and have been supplemented by the need to meetinsulation standards to achieve environmental objectives.
1.69 Over the evaluation period, there has been a growing interest in developing regulationsand other incentives to improve the standards of new housing – particularly withrespect to energy conservation and lifetime homes. Equally, land use planning haslatterly shifted towards increasing densities and the re-use of brownfield sites. SirJohn Egan’s report sought to improve quality and productivity in the constructionindustry and has been instrumental in changing public sector procurement. The impactshave again been fairly successful in their own terms although there is thought tohave been some negative impact on levels of output and in regulatory costs.
1.70 However the proportion of the total stock that can be directly affected by changingregulation of new housing is tiny as compared to the problems of maintaining andupgrading the existing stock.
Lessons from the past, challenges for the future for housing policy: An evaluation of English housing policy 1975-2000
36
% in
crea
se in
sha
re o
f wea
lth
Wealth
Wealth including housing
Most wealthy %
1
5
0
10
15
20
25
30
5 10 25 50
Note: figures refer to marketable wealth, which excludes pension rights.
Source: Inland Revenue
Figure 1.5: Percentage changes in share of wealth 1976-2001
1.71 Improvement grants played a major role in upgrading older private sector housingin the earlier part of the evaluation period, although their impact was weakened inthe private rented sector by rent controls. Proportionately, the private rented sectorrepresents the poorest quality and governments are now wary of attempting toimprove this stock by imposing higher regulatory standards for fear of choking offsupply. While generally highest standards are found in the owner-occupied sector,its growth to such a dominant position within the housing system mean that thelargest numbers of sub-standard housing units are to be found in this sector.
1.72 The theme report found that while standards in local authority housing had improved,the performance of the sector should probably have been better given the relativelyhigh levels of expenditure. However, poor and non-traditional construction methodshave also contributed to a legacy of unacceptability in the local authority sector.
1.73 Until the late 1990s large scale voluntary transfers were concentrated on the southand on social sector stock that was anyway in general in reasonable repair. Constraintson local authority subsidy and the concentration of new social supply in housingassociations left a legacy of increased concentrations of housing quality problemsin the declining local authority sector, particularly in London and the north.
LEGACY 7: REGIONS AND NEIGHBOURHOODS
1.74 Over the evaluation period, there was a growth in both inter and intra-regionaldifferences, reflecting the diversity of economic experience, as some regions haveoutperformed others, and across the country some groups have fared better than others.
1.75 At a regional level, the main manifestation in the housing market is the relativescarcity of housing which is reflected in differing rates of house price inflation.Regional differences between house prices and their trend have a marked cyclicalpattern, widening during periods of economic growth (such as the late 1980s andin recent years) and narrowing during recessions (notably the early 1990s). Theunderlying cause is the differing economic performance of different regions that inturn impacts on population location and dynamics. The inadequate housing supplyin high growth areas has brought concerns that this might inhibit economic growthas private sector firms are unable to recruit workers, although official concern hastended to centre on ‘key’ public sector workers.
1.76 Meanwhile other regions have experienced apparent housing surpluses. Not onlydo such regional imbalances imply a need for different priorities, they mean that theimpact of some nation-wide policies, notably as the homelessness legislation, variesaccording to the relative shortage of housing.
1.77 Growing tenure polarisation has been a much-emphasised phenomenon over theevaluation period, but it is its manifestation as spatial polarisation that appears tohave the greatest social consequences. Hence the way in which the emphasis ofneighbourhood renewal has shifted from improving the physical quality of housesto improving the neighbourhood and the social and economic opportunities withinit. While tenure is a good predictor of these spatial inequalities, it is not exclusivelyso, the emergence of hard-to-sell owner-occupied properties in some urban areasbeing the prime indicator of this. Equally, housing associations have been seen asmajor partners in developing improvement and regeneration programmes.
Housing policy 1975-2000
37
1.78 One of the key lessons of the evaluation period arises from the inability ofneighbourhood policies in the social or private sectors to ‘swim against the tide’.Faced with unfavourable socio-economic trends former Housing Action Areas wherethe physical standard of private housing was improved in the expectation that theareas would in turn become sustainable are now often the same areas that now facelow demand. Similarly, attempts to revive areas dominated by social rented housinghave also left a legacy of policies that were better able to tackle the physicalmanifestations of deprivation than its underlying causes. Consequently a key legacyof the evaluation period is the much greater importance attached the neighbourhoodwhen assessing housing quality than was the case 25 years ago.
Conclusions1.79 Many housing policies have been successful when judged in their own terms. Over
the evaluation period as a whole access to owner-occupation and to private rentinghas increased and in many parts of the country and social renting is reasonablyavailable. Affordability has been maintained for the vast majority of householdsdespite the reduction in and restructuring of subsidies. All of this has been against abackground of ownership restructuring and increasing partnership in developmentand regeneration.
1.80 Some emerging housing problems arise from privatisation as risks have been shiftedfrom government to households. Others arise from the limited availability of socialrented housing in high demand areas. But the most fundamental failures arise fromregulation, particularly concerning the land use planning system, as well as theconstraints placed on local government.
1.81 An important implication of this evidence is that, while many housing specificproblems were effectively addressed, the wider role of housing both in terms ofneighbourhood change and sustainability and in terms of the interaction of housingand the wider economy have been slow to be recognised. This helps to provide aclear rationale for the shifts in policy that have been observed over the last fewyears. These issues are discussed in the next section.
Lessons from the past, challenges for the future for housing policy: An evaluation of English housing policy 1975-2000
38

SECTION 2
Housing policy today
Introduction2.1 The Government is faced with seven broad areas where the housing system is not
meeting key objectives:
● Supply mechanisms are not providing sufficient amounts of new housing, forthe market, intermediate (‘affordable’) or social rented sectors. In particular theprivate sector has not filled the gap left by the limitation on supply subsidies tosupport the provision of social rented housing.
● The deregulated finance market combines with a highly regulated land marketto produce housing market instability. In turn the unstable housing market canexacerbate macro-economic instability and affect competitiveness. On the otherhand a flexible housing sector can make macro-economic policies more effective,for example by facilitating mobility.
● Social sector tenants in high demand areas can usually only obtain accommodationor move when presenting with specific and serious housing needs and aregenerally unable to exert consumer preferences.
● The management of the social rented sector is increasingly complex as it becomesmore closely linked with wider neighbourhood management objectives, suchas tackling crime and anti-social behaviour. It is also open to greater risks as ittakes on different responsibilities and is more dependent on private financewhile at the same time facing greater regulation.
● There are growing concerns about the viability of deprived neighbourhoodsacross the country but particularly in low demand areas, as well as about theacceptability of traditional social rented housing to those who have otherhousing options.
● The housing needs of some groups, including particularly larger Black andMinority Ethnic (BME) households and those in need of residentially-basedsupport, are not being met by general housing policies.
● Disrepair persists in parts of all sectors, together with inadequate renovationprogrammes to maintain properties in effective use. The capacity to modifyexisting stock particularly with respect to insulation to meet broader environmentalrequirements is an important element in this context.
2.2 These deficiencies are widely recognised and much of current housing policy isdirected at tackling them. A comprehensive review of current housing policy is notattempted here. Instead, current policies aimed at meeting the following five broadobjectives are examined:
39

● To ensure that there is an adequate supply of new housing.
● To ensure that the housing system contributes to achieving economic objectives.
● To create greater choice within the social rented sector.
● To create sustainable communities and support people.
● To ensure decent homes and neighbourhoods across all sectors and housingacceptable to the next generation.
Adequate supply
THE GOVERNMENT’S OBJECTIVES
2.3 The fundamental objective of housing policy is to provide enough homes for everyhousehold through the general market, the intermediate market (that includes‘affordable’ housing, shared ownership and key worker housing), as well as the socialrented sector. This objective is intimately linked to the objective of ensuring thathousing is affordable and that house prices do not adversely affect the wider economy.
2.4 Since the removal of general housing shortages in the 1970s, the supply questionhas become more complex. Variations between regions mean that any additionaldwelling is no longer necessarily desirable. Within the south of the country thereare severe access and affordability problems. Despite national policy, planningpolicies are not providing sufficient numbers of new houses. But in parts of someother areas there is a clear excess of housing, although this is often linked to poorquality. Every year some stock becomes obsolete due to deterioration or changingneeds and standards. Demolition, renovation and adaptation are also features ofsupply policy.
2.5 Nevertheless, most importance has been attached to increasing supply responsivenessbecause this is absolutely necessary if economic competitiveness is to be maintained.It is also widely recognised that this must occur in the areas where the demand isstrongest and constraints greatest. To this end Kate Barker’s Review of HousingSupply has reported recently.
POLICY INSTRUMENTS
2.6 The main policy instruments are embedded in the land use planning system,which aims to ensure adequate provision of land for identified housing requirements.Problems of inflexibility in the planning system are being addressed through a rangeof different policy approaches, particularly through the restructuring of regionalgovernance and the relationship between regional and local government. Recentinitiatives include: changes in the Government’s guidance to local authorities(Planning Policy Guidance 3: Housing) to increase transparency and reduce delaysin planning applications; new planning legislation; and more fundamental reviewsof regulatory and supply issues.
Lessons from the past, challenges for the future for housing policy: An evaluation of English housing policy 1975-2000
40
2.7 The current policy on provision of affordable housing through the planning systemoperates through Section 106 of the Planning and Compensation Act 1991. It hasthree distinct objectives, that of providing the land for affordable housing; providingmixed communities and a mix of affordable housing appropriate to the area; andincreasing financial contributions, implicit and explicit, from developers and otherstakeholders. Again this is an area where changes in the planning guidance arecurrently out for consultation.
2.8 Other polices include the requirement, initially made as a statement by the DeputyPrime Minister, for 60 per cent of new development to take place on ‘brownfield’land. This affects local authorities’ capacity to provide additional housing onidentified land.
2.9 Fundamental to the provision of affordable housing is the grant regime. This is nowmainly concentrated in the Housing Corporation’s Approved Development Plan andaims to ensure that a range of affordable housing is provided through housingassociations. In recent years total output has been around 20-22,000 units, about80 per cent of which are for rent. Changes in the procedures for grant allocationare supporting broader based planning at sub-regional and regional level. Specificinitiatives, such as the Housing Corporation’s Challenge Fund, provide mechanismsto allocate resources in line with government priorities, including the stimulation ofoff-site production.
Growth Areas2.10 The vision of expanding production through the regeneration of lower demand
areas within the South East (notably the Thames Gateway), and ensuring sustainablecommunities is clearly enunciated. The capacity to implement the policy within areasonable timeframe is still to be demonstrated. These areas require large-scaleinfrastructure provision and community amenities before the vision can be achieved,and these have yet to be put in place. Land assembly is also a problem even wheremuch of the land is in public ownership. Moreover the commitment to rapid expansionputs pressure on the types of dwelling that can be provided and has resulted insudden shifts in implementation requirements particularly to Registered SocialLandlords, which are themselves costly. More generally, although the objectiveis greater certainty, the process of achieving this generates its own uncertainties,which in turn reduce supply.
Environmental vs. supply trade-offs2.11 There are important trade-offs between the objectives of maintaining existing assets
in use and reusing urban land at the same time as making sure that the full range ofhousing is available to meet the requirements of increasing incomes and aspirationseven in low demand areas. Whether this will be achieved within the currentframework depends heavily on ensuring that the urban agenda goes with the grainof housing demand. If not, there could be increasing polarisation even within thesenewly developed areas.
2.12 A more general issue relates to the incentives and constraints associated withsustainability and particularly energy use and the relationship between housing andtransport. This is an area where the UK has much to learn from other countries, notleast in making regulation more outcome-oriented.
Housing policy today
41
Affordable housing through the planning system2.13 The most recent evidence on the provision of affordable housing through the
planning system suggests that the proportion of affordable housing being achievedin this way is now increasing with new building. It also indicates that the vastmajority of the housing provided also requires subsidy through the ApprovedDevelopment Programme. It is clear therefore that this is not a pot of gold that willprovide the necessary resources to meet the shortfall in public subsidy – especiallywhere large-scale infrastructure is also required to make the development sustainable.Moreover in many areas, including the Midlands and the North, there is little or noscope for extracting contributions from developers towards affordable housing, onceother requirements, such as infrastructure, are taken into account. The pressures tomaximise affordable proportions may also reduce supply especially in areas wherethere is an alternative land use. Further it generates some perverse incentives toproduce smaller units and flats which may not address the requirements of those inthe greatest need. Higher quality planning and design are fundamental to achievingthe Government’s vision.
2.14 Thus while the objectives of policy change are clear – and do address the legaciesof the evaluation period, there is as yet no evidence that the policy changes currentlybeing implemented will enable them to be met. This applies to total output, the mixof dwellings provided, their location and their sustainability. Indeed at the presenttime the supply response seems to be continuing to decline. The incentives that theBarker Review identified as discouraging local planning authorities from releasingsufficient land remain in place, while levels of subsidised building remain low byhistoric standards. Structural changes in construction and infrastructure provision(widely defined) and regulatory changes are prerequisites for achieving a moreflexible supply of housing of all types. However, it is equally the macro economyand in particular the allocation of public funding for affordable housing and forinfrastructure which will determine the success of current policy with respect tonew build.
Housing and economic objectives2.15 The functioning of the housing system has become a key concern of the Treasury
because of its links with the labour market and its importance to economicmanagement. High levels of worklessness among tenants in the social rented sector,and low levels of inter-regional mobility, have been identified as arising in part fromthe operation of the housing system. The housing system has become part of theGovernment’s ‘employment opportunity for all’ agenda and policies formulated toimprove mobility in the social rented sector, and to reduce the work disincentivesarising from Housing Benefit. The Treasury is also concerned that volatility in thehousing market feeds through into instability in the wider economy. This concernpromoted the Treasury to establish two reviews, one to examine the mortgagemarket and the other the supply of housing.
Lessons from the past, challenges for the future for housing policy: An evaluation of English housing policy 1975-2000
42

(a) Employment opportunity for all
THE GOVERNMENT’S OBJECTIVES
2.16 The 2003 Budget Report identified worklessness as ‘a constraint on the economy’sgrowth potential and a major cause of poverty’. The Government aims to increaseemployment levels to the highest levels ever experienced by 2010.
2.17 In recent years, the UK has experienced the lowest unemployment for a quarter ofa century and now compares favourably with other large economies. But we haveseen that one of the key legacies of the last 25 years has been the polarisationbetween dual earner households and no earner households. The UK compares muchless favourably internationally in this regard, especially when set alongside relativelylow levels of unemployment and relatively high levels of employment. Moreover,labour market polarisation has combined with changes in the housing system sothat there is now a large overlap between labour market and tenure polarisation.
2.18 Although the relationship between tenure and employment is very striking, it is verydifficult to establish a ‘tenure effect’ in operation – in other words whether characteristicsof any tenure make people more or less inclined or able to find employment. Evidencesuggests that the prime driver has been general labour market trends, combined withthe impact that Right to Buy had by removing economically active households fromthe social sector. Employment rates among local authority sitting tenant purchasersin 1991 were much higher than among remaining local authority tenants. The peoplenow housed in the social rented sector possess disproportionately the characteristics(such as low skill levels and poor health) that make them vulnerable to worklessness.However, labour market economists remain divided as to the extent to whichsolutions should focus on particular areas with high unemployment or on groupswith poor employment records.
2.19 However, the Government has identified two elements in the housing system that it believes act as a barrier to work:
● work disincentives that may arise from the Housing Benefit system;
● barriers to geographical mobility.
POLICY INSTRUMENTS
2.20 In order to achieve this objective, the Government has put into place a series ofmeasures. These include a series of active labour market policies, such as the NewDeals, as well as the improvement of financial incentives to work (‘making workpay’): the minimum wage, the reform of National Insurance, and the WorkingFamilies Tax Credit (1999-2003)/Working Tax Credit (from April 2003).
2.21 The Government is planning to reform aspects of the housing system to help toachieve its employment objectives.
Housing policy today
43
Housing Benefit and work incentives2.22 Housing Benefit was originally introduced in part to encourage work incentives –
by supplementing low incomes especially in high rent areas. However, the systemof Housing Benefit introduced in 1988 had two features that may create disincentivesto work. First, it pays the whole of the claimant’s eligible rent when their incomefalls to income support levels. Second it has a high rate of withdrawal – as take-homepay rises, Housing Benefit is withdrawn at 65 pence in the pound. When combinedwith the loss of other means-tested assistance, withdrawal rates can rise to 85 pencein the pound. This system can be characterised as providing a safety net for verypoor households, and limited help with housing affordability for some householdsin low paid work. However, it can penalise a move into work (the unemploymenttrap) and discourage people in low paid work from increasing their earnings (thepoverty trap). Moreover, as rules restricting eligible rents, especially in the privaterented sector, have toughened, the system fails to provide an effective safety net.Hence it can be characterised as falling between two stools – neither providing aneffective safety net for many households nor being an effective in-work benefit to‘make work pay’. Yet the balance between the desire to protect the incomes of thepoorest while providing incentives to work would be encountered in the design ofall but the most extravagant housing allowance system.
2.23 Evidence of the impact of Housing Benefit (and other means-tested benefits) onwork disincentives is less easy to establish than the ‘text book’ case outlined above.Factors such as ignorance of the system on the part of claimants, the overridingcommitment to the work ethic, or the acceptance of a low paid job as a pathwayto a better one may each play a role. Nevertheless, the loss of housing assistanceis cited frequently by claimants as a reason for not taking employment. Concernsabout sorting out benefits at the point of transition to work and reclaiming benefitshould the job be lost are also cited by a minority of claimants as reasons for nottaking jobs.
2.24 The Housing Benefit Pathfinder pilot projects aim to tackle this problem by allowingpeople who return to work to have their Housing Benefit claim reassessed as achange in circumstances, rather than having to make a new claim. The importanceof such apparently minor administrative measures should not be underestimated, atleast for some people.
Flat-rate Housing Benefit2.25 The Government is currently running pilot projects (Pathfinders) whereby claimants
in the private rented sector are given a standard housing allowance based on localmarket rents in the locality. In the 2003 Budget Report the Government announcedits intention to extend this system to all private tenants across the country ‘as soonas possible’ and to the tenants in the social rented sector, once rent restructuringand choice based lettings have been introduced.
2.26 The system being piloted effectively standardises the eligible rent in the HousingBenefit system within localities. As such it gives a clearer signal to tenants inadvance of their claim as to the maximum rent that Housing Benefit will meet. Itmay therefore provide a shopping incentive for some prospective tenants to limittheir housing costs. However, it does not alter the relationship between HousingBenefit and income: it remains a means-tested benefit that will be withdrawn asincome rises. Hence, it is difficult to see how this reform will help to meet thegovernment’s objective of ‘making work pay’.
Lessons from the past, challenges for the future for housing policy: An evaluation of English housing policy 1975-2000
44
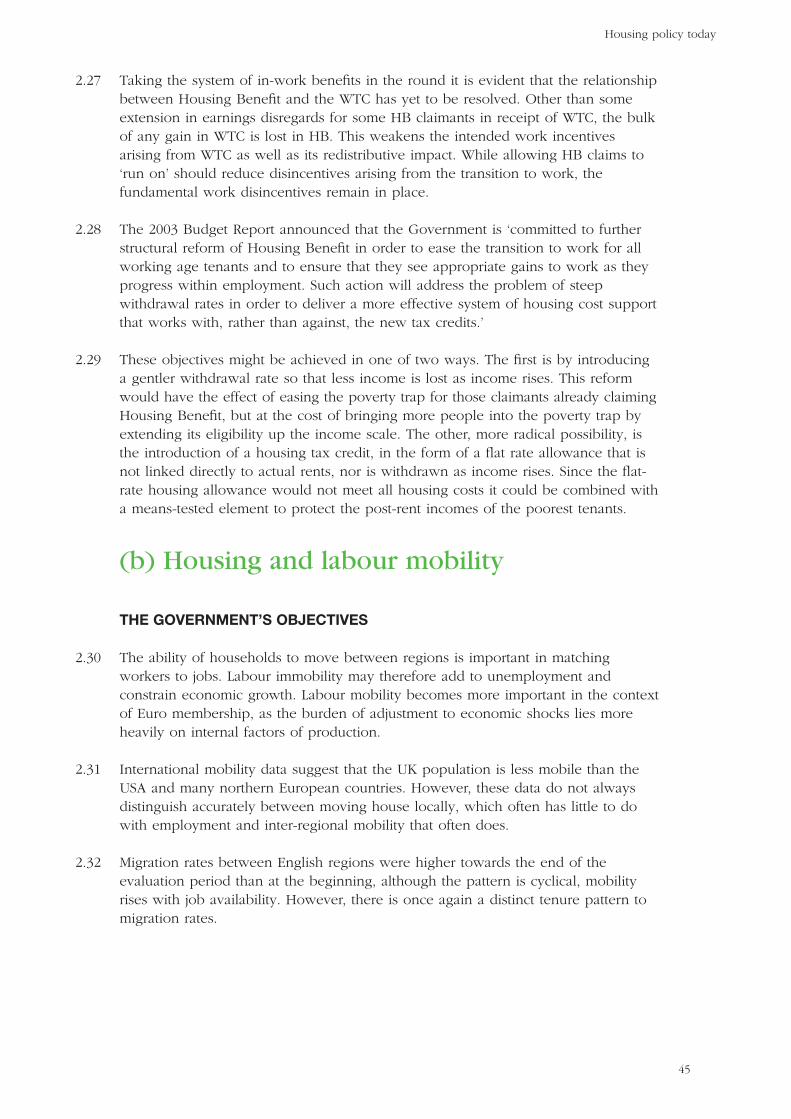
2.27 Taking the system of in-work benefits in the round it is evident that the relationshipbetween Housing Benefit and the WTC has yet to be resolved. Other than someextension in earnings disregards for some HB claimants in receipt of WTC, the bulkof any gain in WTC is lost in HB. This weakens the intended work incentivesarising from WTC as well as its redistributive impact. While allowing HB claims to‘run on’ should reduce disincentives arising from the transition to work, thefundamental work disincentives remain in place.
2.28 The 2003 Budget Report announced that the Government is ‘committed to furtherstructural reform of Housing Benefit in order to ease the transition to work for allworking age tenants and to ensure that they see appropriate gains to work as theyprogress within employment. Such action will address the problem of steepwithdrawal rates in order to deliver a more effective system of housing cost supportthat works with, rather than against, the new tax credits.’
2.29 These objectives might be achieved in one of two ways. The first is by introducinga gentler withdrawal rate so that less income is lost as income rises. This reformwould have the effect of easing the poverty trap for those claimants already claimingHousing Benefit, but at the cost of bringing more people into the poverty trap byextending its eligibility up the income scale. The other, more radical possibility, isthe introduction of a housing tax credit, in the form of a flat rate allowance that isnot linked directly to actual rents, nor is withdrawn as income rises. Since the flat-rate housing allowance would not meet all housing costs it could be combined witha means-tested element to protect the post-rent incomes of the poorest tenants.
(b) Housing and labour mobility
THE GOVERNMENT’S OBJECTIVES
2.30 The ability of households to move between regions is important in matchingworkers to jobs. Labour immobility may therefore add to unemployment andconstrain economic growth. Labour mobility becomes more important in the contextof Euro membership, as the burden of adjustment to economic shocks lies moreheavily on internal factors of production.
2.31 International mobility data suggest that the UK population is less mobile than theUSA and many northern European countries. However, these data do not alwaysdistinguish accurately between moving house locally, which often has little to dowith employment and inter-regional mobility that often does.
2.32 Migration rates between English regions were higher towards the end of theevaluation period than at the beginning, although the pattern is cyclical, mobilityrises with job availability. However, there is once again a distinct tenure pattern tomigration rates.
Housing policy today
45

2.33 These data, which show the highest levels of inter-regional mobility among privaterenters and the lowest among local authority tenants, have led to claims that thereis a tenure effect. In other words, there are aspects of the housing system that act asa barrier to mobility, and hence to the restriction of employment opportunities.
2.34 For example, the locally-based nature of social housing allocations and its allocationprimarily on the basis of need seem likely to deter inter-regional mobility. Morerecently attention has focused on the owner-occupied sector, and one commentatorhas claimed that rising levels of owner occupation have contributed to higherunemployment by deterring mobility. Evidence in support of this conjecture is weak,as well as being counter-intuitive, owner occupation having grown largely at theexpense of social renting over the past two decades. Indeed some evidence suggeststhat the Right to Buy has in part facilitated rising mobility levels among manualoccupational groups. More broadly, transaction costs for British owner-occupiers arelower than in many other European countries, and transaction levels higher.
2.35 However, there is evidence that mobility rates are higher out of high price areasthan in to them, and high house prices (or indeed rents) act as a barrier to mobility.This will be particularly problematic, as differences in regional house prices aregreatest at the very point where jobs are being created in the high-price areas.Further specific rigidities will also be created within pockets of declining and lowdemand, where people find it hard to sell and move on.
2.36 Generally, as with employment it is difficult to detect the direction of causation. Inother words, people may choose to be private renters because they wish to bemobile, or choose to be owner-occupiers because mobility is less important to them.Age and household structure are also reflected in association with the importancethat a household attaches to its mobility. Moreover, tenure correlates well withoccupational class, which in turn is linked to mobility: professional jobs marketsand their recruitment tend to be national, whereas unskilled job markets tend to belocal and vacancies are often filled by word of mouth.
Lessons from the past, challenges for the future for housing policy: An evaluation of English housing policy 1975-2000
46
Moves per thousandhouseholds betweenregions 1973-81 1984-91 1993-95 1996-98
Owner 0.78 0.58 0.57 0.75
LA tenant 0.26 0.29 0.67 0.56
RSL tenant 1.19 0.56 1.92 1.07
Private tenant 3.01 2.43 4.66 7.65
All 0.92 0.66 0.98 1.47
Table 2.1: Migration rates per annum in England, by tenure 1973-98
Source: Nick Donovan, Tony Pilch & Tracy Rubenstein (2002), Geographic Mobility, Cabinet Office Performance& Innovation Unit, p.8
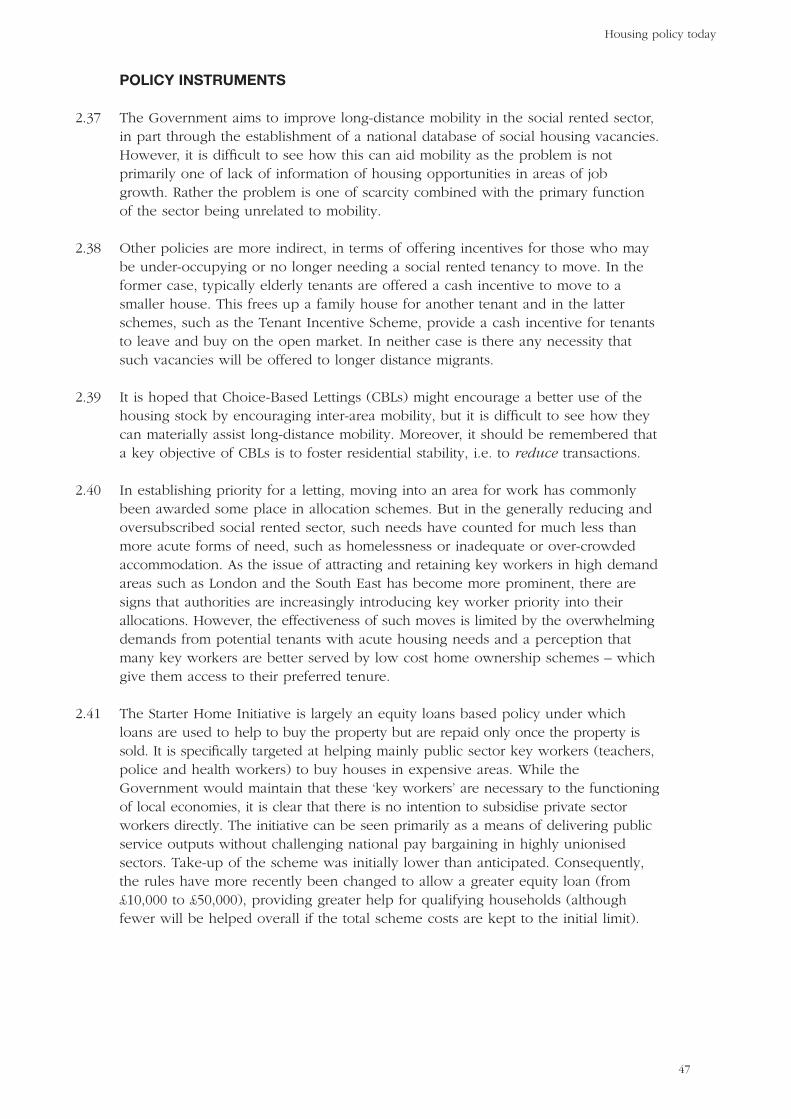
POLICY INSTRUMENTS
2.37 The Government aims to improve long-distance mobility in the social rented sector,in part through the establishment of a national database of social housing vacancies.However, it is difficult to see how this can aid mobility as the problem is notprimarily one of lack of information of housing opportunities in areas of jobgrowth. Rather the problem is one of scarcity combined with the primary functionof the sector being unrelated to mobility.
2.38 Other policies are more indirect, in terms of offering incentives for those who maybe under-occupying or no longer needing a social rented tenancy to move. In theformer case, typically elderly tenants are offered a cash incentive to move to asmaller house. This frees up a family house for another tenant and in the latterschemes, such as the Tenant Incentive Scheme, provide a cash incentive for tenantsto leave and buy on the open market. In neither case is there any necessity thatsuch vacancies will be offered to longer distance migrants.
2.39 It is hoped that Choice-Based Lettings (CBLs) might encourage a better use of thehousing stock by encouraging inter-area mobility, but it is difficult to see how theycan materially assist long-distance mobility. Moreover, it should be remembered thata key objective of CBLs is to foster residential stability, i.e. to reduce transactions.
2.40 In establishing priority for a letting, moving into an area for work has commonlybeen awarded some place in allocation schemes. But in the generally reducing andoversubscribed social rented sector, such needs have counted for much less thanmore acute forms of need, such as homelessness or inadequate or over-crowdedaccommodation. As the issue of attracting and retaining key workers in high demandareas such as London and the South East has become more prominent, there aresigns that authorities are increasingly introducing key worker priority into theirallocations. However, the effectiveness of such moves is limited by the overwhelmingdemands from potential tenants with acute housing needs and a perception thatmany key workers are better served by low cost home ownership schemes – whichgive them access to their preferred tenure.
2.41 The Starter Home Initiative is largely an equity loans based policy under whichloans are used to help to buy the property but are repaid only once the property issold. It is specifically targeted at helping mainly public sector key workers (teachers,police and health workers) to buy houses in expensive areas. While theGovernment would maintain that these ‘key workers’ are necessary to the functioningof local economies, it is clear that there is no intention to subsidise private sectorworkers directly. The initiative can be seen primarily as a means of delivering publicservice outputs without challenging national pay bargaining in highly unionisedsectors. Take-up of the scheme was initially lower than anticipated. Consequently,the rules have more recently been changed to allow a greater equity loan (from£10,000 to £50,000), providing greater help for qualifying households (althoughfewer will be helped overall if the total scheme costs are kept to the initial limit).
Housing policy today
47
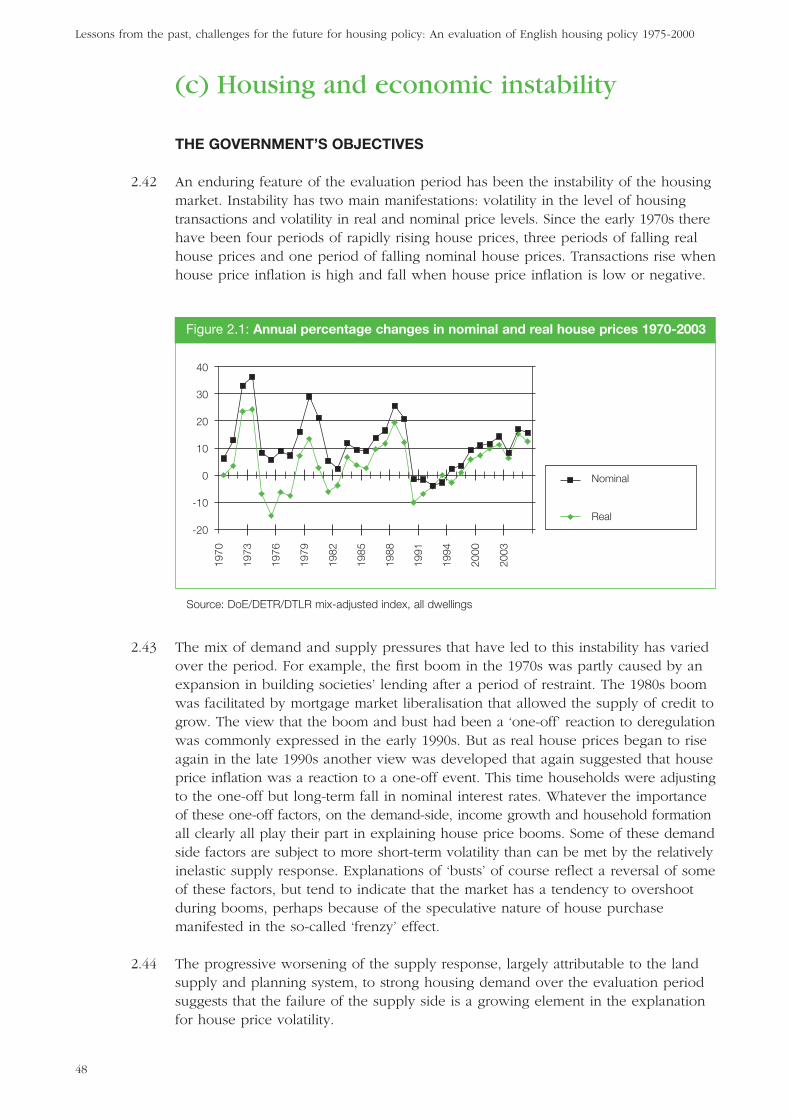
(c) Housing and economic instability
THE GOVERNMENT’S OBJECTIVES
2.42 An enduring feature of the evaluation period has been the instability of the housingmarket. Instability has two main manifestations: volatility in the level of housingtransactions and volatility in real and nominal price levels. Since the early 1970s therehave been four periods of rapidly rising house prices, three periods of falling realhouse prices and one period of falling nominal house prices. Transactions rise whenhouse price inflation is high and fall when house price inflation is low or negative.
2.43 The mix of demand and supply pressures that have led to this instability has variedover the period. For example, the first boom in the 1970s was partly caused by anexpansion in building societies’ lending after a period of restraint. The 1980s boomwas facilitated by mortgage market liberalisation that allowed the supply of credit togrow. The view that the boom and bust had been a ‘one-off’ reaction to deregulationwas commonly expressed in the early 1990s. But as real house prices began to riseagain in the late 1990s another view was developed that again suggested that houseprice inflation was a reaction to a one-off event. This time households were adjustingto the one-off but long-term fall in nominal interest rates. Whatever the importanceof these one-off factors, on the demand-side, income growth and household formationall clearly all play their part in explaining house price booms. Some of these demandside factors are subject to more short-term volatility than can be met by the relativelyinelastic supply response. Explanations of ‘busts’ of course reflect a reversal of someof these factors, but tend to indicate that the market has a tendency to overshootduring booms, perhaps because of the speculative nature of house purchasemanifested in the so-called ‘frenzy’ effect.
2.44 The progressive worsening of the supply response, largely attributable to the landsupply and planning system, to strong housing demand over the evaluation periodsuggests that the failure of the supply side is a growing element in the explanationfor house price volatility.
Lessons from the past, challenges for the future for housing policy: An evaluation of English housing policy 1975-2000
48
Nominal
Real
1970
1973
1976
1979
1982
1985
1988
1991
1994
2000
2003
-10
-20
0
10
20
30
40
Source: DoE/DETR/DTLR mix-adjusted index, all dwellings
Figure 2.1: Annual percentage changes in nominal and real house prices 1970-2003
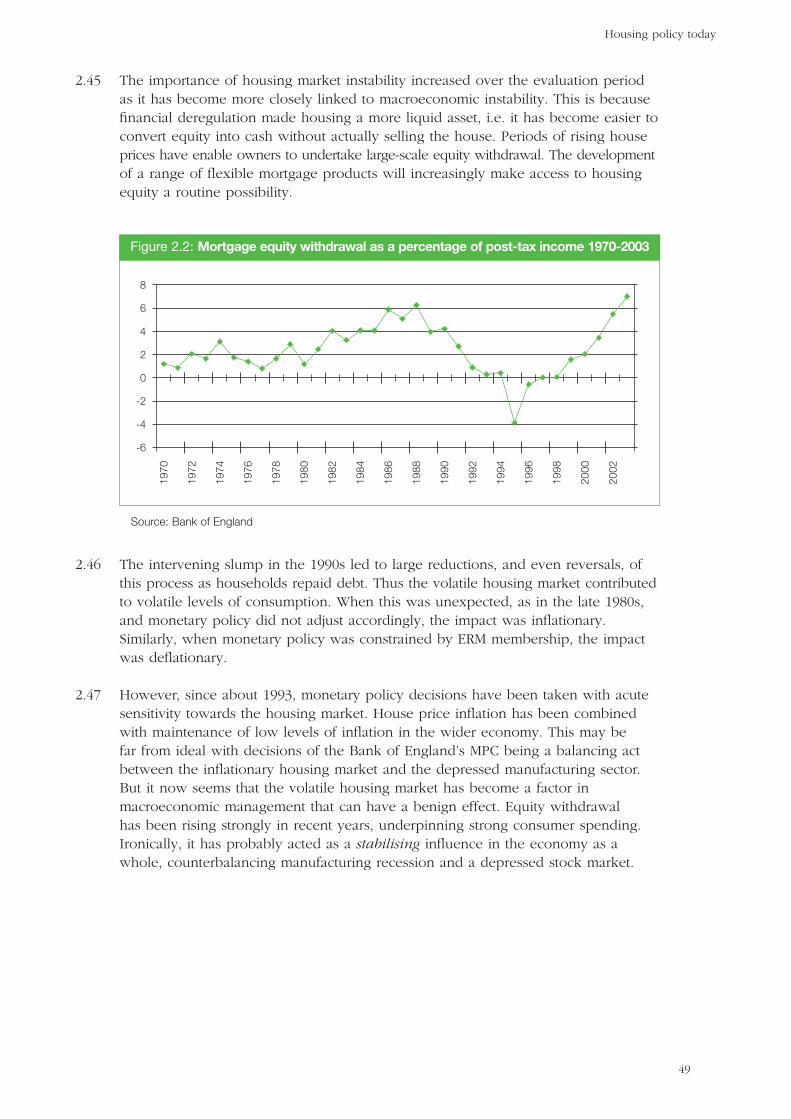
2.45 The importance of housing market instability increased over the evaluation periodas it has become more closely linked to macroeconomic instability. This is becausefinancial deregulation made housing a more liquid asset, i.e. it has become easier toconvert equity into cash without actually selling the house. Periods of rising houseprices have enable owners to undertake large-scale equity withdrawal. The developmentof a range of flexible mortgage products will increasingly make access to housingequity a routine possibility.
2.46 The intervening slump in the 1990s led to large reductions, and even reversals, ofthis process as households repaid debt. Thus the volatile housing market contributedto volatile levels of consumption. When this was unexpected, as in the late 1980s,and monetary policy did not adjust accordingly, the impact was inflationary.Similarly, when monetary policy was constrained by ERM membership, the impactwas deflationary.
2.47 However, since about 1993, monetary policy decisions have been taken with acutesensitivity towards the housing market. House price inflation has been combinedwith maintenance of low levels of inflation in the wider economy. This may befar from ideal with decisions of the Bank of England’s MPC being a balancing actbetween the inflationary housing market and the depressed manufacturing sector.But it now seems that the volatile housing market has become a factor inmacroeconomic management that can have a benign effect. Equity withdrawalhas been rising strongly in recent years, underpinning strong consumer spending.Ironically, it has probably acted as a stabilising influence in the economy as awhole, counterbalancing manufacturing recession and a depressed stock market.
Housing policy today
49
-6
-4
-2
0
2
4
6
8
1970
1972
1974
1976
1978
1980
1982
1984
1986
1988
1990
1992
1994
1996
1998
2000
2002
Source: Bank of England
Figure 2.2: Mortgage equity withdrawal as a percentage of post-tax income 1970-2003
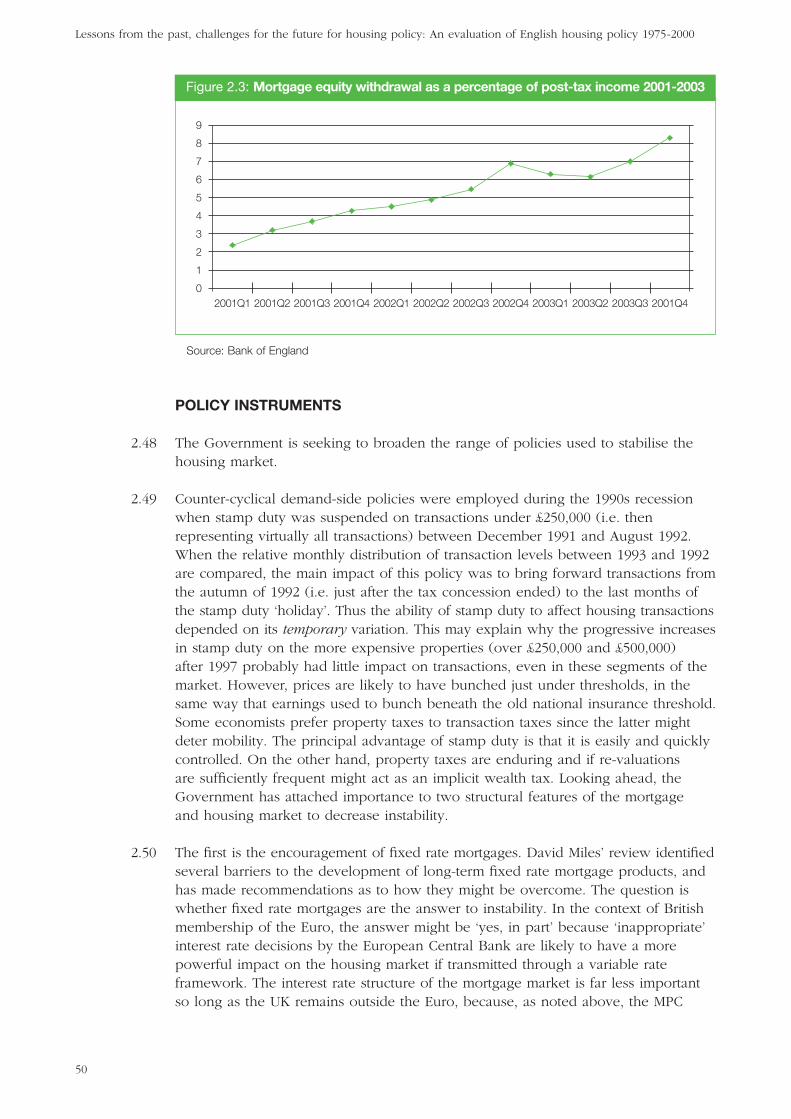
POLICY INSTRUMENTS
2.48 The Government is seeking to broaden the range of policies used to stabilise thehousing market.
2.49 Counter-cyclical demand-side policies were employed during the 1990s recessionwhen stamp duty was suspended on transactions under £250,000 (i.e. thenrepresenting virtually all transactions) between December 1991 and August 1992.When the relative monthly distribution of transaction levels between 1993 and 1992are compared, the main impact of this policy was to bring forward transactions fromthe autumn of 1992 (i.e. just after the tax concession ended) to the last months ofthe stamp duty ‘holiday’. Thus the ability of stamp duty to affect housing transactionsdepended on its temporary variation. This may explain why the progressive increasesin stamp duty on the more expensive properties (over £250,000 and £500,000)after 1997 probably had little impact on transactions, even in these segments of themarket. However, prices are likely to have bunched just under thresholds, in thesame way that earnings used to bunch beneath the old national insurance threshold.Some economists prefer property taxes to transaction taxes since the latter mightdeter mobility. The principal advantage of stamp duty is that it is easily and quicklycontrolled. On the other hand, property taxes are enduring and if re-valuationsare sufficiently frequent might act as an implicit wealth tax. Looking ahead, theGovernment has attached importance to two structural features of the mortgageand housing market to decrease instability.
2.50 The first is the encouragement of fixed rate mortgages. David Miles’ review identifiedseveral barriers to the development of long-term fixed rate mortgage products, andhas made recommendations as to how they might be overcome. The question iswhether fixed rate mortgages are the answer to instability. In the context of Britishmembership of the Euro, the answer might be ‘yes, in part’ because ‘inappropriate’interest rate decisions by the European Central Bank are likely to have a morepowerful impact on the housing market if transmitted through a variable rateframework. The interest rate structure of the mortgage market is far less importantso long as the UK remains outside the Euro, because, as noted above, the MPC
Lessons from the past, challenges for the future for housing policy: An evaluation of English housing policy 1975-2000
50
0
2
1
3
4
5
6
7
8
9
2001Q1 2001Q2 2001Q3 2001Q4 2002Q1 2002Q2 2002Q3 2002Q4 2003Q1 2003Q2 2003Q3 2001Q4
Source: Bank of England
Figure 2.3: Mortgage equity withdrawal as a percentage of post-tax income 2001-2003
takes account of the condition of the housing market when setting interest rates.But the interest rate structure of the mortgage market is clearly not the only factorin explaining house price instability: for example the recent Dutch house priceboom occurred in a fixed rate environment.
2.51 The second structural feature of the housing system identified as contributing to itsinstability is the supply side. The Barker Review has concurred with the evidencecollected in this evaluation that suggests that the supply side has become a moreimportant explanatory factor in explaining house price inflation (see para 1.38).
Choice in the social rented sector
THE GOVERNMENT’S OBJECTIVES
2.52 The Government wishes to reform the social rented sector by moving away from thecurrent highly managed system. Currently most decisions are taken administratively,but the Government wishes tenants to exercise greater choice and wield moreinfluence over management. This will involve reforming allocations, pricing andownership structures. The Government’s proposals aim to meet two broad objectives.
2.53 The Government’s first objective is to create something more akin to a social market:housing let at below-market rents, but using pricing structures to register consumerpreferences and choices. Tenants and prospective tenants are unable to exercisechoice because allocations are made by administrative means, rent structures areincoherent and fail to reflect the relative values of properties and in any case theHousing Benefit system removes all price signals from the majority of tenants.
2.54 The second objective is to encourage local authorities to separate their strategic roleof planning for housing needs, from the ownership and management of the stock.Tenant choice should be increased if there is a greater diversity of social landlord.
2.55 A third objective is to increase the responsiveness of local authority management totheir tenants, through a series of initiatives including performance league tables,Best Value and tenant participation compacts.
POLICY INSTRUMENTS
2.56 The Government is introducing a series of interlocking policies that are intended toallow a social market to be developed in the social rented sector. These are:
● introduce choice-based lettings by 2010;
● restructure rents so that they better reflect the relative attractiveness of individualproperties by 2011;
● reform Housing Benefit so that all tenants bear the marginal cost of housing.
Housing policy today
51

2.57 Meanwhile local authorities are being given incentives to reduce their directinvolvement with housing management:
● local authorities needing additional funding to bring their houses up to theDecent Homes Standard by 2010 can choose between three options: stocktransfer, Arms Length Management Organisations (ALMOs) or the PrivateFinance Initiative (PFI).
2.58 The first set of policies can be characterised as a demand-side social market; thesecond as a supply-side social market.
Demand-side social market2.59 The attempt to create a demand-side social market is fraught with a fundamental
difficulty. The relative poverty of tenants in the sector makes it extremely difficult tointroduce pricing mechanisms without jeopardising the safety net objectives of thehousing and income maintenance systems. Their relative poverty was demonstratedclearly in Section 2 above.
2.60 There are two plausible ways in which the ability of tenants to make market-likechoices can be enhanced: either a wider variety of household types are housed inthe sector, or the incomes of households in the sector need to improve.
2.61 In its Green Paper, published in 2000, the Government stated that it ‘does notbelieve that social housing should only be allocated to the poorest and mostvulnerable members of the community’. Nevertheless it recognised that priorityshould generally be given to households in greatest need. Because the pooresthouseholds have few housing options, some are likely to face total exclusion fromthe housing market if they are unable to obtain social rented housing. Faced withthe inevitable trade-off between social mix and safety net objectives, the Governmenthas opted to strengthen the safety net by increasing the obligations of local authoritiestowards homeless households. Consequently, the social rented sector is likely tobecome more homogenous in income terms.
2.62 The second route is to improve the position of existing tenants. The Government’sprincipal route for tackling poverty among the working age population is to promoteemployment in part through the use of in-work benefits, the Working Families TaxCredit and now the Working Tax Credit. The incomes of poor pensioners have alsobeen enhanced through the Minimum Income Guarantee and Pension Credit. Shouldthe Government’s strategy work then the basis for a social market in the socialrented sector will broaden.
2.63 However, without an improvement in the position of many tenants, the keycomponents of the social market can only ‘work’ through a trade-off with anysafety net objective.
2.64 Choice-based lettings in themselves cannot create more desirable houses orneighbourhoods (although it is hoped that they will create greater stability andcommitment in some places). The method of application is not the fundamentalchange brought about by choice based lettings in their pure form, rather it is theshift in currency from need to time waiting that alters the balance of powerbetween applicants. It has long been observed that the ability of a better-housedapplicant to wait (or hold out) for a desirable property can help to explain the
Lessons from the past, challenges for the future for housing policy: An evaluation of English housing policy 1975-2000
52

concentration of the very poorest households in the least desirable housing. A shiftfrom need to time strengthens the relative position of the less needy: increasingtheir ‘choice’ at the expense of outcomes for the most needy. Perhaps for thisreason most British choice-based letting schemes still place much emphasis on ‘need’.
2.65 Rent reform should make rents reflect better the value of individual properties. Evenif this does not prompt some tenants to move, in principle it may be a fairer systemin distributional terms, even if an unreformed Housing Benefit system removes pricesignals from most tenants. In practice, pensioners who are living in family-sizedhomes seem likely to be a group that would be affected, and this may not be popular.
2.66 Housing Benefit reform is similarly constrained by the structure of the British socialsecurity system. It makes no allowance for housing costs in mainstream benefits.The 1988 Housing Benefit system is designed to prevent post-rent incomes fromfalling below social assistance levels, hence the payment of all of the eligible rentto households in receipt of social assistance and the 100% marginal subsidy for allother recipients.
2.67 The difficulty with the ‘flat rate’ Housing Benefit system being piloted in theprivate rented sector is that it risks allowing post-rent incomes to fall below socialassistance levels when rents are above average. The trade off is simple: the morethat low income tenants are exposed to price signals, the greater their shoppingincentive, but the greater the chance that their post-rent income will fall belowsocial assistance levels. The more that tenants’ post-rent incomes are protected, theweaker are the price signals and the shopping incentives. Improved employmentlevels and the introduction of more generous in-work benefits (the Working TaxCredit) reduce the numbers entitled to HB, which open more households up torent-related price signals. Similarly, the Pension Credit also increases the ability ofsome pensioner households to make a contribution towards their rent. But it is thesuccess of the Government’s employment policies that will most determine whethera social market in housing is possible.
Management effectiveness2.68 Since choice is unlikely to be achieved through the measures aimed at creating a
demand-side social market, much greater reliance must be placed on managementeffectiveness policies.
2.69 The most direct administrative route by which tenants might exercise consumerpower over social landlords is tenant participation. But, while tenant participation mayindirectly improve the culture of management, there is little evidence to suggest thatit is an effective mechanism for the improvement of landlord performance. Tenantsappear to have either lacked the motivation or organisation to exercise consumerpower through the ‘pick a landlord’ mechanism. Although Tenant ManagementOrganisations have proved to be efficient and popular with tenants, they make uponly a tiny proportion of the stock, again reflecting a lack of motivation.
2.70 There is more evidence that the Government is rather more effective than tenantsin extracting management improvements out of local authorities, not least becausethey can use the carrot of finances and the stick of regulation to achieve these.
Housing policy today
53
Supply-side social market2.71 One of the most successful housing policies has been the transfer of local authority
housing to new housing associations. Although the first transfers took place in thelate 1980s, the rate accelerated in the late 1990s. In total almost 750,000 houses,representing 18 per cent of the 1988 stock, have been transferred in this way.
2.72 Local authorities took advantage of the Large Scale Voluntary Transfer (LSVT) initiativeand the Estates Renewal Challenge Fund (ERCF) largely because of the constrainedfinancial choices that they faced. LSVTs were attractive to local authorities withsurpluses on their Housing Revenue Accounts. This was because the new subsidyregime introduced in 1989 was able to ‘cream off’ some of these surpluses. BothLSVTs and ERCF were attractive to tenants, as restrictions on local authority borrowing,made stock transfer the only practical way in which homes could be improved, andtenants were further reassured by rent and other guarantees.
2.73 The Decent Homes standard is being used by the Government as a means ofproviding further incentives for local authorities to loosen their direct control overhousing management. Local authorities requiring additional resources to meet the2010 deadline for meeting the Decent Homes standard are required to eithertransfer stock, establish Arms Length Management Organisations (ALMOs) or (inprinciple) opt for funding under Private Finance Initiative (PFI). The latter option isstill being piloted. ALMOs act as an additional lever over local authority behaviouras additional funds are made available only if management performance meetscertain, stringent, standards.
2.74 These arrangements do not promote social market mechanisms in which tenants aremaking the decisions. Tenants are not responsible for initiating changes in ownershipor management. Under LSVTs and ERCFs compulsory ballots give them a power ofveto. Their involvement is reduced to being consulted in the formation of ALMOs orif the PFI is employed. Nor do these changes really widen the ‘choice’ of landlordopen to tenants, as generally stocks are not being split up between landlords. (Theviability of partial transfers is often diminished because of the high (‘breakage’) costsof repaying loans early.) Despite this, the desire to win a ‘yes’ vote encouragesmanagers to develop packages that tenants will approve.
2.75 But these changes in social housing management arrangements do represent someform of quasi-market behaviour. It is one in which central government can becharacterised as the ‘purchaser’ and the local authorities as a ‘provider’, despite thefact that the local authorities actually own the asset.
Sustainable communities andSupporting People
THE GOVERNMENT’S OBJECTIVES
2.76 It is widely recognised that general housing policies are by themselves insufficientto ensure that all citizens’ housing needs are met. For some people distinct policyinstruments must be devised if all citizens are to be well housed.
Lessons from the past, challenges for the future for housing policy: An evaluation of English housing policy 1975-2000
54
POLICY INSTRUMENTS
2.77 Policies have been devised for three main groups for whom general housingpolicies are insufficient to meet their housing needs:
● Disadvantaged communities, such as Black and Minority Ethnic groups whosecommon interests are not primarily identified by where they live. Policies ofmainstreaming, equality and diversity programmes have been devised to helpprovide a sensitive housing service to members of BME communities.
● Disadvantaged communities defined by the geographical concentration of socialexclusion and disadvantage. The Sustainable Communities strategy is aimed atthese areas.
● Disadvantaged individuals who need housing-related support to live independently,e.g. vulnerable older people, people with disabilities, those with learningdifficulties or mental health problems, and homeless people. Supporting Peopleis the key initiative in this area.
Disadvantaged communities: Black and Ethnic Minorities2.78 A review of the housing outcomes of one disadvantaged group, BME households,
showed how housing outcomes are, in many important respects worse than for themajority, white population. This is partly simply a reflection of wider economicinequality, an inevitable association in the largely marketised housing system.However, it was also clear that additional and broader factors work to exacerbateeconomic disadvantage. While it is acknowledged that poor quality housing andneighbourhood environments characterise many areas containing ethnic minorityclusters, such broader factors have salience across the whole BME community.
2.79 A variety of barriers exist that prevent minority groups from accessing and benefitingfrom mainstream policies. These include inappropriate service delivery (including lackof translated material or interpreters, or inappropriate settings, such as insensitivityto the gender mix of staff and clients), a lack of awareness amongst households ofthe availability of particular services, and reluctance to face bureaucratic hurdles,or to undergo means-testing. Choice throughout the housing system is restrictedto the extent that members of BME communities fear significant racially motivatedharassment and violence, particularly in circumstances where they ‘pioneer’ entryinto new neighbourhoods or tenure sectors.
2.80 An important policy tool used to tackle discrimination has been legislation,especially the Race Relations Act (1976) now amended in 2000 to place a positiveduty on public funded authorities to promote race equality and increases theinvestigation powers of the Commission for Racial Equality. It also imposes dutieson the Housing Corporation in its regulatory role, to eliminate unlawful racialdiscrimination, to promote equality of opportunity and promote good relationsbetween different racial groups.
2.81 The audit and regulatory framework is key to ensuring that the goal of movingequalities issues into the mainstream of policy-making is attained. In recent yearsthe development of much good practice advice, has disseminated clear guidance asto how organisations, and organisational practice, can counteract any unintentionallyracist practices. Some of this best practice has evolved from the approaches adopted
Housing policy today
55
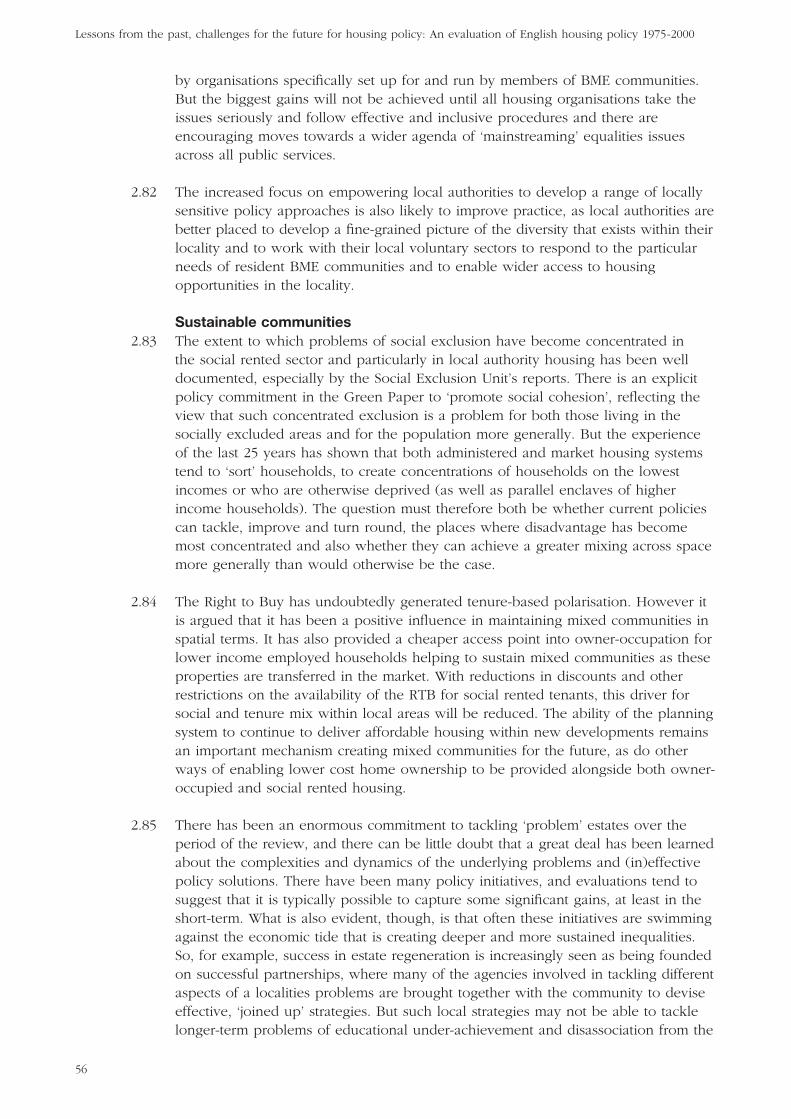
by organisations specifically set up for and run by members of BME communities.But the biggest gains will not be achieved until all housing organisations take theissues seriously and follow effective and inclusive procedures and there areencouraging moves towards a wider agenda of ‘mainstreaming’ equalities issuesacross all public services.
2.82 The increased focus on empowering local authorities to develop a range of locallysensitive policy approaches is also likely to improve practice, as local authorities arebetter placed to develop a fine-grained picture of the diversity that exists within theirlocality and to work with their local voluntary sectors to respond to the particularneeds of resident BME communities and to enable wider access to housingopportunities in the locality.
Sustainable communities2.83 The extent to which problems of social exclusion have become concentrated in
the social rented sector and particularly in local authority housing has been welldocumented, especially by the Social Exclusion Unit’s reports. There is an explicitpolicy commitment in the Green Paper to ‘promote social cohesion’, reflecting theview that such concentrated exclusion is a problem for both those living in thesocially excluded areas and for the population more generally. But the experienceof the last 25 years has shown that both administered and market housing systemstend to ‘sort’ households, to create concentrations of households on the lowestincomes or who are otherwise deprived (as well as parallel enclaves of higherincome households). The question must therefore both be whether current policiescan tackle, improve and turn round, the places where disadvantage has becomemost concentrated and also whether they can achieve a greater mixing across spacemore generally than would otherwise be the case.
2.84 The Right to Buy has undoubtedly generated tenure-based polarisation. However itis argued that it has been a positive influence in maintaining mixed communities inspatial terms. It has also provided a cheaper access point into owner-occupation forlower income employed households helping to sustain mixed communities as theseproperties are transferred in the market. With reductions in discounts and otherrestrictions on the availability of the RTB for social rented tenants, this driver forsocial and tenure mix within local areas will be reduced. The ability of the planningsystem to continue to deliver affordable housing within new developments remainsan important mechanism creating mixed communities for the future, as do otherways of enabling lower cost home ownership to be provided alongside both owner-occupied and social rented housing.
2.85 There has been an enormous commitment to tackling ‘problem’ estates over theperiod of the review, and there can be little doubt that a great deal has been learnedabout the complexities and dynamics of the underlying problems and (in)effectivepolicy solutions. There have been many policy initiatives, and evaluations tend tosuggest that it is typically possible to capture some significant gains, at least in theshort-term. What is also evident, though, is that often these initiatives are swimmingagainst the economic tide that is creating deeper and more sustained inequalities.So, for example, success in estate regeneration is increasingly seen as being foundedon successful partnerships, where many of the agencies involved in tackling differentaspects of a localities problems are brought together with the community to deviseeffective, ‘joined up’ strategies. But such local strategies may not be able to tacklelonger-term problems of educational under-achievement and disassociation from the
Lessons from the past, challenges for the future for housing policy: An evaluation of English housing policy 1975-2000
56

labour market. The success of such partnerships may be disproportionately relianton the commitment, ability and the working relationships between some of theindividuals representing key partners. The emphasis on capacity building reflectsthis view.
2.86 Similarly, understanding of the dynamics of the low demand areas that have beenemerging in some northern (private) housing markets is increasing and a large rangeof additional instruments have been put in place to tackle the problems identified.But any such measures must achieve success in a broader local or regional contextof decline, where the lack of labour market opportunities is a particular issue drivingbroader population out-migration and income and skills decline. There is also adanger that such policies simply transfer the problems of low demand to otherareas where less is being done to offset decline. Understanding these tensions andwhy and how particular policies are successful at this stage is as likely to be asvaluable as introducing further change.
2.87 One of the most important issues with respect to housing and sustainable communities(defined in terms of economic and social as much as environmental sustainability) isthe acceptability of social housing in the twenty first century. There is some evidencethat the costs of management and maintenance within RSLs have been rising whileaspirations with respect to tenure still heavily favour owner-occupation. Even ifrenting were to become more popular, as appears to be the case among youngerhouseholds, the types of dwellings and the range of services required does not tendto favour social housing. The challenge facing social housing in the context ofsustainable communities is therefore to provide both dwellings and services towhich people wish to aspire.
Disadvantaged individuals: Supporting people2.88 Supporting People is a major initiative, marking the largest transfer of public funds
in this area since the introduction of Community Care a decade ago. WhereasCommunity Care focussed on relatively intensive home-care services, SupportingPeople aims to provide a whole range of housing-related support including lowintensity support that was often lacking and resulted in people being left to struggleto live independently or institutionalised unnecessarily. The funding provided by theSupporting People programme is intended to help a range of household types withsupport needs to continue to be able to live independently in general needshousing. It is anticipated that such an approach, by filling a gap in the system ofcare provided by Community Care, can reduce the demands on social services, theNHS and other providers of institutional or intensive support and improve people’squality of life.
2.89 Bringing together various budgets, such as the former Housing Benefit service chargeelement, has enabled the programme to be funded. The budget is administered bythe Homelessness and Housing Support Directorate within ODPM, which allocatesfunding to Supporting People Units in 150 Administering Authorities. These are chargedwith drawing up local strategies and contracting with a range of organisations(potentially in statutory, voluntary and private sectors) to deliver particular services.
2.90 The programme encountered some problems when it was introduced, arising fromthe speed of implementation. It was inevitable that established programmes tendedto be the ones that were funded initially, at least until a review had taken place.Moreover, the scheme’s costs were higher than anticipated, in part because various
Housing policy today
57
schemes that would have qualified for Housing Benefit funding were established inthe expectation that they would benefit from transitional payments. There are alsomore serious concerns. Expenditure does seem to have been concentrated onmaintaining relatively expensive ‘supported housing’ rather than on ensuring thereis a wide range of support services that are good value for money, good quality andmeet local needs. Moreover, there are concerns that some ‘cost-shunting’ hasoccurred whereby services that should be funded by the NHS or social care serviceshave been moved to Supporting People, albeit in modified ‘housing’ forms.
2.91 These may well be transitional problems that will be overcome over time. However,two underlying concerns remain. First, some studies have suggested that ‘floatingsupport’ services alone cannot always overcome the barriers of unsuitable housingor localities or of low income to achieve independence. Secondly, it is difficult tosee how strategic assessments can be made when allocating funds between suchdiverse groups as older home owners, people with mental health problems andhomeless households, especially when such a wide variety of support instrumentsare employed.
Undermaintenance, repair and improvement
THE GOVERNMENT’S OBJECTIVES
2.92 The Government has made clear its intention to improve the quality of housing inall sectors. Legacies of disrepair in the local authority sector have received greatestattention, although a new interest in long-term maintenance has also emerged.
POLICY INSTRUMENTS
2.93 The main policies directed at current problems of under-maintenance andinadequate standards include:
● changes in the definition of unfitness to align it more closely with objectives;
● more targeted approaches to the licensing of HMOs and private landlords in lowdemand areas;
● a target to achieve the Decent Homes standard by 2010 across the socialhousing stock and to increase the proportion of vulnerable households living indecent homes to 70 per cent by the same date; and
● subsidies and incentives to reorganise social sector ownership and managementto realise imputed capital gains to pay for the investment required.
2.94 Ensuring longer-term maintenance depends mainly on the shift to resourceaccounting in the local authority sector and the incentive framework within whichindependent social housing providers are expected to operate.
Lessons from the past, challenges for the future for housing policy: An evaluation of English housing policy 1975-2000
58
2.95 As Theme Paper 3 makes clear the problems of under maintenance in the localauthority sector are to a significant extent the outcome of past government policy,notably with respect to controls on expenditures and rents. The use of past capitalgains through ownership re-structuring, supplemented by dowries and grants wherethat source is inadequate, provides a one-off opportunity to break the downwardspiral. The Decent Homes target provides a benchmark against which to evaluate theuse of resources. Even in the social sector however there are clear problems aboutthe nature of this target and the extent to which it reflects household priorities andaspirations. Equally the new landlords’ choice with respect to the mix of demolitionand replacement as compared to upgrading and the timing of the upgrading programmeis affected as much by the financial regime as by the underlying demand for theexisting stock and the real resource cost to bring the property to acceptable standards.There is undoubtedly some concern that there will be a range of different types ofwaste associated with the policy. This should not detract from the fact that thecurrent policy framework probably does allow the Decent Homes standard to beachieved for most local authority and ex-local authority property within a reasonabletime-scale. The position with respect to mixed funded housing association propertyis less clear, but this is less of a problem because of the age structure of the stock.
2.96 The main problems in achieving the Decent Homes standards lie in the private sectorwhere the instruments available to the government even to define the problem letalone address it are far less clear. There is very little funding available for grants tothe private sector, compared to the 1980s. The problems associated with implementingthis policy are three fold: the inadequacy of the evidence at individual propertylevel; the costs to the local authority associated with enforcing the regulations; and,most important, the potential loss of poorer quality housing from the stock.
2.97 In the context of owner-occupation the result is likely to be benign neglect until theoccupier dies or the property is put on the market, i.e. the current approach willcontinue. However the mismatch between the actual quality of the owner-occupiedstock and the requirements of government regulation is likely to increase as thepopulation of older owner-occupiers expands. This is because interest in andcapacity to undertake large-scale maintenance tends to decline with age and it iswell evidenced that unfitness is often positively correlated with satisfaction becauseof older households’ inertia.
2.98 The Housing Act recognises that due to the problems associated with the regulationof private landlords, such regulations are best limited to areas where alternative,better quality accommodation is available, often at similar rents. However this doesleave the problem of achieving the Decent Homes standard in higher demand areasmainly to the market supported by the local authorities’ general regulatory powers.What is clear is that if these standards are too distinct from what the market isprepared to pay for, the result of strict implementation will be either a reduction inthe availability of private rented housing or an increase in illegal lettings or both.Given the need for flexibility in the private rented market particularly in Londonand the evidence that this flexibility has been forthcoming at least to some extent asa result of deregulation, there is an obvious trade-off between ensuring modernisationand maintenance and ensuring supply. Taken together the demolition programmesin lower demand areas, where there is no requirement to replace fully and theimplementation of the Decent Homes standard in the private sector could morethan offset any gains from additional new provision.
Housing policy today
59

2.99 The most important longer-term concern relates to whether the new financialregime, notably with respect to social sector rents, will actually provide adequatefunding for the required continuing programme of maintenance and upgrading. Tothe extent that what is required is more expensive than allowed for in the past itmust be covered by the rents paid by future tenants. The formula for rent settingdoes not directly allow for this. Indeed it is based on keeping the overall revenueof the sector constant. This will be viable if interest rates continually fall which isunlikely. Instead the real costs of labour are likely to increase raising real concernsabout whether funding will be available. Thus once again the sector remains heavilydependent on central government adjusting policy in the face of external change.
Lessons from the past, challenges for the future for housing policy: An evaluation of English housing policy 1975-2000
60

SECTION 3
Housing futures
3. Introduction3.1 By evaluating housing policies over a 25-year period we can make some
generalisations about policy design and its success:
● Individual policy instruments are most successful when judged in their ownterms. For example, Right to Buy raised the level of home-ownership, thehomelessness legislation provided a safety net for eligible families, and theplanning system helped to protect the countryside. A series of policies reducedgovernment funding and improved its targeting.
● Policies often had unintended consequences. Frequently these were undesirableones. So Right to Buy and the homelessness legislation contributed to theresidualisation of social rented housing so creating concentrations of poverty andexclusion. Targeting subsidies on the poorest tenants reduced incentives to work.
● Policies often also presented trade-offs. For example, the greater choice forborrowers that arose from the liberalisation of the mortgage market also resultedin greater risks for certain households, as did changes in the safety nets. Theplanning system may have protected the countryside, but it has also contributedto housing shortages and higher prices. Transferring social rented housing to thehousing association sector has fragmented management and increased the costsof funding. It has also fragmented ownership and therefore made regenerationand renewal more complex.
● Policies are most successful when they follow the grain of economic and socialchange, and least successful when they do not. On the positive side the stagedremoval of mortgage interest relief occurred during a period of falling interestrates that tended to outweigh the loss of subsidy. On the negative side policiesaimed at neighbourhood regeneration have often produced disappointing resultsbecause they have been overwhelmed by unfavourable economic circumstances.
● Overall, there is considerable evidence of good governance with few instancesof direct wastage of government funding and little large-scale dead-weight loss.Few policies have been almost entirely unsuccessful.
● Housing policies are clearly only one factor in shaping wider housing systems.Institutional, economic and social contexts are fundamental to shaping bothpolicies and outcomes.
61
3.2 These messages also help us to consider how the housing system might perform inthe future when presented by various challenges. We consider four tests:
● The robustness test: can the housing system absorb economic shocks?
● The economic flexibility test: can the housing system meet the needs of aflexible economy?
● The demographic test: can the housing system respond to future demographicdemands?
● The aspiration test: can the housing system respond to rising expectations?
The robustness test3.3 For almost a decade the housing system has operated in a benign environment of
low inflation, until recently falling nominal interest rates which nevertheless remainhistorically low and generally rising house prices. But earlier in the evaluation period,the housing market was faced with periods of inflation and recession. In this sectionassessments are made of the robustness of the housing system in response torecession, deflation and inflation.
RECESSION
3.4 Of particular current concern is how well the system would operate were there tobe a sharp recession in the economy leading to sudden increased unemployment,as happened in the early 1990s.
3.5 With respect to the owner-occupied sector it is arguable that the system might wellfare considerably better, at least in the short-term. The rate of growth of the owner-occupied sector over the last few years has been relatively slow and the numbersof first time buyers, who are generally most heavily exposed to debt, has been afalling proportion of total borrowers. Their average age is also higher. Transactionsare considerably below their peak in the later 1980s when the advanced notice ofthe withdrawal of double tax relief from non-married couples induced additionalactivity. The proportions of households borrowing more than 100 per cent are quitelow and concentrated more in the cheaper areas and downpayments have alsogrown. The market is more mature and the likely short-term consequences ofrecession less extreme.
3.6 Although the immediate problems arising from recession may be less there are threechanges since the early 1990s which make it difficult to predict longer-term outcomes:
● the restrictions to Income Support for Mortgage Interest, the safety net availableto owner-occupiers who lose their income;
● the low rate of inflation; and
● the extent of re-mortgaging.
Lessons from the past, challenges for the future for housing policy: An evaluation of English housing policy 1975-2000
62
3.7 Mortgage Payment Protection Insurance was meant to fill the gaps left by restrictionsto government support, but it appears to have been taken up by the risk averserather than those exposed to the highest risks. To avoid a repossessions crisis,mortgage institutions would have to help uninsured households to restructure theirdebt if they could not sell their houses. Low inflation would prolong problems andmake restructuring more problematic while re-mortgaging means that even moreestablished owner-occupiers may be as exposed (although the evidence suggeststhat most still have significant equity in their properties). These factors would all beof importance once house prices started to fall because one of the features of anyasset market is that expectations of future prices help to drive the market. If prices arefalling then more potential buyers will postpone entering the market, so contributingto price falls overshooting, as they did in the early 1990s.
3.8 An effect of recession on the rental sectors would continue to be offset by HousingBenefit. Eligibility has been restricted since the last recession, mostly in the privaterented sector, and this would tend to weaken its stabilising influence. Nevertheless,a rapid rise in Housing Benefit costs would still be expected and it is not clear thata future government would readily accept a doubling in payments to the privaterented sector, as occurred in the last recession. A further complication is the reactionof the relatively new Buy to Let market, especially where expectations of capitalgains play a major role. If rents fell in the face of short-run variations in demandand owners needed to realise assets this could add a further turn of the screw.
3.9 Equally capital allocations to social housing would be likely to be reduced adverselyaffecting the capacity of the sector to benefit from lower costs. In addition much ofthe capacity to raise finance through S106 planning agreements depends on themaintenance of, and indeed the increase in, land values. A recession would make iteasier for local authorities to negotiate affordable housing allocations on developmentsbut harder to obtain the funding to achieve the output. Affordable housing supplycontinues to depend on government funding and the capital allocation systemmakes it easy to adjust available resources, and a government could increase newbuild in a counter-cyclical manner, as was done in the early 1990s.
DEFLATION
3.10 A rather different, though related, concern is that of deflation that occurred in Japan,after a massive housing and commercial property market bubble burst, and is fearedin Germany as well as other parts of the European Union (though not following aproperty boom).
3.11 The policy approach often adopted in the face of deflation is to cut interest ratesand pump money into the economy to increase consumer spending. This wouldmake it easier to borrow to purchase housing and could help to maintain thehousing market. However, the fear is that lack of confidence would restrict suchspending resulting in declines in house prices. In an extended version of therecession scenario outlined above owner-occupiers would continue to be exposedto debt whose value would be maintained so reducing their purchasing powerelsewhere. Long-term unemployment would make it difficult for institutions andhouseholds to address problems of default. Forced sales would further reduceprices, as would older households that need to realise assets in the face of fallingincomes from savings.
Housing futures
63
3.12 Equally declining asset values would make it problematic for developers to sellproperties because of the adverse impact on their balance sheets and would makeit more difficult to obtain finance contributions through S106 planning agreements.Finally, tax revenues could fall while the costs of demand-led expenditures such asHousing Benefit would rise, putting pressure on capital allocations. Thus while onthe face of it the deflation should make it easier and cheaper to build, this wouldbe inhibited by a crisis of confidence in the market and would be likely to requireactive measures by government to revive confidence.
INFLATION
3.13 Concerns about potential inflation mainly relate to the impact of higher moneyinterest rates on repayments. While perhaps half of all first time buyers have someform of short-term fixed interest rate mortgage the vast majority of remortgages areat variable rates with short-term discounts. A 2 percent increase in money interestrates would increase repayments for most mortgages by at least 25 per cent – amajor impact on people’s budgets. This in turn would reduce house prices thathave been structurally increased by expectations of low interest rates. Again thefear must be that the volatility inherent in the UK housing market would continue.It remains exposed to macroeconomic pressures while house price cycles areexacerbated by changes in confidence
The economic flexibility test3.14 The role of the housing system in inhibiting or facilitating the flexible economy is
widely recognised in current policy concerns. The two most important relationshipsbetween housing and the flexible economy relate to labour mobility and workincentives and have been discussed in detail in Section 2. However, these are notthe only areas where the housing system interacts with the economy.
FINANCE MARKET
3.15 The deregulation of the finance market has been a considerable success and whoseimpacts have been positive and are sustainable. The market is competitive and hasattracted new entrants. New business even by established institutions is beingundertaken at appropriate risk adjustment rates, although there is still ‘excess’ profiton older mortgages. The growth of mortgage backed securities especially in the lastfive years gives greater stability to the market by providing greater access to thewholesale market even though costs are somewhat higher. The new internationalaccord on banking regulation, known as Basel 2, while not ideal from the institutions’point of view will allow the continued expansion of this market.
3.16 There is growing understanding that the more open finance markets in the UK andthe USA while requiring much more complex risk management techniques also providegreater opportunities and make the market more responsive to policy change, whichwith good macro-management change can help stabilise the economy. Equallyderegulation has enabled the mortgage market to restructure in ways which allow someeconomies of scale to be realised. While the housing finance market is not immuneto large-scale shocks, for example arising from inflation or recession, and may not yethave priced all risks effectively, it appears relatively mature and reasonably robust.
Lessons from the past, challenges for the future for housing policy: An evaluation of English housing policy 1975-2000
64
3.17 Assessing the role of finance for the social sector is rather more complex. Thenumbers of institutions involved in lending are relatively small and there areelements of oligopoly or bilateral monopoly. The Housing Corporation’s regulatoryrole is clearly seen as comfort by lenders. It is not clear that the risk assessment ofLarge Scale Voluntary Transfers in metropolitan areas has been fully assessed and itwould be of some concern if lending had taken place on the assumption that theGovernment would bale out such landlords if they encountered major problems.
3.18 The implications for economic flexibility lie in the fact that up to now the financialmarket has been prepared and able to address risks as they emerge. Even theexperience of the early 1990s did not curtail lending significantly. Competition mayhowever mean that traditional prudential requirements are not fully being met andmechanisms for addressing sudden large-scale changes in the economic environmentmay still be inadequate. If so, external factors could undermine the stability of thefinancial market. Market instability would feed back into the stability of the overalleconomy. There is a low probability of these risks being realised, but if they werethe costs would be high.
EQUITY
3.19 Partly because of the success of the debt finance market the position with respect toequity holdings is far less robust. Owner-occupiers are clearly heavily exposed tospecific risks by holding so much of their wealth in a single property. Undiversifiedasset holdings are more risky than portfolios that are diversified by asset type, andin the case of property, location. This strengthens the case very considerably forstabilising the market further. The position is obviously least satisfactory in lowdemand and other high risk areas where lower income households who wish tobecome (or remain) owner-occupiers take on large scale specific risk in relation totheir overall wealth position. The case for developing risk-sharing instruments suchas shared equity or other forms of government support in order to help maintainand improve these areas is strong. Nevertheless, the development of such instrumentsor policies without generating opportunistic behaviour is equally problematic.
3.20 The more general question of whether financial instruments can be developedwhich allow people to have a broader housing asset portfolio while remainingowner-occupiers is one to which considerable attention has been given in the USAand Australia. There is nothing formally to prevent such markets from developing.There do however appear to be strong psychological barriers arising from thenature of owner-occupation. They are, however, relevant not just to problems withentry into home ownership but also to asset realisation by older owner-occupiers.
3.21 The development of shared equity approaches to problems of low-cost homeownership, except for shared ownership itself, where the intention is usually tomove to full ownership, has been very limited. Equity mortgage approaches arehowever embedded in Homebuy and other government initiatives. The case forrisk sharing together with maintaining property as affordable into the longer termsseems strong.
3.22 Equity based solutions in the private rented sectors are also not robust. Greaterinstitutional involvement in the private rented sector would facilitate greaterdiversification as well as the allowing of economies of scale to be realised. This hasnot occurred significantly since deregulation and seems unlikely to do so without
Housing futures
65
government support, for example in the form of tax credits. In part this is about thenature of the private rented stock which includes relatively little flatted accommodationwhere economies of scale can be realised. In part it is the lack of stability and in partit is the dependence of the sector on capital gains. Although there are some signsof small-scale institutional investment the major growth has been in Buy to Let. Thisseems likely to remain the case so long as the stock market remains so uncertain.
3.23 Equally up to now there has been little attempt to introduce private equity into thesocial sector, although this is a growing trend in some other European countries.Enabling developers to bid for grant, the possibility of tax credits, and the possibilityof time limited social sector provision are all under discussion, but are not yet onthe policy map.
3.24 Overall there are clear benefits to more balanced portfolios for all those involved inhousing but this is one area where developments have been slow. Equally there areopportunities to provide a wider range of tenures to meet diverse requirements.
FLEXIBILITY IN HOUSING PROVISION
3.25 A fundamental requirement for greater flexibility in housing and the economy isthe capacity to adjust supply. It is fully recognised by government that this is anarea of policy failure and it is being addressed by a range of analyses and policystatements. So far there is a vision but not the capacity to follow this through intohigher output levels where they are needed.
3.26 As concerning is the evidence on the capacity to adjust the existing stock tochanging needs and aspirations. There is some sign of successful change of use ofbuildings and land in inner city areas, notably in London. However, much of theexisting stock is fairly inflexible and regulations including those relating to housesin Multiple Occupation and to Decent Homes that aim to achieve quality and safetyobjectives tend to reduce flexibility of use. Environmentalists are deeply concernedabout the capacity to bring energy use in existing housing in line with sustainabilityobjectives and there is a broader based concern about the inflexibility of buildingregulations and the impact of development controls on what is provided. All thesefactors tend to limit the range of housing provided and increase the costs ofadjustment to changing requirements.
The demographic test
HOUSEHOLD SIZE
3.27 The average size of household in England has been declining consistently since the1950s, as it has in almost every industrialised country. It is one of many factors,including the ageing of the population, smaller families, structural changes in familypatterns arising from divorce and separation, as well as the capacity of many singlepeople to live on their own. Yet England’s average household size is still higherthan many other European countries.
Lessons from the past, challenges for the future for housing policy: An evaluation of English housing policy 1975-2000
66
3.28 The capacity to choose to live independently for poorer and older households oftendepends on government welfare and housing policy. Once people have found a rentedhome they are eligible to claim Housing Benefit, so if their financial circumstancesdeteriorate, for example as a result of retirement, they can receive assistance to stayin their homes. There is no direct assistance for owner-occupiers, although housingwealth is still treated preferentially to other savings when determining access toincome-related benefits. Were general welfare policies to change the impact on thecapacity to live independently would be significant.
3.29 This is true at the early stages of people’s housing careers as students leave collegewith increasing debts – with some evidence that this is reducing their capacity to formseparate households in particular delaying their date of entry into owner-occupation.Finally, housing costs may inhibit household formation. This is one reason given forthe apparent cessation of the downward trend in household size in London.
3.30 Nevertheless, demographics are not the only or even the main factor determininghousing demand. There is continuing strong evidence that income growth producesstrong demands for additional space. This implies that more single person householdswill become dissatisfied with small dwellings.
3.31 Government housing policy influences both the demand to live separately and theamount of space required by both directly and indirectly. Its most direct influence isthrough land use planning and allocation systems in the social sector, where thirdparty standards are sometimes in conflict with the demands and aspirations ofhouseholds. Powerful indirect influences arise through government’s ability to affectdisposable income, notably through benefits and other measures, such as tax policies,that alter the long-term economic cost of housing to households.
3.32 Over the next 20-25 years it can be hoped that income growth will be in the orderof 50 per cent. This implies that the average household will want significantly morespace and higher standards. The impact will undoubtedly be offset by higher pricesespecially if supply, and adjustments within the existing stock, remain so inflexible.
3.33 Two fundamental objectives of housing policy should be: first, to ensure that thecosts faced by consumers properly reflect the real costs of housing to society; andsecond, to ensure that those with inadequate incomes are able to achieve specifiedstandards. While these are clearly recognised by government there is still a greatdeal of incoherence in the overall approach.
THE AGEING POPULATION
3.34 It is well recognised that on average our population is getting older and that theirneeds change over time. It is equally well established that older households areoften satisfied with poor quality ill-maintained accommodation and that purpose-built sheltered units are sometimes unpopular. The housing needs frequentlyarising from ageing include the flexibility of the dwelling, paying for maintenance,residential-based support and access to other services. Arguably, for the vastmajority of households housing should be a matter of choice and the appropriaterole for housing policy is to enable people to exercise, rather than to constrain,choice. While the Supporting People programme is intended to address some ofthese needs (see Section 2) there are clear areas of market failure where proactivepolicy is required:
Housing futures
67
● Equity release: Many elderly owner-occupiers are ‘income poor’ but ‘assetrich’, their incomes derived from pensions and state benefits are low, but theynevertheless have much wealth ‘locked up’ in their houses. The removal ofmortgage interest relief makes possible the development of a market in equityrelease without cost to the Government. However, the market in equity releaseinstruments is underdeveloped as a result of numerous difficulties. These includeinadequate information (especially relating to the longevity of households andthe future value of their properties), the interface between equity release andsocial security entitlement, the difficulty in anticipating changes in householdbehaviour that are designed to maximise the benefit derived from schemes,as well as the underlying risks of low demand and increasing costs. A furtherhindrance arises from the distinctive treatment of housing wealth whereby assetrealisation reduces eligibility to welfare benefits whereas unrealised housingwealth does not. This is an area where ‘joined-up’ government has a major roleto enable the private sector to develop while meeting both housing and taxefficiency objectives.
● Poor information and low income: The near demise of the system of privatesector improvement grants has had significant impacts on the level of investment.The policies that remain in place are mainly those of regulation and constraint.Much of the regulation is specific to particular problems and is not always whollyorientated towards the achievement of particular outcomes. Consequently, thesepolicies do not look for the most efficient way of achieving a safe, secure and warmenvironment. Issues relating to the relationship between housing and access toother services are also of importance, but are part of a broader agenda. On pastevidence new initiatives need to be far more oriented towards consumer needsrather than to standards set by third parties.
IMMIGRATION AND DIVERSITY
Minority ethnic groups3.35 Across the country only around 9 per cent of people are from minority ethnic
backgrounds. But in some, mainly urban, areas they form a significant minority ofhouseholds in need, and particularly in parts of London, they are the majority notonly of those in need but of the population as a whole.
3.36 Housing policy in this area has been relatively limited. It has included the developmentof minority led housing associations, now often part of wider groups; the publicationof good practice and performance standards with respect to provision; allocationand staffing in the social rented sector; and now the enabling of Islamic mortgages.
3.37 One particular difficulty in current policy has been the disincentives to providelarger dwellings within the social housing sector, which may well be exacerbatedby the emphasis on S106 agreements. It is difficult to predict future demands asincomes rise and aspirations may become more similar to the majority.
In-migration3.38 An associated problem is that of in-migration and both its immediate and long-term
impact on demand. Changing patterns of migration suggest that much of theemployment-related demand should be satisfied within the private rented sector,subject to minimum standards. Longer-term demands can be expected to be similar
Lessons from the past, challenges for the future for housing policy: An evaluation of English housing policy 1975-2000
68

to others at the same stage of their housing careers. The initial position of refugeesand asylum seekers is rather different and must be dealt with as part of social sectorpolicy. The main concern in the longer term is to integrate them into the labourmarket, which may also require their inclusion in training and other employmentprogrammes. In-migration clearly affects the age structure and household sizehelping London in particular to be a younger more vibrant community. Flexiblehousing provision is fundamental to the continuation of this success.
3.39 Demographic change puts pressures on the housing finance and welfare systems,and requires flexibility of supply. Most of the problems are well recognised by atthe present time policies remain generally piecemeal and reactive.
The aspiration test3.40 The fundamental objective of housing policy remains a decent home for all. The
system by which it addresses this aim is still highly delineated by tenure resulting ingaps, particularly with respect to provision for potential low-income owner-occupiersas well as differential treatment and opportunity for households in similar circumstancesbut in different locations and tenures. The most important factors determining theattainment of longer-term objectives, whether individual or governmental, relate tothe underlying distribution of income and employment. Again these are not withinthe powers of housing policy which must therefore address the outcomes.
3.41 It is clear that housing aspirations continue to rise and that many of those seen asdifficult to obtain in 1975 have been achieved for the vast majority of people. Systemsare in place to meet the administratively determined Decent Homes standard at leastin the social sector. However, the mechanisms for continued maintenance andimprovement look much less robust.
3.42 Of fundamental importance with respect to aspirations is the role and acceptabilityof the social sector. If those in work are able to purchase and policies of low costhome ownership are successful in helping a further tranche of households intosustainable ownership it is inherent that the social sector must provide the assistancenecessary to house those who are excluded. If this is not to be second choice itmust not be spatially polarised and must be far more consumer-oriented. If anything,the regulation of the sector can tend to limit this potential. It is already clear, forexample from the Starter Home Initiative, that over-specification and professionallydetermined constraints can make policies non-viable even in areas of high demandwhere they should be attractive. The ideal is again well understood, but thepracticalities of providing a wider range of ownership and of greater consumerorientation is extremely difficult to achieve, especially without apparent waste andthe fear of putting neighbourhoods at risk. Some of these questions and trade-offsrelate particularly to the physical fabric and to the potential for renewal andregeneration, where diverse ownership makes implementation particularly difficult.
3.43 There are still many questions to be answered, notably with respect to whether policiesshould prioritise the most deprived areas or poorest households (‘worst first’) orprioritise the maintenance of those areas (and people) who may be rather better off.A related question is that of appropriate risk sharing, between individuals, communitiesand government. The vision is the same as 25 years ago – of integration betweentenure choice and quality for all. While many of the immediate housing objectiveshave been achieved the problems of achieving that coherence remains unsolved.
Housing futures
69

An agenda for the future3.44 The evaluation has shown that many policies pursued over the past 25 years have
been successful in their own terms. However, many of the problems identified atthe beginning of the period have not been addressed effectively.
3.45 We can identify four factors that explain this apparent paradox whereby individualpolicies are successful when assessed in their own terms while the housing systemas a whole is seen to be dysfunctional:
● Emerging challenges remain unanticipated because policies are formulated asreactions to particular problems.
● Policies are often narrowly conceived because they deal with the symptoms ofparticular problems and ignore wider contextual influences.
● Consequent unanticipated behavioural responses to policy instruments sometimesspawn an array of follow-up policies leading to excessive micro-management.
● There is little vision of what a coherent and robust system would look like, andtherefore little attempt to test policies against achievement of this system.
3.46 Although a decent home for everyone at a price within their means should remainthe key housing objective, the way in which housing policy is conceived mustchange if these problems are to be overcome:
● The first challenge is to achieve policy coherence. Housing policy has becomeincreasingly fragmented, with the department responsible for housing losinginfluence both to what is now the Department of Work and Pensions and tothe Treasury. The development of regional level policy making risks furtherfragmentation of the system. A mechanism for coherent cross-governmentalpolicy development for housing, with a pre-evaluation element, is missing.
This is emphatically not a call for policy to be based on rigid planningmechanisms, whether they are conceived at a national, regional or local level,although of course high quality information systems are a part of any well-functioning system.
● The second challenge is to consider demand and supply sides together andwithin the context of uneven regional economic development. This challengearises from the recognition that the relatively efficient financial market combineswith an inefficient supply side resulting in access and affordability problems,market instability and labour market immobility. Better pricing of the costs andbenefits to society would help to achieve a more efficient level of land releasewithin the current planning gain framework and would support thesustainability agenda.
● The third challenge is to renew the emphasis placed on subsidised building.Demand-side subsidies alone have clearly failed in this context. The costs togovernment over time can be limited by the development of better financialinstruments including greater use of equity finance. More fundamentally there isa strong case for more balanced regional economic growth which needs to beaddressed in the broader policy arena.
Lessons from the past, challenges for the future for housing policy: An evaluation of English housing policy 1975-2000
70
● The fourth challenge is to recognise that nature of housing system and of housing policy is constrained by the social and economic context.Macroeconomic instability has disproportionate impacts on the housing systembecause of the importance of wealth and debt within it. This in turn feeds backon the achievement of macro objectives. Housing contributes to flexibility inmacro-management, but similarly takes the blame for macro-mismanagement.This symbiosis needs to be recognised directly in policy development.
● The fifth challenge is to create greater choice in the social rented sector. Thiswill be hard to achieve partly because of the poverty of tenants, partly becauseof over-regulation and partly because of under-supply. Yet the safety net role of the social rented sector is needed to respond to labour market polarisation,inequality and the nature of social security system. Crucially there is a need to reform the Housing Benefit system, in parallel with the new welfare state,particularly with respect to the tax credit system. This is a necessary first step forproviding the basis of a viable social rented sector, as well as work incentives.
● The sixth challenge is to create a viable social rented sector, that is a tenure ofchoice. This challenge can be tackled only once the fifth challenge has beenmet. Only then would the social rented sector stand some chance of becomingviable, i.e. not trapped as a low-aspiration tenure subjected to excessive micro-management. The key is to promote its simultaneous disassociation from directstate ownership and management, to allow flexible response while promotingsolidarity within the sector. Some redistribution of financial surpluses betweensocial landlords is needed, but the incentive to create them too must be retainedto allow reinvestment to meet long-term sustainability objectives. A degree ofrisk for social landlords is probably necessary to provide incentives to anticipatefuture demands and aspirations.
● The seventh challenge is to reduce the barriers between the social rentedsector and the market sector. Once again the achievement of this objective isdependent on the achievement of the previous one. So far only the Right to Buyand to a far lesser extent low-cost homeownership schemes do this. Opening upsubsidies to competition from private sector landlords would be one possibleway in which barriers could be reduced. Equally, the potential for introducingequity into both social and private housing institutions should be addressed.
● The eighth challenge is to devise mechanisms for collective repairs withinbuildings in multiple ownership and for renewal in neighbourhoods whereownership structures are fragmented.
● The final challenge is to reconsider the distributive impact of housing subsidiesalongside their wider social consequences. Inconsistencies in the distributionof subsidies are well recognised, especially the lack of support for low-incomehomeowners and the failure of Housing Benefit to provide adequate assistancefor many of those at the bottom of the private rented sector. But the growingimportance of housing wealth also needs consideration. Housing will increasinglyprovide a key link to wider social policy, including smoothing income over thelife cycle (e.g. reverse mortgages in retirement and paying for long-term care); andintergenerational life chances (paying for children’s education and inheritance).Housing raises new questions of equality of opportunity and outcome, as wellas public spending.
Housing futures
71

72
The
me
Sup
ply
, Nee
d a
nd A
cces
s
Lega
cy
1975
1976
1977
•La
rge
coun
cil s
ecto
r &
new
bui
ldin
g pr
ogra
mm
e.•
Act
ive
New
Tow
ns.
•Tw
o-tie
r pl
anni
ng s
yste
m.
•Lo
cally
var
iabl
e po
licie
s on
acce
ss &
hom
eles
snes
s.
•P
ublic
Spe
ndin
g cu
ts:
rapi
d re
duct
ion
in L
Ane
w b
uild
.
•H
omel
ess
Per
sons
Act
give
s lo
cal a
utho
ritie
s a
stat
utor
y du
ty t
o ho
use
prio
rity
need
uni
nten
tiona
llyho
mel
ess
hous
ehol
ds.
•19
72 A
ct s
igna
ls s
trat
egic
shift
from
bric
ks a
nd m
orta
rto
indi
vidu
al s
ubsi
dies
.•
Nat
iona
l sys
tem
of r
ent
reba
tes
and
allo
wan
ces
esta
blis
hed
by 1
972
Act
.•
Att
empt
to
harm
onis
elo
cal a
utho
rity
and
hous
ing
asso
ciat
ion
rent
reg
imes
in19
72 A
ct (‘
fair
rent
s’).
•H
ousi
ng A
ssoc
iatio
nG
rant
(HA
G) i
ntro
duce
d by
197
4 A
ct.
•‘F
air
rent
s’ in
loca
lau
thor
ity s
ecto
r ab
olis
hed.
•sh
ift fr
om b
ricks
and
mor
tar
to in
divi
dual
subs
idie
s dr
oppe
d, b
utre
nt r
ebat
es r
etai
ned.
•19
74 A
ct a
nd a
ssoc
iate
dpo
licy
chan
ges
intr
oduc
ed:
aH
ousi
ng A
ctio
n A
reas
-sm
all a
reas
tar
gete
d fo
rim
prov
emen
t- e
stab
lishe
dby
197
4 A
ct t
o re
plac
eG
ener
al Im
prov
emen
tA
reas
.b
New
hom
e im
prov
emen
tgr
ant
syst
em.
cH
ousi
ng a
ssoc
iatio
nsre
cogn
ised
as
a ve
hicl
efo
r re
new
al o
f old
erho
usin
g ar
eas.
•Lo
cal a
utho
ritie
s ha
d th
erig
ht t
o se
ll ho
uses
to
thei
r te
nant
s.
•S
ex D
iscr
imin
atio
n A
ct(1
975)
.
•R
ace
Rel
atio
ns A
ct (1
976)
.
•H
ousi
ng C
orpo
ratio
ngi
ven
role
of r
egis
terin
gan
d m
onito
ring
hous
ing
asso
ciat
ions
wis
hing
to r
ecei
ve H
ousi
ngA
ssoc
iatio
n G
rant
.
Aff
ord
abili
ty &
Fin
ance
Ho
usin
g a
ndN
eig
hbo
urho
od
Qua
lity
Wid
enin
g C
hoic
eM
anag
emen
t E
ffec
tiven
ess
AP
PE
ND
IX 1
Tab
le o
f ke
y p
olic
ies
1975
-200
0

Appendix 1
73
The
me
Sup
ply
, Nee
d a
nd A
cces
s
1978
1979
1980
•E
xhor
tatio
n on
land
supp
ly (C
44/
78).
•H
ousi
ng In
vest
men
tP
rogr
amm
es (H
IPs)
incr
ease
cen
tral
con
trol
over
loca
l aut
horit
yca
pita
l spe
ndin
g.•
Gen
eral
and
Hou
sing
Nee
ds in
dice
s in
trod
uced
to g
uide
cap
ital
allo
catio
ns.
•In
ner
Citi
es p
olic
yfo
resh
adow
ed r
undo
wn
of N
ew T
owns
.
•Jo
int
Hou
sing
Lan
dA
vaila
bilit
y S
tudi
eses
tabl
ishe
d.•
Urb
an D
evel
opm
ent
Cor
pora
tions
(UD
Cs)
esta
blis
hed
to e
ncou
rage
land
and
bui
ldin
g re
clam
atio
nin
des
igna
ted
area
s.
•S
trat
egic
shi
ft fro
m b
ricks
and
mor
tar
to in
divi
dual
subs
idie
s re
sum
es: 1
980
Act
stre
ngth
ens
Gov
ernm
ent
leve
rage
ove
r lo
cal
auth
ority
ren
ts.
•M
ajor
ste
ps t
owar
dsfin
anci
al m
arke
tde
regu
latio
n.•
Firs
t rou
nd o
f priv
ate
rent
alde
regu
latio
n (s
hort
hold
tena
ncie
s in
trod
uced
).
•P
riorit
y E
stat
es P
roje
ctes
tabl
ishe
d to
exp
erim
ent
with
loca
lised
hou
sing
man
agem
ent
as d
ifficu
lt to
let
hous
ing
begi
ns t
o be
reco
gnis
ed.
•R
ight
to
Buy
intr
oduc
ed.
•S
ecur
e te
nanc
ies
for
loca
lau
thor
ity t
enan
ts.
•Te
nant
s’ C
hart
er.
•Lo
w C
ost H
ome
Ow
ners
hip
sche
mes
intr
oduc
ed.
•C
ompu
lsor
y co
mpe
titiv
ete
nder
ing
intr
oduc
ed fo
rlo
cal a
utho
rity
build
ing
cons
truc
tion
and
mai
nten
ance
.•
Loca
l aut
horit
ies
oblig
edto
con
sult
tena
nts
onho
usin
g m
anag
emen
t.
Aff
ord
abili
ty &
Fin
ance
Ho
usin
g a
ndN
eig
hbo
urho
od
Qua
lity
Cho
ice
Man
agem
ent
Eff
ectiv
enes
s

Lessons from the past, challenges for the future for housing policy: An evaluation of English housing policy 1975-2000
74
The
me
Sup
ply
, Nee
d a
nd A
cces
s
1981
1982
1983
1984
1985
1986
1987
•N
ew T
own
cons
truc
tion
falls
bel
ow 1
,000
p.a
.
•N
ew s
ubsi
dy s
yste
m u
sed
to ra
ise
loca
l aut
horit
y re
nts.
•A
ll fro
nt-li
ne H
ousi
ngB
enefi
t ad
min
istr
atio
nsh
ifted
to
loca
l aut
horit
ies.
•M
ortg
age
inte
rest
rel
ief
ceilin
g ra
ised
to
£30,
000
–su
bseq
uent
ly fr
ozen
.
•B
uild
ing
soci
ety
inte
rest
rate
car
tel c
olla
pses
.•
Bui
ldin
g A
ct c
odifi
esbu
ildin
g re
gula
tions
.
•Fi
tnes
s st
anda
rd d
efine
d.
•E
stat
e A
ctio
n in
trod
uced
.
•S
cope
and
gen
eros
ity o
fR
ight
to
Buy
ext
ende
d.
•R
ight
to
repa
ir fo
r lo
cal
auth
ority
ten
ants
.
•R
ight
to
Buy
dis
coun
ts fo
rte
nant
s in
flat
s in
crea
sed.
•Le
aseh
olde
rs’ r
ight
of fi
rst
refu
sal o
n sa
le o
f fre
ehol
d;rig
hts
to a
ppoi
nt m
anag
eror
to
buy
in e
vent
of
mis
man
agem
ent.
Aff
ord
abili
ty &
Fin
ance
Ho
usin
g a
ndN
eig
hbo
urho
od
Qua
lity
Cho
ice
Man
agem
ent
Eff
ectiv
enes
s

Appendix 1
75
The
me
Sup
ply
, Nee
d a
nd A
cces
s
1988
1989
1990
•H
ousi
ng A
ssoc
iatio
nsad
opte
d as
mai
n pr
ovid
ers
of n
ew s
ocia
l ren
ted
hous
ing.
•Lo
cal a
utho
ritie
s en
cour
aged
to s
hift
from
hou
sing
prov
ider
s to
ena
bler
s.•
Sec
ond
wav
e of
UD
Cs.
•R
ural
exc
eptio
ns p
lann
ing
polic
y fo
r af
ford
able
hous
ing
anno
unce
d.
•R
ough
Sle
eper
s In
itiat
ive
(RS
I) la
unch
ed in
Lon
don.
•P
artia
l der
egul
atio
n of
build
ing
soci
etie
s w
iden
sac
cess
to
who
lesa
lefu
ndin
g, b
road
ens
scop
eof
act
iviti
es a
nd p
erm
itsde
mut
ualis
atio
n.•
New
and
mor
e re
stric
tive
Hou
sing
Ben
efit
syst
emin
trod
uced
with
saf
ety-
net
role
em
phas
ised
with
inso
cial
sec
urity
sys
tem
.•
‘Dou
ble’
mor
tgag
e in
tere
stre
lief f
or u
nmar
ried
coup
les
ende
d.
•‘R
ingf
enci
ng’ i
ntro
duce
dfo
r lo
cal a
utho
rity
HR
As
aspa
rt o
f new
sub
sidy
syst
em.
•P
rivat
e fin
ance
and
ren
tde
regu
latio
n fo
r H
ousi
ngA
ssoc
iatio
ns.
•P
rivat
e se
ctor
ren
tde
regu
latio
n on
new
tena
ncie
s.
•‘P
oll t
ax’ r
epla
ces
dom
estic
rat
es.
•H
ousi
ng A
ctio
n Tr
usts
intr
oduc
ed.
•Te
nant
s’ C
hoic
ein
trod
uced
.
•H
ome
impr
ovem
ent
gran
tsm
eans
-tes
ted.
•R
epla
cem
ent
of H
ousi
ngA
ctio
n A
reas
with
Impr
ovem
ent
Are
as.
•Lo
cal a
utho
ritie
sem
pow
ered
to
fund
Hom
eIm
prov
emen
t A
genc
ies.
•Fi
tnes
s st
anda
rd r
edefi
ned.
•In
trodu
ctio
n of
priv
ate
finan
cefo
r ho
usin
g as
soci
atio
ns’
deve
lopm
ent
prog
ram
mes
lead
s to
a d
e-em
phas
is o
fre
habi
litat
ion
activ
ities
•D
ICE
(Des
ign
Impr
ovem
ent
Con
trol
led
Exp
erim
ent)
unde
rway
.
•Te
nant
’s c
hoic
e of
land
lord
intr
oduc
ed –
unu
sed.
•La
rge
Sca
le V
olun
tary
Tran
sfer
s be
gin.
•Te
nant
s’ G
uara
ntee
requ
ires
hous
ing
asso
ciat
ions
to
cons
ult
with
ten
ants
.
•Lo
cal a
utho
ritie
s ob
liged
to p
ublis
h pe
rform
ance
indi
cato
rs.
•P
erfo
rman
ce e
xpec
tatio
nsfo
r ho
usin
g as
soci
atio
nsin
trod
uced
.
Aff
ord
abili
ty &
Fin
ance
Ho
usin
g a
ndN
eig
hbo
urho
od
Qua
lity
Cho
ice
Man
agem
ent
Eff
ectiv
enes
s

Lessons from the past, challenges for the future for housing policy: An evaluation of English housing policy 1975-2000
76
The
me
Sup
ply
, Nee
d a
nd A
cces
s
1991
1992
1993
1994
•P
lan-
led
syst
em (f
ull l
ocal
plan
cov
erag
e in
tend
ed).
•G
ener
al p
lann
ing
polic
yfo
r af
ford
able
hou
sing
intr
oduc
ed (C
7/9
1).
•M
ore
com
petit
ive
HIP
&A
ppro
ved
Dev
elop
men
tP
rogr
amm
e al
loca
tion
proc
ess.
•R
emai
ning
New
Tow
nD
Cs
wou
nd u
p.•
PP
G3
Hou
sing
Rev
ised
:gu
idan
ce o
n pl
anni
ng &
affo
rdab
le h
ousi
ng is
sues
.
•U
rban
Reg
ener
atio
nA
genc
y es
tabl
ishe
d to
adop
t pa
rtne
rshi
pap
proa
ch t
o la
ndre
gene
ratio
n.
•U
K S
trate
gy fo
r Sus
tain
able
Dev
elop
men
t pu
blis
hed.
•M
ortg
age
inte
rest
rel
ief
rest
ricte
d to
bas
ic r
ate
ofta
x (2
5%).
•H
ousi
ng m
arke
t re
scue
pack
age,
incl
udin
gsu
spen
sion
of s
tam
pdu
ty a
nd d
irect
pay
men
tof
Inco
me
Sup
port
for
Mor
tgag
e In
tere
st d
irect
lyto
lend
ers.
•C
ounc
il Ta
x re
plac
es‘p
oll t
ax’.
•M
ortg
age
inte
rest
rel
ief
rest
ricte
d to
20%
.
•C
ity C
halle
nge
(199
2-98
).•
New
app
roac
h to
cont
rollin
g re
side
ntia
lde
sign
intr
oduc
ed t
hrou
ghP
PG
1 an
d P
PG
3.
•S
ingl
e R
egen
erat
ion
Bud
get
1994
-200
2br
ings
tog
ethe
r nu
mer
ous
rege
nera
tion
budg
ets.
•C
onst
ruct
ing
the
Team
(Lat
ham
repo
rt) h
eral
ds n
ewap
proa
ch t
o re
latio
nshi
psbe
twee
n pl
ayer
s in
the
cons
truc
tion
indu
stry
.
•‘C
olle
ctiv
een
franc
hise
men
t’ or
exte
nded
leas
es fo
rle
aseh
olde
rs in
flat
s.
•Te
nant
s’ G
uara
ntee
requ
ires
hous
ing
asso
ciat
ions
to
prov
ide
perfo
rman
ce in
form
atio
nto
ten
ants
.•
Per
form
ance
-bas
ed H
IPfu
ndin
g in
trod
uced
.
•C
ompu
lsor
y co
mpe
titiv
ete
nder
ing
(CC
T) fo
r lo
cal
auth
ority
hou
sing
man
agem
ent,
but
impl
emen
tatio
n de
laye
d.
•H
ousi
ng C
orpo
ratio
nm
akes
ten
ant
part
icip
atio
na
key
perfo
rman
cest
anda
rd.
Aff
ord
abili
ty &
Fin
ance
Ho
usin
g a
ndN
eig
hbo
urho
od
Qua
lity
Cho
ice
Man
agem
ent
Eff
ectiv
enes
s

Appendix 1
77
The
me
Sup
ply
, Nee
d a
nd A
cces
s
1995
1996
1997
1998
•19
92-b
ased
hou
seho
ldpr
ojec
tions
4.4
milli
on.
•S
ite s
ize
thre
shol
ds fo
rs.
106.
•Lo
cal a
utho
ritie
s’ m
axim
umdu
ty t
o ho
use
hom
eles
sre
duce
d to
sec
urin
gte
mpo
rary
acc
omm
odat
ion
for
two
year
s.•
RS
I ext
ende
d be
yond
Lond
on.
•R
easo
nabl
e pr
efer
ence
in a
lloca
tion
to p
riorit
yho
mel
ess
re-in
stat
ed.
•P
lann
ing
for
affo
rdab
leho
usin
g po
licie
s,st
reng
then
ed –
low
erth
resh
olds
.•
Enc
oura
gem
ent
of U
rban
Cap
acity
Stu
dies
(vs.
HLA
s).
•La
st U
DC
s w
ound
up.
•R
ough
Sle
eper
s U
nit
esta
blis
hed.
•In
com
e su
ppor
t fo
rm
ortg
age
inte
rest
rest
ricte
d.•
Mor
tgag
e in
tere
st r
elie
fre
stric
ted
to 1
5%.
•S
ingl
e R
oom
and
Loc
alR
efer
ence
Ren
t int
rodu
ced
to li
mit
rise
in c
ost
ofH
ousi
ng B
enefi
t.
•M
ortg
age
inte
rest
rel
ief
rest
ricte
d to
10%
.
•H
ousi
ng P
lus
intro
duce
d by
the
Hou
sing
Cor
pora
tion.
•M
anda
tory
hom
eim
prov
emen
t gr
ants
limite
d to
att
ainm
ent
of fi
tnes
s st
anda
rd.
•M
ore
stra
tegi
c ap
proa
chto
ren
ewal
are
as.
•E
stat
es R
enew
alC
halle
nge
Fund
laun
ched
.
•S
ocia
l Exc
lusi
on U
nit
esta
blis
hed
to fo
cus
on‘w
orst
est
ates
'.
•N
atio
nal S
trat
egy
for
Nei
ghbo
urho
od R
enew
alpu
blis
hed
for
cons
ulta
tion
(in fi
nal f
orm
200
1).
•N
ew D
eal f
or C
omm
uniti
eses
tabl
ishe
d.•
Ret
hink
ing
Con
stru
ctio
n(E
gan
repo
rt) h
eral
ds p
ush
for
mod
erni
satio
n of
cons
truc
tion
proc
urem
ent.
•D
isab
ility
Dis
crim
inat
ion
Act
.
•C
CT
agai
n de
laye
d•
‘Bes
t Va
lue’
pilo
ted.
Aff
ord
abili
ty &
Fin
ance
Ho
usin
g a
ndN
eig
hbo
urho
od
Qua
lity
Cho
ice
Man
agem
ent
Eff
ectiv
enes
s

Lessons from the past, challenges for the future for housing policy: An evaluation of English housing policy 1975-2000
78
The
me
Sup
ply
, Nee
d a
nd A
cces
s
1999
2000
•A
ckno
wle
dgem
ent
of ‘l
owde
man
d’ p
robl
em (P
AT7)
.•
Urb
an T
ask
Forc
e R
epor
t.•
Eng
lish
Par
tner
ship
scr
eate
d ou
t of
mer
ger
ofC
NT
and
UR
A t
o pr
omot
e‘s
usta
inab
le c
omm
uniti
es’
agen
da.
•Fi
rst
Urb
an R
egen
erat
ion
Com
pany
.•
Reg
iona
l Hou
sing
Boa
rds
& S
tate
men
ts.
•P
PG
3 H
ousi
ng R
evis
ed:
emph
asis
on
brow
nfiel
d/ur
ban
deve
lopm
ent,
high
er d
ensi
ty, s
eque
ntia
lte
stin
g.
•M
ortg
age
inte
rest
rel
ief
ceas
es.
•P
art M
regu
latio
ns in
sist
on
mea
sure
s fo
r ac
cess
ibilit
ym
easu
res
in a
ll ne
who
usin
g.
•U
rban
Whi
te p
aper
set
sou
t po
lices
for
the
urba
nre
nais
sanc
e.•
Hou
sing
Gre
en P
aper
sign
als
new
em
phas
is o
ncr
eatin
g su
stai
nabl
eho
usin
g m
arke
ts.
•G
reen
Pap
er d
evel
ops
posi
tive
prop
osal
s fo
rim
prov
ing
the
cond
ition
of
coun
cil h
ousi
ng.
•R
ace
Rel
atio
ns A
ctam
ende
d: p
uts
a po
sitiv
edu
ty o
n al
l pub
licly
fund
edag
enci
es t
o pr
omot
era
cial
equ
ality
.
•C
CT
abol
ishe
d.
•H
ousi
ng In
spec
tora
tees
tabl
ishe
d to
ass
ess
loca
l aut
horit
y ho
usin
gpe
rform
ance
and
com
plia
nce
with
‘Bes
tVa
lue’
, whi
ch s
uper
sede
dC
CT
and
emph
asis
esqu
ality
as
wel
l as
cost
.
Aff
ord
abili
ty &
Fin
ance
Ho
usin
g a
ndN
eig
hbo
urho
od
Qua
lity
Cho
ice
Man
agem
ent
Eff
ectiv
enes
s

Price £15.00ISBN 1 85112 753 4
The report gives an overview of the keymessages from an independent desk-basedevaluation of English housing policy between1975 and 2000. Seven housing specific legaciesthat emerged from the evaluation period areidentified. An assessment of current issues forhousing policy at the end of the period ispresented. Finally, the key requirements forthe housing system to function well and themajor challenges for housing policy in thefuture are described.