Embed Size (px)
Citation preview
7.9 RECREATION

Draft Environmental Impact Report October 2007 Monterey Plus 7.9-1
7.9 RECREATION 7.9.1 INTRODUCTION 7.9.1.1 Content This section describes the impacts of the Monterey Amendment and Settlement Agreement on recreational resources. Only some elements of the proposed project have the potential to directly affect recreational resources or opportunities as a result of altered operations at Castaic Reservoir, Perris Lake, San Luis Reservoir, and Lake Oroville (see Table 7.9-1). Changes in river flows in the Feather, Sacramento, American, and San Joaquin rivers, attributable to the proposed project are too small to affect recreational uses in or along the rivers.
TABLE 7.9-1
IMPACTS OF PROPOSED PROJECT ELEMENTS ON RECREATIONAL RESOURCES Proposed Project Element Potentially Affected Environmental Resources Impact Number Monterey Amendment Reallocation of water supplies in droughts
Changes in recreation with changes in reservoir storage levels 7.9-1, 7.9-2
Permanent transfers of water Changes in recreation with changes in reservoir storage levels 7.9-1, 7.9-2
Transfer of Kern Fan Element lands NA NA Water supply management practices Changes in recreation with changes in reservoir
storage levels 7.9-1, 7.9-2 Restructured financial arrangements NA NA Settlement Agreement NA NA Note: NA – Not Applicable.
During public review of the NOP for this EIR, interested parties submitted comments regarding issues that should be evaluated in the EIR. One comment was received concerning recreational issues. The comment noted that the Plumas watershed is a strategic natural resource which would yield benefits from proper management, including streamflow augmentation, water storage in meadows, floodplain protection, water quality and quantity protection, and increased value through recreation and tourism. 7.9.1.2 Analytical Method The assessment of impacts on recreational resources was conducted in accordance with standard professional practices for CEQA evaluations. A professional consultant with substantial experience in recreational resource assessment conducted site visits to areas with recreational resources that could be affected by the proposed project. Other recreational resources were assessed through review of a variety of California Department of Water Resources (Department) or other public reports. These resources were exclusively associated with reservoirs, the operation of which could be affected by the proposed project. All reservoirs
7.9 Recreation
Draft Environmental Impact Report October 2007 Monterey Plus 7.9-2
analyzed herein are State Recreational Areas (SRAs) and operation of these SRAs are under jurisdiction of the California Department of Parks and Recreation (CDPR). Site visits to the facilities were used to record the types of recreational facilities and the shoreline characteristics of those facilities that could be affected by changes in water surface elevations. Such effects may influence the nature of recreation resources. Site visits to Perris Lake and Castaic Lake in May 2007 were used to analyze potential future impacts of drawdown on recreation resources. In addition on-site resource managers were asked their opinions on the relationship between water surface elevations and recreational resource values such as boating or fishing. Factors considered in the analysis include:
• monthly average water surface elevations under various project scenarios;
• relationship between water surface elevations and constructed recreation facilities and natural features that support recreational use; and
• monthly impacts on recreation based on different monthly average water surface elevations.
7.9.1.3 Standards of Significance The following standards of significance are based on Appendix G of the CEQA guidelines. For the purposes of the EIR, impacts on recreational resources would be considered significant if the proposed project would:
• substantially damage recreational resources or facilities; or
• result in a substantial reduction in recreational use or activities.
7.9.2 ENVIRONMENTAL SETTING 7.9.2.1 Physical Setting in 1995 Lake Oroville Lake Oroville is located on the Feather River in Butte County, near the City of Oroville. Lake Oroville and Oroville Dam, completed in 1968, are part of a complex which includes Hyatt Powerplant, Thermalito Diversion Dam and Powerplant, the Feather River Fish Hatchery, Thermalito Power Canal, Thermalito Forebay, Thermalito Pumping Generating Plant, Thermalito Afterbay, and the Lake Oroville Visitors Center (Figure 7.9-1). The Oroville-Thermalito Complex was designed as an efficient water and power system. It stores about 3.5 million acre-feet of water and generates power from releases made through Hyatt Powerplant and two other Thermalito generating plants. The Fish Diversion Dam was built to lead salmon and steelhead, returning to spawn, into the Feather River Fish Hatchery. At maximum pool, the water surface covers approximately 15,810 acres, or nearly 25 square miles, and has a 167-mile shoreline. Boating, camping, sailing, fishing, picnicking, horseback riding, wildlife viewing, fish hatchery tours, educational exhibits, and enjoyment of the scenery of the Sierra Nevada foothills are offered in and around the Lake Oroville. In 1994, the Department completed nearly half of a 35-mile long bicycle trail with completion scheduled for1997. Additionally, there are two full-service marinas, five car-top boat launch ramps, and ten floating campsites. Many of the reservoir’s recreational facilities within the Oroville SRA are
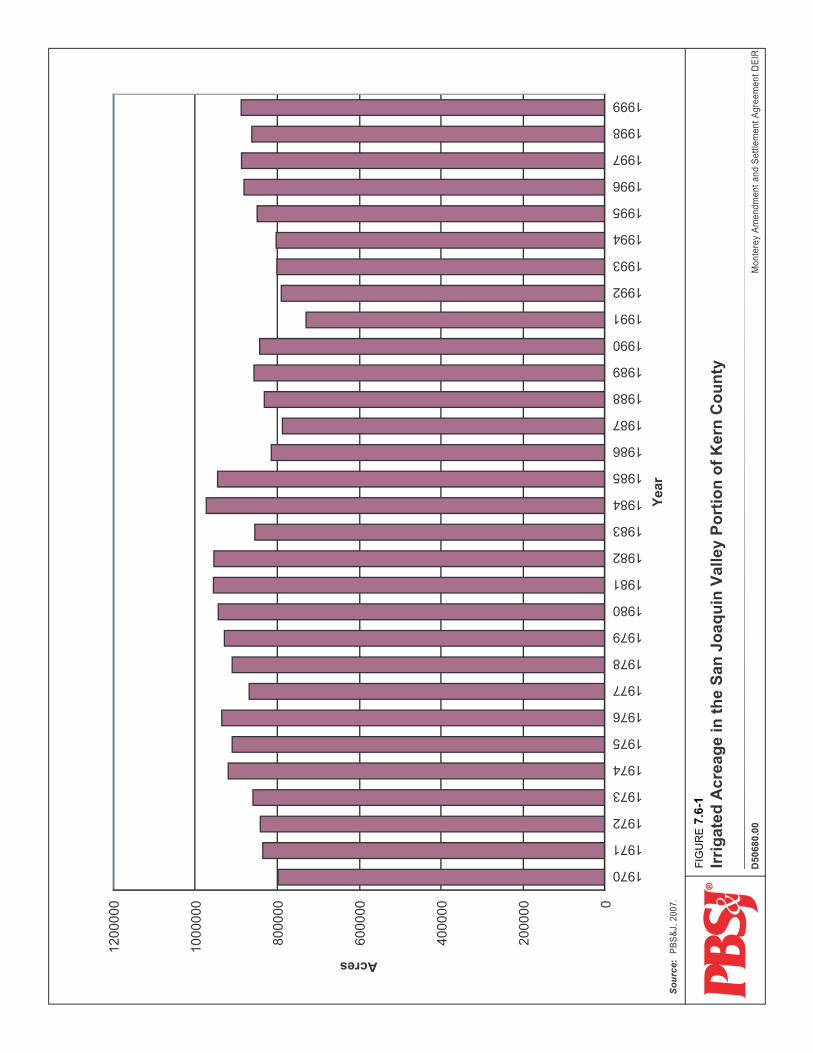
0000002
000004
000006
000008
0000001
0000021
1970
1971
1972
1973
1974
1975
1976
1977
1978
1979
1980
1981
1982
1983
1984
1985
1986
1987
1988
1989
1990
1991
1992
1993
1994
1995
1996
1997
1998
1999
raeY
Acres
ER
UGI F
71 -6.
ytnuoC nre
K fo noitroP yellaV niuqaoJ naS eht ni egaercA detagirrI
00.08605D
tnemeltteS dna tne
mdnemA ye retno
Mtne
meergARIE
D
ecruoS:
.7002 ,J&SB P
7.9 Recreation
Draft Environmental Impact Report October 2007 Monterey Plus 7.9-4
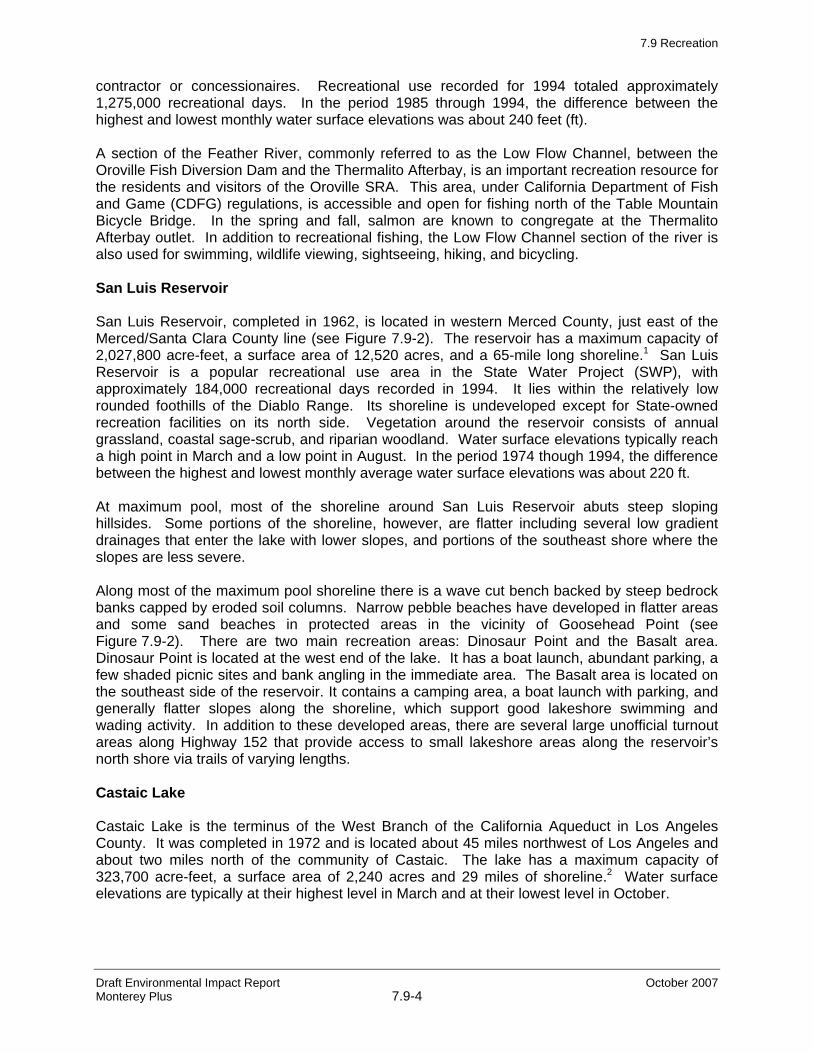
contractor or concessionaires. Recreational use recorded for 1994 totaled approximately 1,275,000 recreational days. In the period 1985 through 1994, the difference between the highest and lowest monthly water surface elevations was about 240 feet (ft). A section of the Feather River, commonly referred to as the Low Flow Channel, between the Oroville Fish Diversion Dam and the Thermalito Afterbay, is an important recreation resource for the residents and visitors of the Oroville SRA. This area, under California Department of Fish and Game (CDFG) regulations, is accessible and open for fishing north of the Table Mountain Bicycle Bridge. In the spring and fall, salmon are known to congregate at the Thermalito Afterbay outlet. In addition to recreational fishing, the Low Flow Channel section of the river is also used for swimming, wildlife viewing, sightseeing, hiking, and bicycling. San Luis Reservoir San Luis Reservoir, completed in 1962, is located in western Merced County, just east of the Merced/Santa Clara County line (see Figure 7.9-2). The reservoir has a maximum capacity of 2,027,800 acre-feet, a surface area of 12,520 acres, and a 65-mile long shoreline.1 San Luis Reservoir is a popular recreational use area in the State Water Project (SWP), with approximately 184,000 recreational days recorded in 1994. It lies within the relatively low rounded foothills of the Diablo Range. Its shoreline is undeveloped except for State-owned recreation facilities on its north side. Vegetation around the reservoir consists of annual grassland, coastal sage-scrub, and riparian woodland. Water surface elevations typically reach a high point in March and a low point in August. In the period 1974 though 1994, the difference between the highest and lowest monthly average water surface elevations was about 220 ft. At maximum pool, most of the shoreline around San Luis Reservoir abuts steep sloping hillsides. Some portions of the shoreline, however, are flatter including several low gradient drainages that enter the lake with lower slopes, and portions of the southeast shore where the slopes are less severe. Along most of the maximum pool shoreline there is a wave cut bench backed by steep bedrock banks capped by eroded soil columns. Narrow pebble beaches have developed in flatter areas and some sand beaches in protected areas in the vicinity of Goosehead Point (see Figure 7.9-2). There are two main recreation areas: Dinosaur Point and the Basalt area. Dinosaur Point is located at the west end of the lake. It has a boat launch, abundant parking, a few shaded picnic sites and bank angling in the immediate area. The Basalt area is located on the southeast side of the reservoir. It contains a camping area, a boat launch with parking, and generally flatter slopes along the shoreline, which support good lakeshore swimming and wading activity. In addition to these developed areas, there are several large unofficial turnout areas along Highway 152 that provide access to small lakeshore areas along the reservoir’s north shore via trails of varying lengths. Castaic Lake Castaic Lake is the terminus of the West Branch of the California Aqueduct in Los Angeles County. It was completed in 1972 and is located about 45 miles northwest of Los Angeles and about two miles north of the community of Castaic. The lake has a maximum capacity of 323,700 acre-feet, a surface area of 2,240 acres and 29 miles of shoreline.2 Water surface elevations are typically at their highest level in March and at their lowest level in October.
<
Q<
<
PortugueseCreek Area
BasaltArea
QuienSabe Pt.
GooseheadPoint
San LuisReservoir
Motorcycle Area
B.F. Sisk Dam
ParkEntrance
MadeirosArea
San Luis CreekArea
RomeroVisitorCenter
O'NeillForebay
San LuisReservoir
CottonwoodBay
HonkerBay
No SkiZone
No SkiZone
No SkiZone
No SkiZone
Lower CottonwoodCreek
Wildlife Area
Upper CottonwoodCreek
Wildlife Area
AþE
AþE
!"̂$
Califo
Cali forniaAqueductRo
mero Cre
ek
Cottonwood Creek
San Luis Crrek
Hidden C
reek
PortugueseCree
k
?üE
O'Neill ForebayWildlife Area
San LuisReservoir
Wildlife Area
Jaspe r Sears
Rd
Gonzaga Rd
McCabe R d
H
Campground
Campground
Campground
Picnic AreaPicnic Area Picnic Area
North Beach
South Beach
N:\G
ISP
roje
cts\
Mon
tere
y_P
lus _
EIR
_106
80\S
a n_L
uis.
mxd
D50860.00
FIGURE 7.9- 2
San Luis Reservoir Recreational Facilities
Monterey Plus and Settlement Agreement DEIR
°0 0.75 1.5
Miles1:95,040
Cottonwood Creek Wildlife Area
O'Neill Forebay Wildlife Area
San Luis Reservoir State Recreation Area
San Luis Reservoir Wildlife Area
< Campground
Q Picnic Area
North Beach
South Beach
7.9 Recreation
Draft Environmental Impact Report October 2007 Monterey Plus 7.9-6
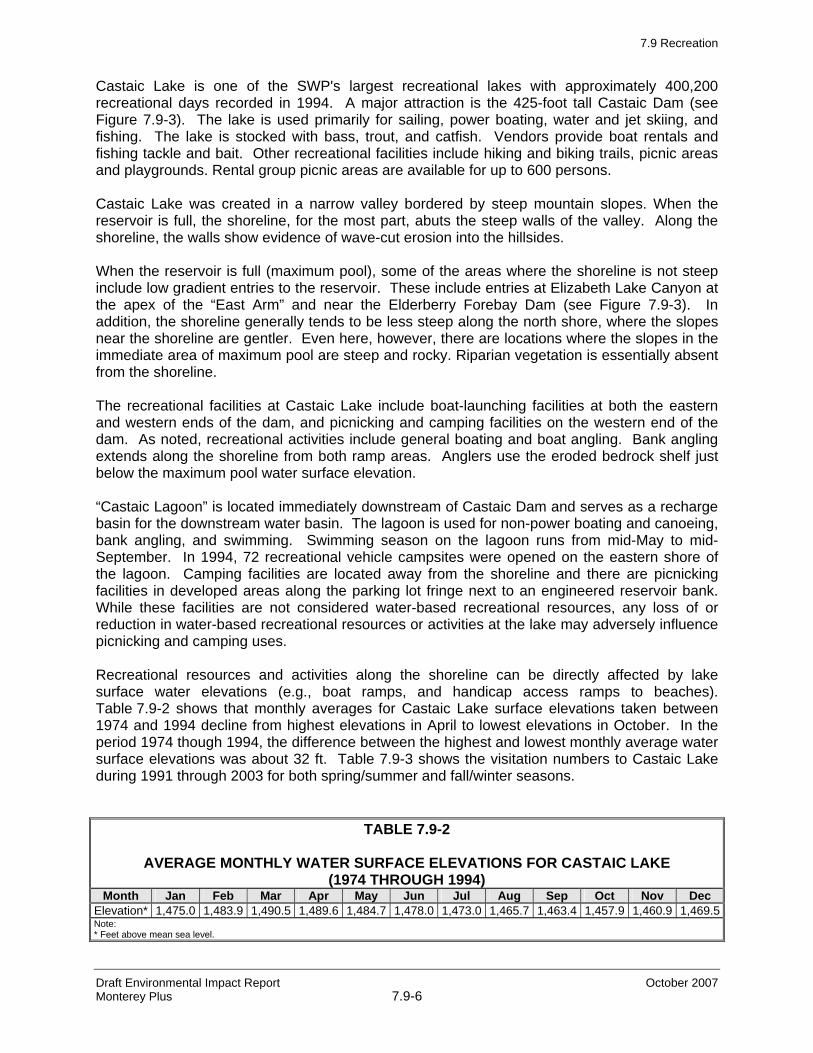
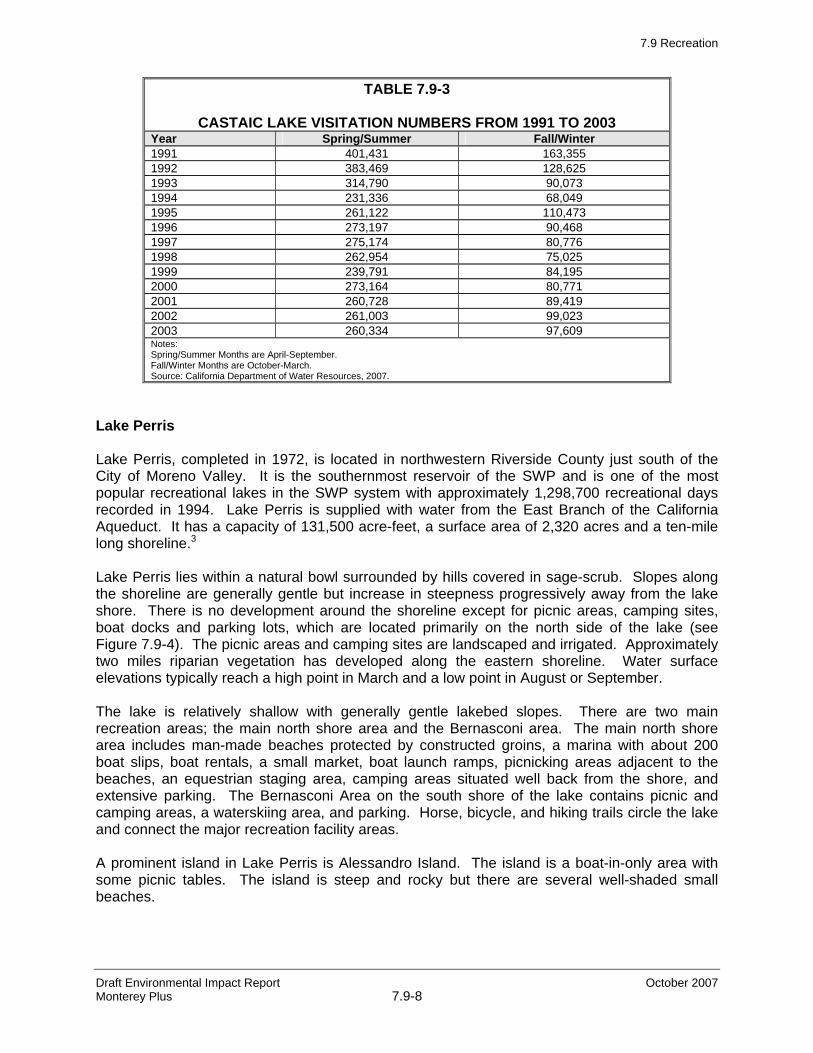
Castaic Lake is one of the SWP's largest recreational lakes with approximately 400,200 recreational days recorded in 1994. A major attraction is the 425-foot tall Castaic Dam (see Figure 7.9-3). The lake is used primarily for sailing, power boating, water and jet skiing, and fishing. The lake is stocked with bass, trout, and catfish. Vendors provide boat rentals and fishing tackle and bait. Other recreational facilities include hiking and biking trails, picnic areas and playgrounds. Rental group picnic areas are available for up to 600 persons. Castaic Lake was created in a narrow valley bordered by steep mountain slopes. When the reservoir is full, the shoreline, for the most part, abuts the steep walls of the valley. Along the shoreline, the walls show evidence of wave-cut erosion into the hillsides. When the reservoir is full (maximum pool), some of the areas where the shoreline is not steep include low gradient entries to the reservoir. These include entries at Elizabeth Lake Canyon at the apex of the “East Arm” and near the Elderberry Forebay Dam (see Figure 7.9-3). In addition, the shoreline generally tends to be less steep along the north shore, where the slopes near the shoreline are gentler. Even here, however, there are locations where the slopes in the immediate area of maximum pool are steep and rocky. Riparian vegetation is essentially absent from the shoreline. The recreational facilities at Castaic Lake include boat-launching facilities at both the eastern and western ends of the dam, and picnicking and camping facilities on the western end of the dam. As noted, recreational activities include general boating and boat angling. Bank angling extends along the shoreline from both ramp areas. Anglers use the eroded bedrock shelf just below the maximum pool water surface elevation. “Castaic Lagoon” is located immediately downstream of Castaic Dam and serves as a recharge basin for the downstream water basin. The lagoon is used for non-power boating and canoeing, bank angling, and swimming. Swimming season on the lagoon runs from mid-May to mid-September. In 1994, 72 recreational vehicle campsites were opened on the eastern shore of the lagoon. Camping facilities are located away from the shoreline and there are picnicking facilities in developed areas along the parking lot fringe next to an engineered reservoir bank. While these facilities are not considered water-based recreational resources, any loss of or reduction in water-based recreational resources or activities at the lake may adversely influence picnicking and camping uses. Recreational resources and activities along the shoreline can be directly affected by lake surface water elevations (e.g., boat ramps, and handicap access ramps to beaches). Table 7.9-2 shows that monthly averages for Castaic Lake surface elevations taken between 1974 and 1994 decline from highest elevations in April to lowest elevations in October. In the period 1974 though 1994, the difference between the highest and lowest monthly average water surface elevations was about 32 ft. Table 7.9-3 shows the visitation numbers to Castaic Lake during 1991 through 2003 for both spring/summer and fall/winter seasons.
TABLE 7.9-2
AVERAGE MONTHLY WATER SURFACE ELEVATIONS FOR CASTAIC LAKE (1974 THROUGH 1994)
Month Jan Feb Mar Apr May Jun Jul Aug Sep Oct Nov Dec Elevation* 1,475.0 1,483.9 1,490.5 1,489.6 1,484.7 1,478.0 1,473.0 1,465.7 1,463.4 1,457.9 1,460.9 1,469.5Note: * Feet above mean sea level.
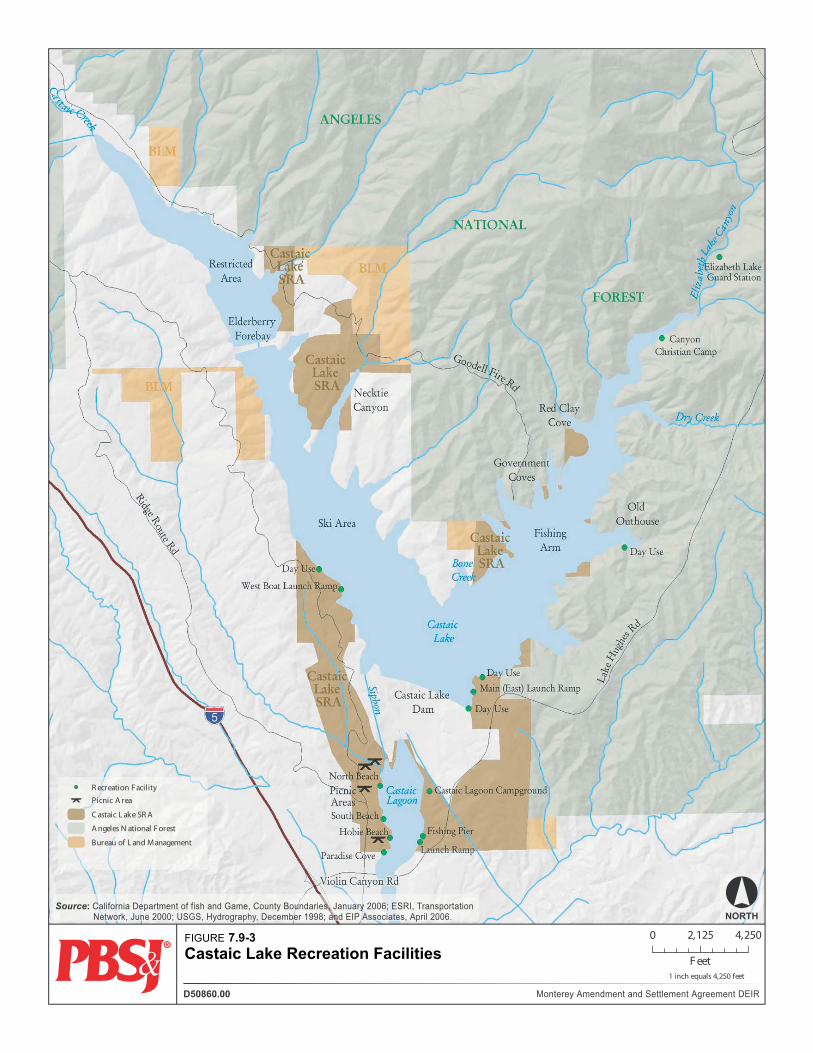
FIGURE 7.9-3Castaic Lake Recreation Facilities
D50860.00 Monterey Amendment and Settlement Agreement DEIR
Source: California Department of fish and Game, County Boundaries, January 2006; ESRI, Transportation Network, June 2000; USGS, Hydrography, December 1998; and EIP Associates, April 2006. NORTH
0 2,125 4,250
Feet1 inch equals 4,250 feet
ï Picnic A rea
R ecreation Facility
A ngeles N ational F orest
C astaic L ake SR A
Bureau of L and Management
7.9 Recreation
Draft Environmental Impact Report October 2007 Monterey Plus 7.9-8
TABLE 7.9-3
CASTAIC LAKE VISITATION NUMBERS FROM 1991 TO 2003 Year Spring/Summer Fall/Winter 1991 401,431 163,355 1992 383,469 128,625 1993 314,790 90,073 1994 231,336 68,049 1995 261,122 110,473 1996 273,197 90,468 1997 275,174 80,776 1998 262,954 75,025 1999 239,791 84,195 2000 273,164 80,771 2001 260,728 89,419 2002 261,003 99,023 2003 260,334 97,609 Notes: Spring/Summer Months are April-September. Fall/Winter Months are October-March. Source: California Department of Water Resources, 2007.
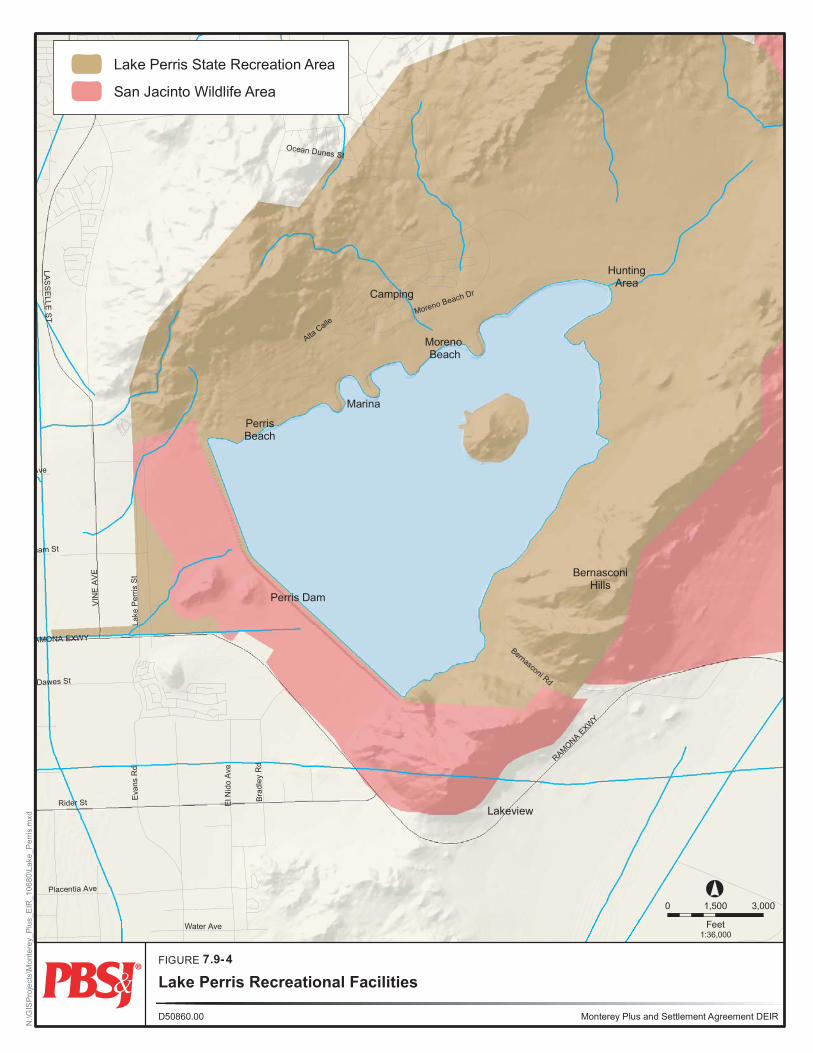
Lake Perris Lake Perris, completed in 1972, is located in northwestern Riverside County just south of the City of Moreno Valley. It is the southernmost reservoir of the SWP and is one of the most popular recreational lakes in the SWP system with approximately 1,298,700 recreational days recorded in 1994. Lake Perris is supplied with water from the East Branch of the California Aqueduct. It has a capacity of 131,500 acre-feet, a surface area of 2,320 acres and a ten-mile long shoreline.3 Lake Perris lies within a natural bowl surrounded by hills covered in sage-scrub. Slopes along the shoreline are generally gentle but increase in steepness progressively away from the lake shore. There is no development around the shoreline except for picnic areas, camping sites, boat docks and parking lots, which are located primarily on the north side of the lake (see Figure 7.9-4). The picnic areas and camping sites are landscaped and irrigated. Approximately two miles riparian vegetation has developed along the eastern shoreline. Water surface elevations typically reach a high point in March and a low point in August or September. The lake is relatively shallow with generally gentle lakebed slopes. There are two main recreation areas; the main north shore area and the Bernasconi area. The main north shore area includes man-made beaches protected by constructed groins, a marina with about 200 boat slips, boat rentals, a small market, boat launch ramps, picnicking areas adjacent to the beaches, an equestrian staging area, camping areas situated well back from the shore, and extensive parking. The Bernasconi Area on the south shore of the lake contains picnic and camping areas, a waterskiing area, and parking. Horse, bicycle, and hiking trails circle the lake and connect the major recreation facility areas. A prominent island in Lake Perris is Alessandro Island. The island is a boat-in-only area with some picnic tables. The island is steep and rocky but there are several well-shaded small beaches.
MorenoBeach
HuntingArea
BernasconiHills
Lakeview
Perris Dam
PerrisBeach
Marina
Camping
RAMONAEXW
Y
AMONA EXWY
ham St
Ave
Ocean Dunes St
Moreno Beach Dr
AltaCalle
Bernasconi Rd
Rider St
Placentia Ave
VIN
EA
VE
Lake
Per
risS
t
LAS
SE
LLES
T
Dawes St
Water Ave
ElN
ido
Ave
Eva
nsR
d
Bra
dley
Rd
N:\G
ISP
roje
cts\
Mon
tere
y_P
lus_
EIR
_106
80\L
ake_
Per
ris.m
xd
D50860.00
FIGURE 7.9- 4
Lake Perris Recreational Facilities
Monterey Plus and Settlement Agreement DEIR
°0 1,500 3,000
Feet1:36,000
Lake Perris State Recreation Area
San Jacinto Wildlife Area
7.9 Recreation
Draft Environmental Impact Report October 2007 Monterey Plus 7.9-10
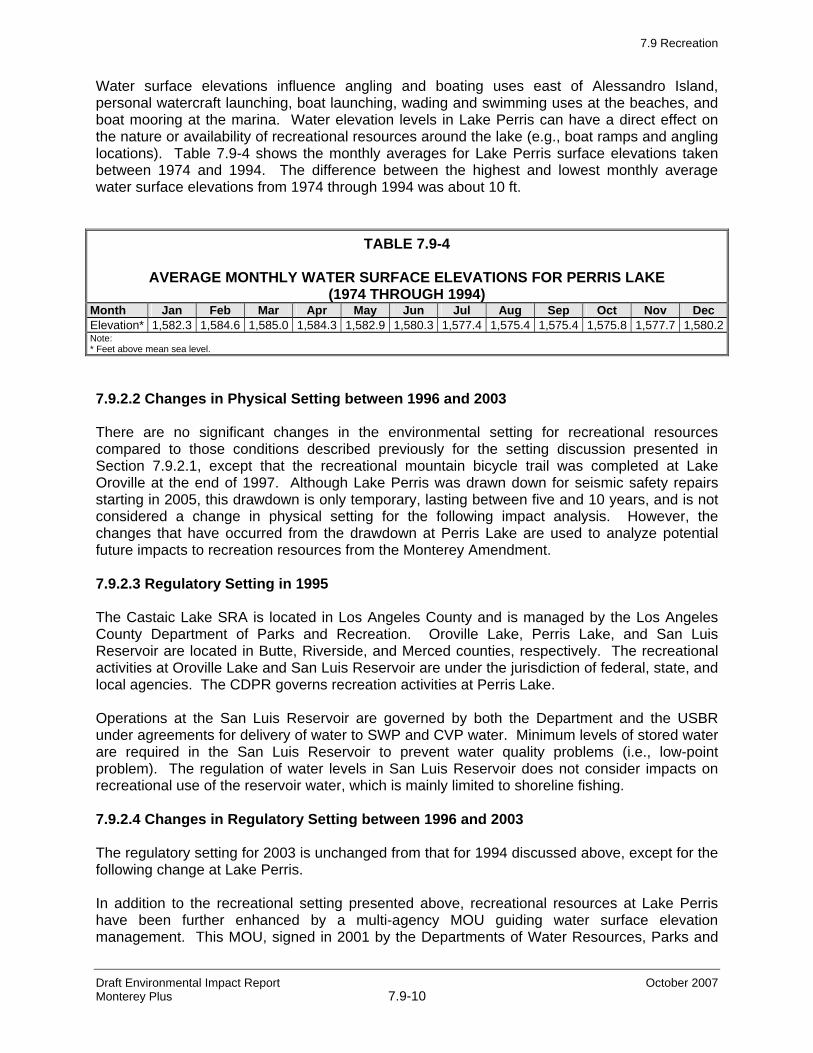
Water surface elevations influence angling and boating uses east of Alessandro Island, personal watercraft launching, boat launching, wading and swimming uses at the beaches, and boat mooring at the marina. Water elevation levels in Lake Perris can have a direct effect on the nature or availability of recreational resources around the lake (e.g., boat ramps and angling locations). Table 7.9-4 shows the monthly averages for Lake Perris surface elevations taken between 1974 and 1994. The difference between the highest and lowest monthly average water surface elevations from 1974 through 1994 was about 10 ft.
TABLE 7.9-4
AVERAGE MONTHLY WATER SURFACE ELEVATIONS FOR PERRIS LAKE (1974 THROUGH 1994)
Month Jan Feb Mar Apr May Jun Jul Aug Sep Oct Nov Dec Elevation* 1,582.3 1,584.6 1,585.0 1,584.3 1,582.9 1,580.3 1,577.4 1,575.4 1,575.4 1,575.8 1,577.7 1,580.2Note: * Feet above mean sea level.
7.9.2.2 Changes in Physical Setting between 1996 and 2003 There are no significant changes in the environmental setting for recreational resources compared to those conditions described previously for the setting discussion presented in Section 7.9.2.1, except that the recreational mountain bicycle trail was completed at Lake Oroville at the end of 1997. Although Lake Perris was drawn down for seismic safety repairs starting in 2005, this drawdown is only temporary, lasting between five and 10 years, and is not considered a change in physical setting for the following impact analysis. However, the changes that have occurred from the drawdown at Perris Lake are used to analyze potential future impacts to recreation resources from the Monterey Amendment. 7.9.2.3 Regulatory Setting in 1995 The Castaic Lake SRA is located in Los Angeles County and is managed by the Los Angeles County Department of Parks and Recreation. Oroville Lake, Perris Lake, and San Luis Reservoir are located in Butte, Riverside, and Merced counties, respectively. The recreational activities at Oroville Lake and San Luis Reservoir are under the jurisdiction of federal, state, and local agencies. The CDPR governs recreation activities at Perris Lake. Operations at the San Luis Reservoir are governed by both the Department and the USBR under agreements for delivery of water to SWP and CVP water. Minimum levels of stored water are required in the San Luis Reservoir to prevent water quality problems (i.e., low-point problem). The regulation of water levels in San Luis Reservoir does not consider impacts on recreational use of the reservoir water, which is mainly limited to shoreline fishing. 7.9.2.4 Changes in Regulatory Setting between 1996 and 2003 The regulatory setting for 2003 is unchanged from that for 1994 discussed above, except for the following change at Lake Perris. In addition to the recreational setting presented above, recreational resources at Lake Perris have been further enhanced by a multi-agency MOU guiding water surface elevation management. This MOU, signed in 2001 by the Departments of Water Resources, Parks and
7.9 Recreation
Draft Environmental Impact Report October 2007 Monterey Plus 7.9-11
Recreation, Boating and Waterways, and CDFG along with MWDSC, established the “Lake Perris Operations Guidelines”. These guidelines are as follows:
• seek to fill or refill and maintain an elevation of 1,584 ft from the Saturday following the Memorial Day holiday to Labor Day;
• limit elevation change to 0.5 ft per day, with an objective to limit change no more than three feet, from March 15th through May 1st; and
• maintain full reservoir operational flexibility from the Tuesday following Labor Day until March 14.
In addition, these guidelines provide recreational resource protection, benefits to fishery resources and improved water quality at Lake Perris. 7.9.3 IMPACTS AND MITIGATION MEASURES 7.9-1 Implementation of the proposed project could potentially affect recreational
resources at Castaic Lake and Lake Perris. 1996 — 2003 Several provisions of the Monterey Amendment have the potential to affect water surface elevations in Castaic Lake and Lake Perris. They include transfer and retirement of Table A amounts, the altered water allocation procedures and the water supply management practices. The Settlement Agreement would have no effect on water surface elevations. An evaluation of the effects of the Monterey Amendment on water surface elevations in the four reservoirs is contained in Section 7.1, Surface Water Hydrology, Water Quality, and Water Supply. Although the primary purpose of the reservoirs is water supply, they also provide recreational opportunities. Recreation resources at each of the reservoirs are affected by water surface elevations. The following paragraphs describe potential effects of the Monterey Amendment on recreational resources at each of the reservoirs. Castaic Lake Average water surface elevations in Castaic Lake increased about 20 ft between 1996 and 2003 compared to the pre-1995 condition. The raise is attributable to several factors but the Monterey Amendment is primary among them. The Article 54 provisions of the Monterey Amendment permit borrowing of water from Castaic Lake by three contractors under certain conditions. Although this caused the water surface of the reservoir to be drawn down at times between 1996 and 2003, the drawdown remained within the range experienced prior to 1995. As discussed earlier in this section, there is a direct relationship between surface water elevations in Castaic Lake and the availability of recreational facilities and uses. One example is the wave-cut bench, cut into the generally steep reservoir slopes, and located generally about 15 ft below the maximum pool elevation. This bench provides bank angling opportunities, but at high water surface elevations the bench is underwater. The bank is available to support angling at water surface elevations from about 15 to 35 ft below the maximum pool elevation. At maximum pool conditions (surface elevation at 1,515 ft above sea level) for example, the lake’s boating capacity is maximized at 500 boats. At a 1,500-ft elevation, the bedrock shelf around the lake becomes useable for bank fishing. Below the elevation 1,495 ft, navigational hazards begin to emerge, and between 1,485 ft and 1,460 ft, boating safety hazards are at their
7.9 Recreation
Draft Environmental Impact Report October 2007 Monterey Plus 7.9-12
maximum. At 1,485 ft, four of the six lanes of the West Launch boat ramp become unusable. The remaining two lanes at West Launch are lost when lake elevations recede beneath 1,480 ft. In addition to the loss of use of the West Launch ramp, a number of other adverse effects on recreational facilities and use occur when lake elevations drop below 1,480 ft. These include significant reductions in the surface area of the “arms” of the lake, detracting from the recreational boating experience. Also, the lake’s boating capacity is reduced to 300 boats and bank angling in the West Arm of Castaic Lake is lost. As discussed in Section 7.1, borrowing of water by contractors has the potential to lower the water surface elevations at Castaic Lake at times, but, in fact, the average water surface elevation was higher between 1996 and 2003 than in the pre-Monterey Amendment period before 1995. The average water surface elevation at Castaic Lake from 1996 to 2003 was about 20 ft higher than between 1974 and 1994. As shown in Figure 7.1-6 in Section 7.1, monthly average Castaic Lake water storage volumes were higher throughout the year between 1996 and 2003 compared to pre-1995 conditions. Of particular significance were increases in water surface elevations in excess of 20 ft from May through December. The higher storage volumes and surface elevations were mainly a result of the Department storing more water in the reservoir in anticipation of future withdrawals. The Department was able to accomplish this because of wetter years during this time period. Because the proposed project generally increased water storage volumes, and thus surface elevations, throughout the years, the project had a net positive effect on recreational resource assets. The only activity that might have been adversely affected is bank angling, which in part depends on access to specific bedrock benches at around elevation 1,500 ft. Lake Perris Average water surface elevations in Lake Perris increased about four feet between 1996 and 2003 compared to the pre-1995 condition. The raise is primarily attributable to the Monterey Amendment. The Article 54 provisions of the Monterey Amendment permit borrowing of water from Lake Perris by MWDSC under certain conditions. Although this caused the water surface of the reservoir to be drawn down at times between 1996 and 2003, the drawdown remained within the range experienced prior to 1995. As discussed above, there is a direct relationship between surface water elevations in Lake Perris and the availability of recreational facilities and uses. For example, at a surface water elevation of 1,594 ft, the lake is at maximum pool and maintains a 450-boat capacity. At elevation 1,580 ft and lower, boat ramp #7 becomes inoperative. At 1,575 ft the waterlines at Lake Perris beaches get further from shade and picnicking and parking facilities. At 1,570 ft and lower, the east end of the lake becomes unusable and boating capacity is significantly reduced. In addition, boat ramp #5 and the Power Cover ramp (#14) become inoperative at around 1,570 ft. Normal low pool is achieved at a surface elevation of 1,560 ft and ramp #6 becomes inoperative at 1,548 ft. Lastly, “low low pool” is achieved at 1,540 ft. As shown in Figure 7.1-7 in Section 7.1, monthly average water storage volumes, and thus water surface elevations, at Lake Perris were higher from May through December. Monthly average surface elevations corresponding to storage volumes show increases between five and 10 ft from July through November. Water levels since 1995 for the period between January through April were slightly higher than prior to 1995. The Department was able to accomplish this because of wetter years during this time period. As the proposed project generally
7.9 Recreation
Draft Environmental Impact Report October 2007 Monterey Plus 7.9-13
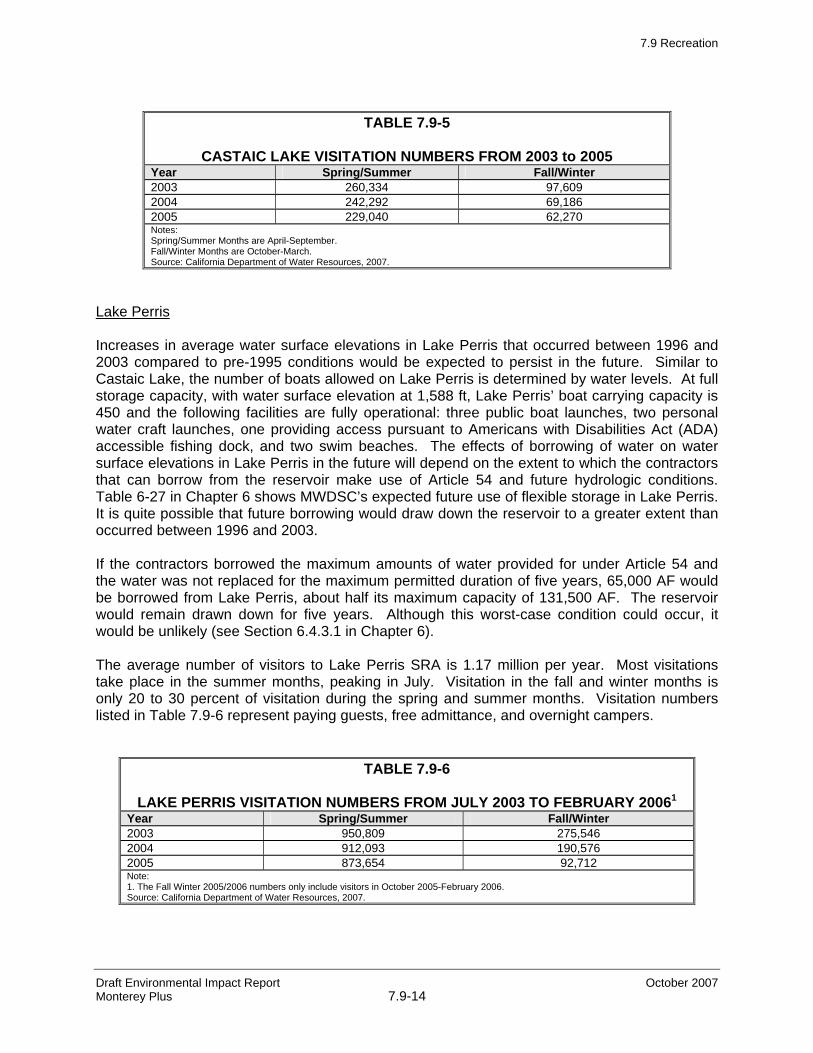
increased water surface elevations through much of the year, the project had a net beneficial effect on recreational resource. Impact Conclusion The proposed project had a modestly beneficial effect on recreational resources at Castaic Lake and Lake Perris between 1995 and 2003. The proposed project had a less-than-significant impact on recreation at these two reservoirs. Mitigation Measures None required. Future Impacts Castaic Lake Increases in average water surface elevations in Castaic Lake that occurred between 1996 and 2003 compared to pre-1995 conditions would be expected to persist in the future during the same water year conditions. The effects of borrowing of water on water surface elevations in Castaic Lake in the future will depend on the extent to which the contractors that can borrow from the reservoir make use of Article 54 and future hydrologic conditions. Table 6-27 in Chapter 6 shows MWDSC’s expected future use of flexible storage in Castaic Lake. It is quite possible that future borrowing would draw down the reservoir to a greater extent than occurred between 1996 and 2003. If the contractors borrowed the maximum amounts of water provided for under Article 54 and the water was not replaced for the maximum permitted duration of five years, 160,000 AF would be borrowed from Castaic Lake; about half its maximum capacity. The reservoir would remain drawn down for five years. Although this worst-case condition could occur, it would be unlikely (see Section 6.4.3.1 in Chapter 6). If the worst-condition were to occur, there is a greater opportunity for damage to occur to the boat docks. Boating hazards increase as lake levels decrease, and waterskiing is also impacted. A three foot elevation drop will close the beaches at Castaic Lake. Historically, Castaic Lake has seen water levels drop annually that impacted recreational opportunities. However, recreation at Castaic Lake has not had to deal with the impacts of an extended drawdown (more than one year) with half the full pool volume. An extended drawdown during the summer at Castaic could eliminate waterskiing and force more stringent speed controls on boats. Additionally, the quality of fishing and the amount of fishing opportunities would be decreased during an extended drawdown. Records of lake visitation numbers at Castaic Lake from 2003 to 2005 in Table 7.9-5, show that during the last significant drawdown of the lake (during 2005) visitation numbers fell by seven to 12 percent during the summer months and about 30 to 36 percent during the winter months from 2003 through 2005. Therefore, impacts of an extended drawdown would be expected to result in a greater reduction in visitation numbers. Although drawdown would be expected to remain within the normal SWP operating range experienced prior to 2003 in the future, in the worst-case scenario, contractors could drawdown by half the volume of the lake, as allowed under Article 54, for up to five years before repayment of water, and reduce recreational use, resulting in potentially significant impacts to recreation.
7.9 Recreation
Draft Environmental Impact Report October 2007 Monterey Plus 7.9-14
TABLE 7.9-5
CASTAIC LAKE VISITATION NUMBERS FROM 2003 to 2005 Year Spring/Summer Fall/Winter 2003 260,334 97,609 2004 242,292 69,186 2005 229,040 62,270 Notes: Spring/Summer Months are April-September. Fall/Winter Months are October-March. Source: California Department of Water Resources, 2007.
Lake Perris Increases in average water surface elevations in Lake Perris that occurred between 1996 and 2003 compared to pre-1995 conditions would be expected to persist in the future. Similar to Castaic Lake, the number of boats allowed on Lake Perris is determined by water levels. At full storage capacity, with water surface elevation at 1,588 ft, Lake Perris’ boat carrying capacity is 450 and the following facilities are fully operational: three public boat launches, two personal water craft launches, one providing access pursuant to Americans with Disabilities Act (ADA) accessible fishing dock, and two swim beaches. The effects of borrowing of water on water surface elevations in Lake Perris in the future will depend on the extent to which the contractors that can borrow from the reservoir make use of Article 54 and future hydrologic conditions. Table 6-27 in Chapter 6 shows MWDSC’s expected future use of flexible storage in Lake Perris. It is quite possible that future borrowing would draw down the reservoir to a greater extent than occurred between 1996 and 2003. If the contractors borrowed the maximum amounts of water provided for under Article 54 and the water was not replaced for the maximum permitted duration of five years, 65,000 AF would be borrowed from Lake Perris, about half its maximum capacity of 131,500 AF. The reservoir would remain drawn down for five years. Although this worst-case condition could occur, it would be unlikely (see Section 6.4.3.1 in Chapter 6). The average number of visitors to Lake Perris SRA is 1.17 million per year. Most visitations take place in the summer months, peaking in July. Visitation in the fall and winter months is only 20 to 30 percent of visitation during the spring and summer months. Visitation numbers listed in Table 7.9-6 represent paying guests, free admittance, and overnight campers.
TABLE 7.9-6
LAKE PERRIS VISITATION NUMBERS FROM JULY 2003 TO FEBRUARY 20061
Year Spring/Summer Fall/Winter 2003 950,809 275,546 2004 912,093 190,576 2005 873,654 92,712 Note: 1. The Fall Winter 2005/2006 numbers only include visitors in October 2005-February 2006. Source: California Department of Water Resources, 2007.
7.9 Recreation
Draft Environmental Impact Report October 2007 Monterey Plus 7.9-15
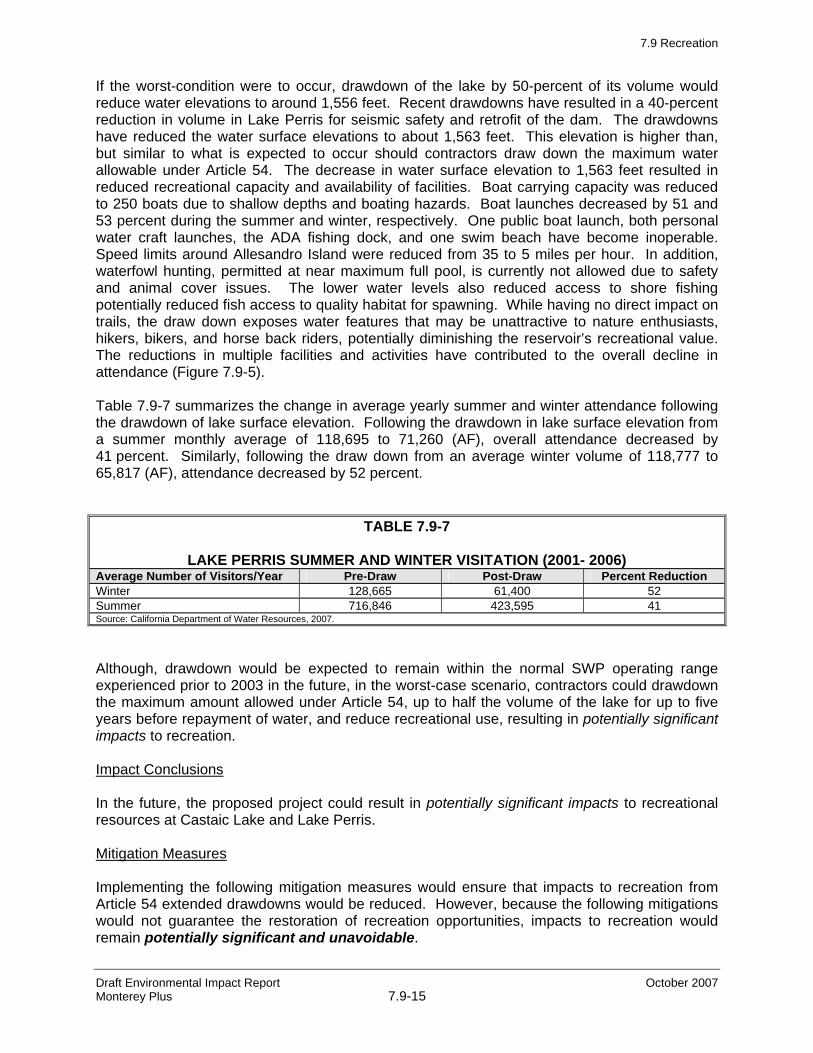
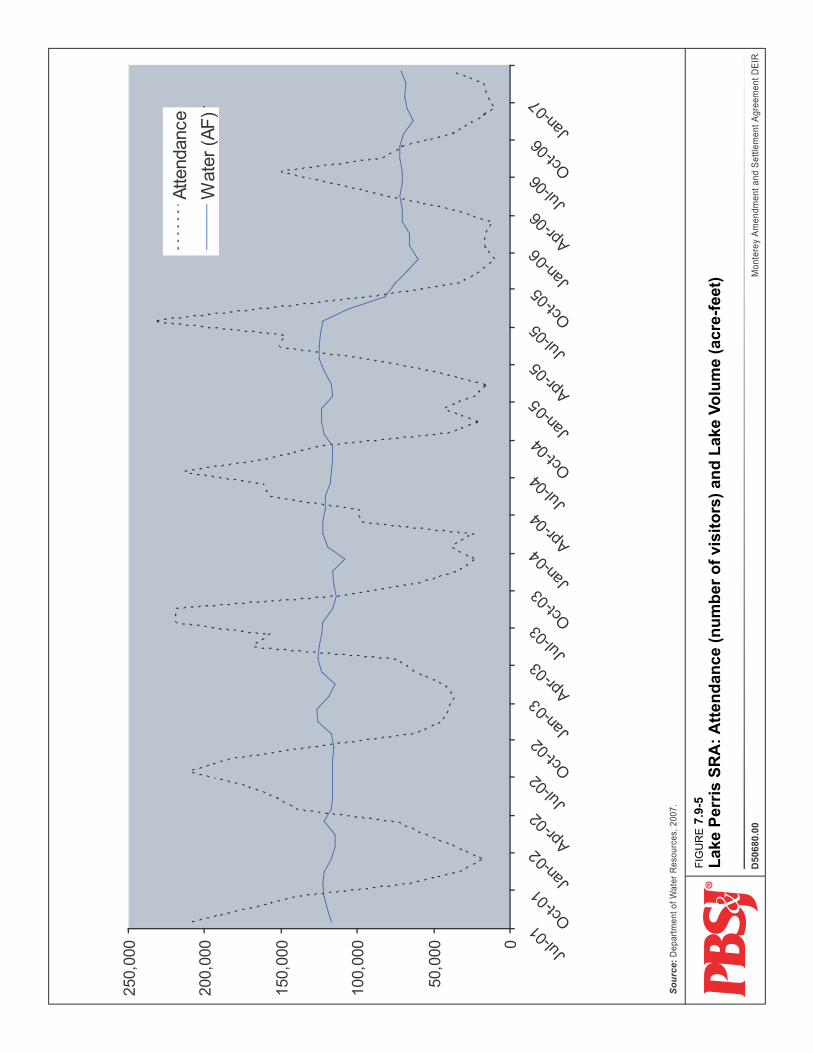
If the worst-condition were to occur, drawdown of the lake by 50-percent of its volume would reduce water elevations to around 1,556 feet. Recent drawdowns have resulted in a 40-percent reduction in volume in Lake Perris for seismic safety and retrofit of the dam. The drawdowns have reduced the water surface elevations to about 1,563 feet. This elevation is higher than, but similar to what is expected to occur should contractors draw down the maximum water allowable under Article 54. The decrease in water surface elevation to 1,563 feet resulted in reduced recreational capacity and availability of facilities. Boat carrying capacity was reduced to 250 boats due to shallow depths and boating hazards. Boat launches decreased by 51 and 53 percent during the summer and winter, respectively. One public boat launch, both personal water craft launches, the ADA fishing dock, and one swim beach have become inoperable. Speed limits around Allesandro Island were reduced from 35 to 5 miles per hour. In addition, waterfowl hunting, permitted at near maximum full pool, is currently not allowed due to safety and animal cover issues. The lower water levels also reduced access to shore fishing potentially reduced fish access to quality habitat for spawning. While having no direct impact on trails, the draw down exposes water features that may be unattractive to nature enthusiasts, hikers, bikers, and horse back riders, potentially diminishing the reservoir’s recreational value. The reductions in multiple facilities and activities have contributed to the overall decline in attendance (Figure 7.9-5). Table 7.9-7 summarizes the change in average yearly summer and winter attendance following the drawdown of lake surface elevation. Following the drawdown in lake surface elevation from a summer monthly average of 118,695 to 71,260 (AF), overall attendance decreased by 41 percent. Similarly, following the draw down from an average winter volume of 118,777 to 65,817 (AF), attendance decreased by 52 percent.
TABLE 7.9-7
LAKE PERRIS SUMMER AND WINTER VISITATION (2001- 2006) Average Number of Visitors/Year Pre-Draw Post-Draw Percent Reduction Winter 128,665 61,400 52 Summer 716,846 423,595 41 Source: California Department of Water Resources, 2007.
Although, drawdown would be expected to remain within the normal SWP operating range experienced prior to 2003 in the future, in the worst-case scenario, contractors could drawdown the maximum amount allowed under Article 54, up to half the volume of the lake for up to five years before repayment of water, and reduce recreational use, resulting in potentially significant impacts to recreation. Impact Conclusions In the future, the proposed project could result in potentially significant impacts to recreational resources at Castaic Lake and Lake Perris. Mitigation Measures Implementing the following mitigation measures would ensure that impacts to recreation from Article 54 extended drawdowns would be reduced. However, because the following mitigations would not guarantee the restoration of recreation opportunities, impacts to recreation would remain potentially significant and unavoidable.
0000,05
000,001
000,051
000,002
000,052
10-l uJ
10-t c O
20- naJ
20-r pA
20-l uJ
20-t c O
30- naJ
30-r pA
30-l uJ
30-t c O
40- naJ
40-r pA
40-l uJ
40-t c O
50- naJ
50-r pA
50-l uJ
50-t c O
60- naJ
60-r pA
60-l uJ
60-t c O
70- naJ
ecnadnettA reta
W(
FA)
ER
UGI F
5-9. 7)teef-erca( e
muloV ekaL dna )srotisiv fo rebmun( ecnadnett
A :A
RS sirreP ekaL
00.08605D
ecruoS:
.7002 , secruoseR reta
W fo tnemtr ape
D
RIED tne
meergA tnem eltteS dna tne
mdnemA y eretno
M
7.9 Recreation
Draft Environmental Impact Report October 2007 Monterey Plus 7.9-17
7.9-1 a) The Department shall notify the public at the onset of the loss of recreational resources due to Article 54 drawdowns at Perris Lake and Castaic Reservoir. Notification shall be made until the withdrawal is repaid through local media outlets including, but not limited to, newspapers and radio, local parks and recreation departments, and on the CDPR’s website. If the maximum amount in Article 54 is withdrawn from either reservoir, then the Department shall use television advertisements to inform the public of the severity and duration of the Article 54 drawdown.
b) To the extent feasible, the Department shall install, extend, or upgrade existing
facilities (including lifeguard towers and emergency assistance equipment) to allow safe access to lower lake levels during multi-year drawdowns.
c) The Department shall monitor water quality during drawdown periods and when
swimming is allowed using the current full-body contact criteria and laboratory methods adopted by the California Department of Health Services or the U.S. Environmental Protection Agency, as applicable.
d) The Department shall prepare and provide funding for a management plan to
control invasive plant species that could expand into recreational areas during extended drawdown periods.
7.9-2 Implementation of the proposed project could potentially affect recreational
resources at San Luis Reservoir and Lake Oroville. 1996 — 2003 Several provisions of the Monterey Amendment have the potential to affect water surface elevations in Lake Oroville and San Luis Reservoir. They include transfer and retirement of Table A amounts, the altered water allocation procedures and the water supply management practices. The Settlement Agreement would have no effect on water surface elevations. An evaluation of the effects of the Monterey Amendment on water surface elevations in the four reservoirs is contained in Section 7.1. Although the primary purpose of the reservoirs is water supply, they also provide recreational opportunities. Recreation resources at each of the reservoirs are affected by water surface elevations. The following paragraphs describe potential effects of the Monterey Amendment on recreational resources at each of the reservoirs. Lake Oroville The proposed project had very little effect on water storage in Lake Oroville under 2003 conditions as shown in Figure 7.1-4 in Section 7.1. Consequently, it had little or no effect on water surface elevations or recreational resources. San Luis Reservoir As described in Section 7.1, Surface Water Hydrology, Water Quality, and Water Supply, the proposed project affected water levels in San Luis Reservoir. Occasionally, several of the water supply management practices that are part of the Monterey Amendment (Article 56) caused filling of the reservoir to be delayed by a few months in the winter and early spring relative to the
7.9 Recreation
Draft Environmental Impact Report October 2007 Monterey Plus 7.9-18
baseline scenario. However, average water surface elevation increased during this period, as shown in Figure 7.1-5 in Section 7.1. The primary recreational activity at San Luis Reservoir is shoreline angling. A wave-cut bedrock bench cut into the generally steep reservoir slopes is located about 12 ft below the maximum pool elevation. This bench provides angling opportunities when the water surface elevation is 12 to 32 ft below the maximum pool elevation. The raise in average water surface elevations attributable to the proposed project may have a modest beneficial effect on shoreline angling. San Luis Reservoir is drawn down in the summer and fall almost every year. The slightly higher water levels may enable angling from the bench to persist a little longer into the summer than with the baseline scenario. The occasional depression of water surface elevations as a result of Article 56 provisions would occur in the winter months when recreation is minimal. If lowered water levels persist into the spring it may delay the start of angling from the bench. The proposed project had no effect on recreational resources at Lake Oroville and minimal effect on recreational resources at San Luis Reservoir between 1996 and 2003. Therefore, the proposed project had a less-than-significant impact on recreation at the Lake Oroville and San Luis Reservoir. Mitigation Measures None required. Future Impacts Lake Oroville The proposed project would have very little effect on water storage in Lake Oroville under 2020 conditions as shown in Figure 7.1-8 in Section 7.1. Consequently, it would have little or no effect on water surface elevations or recreational resources in the future. San Luis Reservoir The proposed project would increase storage in San Luis Reservoir much of the time under 2020 conditions as shown in Figure 7.1-9 in Section 7.1. Average water surface elevations would rise by 10 to 20 ft compared to the baseline scenario. Occasionally, several of the water supply management practices that are part of the Monterey Amendment (Article 56) would cause filling of the reservoir to be delayed by a few months in the winter and early spring relative to the baseline scenario. Water levels could be reduced by up to 50 ft. The raise in average water surface elevations in the future attributable to the proposed project may have a modest beneficial effect on shoreline angling. San Luis Reservoir is drawn down in the summer and fall almost every year. The slightly higher water levels may enable angling from the bench to persist a little longer into the summer than with the baseline scenario. The occasional depression of water surface elevations as a result of Article 56 provisions would occur in the winter months when recreation is minimal. If lowered water levels persist into the spring it may delay the start of angling from the bench. However, the proposed project would result in less-than-significant impacts to recreational activities in San Luis Reservoir compared to baseline conditions.
7.9 Recreation
Draft Environmental Impact Report October 2007 Monterey Plus 7.9-19
In the future, the proposed project would have no effect on recreational resources at Lake Oroville and a minimal effect on recreational resources at San Luis Reservoir. Therefore, the proposed project would have a less-than-significant impact on recreation at these two reservoirs. Mitigation Measures None required.
7.9 Recreation
Draft Environmental Impact Report October 2007 Monterey Plus 7.9-20
ENDNOTES 1. California Department of Water Resources, Management of the State Water Project
(Calendar year 2000), Bulletin 132-01, December 2002. 2. California Department of Water Resources, Management of the State Water Project
(Calendar year 2000), Bulletin 132-01, December 2002. 3. California Department of Water Resources, Management of the State Water Project
(Calendar year 2000), Bulletin 132-01, December 2002.