Embed Size (px)
Citation preview
Capital Forecasting Model
28-10-2009 1
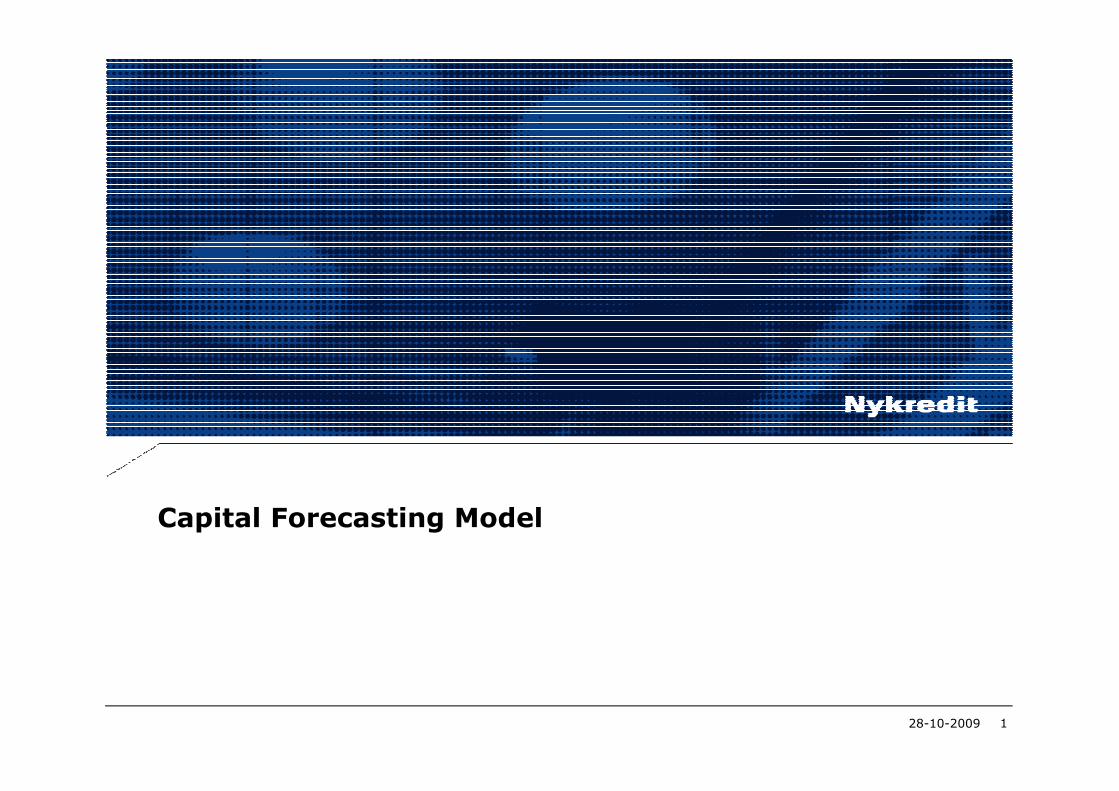
A leading Danish financial institution
3 brands Market shares in Denmarkand volumes as at end September 2009
VolumeEURbn
Totallending
Mortgage banking(bond debt outstanding)
131 41%(bond debt outstanding)
131 41%
26%Commercial banking (loans and guarantees)
14 4%
Customers 1,128,000
Facts as at Q3/2009Asset management 9 5%
Fund administration 28 28%Staff 4,538
Equity EUR 6.9bn
Tier I ratio 15.7%
Fund administration 28 28%
Insurance(premium income)
0.38 4%
Tier I ratio 15.7%
Estate agencies(number of properties sold)
9,027 20%
28-10-2009 2
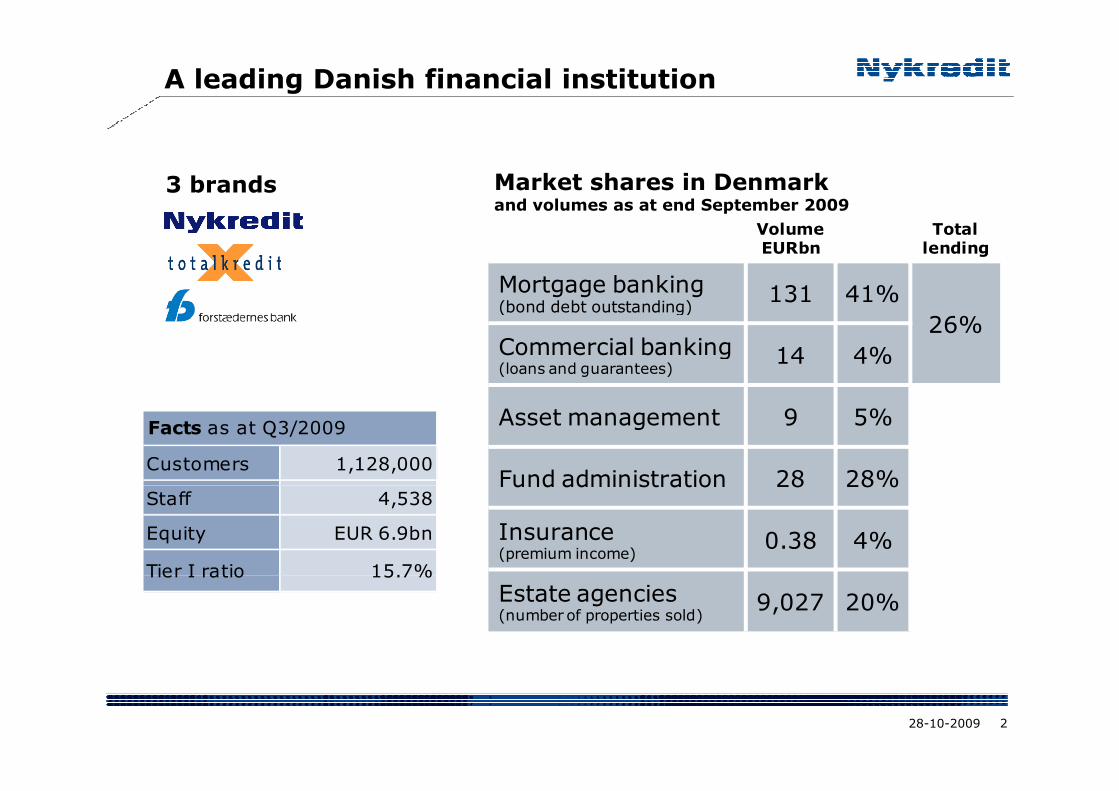
Nykredit's foundation – financial sustainability
Large Danish bond issuer
AssociationNykredit
Long-term loans
Conditions
Nykredit – strategy 2013
Business objects
Nykredit's
Risk policy - credit risk
- market risk
Budget and follow-up
Required rate of return
Capital policy
Nykredit's financial strength
Assessment of risk scenarios
Stable
Short/long term
Adequate capital?
Brakes ok?Stable develop-ment?
term
Mild/strong recession
Financial sustainability/Supply reliability
28-10-2009 3
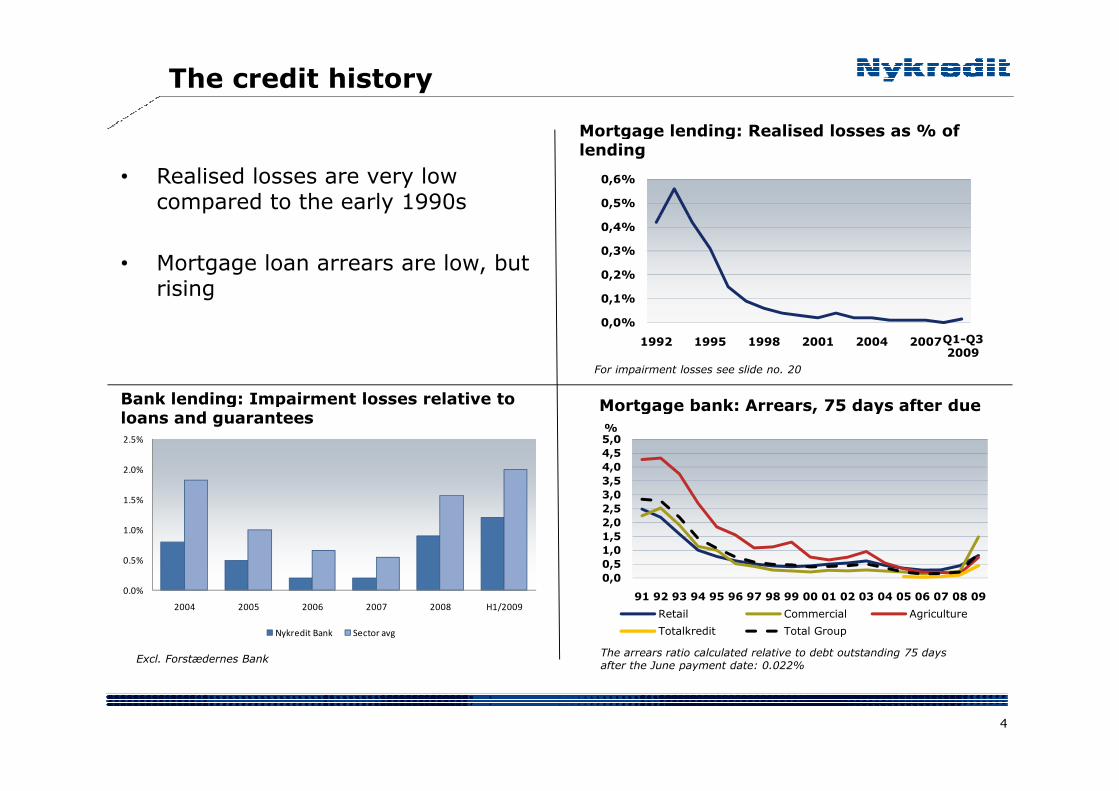
The credit history
Mortgage lending: Realised losses as % of
• Realised losses are very low compared to the early 1990s
Mortgage lending: Realised losses as % of lending
0,5%
0,6%
• Mortgage loan arrears are low, but rising
0,1%
0,2%
0,3%
0,4%
Bank lending: Impairment losses relative to
0,0%
1992 1995 1998 2001 2004 2007Q1-Q32009
Mortgage bank: Arrears, 75 days after due
For impairment losses see slide no. 20
Bank lending: Impairment losses relative to loans and guarantees
2.0%
2.5%
Mortgage bank: Arrears, 75 days after due date
3,5
4,0
4,5
5,0%
0.5%
1.0%
1.5%
0,0
0,5
1,0
1,5
2,0
2,5
3,0
3,5
0.0%
2004 2005 2006 2007 2008 H1/2009
Nykredit Bank Sector avg
The arrears ratio calculated relative to debt outstanding 75 days after the June payment date: 0.022%
0,0
91 92 93 94 95 96 97 98 99 00 01 02 03 04 05 06 07 08 09
Retail Commercial Agriculture
Totalkredit Total Group
Excl. Forstædernes Bank
4
after the June payment date: 0.022%
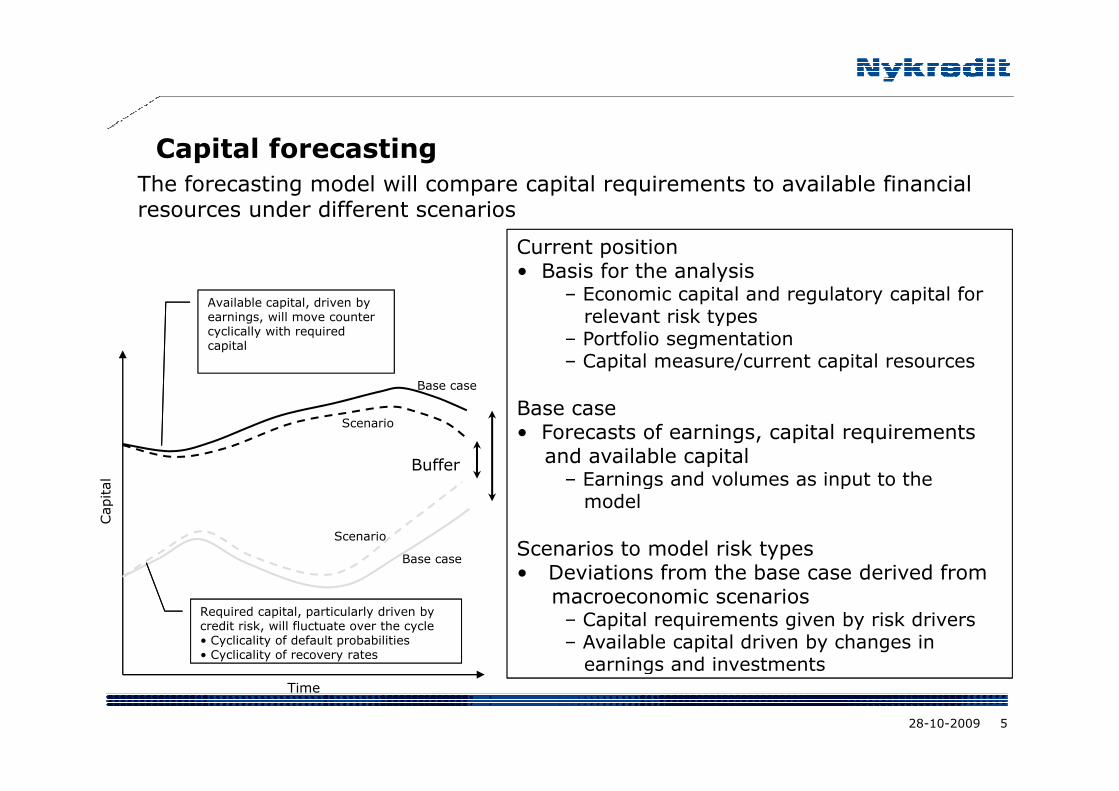
Capital forecasting
The forecasting model will compare capital requirements to available financial resources under different scenarios
Current position• Basis for the analysis
– Economic capital and regulatory capital forrelevant risk types
resources under different scenarios
Available capital, driven by
relevant risk types– Portfolio segmentation– Capital measure/current capital resources
Base case
Available capital, driven by earnings, will move counter cyclically with required capital
Base case
Base case• Forecasts of earnings, capital requirements
and available capital– Earnings and volumes as input to the
Buffer
Capital
Scenario
– Earnings and volumes as input to themodel
Scenarios to model risk types• Deviations from the base case derived from
Capital
Base case
Scenario
• Deviations from the base case derived frommacroeconomic scenarios– Capital requirements given by risk drivers– Available capital driven by changes in
earnings and investments
Required capital, particularly driven by credit risk, will fluctuate over the cycle• Cyclicality of default probabilities• Cyclicality of recovery rates
earnings and investmentsTime
28-10-2009 5
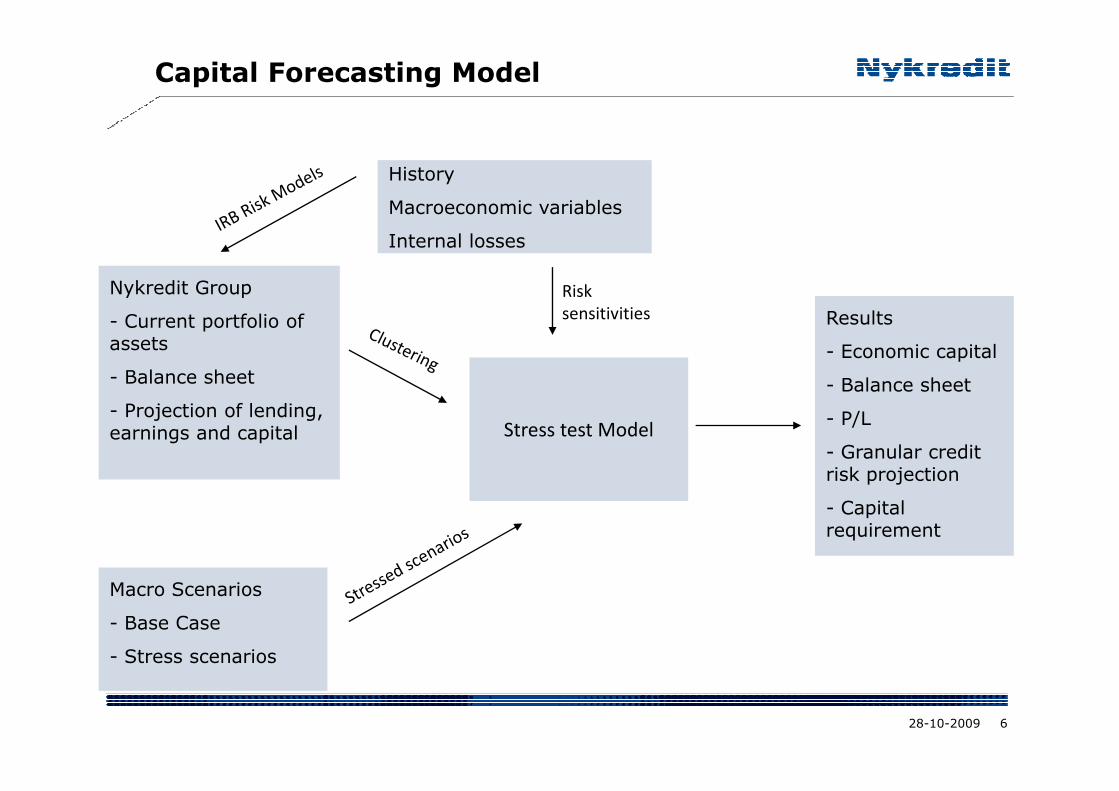
Capital Forecasting Model
History
Macroeconomic variables
Nykredit Group
Macroeconomic variables
Internal losses
Risk
sensitivities- Current portfolio of assets
- Balance sheet
sensitivities Results
- Economic capital
- Balance sheet
- Projection of lending, earnings and capital Stress test Model
- P/L
- Granular credit risk projection
- Capital requirement
Macro Scenarios
- Base Case
- Stress scenarios- Stress scenarios
28-10-2009 6
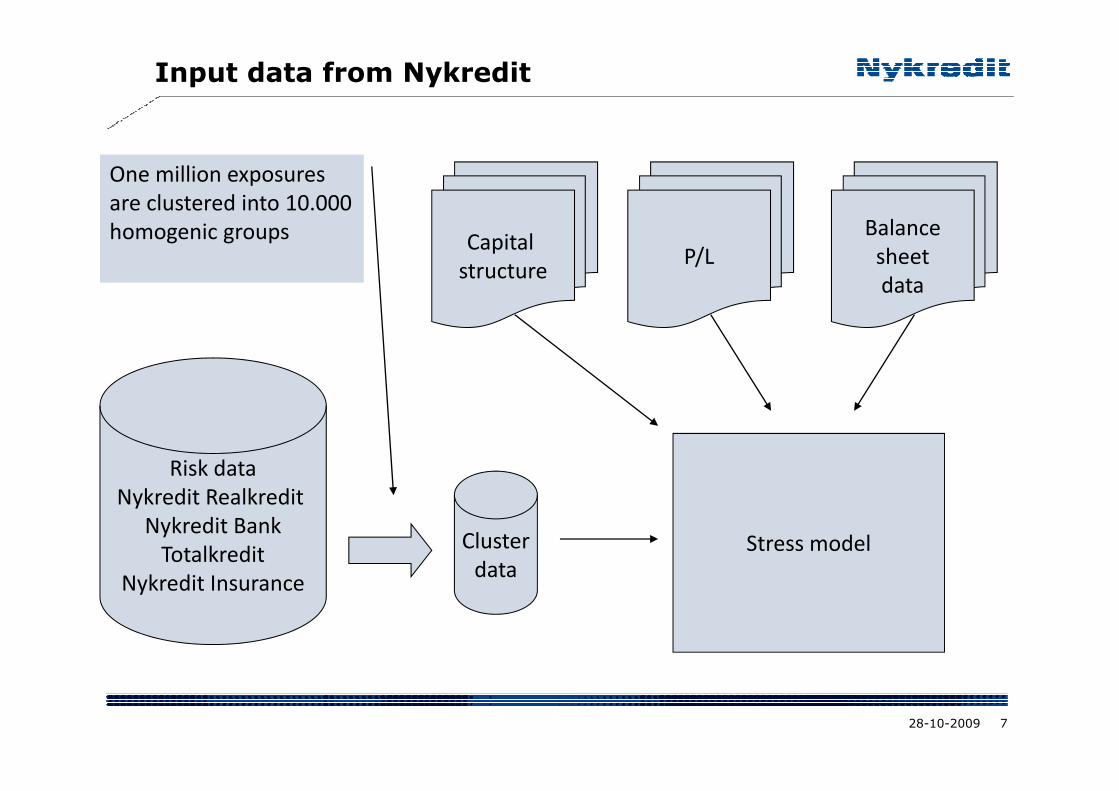
Input data from Nykredit
One million exposures
are clustered into 10.000 Balancehomogenic groups Capital
structureP/L
Balance
sheet
data
Risk data
Nykredit Realkredit Nykredit Realkredit
Nykredit Bank
Totalkredit
Nykredit Insurance
Cluster
dataStress model
Nykredit Insurancedata
28-10-2009 7
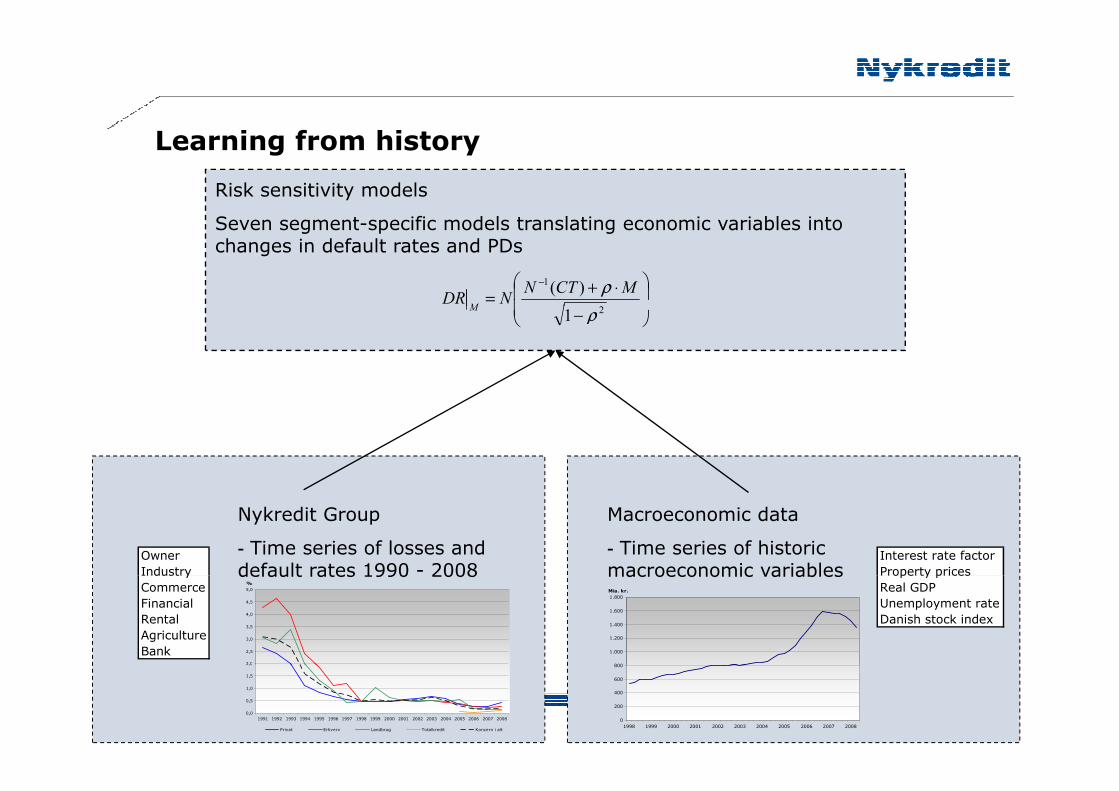
Learning from historyLearning from history
Risk sensitivity models
Seven segment-specific models translating economic variables into Seven segment-specific models translating economic variables into changes in default rates and PDs
−
⋅+=
−
2
1
1
)(
ρ
ρ MCTNNDR
M
−
=21 ρ
NDRM
Nykredit Group
- Time series of losses and default rates 1990 - 2008
Macroeconomic data
- Time series of historic macroeconomic variables
Owner
Industry
Interest rate factor
Property pricesdefault rates 1990 - 2008
2,0
2,5
3,0
3,5
4,0
4,5
5,0
%
macroeconomic variables
800
1.000
1.200
1.400
1.600
1.800
Mia. kr.
Industry
Commerce
Financial
Rental
Agriculture
Bank
Property prices
Real GDP
Unemployment rate
Danish stock index
0,0
0,5
1,0
1,5
2,0
1991 1992 1993 1994 1995 1996 1997 1998 1999 2000 2001 2002 2003 2004 2005 2006 2007 2008
Privat Erhverv Landbrug Totalkredit Koncern i alt
0
200
400
600
800
1998 1999 2000 2001 2002 2003 2004 2005 2006 2007 2008
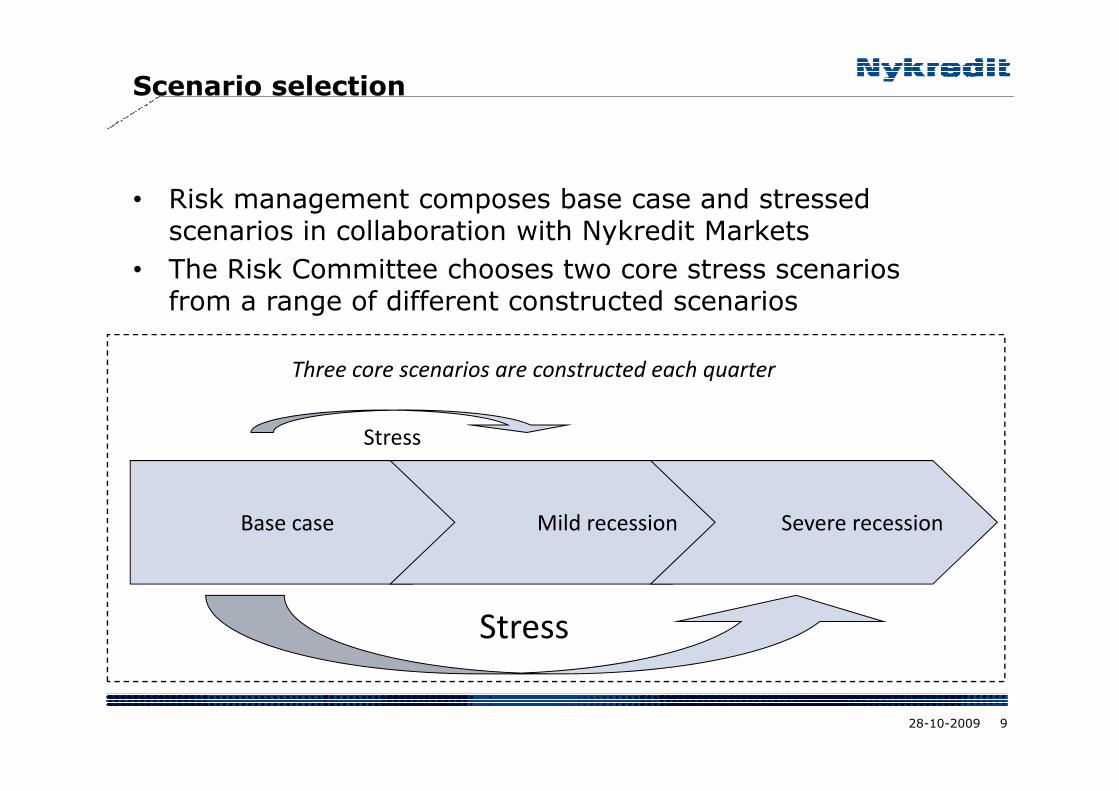
Scenario selection
• Risk management composes base case and stressed scenarios in collaboration with Nykredit Marketsscenarios in collaboration with Nykredit Markets
• The Risk Committee chooses two core stress scenarios from a range of different constructed scenariosfrom a range of different constructed scenarios
Three core scenarios are constructed each quarter
Stress
Base case Mild recession Severe recession
Stress
28-10-2009 9
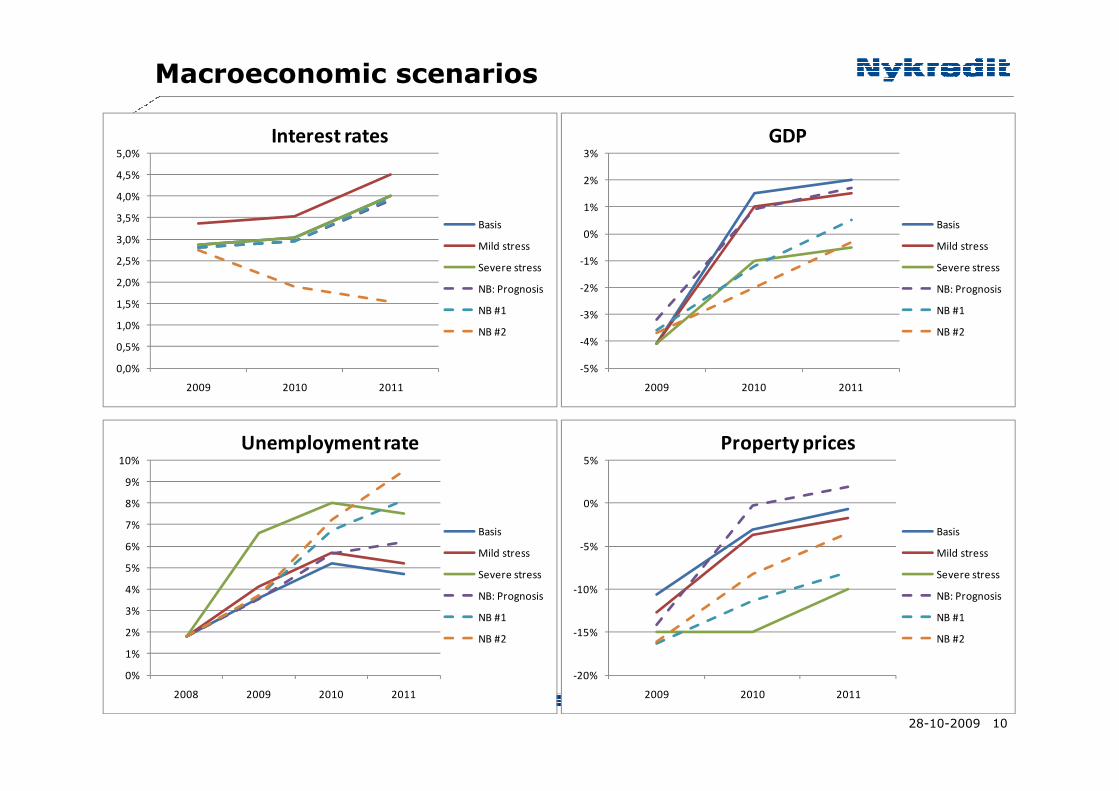
Macroeconomic scenarios
Interest rates GDP
3,5%
4,0%
4,5%
5,0%
Interest rates
1%
2%
3%
GDP
1,5%
2,0%
2,5%
3,0%
3,5%Basis
Mild stress
Severe stress
NB: Prognosis
NB #1
-2%
-1%
0%Basis
Mild stress
Severe stress
NB: Prognosis
NB #1
0,0%
0,5%
1,0%
1,5%
2009 2010 2011
NB #1
NB #2
-5%
-4%
-3%
2009 2010 2011
NB #1
NB #2
9%
10%
Unemployment rate5%
Property prices
5%
6%
7%
8%
9%
Basis
Mild stress
Severe stress
-5%
0%
Basis
Mild stress
Severe stress
1%
2%
3%
4%
Severe stress
NB: Prognosis
NB #1
NB #2-15%
-10%
Severe stress
NB: Prognosis
NB #1
NB #2
0%
2008 2009 2010 2011
-20%
2009 2010 2011
28-10-2009 10
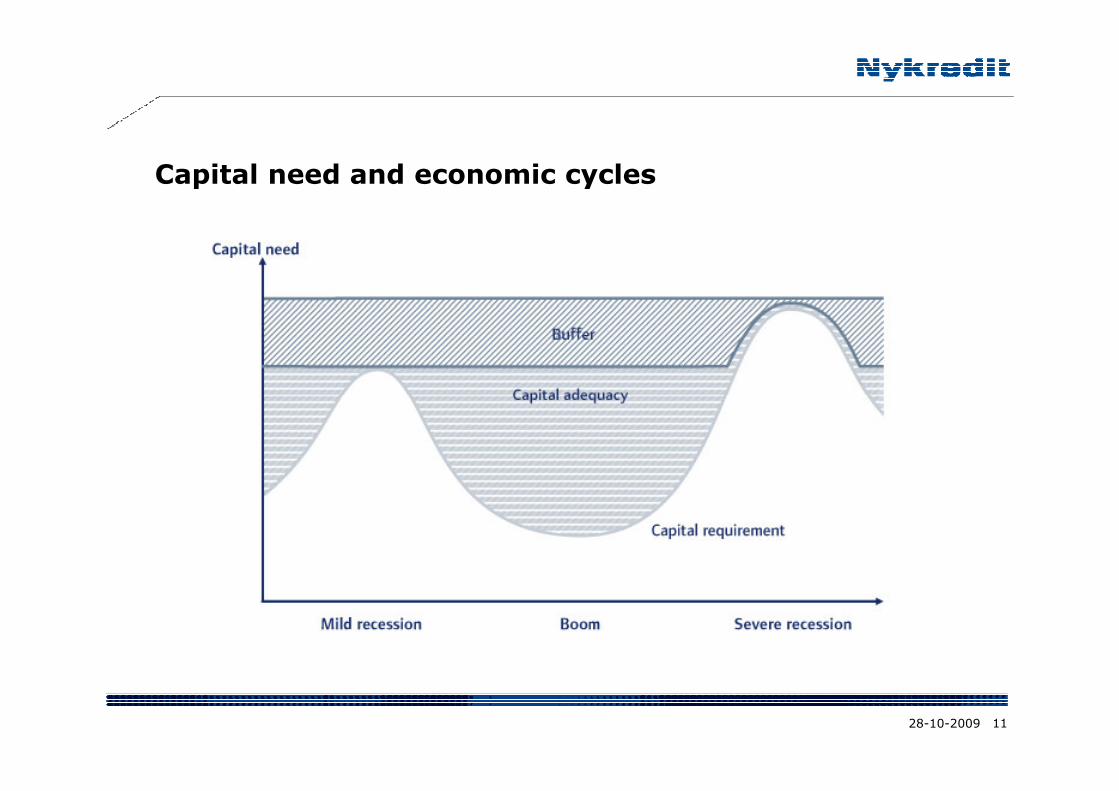
Capital need and economic cycles
28-10-2009 11
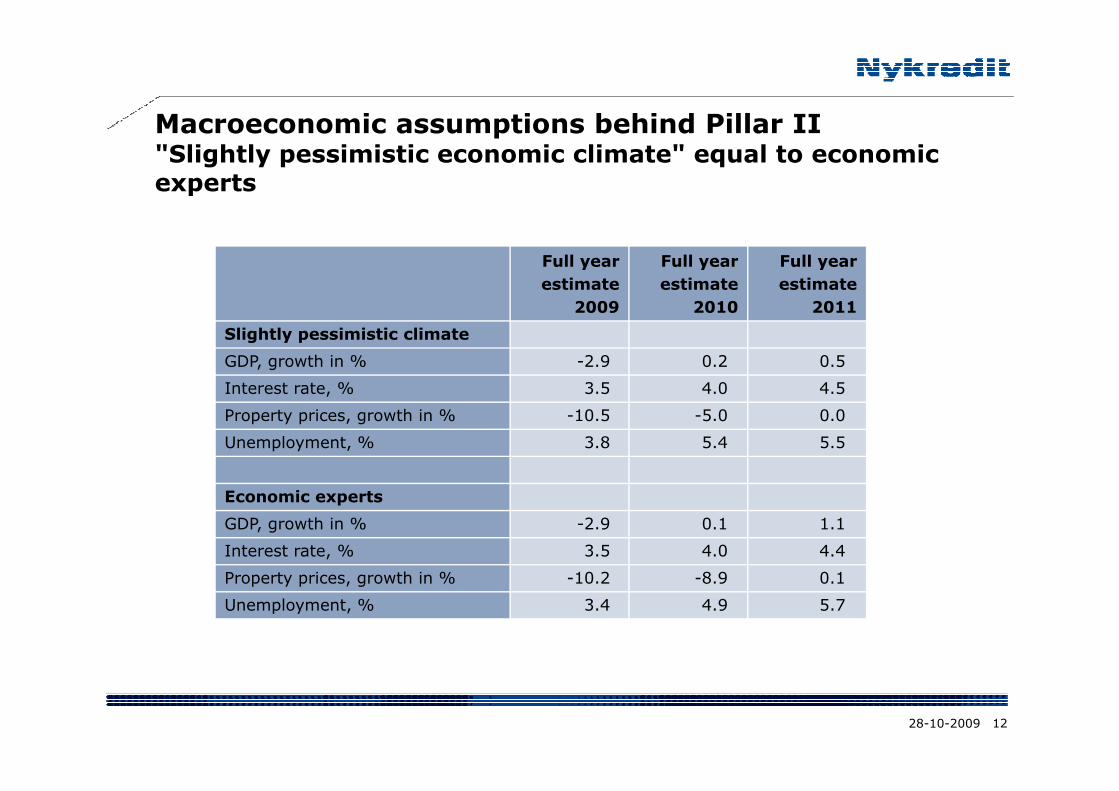
Macroeconomic assumptions behind Pillar IIMacroeconomic assumptions behind Pillar II"Slightly pessimistic economic climate" equal to economic experts
Full year
estimate
2009
Full year
estimate
2010
Full year
estimate
20112009 2010 2011
Slightly pessimistic climate
GDP, growth in % -2.9 0.2 0.5
Interest rate, % 3.5 4.0 4.5Interest rate, % 3.5 4.0 4.5
Property prices, growth in % -10.5 -5.0 0.0
Unemployment, % 3.8 5.4 5.5
Economic experts
GDP, growth in % -2.9 0.1 1.1
Interest rate, % 3.5 4.0 4.4
Property prices, growth in % -10.2 -8.9 0.1Property prices, growth in % -10.2 -8.9 0.1
Unemployment, % 3.4 4.9 5.7
28-10-2009 12
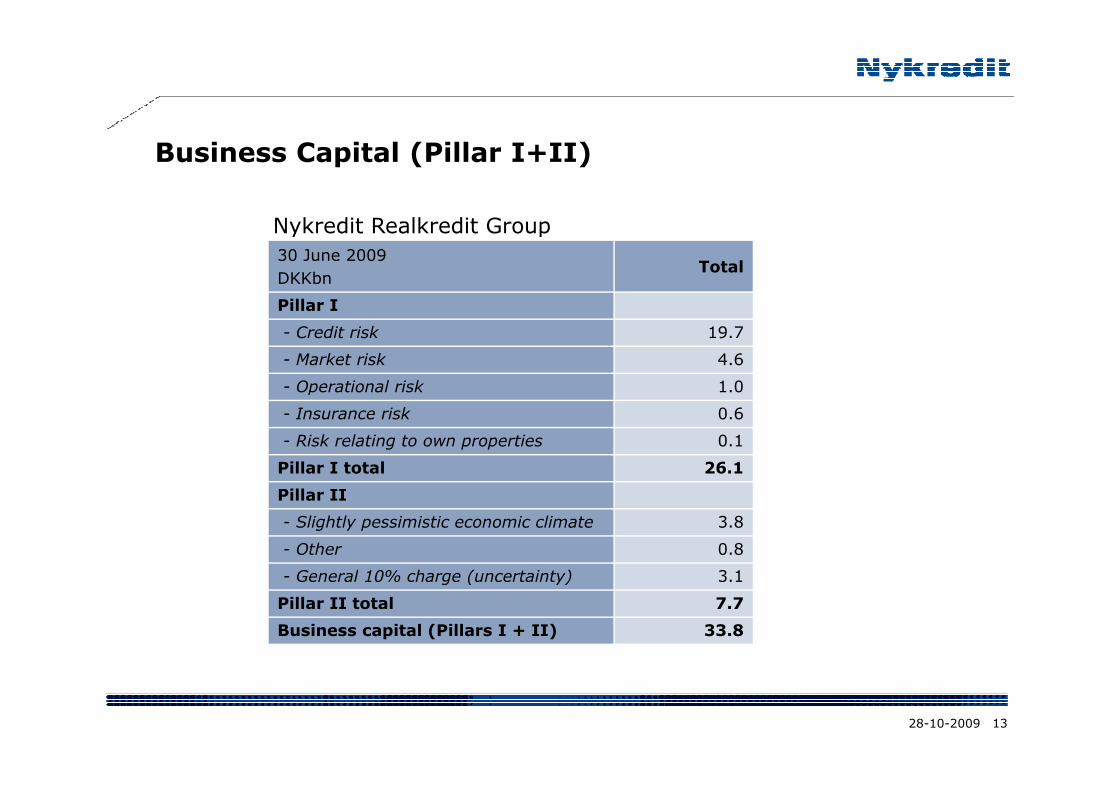
Business Capital (Pillar I+II)
Nykredit Realkredit Group
30 June 2009
DKKbnTotal
Pillar I
Nykredit Realkredit Group
Pillar I
- Credit risk 19.7
- Market risk 4.6
- Operational risk 1.0
- Insurance risk 0.6
- Risk relating to own properties 0.1
Pillar I total 26.1
Pillar IIPillar II
- Slightly pessimistic economic climate 3.8
- Other 0.8
- General 10% charge (uncertainty) 3.1- General 10% charge (uncertainty) 3.1
Pillar II total 7.7
Business capital (Pillars I + II) 33.8
28-10-2009 13
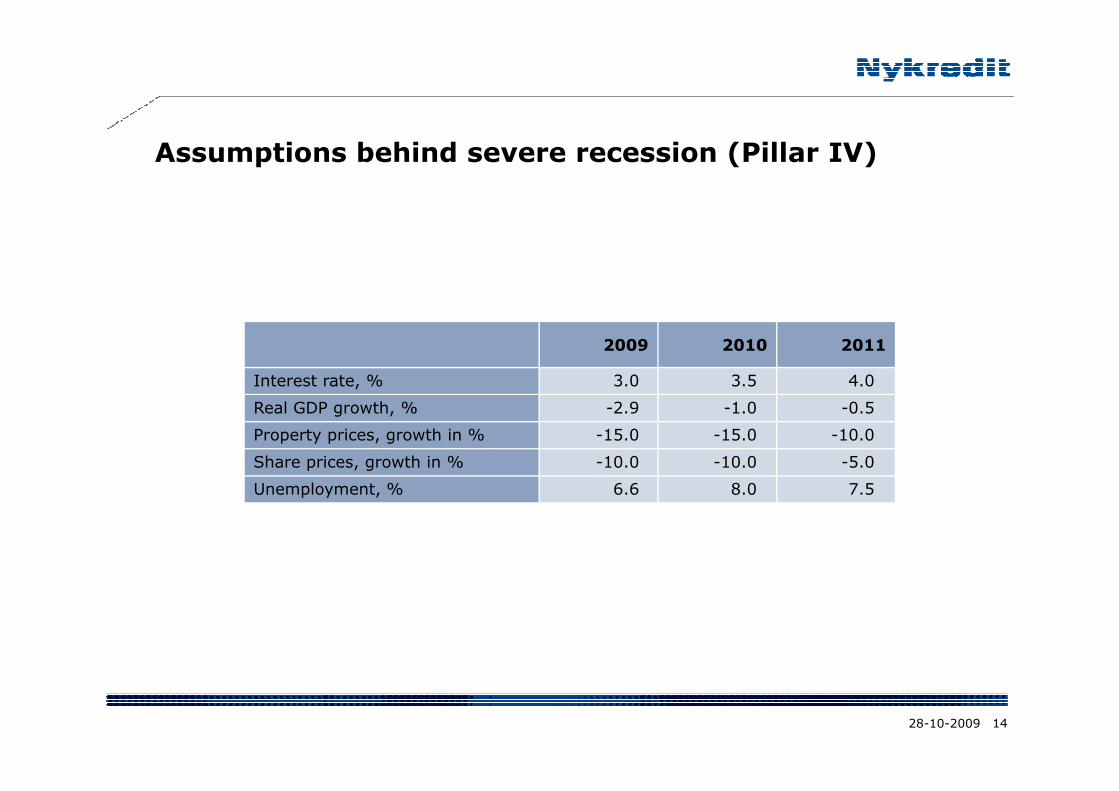
Assumptions behind severe recession (Pillar IV)
2009 2010 2011
Interest rate, % 3.0 3.5 4.0
Real GDP growth, % -2.9 -1.0 -0.5
Property prices, growth in % -15.0 -15.0 -10.0
Share prices, growth in % -10.0 -10.0 -5.0
Unemployment, % 6.6 8.0 7.5Unemployment, % 6.6 8.0 7.5
28-10-2009 14
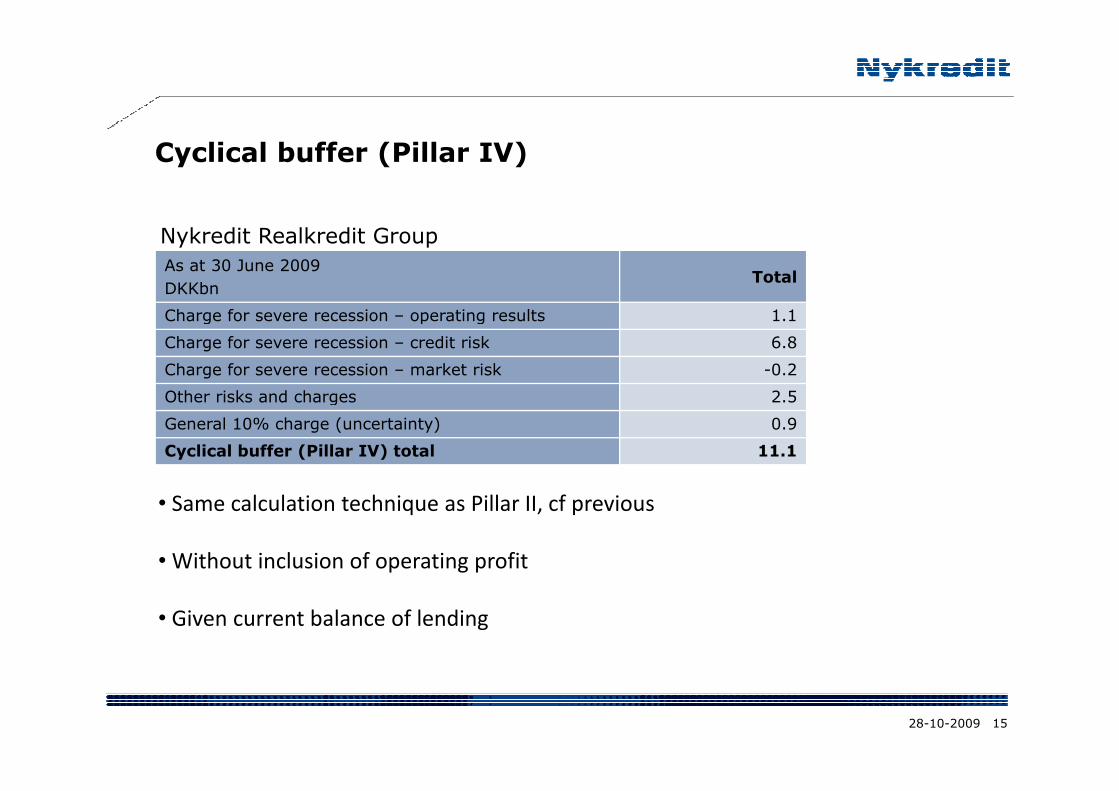
Cyclical buffer (Pillar IV)
As at 30 June 2009
DKKbnTotal
Charge for severe recession – operating results 1.1
Nykredit Realkredit Group
Charge for severe recession – operating results 1.1
Charge for severe recession – credit risk 6.8
Charge for severe recession – market risk -0.2
Other risks and charges 2.5Other risks and charges 2.5
General 10% charge (uncertainty) 0.9
Cyclical buffer (Pillar IV) total 11.1
• Same calculation technique as Pillar II, cf previous
•Without inclusion of operating profit
• Given current balance of lending
28-10-2009 15
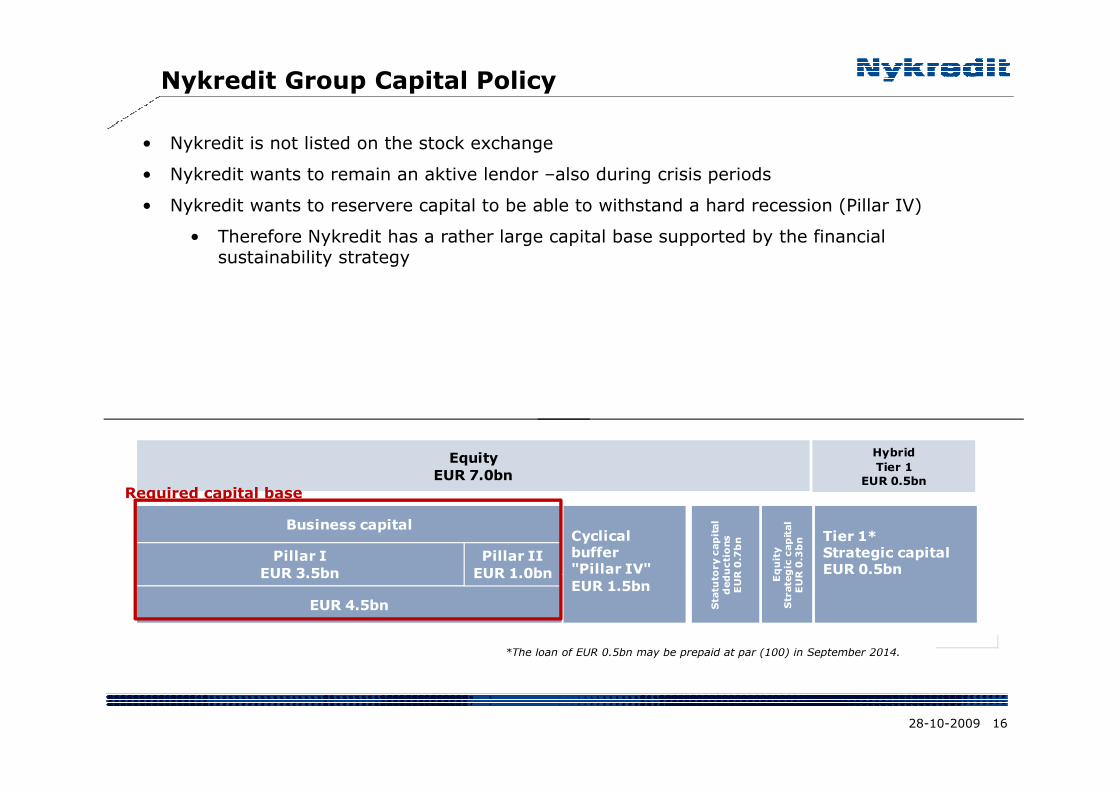
Nykredit Group Capital Policy
• Nykredit is not listed on the stock exchange
• Nykredit wants to remain an aktive lendor –also during crisis periods
• Nykredit wants to reservere capital to be able to withstand a hard recession (Pillar IV)
• Therefore Nykredit has a rather large capital base supported by the financial sustainability strategy
Equity
EUR 7.0bn
Hybrid
Tier 1
EUR 0.5bnRequired capital base
Business capital
Pillar I
EUR 3.5bn
Pillar II
EUR 1.0bn
Cyclical buffer "Pillar IV"
Equity
Strategic capital
EUR 0.3bn
Statutory capital
deductions
EUR 0.7bn Tier 1*
Strategic capitalEUR 0.5bn
EUR 0.5bnRequired capital base
*The loan of EUR 0.5bn may be prepaid at par (100) in September 2014.
EUR 3.5bn
EUR 4.5bn
EUR 1.0bn "Pillar IV"
EUR 1.5bn
Equity
Strategic capital
EUR 0.3bn
Statutory capital
deductions
EUR 0.7bn
EUR 0.5bn
28-10-2009 16
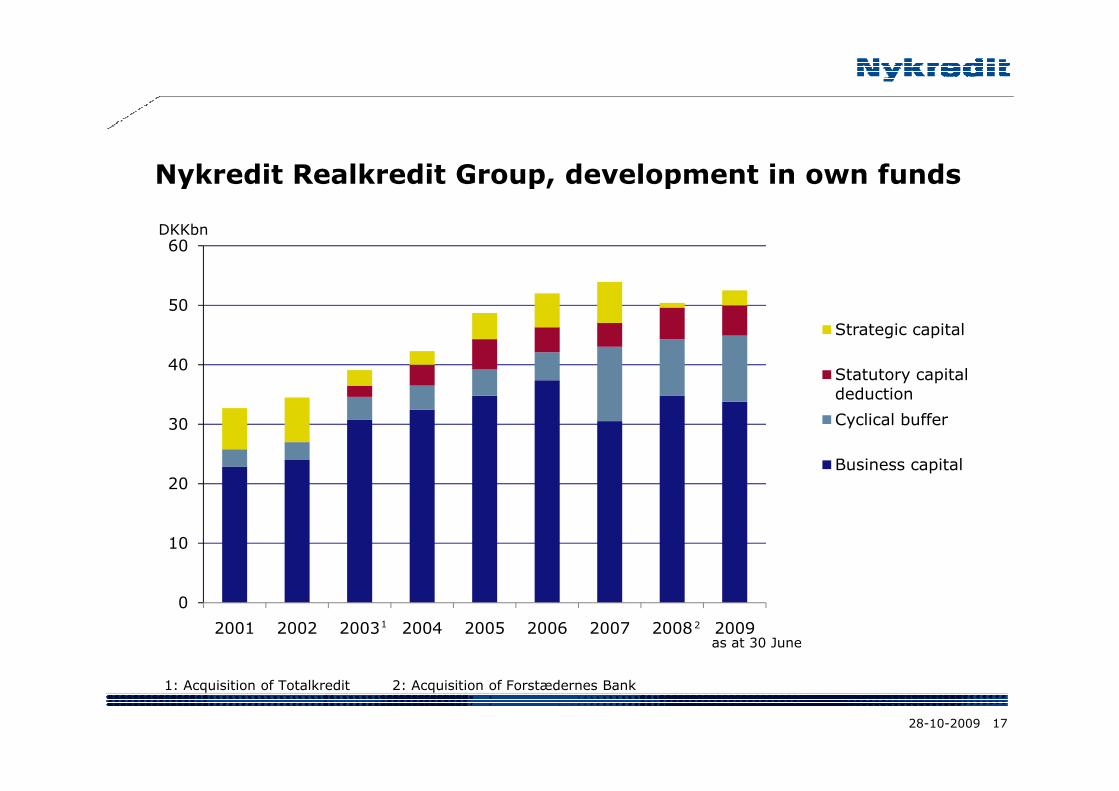
Nykredit Realkredit Group, development in own funds
50
60DKKbn
40
50
Strategic capital
Statutory capital
deduction
20
30
deduction
Cyclical buffer
Business capital
10
20
0
2001 2002 2003 2004 2005 2006 2007 2008 2009as at 30 June
1 2
1: Acquisition of Totalkredit 2: Acquisition of Forstædernes Bank
28-10-2009 17
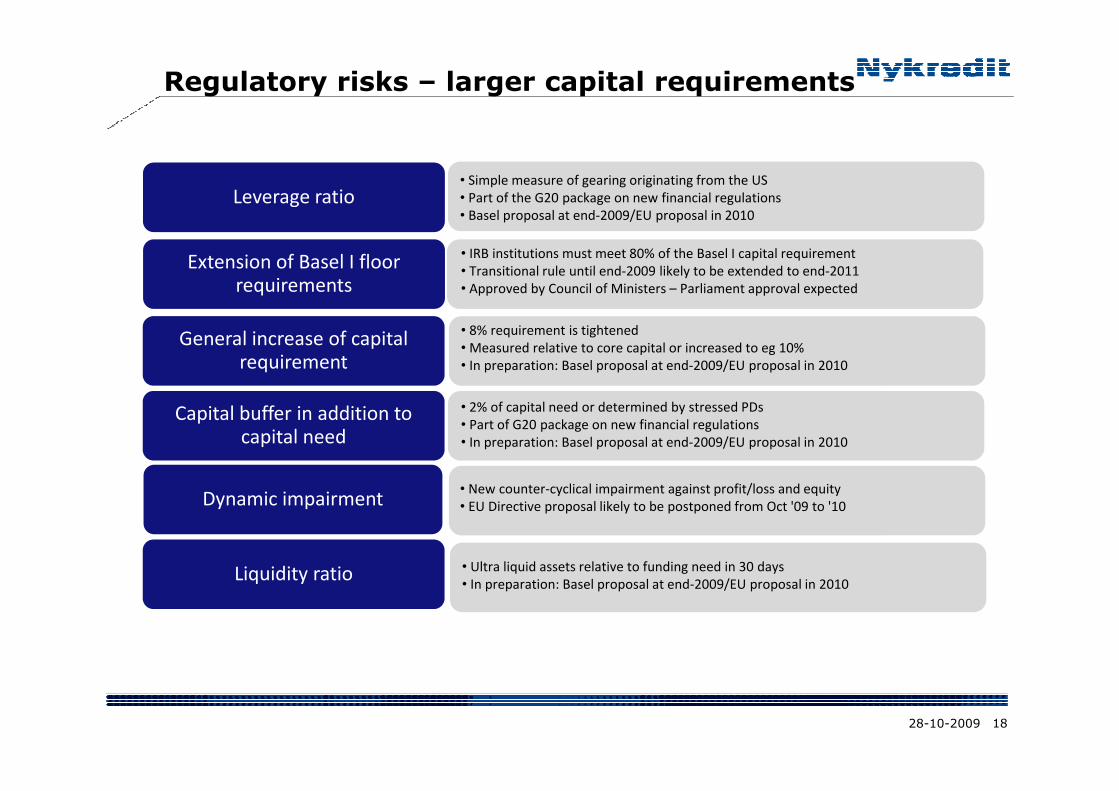
Regulatory risks – larger capital requirements
Leverage ratio• Simple measure of gearing originating from the US
• Part of the G20 package on new financial regulations
• Basel proposal at end-2009/EU proposal in 2010
Extension of Basel I floor requirements
• Basel proposal at end-2009/EU proposal in 2010
• IRB institutions must meet 80% of the Basel I capital requirement
• Transitional rule until end-2009 likely to be extended to end-2011
• Approved by Council of Ministers – Parliament approval expected
General increase of capitalrequirement
• 8% requirement is tightened
•Measured relative to core capital or increased to eg 10%
• In preparation: Basel proposal at end-2009/EU proposal in 2010
Capital buffer in addition to capital need
Dynamic impairment
• 2% of capital need or determined by stressed PDs
• Part of G20 package on new financial regulations
• In preparation: Basel proposal at end-2009/EU proposal in 2010
• New counter-cyclical impairment against profit/loss and equityDynamic impairment
Liquidity ratio
• New counter-cyclical impairment against profit/loss and equity
• EU Directive proposal likely to be postponed from Oct '09 to '10
• Ultra liquid assets relative to funding need in 30 days
In preparation: Basel proposal at end-2009/EU proposal in 2010Liquidity ratio
• In preparation: Basel proposal at end-2009/EU proposal in 2010
28-10-2009 18
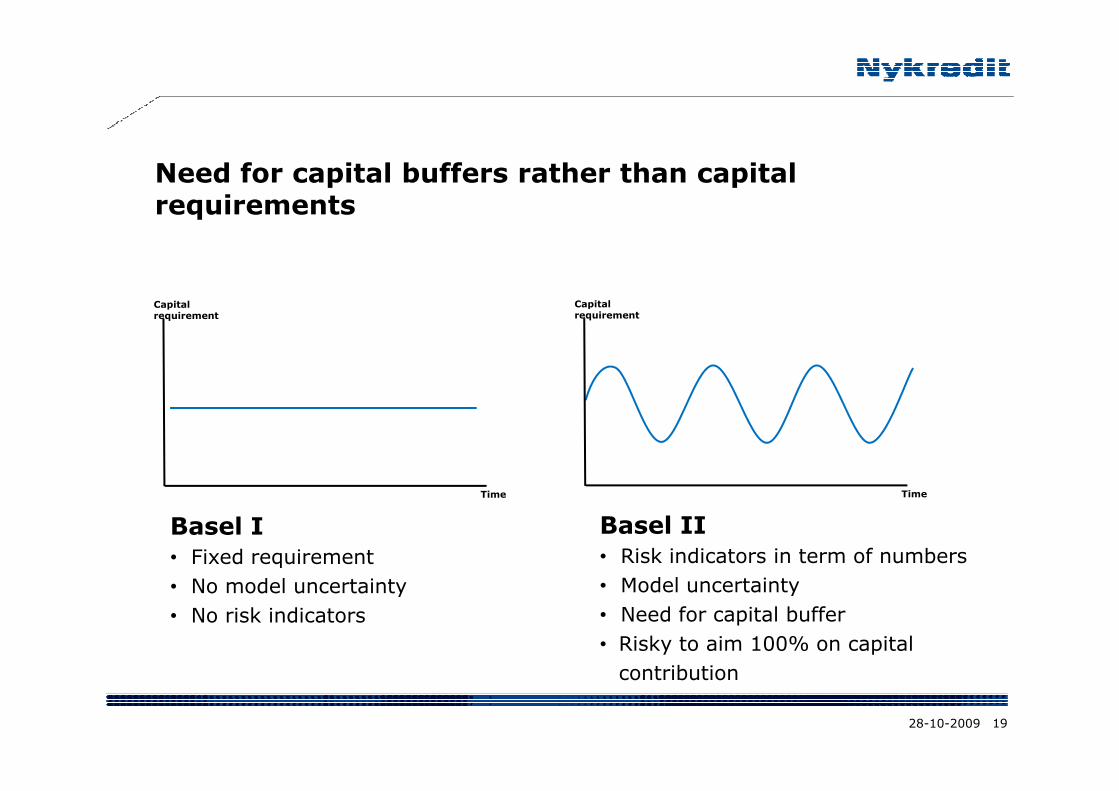
Need for capital buffers rather than capital requirementsrequirements
Capital CapitalCapitalrequirement
Capitalrequirement
Basel I
• Fixed requirement
No model uncertainty
Basel II
• Risk indicators in term of numbers
• Model uncertainty
Time Time
• No model uncertainty
• No risk indicators
• Model uncertainty
• Need for capital buffer
• Risky to aim 100% on capital
contributioncontribution
28-10-2009 19
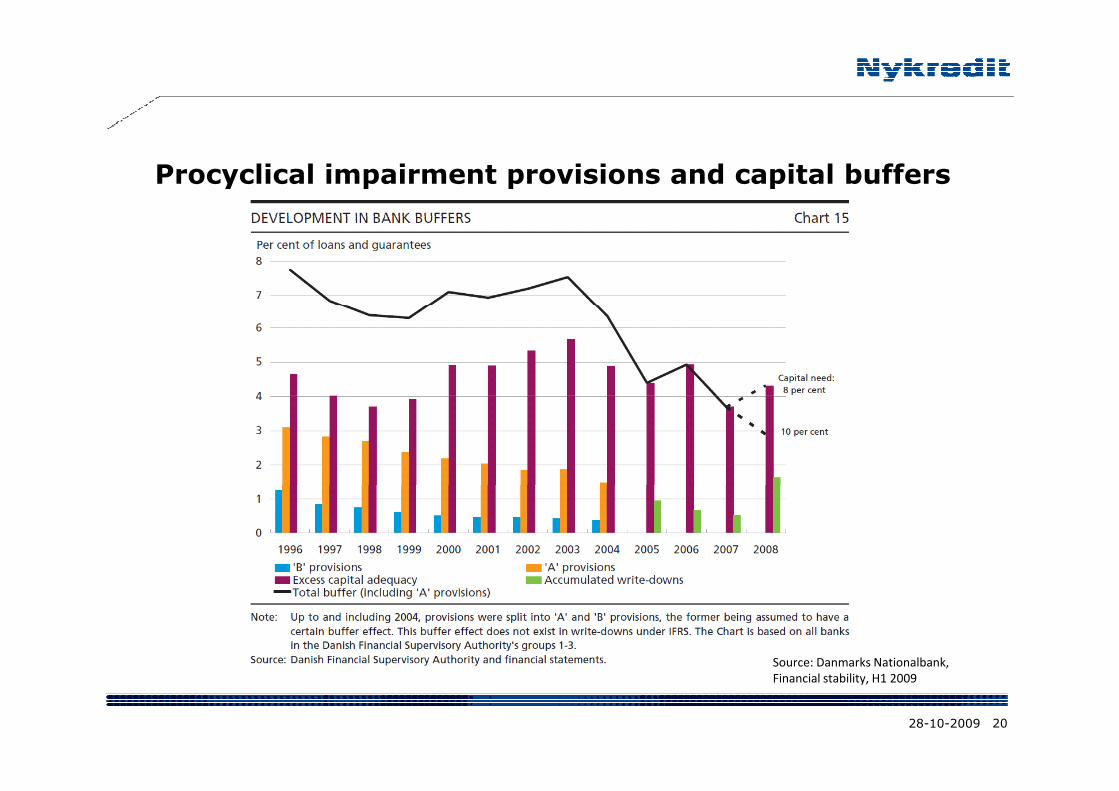
Procyclical impairment provisions and capital buffers
Source: Danmarks Nationalbank, Source: Danmarks Nationalbank,
Financial stability, H1 2009
28-10-2009 20
Basel II – The result depends on the assumptions (1)
• Data: PD data from 1991 – todayLGD data from 1991-2003
- Or only favourable data from a favourable period
Correlations and diversification
- Within credit risk (portfolio model)Credit – Insurance – Market Risk
Confidence levels 99.9% - 99.97%
Value-at-Risk for whole year3-4 multiplication3-4 multiplication
28-10-2009 21
Basel II – The result depends on the assumptions (2)
• Pillar II: How severe a stress test?Reduction for future profits?Reduction for capital planning?Reduction for capital planning?
• Conclusion: What does your bank try to achieve?- A low capital adequacy ratio?- A realistic capital adequacy ratio?- A realistic capital adequacy ratio?- A safe capital adequacy ratio?- A wise capital adequacy ratio?
Basel II should never have been implemented withoutguidelines for the calculations.
• A rubber band regulation?
28/10/2009 22