Embed Size (px)
Citation preview

7/7/2017 2016-2017 Texas Turfgrass Research, Education and Extension Endowment Proposals 9:56 AM
Funded
Title PICo-PIs/
Collaborators Amount Amount
Characterization of Herbicide Resistance in Annual Bluegrass Populations Collected in Texas Golf Courses Bagavathainnan, M
Reynolds, CaseySingh, Vijay $10,000.00 $10,000.00
Turfgrass Colorant Research Renolds, Casey $4,000.00 $3,000.00
Aggie Turf Website Re-design and Update Reynolds, Casey $4,150.00 $3,500.00
TTREEE Undergraduate Scholarship Smith, Wayne Teel, Megan $8,000.00 $8,000.00
Evaluating Potential for Wetting Agents to Improve Turfgrass Health and Nitrogen Use Efficiency Under Deficit Irrigation of St. Augustinegrass
Wherley, BenPeterson, Jacqui
Chen, Zhaoxin; White, Richard $15,000.00 $15,000.00
Physiological impact of chronic water stress on common residential lawn turf species in West Texas Young, Joey, TTU
Montague, Thayne Culpepper, Travis $5,470.00 $4,000.00
TOTAL $46,620.00 $43,500.00
2016-2017 TTREE Proposals
1
FINAL PROJECT REPORT
Title: Characterization of Herbicide Resistance in Annual Bluegrass (Poa annua L.) Populations
Collected in Texas Golf Courses
Project period: 2016-2017
Investigators:
Dr. Muthu Bagavathiannan (Weed Science)
Dr. Casey Reynolds (Agrilife Extension Turfgrass Specialist)
Dr. Vijay Singh (Assistant Research Scientist)
Background:
Annual bluegrass (Poa annua L.) is an allotetraploid (2n = 2X = 14) (La mantia and Huff 2011;
Tutin 1957) and is one of the most troublesome weeds in turfgrass production (Webster 2004;
Christians 2006). Annual bluegrass is known to occur worldwide, with extensive ecotypic
variations among different regions (Tutin 1957; McElroy et al. 2002). A single plant can produce
an average of 1,000 to 2,500 seeds (Holm et al. 1997), and a seedbank size of over 100,000
seeds/m2 has been reported in golf course fairways (Watschke et al. 1979; Gaussoin et al. 1989).
In the United States (U.S.), herbicides have been heavily relied upon for the management of
annual bluegrass in Golf courses. Simazine, a photosystem-II (PSII) inhibitor, is the most
commonly used preemergence (PRE) herbicide, whereas acetolactate synthase (ALS) inhibitors
especially sulfonylureas (trifloxysulfuron and foramsulfuron) are widely used for postemergence
(POST) control of this species due to excellent selectivity in established turf. In Texas golf
courses, a standard bluegrass management program includes sequential application of simazine
PRE followed by a POST application of a sulfonylurea herbicide with need-based application of
amicarbazone. Amicarbazone is a PSII herbicide, which is occasionally used as a late-POST
application to control any escapes.
Frequent use of ALS- and PSII-inhibitor herbicides has resulted in widespread evolution of
herbicide resistance in golf course annual bluegrass populations across the U.S. (Brosnan and
Breeden 2013). In particular, some of these populations exhibit cross [resistance to multiple
herbicides affecting the same mechanism of action (MOA)]- as well as multiple-resistance
2
(resistance to herbicides with different MOA). Cross resistance to ALS-inhibitor herbicides has
been reported in several golf course annual bluegrass populations in Alabama (McElroy et al.
2013), and South Carolina and Georgia (Cross et al. 2013). In Mississippi, Perry et al. (2012)
reported cross resistance to PSII herbicides (atrazine, simazine, and amicarbazone) in two annual
bluegrass populations. The only existing case of multiple herbicide resistance to ALS- and PSII-
inhibitor herbicides has been reported in an annual bluegrass population in Tennessee (Brosnan
et al. 2015).
Resistance mechanisms have been studied in a number of annual bluegrass populations. Amino
acid substitutions have been typically associated with annual bluegrass resistance to PSII- (Kelly
et al. 1999; Kumata 2001; Perry et al. 2012) and ALS-inhibitors (McElroy et al. 2013; Brosnan
et al. 2016). Point mutation in the chloroplast psbA gene that codes for Ser-264-Gly is often
found responsible for resistance to PSII-inhibitor herbicides in annual bluegrass (Kelly et al.
1999; Perry et al. 2002). It was reported that such substitutions in the chloroplast psbA gene
reduces photosynthesis, growth, and plant vigor in resistant annual bluegrass populations (Holt
1990; Kumata et al. 2001; Perry et al. 2012). For ALS gene, point mutations that codes for a Trp-
574-Leu and Ala-205-Phe substitution have been shown to confer high levels of resistance to a
broad range of ALS-inhibitor herbicides (McElroy et al. 2013; Brosnan et al. 2016).
The objectives of this research were to 1) survey Golf course annual bluegrass populations in
eastern Texas for cross- and multiple-resistance to ALS- and PSII-inhibitor herbicides, and 2)
characterize the mutations responsible for resistance in the resistant populations.
Materials and methods
Plant material
Annual bluegrass plants were collected during spring 2015 in eastern Texas golf courses (Table
1; figure 1) where the superintendents witnessed control failures and suspected resistance. Insert
collection procedure here (sample size, etc. – actually the plants were transplanted to pots and
were then grown in a growth chamber to harvest seeds – dividers were used to prevent cross
pollination between two populations). Immediately after harvest, the seeds were air dried in an
oven at 50 C for 72 hrs. To break seed dormancy, seeds were then subjected to cold treatment (-
20°C) for 2 months, placed at 4°C for 2 weeks, and then at room temperature for one week. Prior
3
to germination in Petri dishes, seeds were sterilized in 10% sodium hypochlorite (commercial
bleach) supplemented with 0.1% enzyme grade Tween (Fisher Scientific, Pittsburgh, PA)
surfactant for 2 mins, followed by washing with tap water. Seeds were placed in 9-cm-diameter
Petri-dishes containing moistened filter paper and incubated in a growth chamber at day/night
temperature of 26/20°C. Incubated seed samples germinated after 2-3 days of incubation. Two-
centimeter seedlings were transplanted to 6-cell trays filled with commercial potting-soil mix
(LC1 Potting Mix, Sungro Horticulture Inc., Agawam, MA, USA) for POST herbicides, or with
herbicide-free field soil (silt loam: 25% sand, 48% silt, 27% clay; 1.17% organic matter) for PRE
herbicides. The transplants were nurtured in the greenhouse with day/night temperature ranges of
27° to 30°C/23° to 26°C, with 14 hr photoperiod until used for herbicide screening.
Herbicide screening
The herbicide screening of thirty annual bluegrass populations originating from Northeast Texas
was conducted during spring 2016 at Texas A&M University, College Station, TX. Annual
bluegrass populations were screened for resistance to two PSII-inhibitor herbicides [Simazine
(Princep® 4L, Syngenta Crop Protection, Greensboro, NC); Amicarbazone (Xonerate®, Arysta
LifeScience North America, Cary, NC)] and two ALS-inhibitor herbicides [foramsulfuron
(Revolver®, Bayer CropScience, Greensboro, NC); trifloxysulfuron (Monument®, Syngenta Crop
Protection, Greensboro, NC)]. Initial herbicide screening was conducted based on the
recommended field rates (1X) of 70, 196, 21, and 21 g ai ha-1 for simazine (PRE), amicarbazone
(POST), foramsulfuron (POST), and trifloxysulfuron (POST), respectively. For each herbicide
and for each sample, three 6-cell trays (18 seedlings in total) were evaluated and the screening
was repeated to provide two experimental runs. Herbicide treatments were carried out on 3-tiller
seedling stage for POST and immediately after planting for PRE. Herbicide applications were
made using an automated spray chamber fitted with a flat fan nozzle (TeeJet XR110015)
calibrated to deliver 140 L ha-1 of spray volume at 228 kPa pressure, at an operating speed of 4.8
kmph. Survival and visual injury were recorded (scale of 0-100; 0 = no injury and 100 =
complete plant death) at 3 and 6 weeks after treatment (WAT). After the assessment 6 WAT, the
survivors were sprayed again with a 4X rate of each herbicide; survival and injury ratings were
carried out at 2 weeks after the subsequent application.
Dose-response bioassay

4
Dose-response bioassays were carried out for the two highest surviving populations (ATX14 and
ATX27) during the initial screening, along with a susceptible standard (ATX-S). The putative
resistant populations were treated with eight rates (0.5, 1, 2, 4, 8, 16, 32 and 64X) of
foramsulfuron, trifloxysulfuron, or amicarbazone, and seven rates of simazine (0.5, 1, 2, 4, 8, 16
and 32X). The known susceptible population was treated with seven rates (0.0625, 0.125, 0.25,
0.5, 1, 2 and 4X) of each herbicide. The experiment was conducted in a completely randomized
design with three replications and two experimental runs. Each replicate consisted of 10-cm
diameter pots filled with field soil (PRE) or potting soil mix (POST).
For PRE herbicide (simazine) screening, five intact seeds were planted per pot and treated
immediately after planting. A non-treated standard was maintained for each population,
following the same setup, to account for germination differences between populations. For POST
herbicides, four healthy seedlings were transplanted in each pot filled with potting mix (LC1
Potting Mix, Sungro Horticulture Inc., Agawam, MA, USA) and treated at the 3-tiller growth
stage. Herbicide applications were made as described above. Survival and injury ratings (0-
100%) were carried out at 3 WAT. At 4 WAT, above-ground biomass was harvested and oven
dried at 55ºC for 7 d before weighing. Green leaf tissues were collected from the susceptible and
resistant populations for molecular analysis. Leaf tissues were placed immediately in air tight
containers and stored at -20ºC until used for DNA extraction.
Statistical Analyses. Analysis of variance (ANOVA) for herbicide screening and dose response
data was carried out using JMP Pro v.12 (SAS Institute Inc., Cary NC, USA). Dry biomass was
regressed against herbicide dose using a 3-parametic logistic equation in SigmaPlot v.13 (Systat
Software, Inc., San Jose, CA). There were no treatment by run interactions, so the data were
pooled across the two experimental runs for final analysis. The amount of herbicide that would
cause 50% growth (biomass) reduction (GR50) was estimated from the regression equations.
Resistance ratios (R/S) were computed from their respective GR50 values divided by the GR50 of
the susceptible sample.
Results:
Results from the screening has revealed the widespread occurrence and distribution of annual
bluegrass resistance to various herbicides. The sample collection locations are illustrated in
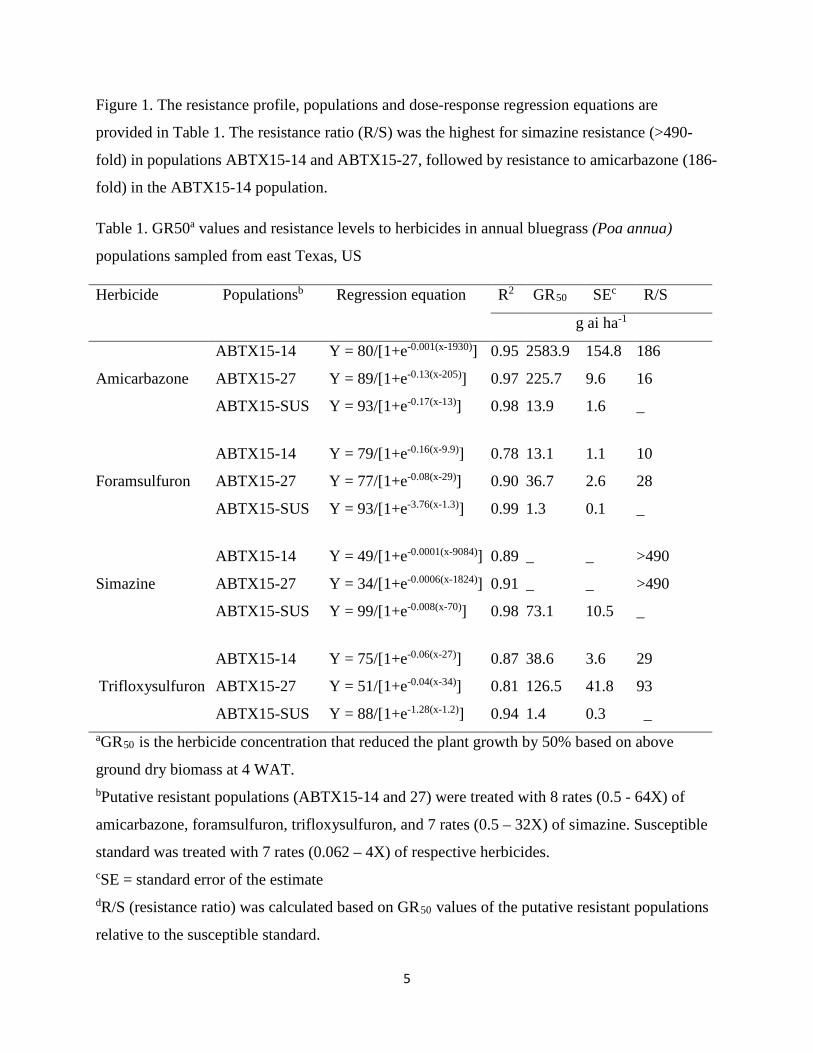
5
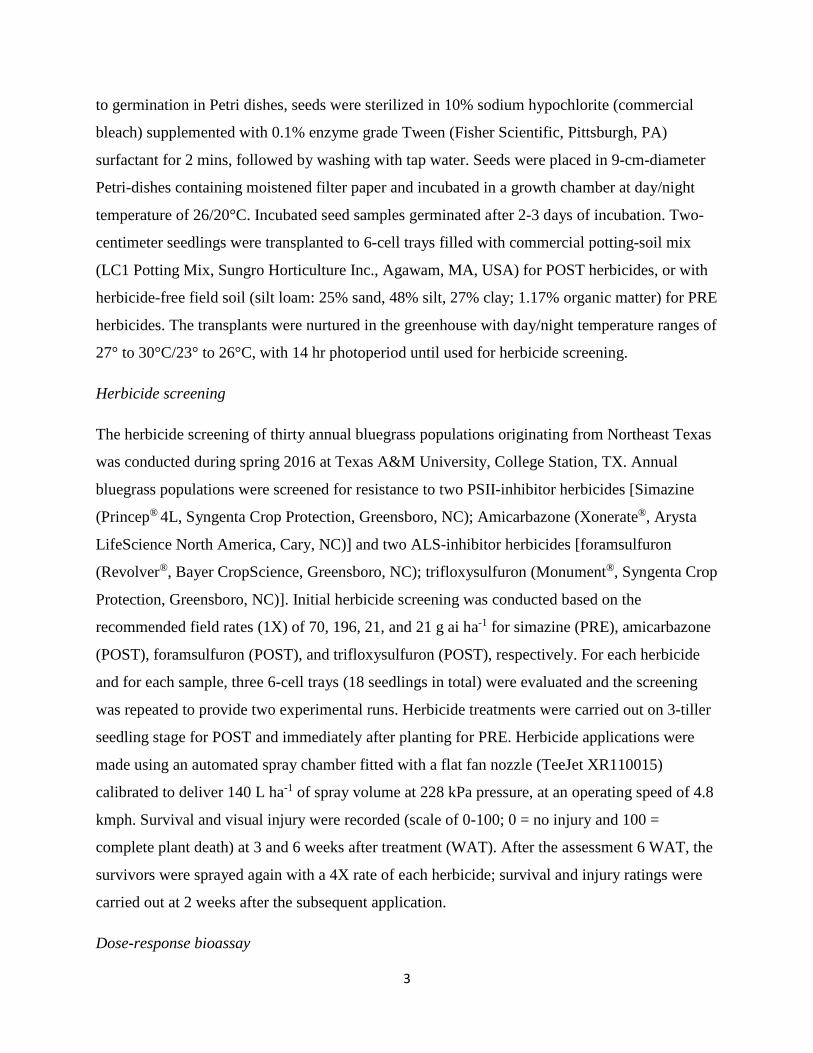
Figure 1. The resistance profile, populations and dose-response regression equations are
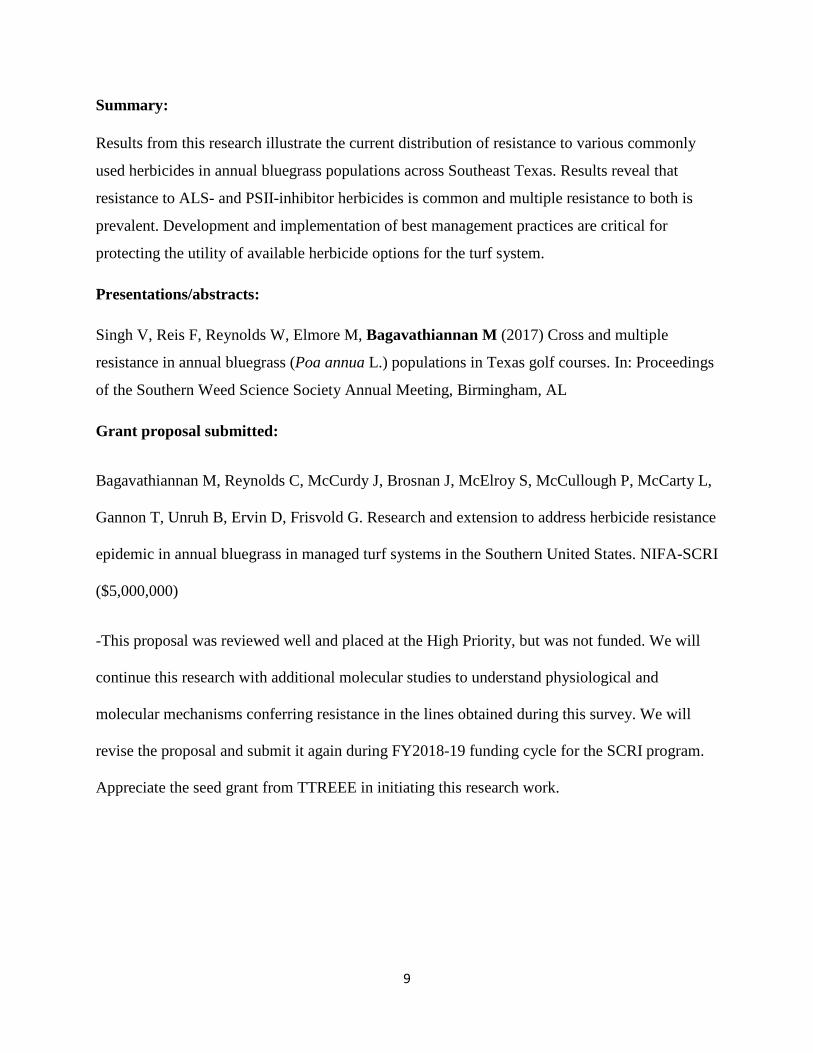
provided in Table 1. The resistance ratio (R/S) was the highest for simazine resistance (>490-
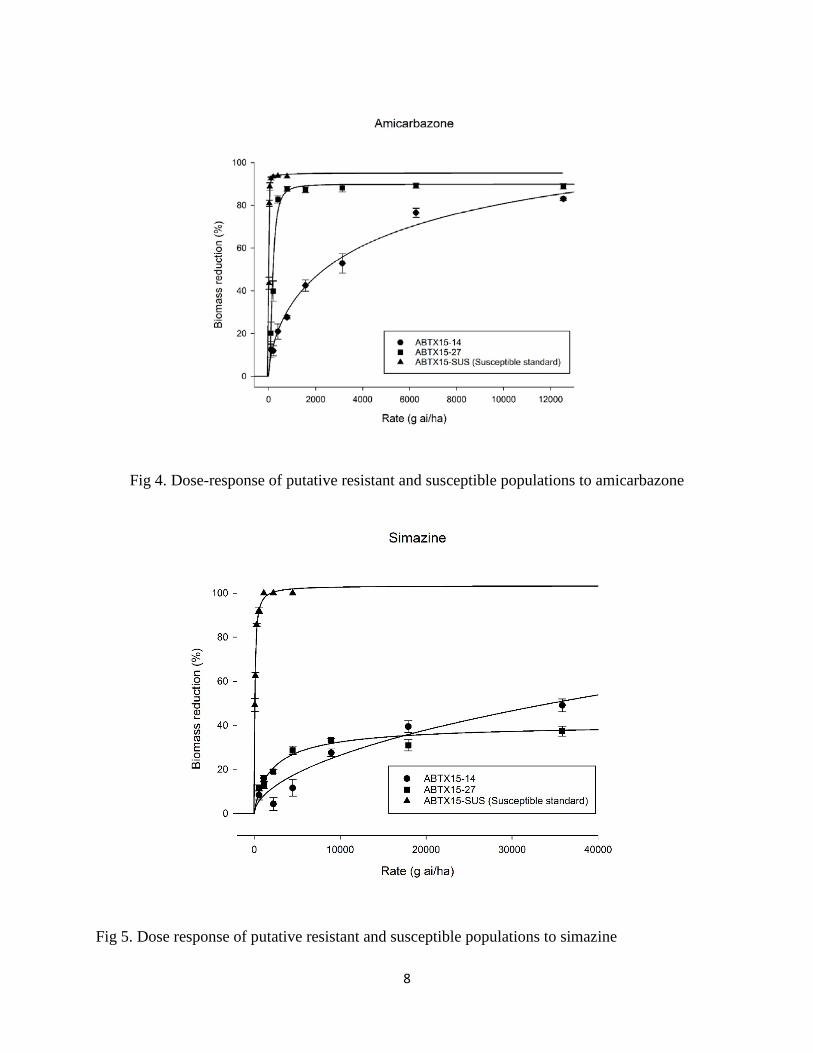
fold) in populations ABTX15-14 and ABTX15-27, followed by resistance to amicarbazone (186-
fold) in the ABTX15-14 population.
Table 1. GR50a values and resistance levels to herbicides in annual bluegrass (Poa annua)
populations sampled from east Texas, US
Herbicide Populationsb Regression equation R2 GR50 SEc R/S
g ai ha-1
Amicarbazone
ABTX15-14 Y = 80/[1+e-0.001(x-1930)] 0.95 2583.9 154.8 186
ABTX15-27 Y = 89/[1+e-0.13(x-205)] 0.97 225.7 9.6 16
ABTX15-SUS Y = 93/[1+e-0.17(x-13)] 0.98 13.9 1.6 _
Foramsulfuron
ABTX15-14 Y = 79/[1+e-0.16(x-9.9)] 0.78 13.1 1.1 10
ABTX15-27 Y = 77/[1+e-0.08(x-29)] 0.90 36.7 2.6 28
ABTX15-SUS Y = 93/[1+e-3.76(x-1.3)] 0.99 1.3 0.1 _
Simazine
ABTX15-14 Y = 49/[1+e-0.0001(x-9084)] 0.89 _ _ >490
ABTX15-27 Y = 34/[1+e-0.0006(x-1824)] 0.91 _ _ >490
ABTX15-SUS Y = 99/[1+e-0.008(x-70)] 0.98 73.1 10.5 _
Trifloxysulfuron
ABTX15-14 Y = 75/[1+e-0.06(x-27)] 0.87 38.6 3.6 29
ABTX15-27 Y = 51/[1+e-0.04(x-34)] 0.81 126.5 41.8 93
ABTX15-SUS Y = 88/[1+e-1.28(x-1.2)] 0.94 1.4 0.3 _ aGR50 is the herbicide concentration that reduced the plant growth by 50% based on above
ground dry biomass at 4 WAT. bPutative resistant populations (ABTX15-14 and 27) were treated with 8 rates (0.5 - 64X) of
amicarbazone, foramsulfuron, trifloxysulfuron, and 7 rates (0.5 – 32X) of simazine. Susceptible
standard was treated with 7 rates (0.062 – 4X) of respective herbicides. cSE = standard error of the estimate dR/S (resistance ratio) was calculated based on GR50 values of the putative resistant populations
relative to the susceptible standard.
6
Fig. 1. Geographic distribution of annual bluegrass (Poa annua L.) accessions collected in 2015
from Golf courses of Northeast Texas, USA
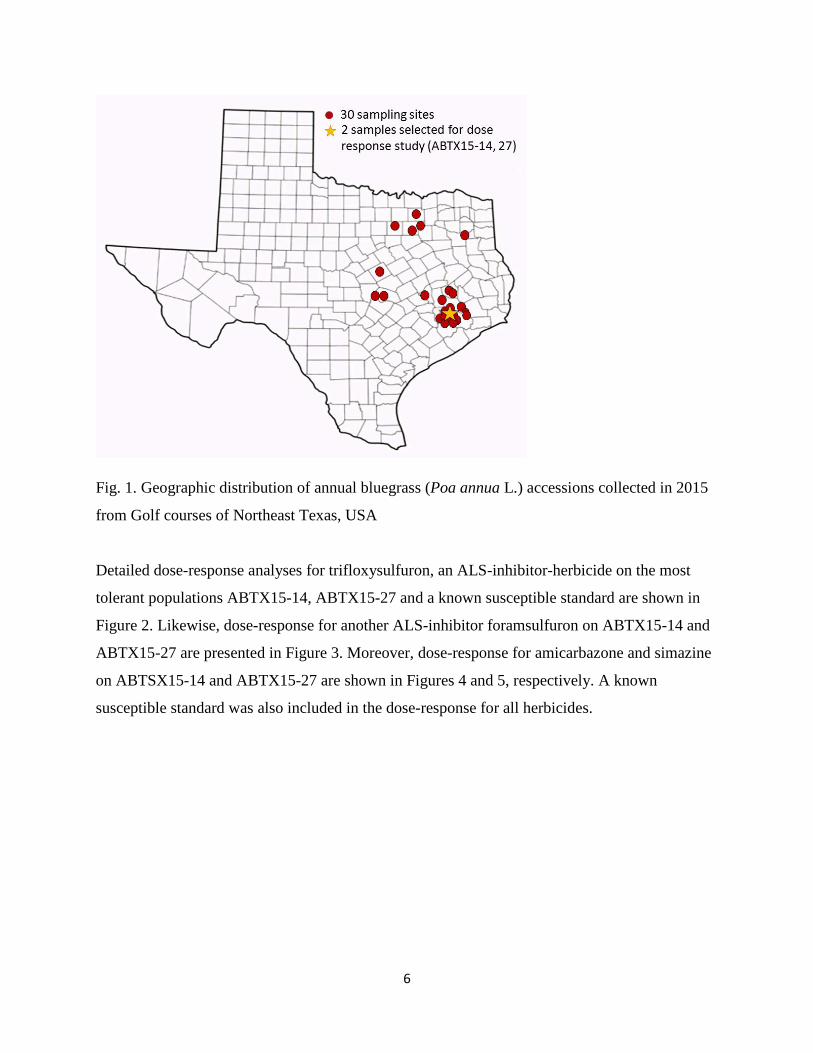
Detailed dose-response analyses for trifloxysulfuron, an ALS-inhibitor-herbicide on the most
tolerant populations ABTX15-14, ABTX15-27 and a known susceptible standard are shown in
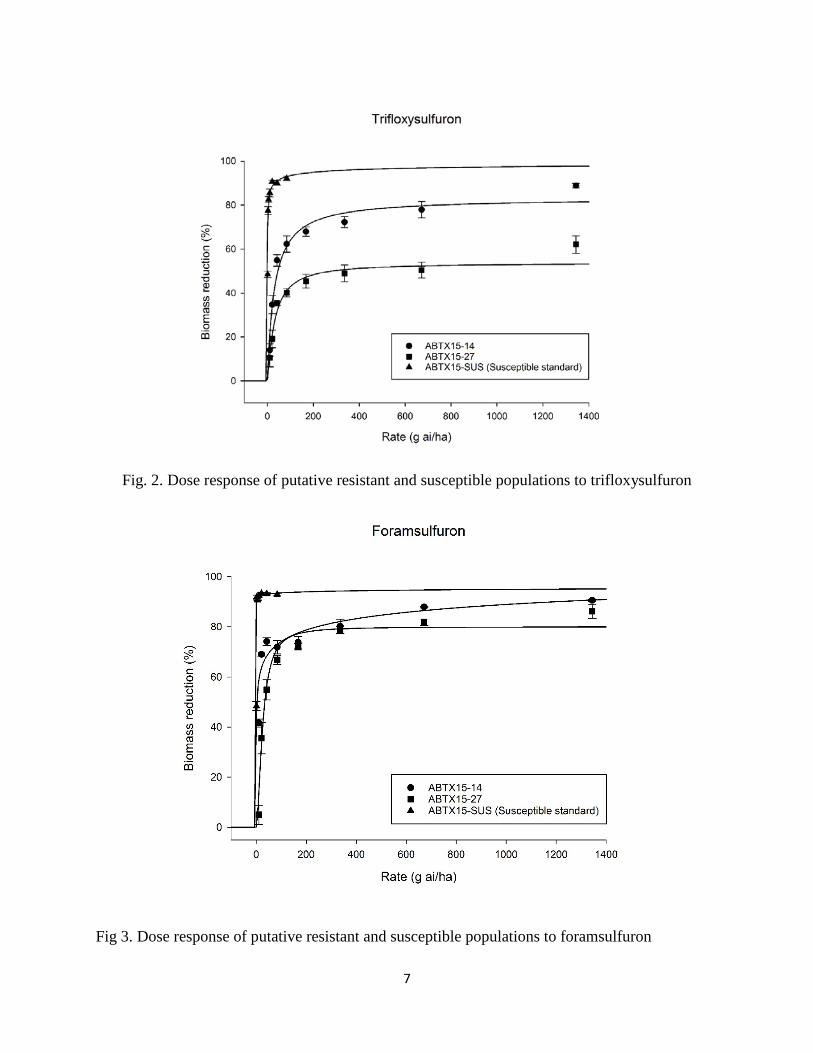
Figure 2. Likewise, dose-response for another ALS-inhibitor foramsulfuron on ABTX15-14 and
ABTX15-27 are presented in Figure 3. Moreover, dose-response for amicarbazone and simazine
on ABTSX15-14 and ABTX15-27 are shown in Figures 4 and 5, respectively. A known
susceptible standard was also included in the dose-response for all herbicides.
7
Fig. 2. Dose response of putative resistant and susceptible populations to trifloxysulfuron
Fig 3. Dose response of putative resistant and susceptible populations to foramsulfuron
8
Fig 4. Dose-response of putative resistant and susceptible populations to amicarbazone
Fig 5. Dose response of putative resistant and susceptible populations to simazine
9
Summary:
Results from this research illustrate the current distribution of resistance to various commonly
used herbicides in annual bluegrass populations across Southeast Texas. Results reveal that
resistance to ALS- and PSII-inhibitor herbicides is common and multiple resistance to both is
prevalent. Development and implementation of best management practices are critical for
protecting the utility of available herbicide options for the turf system.
Presentations/abstracts:
Singh V, Reis F, Reynolds W, Elmore M, Bagavathiannan M (2017) Cross and multiple
resistance in annual bluegrass (Poa annua L.) populations in Texas golf courses. In: Proceedings
of the Southern Weed Science Society Annual Meeting, Birmingham, AL
Grant proposal submitted:
Bagavathiannan M, Reynolds C, McCurdy J, Brosnan J, McElroy S, McCullough P, McCarty L,
Gannon T, Unruh B, Ervin D, Frisvold G. Research and extension to address herbicide resistance
epidemic in annual bluegrass in managed turf systems in the Southern United States. NIFA-SCRI
($5,000,000)
-This proposal was reviewed well and placed at the High Priority, but was not funded. We will
continue this research with additional molecular studies to understand physiological and
molecular mechanisms conferring resistance in the lines obtained during this survey. We will
revise the proposal and submit it again during FY2018-19 funding cycle for the SCRI program.
Appreciate the seed grant from TTREEE in initiating this research work.
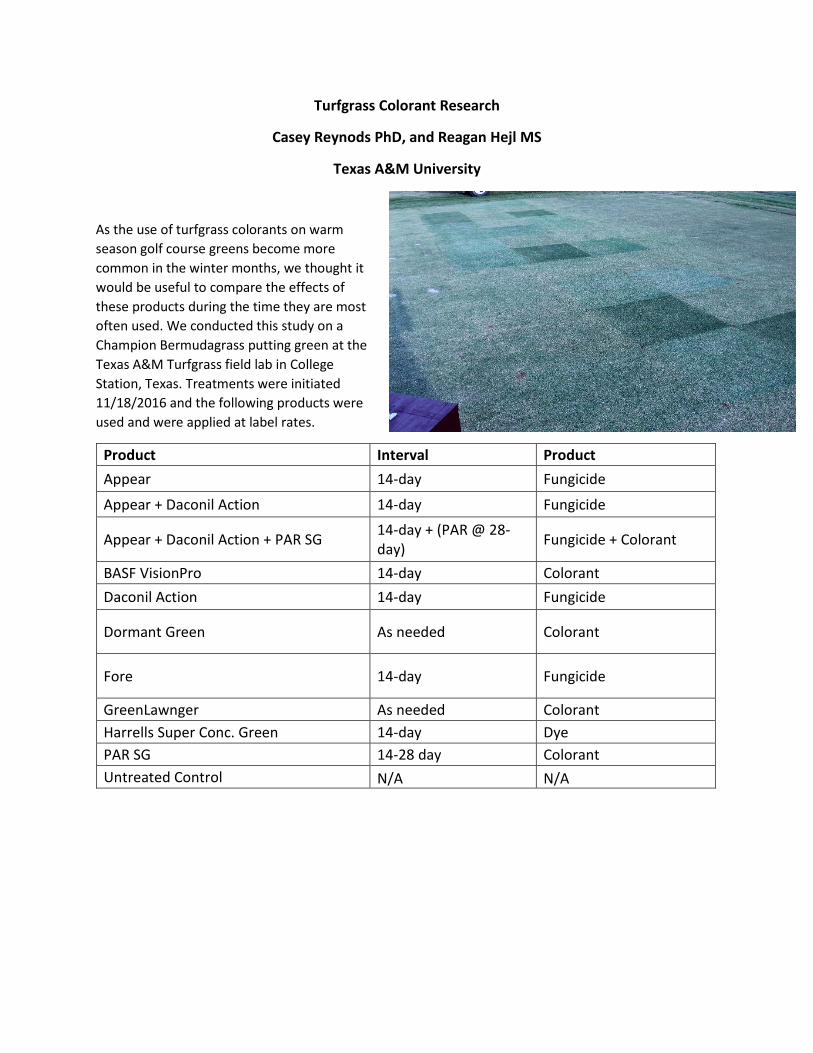
Turfgrass Colorant Research
Casey Reynods PhD, and Reagan Hejl MS
Texas A&M University
As the use of turfgrass colorants on warm season golf course greens become more common in the winter months, we thought it would be useful to compare the effects of these products during the time they are most often used. We conducted this study on a Champion Bermudagrass putting green at the Texas A&M Turfgrass field lab in College Station, Texas. Treatments were initiated 11/18/2016 and the following products were used and were applied at label rates.
Product Interval Product Appear 14-day Fungicide
Appear + Daconil Action 14-day Fungicide
Appear + Daconil Action + PAR SG 14-day + (PAR @ 28-day) Fungicide + Colorant
BASF VisionPro 14-day Colorant Daconil Action 14-day Fungicide
Dormant Green As needed Colorant
Fore 14-day Fungicide
GreenLawnger As needed Colorant Harrells Super Conc. Green 14-day Dye PAR SG 14-28 day Colorant Untreated Control N/A N/A
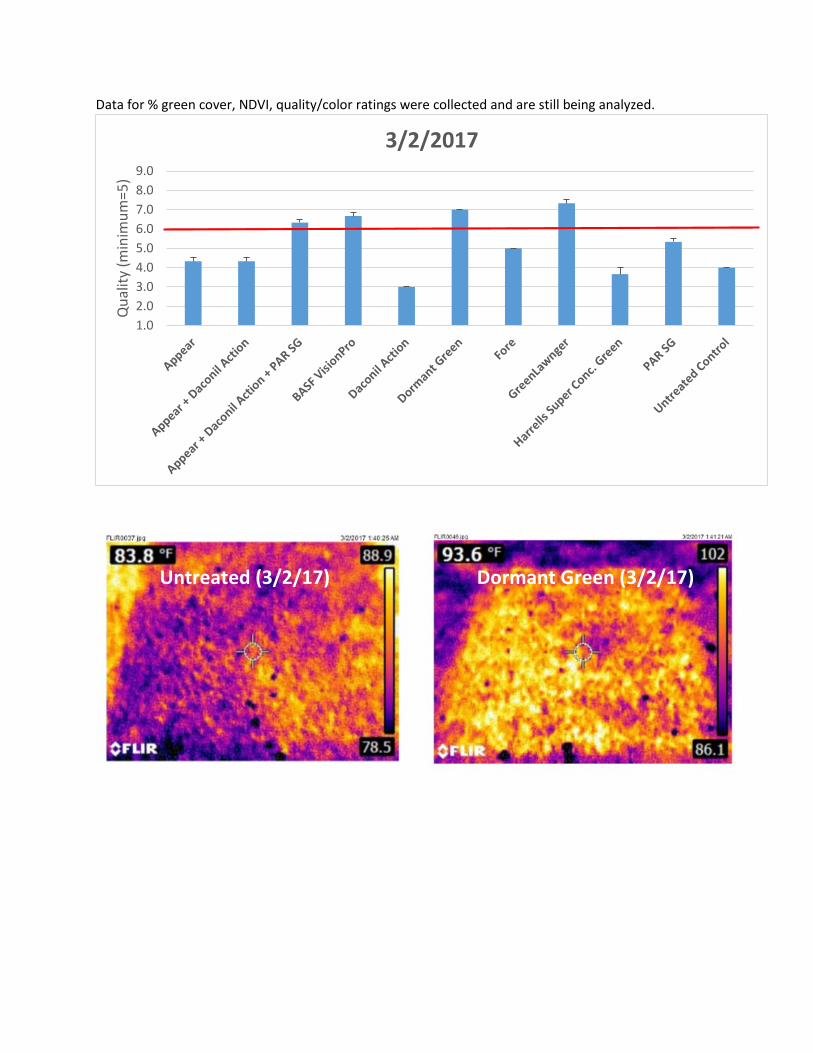
Data for % green cover, NDVI, quality/color ratings were collected and are still being analyzed.
1.02.03.04.05.06.07.08.09.0
Qua
lity
(min
imum
=5)
3/2/2017
Untreated (3/2/17) Dormant Green (3/2/17)


Evaluating Potential for Wetting Agents to Improve Turfgrass Health and Nitrogen Use Efficiency Under Deficit Irrigation of St. Augustinegrass
Ben Wherley, Jacqui Aitkenhead-Peterson, Baoxin Chang and Richard White
Department of Soil and Crop Sciences, Texas A&M University, College Station, TX 77843
Introduction:
Loss of water and nutrients from urban lawns via surface runoff has received increased scrutiny in recent years due to increasingly limited water supplies, and the environmental damage associated with nutrient losses from some ecosystems. With tighter scrutiny on landscape water use across the U.S., the use of wetting agents for improving soil water infiltration and retention has become widespread golf courses and sports fields, where sand root zones predominate. More recently, there has been growing interest by manufacturers in determining potential benefits of wetting agents on commercial and home lawns. Preliminary results from other universities as well as limited testing at the Texas A&M University Urban Landscape Runoff Facility have shown potential benefits of surfactant applications under reduced irrigation scenarios across a range of soil types. If these products show benefits in terms of increasing water infiltration/retention and/or reducing irrigation runoff losses from urban soils, this would could have widespread benefits on the sustainability of turfgrass systems throughout the U.S. and world where water availability is limited. Unfortunately, limited to no information is published concerning the effectiveness of these surfactants on nutrient uptake efficiency and runoff volume reductions. So, the objectives of this study are: 1) Determine the effects of regular applications of a surfactant in reducing the volume of runoff emanating from simulated home lawns, its benefit to soil moisture content, and turfgrass health and quality. 2) Determine if the use of surfactant will reduce nutrient losses in runoff under 2 irrigation regimes, specifically those of 60% x ETo (full replacement) and 30% x ETo (deficit level) irrigation.
Methodology:
This study was conducted at the Texas A&M Turf Field Laboratory in College Station, TX using the existing urban runoff research facility as described by Wherley et al. (2014). The facility contains 24 plots, each 13ft wide by 26ft long with a 3.5% slope and individual irrigation control. All plots are established with four-year-old ‘Raleigh’ St. Augustinegrass. At the toe of each plot is a runoff collection trough which empties through a flume connected to automated flow measurement and sample collection equipment. This gives full documentation of the amounts of water lost to runoff as well as samples for measurement of the chemical composition of the runoff. 20 plots (4 reps/treatment) were used for this study with treatments designed to address the following questions: 1) Does surfactant application significantly reduce runoff volume and increase runoff quality? 2) Does a surfactant improve turf quality under a 1 day a week deficit irrigation, and 3) Is there a synergistic effect of adding a surfactant + fertilizer versus
fertilizer or surfactant alone? Following treatments have been designed to test these questions:
Trt 1: 60% ETo irrigation, – Fert, -Synergy (control) Trt 2: 30% ETo irrigation, + Fertilizer + Surfactant Trt 3: 30% ETo irrigation, + Fertilizer - Surfactant Trt 4: 30% ETo irrigation, - Fertilizer, + Surfactant Trt 5: 30% ETo irrigation, - Fertilizer – Surfactant
Plots receiving the surfactant were treated every 4 weeks beginning July 21, 2016 and ending Nov.1, 2016, at a rate of 3oz/1,000 square feet. Plots receiving fertilizer were received Scotts Southern Turf Builder at the label application rate of 0.916 lbs. N/1,000 square feet on July 21 and September 22. The experimental period is beginning on July 15 and ending November 26.
Water samples and flow rate measurements were taken for each naturally occurring rainfall event during the 16-week period. Should any 4-week period receive insufficient natural rainfall to generate runoff, then the irrigation system need to be operated to apply approximately 0.75-1.0 inch of water, or more if needed, to result in significant runoff collection. During the study period, irrigation system has never been operated to generate runoff because of sufficient natural rainfall. Collected runoff water samples were analyzed for pH, EC, nitrate-nitrogen, ammonium-nitrogen, total dissolved nitrogen (TDN) and orthophosphate-P concentrations. Dissolved organic nitrogen (DON) were estimated for each sample by deducting NO3-N + NH4-N from TDN.
Plots were irrigated every Wednesday morning to simulate home lawns being managed under “once a week” irrigation restrictions. Plots were visually rated for turf quality each Tuesday (day before irrigation) to evaluate quality under stressed (30% ETo) conditions. Moisture content of the upper 7 cm of soil in each plot were measured each Tuesday (1 day pre-irrigation) and Friday (2 day post-irrigation) morning using a hand held Spectrum Field Scout instrument. Digital photos of each plot were taken every Tuesday to provide an unbiased estimate of percent green cover.
Results and Discussion:
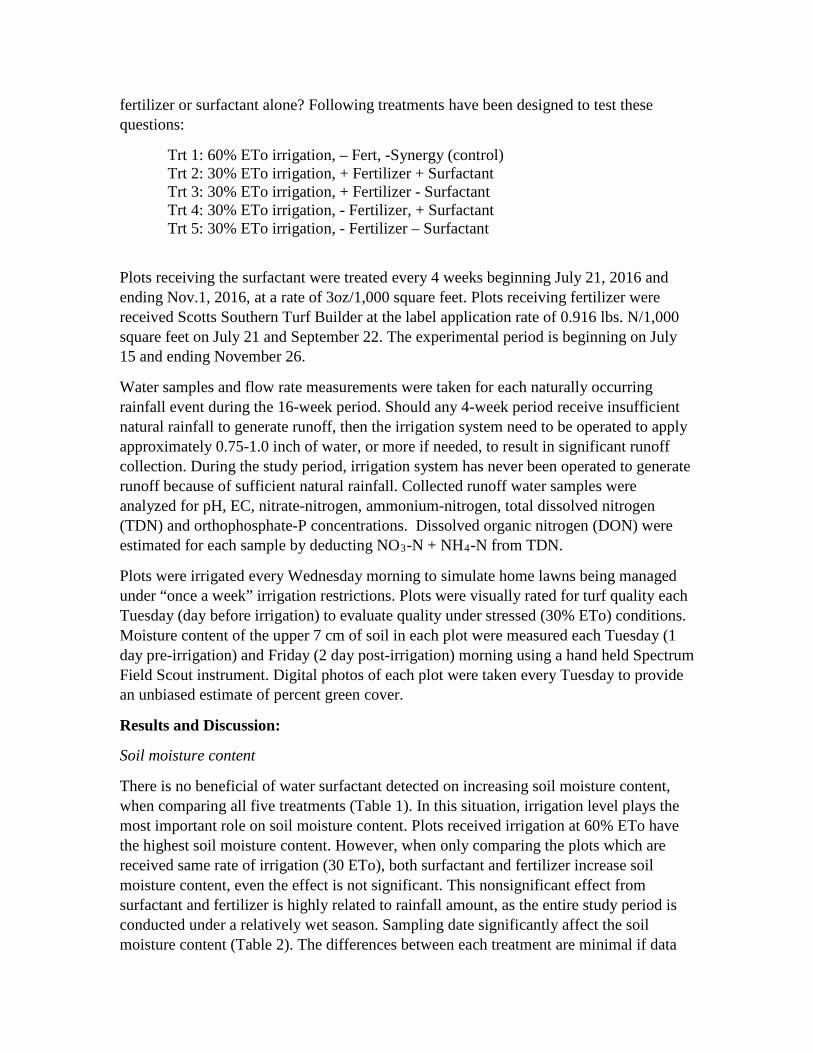
Soil moisture content
There is no beneficial of water surfactant detected on increasing soil moisture content, when comparing all five treatments (Table 1). In this situation, irrigation level plays the most important role on soil moisture content. Plots received irrigation at 60% ETo have the highest soil moisture content. However, when only comparing the plots which are received same rate of irrigation (30 ETo), both surfactant and fertilizer increase soil moisture content, even the effect is not significant. This nonsignificant effect from surfactant and fertilizer is highly related to rainfall amount, as the entire study period is conducted under a relatively wet season. Sampling date significantly affect the soil moisture content (Table 2). The differences between each treatment are minimal if data
were collected right after a rain event which gives every plot a relatively high water input. However, on some dry dates, it’s easier to find that surfactant sometimes elevates the soil moisture content, and soil moisture content is even reduced by fertilizer. These results suggest that surfactant has benefit on keeping water in soil, especially when water is lacking, and additional fertilizer application on a dryer soil stimulate turfgrass absorbing more water for growth, and therefore the soil moisture content is reduced without any additional water supply. An interaction between surfactant and fertilizer is also found (ANOVA is not shown here). Appling surfactant alone seems like is more efficiency than applying it along with fertilizer (Table 1). This uncertainly antagonistic effect should be able to be explained better with combining the data from 2015.
Turf quality
Both surfactant and fertilizer significantly enhance the turf quality, and this positive influence by surfactant and fertilizer is even more efficacious than by high irrigation rate (Table 3). In addition, there is a synergistic effect detected between surfactant and fertilizer on plot percent green cover. Plots applied with surfactant and fertilizer show a significantly higher percent green cover value than those only applied one of them or non-chemical applied control. If comparing all treatment after pick out the 60 ETo treatment, no matter what chemicals were applied, they all significantly increase the plot percent green cover, which means a better quality turf was created. Appling fertilizer enhance turf quality is easy to explain, because more turf growth required elements such as N, P, and K were applied, and thus makes turf grow faster and keeps them more vigorous. The mechanisms behind the enhanced turf quality by surfactant in one hand can may be explained by that it directly increases the plant available water volume as mentioned in soil moisture content section, and in another hand, it may also help plant taking up water easier. This also help to explain why plot irrigated with 60 ETo level has a lower percent green cover than those irrigated with 30 ETo level along with a surfactant application. Without surfactant’s help, the water uptake efficiency of plant is weaker, even those plots have higher soil moisture content. At last, percent green cover of all treatments is higher than 70%, even the lowest one, and no extremely drought damage was found for all plots. This is because that the entail season is relative wet, as we mentioned before.
Runoff chemistry
Chemistry data, obtained from runoff are more complicated. So only few of them will be presented in the following paragraph.
Runoff nitrate concentration was more affected by fertilizer application, rather than surfactant application (data is not shown). During the study period, nitrate concentration of runoff was tremendously increased as the measurement taken right after fertilizer application. The following measurements next the first also showed a higher nitrate concentration of fertilized plots, comparing to those none fertilizer applied.
A synergistic Effect of surfactant and fertilizer was measured on increasing ammonium content of runoff (Table 4). Combining fertilizer and surfactant gave the highest ammonium content of runoff, and this concentration is significantly higher than the concentration of another two treatments. It’s obvious to say that nitrogen input from fertilizer could be able to increase the ammonium content, and interestingly, additional surfactant seems like motivates this function.
As we mentioned before, the soil moisture content which should be relative to runoff volume, was highly affected by rainfall amount, so the effect of surfactant on runoff volume was determined by each measuring date. Result showed that runoff volume was significantly reduced by surfactant on most of the measuring date, especially on the last couple dates (Date is not shown). Apparently, giving enough time is needed to maximize the efficacy of surfactant.
Conclusions:
Based on the results, surfactant, product which is designed to mitigate water repellency of a soil, is capable of reducing the water loss through runoff, and consequently improve the irrigation effiecieny on a simulated St. Augustingrass home lawn. In addition, a continuous application is recommended instead of just spraying once. This method could help to maximize it’s performance, such as improving water infiltration and distribution. Surfactant also improves turf quality, especially combined with fertilizer. They are working together to maintain home lawn at an acceptable level under deficit irrigation. Runoff chemisrty is not influenced by surfacant markedly. For example, the nitrate and ammonium concentration of surfactant treated plots are close to control. However, if we make a calculation by multiplying runoff volume with nutirent concentration, the net nutrient loss from runoff was definitly reduced by surfactant.
Table 1. Effect of irrigation level, fertilizer, and surfacant on soil moisutre content.
A
A
A
A
A
0 10 20 30 40 50
Soil Volumetric Water Content(VWC)
Treatm
ent
Soil Moisture Content
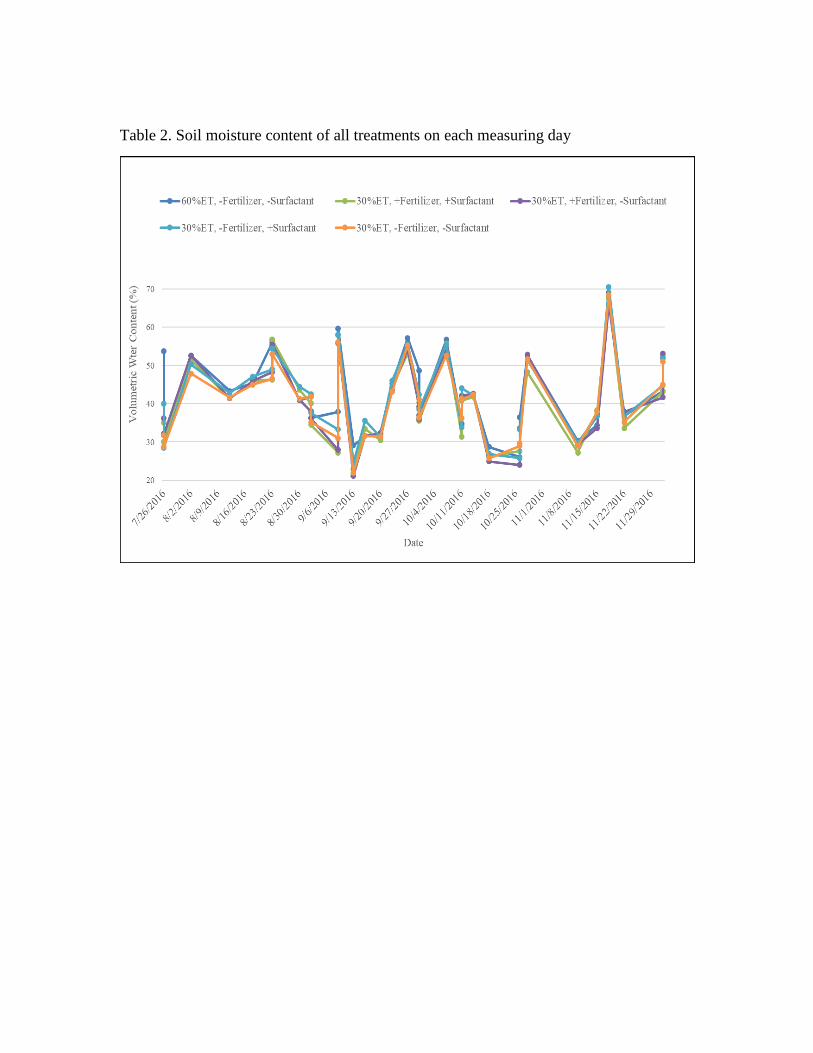
Table 2. Soil moisture content of all treatments on each measuring day
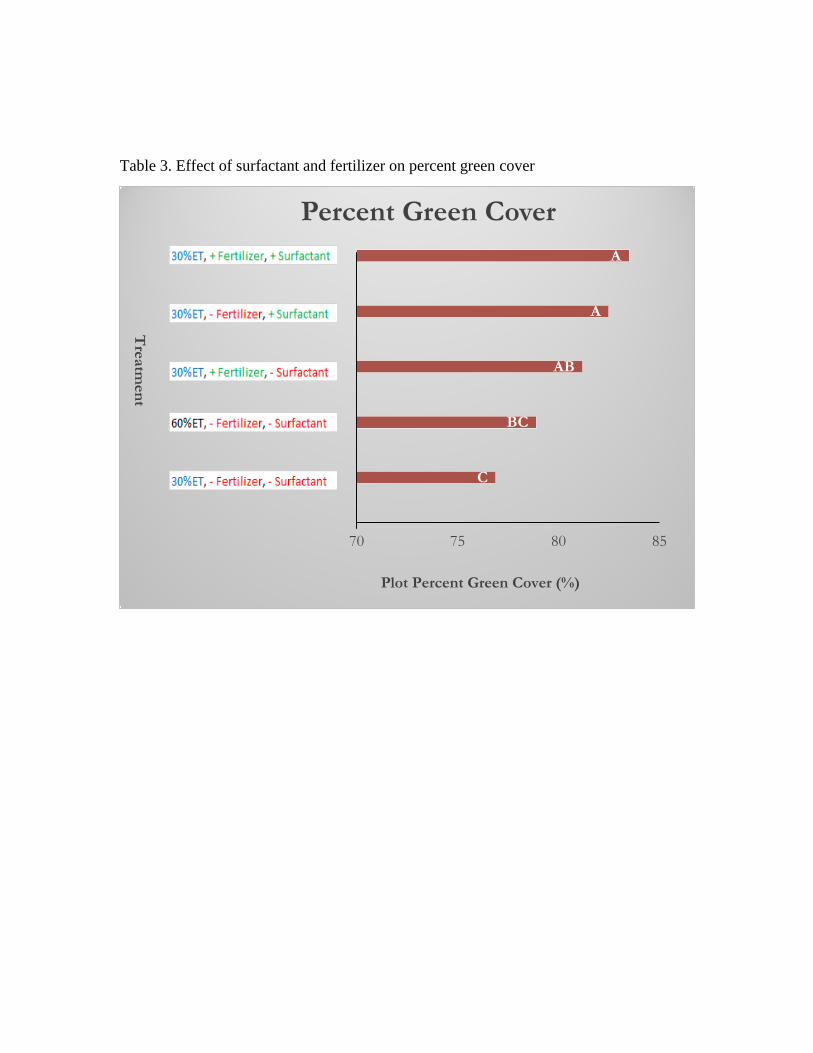
Table 3. Effect of surfactant and fertilizer on percent green cover
C
BC
AB
A
A
70 75 80 85
Plot Percent Green Cover (%)
Treatm
ent
Percent Green Cover
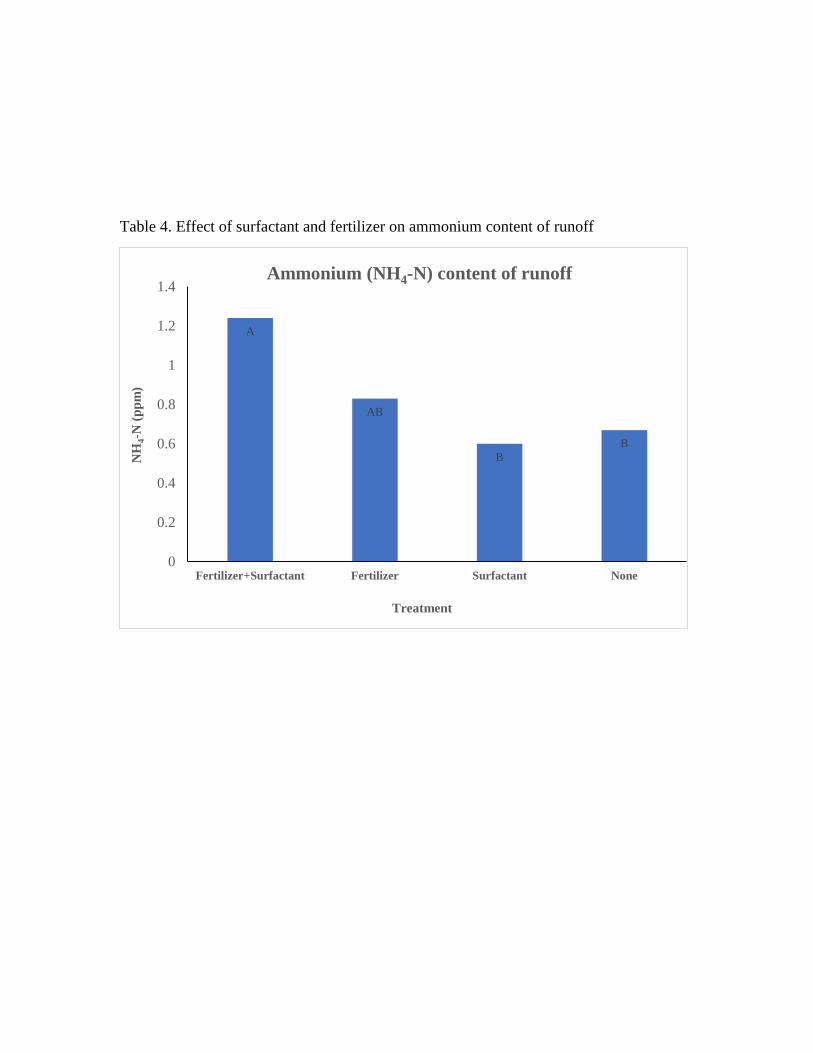
Table 4. Effect of surfactant and fertilizer on ammonium content of runoff
A
AB
BB
0
0.2
0.4
0.6
0.8
1
1.2
1.4
Fertilizer+Surfactant Fertilizer Surfactant None
NH
4-N
(ppm
)
Treatment
Ammonium (NH4-N) content of runoff

TREE Summary Report – Texas Tech University
Physiological impact of chronic water stress on common residential lawn turf species in West Texas
This greenhouse evaluation has been completed in full with two full experiments run with all data collected. The data have been analyzed for all parameters, but further figures and tables need to be constructed for the various parameters.
Two separate greenhouse evaluations were conducted using 7 inch x 4 inch diameter PVC plastic as a pot. Weed barrier material was placed in the bottom with an 80% sand:20% profile mix included as the rootzone mix. ‘Celebration’ bermudagrass, ‘Legacy’ buffalograss, and an experimental tall fescue were obtained as plugs (2 inch diameter and 2 inch length) using a Turf Tech Plugger (TurfTec International) from a field study in September and October for experiments one and two, respectively. The potted grasses were placed in the greenhouse and allowed to acclimate to conditions and fully grow into the pot over 4-5 months as all instrumentation was obtained and put together. Pots were well watered, fertilized, and maintained at a 1-2 inch mowing height throughout the acclimation period.
Experimental pots for study 1 and 2 were arranged as a randomized complete block design that were aligned away from the cooling system. Each block consisted of all turf species irrigated at 1.5, 2.0, 2.5, or 3 fl oz per watering with four blocks in each experiment. Three independent researchers rated the pots for visual turf quality and leaf firing on 1-9 scale on Tuesday and Friday each week. Digital image analysis (green cover and color) was conducted on images from a portable light-box following visual rating. Canopy temperature was recorded as a single observation from each pot. NDVI was determined Tuesday’s and Friday’s using a RapidScan CS-45 with only the grass exposed at a height of 24 inches above the canopy. Data were uploaded to the TurfScout website for calculations of NDVI and other spectral analysis parameters. Both canopy temperature and NDVI measurements were conducted between 1100 and 1200 hours to ensure full sunlight availability at the time of measuring. Relative water content (%) was obtained with a TurfScout Water Meter at a 3 inch depth along with total pot weight being logged on Tuesday, Wednesday, and Friday to estimate moisture content in the pot throughout both studies. A custom photosynthesis chamber was constructed using a kit from Li-Cor (LI 6400-19) and attached to a LI-6400 photosynthesis. Photosynthetic measurements were completed between 1100 and 1400 hours on completely clear days within the greenhouse. All experimental units within a single block were measured using the clear plastic chamber initially, and then dark respiration measurements were obtained for the 3 oz water level of each species to allow for the calculation of net photosynthesis. Photosynthetic measurements were generally obtained on Wednesday’s, but cloud cover required delays on a few occasions.
Further analysis from the trial will be required for final conclusions and results; however, there were some clear trends the data followed that speak to the phsysiological differences of these grass species under chronic drought stress. Environmental conditions were a critical factor in the health and physiological performance of all the turf species with the 4th rep (closest to the cooling system) having significantly better visual quality, cover, color, NDVI, and
photosynthesis than the 1st rep located farthest from the cooling system. The differences observed did not appear to be as much of a water stress as a heat stress reduction closer to the cooling system. The weather data within the greenhouse was collected and retrieved following the two experiments, but those data have not been closely reviewed at this point.
Turfgrass visual quality, leaf firing, and cover followed similar trends. Experiment 1 had some strong declines in turf quality and color with increased firing after the first 10-14 days. There was an improvement in these parameters after a couple of weeks because supplemental water was initially applied two days per week. This watering rate did not result in enough water to sustain the control pots well in the primarily sand-based root system. The watering was extended to 3-days per week at the listed volumes from that point forward in Experiment 1 and the entire time in experiment 2.
There were many significant differences between turf species that were interesting to see for many of the parameters evaluated. Initially, tall fescue and bermudagrass were generally the best in turf quality and green cover, but tall fescue diminished quickly with the hot temperatures reached in the greenhouse (Fig. 1-3). The diminishment in quality and cover was most significant in Experiment 1 with the minimal watering schedule and tall fescue struggled to get much recovery as the irrigation level increased. There was lots of variation in tall fescue performance in Experiment 2, but the higher irrigation treatments did maintain significantly better quality and cover than lower irrigation levels. NDVI levels followed similar trends as these, but limited differences were observed with the pot weights and TDR values throughout either study. These findings are closely tied to the research findings from our field study that conducts similar research in a field setting.
One of the primary goals of this greenhouse study was to include photosynthetic measurements because it was not feasible to conduct the physiological measure in the field study with the number of treatments and irregularities with the natural environment. The photosynthesis system developed from the Li-Cor kit effectively measured gas exchange with our lit and dark measurements. These weekly measurements helped provide physiological understanding of the visible stresses present with the other data collections. The figures provided illustrate mean photosynthesis values per week for the various grass species evaluated. There was variation in the data observed, but generally, the lower water content pots exhibited poorer photosynthesis values than higher watered treatments. The heat experienced in the greenhouse setting during Experiment 2 was likely a major physiological challenge for the tall fescue that resulted in near negative values throughout the trial. Bermudagrass and buffalograss were more consistent in values, but did diminish over time with irrigation treatments separating as expected in the last rating dates (Figs. 4-6).
Ultimately, we complete analysis and interpretation of this data and look to develop a peer-reviewed publication of the work. Additionally, the final report will be published on the Aggie Turf Website later this year. For more pictures of the trial, visit our Texas Tech Turf blog at https://ttuturf.blogspot.com. We appreciate the financial support from the TREE Endowment and Texas A&M that allowed us the opportunity to conduct this important research on conserving water in our lawns and landscapes.

Figures 1-3. Mean percent green cover measured by digital image analysis from Experiment 2.
01020304050607080
0 5 10 15 20 25 30 35
Perc
ent G
reen
Cov
er
Day of Trial
Bermudagrass Percent Green Cover
3 2.5 2 1.5
0
10
20
30
40
50
60
0 5 10 15 20 25 30 35
Perc
ent G
reen
Cov
er
Day of Trial
Buffalograss Percent Green Cover
3 2.5 2 1.5
0
20
40
60
80
100
0 5 10 15 20 25 30 35
Perc
ent G
reen
Cov
er
Day of Trial
Tall Fescue Percent Green Cover
3 2.5 2 1.5
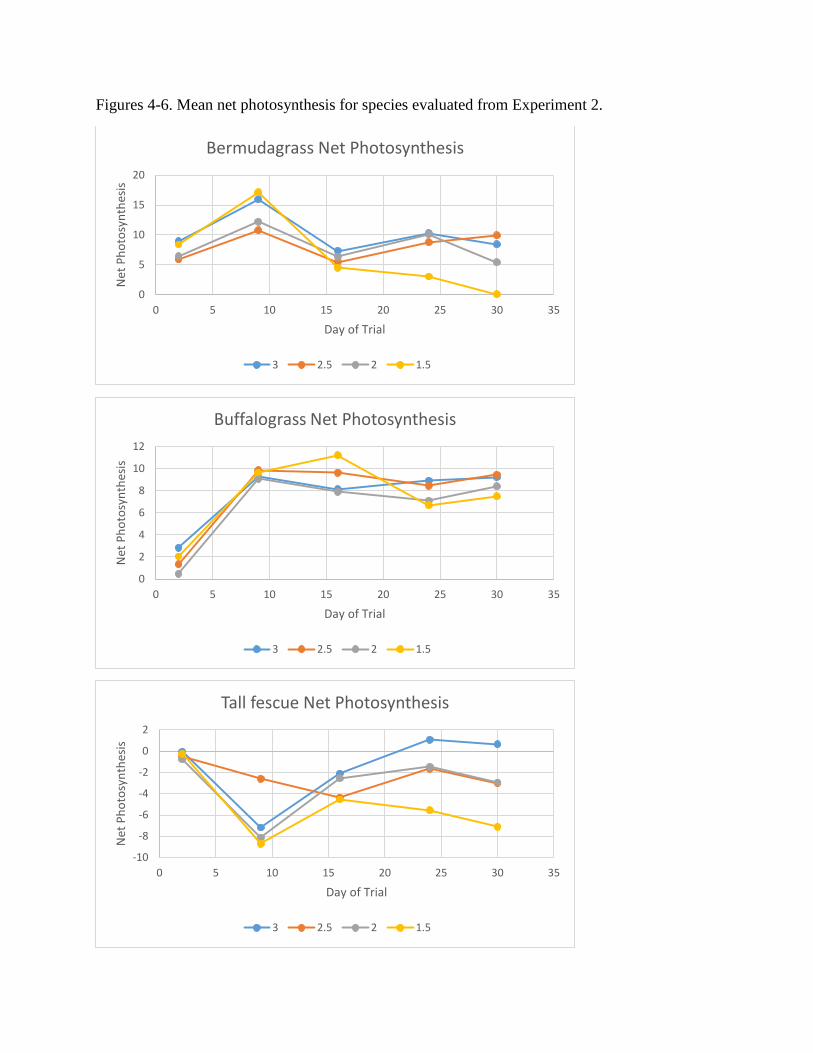
Figures 4-6. Mean net photosynthesis for species evaluated from Experiment 2.
0
5
10
15
20
0 5 10 15 20 25 30 35
Net
Pho
tosy
nthe
sis
Day of Trial
Bermudagrass Net Photosynthesis
3 2.5 2 1.5
0
2
4
6
8
10
12
0 5 10 15 20 25 30 35
Net
Pho
tosy
nthe
sis
Day of Trial
Buffalograss Net Photosynthesis
3 2.5 2 1.5
-10
-8
-6
-4
-2
0
2
0 5 10 15 20 25 30 35
Net
Pho
tosy
nthe
sis
Day of Trial
Tall fescue Net Photosynthesis
3 2.5 2 1.5

We do have all the data and we have done analysis on everything. There is likely some further analysis needed for some parameters to develop into a publication, but I think the data is good all in all.
I included some basic figures for people to get an idea of the data. If I need to make any major changes to the report that you can see, let me know. I am about to be heading out to our research farm to prep for our field days tomorrow and Saturday, but I could work on something later tonight if it is needed.


![Hypochlorite Ion Strength[1]](https://img.pdfslide.us/doc/110x75/577d219a1a28ab4e1e95958b/hypochlorite-ion-strength1.jpg)