Embed Size (px)
Citation preview

MITLibrariesDocument Services
Room 14-055177 Massachusetts AvenueCambridge, MA 02139Ph: 617.253.5668 Fax: 617.253.1690Email: [email protected]://libraries.mit.edu/docs
DISCLAIMER OF QUALITY
Due to the condition of the original material, there are unavoidableflaws in this reproduction. We have made every effort possible toprovide you with the best copy available. If you are dissatisfied withthis product and find it unusable, please contact Document Services assoon as possible.
Thank you.
Some pages in the original document contain pictures,graphics, or text that is illegible.
ON DIRECTIONAL SELECTIVITY IN VERTEBRATE RETINA:AN EXPERIMENTAL AND COMPUTATIONAL STUDY
by
Lyle J Borg-GrahamB.S.E.E., University of California at Berkeley, (1980)
S.M.E.E., Massachusetts Institute of Technology, (1987)
Submitted to the
HARVARD-MIT DIVISION OF HEALTH SCIENCESAND TECHNOLOGY
in partial fulfillmentof the requirements for the degree of
DOCTOR OF PHILOSOPHY
at the
MIT LIBRARIES
SjII N 9 1992
SCHERNG
MASSACHUSETTS INSTITUTE OF TECHNOLOGY
November 1991
@1991 Lyle J Borg-Graham
The author hereby grants to M.I.T. permission to reproduce and to distributepublicly copies of this thesis document in whole or in part.
Signature of AuthorHarvard-MI-tLbivision of Health Sciences and Technology
November 30, 1991
Certified byTomaso Poggio
Thesis SupervisorCo-Director, Centej for Biological Information Processing
Accepted by-i
VJ Roger MarkCo-Chairman, Harvard-MIT Division of Health Sciences and Technology
MsS~C'i ,@JO ';) ;'iSTITTE0f TFCP0,Y OG
CL OJ 0. 1991L18FBR^RE.S
SCHER-PLOUGH.
_ !, .
ABSTRACT
Retina is a good candidate for exploring the relationship between neuralcomputation and circuit, in particular given its physically peripheral locationand its physiologically central status. One example of a spatial-temporalcomputation in the retina is directional selectivity (DS). This computationmay rely on interactions within the dendritic tree which are incrementallymore complex than the basic "point integration" and fire neuronal response.
In this Thesis I use experimental and theoretical techniques to charac-terize the DS circuit in vertebrate retina. For the experimental side I havedeveloped a) an isolated intact turtle retina preparation and b) a whole-cell patch recording protocol of DS ganglion cells, the combination of whichis well-suited for characterizing complicated retinal receptive fields. I willshow evidence that when the inhibitory synaptic input is markedly reducedthe excitatory input to DS ganglion cells in turtle is itself DS. This reduc-tion was accomplished by a) voltage clamping to the reversal potential ofinhibitory currents and b) by removing ATP from the electrodes which, inturn, blocks IPSPs over time.
This finding implies that the necessary and sufficient conditions for thecomputation of DS occurs pre-synaptic to the ganglion cell. For the theoret-ical side of the Thesis, and consistent with the above constraint, I present amodel for the DS circuit that relies on DS distal outputs from functionallyindependent oriented amacrine cell dendrites. I postulate that these dendritecables receive symmetric, evenly distributed, but temporally distinct exci-tatory and inhibitory inputs along their length. Performance of the model(tested with a biophysically and morphometricly detailed neuron simulatorprogram, SURF-HIPPO) is consistent with the data, and generates testablepredictions.
I shall also discuss how this model may work in a developmental con-text and, finally, implications for more general non-linear spatio-temporalfiltering within dendritic trees.
1
ACKNOWLEDGMENTS
First, my career at MIT and HST could not have happened without theinspiration and support of Ernie Cravalho, who decided to take a gamble.
My development as a scientist has been fundamentally guided by TomasoPoggio, my advisor and advocate during my tenure at the Center for Biolog-ical Information Processing, and by Norberto Grzywacz, who has been mycollaborator and teacher. I hope that the quality of my work may emulatethe standards set by theirs.
During my stay at CBIP I was fortunate to mix with an eclectic and gre-garious bunch that passed through over the years; thanks to Tommy, andEllen Hildreth, co-directors of CBIP, and Elizabeth Willey, who runs thewhole show, for making CBIP a Great Resource. Having Anya Hurlbert foran office-mate was icing, and to the honorary CBIP member Davi Geiger,thanks for the sanity checks. Discussions and debates with Christof Koch,Randy Smith, Heinrich Biilthoff, Jeff Sutton, Shimon Edelman, DaphnaWeinshall, Gadi Geiger, Manfred Fahle, Michael Prince (honorary memberfrom The Academy), Thomas Vetter, Jenny McFarland and Jim Smith al-ways ended up illuminating the issue at hand. Thanks to Randy as well forhis help and enthusiasm in the lab, and to Polly McGahan and Marcia Rossfor all their help, especially since I was always late.
I was fortunate to be a part of the HST-MEMP program: my experienceas a part-time med student, in particular alongiIaie Mehmet Tomer, is greatlyvalued. The consistent and warm support from Keiko Oh at HST has beenmuch appreciated during my time here. I would also like to acknowledgethe support of the Department of Brain and Cognitive Sciences, includingthat from Jan Ellertsen. I also thank Mohymen Sadeek, Thomas Olsen, allmy 'buds from California, and, especially, the poet David English for theirfriendship and good humour through the years.
I thank the rest of my thesis committee for their help and useful critiques:Ray Dacheux, John Wyatt, and, especially, Richard Anderson.
Finally, I would like to thank my mother, Kathy Graham, for her supportin both word and deed, and, more importantly, for her passing onto me fromher parents lessons of perseverance and quality. And to my brother Chris,who never let me down and always helped keep my chin up.
This Thesis is dedicated to Josette, whose spirit and creativity I honor.
2
This Thesis describes research done within the Center for Biological In-formation Processing in the Department of Brain and Cognitive Sciences.This research is sponsored by the grant BNS-8809528 from the NationalScience Foundation; by a grant from the Office of Naval Research, Cogni-tive and Neural Sciences Division; by the Alfred P. Sloan Foundation; bya grant from the National Science Foundation under contract IRI-8719394.Tomaso Poggio is supported by the Uncas and Helen Whitaker Chair at theMassachusetts Institute of Technology, Whitaker College.
3
Contents
1 Introduction 12
2 Directional Selectivity in the Visual System 142.1 A Definition of Directional Selectivity ............. 14
2.1.1 Directional Selectivity versus Difference . . . . . . . . 152.1.2 Consistency of Directional Properties Over the Recep-
tive Field . . . . . . . . . . . . . . ..... . . . . . . 152.1.3 Directionally Selective Responses Emerge at Different
Levels for Different Species . . . . . . . . . . ..... 152.1.4 Structure of, and Directional Response in the Retina . 16
2.2 Theoretical Requirements for Directional Selectivity and Dif-ference ............................... 16
2.3 Experimental Work on Retinal Directional Selectivity .... 172.3.1 Extracellular Electrophysiology ............. 172.3.2 Intracellular Electrophysiology . ....... 182.3.3 Neurochemistry ...................... 202.3.4 Anatomy ......................... 20
2.4 Theoretical Work on Retinal Directional Selectivity ..... . 202.4.1 Implications of Ganglionic Directionally Selective In-
teractions ......................... 212.4.2 Starburst Amacrine Cell Models for DS ....... . 23
2.5 Summary ............................ . ..... 23
3 Directionally Selective Ganglion Cells in Turtle: Experi-mental Results 303.1 Stimuli for Characterizing Directional Selectivity ....... 31
3.1.1 Gratings Versus Bars, Temporal and Spatial Windowing 31
4
3.2 Protocols for the Identification and Characterization of Di-rectionally Selective Cells .. .................. 343.2.1 Basic Protocols ...................... 343.2.2 Advanced Protocols . .................. 35
3.3 Elimination of IPSPs With Maintenance of Antagonistic Cen-ter Surround Excitatory Input ................. 37
3.4 Directionally Selective Responses ................ 383.4.1 Directionally Selective Responses Under Current Clamp 383.4.2 Directionally Selective Responses Under Voltage Clamp 38
4 A Model of Retinal Directional Selectivity 654.1 Oriented Amacrine Cell Branches with Directionally Selective
Outputs ............... ............... 654.1.1 Start by Finding the Asymmetry . . . . . . . . .... 694.1.2 Add Location Dependence . . . . . . . . . . . ..... 694.1.3 Directional Dependence for the Linear Case ...... . 704.1.4 Synaptic Nonlinearities and Cable Directionality . . . 704.1.5 Considering Tip Output Nonlinearity, Facilitation, and
the Sign of the Output . ................ 714.2 Predictions of the Model ..................... 73
4.2.1 Directionally Selective Somatic Recordings? ...... 734.2.2 Dependence of Directional Selectivity on Ganglion Cell
Membrane Potential .............. . 744.2.3 Comparing Total Synaptic Input for the Preferred/Null
Responses ... ....... 744.2.4 Dynamic Range of Cable Mechanisms: Saturation and
Reversal of Directional Selectivity . ........ 754.3 Simulations of Morphometricly and Biophysically Detailed
Amacrine Cell Models ........ ............... 764.3.1 Simulations of Asymmetric Responses from Symmet-
ric Cells .......................... 764.3.2 Parametric Simulations of Cable Mechanisms . .. . . 774.3.3 Simulations of Facilitation by an Inactivating K + Chan-
nel ............................. 794.3.4 Accounting for the Anomalous Area Response .... . 804.3.5 An Asymmetric Substrate for Non-Linear Interactions
Avoids Preferred Direction Inhibition ......... 804.4 Summary .............................. 81
5
5 Discussion 915.1 Experimental Evidence of Pre-Synaptic Computation of Di-
rectional Selectivity and Possible Complications ....... 915.2 Anatomical Predictions of the Cable DS Model . . . . . .. 92
5.2.1 Correlating Anatomy with Function ......... 945.3 Relative Frequency of Directional Selective Responses ... . 94
5.4 Comparison to Results of Watanabe and Murakami: Direc-tionally Selective Responses in-ON, OFF, and ON/OFF Cells 95
5.5 Development of Direction Selectivity: The Problem of Coor-dination of Asymmetries . . . . . . . . . . . . . . . . . . 95
5.6 Retinal Directional Selectivity: Exemplar of a Canonical Com-putational Mechanism? . . . . . . . . . . . . . . . . . . 965.6.1 For Generic Central Neurons: Trees of Dendrite Filters 96
5.7 So What Are Ganglion Cells For, Anyway? .......... 995.8 Implications for DS in the Visual Systems of Higher Species . 99
A Isolation and Recording of Turtle Retina Allowing for Arbi-trary Electrode Approach and Trans-Illumination of Retinal00A.1 Dissection Method .. . . . . . . . . . . . . . ..... 101
A.1.1 Importance of Low Light During Dissection ...... 102A.2 Recording System for Superfusion and Transmitted-Light IR
Microscopy ............................ 103A.3 Stimulus Generation, Data Acquisition and Experiment ControllO3A.4 Extracellular Recordings ..................... 103A.5 Properties of Ganglion Cells . .................. 104
A.5.1 ON, OFF, and ON/OFF Properties .......... 104A.5.2 Receptive Field Size and Location, Center Surround
Organization ....................... 104A.6 Preservation of Photoreceptors . . . . . . . . . . . . ..... 105A.7 Infra-Red Viewing of Preparation During Recording ..... 105A.8 Consistency of Method . . . . . . . . . . . . . . . . ... 105A.9 Stability and Longevity of Method . .............. 106A.10 Summary .. . . . . . . . . . . .. .. . . . . . . 106
B Whole-Cell Patch Recordings in Isolated Intact Turtle Retinall3B.1 Recording Method ........................ 113
B.1.1 Electrodes and Electrode Solutions . . . . . . . . . . . 114B.1.2 Electrode Manipulation . . . . . . . . . . . . . .... 114B.1.3 Electrode Solution Bleeding ............... 116
6
B.1.4 Making the Seal ................. ... 116B.1.5 On-Cell Patch Recordings Prior to Whole-Cell Access 117B.1.6 Getting Whole-Cell Access . . . . . . . . . . .... 117B.1.7 Importance of Visualization of Tissue During Recording117
B.2 Whole-Cell Patch Recordings Show Both Light and Current-Evoked Spikes, Long Time Constants, and High Input Resis-tances ................... 1............ 121
B.3 Reduction of IPSPS Over Time With ATP-Less Whole-CellPatch Electrode Solution . . . . . . . . . . . . . . . . .. . . . 122B.3.1 Antagonistic Center/Surround is Maintained Despite
Local Reduction of IPSPS ................ 122B.4 Measurement of Passive Parameters with Whole-Cell Patch
Recordings ............................ 122B.4.1 Estimates of RI, and r0 ................. 130B.4.2 Effect of Non-Linear Membrane on RI, and ro ... . 132B.4.3 Effect of Electrode Seal on RI, and ro ........ . 132B.4.4 Estimation of Eret ...... .......... .. 132B.4.5 Correlations Between Passive Parameters .... . 132
B.5 Staining of Recorded Cells . . . . . . . . . . . . . . . . . 133
C The SURF-HIPPO Neuron SimulatorC.1 Introduction. ...................
' N.2 'Nunerical Methocd ................C.3 Channel Models ..................C.4 System Versions .................C.5 SURF-HIPPO Basics ...............C.6 Representation of Circuit Structure .......
136.... . . . . 136... . . . . . 137
........ 137........ 137
.... . . . . 137.... . . . . 138
7
List of Figures
2.1 Marchiafava protocol (Figure 8 from Marchiafava, 1979) . . .2.2 Simulations of Marchiafava protocol ..............2.3 Maintenance of directional selectivity in turtle retina under
picrotoxin . . . . . . . . . . . . . . . . . . . . . . . . . . .2.4 Reversal of directional selectivity in turtle retina under picro-
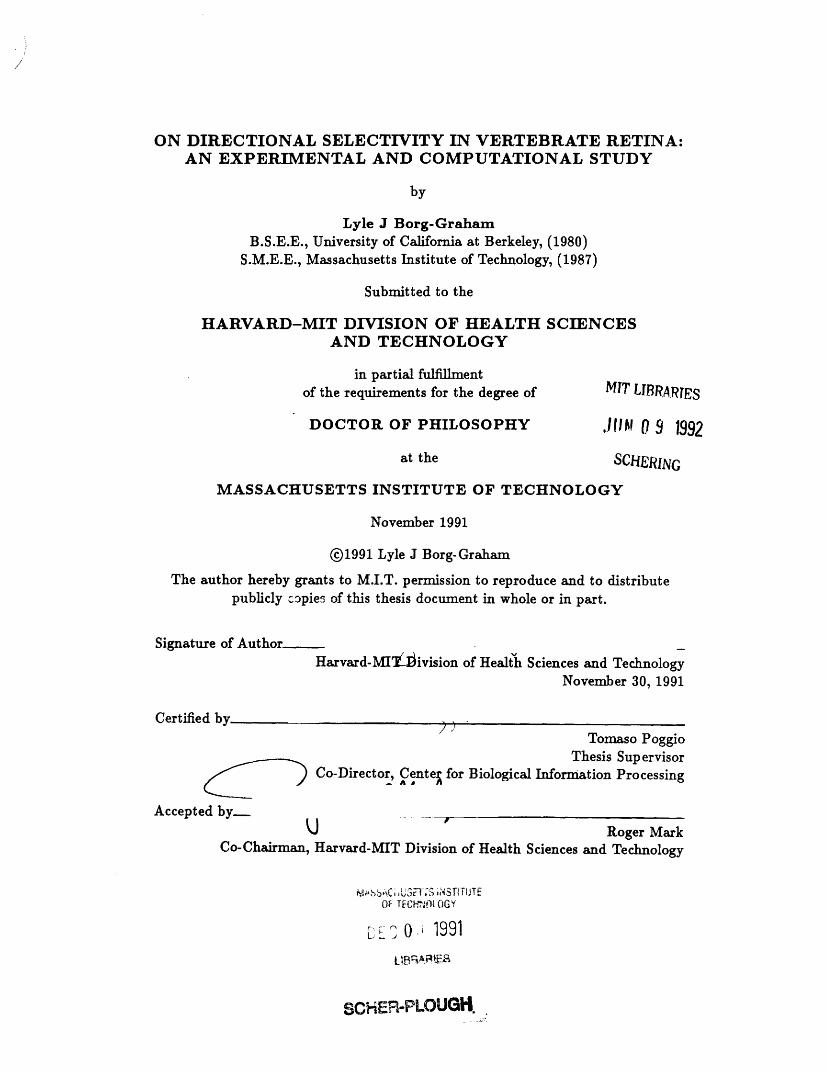
toxin .2.5 Correlation models for directional selectivity ..........2.6 Preferred direction inhibition predicted by ganglionic correl-
lation models for directional selectivity .............
3.1 Inactivating and adaptive mechanisms in neural pathways . .3.2 Generation of local DS within symmetric antagonistic cen-
ter/s3.3 Protocol3.4 Protocol3.5 Protocol3.6 Protocol
· - -ptive fields .A47WF3: Results .A47WF3: Results .A47WF15: Results.A47WF15: Results.
Protocol A56WF2:Protocol A56WF4:Protocol A56WF4:Protocol A56WF6:Protocol A56WF6:Protocols A56RF1Protocol A81WF6:Protocol A84WF2:Protocol A84WF3:Protocol A84WF5:Protocol A84WF5:
ResultsResultsResultsResultsResults
and A56RF2: ResultsResults . . . . . . .Results.Results . . . . . . .Results . . . . . . .Results . . . . . . .
w/DS ........
2425
26
2728
29
33
33414243444546474849505152535455
8
3.73.83.93.103.113.123.133.143.153.163.17
. . . . .
3.18 Shift in stimulus center causes shift in Op because on antag-onistic center/surround for cell A84 .............. 56
3.19 Protocol A105WF3: Results ................... 573.20 Protocols A105PN2-4 ...................... 583.21 Protocol A105RF2: Results w/DS ............... 593.22 Protocol A115WF4: Results ................... 603.23 Protocol A115PN1-3: Results .................. 613.24 Protocol A115WF5: Results ................... 623.25 Protocols A115PN4-8: Results ................. 633.26 Protocol A115RF1: Results w/DS . . . . . . . . . . . . . . . 64
4.1 Directionally selective dendritic cable model .......... 664.2 Relationship between directionally selective amacrine cell out-
puts and ganglion cell (preferred direction stimulus) ..... 674.3 Relationship between directionally selective amacrine cell out-
puts and ganglion cell (null direction stimulus ......... 684.4 Cable equivalent circuit and on-the-path shunting inhibition . 724.5 Morphology of simulated rabbit starburst amacrine cell . . . 784.6 Simulated somatic and distal tip motion responses of star-
burst amacrine cell ........................ 824.7 Directional tuning of distal tips of starburst amacrine cell in
response to motion stimuli ................... .. 834.8 Morphology of simulat . simnple amacrine cell ......... 844.9 Simulated tip response of simple cell model to motion stimuli,
and dependence on inhibition and membrane capacitance . 854.10 Simulated tip response of simple cell model to motion stimuli,
and non-linear output processing showing reversal of directionselectivity when inhibition is absent .............. 86
4.11 Directional selectivity index of simple cell model tip output:Dependence on model parameters ................ 87
4.12 Directional selectivity index of simple cell model tip outputafter sigmoidal non-linearity: Dependence on model parameters 88
4.13 Geometry of apparent motion simulations of starburst amacrinecell ................................. 89
4.14 Simulation of apparent motion stimuli onto starburst amacrinecell showing null direction inhibition and preferred directionfacilitation ............................. 90
9
5.1 Predicted anatomical relationship of amacrine cells with DSoutputs and DS ganglion cell . ....... ........... 93
5.2 Development of anatomical relationship of amacrine cells withDS outputs and DS ganglion cell by Hebbian reinforcementof initial directional bias. .................... 97
5.3 Directionally selective dendrite filters fed by fiber bus .... 98
A.1 Holder for filter paper retina carrier .............. 107A.2 Procedure for the dissection of intact isolated turtle retina . 108A.3 Setup of apparatus for recordings from intact isolated turtle
retina ................... 1............ 109A.4 Distribution of receptive field sizes from extracellular record-
ings of turtle retina ganglion cells ................ 110A.5 Scanning electron micrographs of intact photoreceptors from
isolated intact turtle retina . . . . . . . . . . . . . . ..... 111A.6 Infra-red image of intact isolated turtle retina taken during
experiment ............................ 112
B.1 Photomicrograph of whole-cell patch electrode ........ 115B.2 Transition between on-cell patch and whole-cell patch show-
ing on-cell and whole-cell light-evoked spike response anddrop of Eeet . . . . . . . . . . . . . . . . . . . . . . . . . . . 118
B.3 Transition between on-cell patch ana whole-cell patch show-ing drop of RI, and Eet ................... . 119
B.4 Infra-red image of intact isolated turtle retina: High resolu-tion showing cell bodies and whole-cell electrode tip ..... 120
B.5 Light and current-evoked spike response from whole-cell patchrecordings ....... .................... 121
B.6 Attenuation of IPSPs with time for cell A29 .......... 123B.7 Light-evoked IPSPs to large spots at start of whole-cell access
for cell A84 ............................ 124B.8 Attenuation of light-evoked IPSPs for cell A84 after 1 hour
of whole-cell recording ...................... 125B.9 Depolarization of cell A84 after 1 hour of whole-cell access
fails to mmask light-evoked IPSPs ............... 126B.10 Light-evoked IPSPs at start of whole-cell access for cell A100 127B.11 Attenuation of light-evoked IPSPs and drop in E,,,t after 31
minutes of whole-cell access for cell A100 ........... 128
10
B.12 Depolarization of cell A100 fails to unmask light-evoked IP-SPs after 31 minutes of whole-cell access ............ 129
B.13 Current clamp step response of cell A54 and fitted single ex-ponential (ro0 = 54 ms) ...................... 130
B.14 Distribution of RI, for series of 59 cells measured with whole-cell patch technique ....................... 131
B.15 Distribution of r0 for series of 59 cells measured with whole-cell patch technique .....- ................. 131
B.16 Distribution of E,.,t for series of 59 cells measured with whole-cell patch technique ........... .......... . 134
B.17 Scatter plot of RI, and r0 ................... . 134B.18 Scatter plot of RIn and Ee,,t .................. 135B.19 Scatter plot of r 0 and E,,,t ................... 135
C.1 SURF-HIPPO screen ....................... 140C.2 Near-radial view of simulated star amacrine cell ........ 140C.3 The Dynamic Neuron Builder .................. 141
11
Chapter 1
Introduction
In this Thesis we investigate the generation of directionally selective re-sponses in the vertebrate retina (Chapter 2). Our perspective will be bothexperimental and theoretical. We shall use the turtle retina (and to a lesserdegree, rabbit retina) as a model system for both vertebrate retinal process-ing in particular and neural computation in general. The major results areas follows:
On the experimental side (Chapter 3), we shall show that at least somedirectionally selective ganglion cells in the turtle retina receive directionallyselective excitatory input ([13]). This interpretation is supported v bothvoltage clamp recordings at holding potentials near inhibitory synaptic re-versal potentials, and evidence that inhibitory input onto recorded cells isattenuated under our recording conditions. An important implication of thisfinding is a constraint placing the location for the computational elementsnecessary for direction selectivity onto cells presynaptic to ganglion cells.
On the theoretical side (Chapter 4), we shall present a model for the pre-ganglionic computation of direction selectivity in vertebrate retina ([12]).This model is consistent with known properties of the retina and the afore-mentioned results, and requires reasonable assumptions/constraints on whatis not known. Computer simulations of biophysically and morphometriclydetailed models of amacrine cells demonstrate the performance of the model,and suggest that the model is robust for realistic variations in model param-eters.
This model is based on the sequence-dependent output of a dendriticcable resulting from non-linear interactions between the cable's excitatoryand inhibitory synaptic inputs. We suggest that the biophysical substrate
12
for this model might be found in extra-retinal systems (Chapter 5), andwe discuss the possibility of such computations (non-linear spatial-temporalinput filtering) in other contexts. We also discuss advantages that thisparticular model has for solving the developmental problem of the breakingof symmetry, and what this model suggests about ganglion cell function ingeneral.
Finally, this project included the development of two new experimentalprotocols - isolation and recording from intact turtle retina ([11]), and wholecell patch recording from intact turtle retina([13]). These techniques are dis-cussed in Appendix A and B. This project also included the development ofa circuit simulator program, SURF-HIPPO, that facilitated our theoreticalinvestigations. SURF-HIPPO is discussed in Appendix C.
13
Chapter 2
Directional Selectivity in theVisual System
2.1 A Definition of Directional Selectivity
What is directional selectivity (DS) in the visual system? In this thesis thedefinition is: The response of some visual pathway to a moving stimulus isDS when some linear measurement taken over the entire response (e.g. theintegral) is significantly asymmetric with respect to stimulus direction. Anex;aiple, and perhaps the classics. definition, would be that a cell is DS ifit consistently fires more spikes for a specific (preferred) stimulus trajectoryas compared to the (null) stimulus trajectory that differs only in sign.1 Onthe other hand, for a non-spiking cell, an EPSP with a significantly largerarea for a specific motion direction is defined as DS. A common thread forour definition is that a DS system requires the breaking of symmetry overthe receptive field of that system.
Behaviorly, of course, the most important DS signals are carried by spikes(we leave aside the possibility of subthreshold signaling within a subsystem,e.g. an intra-retinal DS channel). Certainly the motivation for studyingDS starts with spike-based systems, but in this Thesis we are ultimatelyinterested in dissecting the mechanisms underlying a specific computation.Strictly speaking, this may be done independent of considering the function-ality of the specific computation. In the case of retinal DS, this means thatall DS somatic ganglion cell responses are relevant, since it is straightforward
'Preferred or null may refer to either the stimulus or the system/cell response, asappropriate.
14
to apply known mechanisms to, for example, DS EPSPs to yield the classi-cal signals. Thus in this Thesis we may consider motion asymmetries whichmay either account directly for the classical DS responses, or, in principle,be used by the brain for directional information.
2.1.1 Directional Selectivity versus Difference
In fact, for our analysis of DS we will also consider a broader directionaldifference (DD) response distinction, one which also requires a fundamentalasymmetry: a system or cell output is DD if there is any consistent pre-ferred/null (P/N) difference that is independent of any relative time shiftof the two waveforms. For example, P/N output waveforms with equivalentaverages but different shapes or amplitudes would constitute a DD, but notDS, response. As described by Poggio and Reichardt ([55]), DS responsesalso require a nonlinearity in the circuit.
2.1.2 Consistency of Directional Properties Over the Recep-tive Field
In either case, in this Thesis consistency means that a single P/N axis isdominant over the entire receptive field of the cell. This constraint is mo-tivated by both the classical work on DS (e.g. [8]), and by the notion ofbreaking of rnmmetry mentioned earlier. Recntly, center/surround DS an-tagonistic receptive fields have been reported in turtle retina ([22]), but inprinciple these cells would be considered DS since they still break symme-try. As a counter-example, a cell with a classical excitatory center/inhibitorysurround may give a centrifugal "DS" response for movement across the re-ceptive field edge (see Section 3.1). However, since the observed P/N axisrotates as a function of stimulus location, the cell would not be classified aseither DS or DD.
2.1.3 Directionally Selective Responses Emerge at DifferentLevels for Different Species
Directionally selective visual responses emerge at different levels of the visualpathway in different species - in general, complicated receptive fields tendto appear at higher levels with higher species. For example, directionallyselective responses are common in turtle optic nerve fibers (ranging between20% to 40% [27], [20]), whereas in primate, similar responses appear in
15
relative abundance first in V1 (however, a small percentage of primate retinaDS responses have been reported [57] [21]).
2.1.4 Structure of, and Directional Response in the Retina
The "sensory membrane of the eyeball" is a good candidate for study givenits physically peripheral location and its physiologically central status ([24]).The vertebrate retina is organized in several layers of cell bodies and theirinteracting processes. Signal flow is both direct (perpendicular to the image)and lateral (parallel to the image) at all levels. Light is transduced at thephotoreceptor layer, which outputs to bipolar and horizontal cells withinthe outer plexiform layer. Bipolar cell output impinges on the mesh ofamacrine and ganglion cell dendrites within the inner plexiform layer (IPL).Finally, ganglion cell axons form the optic nerve. Each major cell type inthe retina has several subtypes, classified either anatomically (e.g. accordingto dendritic tree shape), neurochemically (e.g. cholinergic, GABAergic), orphysiologically (e.g. ON/OFF, DS, red/green opponent).
In turtle, motion dependent responses have been reported at all retinallayers [23]. The focus of this Thesis is to analyze the circuitry responsiblefor DS responses at the output layer - the ganglion cells - of the vertebrateretina, using turtle retina as an experimental model and turtle and rabbitretina as the primary basis for a theoretical circuit model.
2.2 Theoretical Requirements for Directional Se-lectivity and Difference
Motion detection is a computation on spatially separated inputs over time.Detection of motion direction (DD) requires a spatial asymmetry in the cir-cuit. Finally, as mentioned earlier, a non-linearity is necessary to transforma DD signal to DS. Note that it is also possible to have a DS system in whichthere is no DD signal.
It is useful at this point to define two broad classes of retinal DS mod-els: ganglionic models, where the crucial nonlinear interaction occurs in theganglion cell, and pre-ganglionic models, where the interaction occurs priorto the ganglion cell (see review in [39]; in this paper post-synaptic meansganglionic, and pre-synaptic means pre-ganglionic).
Thus, the specific questions we are trying to answer here are:
* What is the anatomy and connectivity of the DS pathway?
16
* What is the crucial nonlinearity of the DS pathway?
* Where on the DS pathway is the nonlinearity, e.g. is it pre-ganglionicor ganglionic?
The experimental portion of this Thesis deals with the last point mostdirectly, while the first two points are more pertinent to the theoreticalportion.
2.3 Experimental Work on Retinal DirectionalSelectivity
Over the past thirty years there has been a large body of work investigatingretinal DS with a variety of preparations. DS retinal output was first de-scribed in amphibian (frog, Maturana, Lettvin, McCulloch, and Pitts [50])and eventually characterized in insect (fly, e.g. Hausen [34]), reptile (turtle,e.g. Lipetz and Hill [44]), bird (pigeon, Maturana [49]), and mammal (e.g.rabbit, Barlow and Hill [7]). We shall now overview some of the key findingsin rabbit and turtle that are pertinent to this Thesis.
2.3.1 Extracellular Electrophysiology
Ti'L. classical extracellular rabbit experiments of Barlow and Leviek ([8])described several phenomena related to the DS response. Using both movingslits and apparent motion 2 protocols they showed:
* DS subunits: Small non-overlapping stimulus regions within the slit-mapped receptive field which were DS consistent with the response tofull field stimuli.
* Inhibitory Mechanisms: Stimulus at a given point in the receptive fieldinhibited later responses to stimuli in the null direction.
The first finding suggested that the DS circuit elements for a given gan-glion cell were replicated many times for that cell. Historically, the mostexplored interpretation of the second finding was that the DS computationrelied on an asymmetric inhibitory pathway. However, these data cannot
2 Apparent motion stimuli are sequences of flashed spots in adjacent locations, similarto the lights in a movie marquee.
17
rule out a model in which excitation is asymmetric and inhibition is sym-metric (e.g. from an antagonistic center/surround). Such a possibility issupported by the following finding.
Apparent asymmetric inhibition was not the only phenomena observedin DS; Barlow and Levick ([8]) also showed (and later Grzywacz and Amthor[30]):
· Facilitatory Mechanisms: A stimulus at a given point in the receptivefield facilitates later responses to stimuli in the preferred direction.
Note that null direction inhibition and preferred direction facilitationmay be accounted for by an asymmetry in either an excitatory (more pre-cisely, facilitatory) and/or an inhibitory pathway.
Additional spatial and temporal parameters for the DS network may beinferred by the velocity tuning and size of DS receptive fields (e.g. Wyattand Daw [69]; Grzywacz and Amthor [30]; Granda and Fulbrook [28]). Forinstance, the minimum length (measured on the retinal surface) of the lateralpath in the DS circuit, near the visual streak, is 100 to 300 pm, as derivedfrom apparent motion protocols.
Sequence-dependent responses may be resolved for very short separa-tions, less than 10 pim (Amthor and Grzywacz, unpublished data). Thisshort distance places a constraint vis-a-vis the electrotonic properties of the
-IS pathway: passive cable properties, specifically electrotonic length con-stants of hundreds of microns, are not well-suited for such fine distancediscrimination. Thus, this result suggests that non-linearities in the pathare important.
The velocity of effective DS stimuli ranges from approximately 0.01 to10 pm/ms (0.1 to 1000°/s in the visual field). These results add constraintson the synaptic kinetics in the DS circuit.
2.3.2 Intracellular Electrophysiology
As mentioned earlier, motion dependent responses have been recorded fromall cell types in turtle retina ([23]). These recordings suggest that the crucialelements for DS are found throughout the retina, but two important caveatsmust be kept in mind. First, the existence of somatic DS signals prior to theganglion cell layer does not provide, by itself, evidence that these signals arerelevant to DS ganglion cell properties. Second, and most important, whatconstititutes a "true" DS response is open to interpretation, as we discussedearlier in this chapter (see also Section 3.1)
18
N
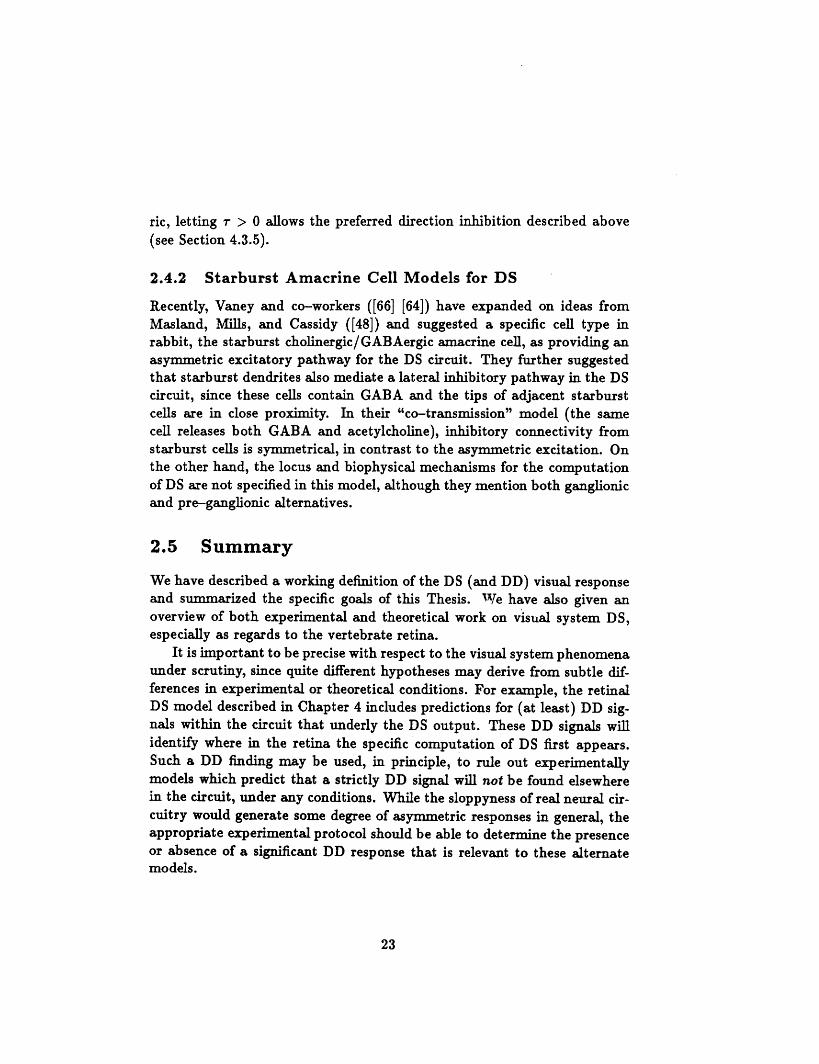
The classical paper of Marchiafava [47] explored ganglion cell inputsynapses in turtle, for example by examining the effects of injected currenton DS responses (Figure 2.1). This paper analyzed the synaptic mecha-nisms underlying antagonistic center/surround responses, and the possiblerelevance of these mechanisms to directional selectivity. He concluded that:
* Inhibitory inputs to the ganglion cell with reversal potential close tothe resting potential contributed to the antagonism between stationarystimuli in the center and annulus of the receptive field.
* Moving spots activated inhibitory inputs with kinetics and reversalpotential similar to those activated by stationary large spots.
* The difference in kinetics between inhibitory and excitatory inputs issufficient for the reduced null direction response being accounted forby a correlation between inhibition and excitation.
In concordance with this last point, Marchiafava suggested that evidenceof motion-evoked inhibition meant that some part of the inhibitory inputdid not require diffuse stimulation, as might be inferred by the stationarycenter/surround properties. Presumably, this interpretation was based onthe assumption that the motion-evoked inhibition seen for the relatively longstimulus trajectory shown in the paper (991 Mm, Figure 8) was present for- tiyely ' -t trajectories, although this was not explicitly ': mJnstrated.However, the ganglion cell motion responses shown in this paper may alsobe accounted for by a DS excitatory input that is concurrent with a non-DSinhibitory input. A simulation of such a mechanism that reproduces thesalient features of Figure 8 in [47] is shown in Figure 2.2.
The experiments of Watanabe and Murakami in frog retina ([67]) alsolooked at the effect of intracellular current injection on DS ganglion cellresponses. They showed:
*Motion stimuli-evoked IPSP's in ON/OFF, but not ON nor OFF DSganglion cells, both with no injected current, and with depolarizingcurrent.
They concluded that a directionally-dependent interaction between ex-citation and inhibition at the ganglion cell could account for the DS inON/OFF cells, but that "The neural mechanism responsible for the differ-ence in EPSP amplitude in ON- and OFF-type cells probably lies presynap-tic to the ganglion cells."
19
2.3.3 Neurochemistry
The neurotransmitters involved in the DS circuit has been investigated bypharmacological protocols in rabbit (Caldwell, Daw and Wyatt [18], Arieland Daw [6]) and in turtle (Ariel and Adolph [5]). From this work we canconclude the following:
* Inhibitory Mechanisms: Blockage of GABAergic pathways reduces oreliminates DS.
As before, this result would seem to support the class of DS models inwhich inhibition is asymmetric. But as we shall see in Chapter 4, this datais also consistent with models in which the inhibitory pathway is symmet-ric. Also, recent results (Smith, Grzywacz, and Borg-Graham ([59]) withGABAergic antagonists in turtle show:
· Inhibitory Mechanisms: For about 50% of all DS cells, DS is main-tained or reversed when GABAergic pathways are blocked.
These experiments are demonstrated in Figures 2.3 and 2.4. This resultis similar to that reported previously in fly (Bilthoff and Bilthoff, [16]). Aswe discuss later, existence of DS without inhibition places strong constraintson the DS circuit model.
2.3.4 Anatomy
Physiologically identified DS ganglion cells have been stained in rabbit (Amthor,Oyster, and Takahashi [4]) and turtle (Jensen and DeVoe [38]). A clear re-sult of this work is that:
* DS Morphology: The dendritic trees of DS ganglion cells are notaligned with their P/N axes.
Thus the morphometric substrate for DS is not immediately obviousfrom the histology.
2.4 Theoretical Work on Retinal Directional Se-lectivity
Inspired in part by the correlation models of Hassenstein and Reichardt([33]) for motion detection in fly, several models for retinal DS have been
20
proposed which describe the location and biophysical mechanisms for thenecessary (Section 2.2) spatial asymmetry and time-dependent nonlinearinteraction (Figure 2.5).
Barlow and Levick ([8]) considered both asymmetric lateral inhibitoryand excitatory pathways in the outer plexiform layer, with a nonlinear inter-action at bipolar cells between these pathways and direct excitatory path-ways. Others, including Torre and Poggio ([63]) and Koch, Poggio and Torre([39]), suggested that the lateral pathway might be mediated by amacrinecells, among other possibilities. They showed that the interaction betweenan asymmetric lateral synaptic inhibition and symmetric synaptic excita-tion, possibly on the ganglion cell membrane itself, could provide the nec-essary nonlinearity for DS. In particular, Torre and Poggio showed how theshunting action of inhibitory synaptic conductances interacts non-linearlywith other inputs. These models do not explicitly define the mechanism ofthe delay, other than to point out that a mechanism which has a low-passfilter characteristic (as had been suggested in fly DS literature), or slowerinhibitory synaptic kinetics, might suffice.
We note that in these circuit architectures the only directional signalavailable is strictly DS, under any circumstances. This is because the in-teraction between the asymmetric and symmetric pathways is immediatelynonlinear. If the nonlinearity is blocked (e.g. blocking inhibition for theinhibitory model), then no ,nteraction can take place: there will be no DDsignal at all. This property is directly relevant to the finding of DS withblocked inhibition that was mentioned in Section 2.3.3.
Koch, Poggio and Torre ([41]) (also O'Donnell, Koch and Poggio [53])examined the electrotonic structure of a cat ganglion cell and a putative DSrabbit ganglion cell ([4]), respectively, in detail. They showed that the den-dritic tree of the ganglion cell was well suited for local interactions within thetree between an excitatory input and an inhibitory input that has a strongshunting component (large conductance change with synaptic reversal po-tential near rest). The conclusion was that the computational substrate forsubunit response was possible within the tree, e.g. supporting a ganglionicmodel.
2.4.1 Implications of Ganglionic Directionally Selective In-teractions
Although not explored in the work cited above, a ganglionic DS model alsopredicts the arrangement of DS subunits with respect to the ganglion cell
21
dendritic tree, and the relative response to preferred direction motion whichtraverses the entire receptive field, given certain constraints. Assuming thatDS interactions occurr at random locations in a radially symmetric ganglioncell dendritic tree, then preferred direction inhibition is predicted, despitethe locality of the interactions (see Figure 2.6). For long distance motion,this arises because the distal tree on the preferred direction side is activatedlast. In order to get to the soma, the excitation from this area must traversedendritic regions in which the locally non-correlated delayed inhibition re-mains activated. This phenomena would be expected to limit the spatialand temporal bandwidth of effective preferred direction stimuli. Likewise,subunits on the preferred side of the receptive field would be expected tohave a smaller preferred response than that from subunits on the null side.
Barlow and Levick ([8]) compared subunit responses to the (stationary)spot-mapped receptive field. If we assume that that the latter mapping iscongruent with the dendritic tree, then their results (Figure 4 in [8]) do notsupport the prediction of preferred direction inhibition. In this figure, forexample, the preferred direction response for subunits d - e, i - j, andn o (all on the preferred side) are similar to that for a - b, f - g,and k -+ I (all on the null side), respectively. On the other hand, therewas a significant null direction response within the three null side subunits(anomalous response, see Section 4.3.4). Further work will be necessary todetermine whether these observations re significant.
Correlation models also predict velocity tuning as a function of the delayand length of the asymmetric pathway, At and 1, and for ganglionic modelversions there is an inherent tradeoff between bandwidth of null directionmotion and the above preferred direction inhibition. Consider the simpleversion shown in Figure 2.5 (B), where I refers to the spacing between theinhibitory and excitatory pathways. If we assume that the synaptic temporaltransfer functions are given by 6(t), then for a moving spot the only nullstimulus is motion towards the left with velocity:
Vnul = I/At
All other velocities, even towards the left, will pass. To increase the rejectionbandwidth we can add some width r to the inhibition impulse response. Nowthe rejected null direction velocities are in the following range:
l/(At + r) < vnu,, < I/At
However, since the structure in which the interactions takes place is symmet-
22
ric, letting - > 0 allows the preferred direction inhibition described above(see Section 4.3.5).
2.4.2 Starburst Amacrine Cell Models for DS
Recently, Vaney and co-workers ([66] [64]) have expanded on ideas fromMasland, Mills, and Cassidy ([48]) and suggested a specific cell type inrabbit, the starburst cholinergic/GABAergic amacrine cell, as providing anasymmetric excitatory pathway for the DS circuit. They further suggestedthat starburst dendrites also mediate a lateral inhibitory pathway in the DScircuit, since these cells contain GABA and the tips of adjacent starburstcells are in close proximity. In their "co-transmission" model (the samecell releases both GABA and acetylcholine), inhibitory connectivity fromstarburst cells is symmetrical, in contrast to the asymmetric excitation. Onthe other hand, the locus and biophysical mechanisms for the computationof DS are not specified in this model, although they mention both ganglionicand pre-ganglionic alternatives.
2.5 Summary
We have described a working definition of the DS (and DD) visual responseand summarized the specific goals of this Thesis. We have also given anoverview of both experimental and theoretical work on visual system DS,especially as regards to the vertebrate retina.
It is important to be precise with respect to the visual system phenomenaunder scrutiny, since quite different hypotheses may derive from subtle dif-ferences in experimental or theoretical conditions. For example, the retinalDS model described in Chapter 4 includes predictions for (at least) DD sig-nals within the circuit that underly the DS output. These DD signals willidentify where in the retina the specific computation of DS first appears.Such a DD finding may be used, in principle, to rule out experimentallymodels which predict that a strictly DD signal will not be found elsewherein the circuit, under any conditions. While the sloppyness of real neural cir-cuitry would generate some degree of asymmetric responses in general, theappropriate experimental protocol should be able to determine the presenceor absence of a significant DD response that is relevant to these alternatemodels.
23
Ganglion cell photoresponses
1 II
23x10 AI F1.V Al*'%
d
4
- 2.310A
. ~ 1 . . I . I .
0 2 4 6 .8 0 .2 4 6 8sec sac
Fig 3. The effect or intracellular current injection upon the photoresponses to a mosing spot. nitrajectory of the spot (991 urn at 3.5 'msec) was along the prercre-null axis. The responses to move-ment in the preferred and null directions (marked by a star) are shown at the left and the right side offigure, respectively. At the top. the duration and the direction o movement are indicated. ControlIndicates responses recorded at resting potential. Upper and lower reciords show the photoresponsesdunng artifcial polarization of the cell membrane obtained with the current intensity indicated by the
n.,mbers above the records on the left. Zero time coincides with the onset of the spot movement.
Figure 2.1: Protocol by Marchiafava (Figure 8 from [47j) investigating the effect ofcurrent injection on DS responses in turtle retinal ganglion cells. An important featureof this protocol is that for both directions of the stimulus, the hyperpolarizing current issufficient for the synaptic potentials to stay below the resting potential. The small EPS Pfor the null stimulus under hyperpolarization implies that a null-direction correlation ofinhibition and excitation does not underly DS in this cell.
24
20mv
_?o _ i
12D
( -_11 -- *'
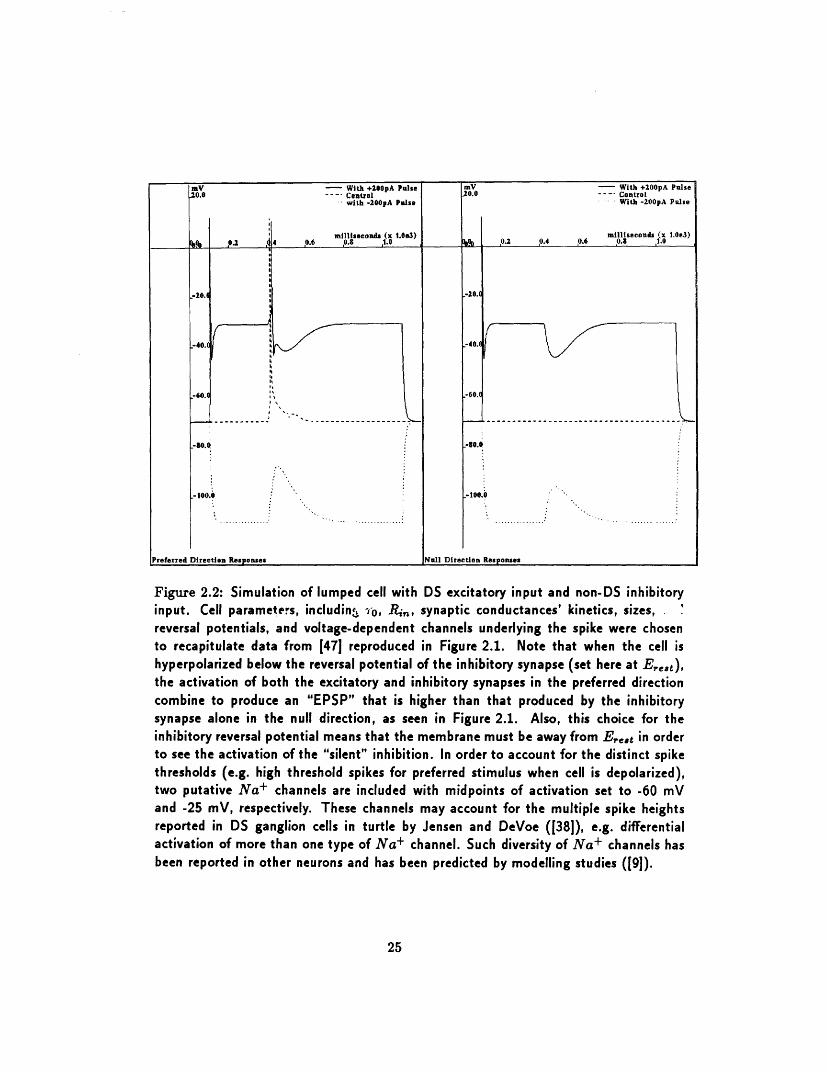
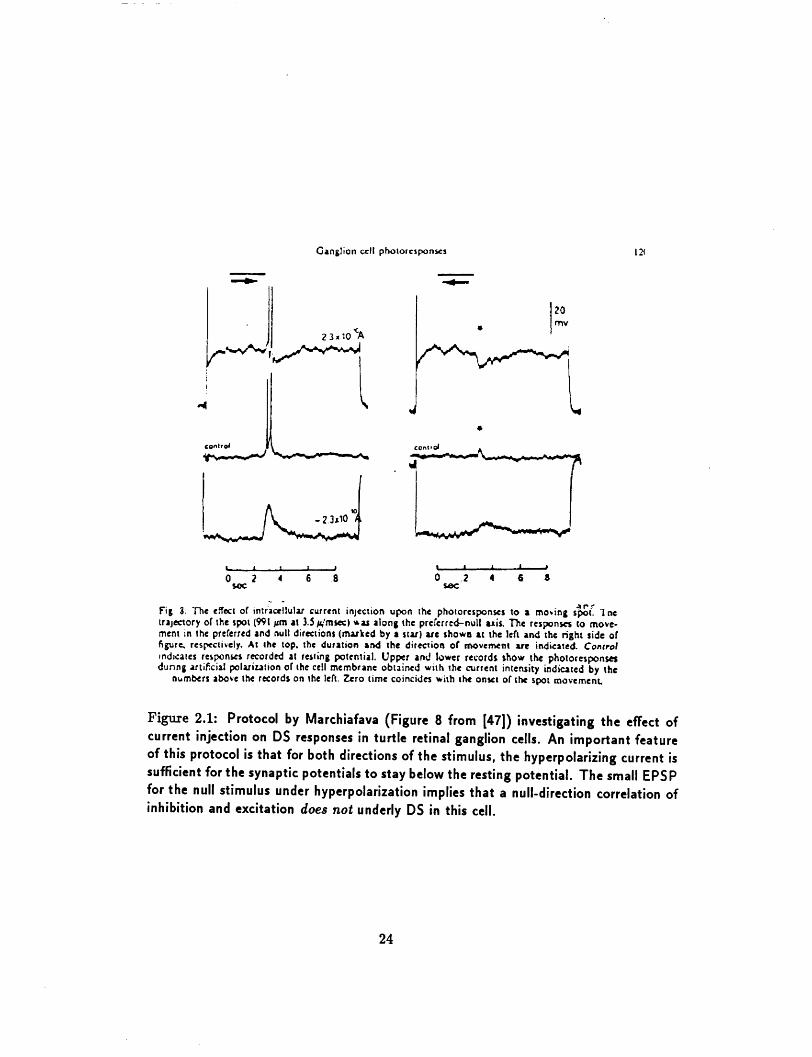
Figure 2.2: Simulation of lumped cell with DS excitatory input and non-DS inhibitoryinput. Cell parameters, including ,bo, R,,, synaptic conductances' kinetics, sizes, 'reversal potentials, and voltage-dependent channels underlying the spike were chosento recapitulate data from [471 reproduced in Figure 2.1. Note that when the cell ishyperpolarized below the reversal potential of the inhibitory synapse (set here at E,,et),the activation of both the excitatory and inhibitory synapses in the preferred directioncombine to produce an "EPSP" that is higher than that produced by the inhibitorysynapse alone in the null direction, as seen in Figure 2.1. Also, this choice for theinhibitory reversal potential means that the membrane must be away from E,et in orderto see the activation of the "silent" inhibition. In order to account for the distinct spikethresholds (e.g. high threshold spikes for preferred stimulus when cell is depolarized),two putative Na+ channels are included with midpoints of activation set to -60 mVand -25 mV, respectively. These channels may account for the multiple spike heightsreported in DS ganglion cells in turtle by Jensen and DeVoe ([381), e.g. differentialactivation of more than one type of Na+ channel. Such diversity of Na+ channels hasbeen reported in other neurons and has been predicted by modelling studies ([91).
25
mV - With +OOpA Pulse mV With +2OOpA PulseL0.0 ....- Control 20.0 ---- Control
with -200pA Pulse- -With -200pA Pulse
milliseconds (x 1.063) millIrconds (x 1.0e3)%%b ~s1 4 , .6 p.8 1.0 , __ 0.2 0.4 ,0.6 O.S 1.0
·ZO.C -20.(
-40. .40,
-60. 60.
-10. -0.0
-100.0 ·', D e-100.0 o'
P referred Diretion Responses Null Direction Responses
Response(Spikes/s)
40
,an.
DS Maintenance
20
10-
contrast--- Picrotoxin
Control* Preferred
.Null
Figure 2.3: Smith et. al. ([59]) tested the sensitivity of DS to picrotoxin (a GABAergicantagonist) in isolated intact turtle retina, using the extracellular preparation describedin Appendix A. In some cells DS was maintained despite saturating levels of picro-toxin in the superfusate (50 to 200 M), as demonstrated in the example cell above.Motion stimulus: 200im X 600pm bar at various angles, speed ranging from 1 to5 um/rms, centered on the spot-mapped receptive field. In this figure, contrast is de-fined as (f - b)/b, where f is the foreground light intensity, and b is the backgroundlight intensity.
26
Response(Spikes/s)
20
I C.
10
5
n'
DS Reversal
T I, T
2
Contrast --- PicrotoxinControl
A PreferredNull
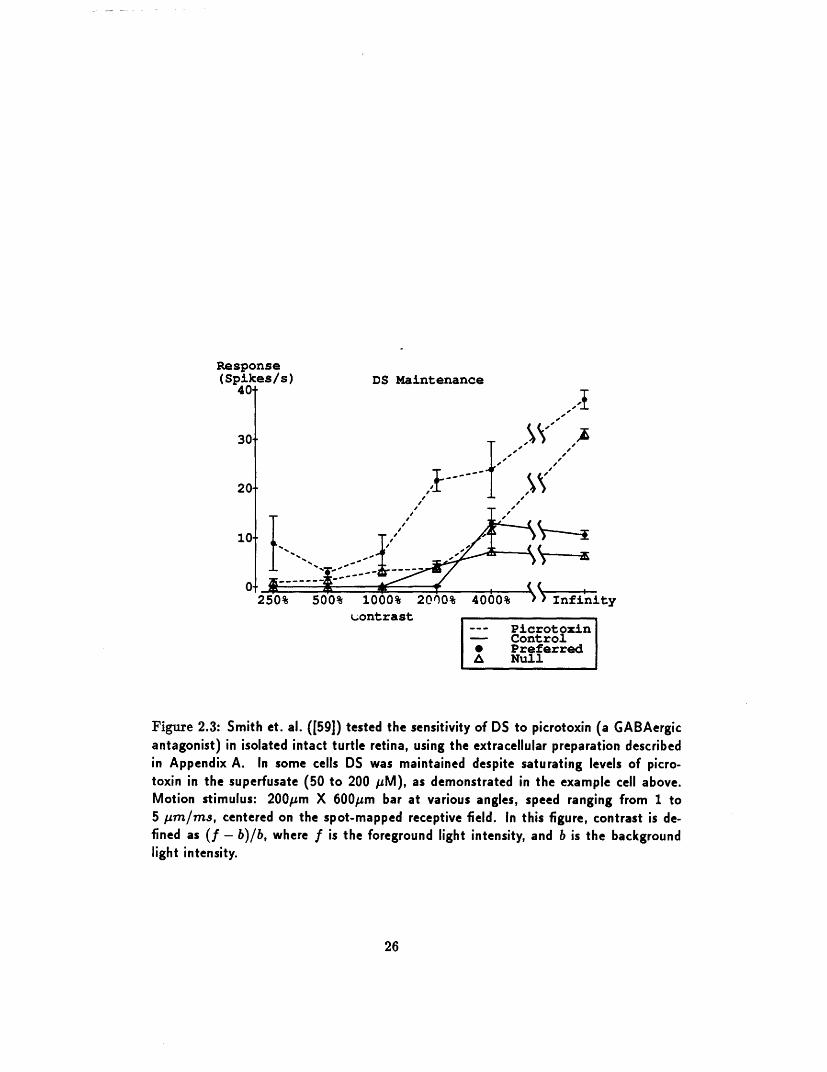
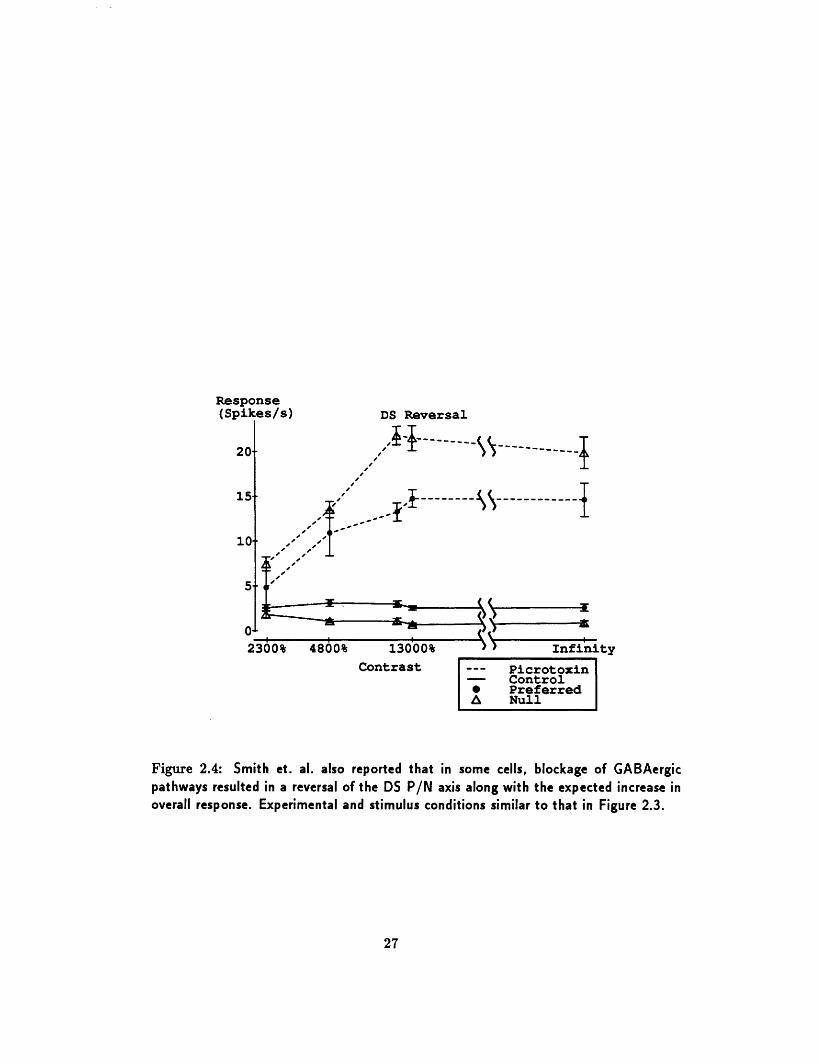
Figure 2.4: Smith et. al. also reported that in some cells, blockage of GABAergicpathways resulted in a reversal of the DS P/N axis along with the expected increase inoverall response. Experimental and stimulus conditions similar to that in Figure 2.3.
27
------- I
(A) (B)
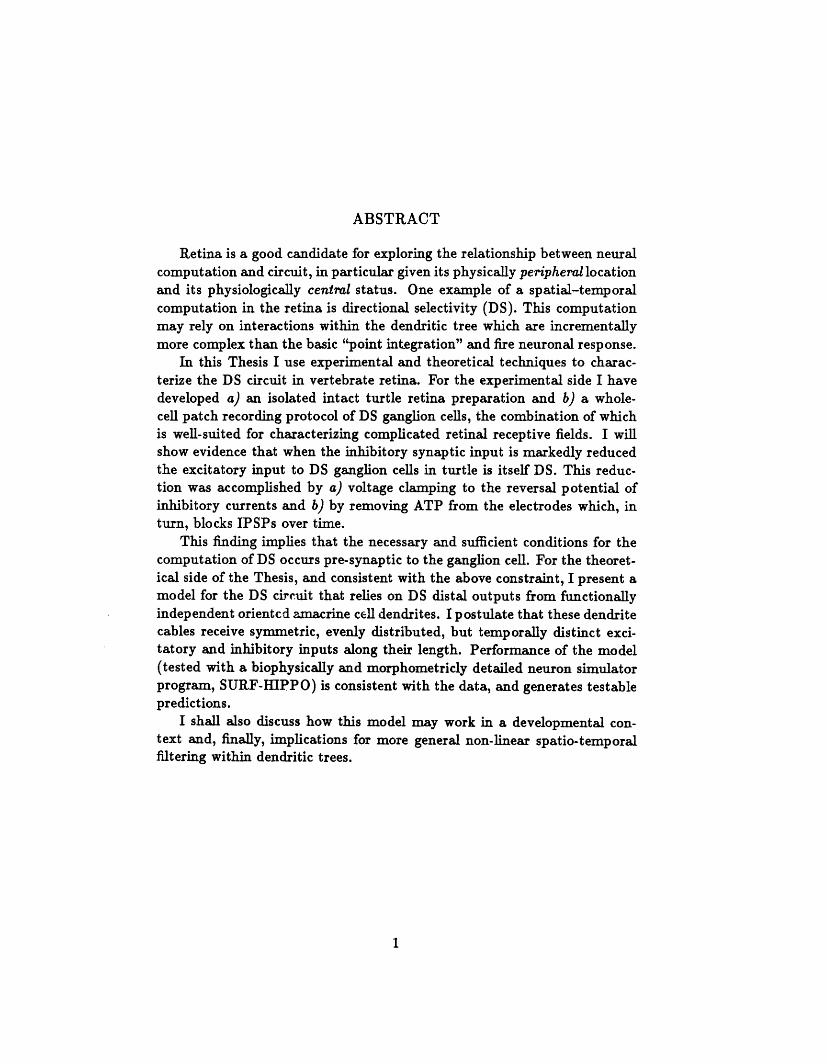
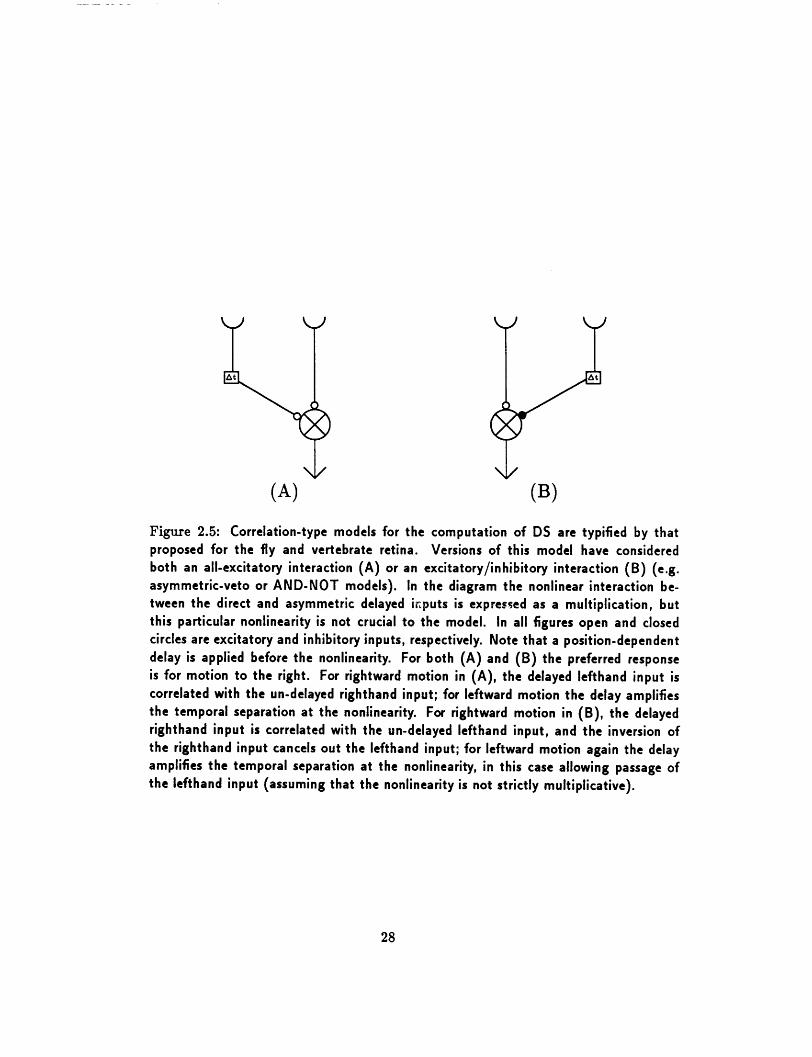
Figure 2.5: Correlation-type models for the computation of DS are typified by thatproposed for the fly and vertebrate retina. Versions of this model have consideredboth an all-excitatory interaction (A) or an excitatory/inhibitory interaction (B) (e.g.asymmetric-veto or AND-NOT models). In the diagram the nonlinear interaction be-tween the direct and asymmetric delayed inputs is expressed as a multiplication, butthis particular nonlinearity is not crucial to the model. In all figures open and closedcircles are excitatory and inhibitory inputs, respectively. Note that a position-dependentdelay is applied before the nonlinearity. For both (A) and (B) the preferred responseis for motion to the right. For rightward motion in (A), the delayed lefthand input iscorrelated with the un-delayed righthand input; for leftward motion the delay amplifiesthe temporal separation at the nonlinearity. For rightward motion in (B), the delayedrighthand input is correlated with the un-delayed lefthand input, and the inversion ofthe righthand input cancels out the lefthand input; for leftward motion again the delayamplifies the temporal separation at the nonlinearity, in this case allowing passage ofthe lefthand input (assuming that the nonlinearity is not strictly multiplicative).
28
Excitatory Conductance
. . Inhibitory Conductance
/J ~-_ -/~ (Local) Uncorrelated Excitation and
/._.. .. - ... ........
On-the-path Inhibition at CBlock Excitation From D
Time
Preferred Direction Stimulus
! t - - - - - -
ABanglion Cell
DS Ganglion Cell- - - Flow of Excitation
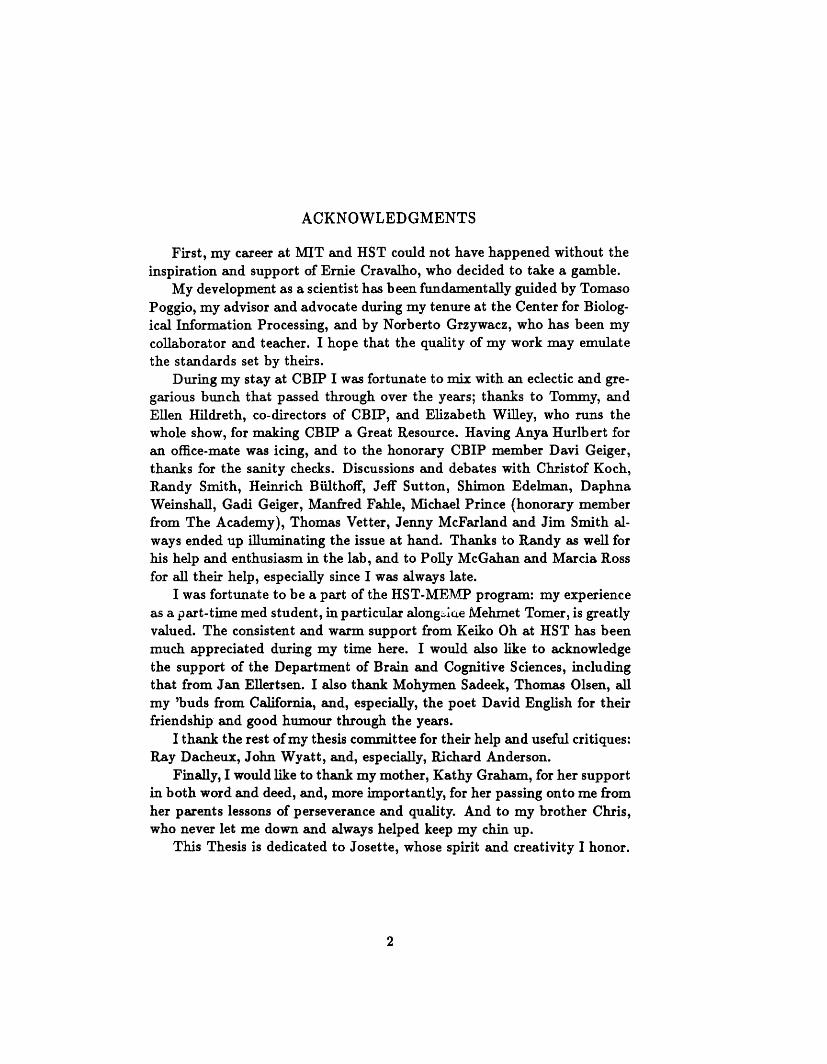
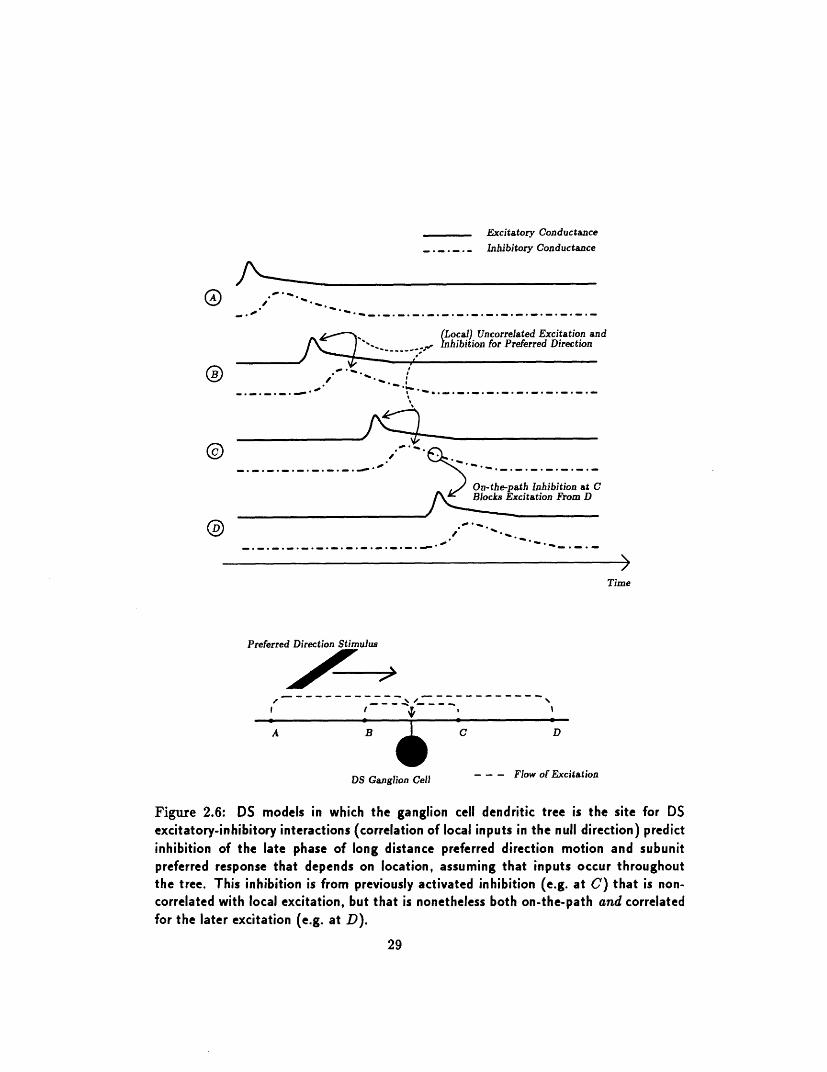
Figure 2.6: DS models in which the ganglion cell dendritic tree is the site for DSexcitatory-inhibitory interactions (correlation of local inputs in the null direction) predictinhibition of the late phase of long distance preferred direction motion and subunitpreferred response that depends on location, assuming that inputs occur throughoutthe tree. This inhibition is from previously activated inhibition (e.g. at C) that is non-correlated with local excitation, but that is nonetheless both on-the-path and correlatedfor the later excitation (e.g. at D).
29
®
0
@
C D
Chapter 3
Directionally SelectiveGanglion Cells in Turtle:Experimental Results
We shall now present data from whole-cell patch (intracellular) recordingsof ganglion cells in turtle retina. As we saw in the last chapter, variousmodels for retinal directional selectivity have different predictions as to theproperties. of synaptic input onto directionally selective ganglion cells. Therecordings presented here show that some ganglion cells receive DS excita-tory input: therefore the necessary elements for the DS computation mustoccur in cells pre-synaptic to the ganglion cell.
Further, we present on-cell patch' (extracellular) and subsequent whole-cell patch recordings from the same cells in which extracellularly-determinedDS properties are consistent with DS properties of the excitatory input.These recordings suggest that the whole-cell patch protocol does not intro-duce artifactual DS properties. Details on the tissue preparation, stimulusgeneration, and experiment control apparatus are described in Appendix A.Details of the whole-cell patch technique, and basic properties of cells recordedwith this technique, are described in Appendix B.
On-cell patch recordings are made with a patch electrode in a tight seal configurationonto the cell, with the cell membrane intact.
30
3.1 Stimuli for Characterizing Directional Selec-tivity
A variety of light stimuli with different motion components may be usedto explore directional properties. Depending on the spatial and temporalproperties of the stimulus, each type emphasizes different aspects of motionsensitivities.
3.1.1 Gratings Versus Bars, Temporal and Spatial Window-ing
As mentioned in the last chapter, previous work investigating directional vi-sual responses have used both aperiodic stimuli (e.g. moving bars or spots,apparent motion protocols) and quasi-periodic stimuli (e.g. spatially andtemporally windowed gratings). Both classes of stimuli have strong (direc-tional) motion components. Aperiodic stimuli, however, emphasize the tran-sient (in time) and wide (in space) components of the DS circuit's transferfunction, while the quasi-periodic stimuli tend to emphasize the steady-stateand narrow (in space) components.2
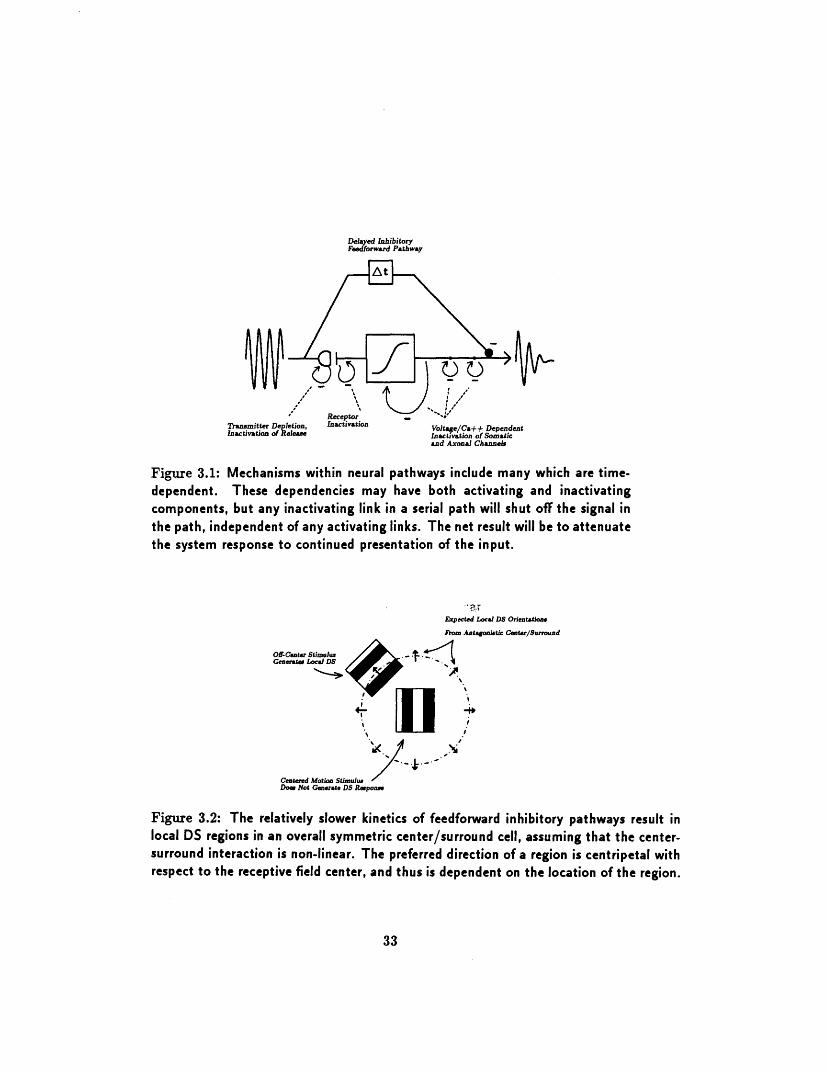
In principle any realizable DS circuit will show a DS response to periodicstimuli. However, there are several candidates for inactivating or adaptivemechanisms along any neural pathway which tend to emphasize the tran-sient es.ase of the system, as shown in Figure 3.1. Examples include ei-thor inactivation or adaptation of phototransduction, synaptic release (e.g.transmitter depletion), synaptic receptors, and of voltage or Ca++ dependentchannels (e.g. adaptation of repetitive firing, channel inactivation [36]). In-hibitory feedback may also be important in retinal function [68]. Also, inretina, inhibitory feedforward pathways are relatively slower than their ex-citatory counterparts.
The inhibitory pathways in the retina are not only relatively slower thanthe parallel excitatory pathways, but they tend to have wider spatial rangeas well. To the extent that a DS circuit depends on inhibitory input, theseproperties would tend to generate a more asymmetric response to stimuliwith larger size (e.g. in terms os moving spot path length or moving gratingaperture).
2In this Thesis, the "steady-state" response is defined similar to that used in electricalengineering practice, i.e. the response of a system at long times relative to the start of aperiodic input.
31
Stimuli with a relatively smaller size have another disadvantage whenit comes to characterizing receptive field asymmetries. We expect a DScell to have a consistent asymmetry over its receptive field, as we discussedearlier. The classical antagonistic center-surround receptive field, while sym-metric overall, includes local asymmetries (Figure 3.2) which could give DSresponses to spatially-limited stimuli (assuming non-linear center-surroundinteractions). A harbinger of such a situation would be a strong DS sensi-tivity to aperture size (e.g. DS for apertures below some maximum size). Aconsistent DS receptive field would not show such a sensitivity to the spa-tial change in a larger stimuli (although a concomitant increase in temporalcharacteristics might reduce the DS of the complete response). Such mech-anisms may explain some previous findings, e.g. spatially-limited DS cellsprior to ganglion cells [23]. An alternate explanation for the spatial lim-itation may, however, be center/surround DS antagonistic receptive fields[22].
We have used both gratings and bar stimuli in the experiments presentedhere. Although DS responses were found using both types of stimuli, prelim-inary results suggest that the most effective DS stimuli under the recordingconditions described in Appendices A and B are spots (e.g. 100 to 200/pm indiameter) with a long path (> 500/pm, drifting from 0.5 to 5 pm/ms). Longmoving bars (e.g. 1000 x 200pm) do not seem to be as effective, possiblybecause of activation of the inhibitory surround.
Moving grating stimuli were presented within a square aperture (100 to400pmsides, oriented along the motion axis). Gratings were exposed for 2 second"burst" windows from a dark background; depending on the temporal fre-quency of the grating, each burst included 1 to 10 cycles of the grating.The spatial phase of the gratings was set such that at the start of eachtemporal window an ON edge appeared at one side of the aperture. Thespatial period of all gratings was at least 800 Am, so the aperture was com-pletely dark at the start of the temporal window. Responses from a seriesof windows at a given orientation were then averaged together, maintainingzero relative phase. This protocol provided both a transient response tothe first ON edge drifting across the aperture, and the first cycles of the"steady-state" response. Although the rotating square aperture meant thatslightly different areas of the retina were illuminated depending on orien-tation, the illuminated areas for motions of opposite directions (relevant tothe DS determination) was identical.
As described in Appendix A, 100% contrast (point on monitor either fullon or full off) stimuli were used in all experiments.
32
¥
ranmmitter Depletion, Inactivation Volte/C+ DependeInactivation Of Releon tlCa++ Dependent].nactivation of Reeue Inactlvation of Somatic
and Axonal Channels
Figure 3.1: Mechanisms within neural pathways include many which are time-dependent. These dependencies may have both activating and inactivatingcomponents, but any inactivating link in a serial path will shut off the signal inthe path, independent of any activating links. The net result will be to attenuatethe system response to continued presentation of the input.
Expected Local DS Orientiow
tom Antaonatic Ceter/Surund
Off-Center Stimulus ...Generat. Local D8 DS
Centred Motion StimulueDor Not Generate DS RIeponre
Figure 3.2: The relatively slower kinetics of feedforward inhibitory pathways result inlocal DS regions in an overall symmetric center/surround cell, assuming that the center-surround interaction is non-linear. The preferred direction of a region is centripetal withrespect to the receptive field center, and thus is dependent on the location of the region.
33
tr g ..
3.2 Protocols for the Identification and Charac-terization of Directionally Selective Cells
3.2.1 Basic Protocols
In each the experiments described here, basic DS properties were determinedas follows:
1. Single cell response were obtained with extracellular (spiking) on-cellpatch recordings using flashing spots (typically 400 Mm square) at 1Hz, centered either at the electrode tip location or roughly midwaybetween the electrode tip and the visual streak, when visible).
2. Receptive field spot map was then obtained extracellularly using (typ-ically) 100 pm square spots flashing at 1 Hz, stepping over a 5 by 5square grid (100 - 200 pm distance between grid points)(protocol type"RF"). The center of the resulting spot map was estimated by eye.
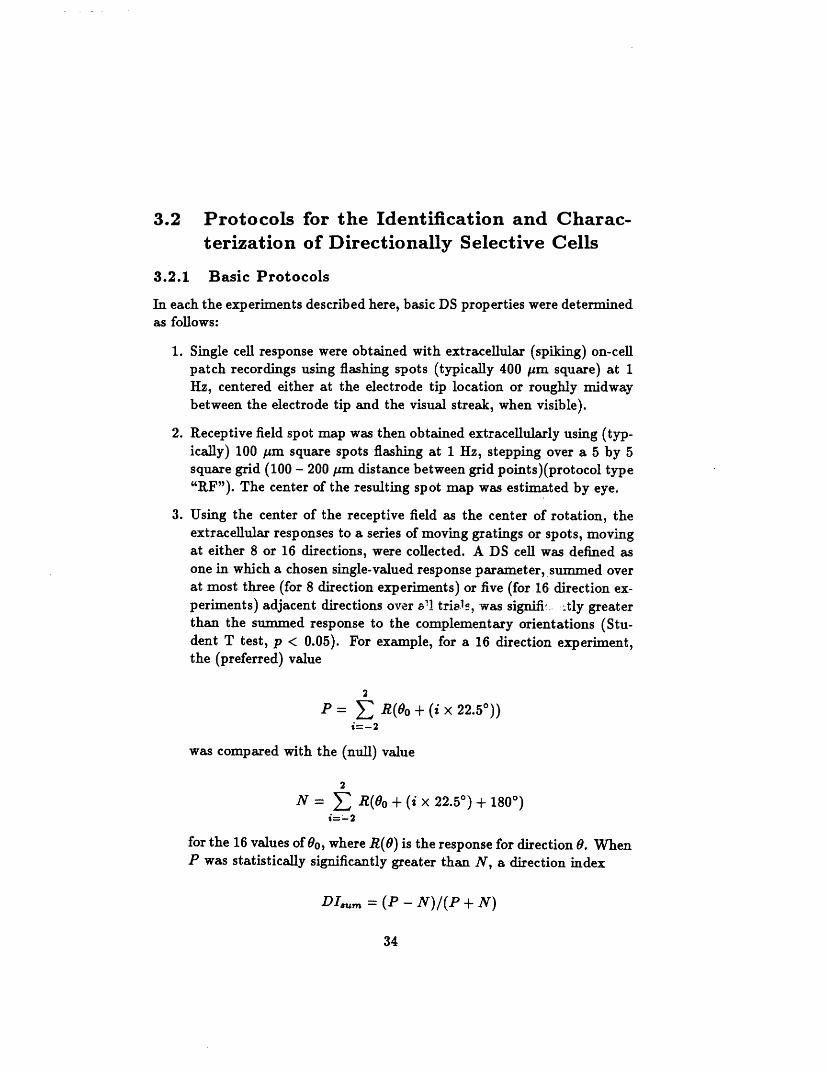
3. Using the center of the receptive field as the center of rotation, theextracellular responses to a series of moving gratings or spots, movingat either 8 or 16 directions, were collected. A DS cell was defined asone in which a chosen single-valued response parameter, summed overat most three (for 8 direction experiments) or five (for 16 direction ex-periments) adjacent directions over al trials, was signifil.. tly greaterthan the summed response to the complementary orientations (Stu-dent T test, p < 0.05). For example, for a 16 direction experiment,the (preferred) value
2
P = E R(Oo + (i x 22.50))i=-2
was compared with the (null) value
2
N = E R(o + (i x 22.50) + 180')i=-2
for the 16 values of 0 o, where R(8) is the response for direction 8. WhenP was statistically significantly greater than N, a direction index
DI,,,m = (P - N)/(P + N)
34
was then computed (see Section 4.3.2). The preferred direction ofthe cell, Gp, was defined as the value of 00 which gave the maximumstatistically significant value of DIsum. The degrees of freedom for theStudent T test was defined as the number of trials (2 to 8) multipliedby the number of grouped orientations (1 to 5). These protocols,which also generate an orientation tuning for the cell, are defined astype "WF".
4. Whole cell (intracellular) access was then obtained and WF protocolswere used to determine if extracellular DS properties (DS or not DS,preferred direction and DS tuning) were maintained over time, underboth current and voltage clamp conditions.
Single-valued response parameters used for DS determination (R(O)) in-cluded spike count, integral of membrane potential minus E,,et (for currentclamp protocols), and integral of the holding current minus the total clampcurrent (for voltage clamp protocols; note that negative clamp current im-plied an excitatory event).
Ideally, extracelluar recordings were stable enough to perform the DS de-termination, but in many cases either whole-cell access was obtained priorto completion of the DS protocol, or the extracellular recordings were toonoisy for evaluation in the limited time available. Likewise, in the idealcase whole-cell access provided clear and stable spikes so that recapit-lated protocols (using spike count as the response parameter) could be moredirectly compared with the previous extracellular protocols. However, insome cells spikes disappeared within minutes, and either synaptic potentials(via current clamp) and/or synaptic conductances (via voltage clamp) wereevaluated for DS properties. In this case, either the DS properties of thewaveforms were obvious to the eye, or a similar student-T test as above wasapplied using the appropriate waveform integral as the dependent variable.
3.2.2 Advanced Protocols
For many identified DS cells, particularly when the recordings were suffi-ciently stable, more specific DS measurements were made. These includedthe following:
* In order to replicate the data of Marchiafava directly (Figure 2.1) andthus highlight ganglion cell inhibition, preferred/null runs using spotsor gratings under various current clamp conditions were run as soon
35
as possible and after at least 30 minutes of whole-cell access (pro-tocol type "PN"). These included a control run (current clamp at 0pA), and runs with a constant depolarizing or hyperpolarizing currents(typically to about ± 10 to 30 mV around rest, i.e. ± 10 to 30 pA).Ideally, if extracellular DS was determined then the first set of theseruns was done immediately after whole-cell access in order to avoidIPSP attenuation. Otherwise, a WF protocol was done immediatelyafter whole-cell access and then (if the cell was DS) the first run ofthis protocol was done.
* In order to explore velocity tuning and/or spatial dependence, variousWF protocols were used with different temporal and spatial parame-ters, e.g. various spot speeds or grating temporal frequencies, or spotpath lengths or grating aperture sizes.
* In order to evaluate DS edge effects of symmetrical receptive fieldproperties, and to measure DS subunit properties, a series of 5 P/Nruns with gratings or spots of limited extent were used, with stimuluscenters spaced on typically 100 pm centers along the P/N axis and theentire series centered on the receptive field center.
* In order to map DS subunit properties more fully, WF protocols usingspatially limited moving spots or gratings were used over a 3 by 3grid (100 - 23 pm distance between grid points), with tihe entire gridcentered on the spot-mapped receptive field center.
* In some cases, RF protocols were repeated at various intervals to checkthe stability of the spot-mapped receptive field.
For some cells, simple size dependence for flashing spots was determinedusing 50 to 1600 prm square spots, centered on the spot-mapped receptivefield. This protocol, called type "SP", was especially useful for observingthe evolution of inhibitory post synaptic potentials (IPSPs) during whole-cell access. Because of its importance in the interpretation of intracellularDS recordings, we shall discuss this phenomenon now.
36
3.3 Elimination of IPSPs With Maintenance ofAntagonistic Center Surround Excitatory In-put
In Section 2.4 we discussed ganglionic models in which the interaction be-tween (non-DS) excitatory and inhibitory input onto the ganglion cell un-derlie the cell's DS response. Also, interpretation of ganglion cell membranepotentials may be complicated by inhibitory input onto the cell which mightnot have a direct link to the directional properties (Section 2.3.2).
For this reason we have recorded from ganglion cells using whole cellpatch electrodes in which the electrode solution is free of ATP (in somecases without Mg2+ as well) (Appendix B). Given the large bore of theelectrode (1-2 ptm), it is likely that the cell contents are dialyzed by theelectrode solution within several minutes after the start of recording. It hasbeen reported in hippocampus that such conditions block the response ofGABAA receptors ([60]); thus this technique offers a method for selectivelyblocking an inhibitory component of the recorded cell's synaptic input, with-out disturbing the rest of the network.
Using this technique we have recorded from ganglion cells which showclear light-evoked IPSPs and EPSPs at normal resting potential at the onsetof whole-cell access. However, in almost all these cells, within typically ten totwenty minutes after whole-cell access, light-evoked IPSPs disappear wl.haEPSPs are maintained, suggesting the block described above. This apparentremoval of direct inhibitory input to these cells was verified by depolarizingthe cells: negative synaptic potentials were not observed despite large de-polarizations (30 mV above the resting potential). Hyperpolarizing phasesof spike repolarizations were observed, however, suggesting preservation ofvoltage-dependent hyperpolarizing mechanisms.
Figures B.6 through B.12 in Appendix B demonstrate the reduction ofIPSPs to flashing spots over time. In this chapter we shall show DS record-ings of these same cells or cells recorded under the same conditions. To re-capitulate, DS ganglion cell responses without measurable inhibitory input,especially with P/N distinctions that are stable with respect to hyperpolar-izing or depolarizing current, suggest that some turtle ganglion cells receiveexcitatory input which is already DS.
37
3.4 Directionally Selective Responses
We shall now present DS recordings from several ganglion cells taken witha variety of protocols. We shall describe the basic findings under currentclamp and voltage clamp, and then present example recordings in Figure 3.3through 3.25. These recordings are listed in Table 3.1 for quick reference.
DS data is presented in several formats. Polar plots of single-valuedresponse parameters are presented with standard deviations when the pa-rameter was computed for each trial, and then averaged over several trials.Response waveforms are presented both in the standard fashion and in per-spective plots (moving gratings only). Each perspective plot is composed ofa series of averaged current or voltage clamp waveforms in response to mo-tion stimuli at 16 orientations (WF protocol). The responses shown in theseplots are passed through a low pass filter (fc = 20hz) before averaging. Asmentioned earlier in the description of moving grating burst averaging, eachaveraged waveform shows both the transient response and the (beginning ofthe) steady state (grating) response. The waveform data is replicated onceby concatenating 2 full cycles of the 3600 sweep of the stimuli direction, inorder to more clearly show any directional component.
For some cells, we also show spot-mapped receptive fields overlaid withthe cells' DS axis.
3.4.1 Directionally Selective Responses Under Current Clamp
DS EPSPs and spike responses have been obtained with the whole-cell patchtechnique under the conditions which reduce or eliminate IPSPs. The DS ofthe responses are stable with respect to holding current, which was adjustedto move the resting potential within ± 30 mv from the control Ee,t.
3.4.2 Directionally Selective Responses Under Voltage Clamp
DS responses were also recorded under voltage clamp. In the perspectiveplots of these responses clamp current polarity has been reversed for clarity;thus positive current implies an excitatory synaptic event. The DS of theresponse are stable with respect to holding potential, which ranged from -90to -35 mV.
For example, in cell A56 (Figure 3.8) the dependence is striking (best atabout 157°), and is independent of the holding potential (Figure 3.10). Forcomparison, cell A81 (Figure 3.13) shows little dependence of the voltage
38
clamp waveforms on stimulus direction.Although the degree in which the dendritic tree of these cells is actually
clamped during the voltage clamp protocol is not know directly, the obser-vation of DS inward currents at low (somatic) holding potentials is furtherevidence for at least a component of the excitatory synaptic input being DS,independent of any local blockage of IPSPs.
39
Cell Type Figure Recording Stimulus Plot Type__ l | I __ Method Protocol
A47 + 3.3 CC WF3 Conventional3.4 CC WF3 Polar3.5 VC WF15 Conventional3.6 CC WF15 Polar
A56 + 3.7 EC WF2 Polar3.8' VC WF4 Perspective3.9 VC WF4 Polar
3.10 VC WF6 Perspective3.11 VC WF6 Polar3.12 CC RF1-2 RF w/DS axis
A81 ± 3.13 VC WF6 Non-DS Persp.A84 i 3.14 EC WF2 Polar
3.15 CC WF3 Conventional3.16 VC WF5 Perspective3.17 VC WF5 Polar
A105 i 3.19 CC WF3 Polar3.20 CC PN2-4 Conventional3.21 CC RF2 RF w/DS axis
A115 + 3.22 EC WF4 Polar3.23 CC PN1-3 Conventional3.24 CC WF5 Polar3.25 CC PN4-8 Conventional3.26 CC RF2 RF w/DS axis
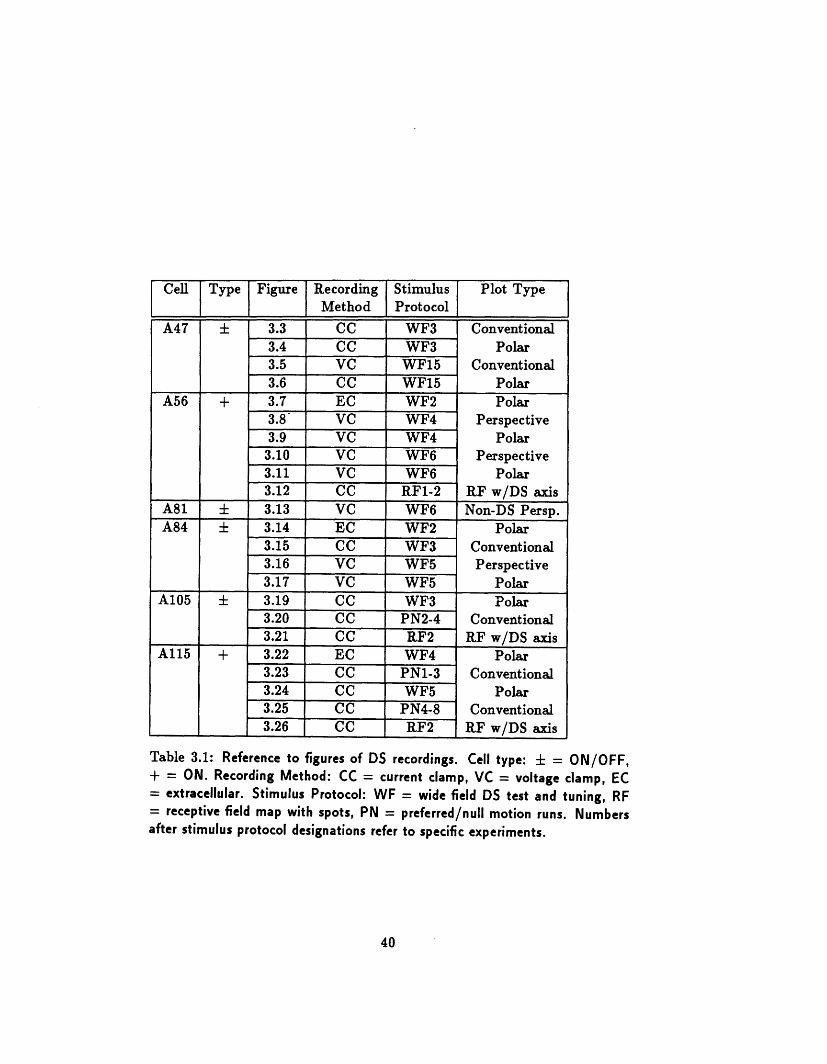
Table 3.1: Reference to figures of DS recordings. Cell type: = ON/OFF,+ = ON. Recording Method: CC = current clamp, VC = voltage clamp, EC= extracellular. Stimulus Protocol: WF = wide field DS test and tuning, RF= receptive field map with spots, PN = preferred/null motion runs. Numbersafter stimulus protocol designations refer to specific experiments.
40
-mV 0.0 dog50.0 .. 180.0 dog
55.0
.0milliseconds x 1.0e3).0 9.25 .5 .75 . . .
mV 45.0 dog0.0 ---. 225.0-dog
5.0
60.0 -' -" --.mllIlseconds (x 1.0.3)
o.0 ,.25 ,.5 0.75 11.0 1.25 1.5 1.75
mV - 90.0 dog50.0 - 270.0 dog
550 I
mllllsaconds (jx .0-3)_.0 ,0.25 ,0.5 ,.75 ,1.0 ,1.25 ,.5 ,175
mV 135.0 deg50.0 .. 315.0 dog
milliseconds (x 103)D.0 0.25 ,0.5 ,.75 ,1.0 ,1.25 1.5 ,1.75
mV - 22.5 dag50.0 --- 202.5 dg
55.0
milliseconds (x 10e3)
D.O ,5 , ,0 '.25 ,15 1.775mV -- 11267.5 dog50 0 .. . 24792.5 dg
J.0
_.0 ,0.25 ,0.5 ,0.75 1'° 1.1.25 ,1.5 (x11 7 *3)
mV - 157 5 deg
.50.0 29. 3375 dog55.0 ,,'XI :.6 0
millseconds (x 1eS
.0 ,0.25 .5 .75 ,1.0 ,.25 ,1.5 ,1.75MV - 1.5 deg-5.0 33- 29.5 deg
-5.0
.6.0
D.0 I~~~~~~~llise·conds (x 1.,03),0 .25 P.5 P.75 1.0 1725 1.5 -
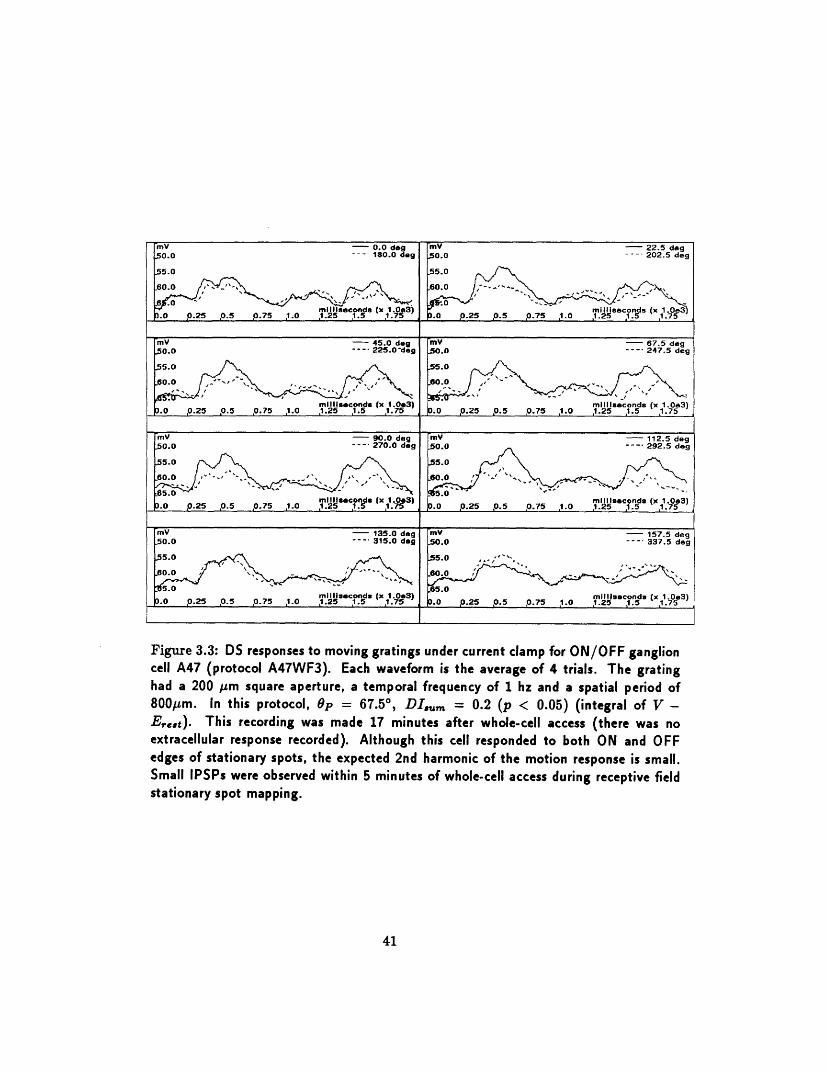
Figure 3.3: DS responses to moving gratings under current clamp for ON/OFF ganglioncell A47 (protocol A47WF3). Each waveform is the average of 4 trials. The gratinghad a 200 /qm square aperture, a temporal frequency of 1 hz and a spatial period of800pm. In this protocol, Op = 67.50, DIm = 0.2 (p < 0.05) (integral of V -E,e,t). This recording was made 17 minutes after whole-cell access (there was noextracellular response recorded). Although this cell responded to both ON and OFFedges of stationary spots, the expected 2nd harmonic of the motion response is small.Small IPSPs were observed within 5 minutes of whole-cell access during receptive fieldstationary spot mapping.
41
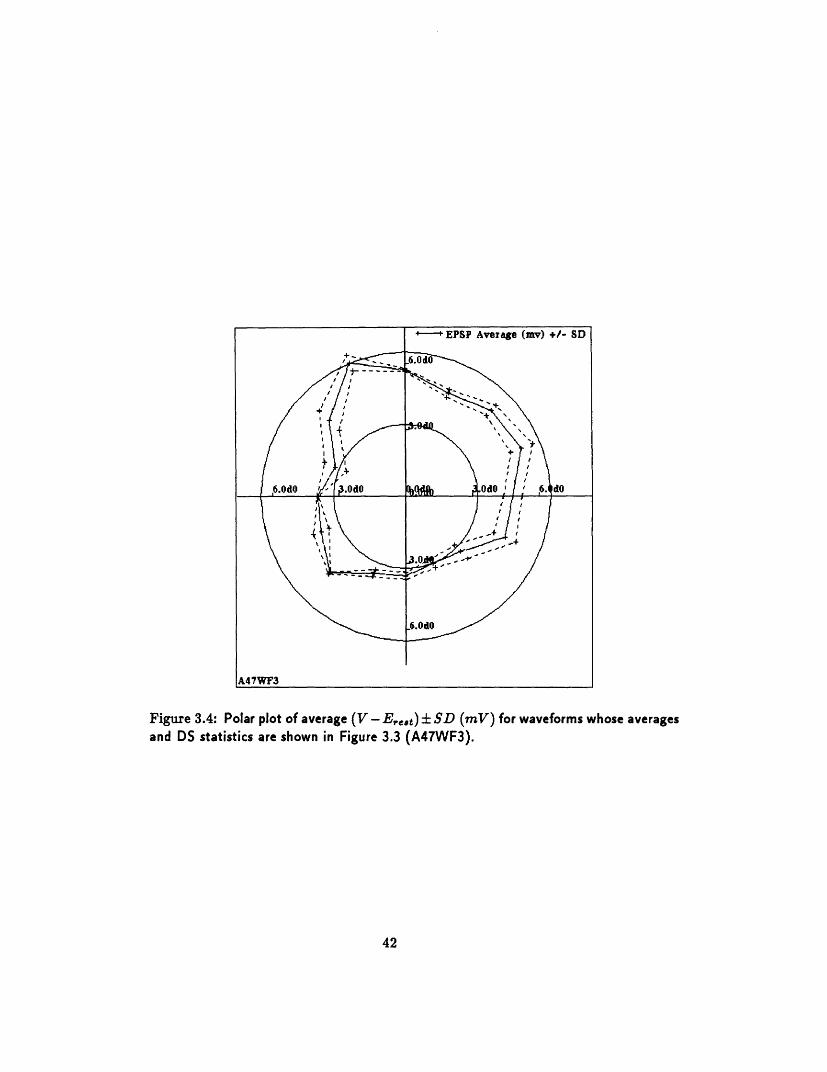
Figure 3.4: Polar plot of average (V - E,,t) f SD (my) for waveforms whose averagesand DS statistics are shown in Figure 3.3 (A47WF3).
42
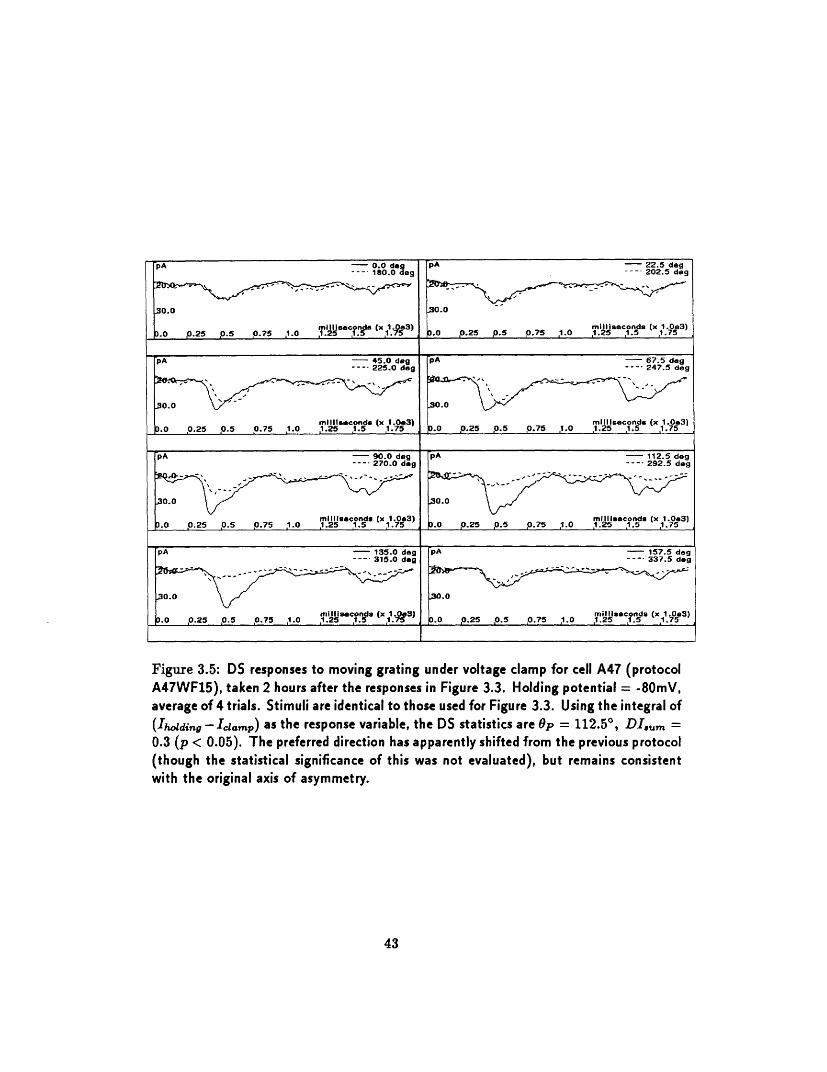
Figure 3.5: DS responses to moving grating under voltage clamp for cell A47 (protocolA47WF15), taken 2 hours after the responses in Figure 3.3. Holding potential = -80mV,average of 4 trials. Stimuli are identical to those used for Figure 3.3. Using the integral of(Iholding - Iclamp) as the response variable, the DS statistics are Op = 112.5 ° , DIgum =0.3 (p < 0.05). The preferred direction has apparently shifted from the previous protocol(though the statistical significance of this was not evaluated), but remains consistentwith the original axis of asymmetry.
43
pA 0.0 dg _ pA 22.5 dog1--- 80.0 deg --.- 202.5 deg
30.0 So0.0
millseconds (x 1.0e3) milliseconds (x 1.0e3).0 o.25 ,0.5 0.75 ,1.0 1.25 .5 75 0 .25 1.5 p.75 ,.0 11.25 1.5 .75
pA - 45.0 dg A 67.5 deg--- 225.0 deg --- 247.5 deg
mllll.ocondo (x 1 .03) mIllseconds (x 1.0.3).0 0.25 9.5 ,0.75 ,1.0 1.25 1.5 1.75 .0 ,.25 .5 '.75 ,1.0 1.25 ,1.5 1.75
pA 90.0 dog pA 112.5 deg... 270.0 dog . 292.5 dg
30 0300
mllsecondS (x 1.03) milllseconds (x 1e3).0 ,.25 p.5 0.75 1.0 ,1.25 1 0 O 0.25 0.5 0.75 .o0 1.125s .5 .
pA - 135.0 dg A 157.5 deg-.- 315.0 dg . 337.5 dog
300 300
mIlloisconds (x 1001 ) milliseconds (x 1.0e3).0 9.25 .5 9.75 .0 1.25, 1.5 1.75 .0 25 .5 .75 1.0 1.25 1.5 1.75
,
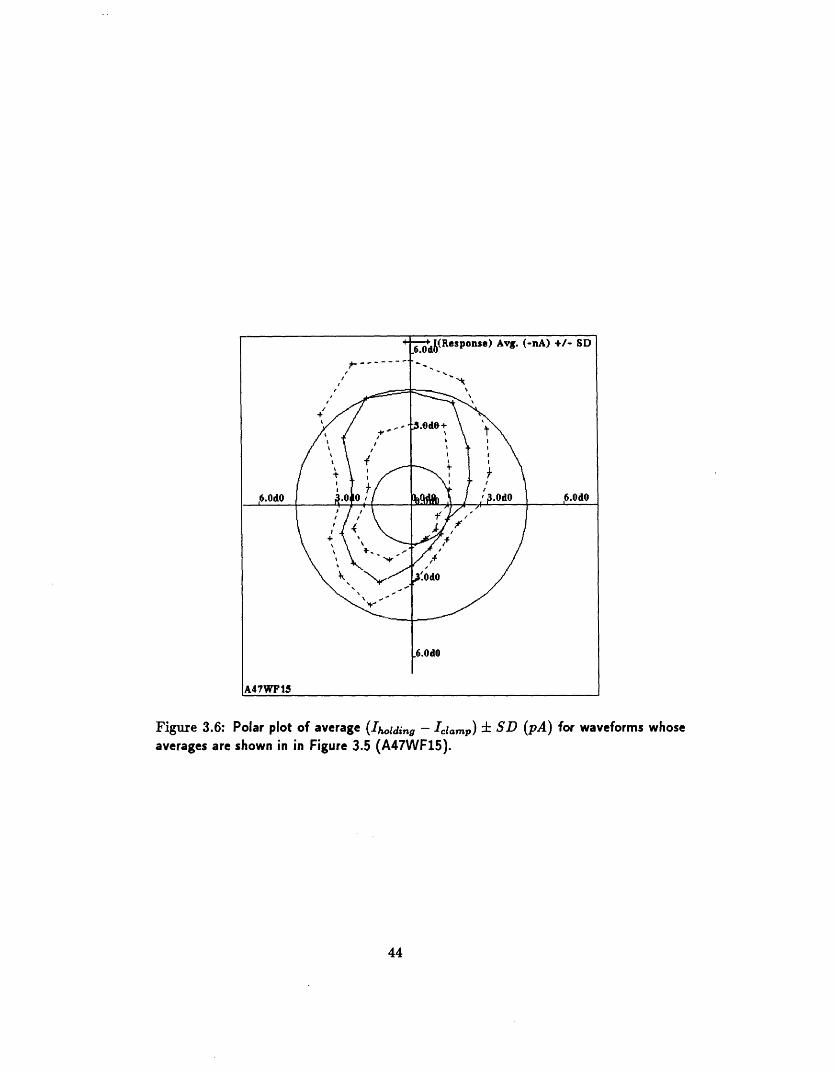
Figure 3.6: Polar plot of average (Iholding - Icoamp) ± SD (pA) for waveforms whoseaverages are shown in in Figure 3.5 (A47WF15).
44
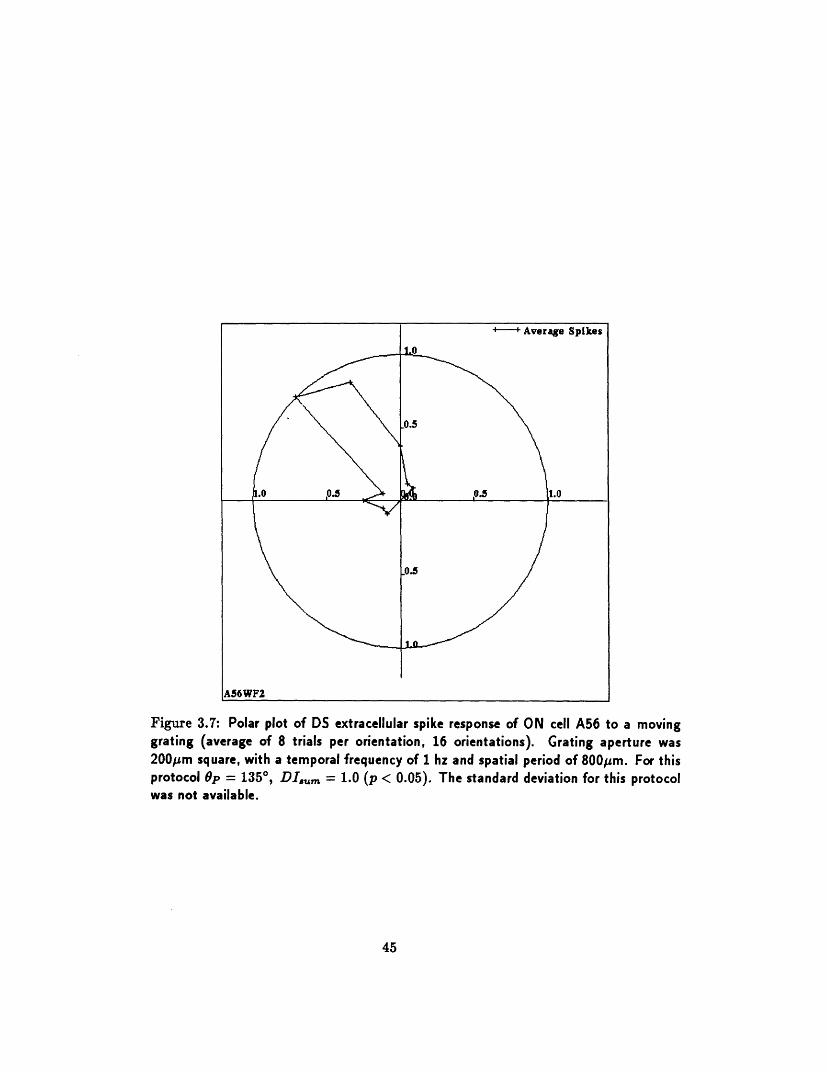
Figure 3.7: Polar plot of DS extracellular spike response of ON cell A56 to a movinggrating (average of 8 trials per orientation, 16 orientations). Grating aperture was200pm square, with a temporal frequency of 1 hz and spatial period of 800/m. For thisprotocol p = 1350, DI,,,m = 1.0 (p < 0.05). The standard deviation for this protocolwas not available.
45
deg
1980 ms
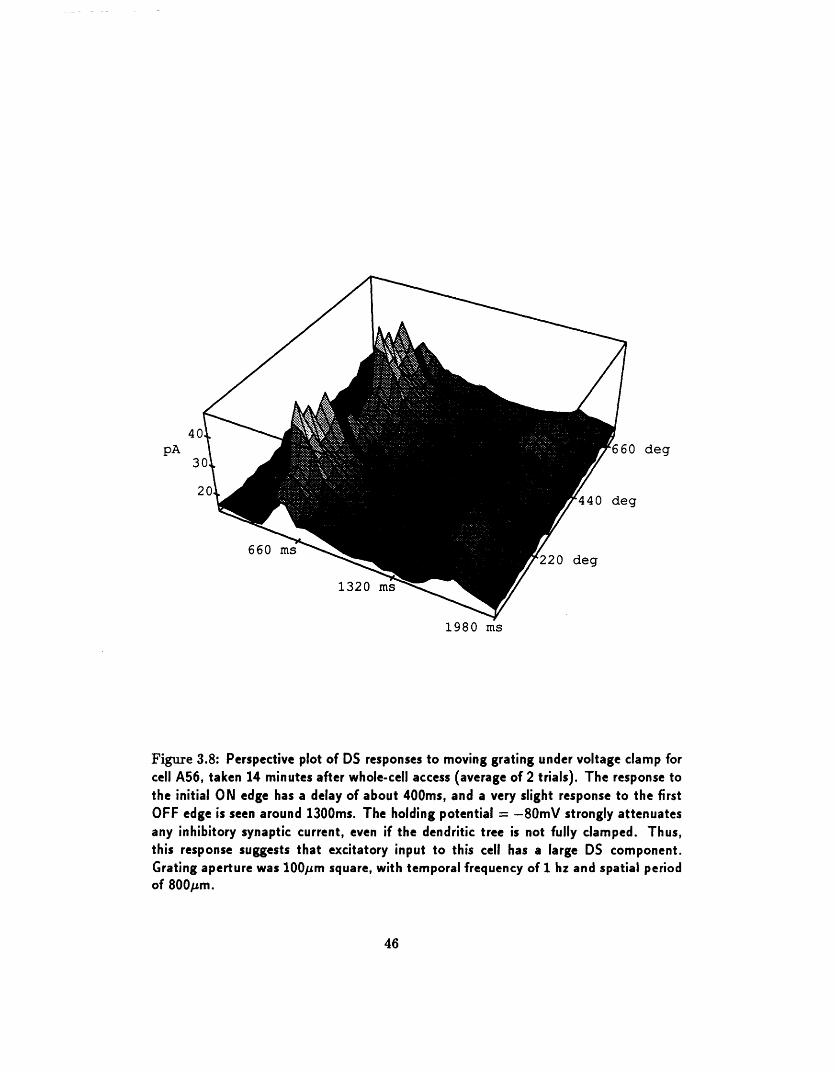
Figure 3.8: Perspective plot of DS responses to moving grating under voltage clamp forcell A56, taken 14 minutes after whole-cell access (average of 2 trials). The response tothe initial ON edge has a delay of about 400ms, and a very slight response to the firstOFF edge is seen around 1300ms. The holding potential = -80mV strongly attenuatesany inhibitory synaptic current, even if the dendritic tree is not fully clamped. Thus,this response suggests that excitatory input to this cell has a large DS component.Grating aperture was 100pm square, with temporal frequency of 1 hz and spatial periodof 800pm.
46
pA
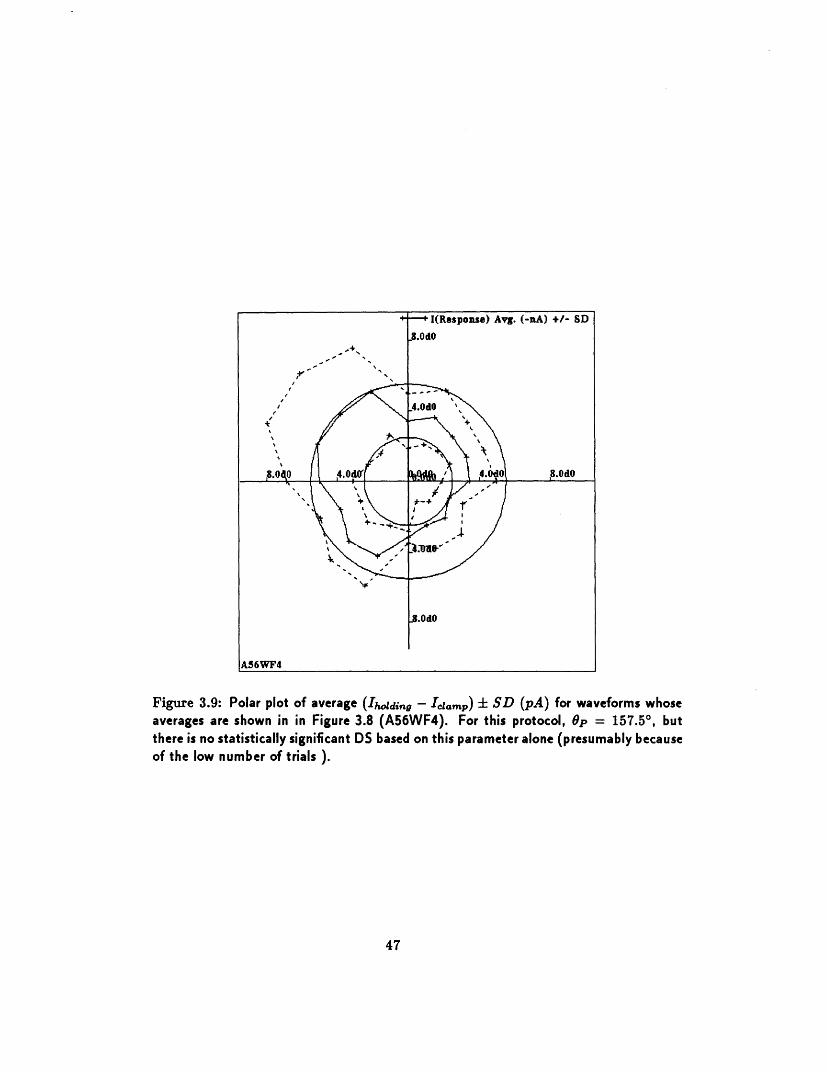
Figure 3.9: Polar plot of average (Ihldig - clamp) ± SD (pA) for waveforms whoseaverages are shown in in Figure 3.8 (A56WF4). For this protocol, p = 157.5 °, butthere is no statistically significant DS based on this parameter alone (presumably becauseof the low number of trials ).
47
pA O deg
g
1980 ms
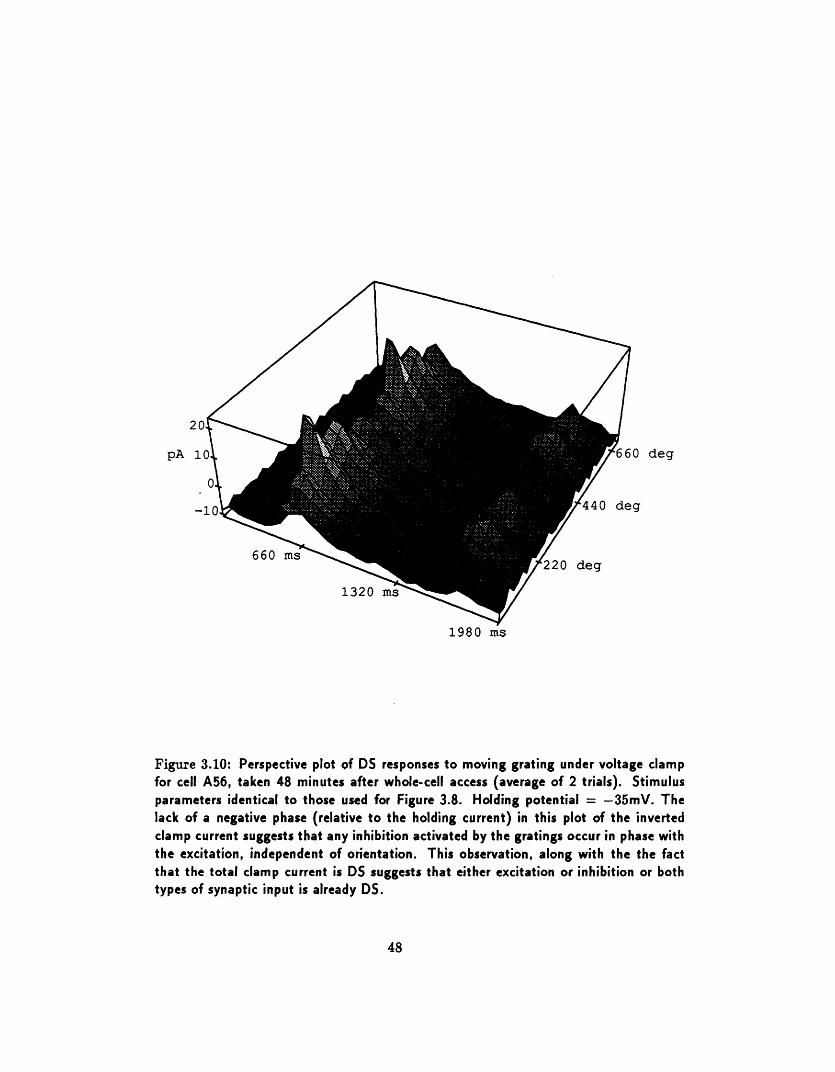
Figure 3.10: Perspective plot of DS responses to moving grating under voltage clampfor cell A56, taken 48 minutes after whole-cell access (average of 2 trials). Stimulusparameters identical to those used for Figure 3.8. Holding potential = -35mV. Thelack of a negative phase (relative to the holding current) in this plot of the invertedclamp current suggests that any inhibition activated by the gratings occur in phase withthe excitation, independent of orientation. This observation, along with the the factthat the total clamp current is DS suggests that either excitation or inhibition or bothtypes of synaptic input is already DS.
48
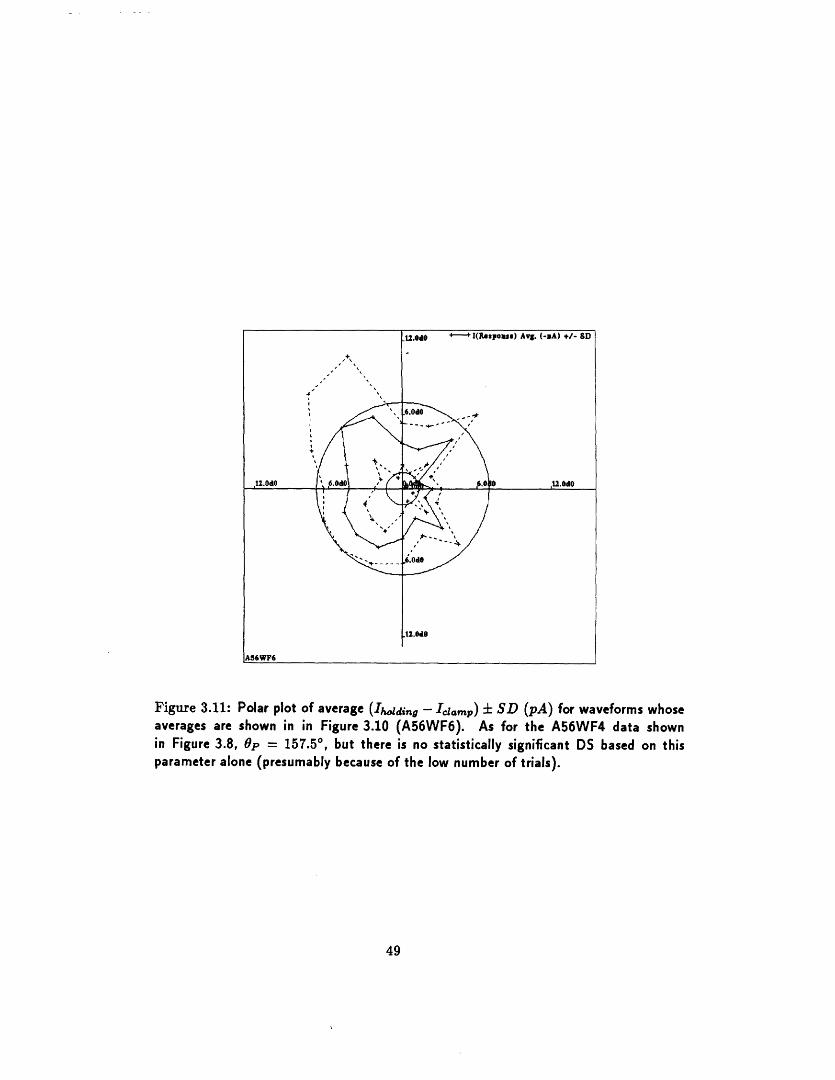
Figure 3.11: Polar plot of average (Ihdding - Iclamp) ± SD (pA) for waveforms whoseaverages are shown in in Figure 3.10 (A56WF6). As for the A56WF4 data shownin Figure 3.8, Op = 157.50, but there is no statistically significant DS based on thisparameter alone (presumably because of the low number of trials).
49
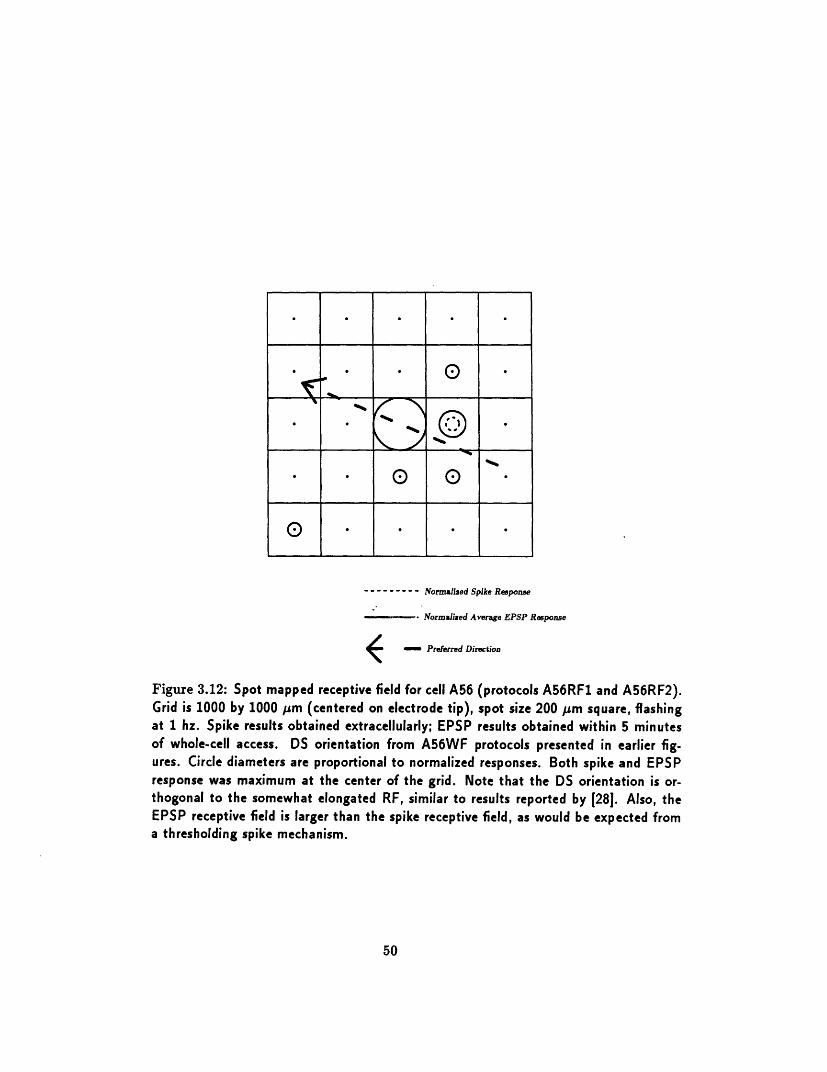
--------- Normalized Spike Response
Normalized Average EPSP Response
( Preferred Direction
Figure 3.12: Spot mapped receptive field for cell A56 (protocols A56RF1 and A56RF2).Grid is 1000 by 1000 m (centered on electrode tip), spot size 200 JIm square, flashingat 1 hz. Spike results obtained extracellularly; EPSP results obtained within 5 minutesof whole-cell access. DS orientation from A56WF protocols presented in earlier fig-ures. Circle diameters are proportional to normalized responses. Both spike and EPSPresponse was maximum at the center of the grid. Note that the DS orientation is or-thogonal to the somewhat elongated RF, similar to results reported by [281. Also, theEPSP receptive field is larger than the spike receptive field, as would be expected froma thresholding spike mechanism.
50
pA 0 deg
g
2000 ms
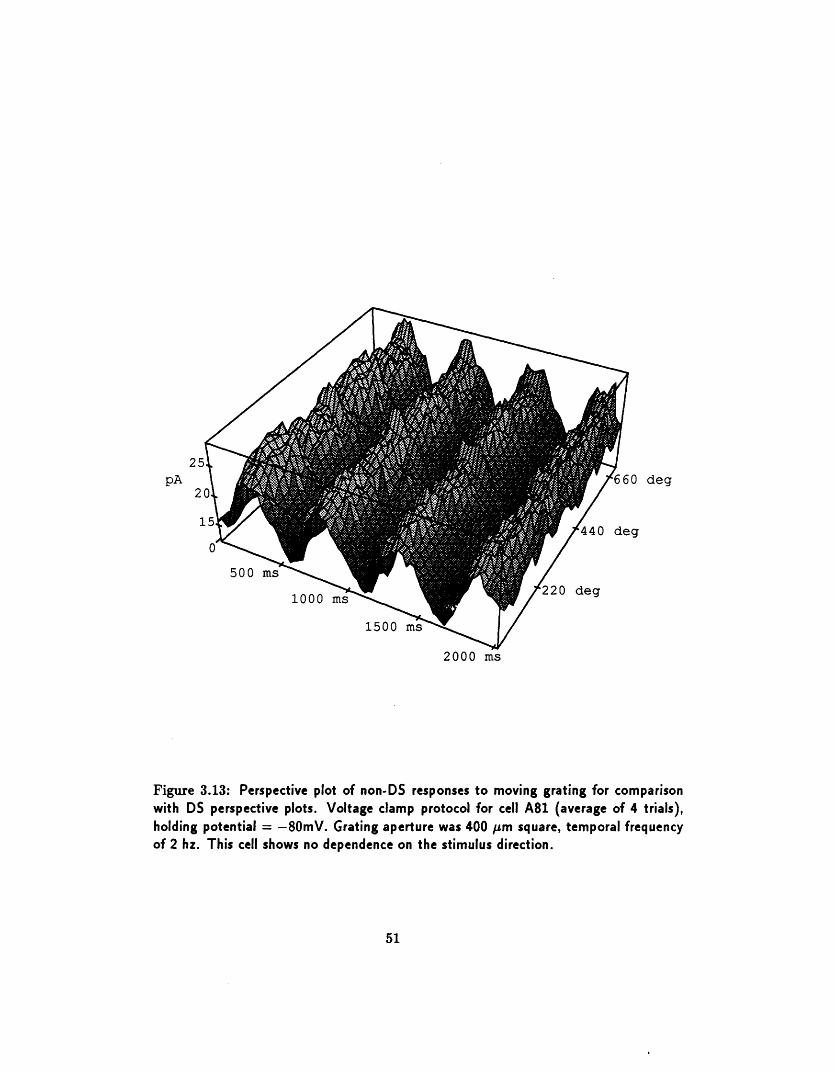
Figure 3.13: Perspective plot of non-DS responses to moving grating for comparisonwith DS perspective plots. Voltage clamp protocol for cell A81 (average of 4 trials),holding potential = -80mV. Grating aperture was 400 Jsm square, temporal frequencyof 2 hz. This cell shows no dependence on the stimulus direction.
51
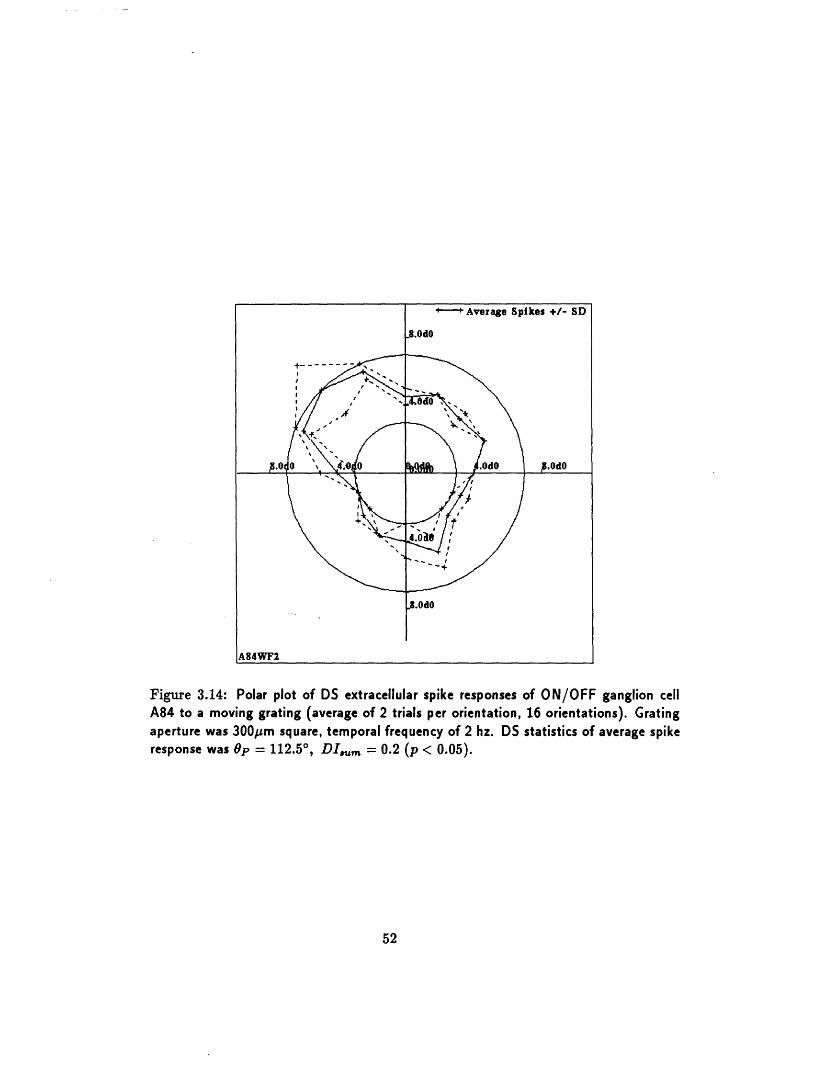
Figure 3.14: Polar plot of DS extracellular spike responses of ON/OFF ganglion cellA84 to a moving grating (average of 2 trials per orientation, 16 orientations). Gratingaperture was 300/pm square, temporal frequency of 2 hz. DS statistics of average spikeresponse was Op = 112.50, DI,,,m = 0.2 (p < 0.05).
52
-mV O0 d mV -v 22.5 deg-30.0 .. .. 1S de .- 30.0 . . .. 202.5 deg
.:-50.0 -50.0
-60.0 -6.0
m.-300 ( 1.0 deg(x1 30.0 '-- .m d e. D.0 i.s 1.25 , .7 .5 1,.0 1 . 1.75mV 45.0 dog 6mY .-- 65 deg30. ---- 22570.0 deg -30.0 ---- 27.5 deg,4.d~m0.0 e.od ( , - 0.0(
-3'0. , --. - 31. dg -30.0
mV 90.0 dog mV -- 112.5 deg.-30.0 170.0 d J-30.0 .. 01.5 d'
-,.0 4. \. f t\t0.0
.60. 1 0 r,_.__' _1 . 0 75;J ,0. 1.251 .5 1.7e _,,_ o_ __ 015 .5 0.75 1.0 1.25 1. 1.75
Figure 3.15: DS responses15. dto moving gratings 17.5 deg-50.0 ; .... 3L dog -30.0 .. .. 337.5 dog
'.25 0.5 .1.05 .5 ,1.5 0!.75
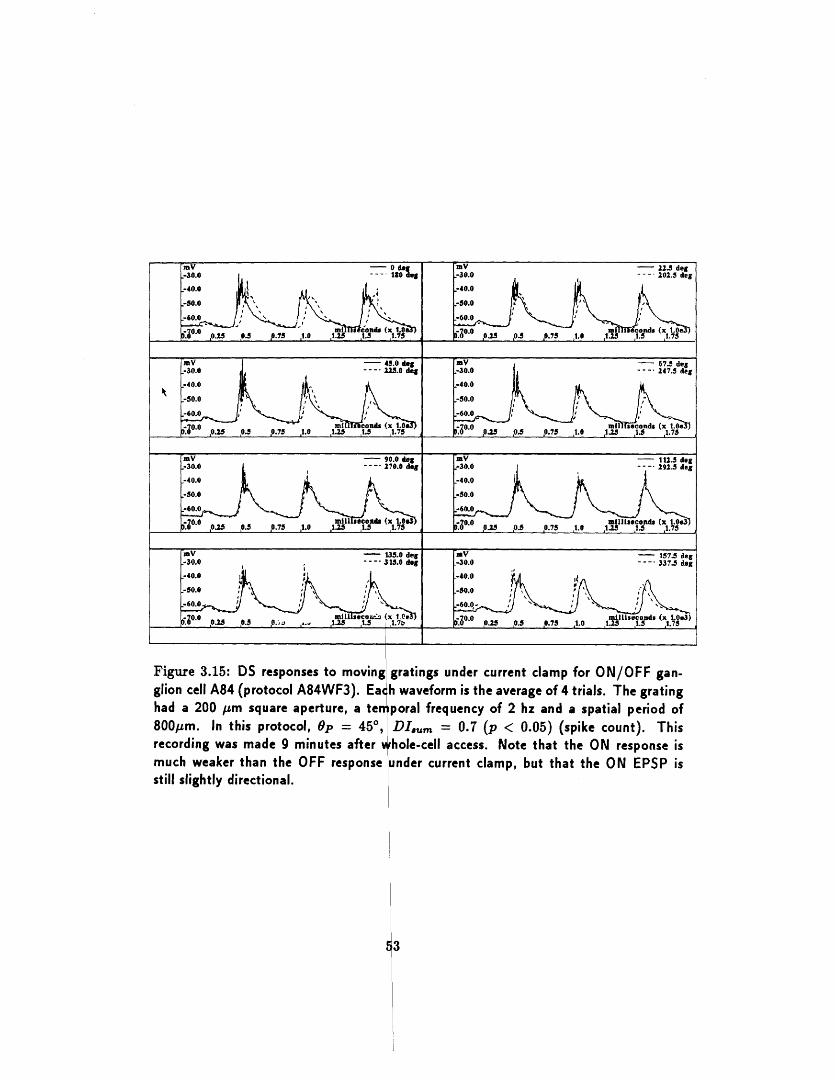
Figure 3.15: DS responses to movinl gratings under current clamp for ON/OFF gan-glion cell A84 (protocol A84WF3). Ea h waveform is the average of 4 trials. The gratinghad a 200 m square aperture, a ten poral frequency of 2 hz and a spatial period of800om. In this protocol, p = 450, DI,, u = 0.7 (p < 0.05) (spike count). Thisrecording was made 9 minutes after irhole-cell access. Note that the ON response ismuch weaker than the OFF response under current clamp, but that the ON EPSP isstill slightly directional.
~3
pA 1
Figure 3.16: Perspective plot of response to moving grating under voltage clamp for cellA84, taken 30 minutes after whole-cell access. Holding potential = -80mV (average of4 trials), suggesting that excitatory input to this cell has a large DS component. Gratingaperture was 200pm square, temporal frequency of 2 hz. The 2nd harmonic from theON/OFF cell is clearly seen in this motion response, and the ON response is relativelylarger than that seen in Figure 3.15, possibly because the voltage clamp reduces thecontribution of inhibition, and the inhibition may be more blocked by the lack of ATPat this later recording time. Also, the ON response adapts more than the OFF response,which in turn has a stronger directional dependence over time. The shift in preferreddirection between this figure and Figure 3.14 (here, Op = 22.50, DI,,,um = 0.12 (p <0.05)) might be accounted for by a shift in the aperture location (see Figure 3.18),although the statistics of a broad directional tuning may also account for an apparentshift.
54
deg
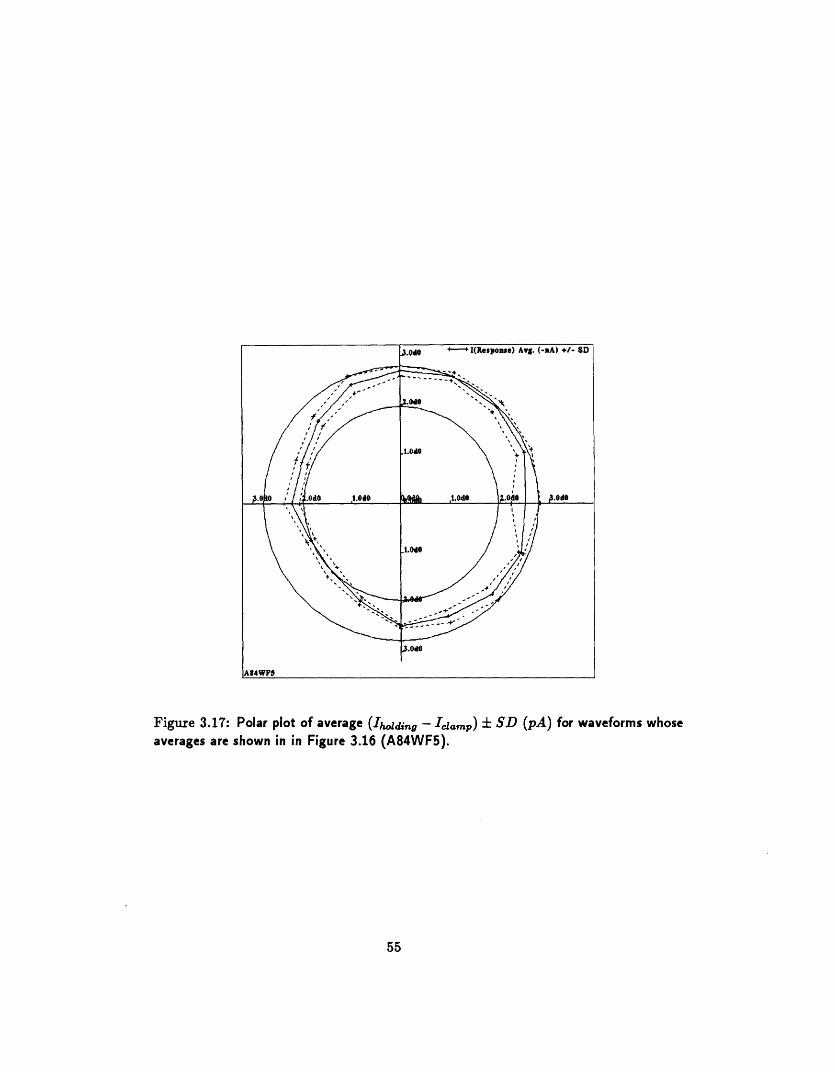
Figure 3.17: Polar plot of average (Iholding - IcIamp) ± SD (pA) for waveforms whoseaverages are shown in in Figure 3.16 (A84WF5).
55
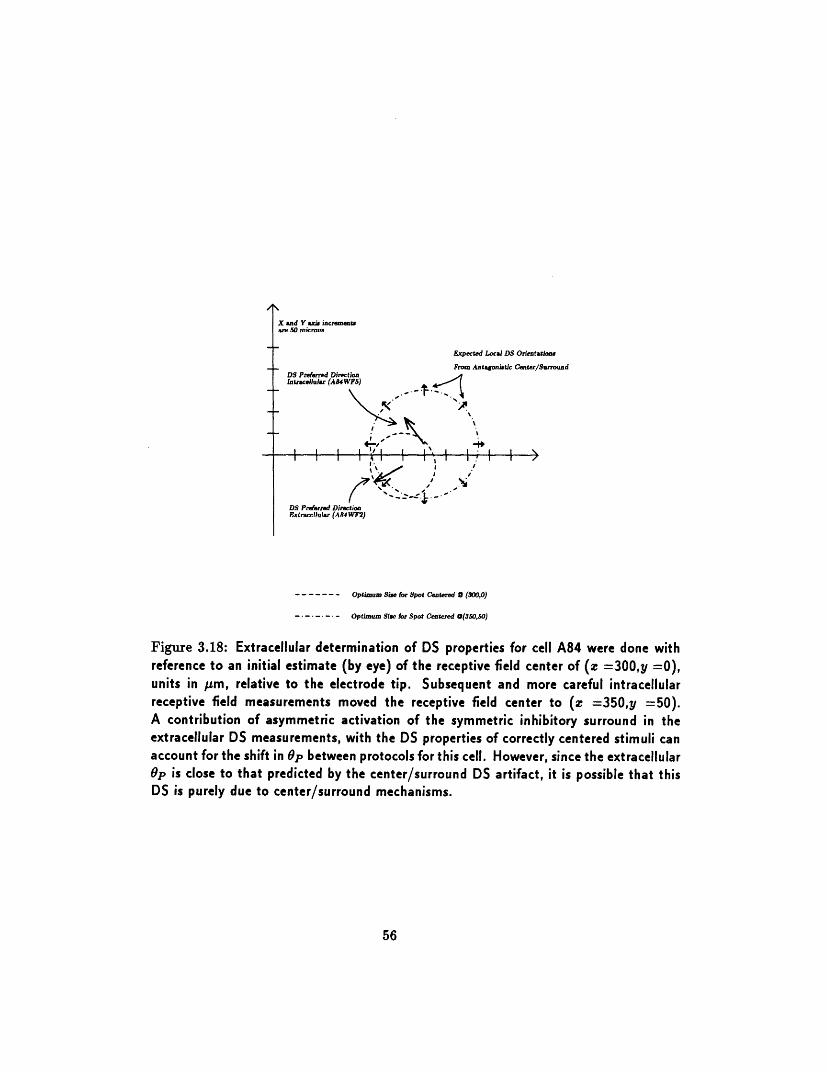
X ad Y i iacrementsare 50 nmiros
Expected Local DS Orientatio
From atonitc Center/SurroundDS Preferd Direction ntraeiluhr (A84WF5)
.a -
I' I I
DS Preferred DirectionFxtr:llular (A84WF2)
Optimum Si o S fpoi Centered (o0,0)
-.- - - - Optimum Siwr for Spot Centered 0(350,50)
Figure 3.18: Extracellular determination of DS properties for cell A84 were done withreference to an initial estimate (by eye) of the receptive field center of (z =300,y =0),units in Jim, relative to the electrode tip. Subsequent and more careful intracellularreceptive field measurements moved the receptive field center to (z =350,y =50).A contribution of asymmetric activation of the symmetric inhibitory surround in theextracellular DS measurements, with the DS properties of correctly centered stimuli canaccount for the shift in Op between protocols for this cell. However, since the extracellularOp is close to that predicted by the center/surround DS artifact, it is possible that thisDS is purely due to center/surround mechanisms.
56
/1
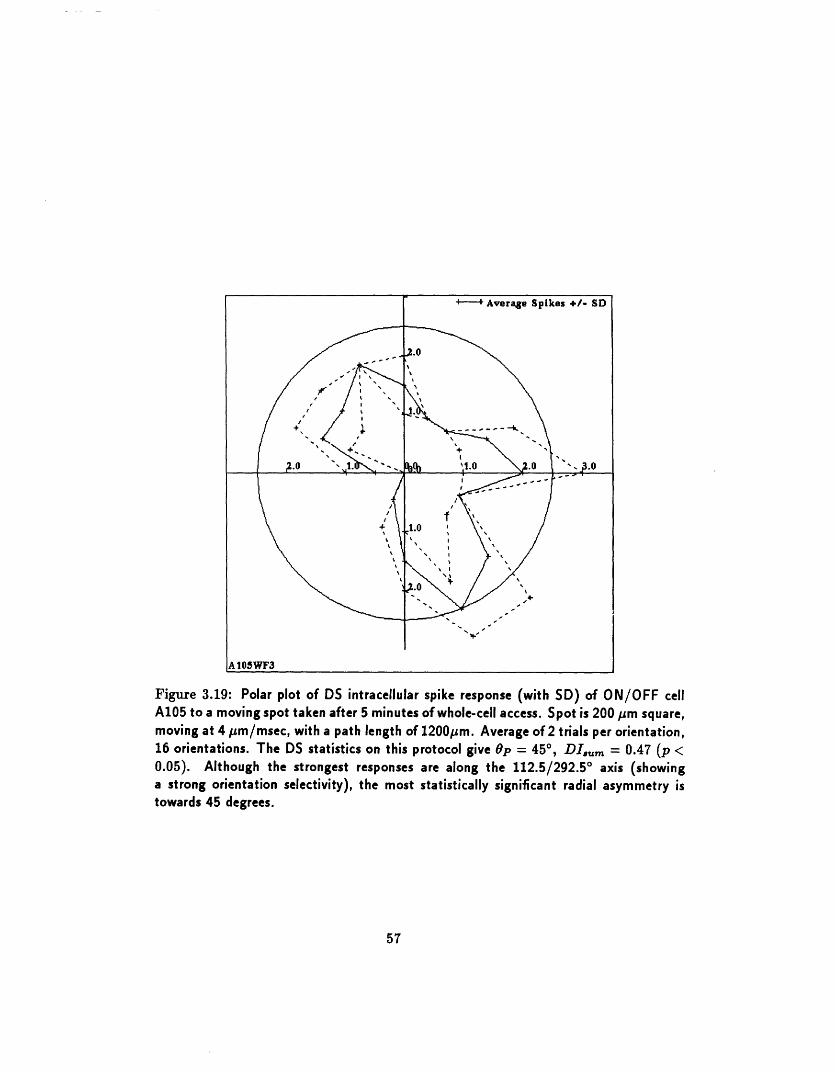
Figure 3.19: Polar plot of DS intracellular spike response (with SD) of ON/OFF cellA105 to a moving spot taken after 5 minutes of whole-cell access. Spot is 200 pm square,moving at 4 pm/msec, with a path length of 1200pm. Average of 2 trials per orientation,16 orientations. The DS statistics on this protocol give p = 450, DI,,,m = 0.47 (p <0.05). Although the strongest responses are along the 112.5/292.50 axis (showinga strong orientation selectivity), the most statistically significant radial asymmetry istowards 45 degrees.
57
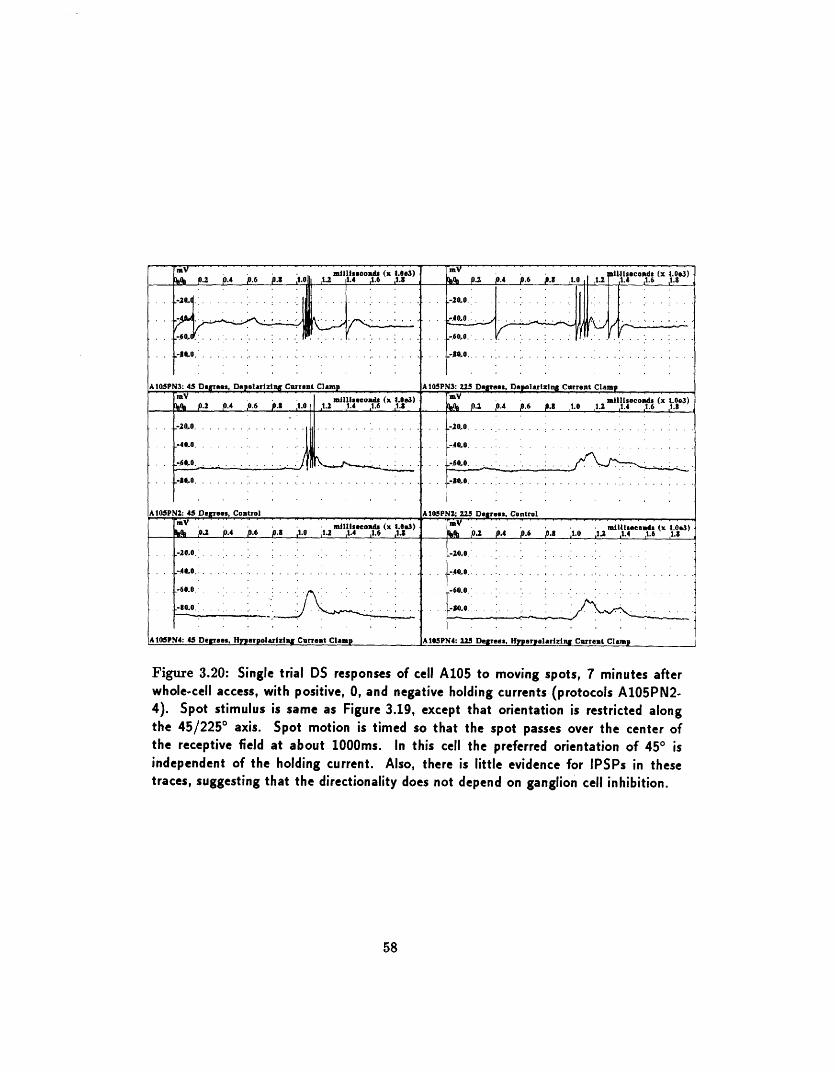
Figure 3.20: Single trial DS responses of cell A105 to moving spots, 7 minutes afterwhole-cell access, with positive, 0, and negative holding currents (protocols A105PN2-4). Spot stimulus is same as Figure 3.19, except that orientation is restricted alongthe 45/225° axis. Spot motion is timed so that the spot passes over the center ofthe receptive field at about 1000ms. In this cell the preferred orientation of 45 isindependent of the holding current. Also, there is little evidence for IPSPs in thesetraces, suggesting that the directionality does not depend on ganglion cell inhibition.
58
e2 .4 0.6 . 1. 1. 1.41 .6 1J.3 0 .4 .6 ,.3 1.0 I 1. 4 1.6 1.3
-20 .. .. -20.0 .r'mV* .... .......... ....... . ........ ..................... ......
, . . .. 60. .
.... .. . .. . . .... 0 0.. .
...... .... 0 ...A105PN3: 45 Degrees, oDelarizin Currnt Clamp AIOPN3 2.5 Degress, Depolarlzl% Currnt Clam
'V mllisoads (x 1.03) mV I ' llisecoeds (x 1.03)0_ ~.2 ,o 0.46 .p. S , ,21. ,1 1.6 1.3 . 2 . , .6 1 .0 1.2 1.4 1.6 1.3-.2000. 0.6 ~ .S .0.
.0 . ....... .... ...... 200. ..
.0.0 .. .. . . . -....
.I .0S .4 .. . . . .. . .. i .e Cl ,. . .. . . .. ... . . .... . . . . . .. . . ..C. .r. lC m............ . . .... ,..1.... ........
A105PN2: 4 Derees, Control A10SPN2; 225 Degrees Cntral
_ o 02. p.4 t.6 p.8 1. . l14 . 6 1. 0. .4 ,0.6 0.8 1.0 ,12 ,.4 1.6 l.S
-2(L 0 .. .... '. .. ... .. ...... . .'.. ' . A ... . .... ... . . . .. *...'. ... .. ... . .. . .
. .o............ .. .. . .. :..4,0... 6 ..
At SP:ee. e eHpplrii Cr. o.:.....:.e. i- · -: - .- *t-: ·n -Cr _m.. ...
- ; ;.:-'...'' ' * .....
A105PN4: 4 DeSees, Hperplrizin Current Clamp AIOPN4 2,5 Derees. Hperolarizing Currout Clamp
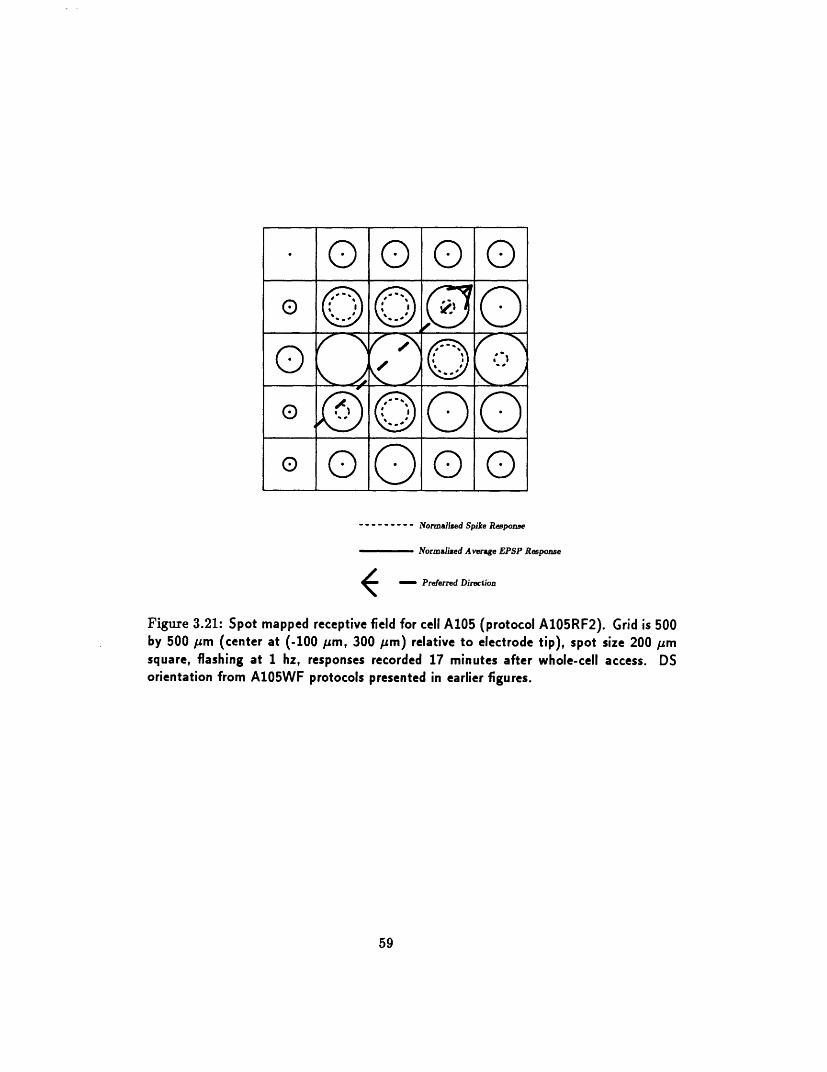
--------- Normalized Spike Response
Normalized Average EPSP Response
* - Preferred Direction
Figure 3.21: Spot mapped receptive field for cell A105 (protocolby 500 /m (center at (-100 m, 300 /m) relative to electrodesquare, flashing at 1 hz, responses recorded 17 minutes afterorientation from A105WF protocols presented in earlier figures.
A105RF2). Grid is 500tip), spot size 200 gmwhole-cell access. DS
59
o _ ·o OO 03 000O o O o ooQO~~~o
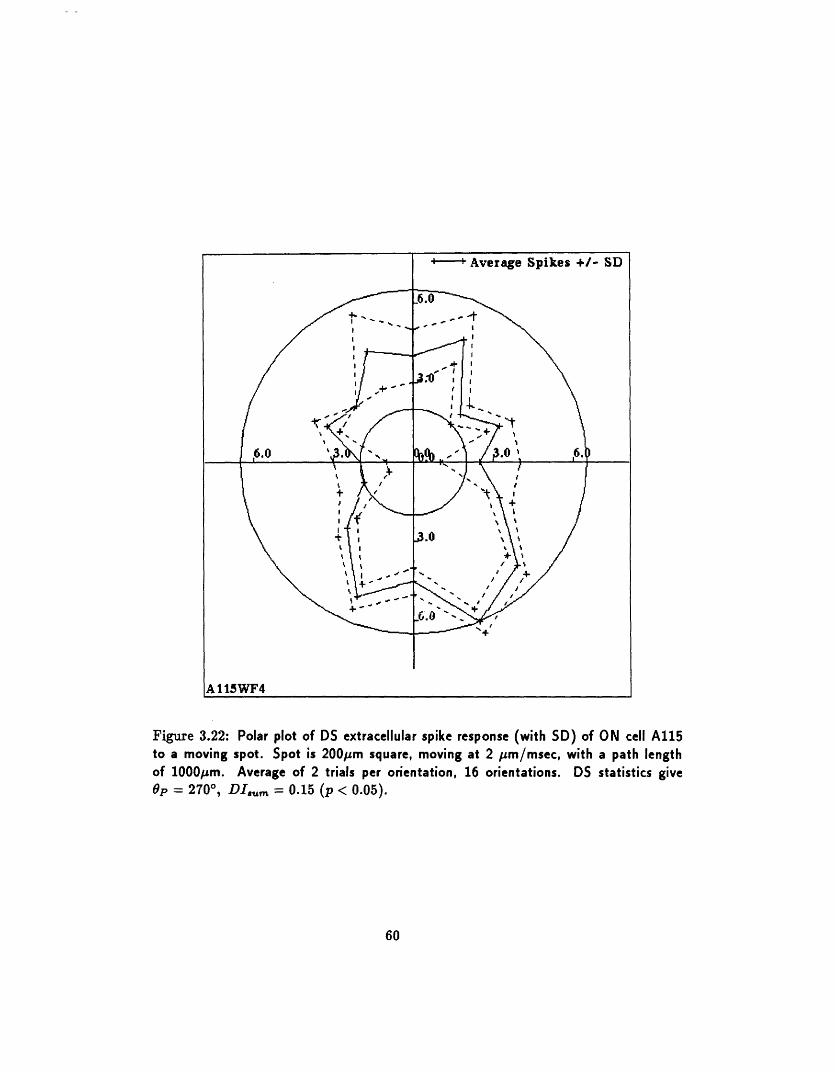
Figure 3.22: Polar plot of DS extracellular spike response (with SD) of ON cell A115to a moving spot. Spot is 200pm square, moving at 2 Om/msec, with a path lengthof 1000pm. Average of 2 trials per orientation, 16 orientations. DS statistics giveOp = 2700, DI,,,,m = 0.15 (p < 0.05).
60
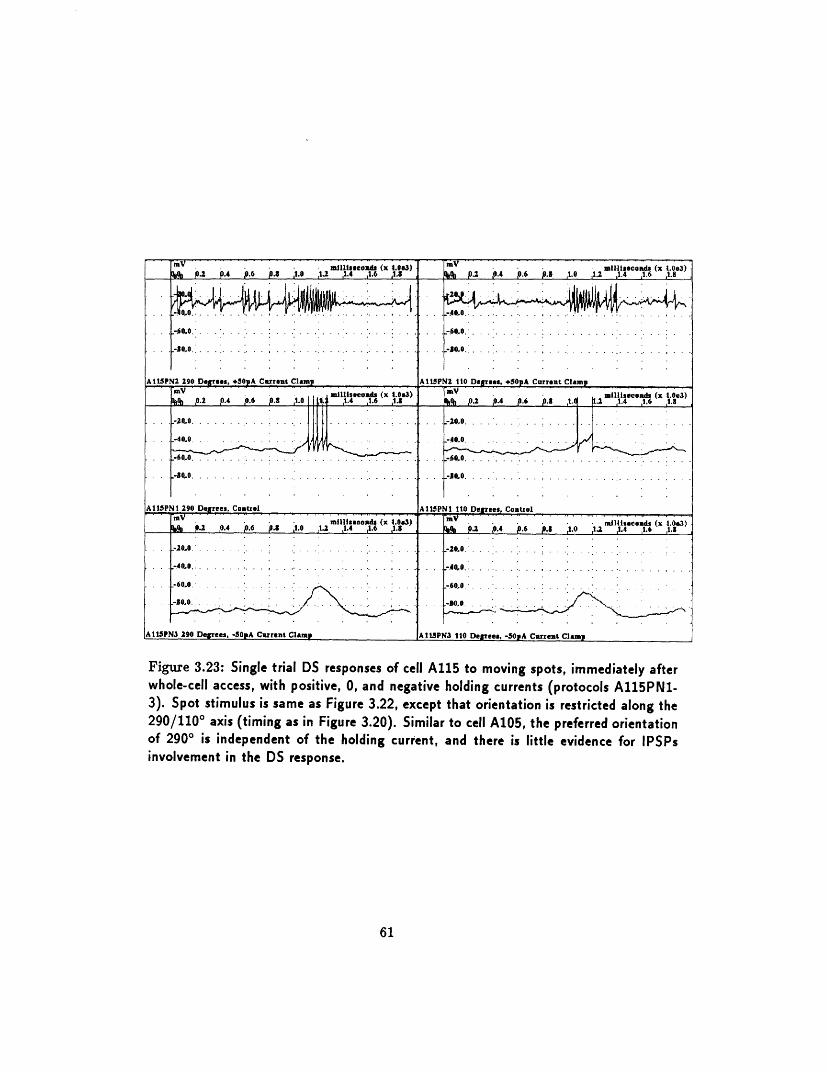
Figure 3.23: Single trial DS responses of cell A115 to moving spots, immediately afterwhole-cell access, with positive, 0, and negative holding currents (protocols A115PN1-3). Spot stimulus is same as Figure 3.22, except that orientation is restricted along the290/110 ° axis (timing as in Figure 3.20). Similar to cell A105, the preferred orientationof 2900 is independent of the holding current, and there is little evidence for IPSPsinvolvement in the DS response.
61
mV · 1_ le · nd (X fir ) I.MillisecO (X 1.03). .4 .6 .8 1e 1.2 L4 1. 6 . _ 4 1.6 1.5 t _.e 1 1 .2 t.4 1c6 ( 1.83). pp ,. . .. . .
.... ;6 0. ' .... .. - . . . .0 6,0 . . . . .. . . . . . .. . . ..0,0.' ' . . . . . . . . . . . . . . . . 0 0. .. .I..., . . . . . . . . . . . ... . . .. . .
rJ !I. ,.. . .............. ...........O; 0
AIS5PN2 290 Degrees, +Sp6A Current Clamnp AIISPN2 110 Degres, +5OpA Current Clamp
um_ ,6 2 ,0 4 ,0 6 p s _ ull1113lecods (x 1.0.1) mV millseconds (x t1.03)0.2 o.4 0.6 P. ;1.0 1,, 1.4 1.6 ,1.1 *Oa P.2 0.4 6 . 1 .2 1.4 1.6 1.3
-20...... ·- ·. .........- 20,.0. · .....
...-4e~0, .. . . .. .......- 6- 20. . . . ......
-......... .. ....... ..... -. , ....
A11SPNt 290 Degrees, Control .A11SPNI 110 De[ees, Control
mllsuoa, ' (x 1.03) . . mlisecon ds (x 1..3)0.2 0.4 0.6 p.S 1.0 1.2 1.4 1.6 1.8 0. . 4 .6 .1 1.0 1.2 1.4 1.6 1.8
-2.0 . . . - ... . . .-... .. .. . . . .- .
.. . . .... ... ... ....... .... . . ..... ... . .4 . . ...... . ... . ... . . . . . ... . ... . ... . ... . .
60.0. .-.. . . . . . . : .. .
-0.0. -. . ._ ; 10..
At1SPN3 290 Degrees, -SOpA Crrent Clamp 1AI!PN3 110 Degrees, -5OpA Current Clam
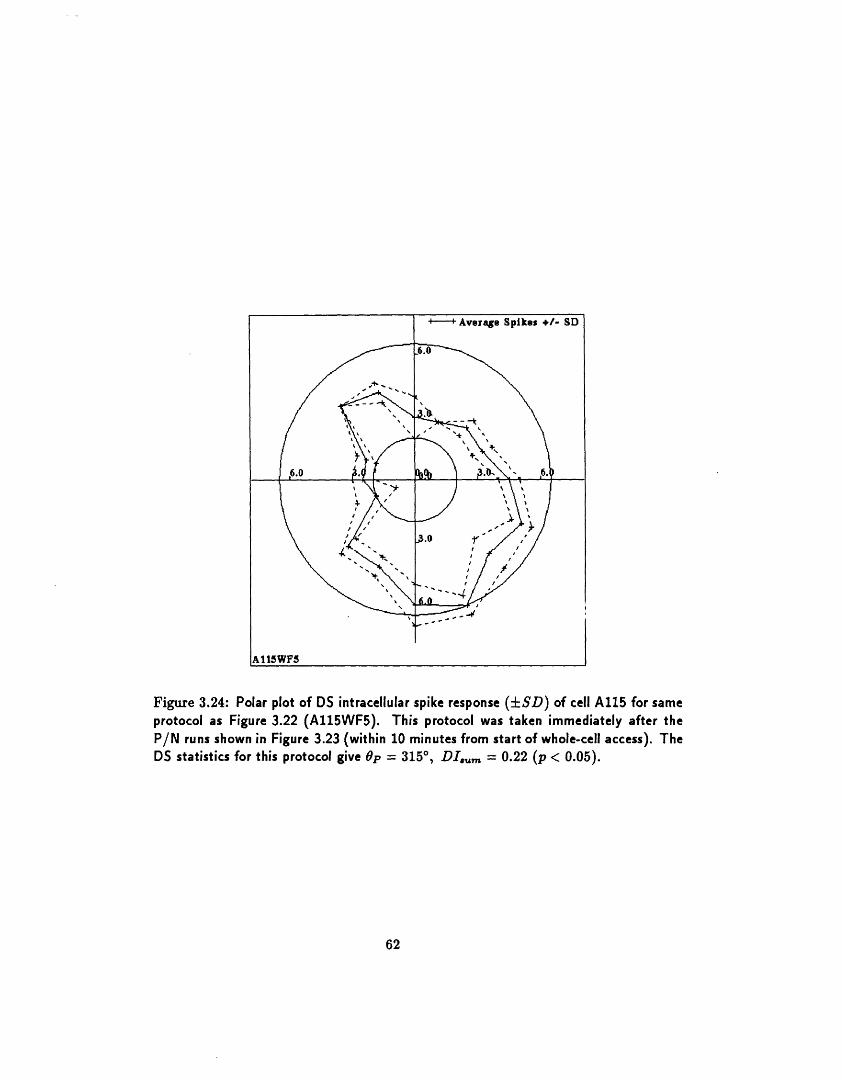
Figure 3.24: Polar plot of DS intracellular spike response (SD) of cell A115 for sameprotocol as Figure 3.22 (A115WF5). This protocol was taken immediately after theP/N runs shown in Figure 3.23 (within 10 minutes from start of whole-cell access). TheDS statistics for this protocol give p = 3150, DIum = 0.22 (p < 0.05).
62
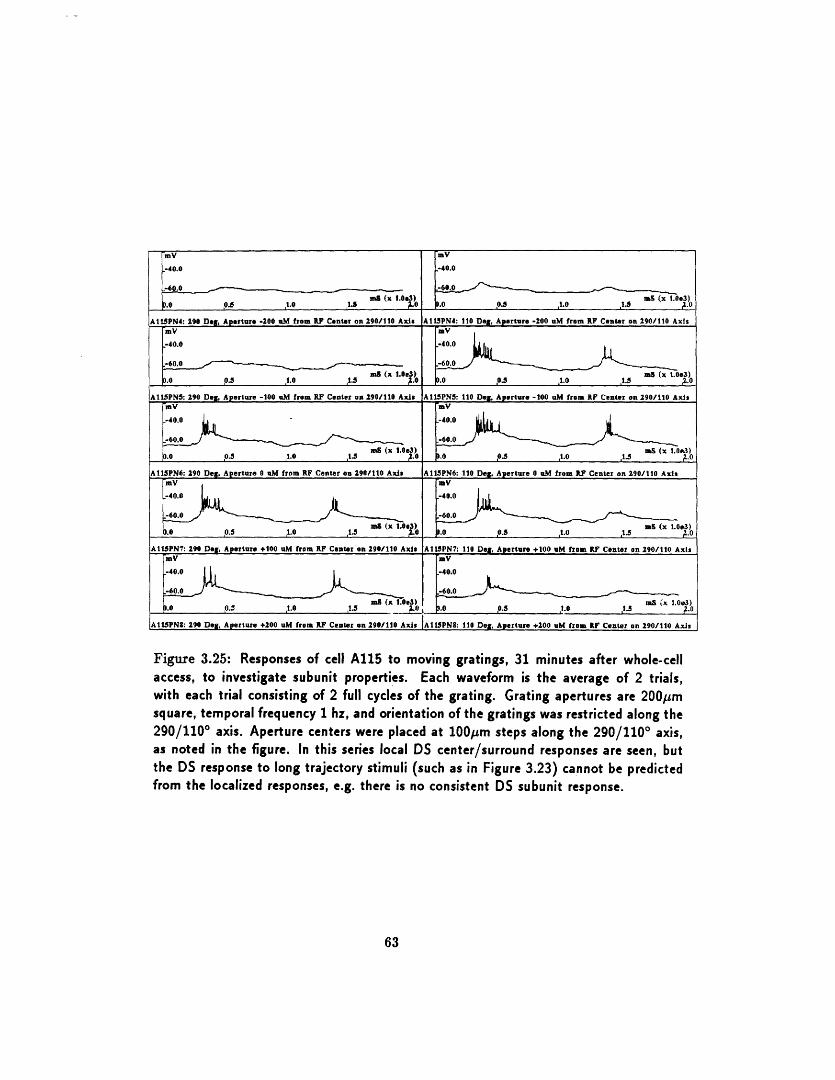
mV _mV
-40.0 -40.0
-60.0 -60.0
0.0 0 5 1.0 m (x. .0 mS (x t. 03)
A1ISPN4: 290 Dog, Aperture -200 uM from RF Center on 290/110 Axis AII3PN4: 110 Dog, Aperture -200 uM from RF Center on 290/110 AxismV mV
-40.0 --40.0
-60.0 m x -60.0g (X LO m8 x 1.Oe3)
.05 0 1S . l .0 o 1.0 15 2
AlIIPNS: 290 Deg. Aperture -100 uM from RF Center on 290/110 Axis A15PNS: 110 Deg. Aperture -100 uM from RF Center on 290/110 AxismV 'mV
~~~-1~~~~~~~~0.0 L-~ ~:0.0-60.0 -60.0
_.0 D. O.. ( O 0 .(x .0 11.5 10)
A115PN6: 290 Deg. Aperture 0 uM from RF Center on 290/110 Axis A11PN6: 110 Deg. Aperture 0 uM from RF Center on 290/110 AxismV mV
-40.0 , I -40.0
-60.0 -60.0
( 103) m (x 1.03)_.0 IO ,10 15 msx W)0 _ 0 .5 10. 1
A115PN7: 290 Dog, Aperture +100 uM from RF Center on 290/110 Axsle A115PN7: 110 Dog, Aperture +100 uM from RF Center on 290/110 AxismV mInV
-40.0 -40.0
-60._0 -60.0
_ ).0 Ms (X ,.O . 0 .). .. 1.03
A115PN: 290 Deg, Aperture +200 uM from IRF Center on 290/110 Axis AIISPN8: 110 Del , Aperture +200 uM from RF Center n 290/110 Axis
Figure 3.25: Responses of cell A115 to moving gratings, 31 minutes after whole-cellaccess, to investigate subunit properties. Each waveform is the average of 2 trials,with each trial consisting of 2 full cycles of the grating. Grating apertures are 200pimsquare, temporal frequency 1 hz, and orientation of the gratings was restricted along the290/1100 axis. Aperture centers were placed at 100pm steps along the 290/1100 axis,as noted in the figure. In this series local DS center/surround responses are seen, butthe DS response to long trajectory stimuli (such as in Figure 3.23) cannot be predictedfrom the localized responses, e.g. there is no consistent DS subunit response.
63
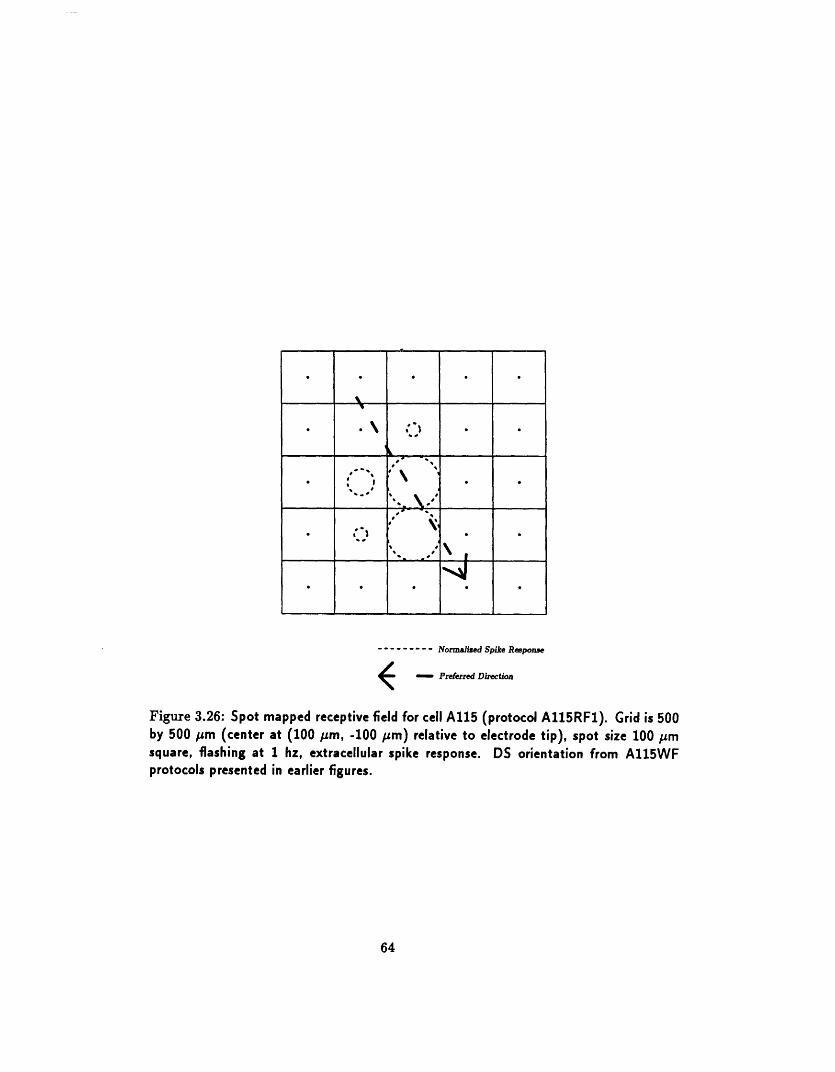
- . ...... Normalized Spike Response
Preferred Direction
Figure 3.26: Spot mapped receptive field for cell A115 (protocol A115RF1). Grid is 500by 500 m (center at (100 m, -100 m) relative to electrode tip), spot size 100 msquare, flashing at 1 hz, extracellular spike response. DS orientation from A115WFprotocols presented in earlier figures.
64
* *\ : I
· . . \ .. .
· · · I
f
Chapter 4
A Model of RetinalDirectional Selectivity
Models for retinal directional selectivity have proposed various locations forthe asymmetric path, delay elements, and non-linear interactions requiredfor this computation, as we discussed in Chapter 2. The experimental resultsof the previous chapter add some constraints, namely that all these elementsmust occur prior to the DS ganglion cell, which, in turn, apparently receivesDS excitatory input.
We now present a pre-ganglionic model for DS which is morphometricl-similar to Vaney's' ([66], [64]) in that 'the lateral pathway is via individualbranches of amacrine cells with tip outputs [12]. We find as well that given aplausible set of constraints on a) the distribution and biophysics of synapticinput and output on the branches and b) the intrinsic cable properties, theoutputs of this pathway are at least DD and normally are DS. Thus, both thelateral path and the non-linear interaction underlying the DS computationoccur on the same substrate.
4.1 Oriented Amacrine Cell Branches with Di-rectionally Selective Outputs
The crucial DS element in this circuit is shown in Figure 4.1, and theanatomy of the asymmetric pathways and the target DS ganglion cell isshown in Figures 4.2 and 4.3. We suggest, as Vaney, that DS subunits arisefrom multiple oriented amacrine cell dendritic tips connecting to the DSganglion cell. In the context of retinal DS, the directional properties of a
65
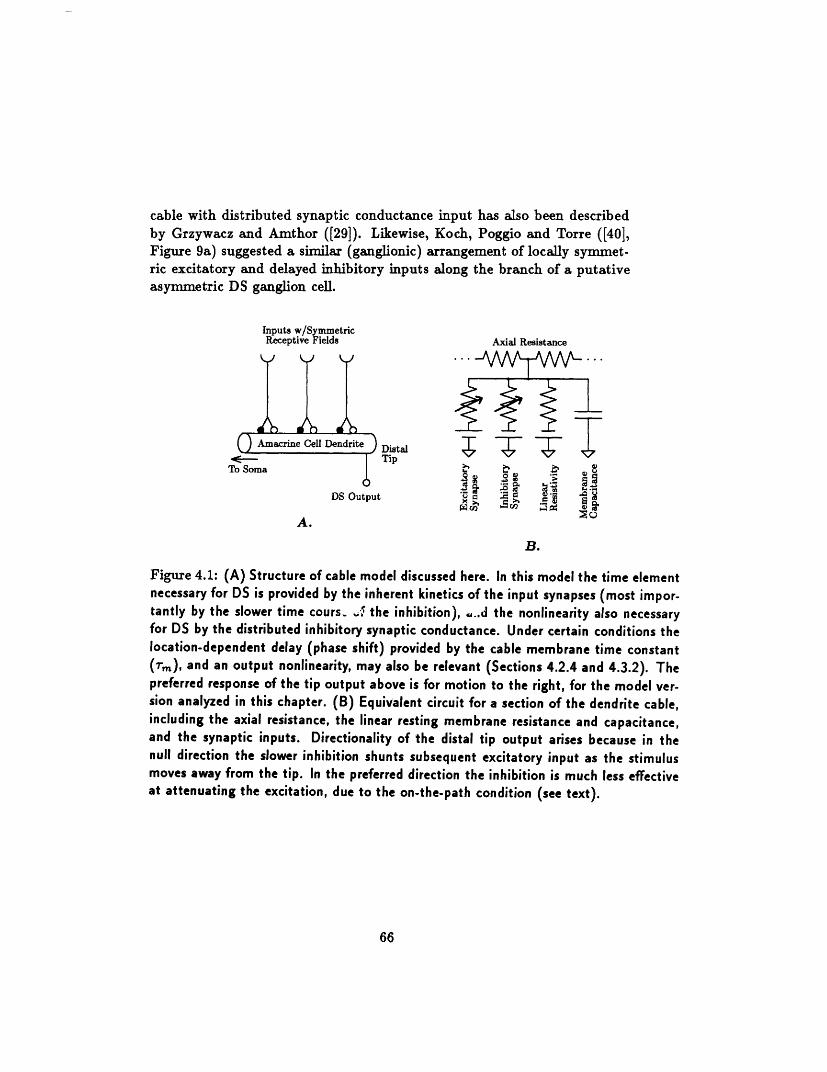
cable with distributed synaptic conductance input has also been describedby Grzywacz and Amthor ([29]). Likewise, Koch, Poggio and Torre ([40],Figure 9a) suggested a similar (ganglionic) arrangement of locally symmet-ric excitatory and delayed inhibitory inputs along the branch of a putativeasymmetric DS ganglion cell.
Inputs w/SymmetricReceptive Fields Axial Resistance
Amacrine Cell Dendrite DistalTip
DS Output v f "'
A.
B.
Figure 4.1: (A) Structure of cable model discussed here. In this model the time elementnecessary for DS is provided by the inherent kinetics of the input synapses (most impor-tantly by the slower time cours ,.-E the inhibition), ..d the nonlinearity also necessaryfor DS by the distributed inhibitory synaptic conductance. Under certain conditions thelocation-dependent delay (phase shift) provided by the cable membrane time constant(rm), and an output nonlinearity, may also be relevant (Sections 4.2.4 and 4.3.2). Thepreferred response of the tip output above is for motion to the right, for the model ver-sion analyzed in this chapter. (B) Equivalent circuit for a section of the dendrite cable,including the axial resistance, the linear resting membrane resistance and capacitance,and the synaptic inputs. Directionality of the distal tip output arises because in thenull direction the slower inhibition shunts subsequent excitatory input as the stimulusmoves away from the tip. In the preferred direction the inhibition is much less effectiveat attenuating the excitation, due to the on-the-path condition (see text).
66
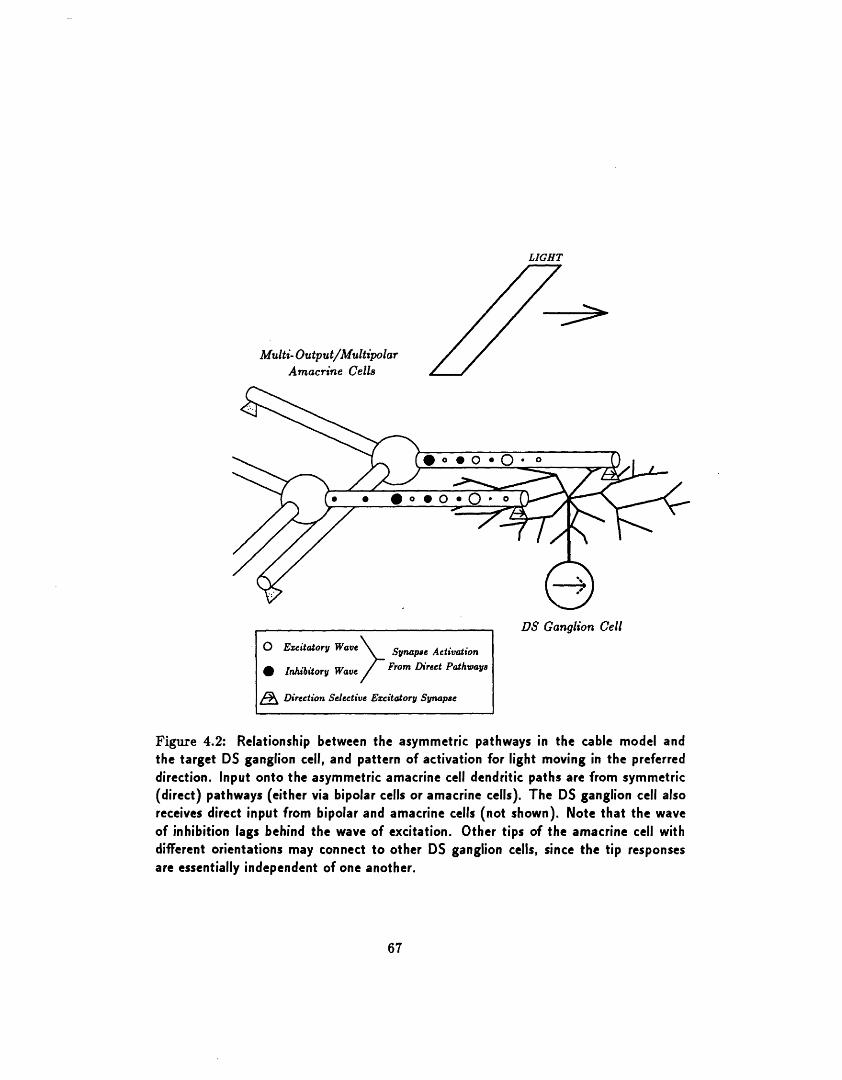
LIGHT
Multi- Output/MultipolarAmacrine Cells
DS Ganglion Cell
Figure 4.2: Relationship between the asymmetric pathways in the cable model andthe target DS ganglion cell, and pattern of activation for light moving in the preferreddirection. Input onto the asymmetric amacrine cell dendritic paths are from symmetric(direct) pathways (either via bipolar cells or amacrine cells). The DS ganglion cell alsoreceives direct input from bipolar and amacrine cells (not shown). Note that the waveof inhibition lags behind the wave of excitation. Other tips of the amacrine cell withdifferent orientations may connect to other DS ganglion cells, since the tip responsesare essentially independent of one another.
67
o Excitatory Wave Synapse Activation
* Inhibitory Wauve From Direct Pathways
Direction Slective Excitatory Synapse
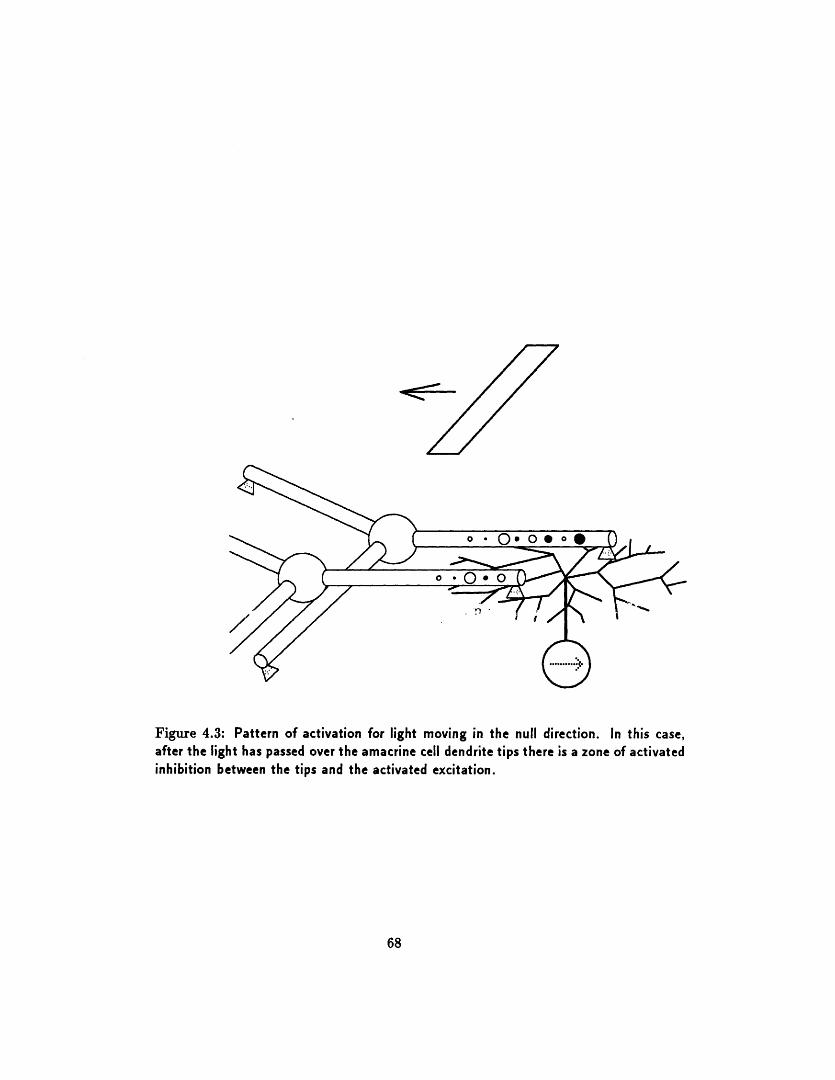
Figure 4.3: Pattern of activation for light moving in the null direction. In this case,after the light has passed over the amacrine cell dendrite tips there is a zone of activatedinhibition between the tips and the activated excitation.
68
4.1.1 Start by Finding the Asymmetry
Histological data from retina does not immediately suggest the spatial asym-metry required for directional selectivity, as mentioned in Chapter 2. How-ever, if we consider putative outputs on the dendritic tips of amacrine cells,the IPL becomes full of asymmetries, since for a large number of amacrinecells the tips are displaced with respect to the entire tree (see Section 5.7).This interpretation deviates from the assumption of classical neuronal polar-ity: input onto the dendritic tree, conducted proximally and integrated bythe soma membrane, cell output via the somatic axon. Some retinal neuronschallenge this dogma, and the distinction of dendrite versus axon becomesblurred. Many retinal cells do not have an axon at all per se, and single cellprocesses may have both input and output.
As Vaney pointed out, detailed studies of starburst amacrine cell den-drites support this potential asymmetry for the rabbit retina ([26], [25], [65],[62]). Small swellings in the outer third of the dendritic tree have been de-scribed, and electron micrographs show that synapses with ganglion cellsoccur in the swellings' zone [14]. In contrast, the general distribution ofsynaptic inputs along the dendrites is apparently uniform1 .
It should be emphasized that the critical asymmetry in this model re-quires inputs all over the amacrine cell dendrite branch and outputs near thetip. There is no restriction on outputs elsewhere on the branch, however,and she most general version of the model would have unifo-i 'liputs andoutputs over the entire amacrine cell dendritic tree. On the other hand, onlya subset of those outputs will have strong DS properties, and an assumptionof the model is that a given target DS ganglion cell will receive at leastsome of the outputs from this subset. This problem will be addressed inSection 5.5.
4.1.2 Add Location Dependence
The morphometric asymmetry is necessary for directional selectivity, butnot sufficient. If the dendrite branch is isopotential then there is no location
'It should be pointed out that there is conflicting support for the starburst amacrinecell specifically in the DS circuit for rabbit. For example Linn and Massey [43] suggestthat cholinergic release from starburst cells is not inhibited directly by GABA, which iscontrary to the model prediction. However, other amacrine cells may have the necessaryinput/output relationship. Later we shall show simulations of a cell whose morphometryis based on the starburst cell; despite the evidence against the starburst cell specifically,we feel that the conclusions from this tree geometry are applicable to other amacrine cells.
69
dependence of branch input, precluding any sort of motion selectivity, muchless directional selectivity. When we add the intracellular resistance of thecable, however, then location dependence results.
4.1.3 Directional Dependence for the Linear Case
Let us now examine the response of the cable tip to moving inputs. Webegin with the simplest case: distributed excitatory synaptic input ontothe (linear) cable. If the synapses are modelled as current sources, e.g.the excitatory synapse injects a depolarizing current, then the tip responsecan be obtained by the appropriate superposition of responses to individualinputs. The resulting waveforms for motion in the two directions will havedifferent shapes, but, since the system is linear, equal areas.
As simulations by Rall demonstrated implicitly ([56]), we now have inthe dendrite cable the prerequisites - location dependency and asymmetry -for DD (but not DS). Accentuating the difference is the location-dependentdelay of the cable (due to the cable time constant). This delay tends to in-crease the output amplitude for motion towards the tip; the EPSPs arrivingat the tip are more correlated since the cable delay (phase shift) countersthe motion delay. Otherwise the two waveforms would simply be reversedin time. We shall return to this phenomena later in the simulations section(Section 4.3.2).
Now we assume that at each point on the cable there is a paired exci-tatory/inhibitory input, with the inhibitory kinetics slower than that of theexcitation 2. Again, if the inhibitory synapse is modelled as a hyperpolar-izing current source the (linear) responses for the two directions will haveequal area. The DD response holds, still without DS.
4.1.4 Synaptic Nonlinearities and Cable Directionality
Synaptic input, however, is more accurately modelled by a conductancechange in series with a battery. The circuit is now a nonlinear one: thevariable conductance of the inputs means that motion responses cannot bederived from the superposition of a sequence of point responses. As a resultthe integral of the response for the two directions is generally not conserved.
The effect of the inhibitory input is particularly important on the direc-tionality of the cable tip response. Assuming that the reversal potential for
2 Note that if the excitatory and inhibitory kinetics were identical, then synapses at thesame location could be lumped together as one.
70
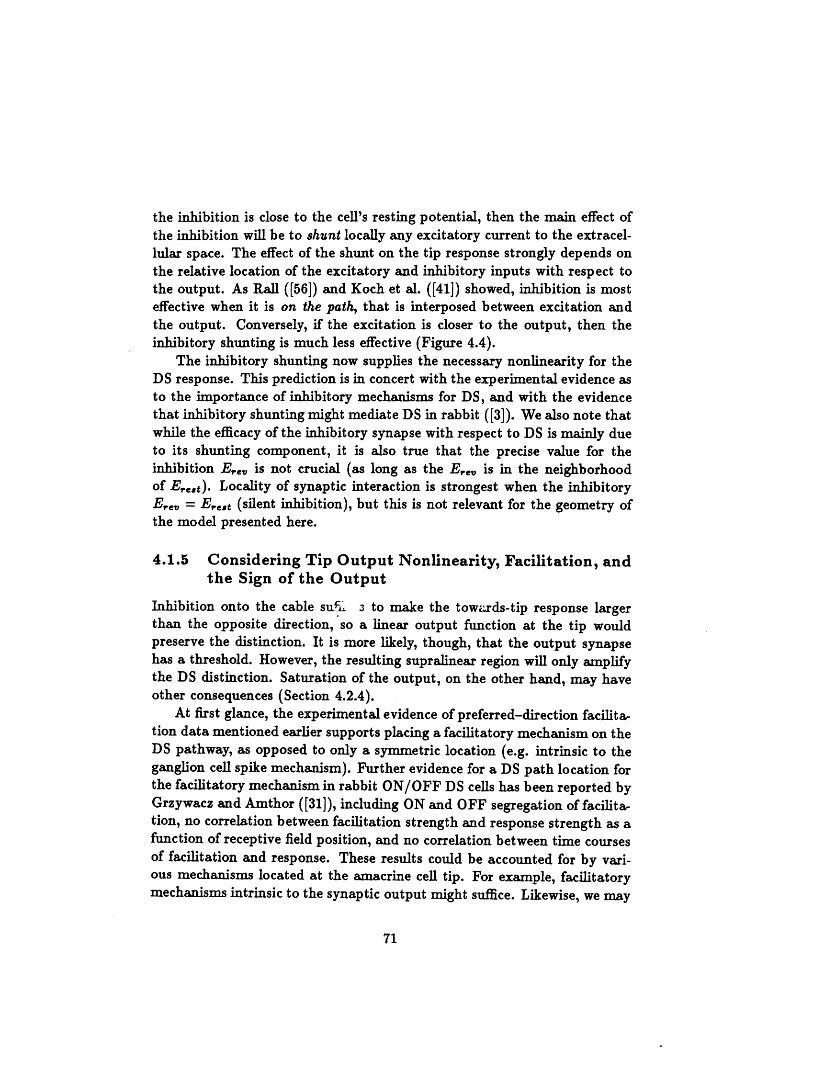
the inhibition is close to the cell's resting potential, then the main effect ofthe inhibition will be to shunt locally any excitatory current to the extracel-lular space. The effect of the shunt on the tip response strongly depends onthe relative location of the excitatory and inhibitory inputs with respect tothe output. As Rall ([56]) and Koch et al. ([41]) showed, inhibition is mosteffective when it is on the path, that is interposed between excitation andthe output. Conversely, if the excitation is closer to the output, then theinhibitory shunting is much less effective (Figure 4.4).
The inhibitory shunting now supplies the necessary nonlinearity for theDS response. This prediction is in concert with the experimental evidence asto the importance of inhibitory mechanisms for DS, and with the evidencethat inhibitory shunting might mediate DS in rabbit ([3]). We also note thatwhile the efficacy of the inhibitory synapse with respect to DS is mainly dueto its shunting component, it is also true that the precise value for theinhibition E,ev, is not crucial (as long as the E,,, is in the neighborhoodof Er,et). Locality of synaptic interaction is strongest when the inhibitoryE,, = Eret (silent inhibition), but this is not relevant for the geometry ofthe model presented here.
4.1.5 Considering Tip Output Nonlinearity, Facilitation, andthe Sign of the Output
Inhibition onto the cable suF 3 to make the towards-tip response largerthan the opposite direction, so a linear output function at the tip wouldpreserve the distinction. It is more likely, though, that the output synapsehas a threshold. However, the resulting supralinear region will only amplifythe DS distinction. Saturation of the output, on the other hand, may haveother consequences (Section 4.2.4).
At first glance, the experimental evidence of preferred-direction facilita-tion data mentioned earlier supports placing a facilitatory mechanism on theDS pathway, as opposed to only a symmetric location (e.g. intrinsic to theganglion cell spike mechanism). Further evidence for a DS path location forthe facilitatory mechanism in rabbit ON/OFF DS cells has been reported byGrzywacz and Amthor ([311), including ON and OFF segregation of facilita-tion, no correlation between facilitation strength and response strength as afunction of receptive field position, and no correlation between time coursesof facilitation and response. These results could be accounted for by vari-ous mechanisms located at the amacrine cell tip. For example, facilitatorymechanisms intrinsic to the synaptic output might suffice. Likewise, we may
71
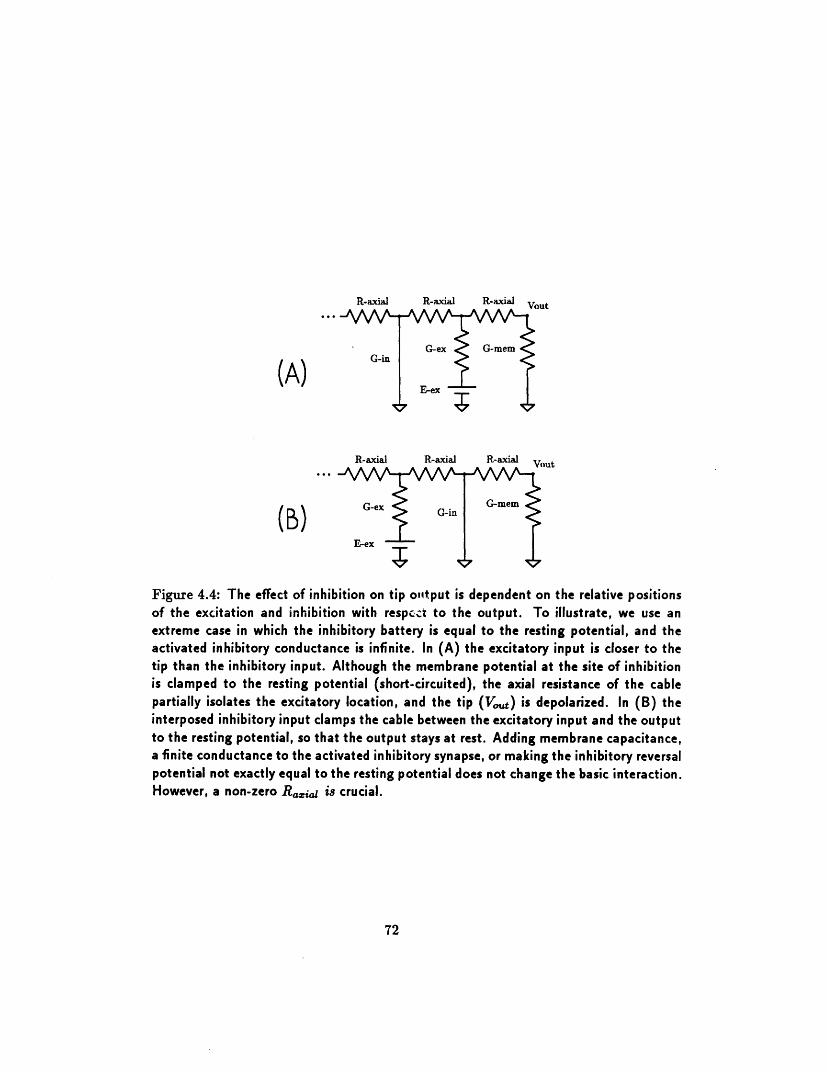
R-axial R-axial R-axial v,,*
(A)
R-axial R-axial R-axial Vout
( B ) G- o G Smem
Eex
Figure 4.4: The effect of inhibition on tip output is dependent on the relative positionsof the excitation and inhibition with respcct to the output. To illustrate, we use anextreme case in which the inhibitory battery is equal to the resting potential, and theactivated inhibitory conductance is infinite. In (A) the excitatory input is closer to thetip than the inhibitory input. Although the membrane potential at the site of inhibitionis clamped to the resting potential (short-circuited), the axial resistance of the cablepartially isolates the excitatory location, and the tip (V,,t) is depolarized. In (B) theinterposed inhibitory input clamps the cable between the excitatory input and the outputto the resting potential, so that the output stays at rest. Adding membrane capacitance,a finite conductance to the activated inhibitory synapse, or making the inhibitory reversalpotential not exactly equal to the resting potential does not change the basic interaction.However, a non-zero Raiaz is crucial.
72
Iuu
consider a voltage and time-dependent K+ channel at the tip which is nor-mally open at rest but slowly inactivates with depolarization, similar to theID channel identified in hippocampal pyramidal cells (see review by Storm[61]). The characteristics of this channel would cause the tip output to be"primed" by distant cable input, such that subsequent excitation near thetip (for motion in the preferred direction) would be unopposed by the now-inactivated K+ shunt. In Section 4.3.3 we show simulations of an apparentmotion protocol that demonstrates this particular facilitatory mechanism.
Two versions of this model include either that the amacrine DS outputforms an excitatory connection with a DS ganglion cell, or the connection isinhibitory. It is also possible to include plausible voltage and time dependentnonlinearities in the cable so that the preferred direction for the branchoutput is away from the tip. Also, the tip output may pass through sign-inverting bipolar cells or amacrine cells before the ganglion cell.
While any combination of the above polarities will yield a ganglion cellDS response, the fact that directional responses have been recorded in theabsence of GABAergic inhibition (Section 2.3.1) suggests that the DS path-way has an excitatory component at every junction. Further, the data de-scribed in Chapter 3, in particular with local block of GABAergic inhibitoryinput, supports the excitatory connectivity version. Also, simulations ofmodel cells with likely membrane parameters favor the preferred-towards-tip orientation for the cable output (Section 4.3 and unpublished data).
4.2 Predictions of the Model
We now consider testable predictions, namely that for somatic recordings ofamacrine and target ganglion cells.
4.2.1 Directionally Selective Somatic Recordings?
With respect to amacrine cells, the model predicts that moving stimuli cen-tered on the (somatic) receptive field would not elicit a directionality, as-suming a symmetrical dendritic tree. If either the stimuli or the dendritictree was asymmetric with respect to the soma, then a directional responsewould result, perhaps similar to the preganglionic DS/DD recordings of De-Voe et. al. ([23]). While this result supports the proposed mechanism forDS, it does not link the mechanism to an identified DS ganglion cell.
From the point of view of DS ganglion cell, the model predicts that theinput waveforms to the cell are themselves DS; any ganglionic computational
73
mechanisms will be inherently symmetric and serve only to refine the P/Nresponse properties. This result is in contrast with the ganglionic modelclass, in which the inputs are not DS by themselves.
4.2.2 Dependence of Directional Selectivity on Ganglion CellMembrane Potential
Differences in P/N EPSPs are predicted by the ganglionic model, but sincethe differences arise from ganglionic interaction of conductances with dif-ferent reversal potentials, this model predicts that the relationship betweenthe preferred and null EPSPs will depend on the membrane potential.
For example, let us consider the ganglionic AND-NOT circuit: Null di-rection response reflects a temporal overlap of the excitatory input withinhibitory (mainly shunting) input at the ganglion cell. Since the inhibitoryreversal potential might be near the rest potential, there would be little neg-ative portions in either the preferred or null response. A negative portionwould result if the membrane potential is artificially raised by injecting cur-rent. The "unmasked" IPSP would be expected to be more correlated withthe control EPSP in the null direction as compared to the preferred direction(e.g. [47]). If the ganglion cell was hyperpolarized by the electrode, the "un-masked" inhibitory input would now contribute a component to the EPSP.With sufficient hyper/depolarization the amplitude of the null response couldbecome greater than that of the pref.Txed response (see Figures 2.1 rd 2.2).
This result is in clear distinction to a pre-ganglionic model. The singlereversal potential of the ganglion cell DS inputs imply that the ratio ofthe preferred and null EPSPs is independent of the membrane potential:Manipulating the membrane potential will not reverse the P/N axis.
4.2.3 Comparing Total Synaptic Input for the Preferred/NullResponses
The above result is related to measuring the somatic input conductance,GIn(S, t), of the ganglion cell during a motion stimulus S(z, t). For a lumpedcell approximation and no voltage-dependent membrane, predictions aboutGIn(S,t) are simple. In the ganglionic model, the only difference in theinputs for the preferred versus null responses is in their timing. Thus themodel predicts:
I Gin(S(, t))= GIn(S(-Zt))
74
where S(z,t) and S(-z,t) are stimuli moving in the preferred and nulldirections, respectively. On the other hand, for the pre-ganglionic modelthere is more synaptic input for one direction versus the other; therefore(assuming the lumped cell without voltage dependencies):
f GI(S(X t))> f GI(S(-d t))
for a pre-ganglionic excitatory DS input model, and
| GI(S(], t)) <| G(S(-xpt))
for a pre-ganglionic inhibitory DS input model. An advantage of comparingthe integrals of GI, for the preferred and null stimuli is that the effect ofthe membrane capacitance may be ignored. It can be shown that undersome constraints on the ganglion cell and the experimental protocol, similarrelationships are testable even with distributed inputs on dendritic trees andvoltage dependent membrane.
4.2.4 Dynamic Range of Cable Mechanisms: Saturation andReversal of Directional Selectivity
Real biophysical mechanisms saturate, e.g. a supralinear transfer functionwill not stay supralinear for unbounded inputs. We now consider possibleimplications of saturation on the performance of the model.
Saturation of an input synaptic conductance onto the cable will notchange the basic distinctions between the preferred and null waveforms, sincethis saturation is independent of stimulus direction. Saturation (strictlyspeaking, a sublinear region) of the output nonlinearity can have quite dif-ferent effects: for strong enough cable excitation the null waveform, withits greater temporal support (due to cable rm spreading out the synapticpotentials), will eventually yield a final output that is equal to the preferredoutput, despite the larger amplitude of the preferred waveform. Increasingexcitation further could cause a reversal of the P/N orientation, after theoutput nonlinearity. This might be observed, for example, with a stimuluscontrast that is normally DS, but under conditions in which inhibition isreduced or blocked (e.g. with pharmacological manipulations). WhetherDS would be entirely eliminated or reversed would be dependent on circuitand stimulus parameters.
This result is unique to models in which the DS asymmetry includesdistributed excitatory input with relative delays along the P/N axis. Such
75
models been explored theoretically for the interpretation of DS reversal infly ([54]), and in Section 4.3.2 we show simulations which demonstrate thiseffect.
4.3 Simulations of Morphometricly and Biophys-ically Detailed Amacrine Cell Models
To investigate neuronal properties which are pertinent to the cable model,we have run simulations of amacrine cells. The model parameters are as con-strained as possible; morphometry is obtained from histological data in theliterature, and membrane properties are either inferred from experimentaldata and/or supported by theoretical studies of other cells ([9]).
An important aspect of these simulations is that dynamic retinotopicstimuli may be used as input to the model circuit. Since the simulatormaintains the 3-dimensional structure of the cells, it is straightforward tointerpret model response to realistic arbitrary stimuli (Appendix C).
4.3.1 Simulations of Asymmetric Responses from SymmetricCells
In Figures 4.5 through 4.7 we show a simulation of an amacrine cell whosemorphometry is taken from a rabbit starburst amacrine cell ([62]). All meim-brant amt. cable properties are uniform, including specific capacitance (Cm),membrane resistivity (R,), intracellular resistivity (Ri), excitatory synapticdensity (G,,), and inhibitory synaptic density (Gin). R, and Ri are fixedat 100Kfcm2 and 200cm ([58]), respectively. Cm is set to 1.0 F/cm2
(rm = 100mS), Gin, is set to 100pS/pm2, and G,, to lpS/pm2. The restingpotential for the cell is -70mV. The reversal potentials for the excitatoryand inhibitory synapses are 50mV and -70mV, respectively. No voltage-dependent membrane is included.
The synaptic transfer functions are fixed. The excitatory input responseis given by the half-wave rectified convolution of the light stimulus by thedifference of two alpha functions, a,(t),
a1 (t)= t et/
the first with a r of 10 mS and the second with a 7 of 60 mS. This transientresponse is typical of retinal ON response to a flashing stimulus. The in-hibitory response is the half-wave rectified convolution of the light stimulus
76
with a single alpha function of unit area and r = 100 mS. This sustainedON response approximates the time course for inhibition to various stimuli[2]. Adding an OFF component to the transfer functions does not changethe motion-dependent behavior. For simplicity the spatial impulse responsefor both synapse types is 6(x, y), although the receptive field of candidatebipolar or amacrine cell outputs are on the order of tens to hundreds ofmicrons wide. Since spatial properties derive from the successive convolu-tion of each circuit element, minimizing the intrinsic spatial spread of theamacrine input yields an upper bound on overall spatial resolution of theDS dendrite structure.
The large value for Rm is consistent with values measured in our lab andothers in various neurons using the whole cell patch technique (e.g. [19]).Synaptic conductance densities and kinetics are less constrained as far as theliterature is concerned; the range of values we have chosen produce synapticpotentials which are consistent with available data.
In Figure 4.6 we show the response of the soma and a distal node to abar moving across the entire field of the cell. The soma response is almostidentical for opposite motions, while the tip response is highly DS. In Figure4.7 we have plotted the total response of each dendritic tip of the cell, scaledby stimulus speed, as a function of angle off the soma, for a slit travelingacross the entire breadth of the cell. Despite the overall symmetry of thecell, this functional is highly directional.
4.3.2 Parametric Simulations of Cable Mechanisms
In this section we present a series of simulations on a simple cell model(chosen to allow rapid parametric simulations) to illustrate how the differentmechanisms in the dendrite cable interact. The basic structure of this modelis a 1-dimensional symmetrical cell with two opposing unbranched processes(Figure 4.8). Cell membrane and synaptic parameters are identical to thesimulated cell in Figure 4.5, except as follows: We shall vary Cm (1.0 and1.0- 5 F/cm2, or rm = 100ms and 0.001 ms) 3 , and Gi, (100, 10, 1, 0.1,and 0 pS/pm2). The goal here is to see how directionality depends on theinhibitory input versus the intrinsic cable delay properties.
As before, the stimulus is a moving slit, 50pm wide, now with velocitiesof 0.5, 1, 2, 4, 8, and 16 gm/msec. The response waveforms from therighthand distal tip for rightward and leftward motion will be compared.
3A C, of 0 iAF/cm2 was not possible due to the integration technique of the simulator.
77
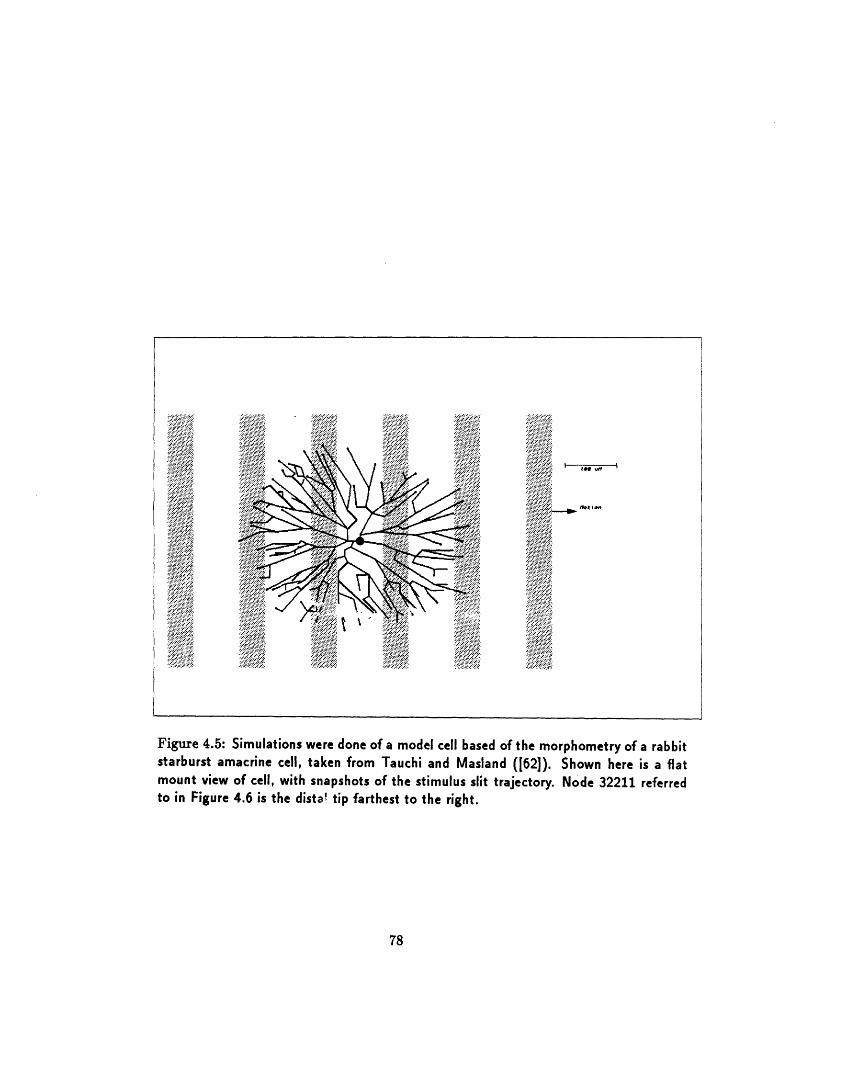
. .--:
-. e ,~ . u:,.. , ~n
..~~ ·:.<~:.-:
·oto
.~.~" ,~,-
Figure 4.5: Simulations were done of a model cell based of the morphometry of a rabbitstarburst amacrine cell, taken from Tauchi and Masland ([62]). Shown here is a flatmount view of cell, with snapshots of the stimulus slit trajectory. Node 32211 referredto in Figure 4.6 is the dista! tip farthest to the right.
78
jgyqh·�i�
����
�;·%·�:·�·�
·�:··lz
�ii�
�·�;;'"�:·
:�;�:···��""�-�;���·i.
�j�i�i��I��
In particular, we shall compute a directional index (DI) (after [32]) forboth the linear integral of the waveforms and the integral of the waveformsafter being passed through a sigmoidal nonlinearity (representing synaptictransmission):
DI = f(Vp) - f f(VN)f f(Vp+ f f (VN)
DI = -1 DI= 0 DI = 1
Strongly Selective for VN No Directionality Strongly Selective for Vp
(Motion Away From Tip) (Motion Towards Tip)
where f() is either the identity (•= DI(Average)), or the sigmoidal nonlin-earity shown in Figure 4.12 (= DI(Sigmoid Average)). Vp is the voltagewaveform for the distal tip for light moving toward the tip, and VN is thewaveform for the opposite direction.
As shown in Figures 4.11 and 4.12, the "normal" directionality of the tipoutputs (DI > 0) is strongly dependent on the presence of inhibition. How-ever, if a nonlinear functional is applied to the tip waveform, the distributednature of the cable without inhibition generates a directional response, al-though it is much weaker than the control case. In addition, the particularnonlinearity and other model paramete. nF'-ure 4.12 causes a DI reversalwhen inhibition is blocked. As illustrated in Figures 4.9 and 4.12, the abilityof a nonlinear integrator to make this distinction depends on the delay pro-vided by the cable capacitance, since a time delay is a necessary conditionfor DS (or DD). This prediction is consistent with the experimental resultscited earlier for turtle and fly.
4.3.3 Simulations of Facilitation by an Inactivating K + Chan-nel
Apparent motion protocols consisting of two stimuli in the sequence X - Ycan be used to evaluate how the relative position of X and Y affects theresponse to Y, compared to the response to Y alone. In a DS system, eitherX must reduce the Y response, when the sequence is in the null direction,and/or X must enhance the Y response for the preferred direction sequence.As mentioned in Chapter 2, both the former (null direction inhibition) andthe latter (preferred direction facilitation) have been observed.
79
In Figures 4.13 and 4.14 we show a simulation of apparent motion forthe starburst amacrine cell presented earlier. The cell parameters are iden-tical to before, except that an inactivating K+ channel (as mentioned inSection 4.1.5) was included in the distal portions of the tree. In Figure 4.14the response of the second stimulus is strongly affected for motion in bothdirections.
4.3.4 Accounting for the Anomalous Area Response
As mentioned in Section 2.4 Barlow and Levick reported a subregion of theDS ganglion cell's spot receptive field in which preferred and null responseswere similar. This subregion lay on the spot receptive field edge from whichpreferred motion originated. Since both directions give a response, the sim-plest explanation is that the receptive field of the DS sub-circuit also hasan "anomalous area", which is recapitulated by the ganglion cell. For a rea-sonable set of parameters our model predicts such an area for a particularmorphological class of amacrine cells: those amacrine cells whose individualbranches have orthogonal mates (e.g. stellate and starburst morphologicaltypes).
Consider the response of a tip output of such a cell to the followingstimulus: a moving bar whose length is greater than the threshold spotdiameter for motion, and whose trajectory is over some fraction of the cell'sdendrioic field, along the preferred/ null axis of the blt. Movement overthe distal third of the tree adjacent to the output gives the expected DSwaveform. Movement over the distal third on the other side of the somaproduces a much weaker, perhaps nil, response, due to the distance and theintervening somatic load. However, movement centered over the soma wouldproduce a more nearly equivocal set of preferred and null responses. Thisis because the bar passes activates synapses on dendrites with a trajectorythat is orthogonal to those dendrites' preferred/null axes. These branchesget activated almost all at once as the bar sweeps over the soma. Theresulting bolus of excitatory current might by strong enough to generate atip response, despite the cable attenuation.
4.3.5 An Asymmetric Substrate for Non-Linear InteractionsAvoids Preferred Direction Inhibition
As described in Section 2.4.1, putting a synaptic vetoing mechanism onto asymmetric ganglion cell dendritic tree has the problem of preferred direction
80
inhibition for motion over the side of the receptive field that lies towardsthe preferred direction. In these models there is a tradeoff that depends onthe duration of the inhibitory response: the longer the response, the widerthe null velocity bandwidth, but also the greater the preferred directioninhibition. The model described here does not have this tradeoff, since theintegrating substrate (the single amacrine cell dendrite) is asymmetric. Theimportant signal flow is always in one direction (towards the dendrite tip).For a single spot, there is no velocity nor duration of inhibitory kinetics suchthat preferred direction motion will elicit residual (interposed) inhibitionthat can interfere with excitation.
4.4 Summary
We have presented a model for directional selectivity in retina whose anatom-ical structure and simulated performance is consistent with the data. Thecrucial elements for directionality are as follows:
* Asymmetric input to output distribution on the DS amacrine cell den-drite pathway.
* Intracellular resistivity of the dendrite cable allowing on-the-pathinteractions which, in turn, depend on stimulus direction.
· Inhibitory nonlinear shunting of sufficient duration to mask subsequentproximal excitation of the distal tip output.
Further, we have showed that other cable mechanisms may generatetestable predictions unique to this model.
81
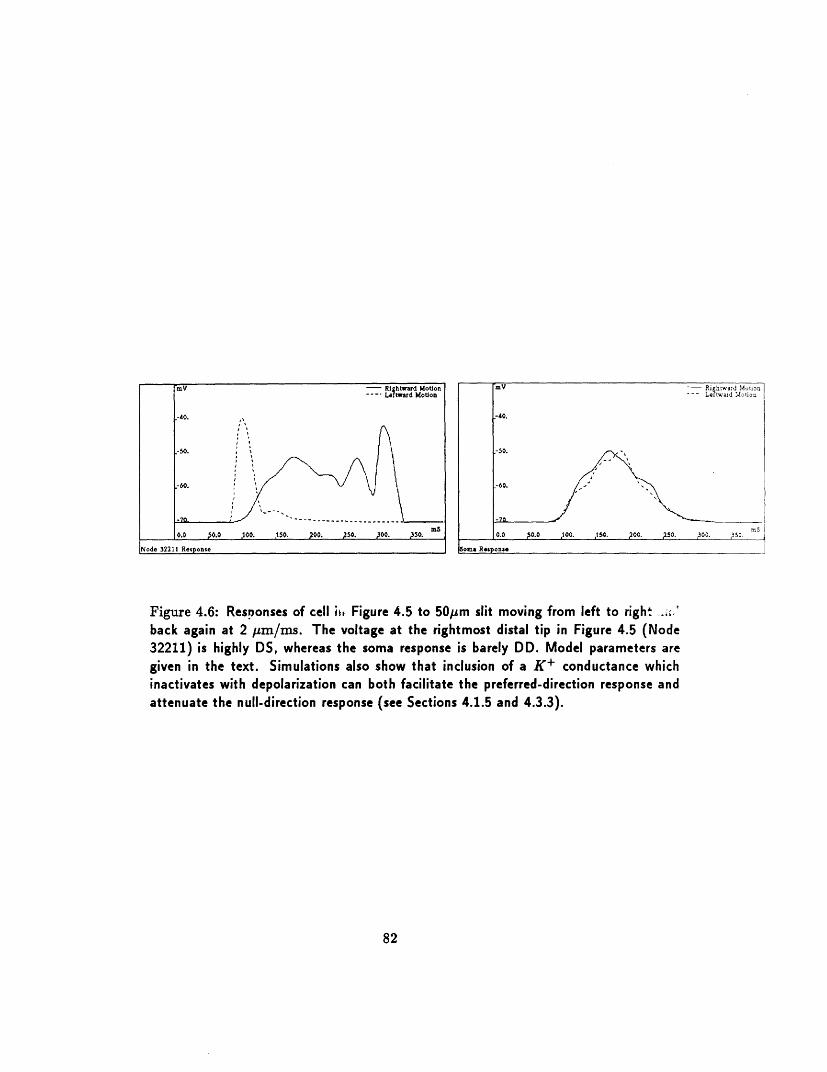
Figure 4.6: Resoonses of cell i Figure 4.5 to 50pm slit moving from left to right .:'back again at 2 prm/ms. The voltage at the rightmost distal tip in Figure 4.5 (Node32211) is highly DS, whereas the soma response is barely DD. Model parameters aregiven in the text. Simulations also show that inclusion of a K+ conductance whichinactivates with depolarization can both facilitate the preferred-direction response andattenuate the null-direction response (see Sections 4.1.5 and 4.3.3).
82
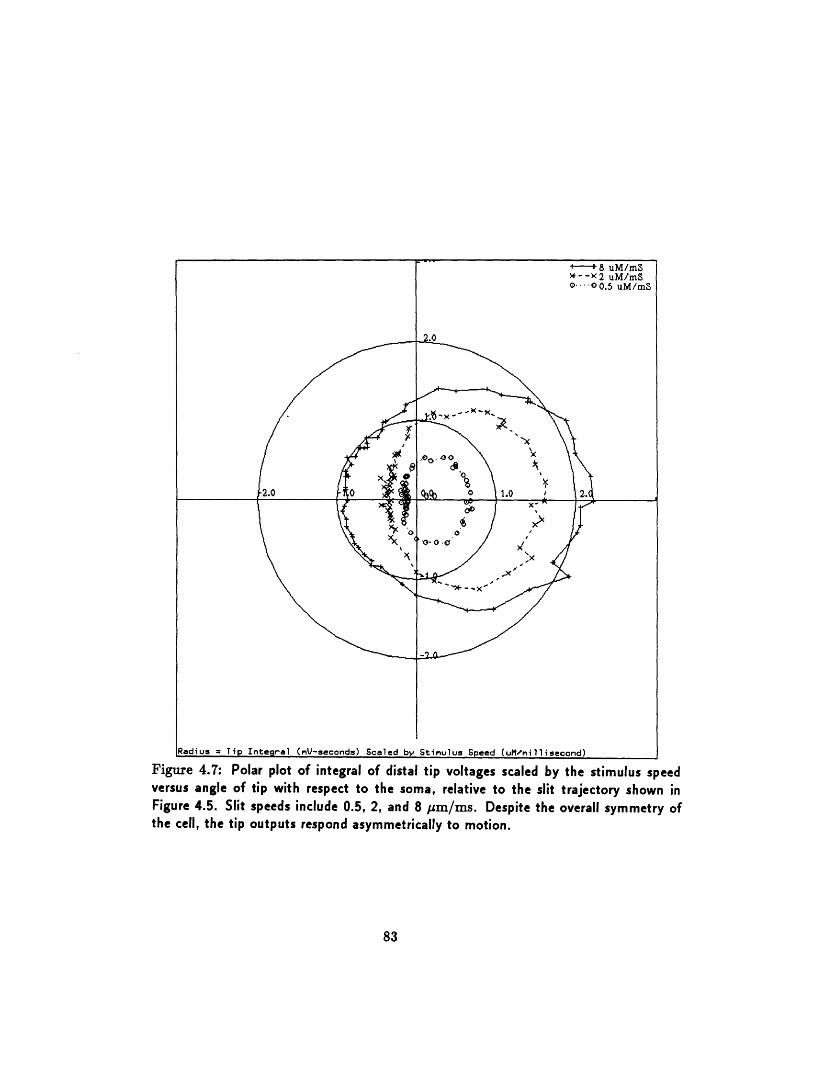
Figure 4.7: Polar plot of integral of distal tip voltages scaled by the stimulus speedversus angle of tip with respect to the soma, relative to the slit trajectory shown inFigure 4.5. Slit speeds include 0.5, 2, and 8 m/ms. Despite the overall symmetry ofthe cell, the tip outputs respond asymmetrically to motion.
83
J
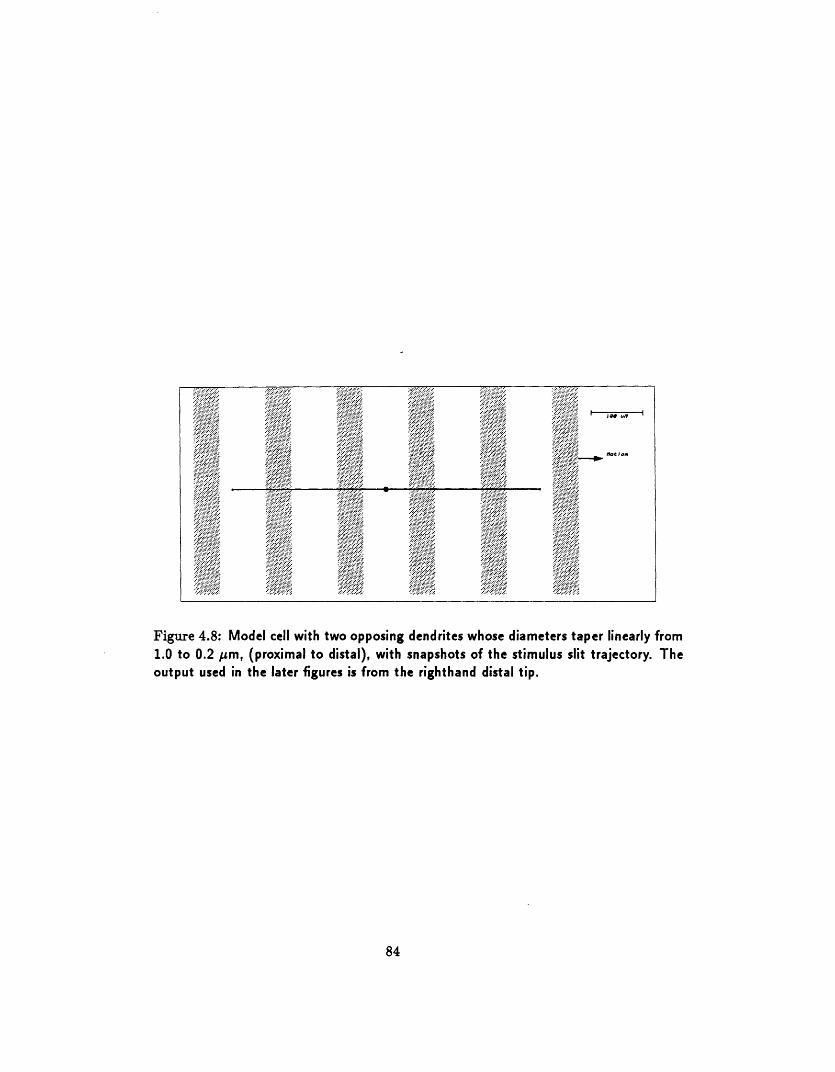
Figure 4.8: Model cell with two opposing dendrites whose diameters taper linearly from1.0 to 0.2 m, (proximal to distal), with snapshots of the stimulus slit trajectory. Theoutput used in the later figures is from the righthand distal tip.
84
, ., ...... , .......... ........ ..... .: ; *. or I...
��E :�;��·�:··�·� -b��j�c.i.-.-· :r � ··�'�ca W�� ��-····:,···s-�'" :s:2·�� Iw on
1� 'a�l-�
··-� �-��-�i.
�" � �-�? iRs· rrotrorr�"":'r�,�c
r��i�i'-' �i-�,,
·-. �i:�i�A��.t .���c�r �
�i�ii ·c·�:r� --���rr·- .�� ��h��l·ii�Q i·�·�·�:a�"�� ��ibF
�i� ��a��" r� ��
-�:·� ""'..;..";i�i�c�
�j�.�···.··I.· -�-�··�.··r�r-�
�! �i�i��i �·i�·':'i·: �i�i�:::: �:��Mxl��: :�i� ···� r�*
:·�:·�:�;i�c·�-··�
� i"��
i�i�j
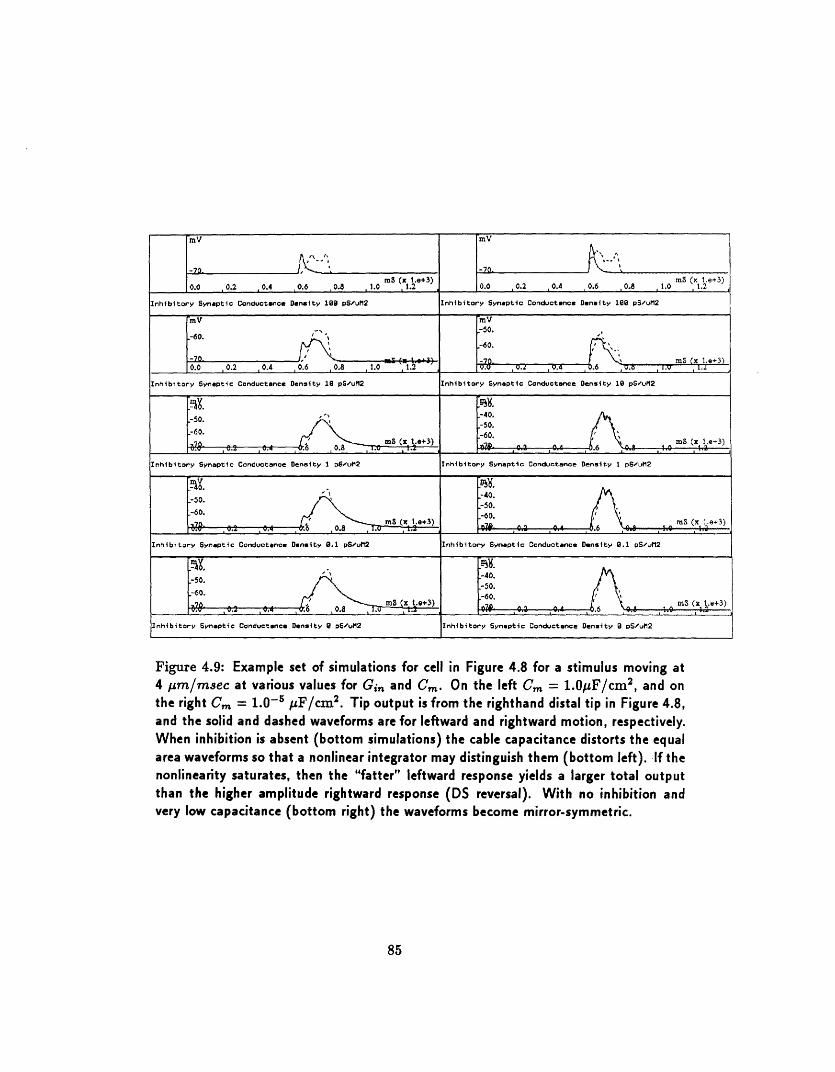
-mV mV
Lv _ _ _ _ _ -70 _ _ __ ____ms ( 1 .e+3) mS (x .e 3)
0.0 ,0.2 ,0.4 ,0.6 .0.8 1.0 1, 2 0.0 0.2 0.4 0.6 0.8 ,1.0 1.2
Inhibitory Synaptic Conductance Density 10 pS/uM2 Inhibitory Synaptic Conductance Density 1 pS/un2
-m V 'mV-50.
[~~~~~~~~~80 ~ ~ ~ ~ ~ ~ ~..-60._700 Ms0.0 , 0.2 0.4 0.6 0.8 .0 1.2 _.. . 4 .6
Inhibitory Synaptic Conductance Density 10 pS/uM2 Inhibitory Synaptic Conductance Density 10 pSuMI2
' -40.-50. ' O ,v~~~.:40.v~~~~~~~ ~-50.
_-60._ _ _ _ _ .6 0. 8 , . _ 1 ^.6
Inhibitory Synaptic Conductance Density 1 p/uM2 Inhibitory Synaptic Conductance Density 1 puM2na
·- '~ ~ '-40.-50.
-60,-6 0.8 mS (x i~e+60 mS (x 1.e+3)
_0_\ _ __ _ _ __ ___ 1 .60
Inhibitory Synaptic Conductnce Dnasity .1 pSuM2 Inhibitory Synaptic Conductance Density 9.1 pS/ut2
-nibo.y ,Synaptic C.nductanc _nsity , , , 4 A.2 .nibty Snptic odu c D y 9 40.50. .-60. ;60.
1,nhibitorv Syneptic Cnductance Density pS/uH2 Inhibitory Syrptia Cnductance Denity B S/M2
Figure 4.9: Example set of simulations for cell in Figure 4.8 for a stimulus moving at4 m/msec at various values for Gin and Cm. On the left C, = 1.OF/cm2 , and onthe right Cm = 1.0 - 5 sF/cm2 . Tip output is from the righthand distal tip in Figure 4.8,and the solid and dashed waveforms are for leftward and rightward motion, respectively.When inhibition is absent (bottom simulations) the cable capacitance distorts the equalarea waveforms so that a nonlinear integrator may distinguish them (bottom left). If thenonlinearity saturates, then the "fatter" leftward response yields a larger total outputthan the higher amplitude rightward response (DS reversal). With no inhibition andvery low capacitance (bottom right) the waveforms become mirror-symmetric.
85
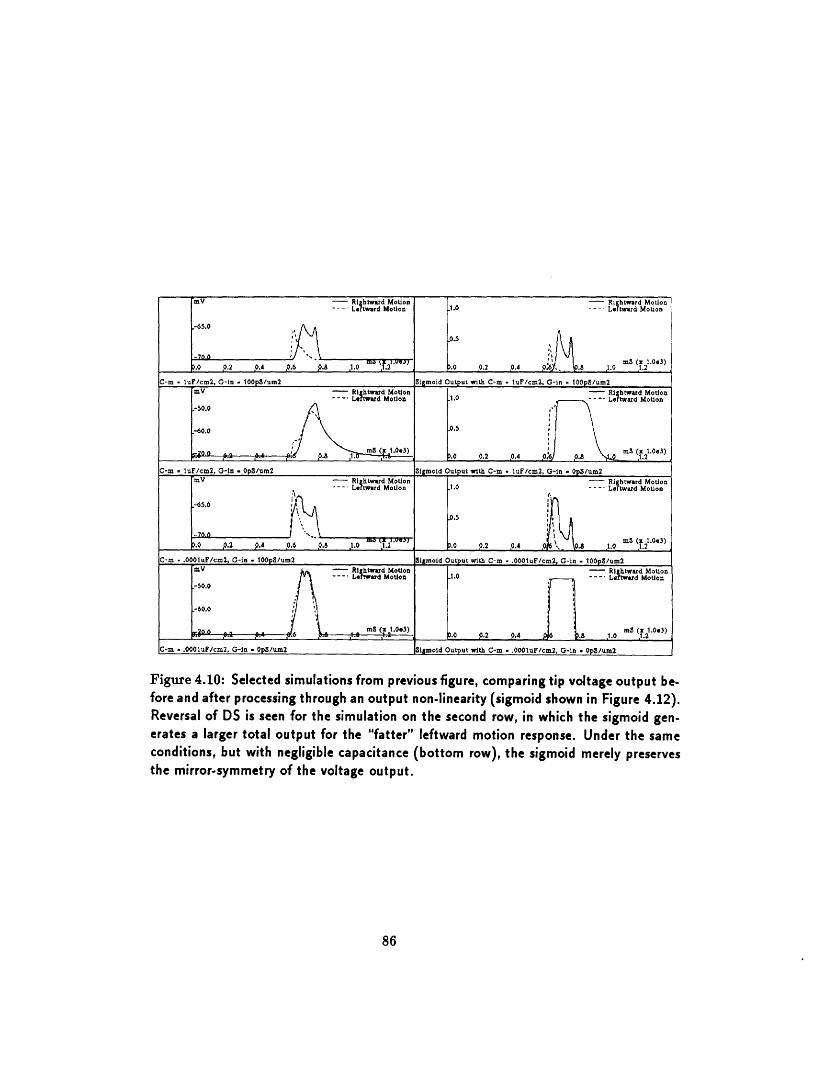
Figure 4.10: Selected simulations from previous figure, comparing tip voltage output be-fore and after processing through an output non-linearity (sigmoid shown in Figure 4.12).Reversal of DS is seen for the simulation on the second row, in which the sigmoid gen-erates a larger total output for the "fatter" leftward motion response. Under the sameconditions, but with negligible capacitance (bottom row), the sigmoid merely preservesthe mirror-symmetry of the voltage output.
86
mV - Ri htward Motion - Rightward Motion--- Ltard Motion 1.0 - Letwrd Motion
-6~~~~~~~~~~~~~~~~~~~.5.0
-7 I -Cm~ ~~~-n. ___________,. _ _ 9) .1.mlrS (x 1.0e3)
.0 9.2 ,.4 9.6 ,. 1. 0 1. 2 _ .o .2 0.4 , o .4 . 1.2
C-m luF/cm2, G-in 100pS/um2 Si moid Output with C-m .luF/cm. G-in 100pg/um2mV Rldhtward Motion Rightwrd Motion
-50 Ltud Motion 1.0 -- Leftward Motion-50.0
-60.0 _0.5
,-20.° 1 °. S 'l \ (x1.0e3)* . . mS (x 1.0.3) 0.0 0.2 0.4 ,0/ ,08 1. 2
C-m · luF/cm2, G-in -OpS/um2 Sigmoid Output with C-m luF/cm2, G-in , OpS/um2'mV -Rlghtward Motion Rightward Motion
-65 - Lettward Motion 1.0 h--- Leftward Motion
-65.0
i.O .0.2 ,0.4 ,.6 9.8 .1.0 1.2 , .2 .4 0 . .1.03)
_ _ _ _ _ _ _ _ _ _ _ _ _ _ _ . 0 9.2 0.4 , 1.0.)2
C-m .OuF/cm2, G-in - 100p/um2 Sigmoid Output with C-m - .000uF/cm2, G-in - 1OpS/um2mV -A Rlhtwrd Motion Rlghtward Motion
--- Lefrrd Motion .0 --- Lftward Motion-0.0
-60.0 .
[·0.zoo. ms ( 1.0e3) r Cx 1.0.3),. . 6 ,.. .m .0 ' p.2 ,0.4 . .6 ,1.0 m ( )
-m -.0001uF/cr2, G-in - OpS/um2 Sigmoid Output with C-m .0001uF/cmn2, G-in - OpS/um2
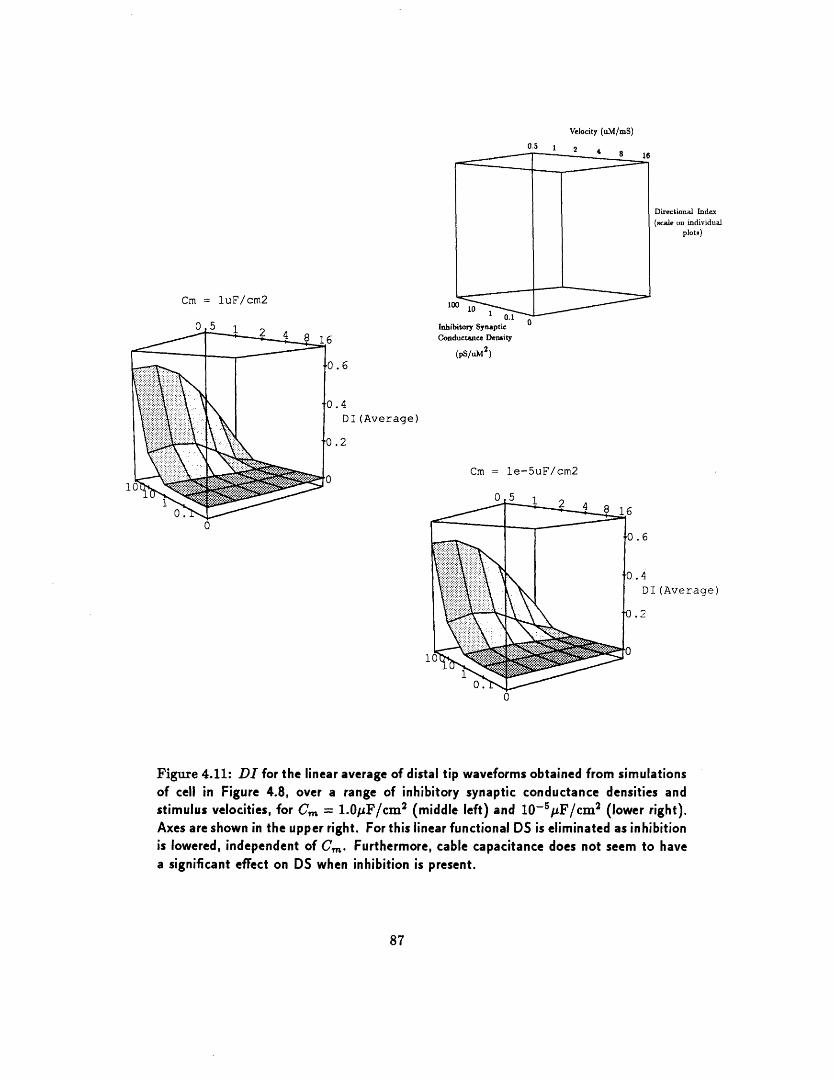
Cm = luF/cm2
Inhibitory Synaptic
Conductance Density
(p/uJ2)
.6
.4DI(Average)
.2
Cm = le-5uF/cm2
.6
.4DI(Average)
Figure 4.11: DI for the linear average of distal tip waveforms obtained from simulationsof cell in Figure 4.8, over a range of inhibitory synaptic conductance densities andstimulus velocities, for Cm = 1.0pF/cm2 (middle left) and 10-5pF/cm 2 (lower right).Axes are shown in the upper right. For this linear functional DS is eliminated as inhibitionis lowered, independent of Cm. Furthermore, cable capacitance does not seem to havea significant effect on DS when inhibition is present.
87
Velocity (uM/mS)
Directional Index(cale oil individual
plot)
nr .
11
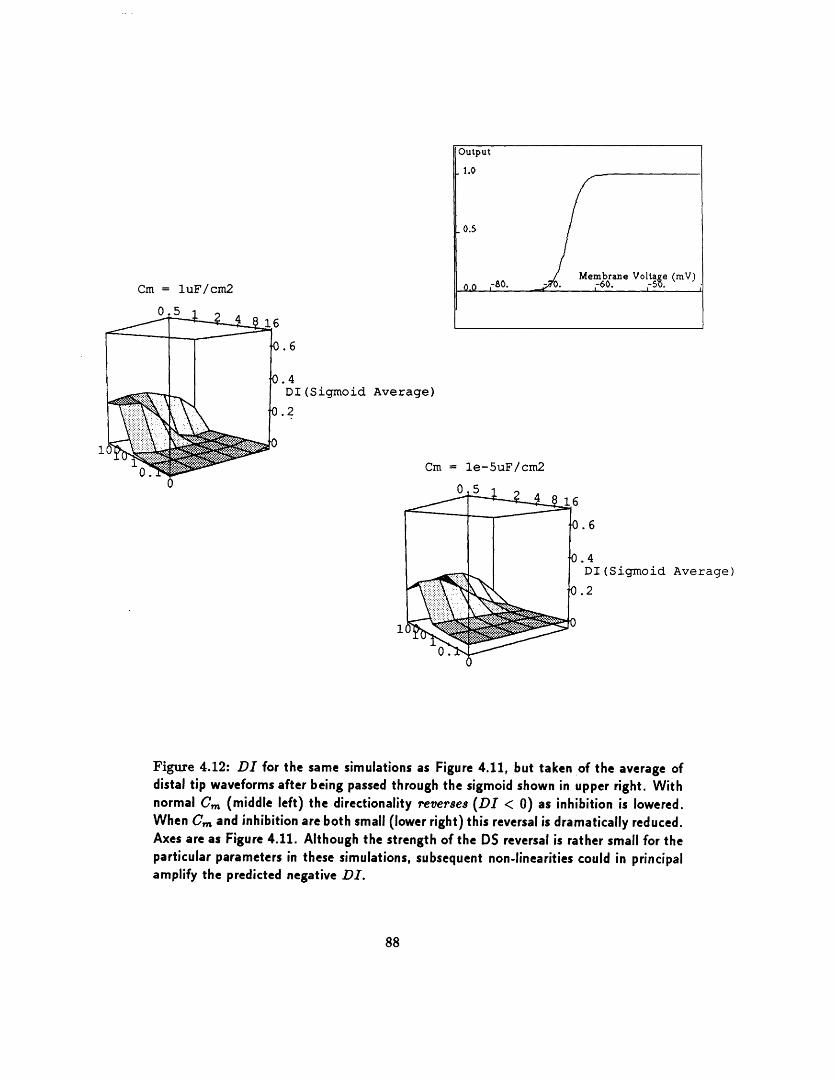
Cm = luF/cm2
Output
1.0
0.5
Membrane Volta e (mV)0.0 ,-80 . a-60. i- t.
.6
.4DI (Sigmoid Average)
.2
Cm = le-5uF/cm2
.6
.4DI (Sigmoid Average)
.2
Figure 4.12: DI for the same simulations as Figure 4.11, but taken of the average ofdistal tip waveforms after being passed through the sigmoid shown in upper right. Withnormal Cm (middle left) the directionality reverses (DI < ) as inhibition is lowered.When Cm and inhibition are both small (lower right) this reversal is dramatically reduced.Axes are as Figure 4.11. Although the strength of the DS reversal is rather small for theparticular parameters in these simulations, subsequent non-linearities could in principalamplify the predicted negative DI.
88
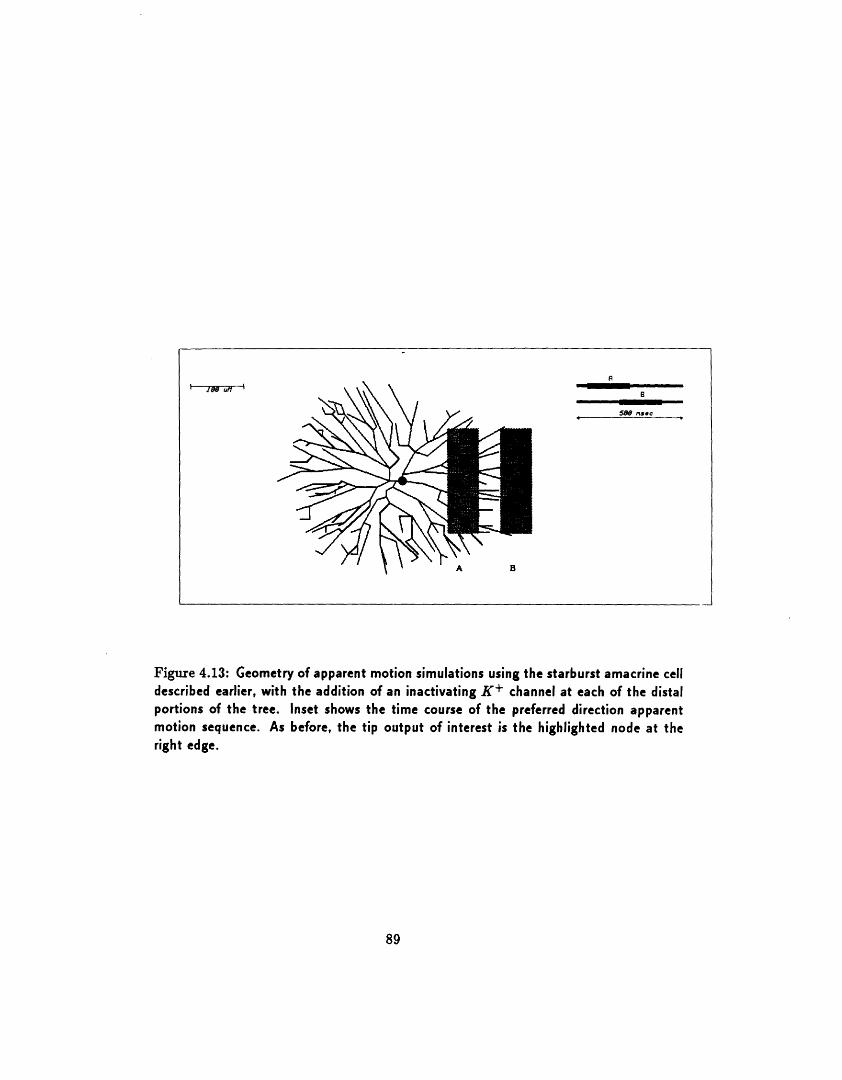
S
B
5W " nl'e
Figure 4.13: Geometry of apparent motion simulations using the starburst amacrine celldescribed earlier, with the addition of an inactivating K+ channel at each of the distalportions of the tree. Inset shows the time course of the preferred direction apparentmotion sequence. As before, the tip output of interest is the highlighted node at theright edge.
89
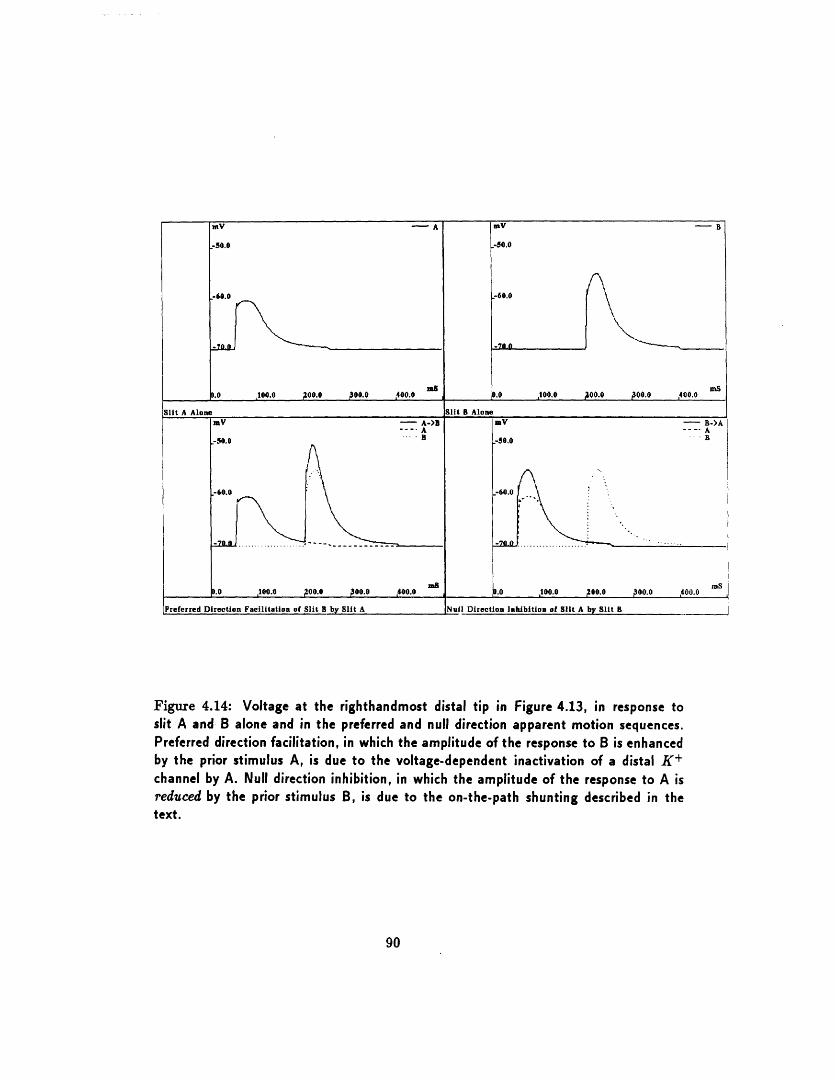
Figure 4.14: Voltage at the righthandmost distal tip in Figure 4.13, in response toslit A and B alone and in the preferred and null direction apparent motion sequences.Preferred direction facilitation, in which the amplitude of the response to B is enhancedby the prior stimulus A, is due to the voltage-dependent inactivation of a distal K+channel by A. Null direction inhibition, in which the amplitude of the response to A isreduced by the prior stimulus B, is due to the on-the-path shunting described in thetext.
90
Chapter 5
Discussion
We shall now recapitulate and discuss the experimental and theoretical re-sults, and discuss some related issues, including that of developmental con-siderations and the possible relevance of the model and data to other brainareas and computations.
5.1 Experimental Evidence of Pre-Synaptic Com-putation of Directional Selectivity and Pos-sible Complications
Again, we interpret the recordings shown in Chapter 3 as evidence for ex-citatory synaptic input onto DS ganglion cells in turtle retina as being al-ready DS. This finding pushes the computational elements for DS back ontoamacrine cells or further. Thus, in Chapter 4 we have postulated a specificmodel for DS in which evenly distributed excitatory and (slower) inhibitoryinputs onto individual amacrine cell dendrites generate DS excitatory out-puts onto DS ganglion cells, the outputs being at or near the tips of theamacrine cell dendrites. The crucial asymmetry in this model is found inthe receptive fields (the spatial extent of the input) of the distal tip outputsynapses: the input onto the amacrine cell, although evenly-distributed andwith symmetric receptive fields, is displaced with respect to any tip out-put. This asymmetry must be maintained in the afferents onto any givenDS ganglion cell, that is the ganglion cell must contact amacrine cell tipsof a specific orientation (see Section 5.5). Also, the most important non-linearity in the system arises from the interaction between the excitatory
91
and inhibitory synaptic conductance input onto the amacrine cell dendrites.The observation that under our recording conditions IPSPs are reduced
soon after whole-cell access supports the above interpretations, but we mayask whether this blockage is complete for distal inhibitory inputs and, ifnot, whether such inputs may preserve DS via a correlative null directionvetoing mechanism. If a synaptic event (such as distal inhibition) is ableto influence somatic events, however, then in principle that event must beobservable by somatic recordings (though not necessarily accurately mea-sured). Since neither inhibitory voltages (under current clamp) nor currents(under voltage clamp) were observed in the motion responses, then we sub-mit that the blocking of inhibitory input in our experiments is sufficient tosupport the DS excitatory input interpretation.
A similar argument may be used if we consider possible contributionsfrom other DS ganglion cells which do not have their inhibition blocked butare able to transmit DS potentials via gap junctions to the recorded cell. Inthis case, as well, the electrical continuity of the gap junctions would meanthat any inhibitory event that could eventually influence the soma voltageof the recorded cell must, in turn, be observable from that cell.
5.2 Anatomical Predictions of the Cable DS Model
The essence of the DS model presented in Ch_, A: is that amacrine elloutput synapses that are asymmetric with respect to the dendritic tree of theamacrine cell will have directional responses which, under reasonable condi-tions, will be DS. We have focused on the distal tip synapses in particularsince, assuming that the input to the tree is homogeneous, these locationshave the most asymmetric input. Since a given DS ganglion cell would col-lect DS inputs of a given orientation, then the model predicts an overallspatial asymmetry in the amacrine cell connectivity onto the ganglion cell.For the model version discussed at length, the input cells would be shiftedtowards the null side of the ganglion cell receptive field (see Figure 5.1). Itmay also be that the amacrine cell DS outputs pass through bipolar cellsbefore going to the ganglion cell: for the model version discussed here theamacrine cell asymmetry is still towards the null side for a sign-preservingbipolar connection, and towards the preferred side for a sign-inverting bipo-lar connection. DS facilitatory data (Section 4.1.5), however, argue againstthe latter possibility.
92
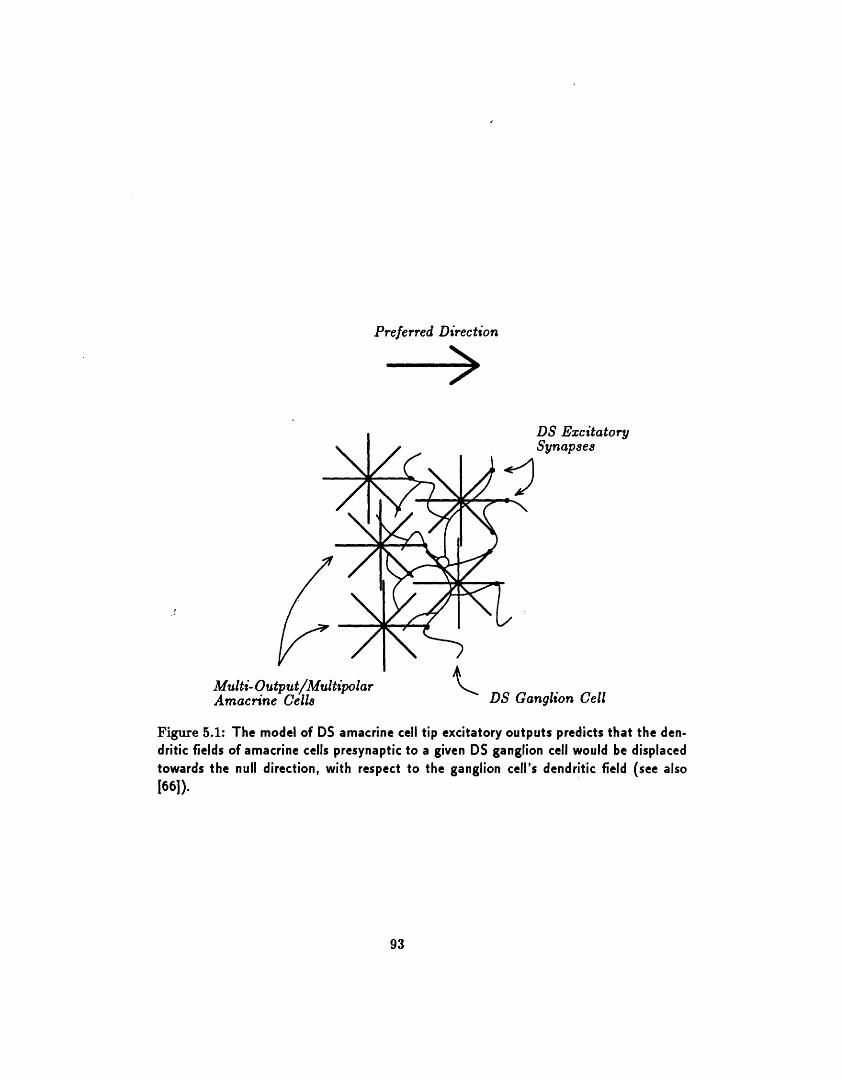
Preferred Direction
DS ExcitatorySynapses
Multi- Output/MultipolarAmacrine Cells DS Ganglion Cell
Figure 5.1: The model of DS amacrine cell tip excitatory outputs predicts that the den-dritic fields of amacrine cells presynaptic to a given DS ganglion cell would be displacedtowards the null direction, with respect to the ganglion cell's dendritic field (see also[661).
93
C
5.2.1 Correlating Anatomy with Function
One experiment to test these predictions would be to inject a physiologicallycharacterized DS ganglion cell with a retrograde tracer, such as Herpes Sim-plex virus [52], and then compare the distribution and orientation of staineddendritic afferents with the DS receptive field properties. The whole-celltechnique described here may be well suited for this type of experiment be-cause a) the wide bore of the patch electrode facilitates delivery of electrodecontents to the cell and b) the stability of the method allows for detailedmapping of the receptive field.
5.3 Relative Frequency of Directional SelectiveResponses
At this stage of our work we have avoided characterizing the percentageof DS cells using this preparation, primarily because a) the protocols andrecording techniques were evolving, b) the DS criteria described in Chapter 3are probably weaker than that usually used (explicitly or implicitly) in theliterature, and c) for many cells a DS response from a WF protocol wasnot stable over time. With respect to the second point, while our criteriadoes pick out statistically significant asymmetries, it does not consider thestrength of th--symmetry (e.g. DI). With these points in mind, f- thecohort of 59 cells described in Appendix B, x 50% showed DS responses atsome point during the recording. The cells shown in Chapter 3 were chosenbecause they had particularly stable DS responses. As we have seen, all ofthese cells show evidence for DS synaptic input. On the other hand, wehave found no cells in which an initial DS response disappeared over time(i.e. subsequent to removal of inhibition at the cell) without a concurrentdegradation of the cell response in general. In other words, we found noevidence that ganglion cell DS in turtle depends on the presence of inhibitiononto that cell.
94
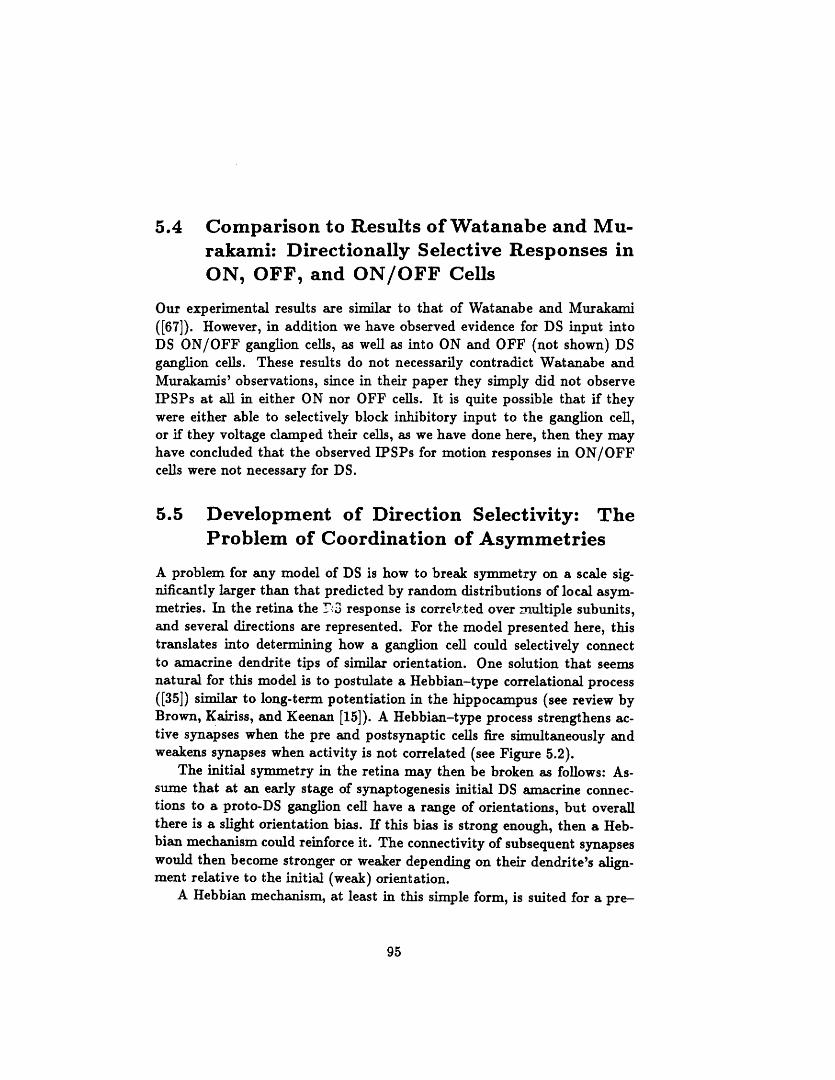
5.4 Comparison to Results of Watanabe and Mu-rakami: Directionally Selective Responses inON, OFF, and ON/OFF Cells
Our experimental results are similar to that of Watanabe and Murakami([67]). However, in addition we have observed evidence for DS input intoDS ON/OFF ganglion cells, as well as into ON and OFF (not shown) DSganglion cells. These results do not necessarily contradict Watanabe andMurakamis' observations, since in their paper they simply did not observeIPSPs at all in either ON nor OFF cells. It is quite possible that if theywere either able to selectively block inhibitory input to the ganglion cell,or if they voltage clamped their cells, as we have done here, then they mayhave concluded that the observed IPSPs for motion responses in ON/OFFcells were not necessary for DS.
5.5 Development of Direction Selectivity: TheProblem of Coordination of Asymmetries
A problem for any model of DS is how to break symmetry on a scale sig-nificantly larger than that predicted by random distributions of local asym-metries. In the retina the -:3 response is correlated over multiple subunits,and several directions are represented. For the model presented here, thistranslates into determining how a ganglion cell could selectively connectto amacrine dendrite tips of similar orientation. One solution that seemsnatural for this model is to postulate a Hebbian-type correlational process([35]) similar to long-term potentiation in the hippocampus (see review byBrown, Kairiss, and Keenan [15]). A Hebbian-type process strengthens ac-tive synapses when the pre and postsynaptic cells fire simultaneously andweakens synapses when activity is not correlated (see Figure 5.2).
The initial symmetry in the retina may then be broken as follows: As-sume that at an early stage of synaptogenesis initial DS amacrine connec-tions to a proto-DS ganglion cell have a range of orientations, but overallthere is a slight orientation bias. If this bias is strong enough, then a Heb-bian mechanism could reinforce it. The connectivity of subsequent synapseswould then become stronger or weaker depending on their dendrite's align-ment relative to the initial (weak) orientation.
A Hebbian mechanism, at least in this simple form, is suited for a pre-
95
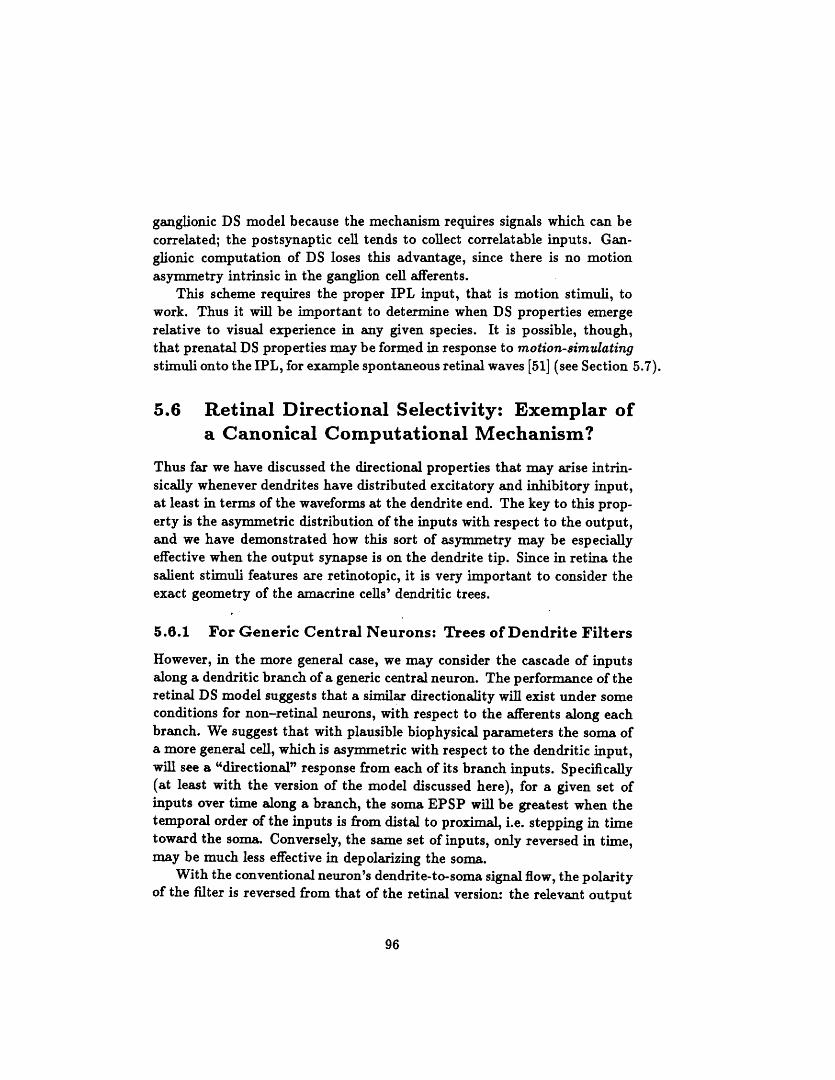
ganglionic DS model because the mechanism requires signals which can becorrelated; the postsynaptic cell tends to collect correlatable inputs. Gan-glionic computation of DS loses this advantage, since there is no motionasymmetry intrinsic in the ganglion cell afferents.
This scheme requires the proper IPL input, that is motion stimuli, towork. Thus it will be important to determine when DS properties emergerelative to visual experience in any given species. It is possible, though,that prenatal DS properties may be formed in response to motion-simulatingstimuli onto the IPL, for example spontaneous retinal waves [51] (see Section 5.7).
5.6 Retinal Directional Selectivity: Exemplar ofa Canonical Computational Mechanism?
Thus far we have discussed the directional properties that may arise intrin-sically whenever dendrites have distributed excitatory and inhibitory input,at least in terms of the waveforms at the dendrite end. The key to this prop-erty is the asymmetric distribution of the inputs with respect to the output,and we have demonstrated how this sort of asymmetry may be especiallyeffective when the output synapse is on the dendrite tip. Since in retina thesalient stimuli features are retinotopic, it is very important to consider theexact geometry of the amacrine cells' dendritic trees.
5.6.1 For Generic Central Neurons: Trees of Dendrite Filters
However, in the more general case, we may consider the cascade of inputsalong a dendritic branch of a generic central neuron. The performance of theretinal DS model suggests that a similar directionality will exist under someconditions for non-retinal neurons, with respect to the afferents along eachbranch. We suggest that with plausible biophysical parameters the soma ofa more general cell, which is asymmetric with respect to the dendritic input,will see a "directional" response from each of its branch inputs. Specifically(at least with the version of the model discussed here), for a given set ofinputs over time along a branch, the soma EPSP will be greatest when thetemporal order of the inputs is from distal to proximal, i.e. stepping in timetoward the soma. Conversely, the same set of inputs, only reversed in time,may be much less effective in depolarizing the soma.
With the conventional neuron's dendrite-to-soma signal flow, the polarityof the filter is reversed from that of the retinal version: the relevant output
96
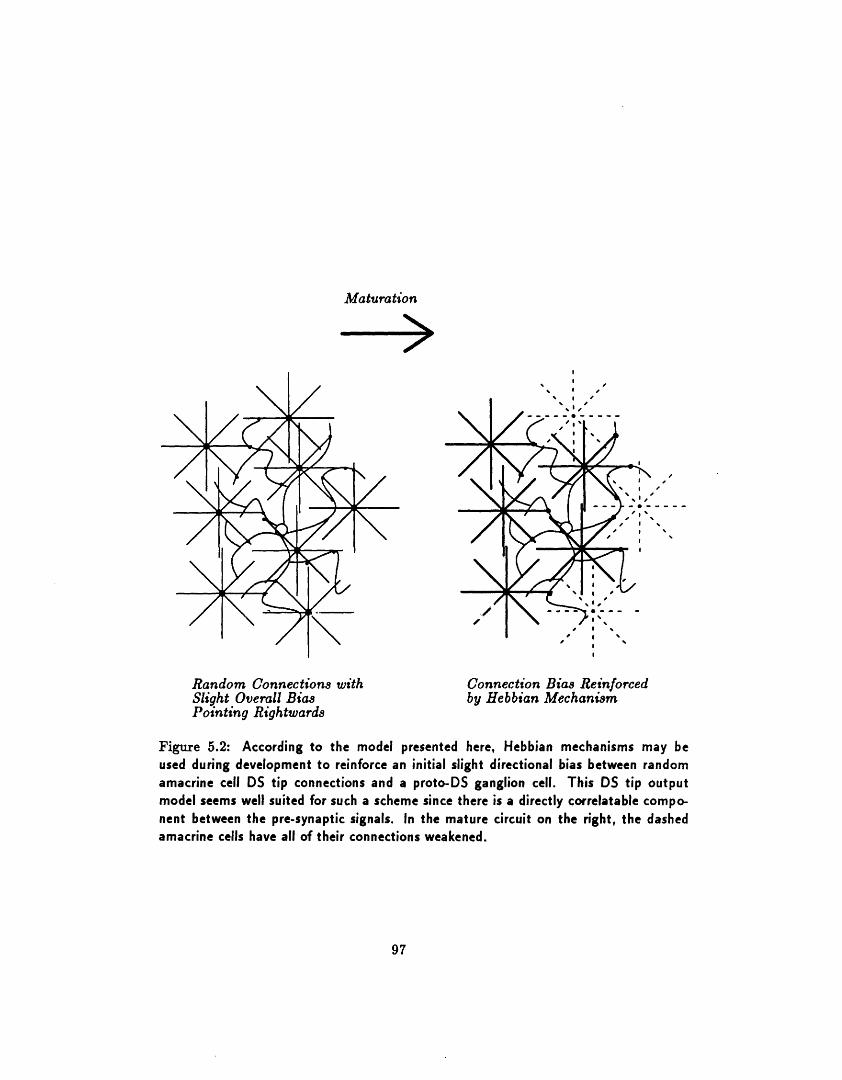
Maturation
_ ,
I
I I
Random Connections withSlight Overall BiasPointing Rightwards
Connection Bias Reinforcedby Hebbian Mechanism
Figure 5.2: According to the model presented here, Hebbian mechanisms may beused during development to reinforce an initial slight directional bias between randomamacrine cell DS tip connections and a proto-DS ganglion cell. This DS tip outputmodel seems well suited for such a scheme since there is a directly correlatable compo-nent between the pre-synaptic signals. In the mature circuit on the right, the dashedamacrine cells have all of their connections weakened.
97
a
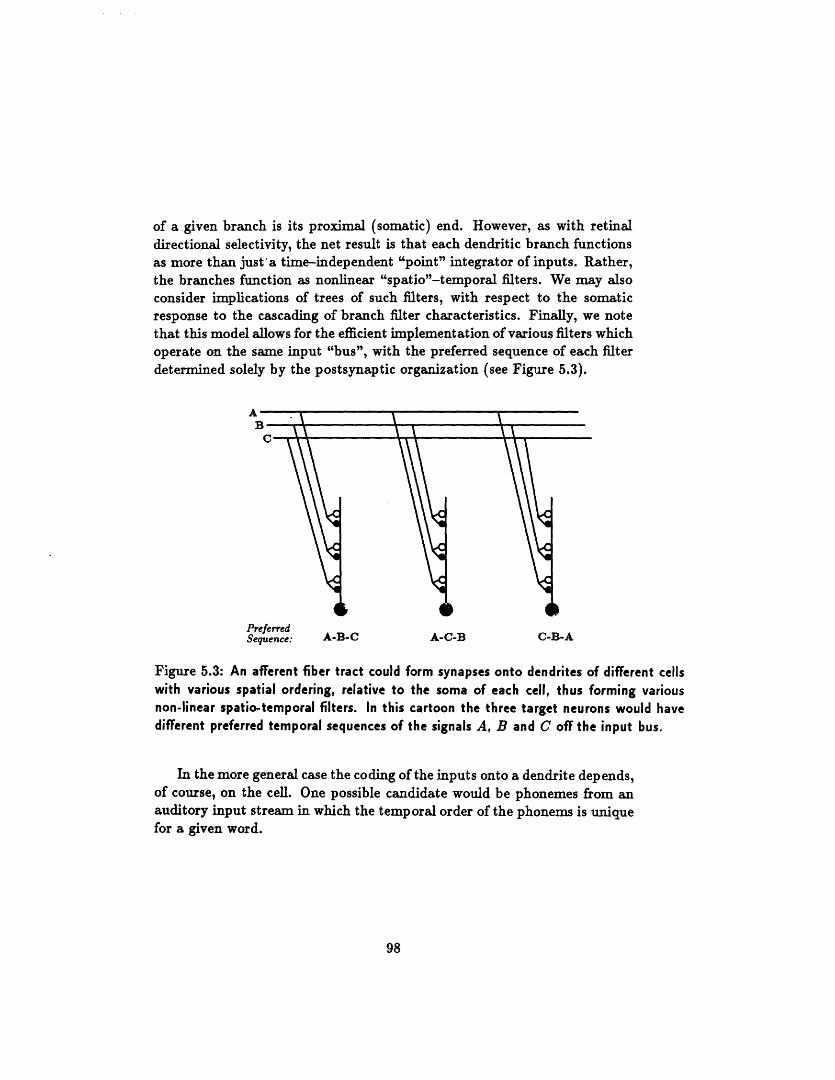
of a given branch is its proximal (somatic) end. However, as with retinaldirectional selectivity, the net result is that each dendritic branch functionsas more than just'a time-independent "point" integrator of inputs. Rather,the branches function as nonlinear "spatio"-temporal filters. We may alsoconsider implications of trees of such filters, with respect to the somaticresponse to the cascading of branch filter characteristics. Finally, we notethat this model allows for the efficient implementation of various filters whichoperate on the same input "bus", with the preferred sequence of each filterdetermined solely by the postsynaptic organization (see Figure 5.3).
PreferredSequence: A-B-C A-C-B C-B-A
Figure 5.3: An afferent fiber tract could form synapses onto dendrites of different cellswith various spatial ordering, relative to the soma of each cell, thus forming variousnon-linear spatio-temporal filters. In this cartoon the three target neurons would havedifferent preferred temporal sequences of the signals A, B and C off the input bus.
In the more general case the coding of the inputs onto a dendrite depends,of course, on the cell. One possible candidate would be phonemes from anauditory input stream in which the temporal order of the phonems is uniquefor a given word.
98
5.7 So What Are Ganglion Cells For, Anyway?
The results of the work presented here suggest that the DS ganglion cell inturtle doesn't do very much in terms of the DS computation itself; rather,the ganglion cell's job seems to be to collect many instances of a specificcomputation - done by amacrine cells - in order to form a coherent, consistentreceptive field. It may be that this sort of final "editing" of retinal processingis typical for the ganglion cell layer. -
As we mentioned above, the conditions for DS dendritic waveforms areweak: therefore we suggest that not only may this mechanism be relevantoutside the retina, but also that some degree of DS may be the rule forIPL output rather than the ezception. As we mentioned in Section 4.1.1,if we assume that amacrine cells in general have outputs throughout theirdendritic trees, then most of the outputs will be asymmetric with respect tothe inputs that can effect them. The degree of input asymmetry for a givenoutput may in turn be reflected in the degree of DS for that output. If this isthe case, then we may surmise the following: a given species will demonstrateretinal DS if either a) the ganglion cells have the necessary machinery (e.g.Hebbian) to selectively collect DS IPL signals and/or b) motion or motion-simulating input onto the IPL is present during a critical plastic stage ofdevelopment. This leads to the hypothesis that the existence of retinalDS for a species depends more on details of developmental mechanisms andtiming for hat species, rather than on any "special" biophysical mechanismsinvolved in the mature DS circuitry.
5.8 Implications for DS in the Visual Systems ofHigher Species
As we mentioned in Chapter 2, DS responses in higher species tend to firstemerge in visual cortex. Does the model presented here have any relevancefor cortical DS? Certainly visual cortex has the retinotopic organization thatmakes this model arise in a simple way within retinal tissue. Similar bio-physical mechanisms probably exist in cortex as well, as discussed above.Whether or not the synaptic organization necessary to recapitulate the reti-nal DS model exists in cortex remains to seen, but hopefully this modelwill generate testable predictions for DS-generating connectivity in visualcortex.
99
Appendix A
Isolation and Recording ofTurtle Retina Allowing forArbitrary ElectrodeApproach andTrans-Illumination of Retina
Isolated retina preparations have proved useful in many experimental pro-tocols since developed by Ames and Nesbett for rabbit retina ([1]). Theseadvantages include:
* Better clearance properties (useful in pharmacological studies).
* Avoidance of electrode shadowing of stimulus.
* Infra-red trans-illUmination of the tissue which facilitates electrodeplacement and control.
* Visual observation during recording which allows for impalement ofselected (e.g. stained) cells.
In 1989 Lipetz et. al. [45] described a new technique for the isolation ofa functional turtle retina. While their technique apparently yields normalresponses from cones and horizontal cells, it does not allow either directelectrode approach from the ganglion cell side, nor transmitted light mi-croscopy. In this appendix we describe a modification of their technique,
100
which allows both physical and visual access to either side of the retina([11]). In particular, in the majority of the dissections it is possible to lo-cate the visual streak and use this as a location reference throughout theexperiment. Because we initially used extracellular recordings to assess thispreparation (with metal electrodes), and because intracellular protocols willbe discussed in Appendix B, in this appendix we will confine recording re-sults to conventional extracellular protocols.
A.1 Dissection Method
Prior to the dissection a small piece of filter paper is prepared and mountedin a holder (Figures A.1 and A.2). The arm of the holder is mounted on thehead carriage of a dissecting microscope (with the optics removed), whichserves as a useful platform for the dissection. After mounting, the paperholder is adjusted so that the filter paper is coplanar with the microscopestage.
With respect to the filter paper, we have had some success with bothcoffee maker filter paper (Mellita) and nitro-cellulose paper (Millipore, 0.45ym pore size). Generally, the nitro-cellulose paper seems to have slightlymore affinity for the retina, and it is a simple matter to melt small windows inthis material with the heated end of glass tubing of the appropriate diameter.
Perf- ' ' taken from [5]: 96i5 mM NaC1, 2.6 mM KC1, 2 mM MgC12,4 mM CaC12, 31.5 mM NaHCO 3, 10 mM glucose, 10 mM HEPES, bubbledwith 95%oO2/5%C02. In practice, 10x stock solutions, without CaC12 orglucose, were prepared ahead of time and stored in the refrigerator.
Turtles are dark-adapted in a light-tight box for at least 8 hours prior toan experiment. After adaptation the entire dissection procedure, includingdecapitation, is done using a head-mounted monocular infra-red (IR) viewer(Model 6100M, Electrophysics Corporation, Nutley, New Jersey). After de-capitation and pithing the head is immediately mounted in a dissectionholder, covered with foil to block out light, and put in the refrigerator (50 C).
After a variable amount of time (ranging from immediately to one day)the head and holder are unwrapped and one eye is enucleated. The headis then wrapped back in foil and returned to the refrigerator for possibledissection of the remaining eye later. The enucleated eye is placed on blotterpaper and hemisected, and the posterior half laid face down on the paperto drain for about 20 seconds. The drained eyecup is then rinsed in theRinger's solution for about one minute. The eyecup is then removed from
101
the Ringer's and the disc and streak are located. The cup is bisected ona non-porous surface (to avoid premature removal of the retina) along theperpendicular to the streak, narrowly skirting the disc. One half of thebisected cup is placed in a small dish of the Ringer's solution and put intothe refrigerator for later use (up to 8 hours).
If the remaining half has the disk then another cut is made, parallel tothe first, to remove the disc from the section. Further trimming may bedone in order to make the section about 4mm wide. If necessary, the sectionis laid on its side on the non-porous surface in order to drain more vitreous.The section is then placed on blotter paper, and a scalpel is used to maketwo lateral cuts (perpendicular to the long axis) through the retina only,dividing the section in thirds. The section is then centered, retina side up,on a small ( 3mm x 5mm x mm high, made of tape) support which ismounted on the XY stage of a dissection microscope. The lateral "ears"of the section are held down by two spring wire clips such that the middlethird of the retina is elevated slightly by the support.
The filter paper retina carrier hole is then aligned in the XY plane, withthe paper several mm above the tissue, so that the hole is centered on themiddle third of the section. Monitoring from the side, the paper is thenlowered using the dissection microscope's focus adjustment until the paperbarely rests on the retina. The paper is then allowed to sit on the retina forabout 20 to 40 seconds, and then the paper holder is lifted quickly by hand,taking the section of 'ting wit -it. The retina section is now attached byits ganglion cell surface to the underside of the filter paper. At this pointthe dissection is inspected and, if it is not satisfactory, adjusted with fineforceps in room light. In our experience, light exposure does no harm oncethe retina is isolated. The retina and filter paper is then placed under anylon ring in the perfusion bath (flow lml/min). Recordings are begunafter at least a one and half hour wait, but consistent light responses havebeen recorded within minutes of the dissection.
A.1.1 Importance of Low Light During Dissection
The key step to this technique is that of maintaining very low light levelsduring the dissection to prevent the interdigitation of the pigment epitheliumwith the photoreceptors prior to and during the actual isolation [17]. Otherfactors that may contribute to retinal adhesion to the pigment epithelium,including temperature or pH [70], were not evaluated. We have found thatrefrigeration schedules are not critical, and the material is relatively resistant
102
to anoxia, since we have obtained apparently reasonable light responses fromboth freshly killed animals and from heads that have been stored up to twofull days under refrigeration.
A.2 Recording System for Superfusion and Transmitted-Light IR Microscopy
The perfusion system and stimulus/recording layout is set up to providemixed stimulus and IR illumination from below, and recording and IR videomonitoring from above, as shown in Figure A.3.
A.3 Stimulus Generation, Data Acquisition andExperiment Control
Light stimuli were generated on a Textronix 608 monitor with a P4 phos-phor, controlled by a Picasso CRT Image Synthesizer (Innisfree, Cambridge,Massachusetts). All experiments described in this thesis used maximum con-trast stimuli (full brightness from full off). The monitor image was collectedby a 4 inch diameter convex lens and then mixed into the microscope IRilluminator path by a half-silvered mirror prior to the microscope condenser.The final image on the retina w: - .--an.gr- . l by a factor of 40, and theintensity at retina was x 25IW/cm 2 (estimate).
Control of the Picasso and data acquisition was handled with an IBMModel AT Personal Computer, running under the Asyst system (MacmillanSoftware Company, New York, New York). Electrophysiological amplifier,window discriminator (World Precision Instruments), and Picasso phase out-puts were both recorded on a PCM VCR recorder (Vetter), and digitizedfor on-line data analysis and storage. Off line data analysis was done withvarious standard computing resources.
A.4 Extracellular Recordings
In order to assess the viability of this preparation, extracellular recordingswere done, presumably picking up spiking activity from ganglion cells (Da-gan extracellular amplifier, Dagan Corporation, Minneapolis, Minnesota).Cells were located by advancing extracellular electrodes (2-5MN, parylene
103
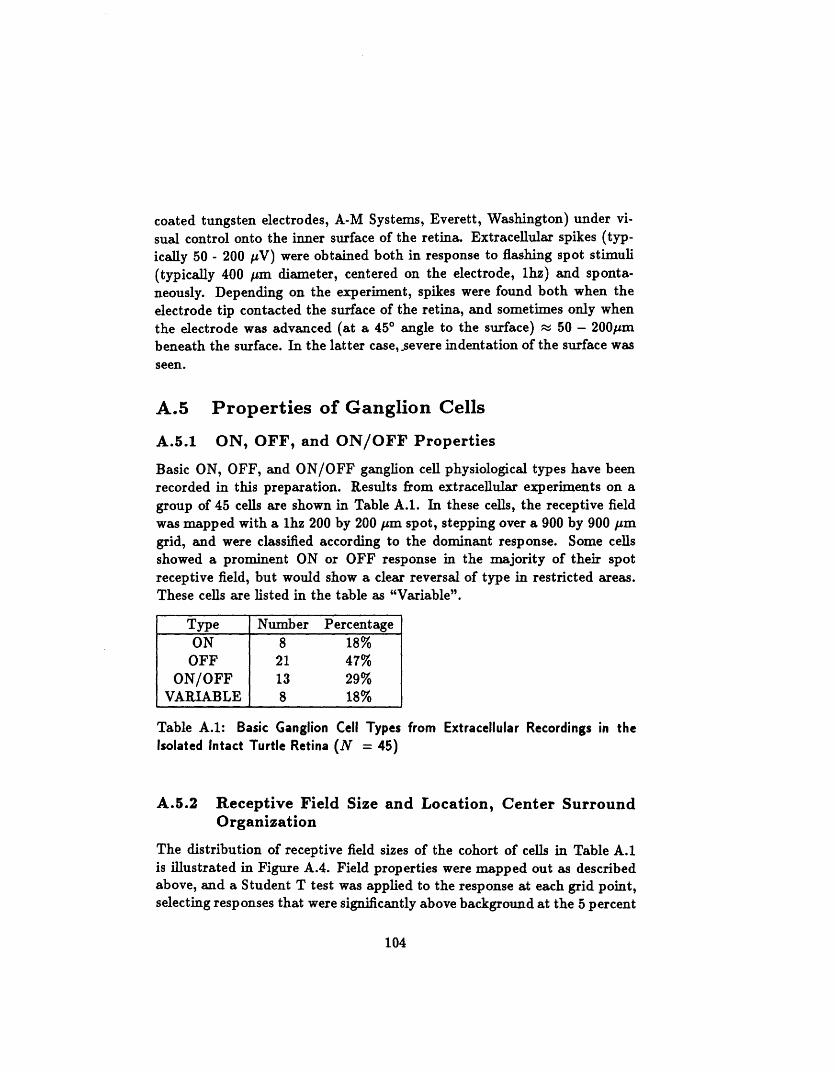
coated tungsten electrodes, A-M Systems, Everett, Washington) under vi-sual control onto the inner surface of the retina. Extracellular spikes (typ-ically 50 - 200 pV) were obtained both in response to flashing spot stimuli(typically 400 pm diameter, centered on the electrode, hz) and sponta-neously. Depending on the experiment, spikes were found both when theelectrode tip contacted the surface of the retina, and sometimes only whenthe electrode was advanced (at a 450 angle to the surface) 50 - 200pmbeneath the surface. In the latter case, severe indentation of the surface wasseen.
A.5 Properties of Ganglion Cells
A.5.1 ON, OFF, and ON/OFF Properties
Basic ON, OFF, and ON/OFF ganglion cell physiological types have beenrecorded in this preparation. Results from extracellular experiments on agroup of 45 cells are shown in Table A.1. In these cells, the receptive fieldwas mapped with a 1hz 200 by 200 pm spot, stepping over a 900 by 900 pmgrid, and were classified according to the dominant response. Some cellsshowed a prominent ON or OFF response in the majority of their spotreceptive field, but would show a clear reversal of type in restricted areas.These cells are listed in the table as "Variable".
Type Number PercentageON 8 18%
OFF 21 47%ON/OFF 13 29%
VARIABLE 8 18%
Table A.1: Basic Ganglion Cell Types from Extracellular Recordings in theIsolated Intact Turtle Retina (N = 45)
A.5.2 Receptive Field Size and Location, Center SurroundOrganization
The distribution of receptive field sizes of the cohort of cells in Table A.1is illustrated in Figure A.4. Field properties were mapped out as describedabove, and a Student T test was applied to the response at each grid point,selecting responses that were significantly above background at the 5 percent
104
confidence level. The total area of the grid covered by the selected pointswas then calculated, and the diameter of a circular field with the same areawas derived.
Visualization of the retina during recording allows for immediate de-termination of the relation between soma location and the receptive field,relative to the visual streak. In our experiments we have consistently ob-served a bias in this relation which tends to put the receptive field centermidway between the electrode tip and the streak.
Some cells showed a clear excitatory-center, inhibitory-surround responseto spots of increasing diameter. These characteristics are discussed in detailin Appendix B.
A.6 Preservation of Photoreceptors
A major concern with the isolation procedure is the integrity of the frag-ile photoreceptor outer segments. Scanning electron micrographs of thephotoreceptor surface is one way to evaluate this morphology [45]. In themicrographs shown in Figure A.5 the outer segments are clearly visible, andlarge areas of photoreceptors seem to have weathered the dissection ratherwell. We also saw extensive areas of damage, but we assume that the "good"areas are large enough for the electrophysiology.
A.7 Infra-Red Viewing of Preparation During Record-ing
An important advantage of this preparation is the ability to see the tissueduring recording, especially for the whole-cell patch protocol described inthe following appendix. An example IR video hardcopy of a retina during awhole-cell protocol is shown in Figure A.6.
A.8 Consistency of Method
This method has yielded preparations in which extracellular ganglion cellresponses are quite readily obtained. In addition, there appears to be noobvious large-scale artifact in the mapped receptive fields that might be dueto the dissection.
105
A.9 Stability and Longevity of Method
We have not encountered significant bleaching effects with the isolated prepa-ration, despite the absence of pigment epithelium, possibly due to the lowlevel of illumination. Vigorous responses to spots have been obtained fromretinas after up to 14 hours of a protocol consisting of 200pm diameter flash-ing spots or moving gratings, presented at various locations over a 2 x 2mmretinal area for x 80% of the time, and large (500 - OOOpm diameter) stim-uli for the remaining time. In addition, extracellular recordings from singlecells have been maintained for up to 8 hours. This stability is especially use-ful when investigating the fine structure of the terrapin retina's complicatedreceptive fields.
A.10 Summary
We have demonstrated that fully isolated turtle retina is a viable prepara-tion. The dissection technique that we describe is designed to be as robustas possible, and we believe that this preparation is amenable to a variety ofextracellular, intracellular, pharmacological, and histological techniques.
106
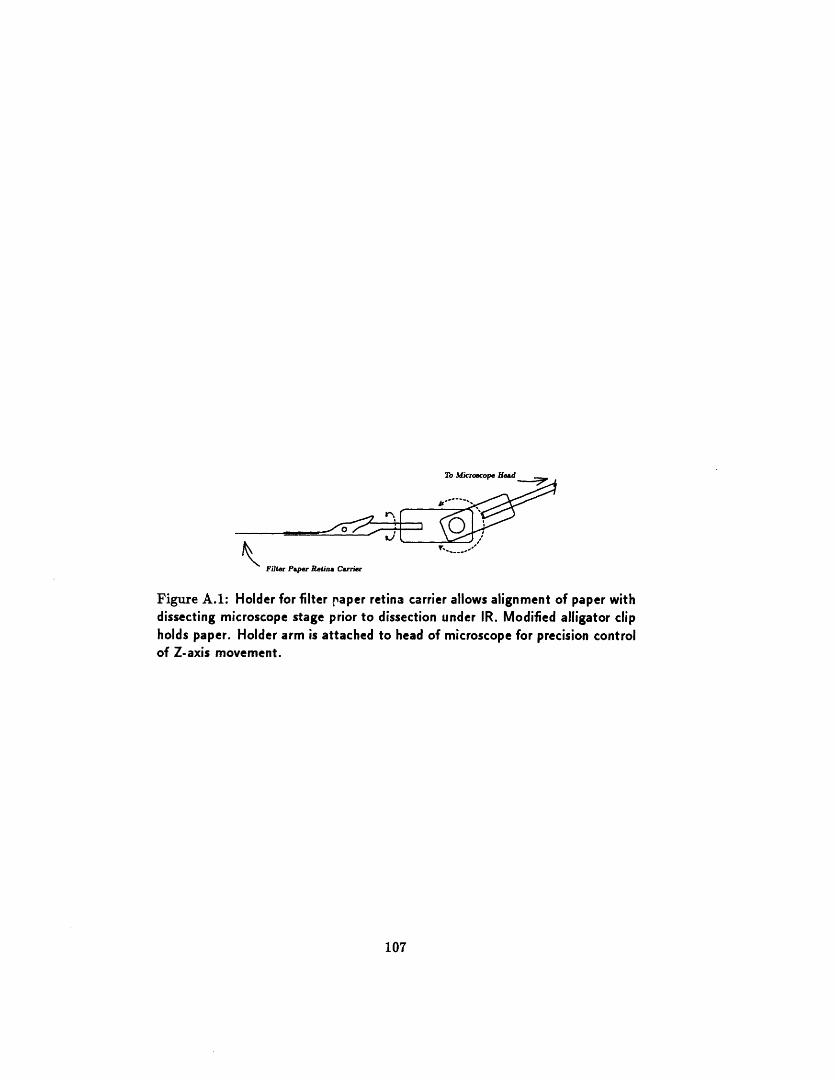
To
Filter Paper Retina Carrier
Figure A.1: Holder for filter paper retina carrier allows alignment of paper withdissecting microscope stage prior to dissection under IR. Modified alligator clipholds paper. Holder arm is attached to head of microscope for precision controlof Z-axis movement.
107
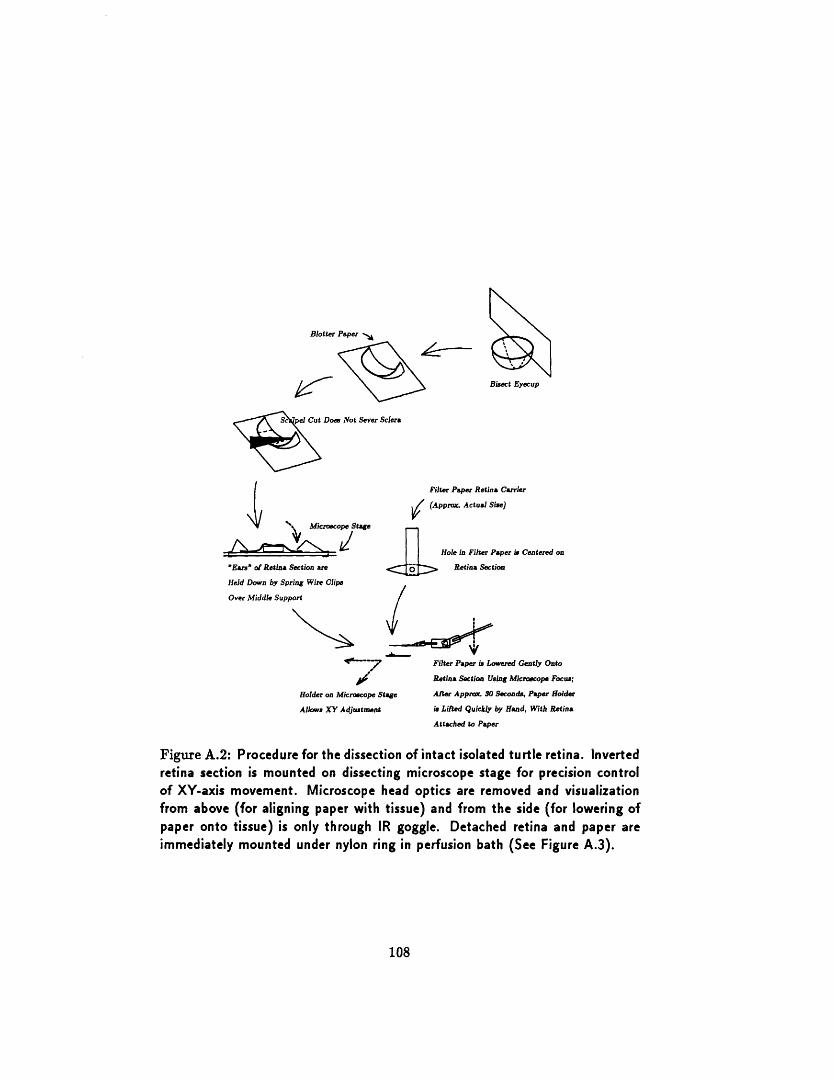
Blotter Paper l
e utDoes Not Sever Sclera
( /Micrecope Stage
'Ears' of Retina Section are
Held Down by Spring Wire Clips
Over Middle Support
7Holder on Microscope Stage
Allows XY Adjustment
Hole in Filter Paper is Centered on
Retina Section
Filter Paper i Lowered Gently Onto
Retina Section Using Microecope Focus;
After Approx 30 Seconds, Paper Holder
is Lifted Quickly by Hand, With Retina
Attached to Paper
Figure A.2: Procedure for the dissection of intact isolated turtle retina. Invertedretina section is mounted on dissecting microscope stage for precision controlof XY-axis movement. Microscope head optics are removed and visualizationfrom above (for aligning paper with tissue) and from the side (for lowering ofpaper onto tissue) is only through IR goggle. Detached retina and paper areimmediately mounted under nylon ring in perfusion bath (See Figure A.3).
108
Bisect Eyecup
Filter Paper Retina Carrier
(Apprcx. Actual Sine)
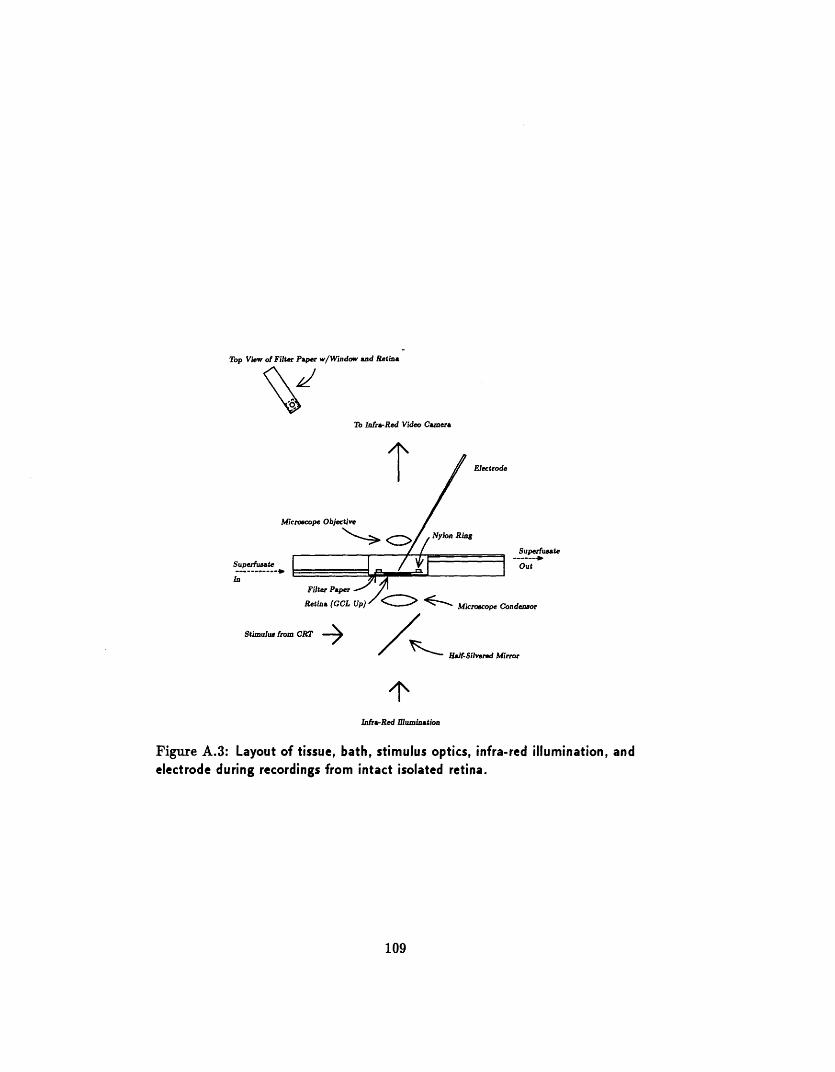
Top View of Filter Paper w/Window and Retina
To Infra-Red Video Camera
Mi
Superfuaate
in
nenlhr
Stimulus from CRT ->
/ 'r' HBalf-Silvered Mirror
Infra-Red Illumination
Figure A.3: Layout of tissue, bath, stimulus optics, infra-red illumination, andelectrode during recordings from intact isolated retina.
109
Superfusate
Out
/Ne
. ..sX'~MV v A EW·V·
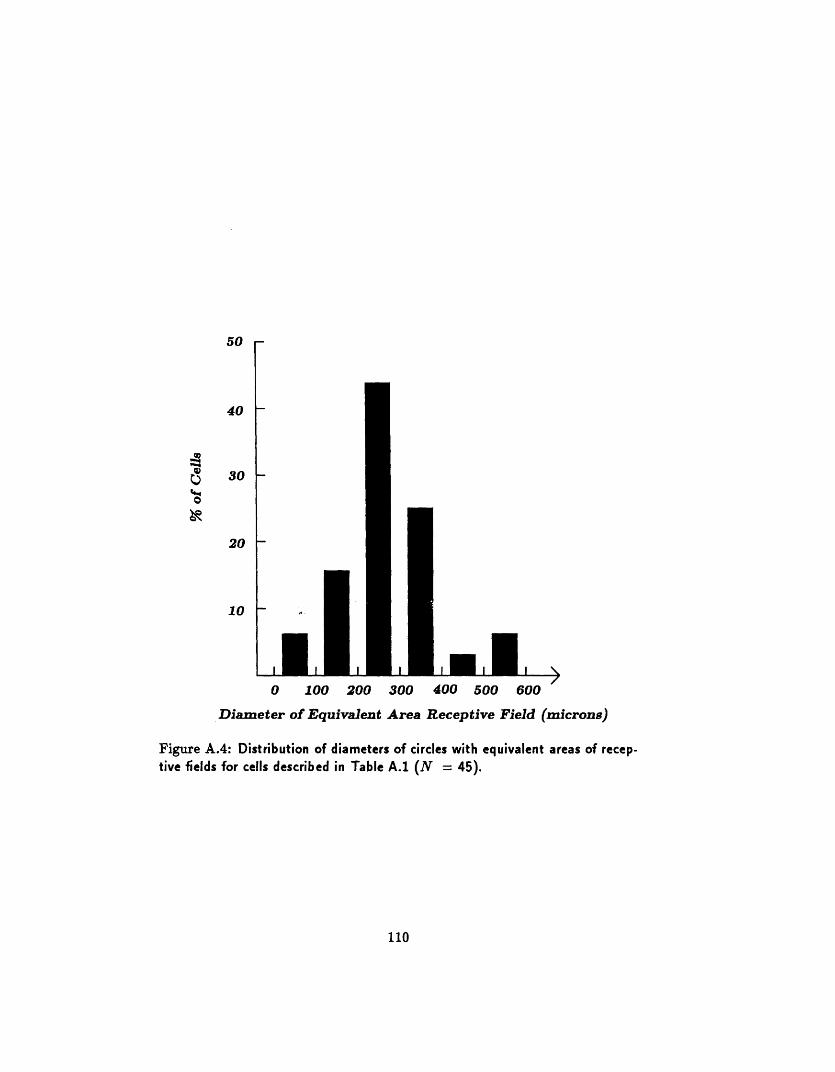
50
40
30
2020
10
I I 1 I I I 40 100 200 300 400 500 600
Diameter of Equivalent Area Receptive Field (microns)
Figure A.4: Distribution of diameters of circles with equivalent areas of recep-tive fields for cells described in Table A.1 (N = 45).
110
..
I
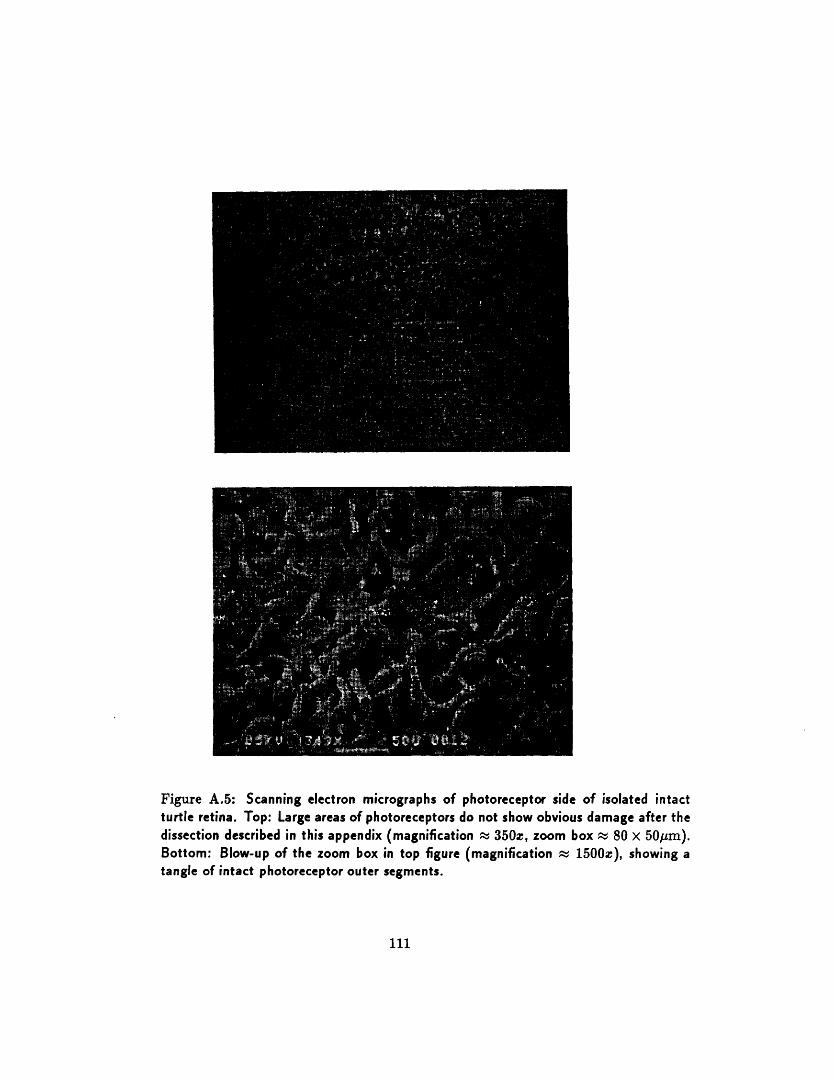
Figure A.5: Scanning electron micrographs of photoreceptor side of isolated intactturtle retina. Top: Large areas of photoreceptors do not show obvious damage after thedissection described in this appendix (magnification x 350z, zoom box P 80 x 501rm).Bottom: Blow-up of the zoom box in top figure (magnification _ 1500z), showing atangle of intact photoreceptor outer segments.
111
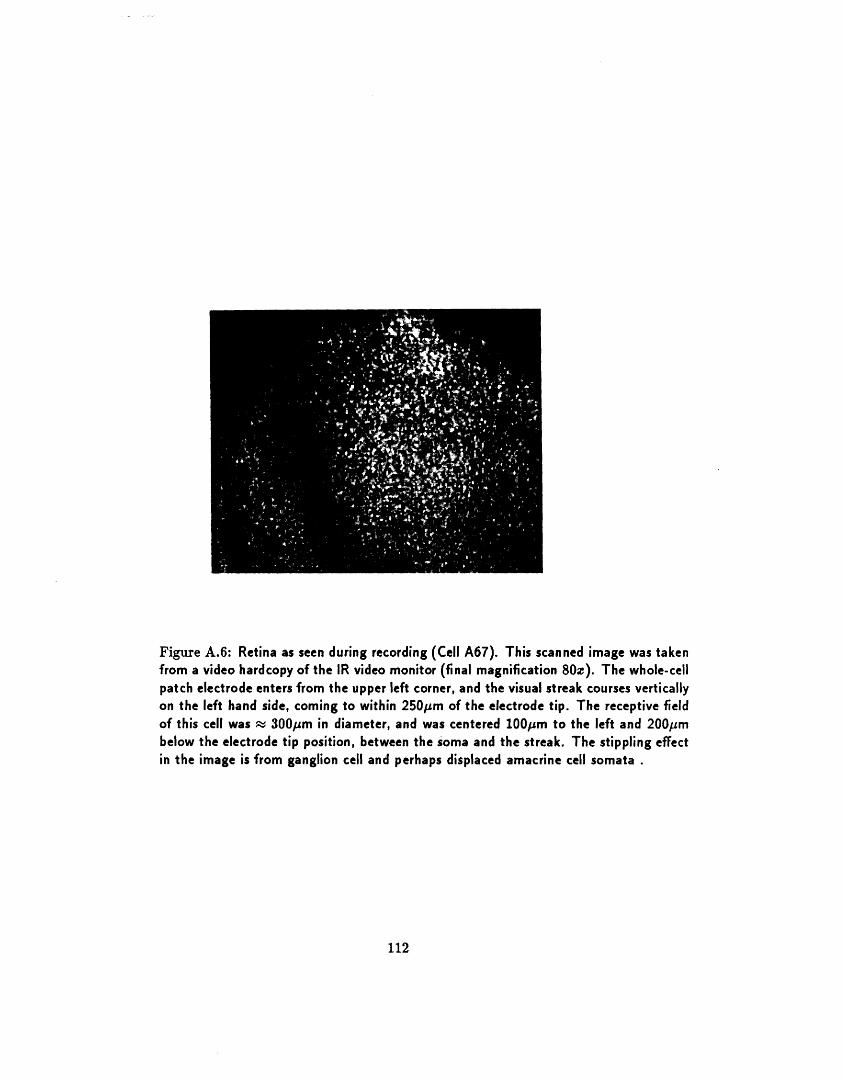
Figure A.6: Retina as seen during recording (Cell A67). This scanned image was takenfrom a video hardcopy of the IR video monitor (final magnification 80z). The whole-cellpatch electrode enters from the upper left corner, and the visual streak courses verticallyon the left hand side, coming to within 250pm of the electrode tip. The receptive fieldof this cell was - 300pm in diameter, and was centered 100m to the left and 200pmbelow the electrode tip position, between the soma and the streak. The stippling effectin the image is from ganglion cell and perhaps displaced amacrine cell somata .
112
Appendix B
Whole-Cell PatchRecordings in IsolatedIntact Turtle Retina
In order to investigate the synaptic inputs to DS retinal ganglion cells wehave developed a whole-cell patch technique in intact isolated turtle retina.This method allows the following:
* Initial extracellular determination of receptive field properties, withon-cell patch recordings.
* Intracellular recordings that are stable for typically > 2 hours, andthat are quieter than conventional microelectrode recordings due tothe low impedance of the whole-cell electrodes.
* Dialysis of the cell interior by the electrode solution allowing manipu-lation of the intracellular environment.
In this appendix we shall present the protocol used and basic propertiesof cells measured with the whole-cell patch.
B.1 Recording Method
We shall now describe the whole-cell patch protocol materials and methods.
113
B.1.1 Electrodes and Electrode Solutions
Whole-cell patch electrodes are made from Corning 7052 capillary glass,1.65 mm O. D. 1.20 mm I. D. (A-M Systems, Everett, Washington) usinga three pull sequence on a Flaming-Brown micropipette puller (Model P-80/PC, Sutter Instrument Corporation, San Rafael, California). A typicalsequence is as follows:
Cycle Heat Pull Velocity Time1 400 0 30 802 400 0 30 803 410 60 30 40
The electrodes have a steeply-tapering tip (diameter approximately 2pm) and a resistance of approximately 4 MfO when filled with the solutionsto be described. We have not found it necessary to coat the electrodes norotherwise treat them further other than a simple fire-polishing using a single(extra) heat cycle of the micropipette puller. This step consists of movingthe tip of one electrode at a time into the heating element area, while theelectrode is still mounted in the puller. The puller is then activated (Heat =350, Time = 100) while holding the tip in this position. A typical electrodeis shown in Figure B.1.
Intracelluar solutions are derived from the protocol of the first whole-cell patch recordings in intact vertebrate retina reported by Coleman andMiller [19]. Control solutions are composed of 90 mM KCH3SO4, 5 mMNaCH3SO4, 12 mM MgCl 2, 1 mM CaC12, 11 mM EGTA, 5 mM HEPES,2 mM glucose, and 1 mM ATP, titrated with KOH to a pH of 7.4. Forprotocols which include the presumed blocking of GABAA responses of therecorded cell alone the control solution is used minus the ATP ([60]) and,occasionally, the MgCl 2. All the results presented in this thesis are fromprotocols using the control solution without ATP.
B.1.2 Electrode Manipulation
Electrodes are backfilled with a hypodermic needle and syringe, which isfitted with a 2pm in-line filter. Following the recommendation in [19], the
114
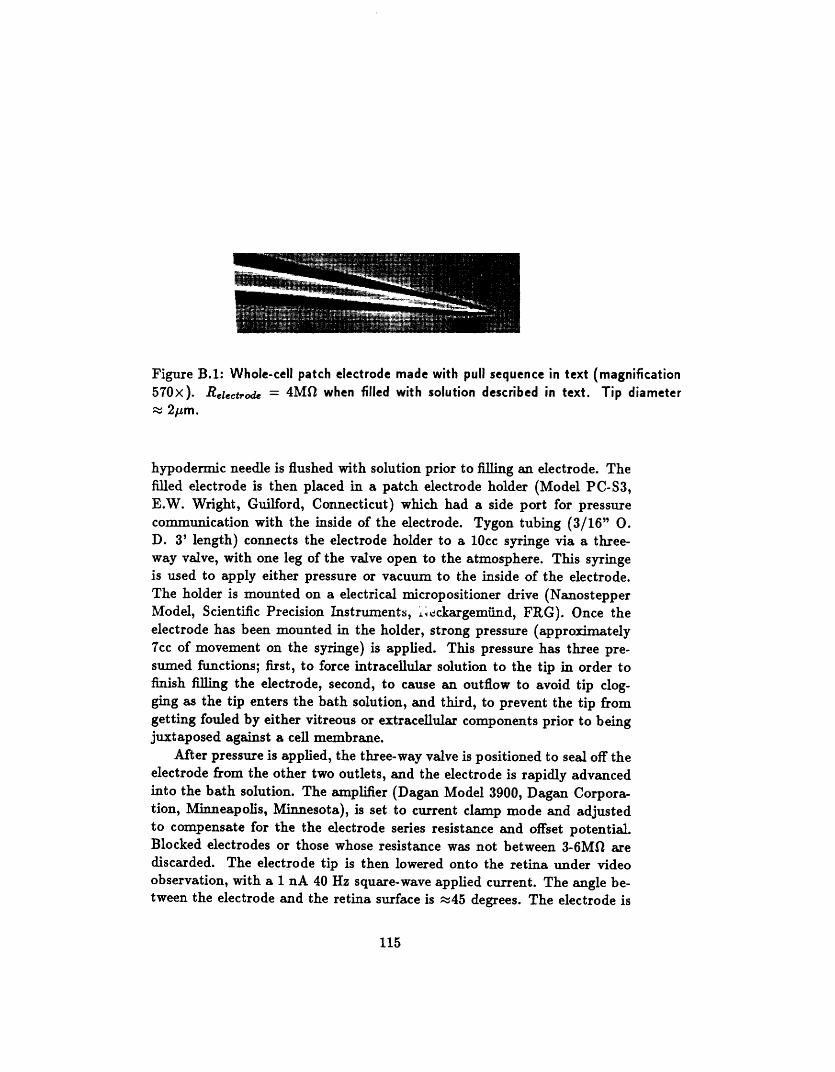
Figure B.1: Whole-cell patch electrode made with pull sequence in text (magnification570x). Rectode = 4MO when filled with solution described in text. Tip diameter
2m.
hypodermic needle is flushed with solution prior to filling an electrode. Thefilled electrode is then placed in a patch electrode holder (Model PC-S3,E.W. Wright, Guilford, Connecticut) which had a side port for pressurecommunication with the inside of the electrode. Tygon tubing (3/16" O.D. 3' length) connects the electrode holder to a 10cc syringe via a three-way valve, with one leg of the valve open to the atmosphere. This syringeis used to apply either pressure or vacuum to the inside of the electrode.The holder is mounted on a electrical micropositioner drive (NanostepperModel, Scientific Precision Instruments, ileckargemiind, FRG). Once theelectrode has been mounted in the holder, strong pressure (approximately7cc of movement on the syringe) is applied. This pressure has three pre-sumed functions; first, to force intracellular solution to the tip in order tofinish filling the electrode, second, to cause an outflow to avoid tip clog-ging as the tip enters the bath solution, and third, to prevent the tip fromgetting fouled by either vitreous or extracellular components prior to beingjuxtaposed against a cell membrane.
After pressure is applied, the three-way valve is positioned to seal off theelectrode from the other two outlets, and the electrode is rapidly advancedinto the bath solution. The amplifier (Dagan Model 3900, Dagan Corpora-tion, Minneapolis, Minnesota), is set to current clamp mode and adjustedto compensate for the the electrode series resistance and offset potential.Blocked electrodes or those whose resistance was not between 3-6Mf arediscarded. The electrode tip is then lowered onto the retina under videoobservation, with a 1 nA 40 Hz square-wave applied current. The angle be-tween the electrode and the retina surface is t45 degrees. The electrode is
115
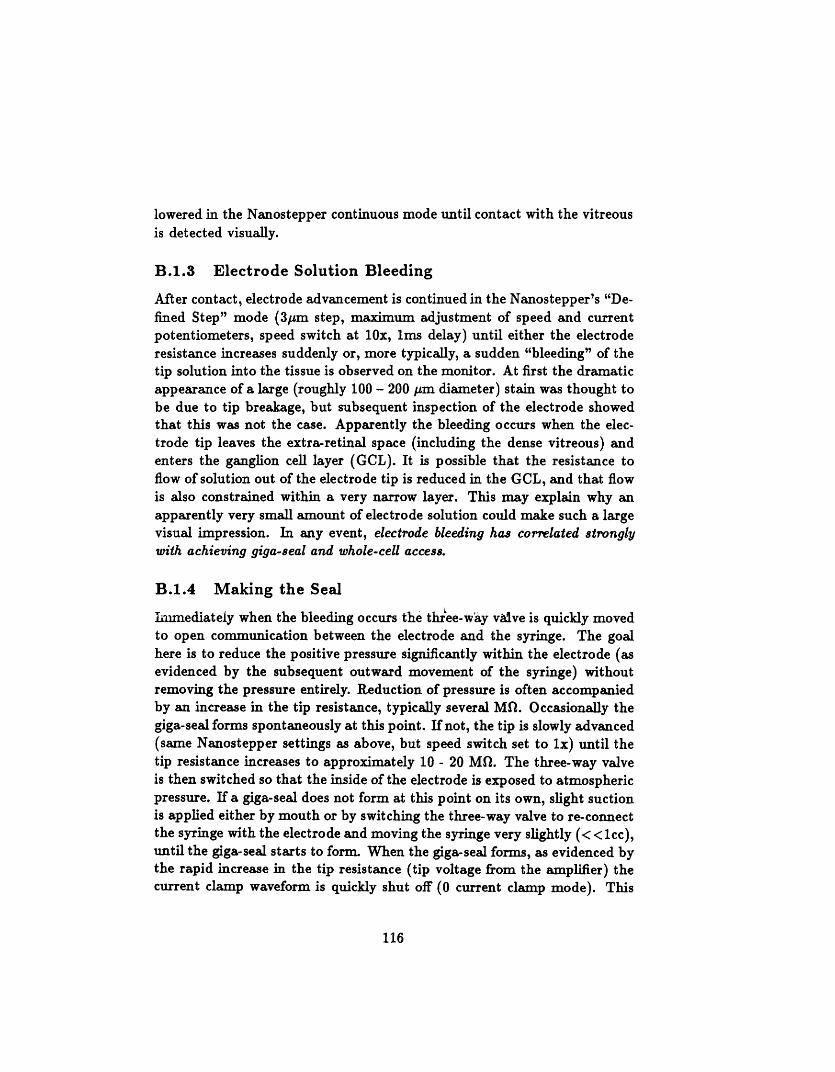
lowered in the Nanostepper continuous mode until contact with the vitreousis detected visually.
B.1.3 Electrode Solution Bleeding
After contact, electrode advancement is continued in the Nanostepper's "De-fined Step" mode (3pm step, maximum adjustment of speed and currentpotentiometers, speed switch at 10x, ms delay) until either the electroderesistance increases suddenly or, more typically, a sudden "bleeding" of thetip solution into the tissue is observed on the monitor. At first the dramaticappearance of a large (roughly 100 - 200 pm diameter) stain was thought tobe due to tip breakage, but subsequent inspection of the electrode showedthat this was not the case. Apparently the bleeding occurs when the elec-trode tip leaves the extra-retinal space (including the dense vitreous) andenters the ganglion cell layer (GCL). It is possible that the resistance toflow of solution out of the electrode tip is reduced in the GCL, and that flowis also constrained within a very narrow layer. This may explain why anapparently very small amount of electrode solution could make such a largevisual impression. In any event, electrode bleeding has correlated stronglywith achieving giga-seal and whole-cell access.
B.1.4 Making the Seal
Imnediately when the bleeding occurs the three-way vlve is quickly movedto open communication between the electrode and the syringe. The goalhere is to reduce the positive pressure significantly within the electrode (asevidenced by the subsequent outward movement of the syringe) withoutremoving the pressure entirely. Reduction of pressure is often accompaniedby an increase in the tip resistance, typically several MQ. Occasionally thegiga-seal forms spontaneously at this point. If not, the tip is slowly advanced(same Nanostepper settings as above, but speed switch set to lx) until thetip resistance increases to approximately 10 - 20 Mfl. The three-way valveis then switched so that the inside of the electrode is exposed to atmosphericpressure. If a giga-seal does not form at this point on its own, slight suctionis applied either by mouth or by switching the three-way valve to re-connectthe syringe with the electrode and moving the syringe very slightly (< <lcc),until the giga-seal starts to form. When the giga-seal forms, as evidenced bythe rapid increase in the tip resistance (tip voltage from the amplifier) thecurrent clamp waveform is quickly shut off (0 current clamp mode). This
116
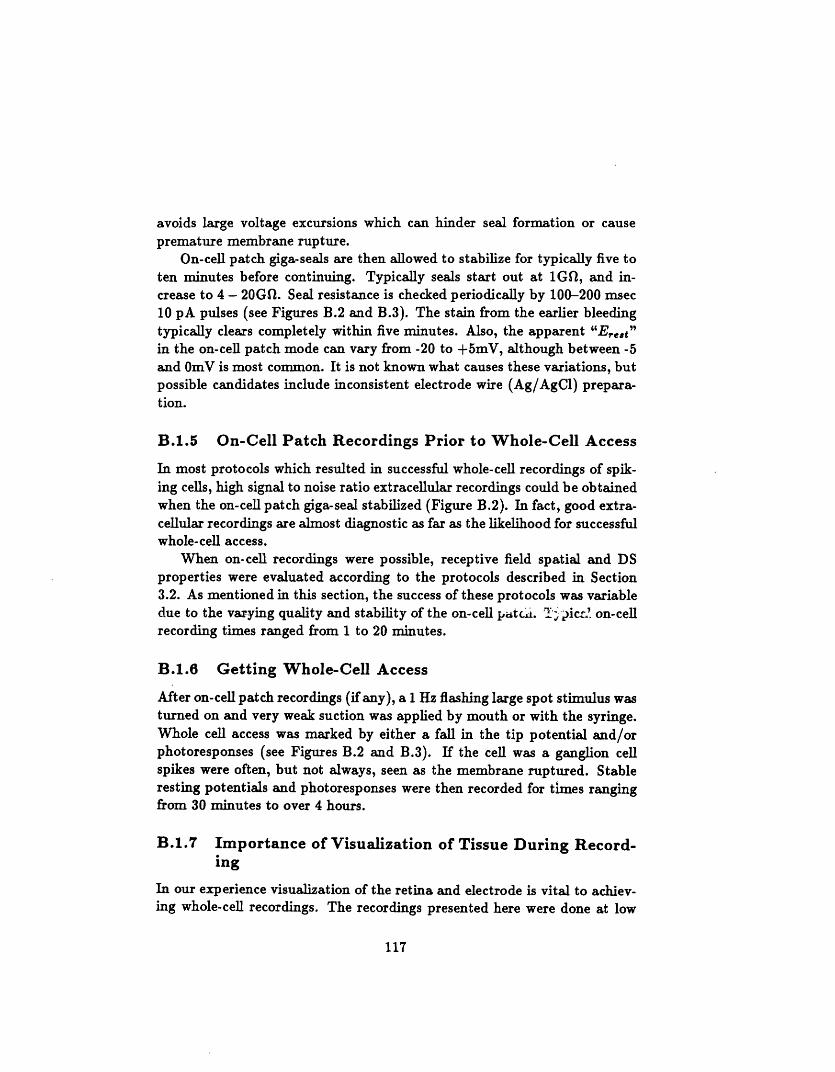
avoids large voltage excursions which can hinder seal formation or causepremature membrane rupture.
On-cell patch giga-seals are then allowed to stabilize for typically five toten minutes before continuing. Typically seals start out at 1GOf, and in-crease to 4 - 20GO. Seal resistance is checked periodically by 100-200 msec10 pA pulses (see Figures B.2 and B.3). The stain from the earlier bleedingtypically clears completely within five minutes. Also, the apparent "Eet"in the on-cell patch mode can vary from -20 to +5mV, although between -5and OmV is most common. It is not known what causes these variations, butpossible candidates include inconsistent electrode wire (Ag/AgC1) prepara-tion.
B.1.5 On-Cell Patch Recordings Prior to Whole-Cell Access
In most protocols which resulted in successful whole-cell recordings of spik-ing cells, high signal to noise ratio extracellular recordings could be obtainedwhen the on-cell patch giga-seal stabilized (Figure B.2). In fact, good extra-cellular recordings are almost diagnostic as far as the likelihood for successfulwhole-cell access.
When on-cell recordings were possible, receptive field spatial and DSproperties were evaluated according to the protocols described in Section3.2. As mentioned in this section, the success of these protocols was variabledue to the varying quality and stability of the on-cell patci. T ic on-cellrecording times ranged from 1 to 20 minutes.
B.1.6 Getting Whole-Cell Access
After on-cell patch recordings (if any), a 1 Hz flashing large spot stimulus wasturned on and very weak suction was applied by mouth or with the syringe.Whole cell access was marked by either a fall in the tip potential and/orphotoresponses (see Figures B.2 and B.3). If the cell was a ganglion cellspikes were often, but not always, seen as the membrane ruptured. Stableresting potentials and photoresponses were then recorded for tmes rangingfrom 30 minutes to over 4 hours.
B.1.7 Importance of Visualization of Tissue During Record-ing
In our experience visualization of the retina and electrode is vital to achiev-ing whole-cell recordings. The recordings presented here were done at low
117
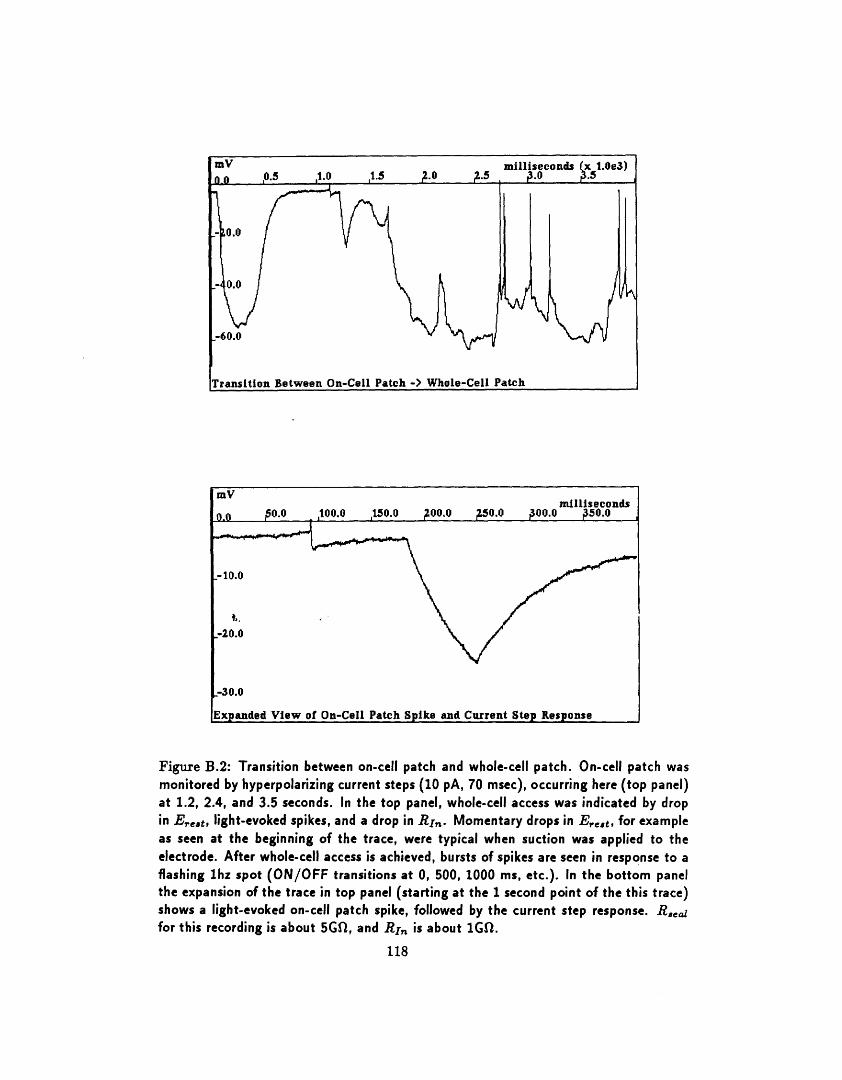
mVmilliseconds
0o o p.0 ,100.0 ,150.0 ;00.0 P0.0 A00.0 350.0
-10.0
.-20.0
.-30.0
Expanded View of On-Cell Patch Spike and Current Step Response
Figure B.2: Transition between on-cell patch and whole-cell patch. On-cell patch wasmonitored by hyperpolarizing current steps (10 pA, 70 msec), occurring here (top panel)at 1.2, 2.4, and 3.5 seconds. In the top panel, whole-cell access was indicated by dropin E,,,et, light-evoked spikes, and a drop in RI,. Momentary drops in E, et, for exampleas seen at the beginning of the trace, were typical when suction was applied to theelectrode. After whole-cell access is achieved, bursts of spikes are seen in response to aflashing lhz spot (ON/OFF transitions at 0, 500, 1000 ms, etc.). In the bottom panelthe expansion of the trace in top panel (starting at the 1 second point of the this trace)shows a light-evoked on-cell patch spike, followed by the current step response. Reafor this recording is about 5GQ, and RIn is about 1GQ.
118
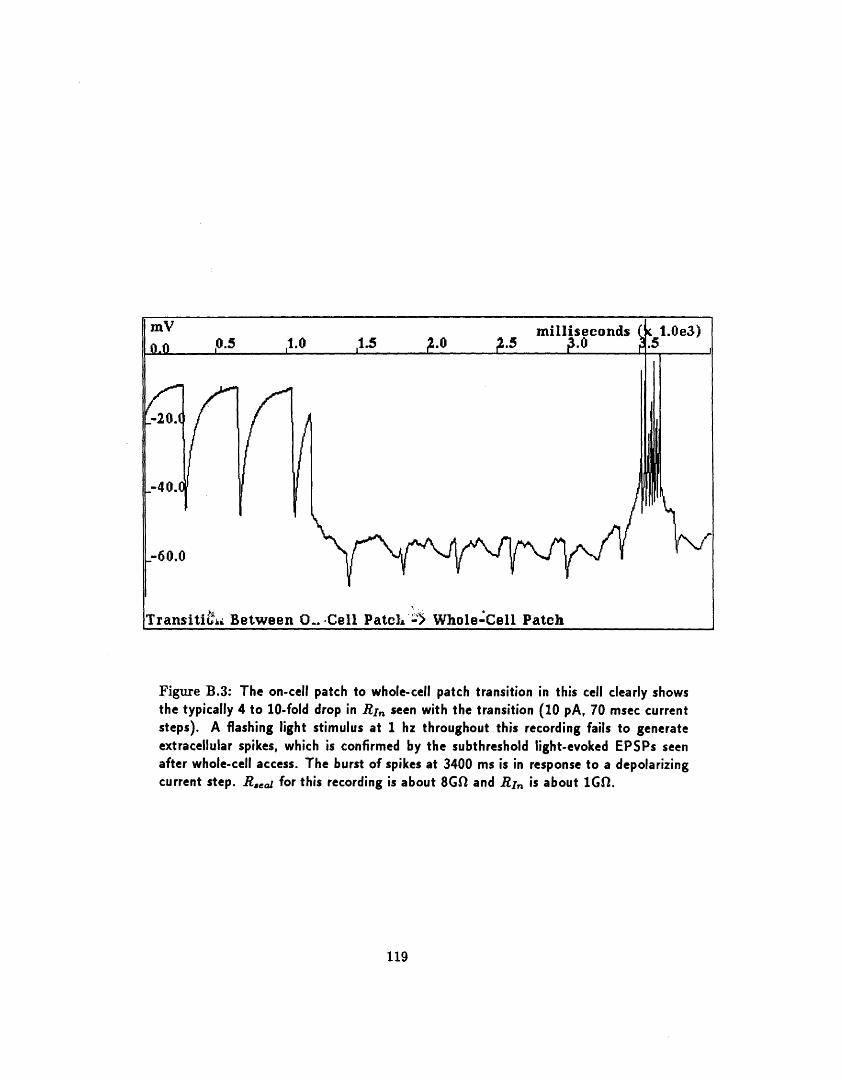
ii Between O .- Cell Patch :. Whole-Cell Patch
Figure B.3: The on-cell patch to whole-cell patch transition in this cell clearly showsthe typically 4 to 10-fold drop in RI, seen with the transition (10 pA, 70 msec currentsteps). A flashing light stimulus at 1 hz throughout this recording fails to generateextracellular spikes, which is confirmed by the subthreshold light-evoked EPSPs seenafter whole-cell access. The burst of spikes at 3400 ms is in response to a depolarizingcurrent step. R,,ea for this recording is about 8GSI and RI, is about 1GfI.
119
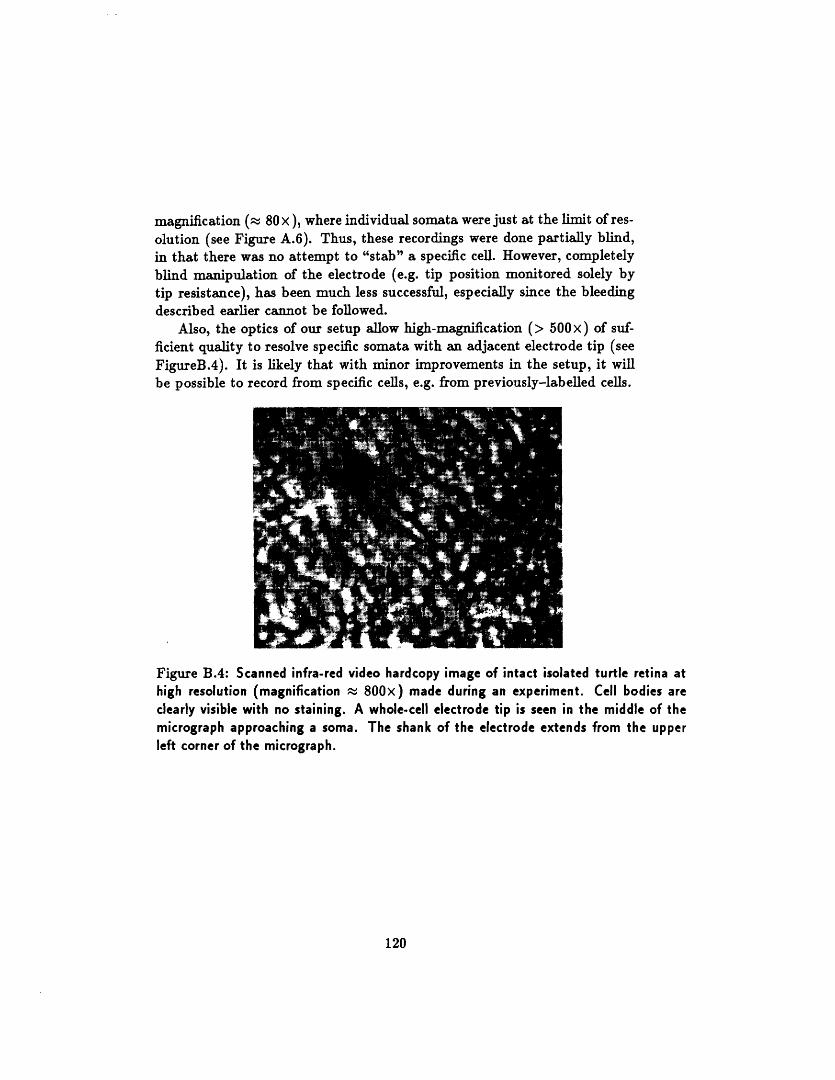
magnification ( 80x ), where individual somata were just at the limit of res-olution (see Figure A.6). Thus, these recordings were done partially blind,in that there was no attempt to "stab" a specific cell. However, completelyblind manipulation of the electrode (e.g. tip position monitored solely bytip resistance), has been much less successful, especially since the bleedingdescribed earlier cannot be followed.
Also, the optics of our setup allow high-magnification (> 500x) of suf-ficient quality to resolve specific somata with an adjacent electrode tip (seeFigureB.4). It is likely that with minor improvements in the setup, it willbe possible to record from specific cells, e.g. from previously-labelled cells.
Figure B.4: Scanned infra-red video hardcopy image of intact isolated turtle retina athigh resolution (magnification P 800x) made during an experiment. Cell bodies areclearly visible with no staining. A whole-cell electrode tip is seen in the middle of themicrograph approaching a soma. The shank of the electrode extends from the upperleft corner of the micrograph.
120
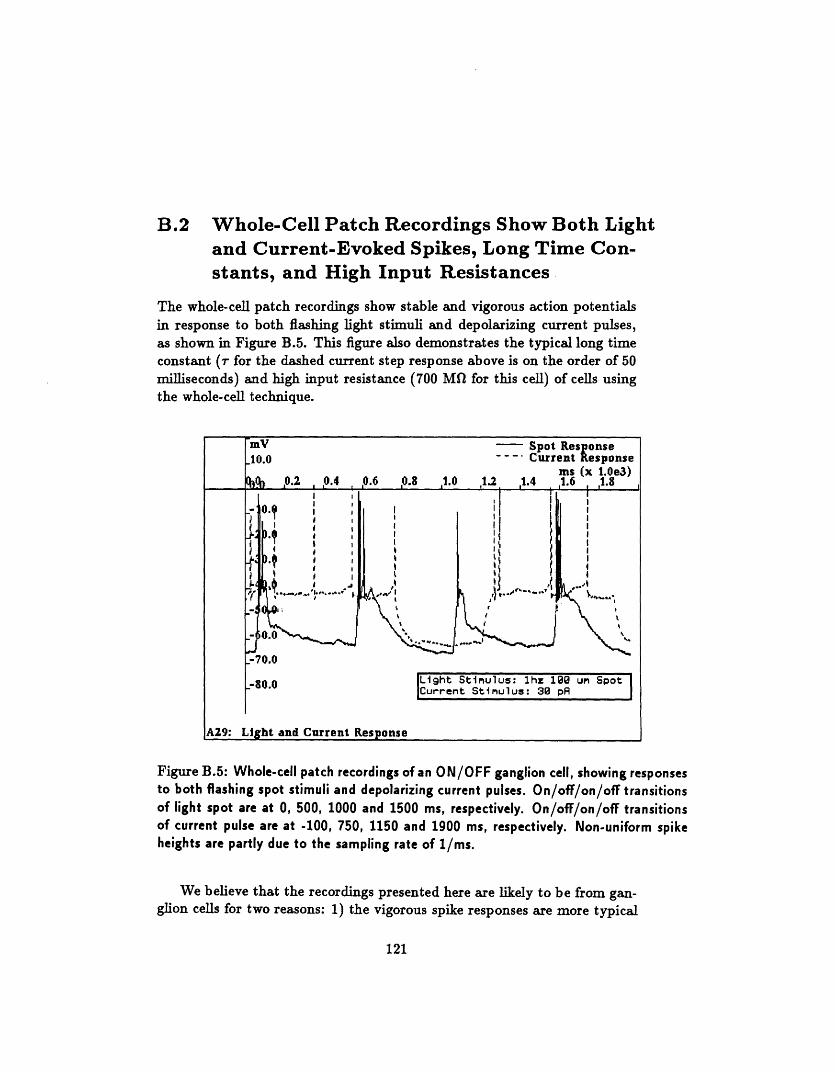
B.2 Whole-Cell Patch Recordings Show Both Lightand Current-Evoked Spikes, Long Time Con-stants, and High Input Resistances
The whole-cell patch recordings show stable and vigorous action potentialsin response to both flashing light stimuli and depolarizing current pulses,as shown in Figure B.5. This figure also demonstrates the typical long timeconstant ( for the dashed current step response above is on the order of 50milliseconds) and high input resistance (700 Mfthe whole-cell technique.
for this cell) of cells using
Figure B.5: Whole-cell patch recordings of an ON/OFF ganglion cell, showing responsesto both flashing spot stimuli and depolarizing current pulses. On/off/on/off transitionsof light spot are at 0, 500, 1000 and 1500 ms, respectively. On/off/on/off transitionsof current pulse are at -100, 750, 1150 and 1900 ms, respectively. Non-uniform spikeheights are partly due to the sampling rate of 1/ms.
We believe that the recordings presented here are likely to be from gan-glion cells for two reasons: 1) the vigorous spike responses are more typical
121
mYV Spot Response10.0 -- Current Response
ms (x 1.0e3)%__ 0.2 0.4 0.6 0.8 1.0 1.2 1.4 1.6 1.8
, _
! I ,i I
I I
-70.0
[I00Light Stimulus: 1hz 12a um Spot .-80.0 [Current Sti m ulus: 30 pR
A29: Light and Current Response
of the classic ganglion cell response, rather than from amacrine cells, and2) the electrode seal is established very soon after initial contact with theretinal surface (ganglion cell layer). However, it is still possible that somerecordings are from spiking displaced amacrine cells.
B.3 Reduction of IPSPS Over Time With ATP-Less Whole-Cell Patch Electrode Solution
In most of the retinal cells that we have recorded from using the whole-celltechnique, IPSPs are observed for large spots (typically > 200,pm) for thefirst 10 to 30 minutes of the recordings. When ATP is not included in theelectrode solution the IPSPs eventually disappear, often losing more than50% of amplitude within a 30 second period. EPSPs, on the other hand,are much more stable, with many cells showing less than 10% attenuationof EPSPs over 1 to 2 hours. Figures B.6 through B.12 demonstrate thereduction of IPSPs to large spots over time.
B.3.1 Antagonistic Center/Surround is Maintained DespiteLocal Reduction of IPSPS
That the attenuation of inhibition using our technique is a local phenomenonis supported by the maintenF- -e of an inhibitory surround in most cells.This is demonstrated in Figures B.10, B.11, and B.12, where the largestresponse continues to be from a sub-maximal spot, despite lack of IPSPs.These results also point out that antagonistic center/surround propertiesare derived from interactions both pre and post-synaptic to the ganglioncell, and is, in some cases, purely post-synaptic.
B.4 Measurement of Passive Parameters with Whole-Cell Patch Recordings
Data from 59 cells recorded under whole-cell conditions were pooled to es-timate RIn, To, and E,.et. The protocol used was a 10 trial average of theresponse under current clamp to a 10 pA square wave (no DC offset). Lin-ear regression on the logarithm of this response was used to derive r0 . Anexample response is shown in Figure B.13.
122
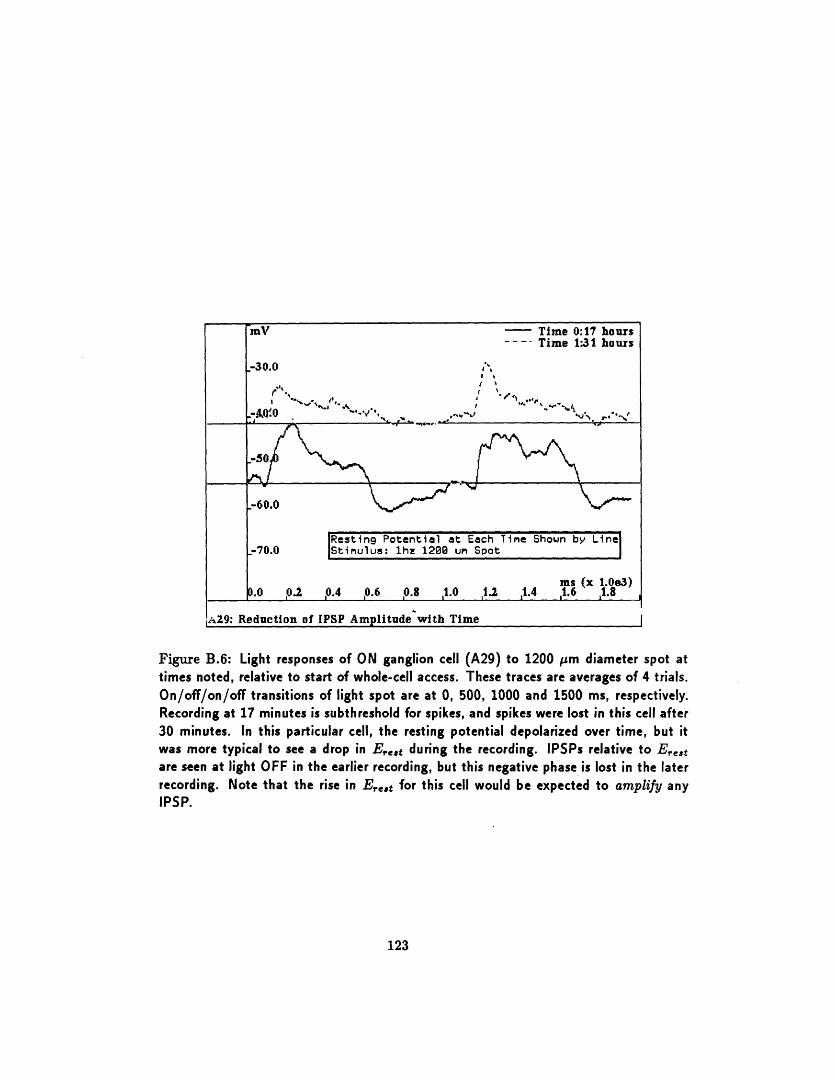
mV - Time 0:17 hours... Time 1:31 hours
-30.0
r r '*
A .j Ad .. . · .
-50
-60.0
IResting Potential at Each Time Shown by Line-70.0 IStimulus: hz 12C0 un Spot
ms (x 1.083).0 .2 0.4 ,0.6 0.8 ,1.0 ,1.2 1.4 1.6 ,1.8
A29: Reduction of IPSP Amplitude with Time
Figure B.6: Light responses of ON ganglion cell (A29) to 1200 /m diameter spot attimes noted, relative to start of whole-cell access. These traces are averages of 4 trials.On/off/on/off transitions of light spot are at 0, 500, 1000 and 1500 ms, respectively.Recording at 17 minutes is subthreshold for spikes, and spikes were lost in this cell after30 minutes. In this particular cell, the resting potential depolarized over time, but itwas more typical to see a drop in E,e,t during the recording. IPSPs relative to E,,e,tare seen at light OFF in the earlier recording, but this negative phase is lost in the laterrecording. Note that the rise in E,,t for this cell would be expected to amplify anyIPSP.
123
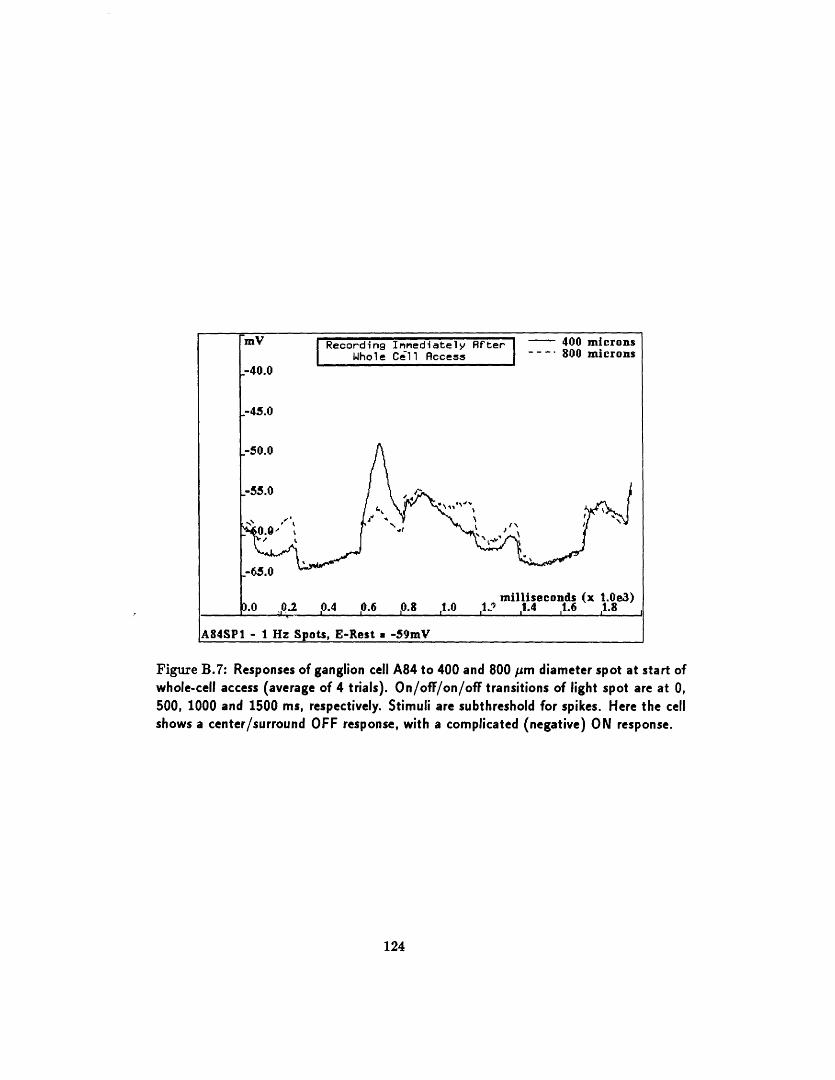
Figure B.7: Responses of ganglion cell A84 to 400 and 800 Jim diameter spot at start ofwhole-cell access (average of 4 trials). On/off/on/off transitions of light spot are at 0,500, 1000 and 1500 ms, respectively. Stimuli are subthreshold for spikes. Here the cellshows a center/surround OFF response, with a complicated (negative) ON response.
124
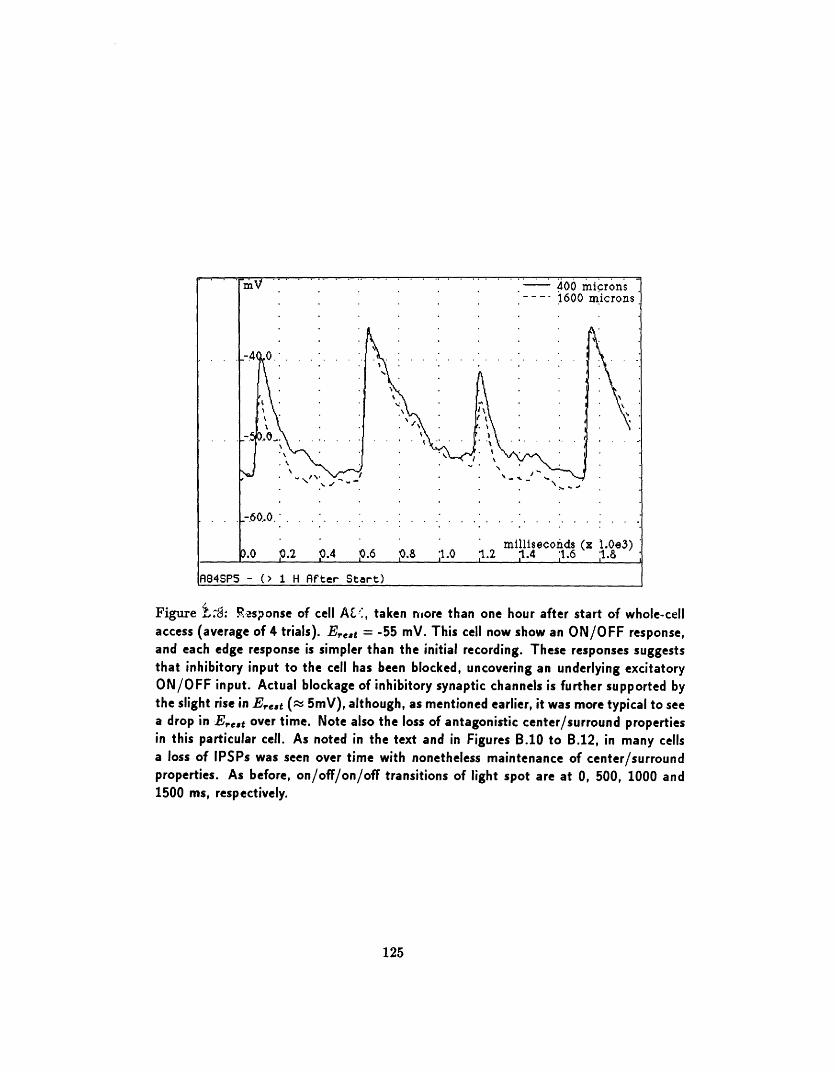
Figure .zS: Response of cell AU:, taken ore than one hour after start of whole-cellaccess (average of 4 trials). E,,,t = -55 mV. This cell now show an ON/OFF response,and each edge response is simpler than the initial recording. These responses suggeststhat inhibitory input to the cell has been blocked, uncovering an underlying excitatoryON/OFF input. Actual blockage of inhibitory synaptic channels is further supported bythe slight rise in Er,,t ( 5mV), although, as mentioned earlier, it was more typical to seea drop in E,,,t over time. Note also the loss of antagonistic center/surround propertiesin this particular cell. As noted in the text and in Figures B.10 to B.12, in many cellsa loss of IPSPs was seen over time with nonetheless maintenance of center/surroundproperties. As before, on/off/on/off transitions of light spot are at 0, 500, 1000 and1500 ms, respectively.
125
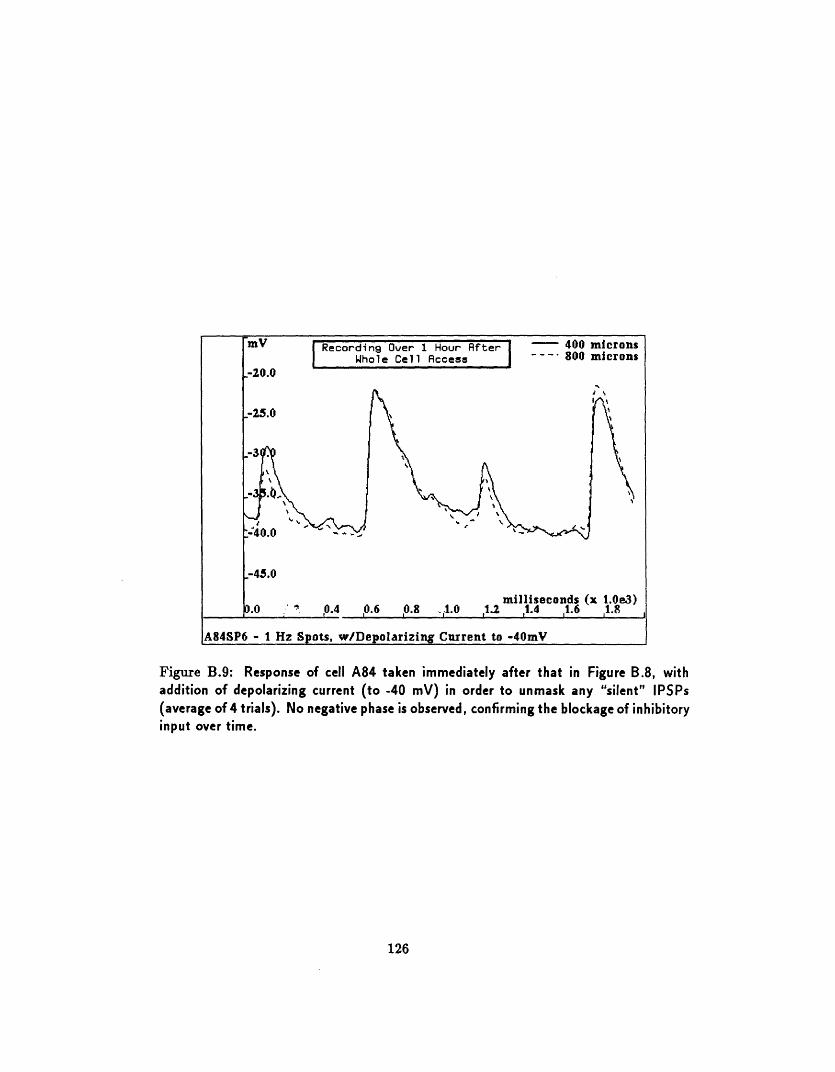
Figure B.9: Response of cell A84 taken immediately after that in Figure B.8, withaddition of depolarizing current (to -40 mV) in order to unmask any "silent" IPSPs(average of 4 trials). No negative phase is observed, confirming the blockage of inhibitoryinput over time.
126
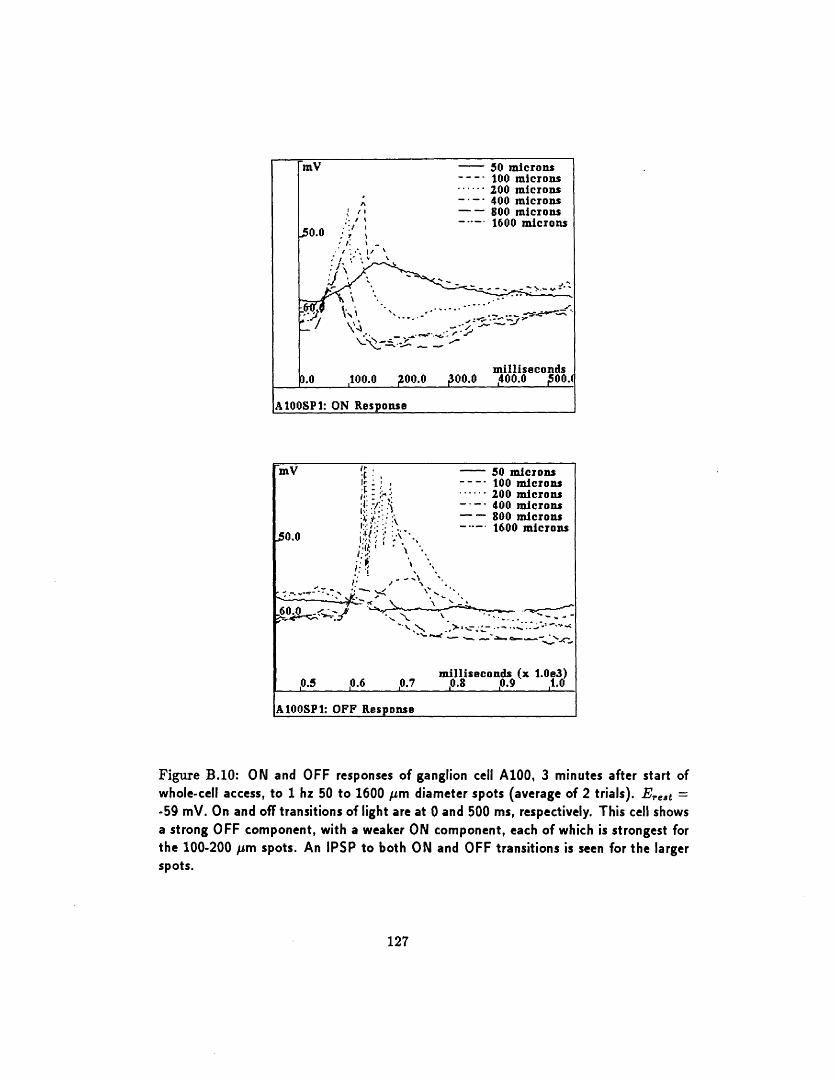
1AIOSPI: ON Response
mV I- 50 microns1i': , ---- 100 micronsi : ...... 200 microns
ii - 2 400 micronsII4 Jo -- 8400 microns
--- - 800 microns*: ...; 1600 mcrons.50.0
milliseconds (x 1.0e3),o.s ,.6 ,0.7 ,.8 ,o.9 ,1.o
A10OSPI: OFF Response
Figure B.10: ON and OFF responses of ganglion cell A100, 3 minutes after start ofwhole-cell access, to 1 hz 50 to 1600 m diameter spots (average of 2 trials). Eret =-59 mV. On and off transitions of light are at 0 and 500 ms, respectively. This cell showsa strong OFF component, with a weaker ON component, each of which is strongest forthe 100-200 m spots. An IPSP to both ON and OFF transitions is seen for the largerspots.
127
mV - 0 microns- . 100 microns...... 200 microns,. 400 microns, -- 800 microns- ' 1600 microns
,50.0 .,· . -
· . , ,- ' .. o-... - ./
milliseconds.o ,oo100.0 o00.0 o00.0 ,4o0.o o0.
I
-- ---
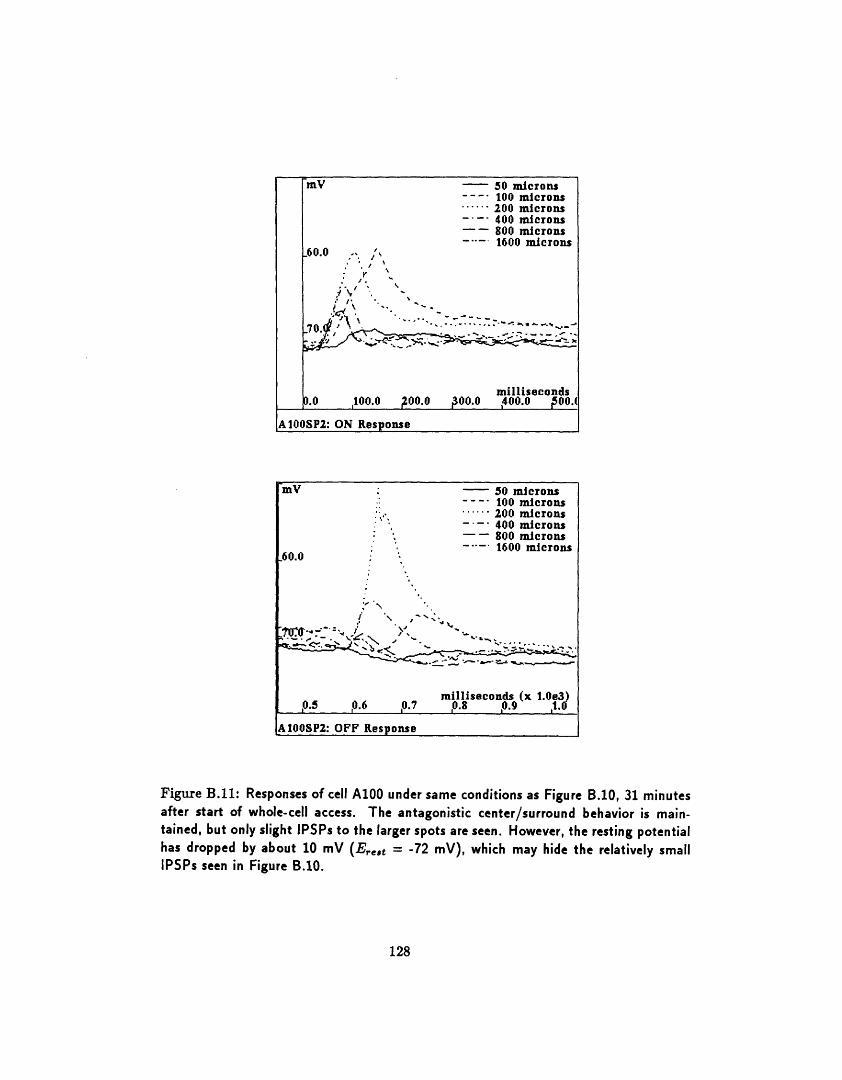
mV - 50 microns--- 100 microns...... 200 microns
' - 400 microns: ' ---- 800 microns,6 0 - .... 1600 microns
60.0
. W.
,0.5 0 6 07 milliseconds (x 1.Oe3)0. 0.6 \0.? 0.8 0.9 ,1.0
A1OOSP2: OFF Response
Figure B.11: Responses of cell A100 under same conditions as Figure B.10, 31 minutesafter start of whole-cell access. The antagonistic center/surround behavior is main-tained, but only slight IPSPs to the larger spots are seen. However, the resting potentialhas dropped by about 10 mV (Eret = -72 mV), which may hide the relatively smallIPSPs seen in Figure B.10.
128
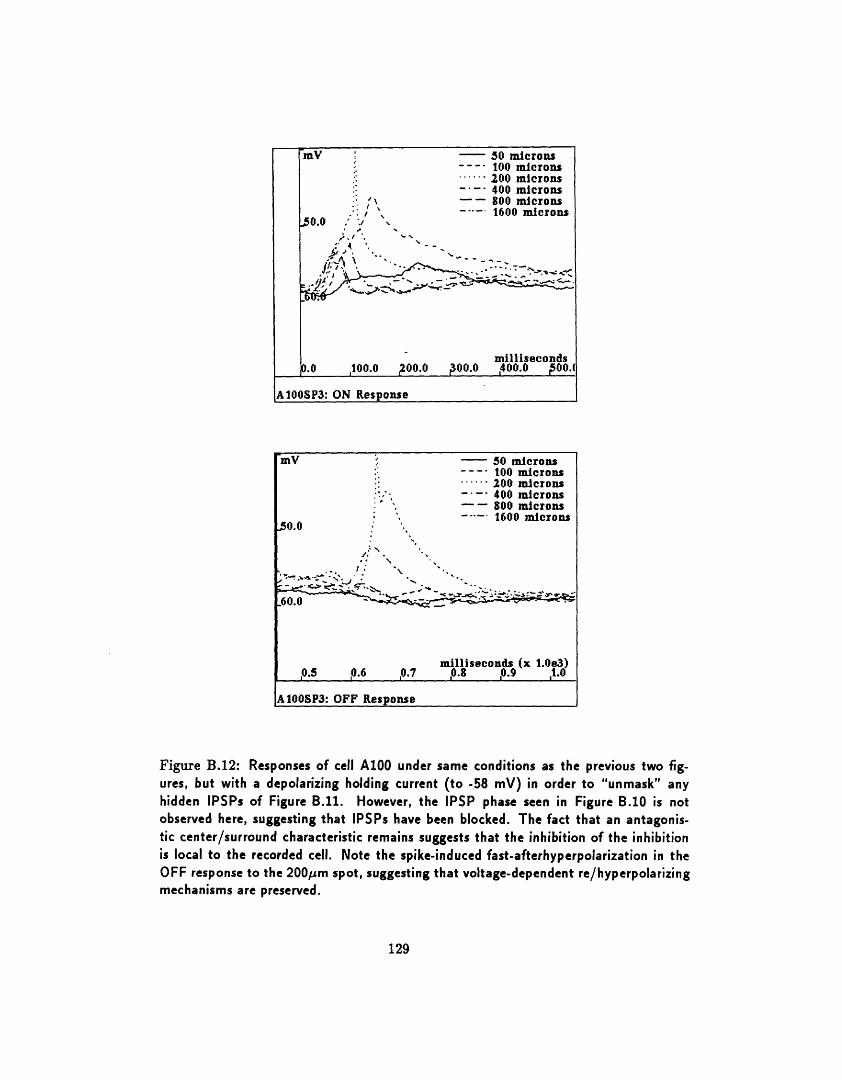
F.U IUU.U suU.U PUU.U ,UU.U pUU.I
AI00SP3: ON Response
mV : 50 microns---. 100 microns...... 200 microns- . 400 microns-- 800 microns--- 1600 microns
.50.0
milliseconds (x 1.Oe3)0.s 0.6 , 0.7 0.8 .9 tO.0
AIOOSP3: OFF Response
Figure B.12: Responses of cell A100 under same conditions as the previous two fig-ures, but with a depolarizing holding current (to -58 mV) in order to "unmask" anyhidden IPSPs of Figure B.11. However, the IPSP phase seen in Figure B.10 is notobserved here, suggesting that IPSPs have been blocked. The fact that an antagonis-tic center/surround characteristic remains suggests that the inhibition of the inhibitionis local to the recorded cell. Note the spike-induced fast-afterhyperpolarization in theOFF response to the 200pm spot, suggesting that voltage-dependent re/hyperpolarizingmechanisms are preserved.
129
mV - 50 microns--- 100 microns. ..... 200 microns:: . 400 microns.-- 800 microns
-.: / - 1600 microns50.0 . ,
m/. ', cn
milliseconds~..- , B.*. A ~.",e ~' ~,.n. a- Am., aeb d
.
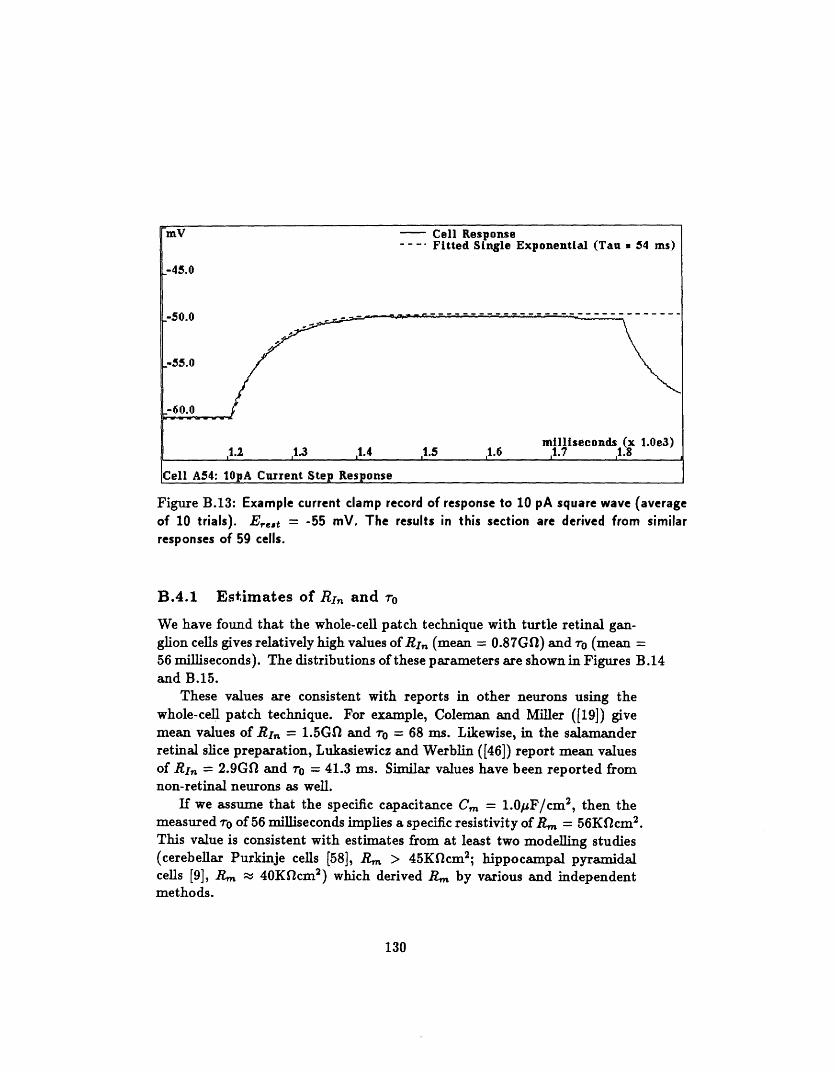
Figure B.13: Example current clamp record of response to 10 pA square wave (averageof 10 trials). E,,,t = -55 mV. The results in this section are derived from similarresponses of 59 cells.
B.4.1 Estimates of RIn and ro
We have found that the whole-cell patch technique with turtle retinal gan-glion cells gives relatively high values of RI, (mean = 0.87GO) and r0 (mean =56 milliseconds). The distributions of these parameters are shown in Figures B.14and B.15.
These values are consistent with reports in other neurons using thewhole-cell patch technique. For example, Coleman and Miller ([19]) givemean values of RI, = 1.5GO and r0 = 68 ms. Likewise, in the salamanderretinal slice preparation, Lukasiewicz and Werblin ([46]) report mean valuesof RI, = 2.9GQ and r0 = 41.3 ms. Similar values have been reported fromnon-retinal neurons as well.
If we assume that the specific capacitance Cm = 1.OpF/cm2, then themeasured r0 of 56 milliseconds implies a specific resistivity of Rm = 56KOcm 2.This value is consistent with estimates from at least two modelling studies(cerebellar Purkinje cells [58], R > 45Kfcm2; hippocampal pyramidalcells [9], R 40Kflcm2) which derived Rm by various and independentmethods.
130
'ell A4: 101PA Crent Step Response
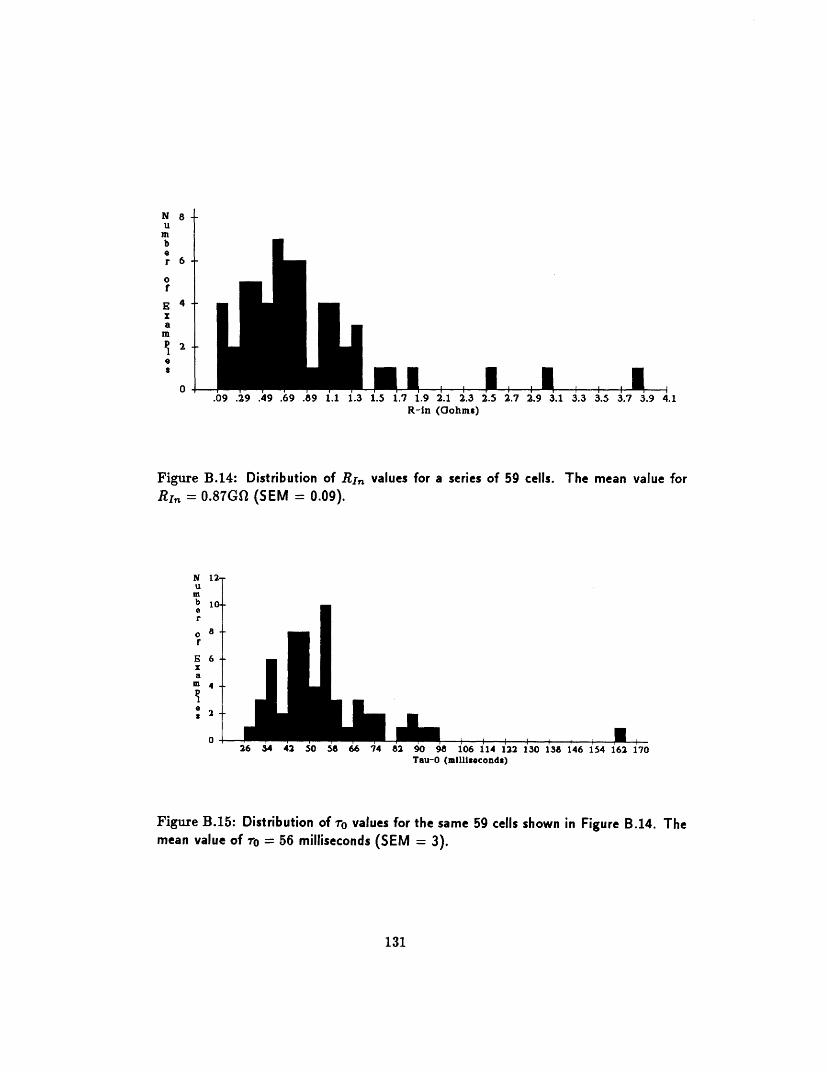
* I I -I I I I I.09 .29 .49 .69 .89 1.1 1.3 1.5 1.7 1.9 2.1 2.3 2.5 2.7 2.9 3.1 3.3 3.5 3.7 3.9 4.1
R-in (Gohms)
Figure B.14: Distribution of RI, values forRIn = 0.87GQ (SEM = 0.09).
Nu
ar
orExam
3
a series of 59 cells. The mean value for
ai1O
26 34 42 50 58 66 74 82 90 98 106 114 122Tau-0 (milllsoconds)
130 138 146 154
Figure B.15: Distribution of ro values for the same 59 cellsmean value of To = 56 milliseconds (SEM = 3).
shown in Figure B.14. The
131
8
6
4
2
NUmbar
of
E&am
arI
0
162 170
B.4.2 Effect of Non-Linear Membrane on RI, and ro
Given the fairly large voltage excursion (typically 10 mV) and long timeconstant of the step responses, and that the responses had both a hyper-polarizing and depolarizing component (relative to the resting potential), itis likely that non-linear conductances participated in shaping the responses.Since many rectifying channels tend to activate in this voltage range (partic-ularly for depolarizations), it is possible that this protocol underestimatedboth RI, and r0 .
B.4.3 Effect of Electrode Seal on RI, and r0
In addition, given the the high values for both RI, and ro it is useful toconsider the contribution of the giga-seal (between the electrode and theextracellular space) on these parameters. A rough estimate would be toassume a measured value of Rr, = 1G11 and consider a lower bound ofR,,a = 2Gfl. For this value of Ra,,a, half of the input conductance (1/R,,)would be due to electrode leak, and thus the true RI, = 2GO. Likewise, To
under these conditions would be underestimated by a factor of 2. In practice,Revoi > 5G1f, but this value is of course measured prior to whole-cell access,and it is possible that the seal is partly compromised by the whole-cell access.In summary, these factors may also contribute to an underestimation of bothRI, and ro0
B.4.4 Estimation of Erot
After IPSP attenuation (see Section B.4.5), the resting potential tended tobe stable for the remainder of the recording. For the set of 59 cells justpresented, the mean value for E,,t was -56 mV. The distribution of E,,tvalues in these cells is shown in Figure B.16.
B.4.5 Correlations Between Passive Parameters
As shown in Figures B.17, B.18 and B.19, there was only a slight positivepair-wise correlation between RI,, 0 and E,ot. One possible mechanismcontributing to these correlations involves the state of the inhibitory synap-tic channels. Typically, the attenuation of IPSPs during whole-cell accesswas accompanied by a drop in E,,ret by 10 to 15 mV. In a few cells,RI,, also dropped as the IPSPs disappeared by approximately 50%. Thesepreliminary observations suggest that blockage of IPSPs may be caused by
132
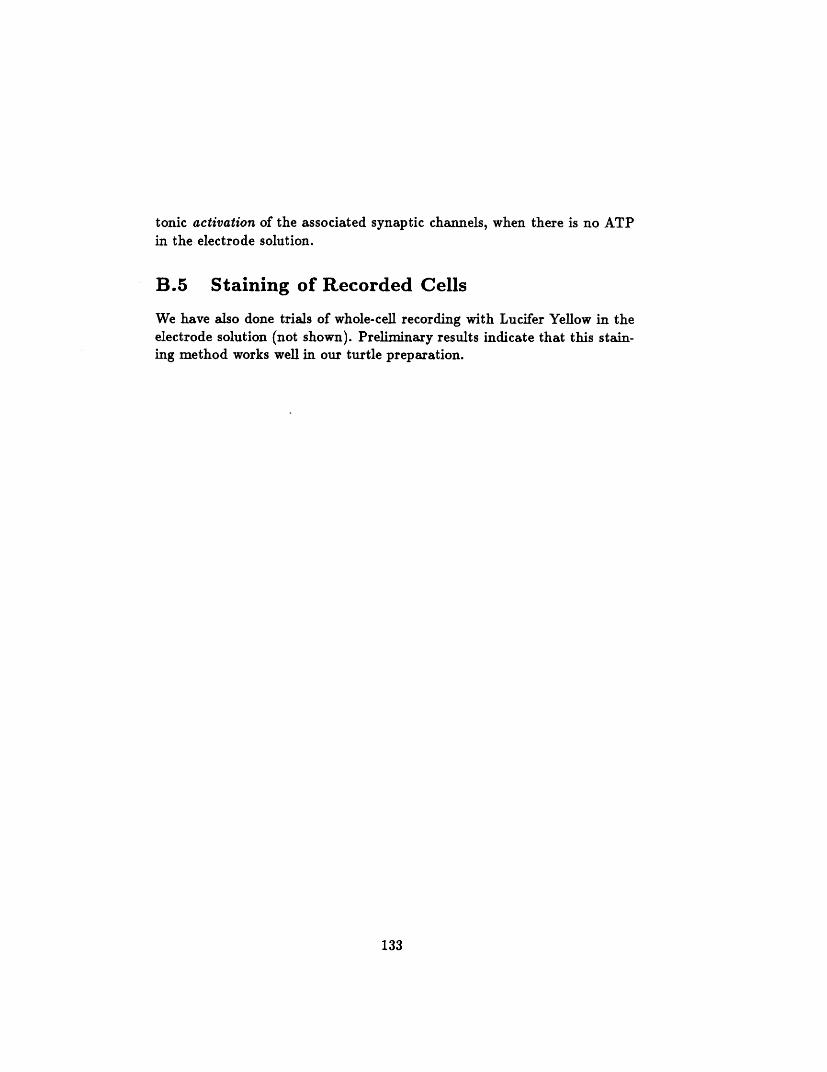
tonic activation of the associated synaptic channels, when there is no ATPin the electrode solution.
B.5 Staining of Recorded Cells
We have also done trials of whole-cell recording with Lucifer Yellow in theelectrode solution (not shown). Preliminary results indicate that this stain-ing method works well in our turtle preparation.
133
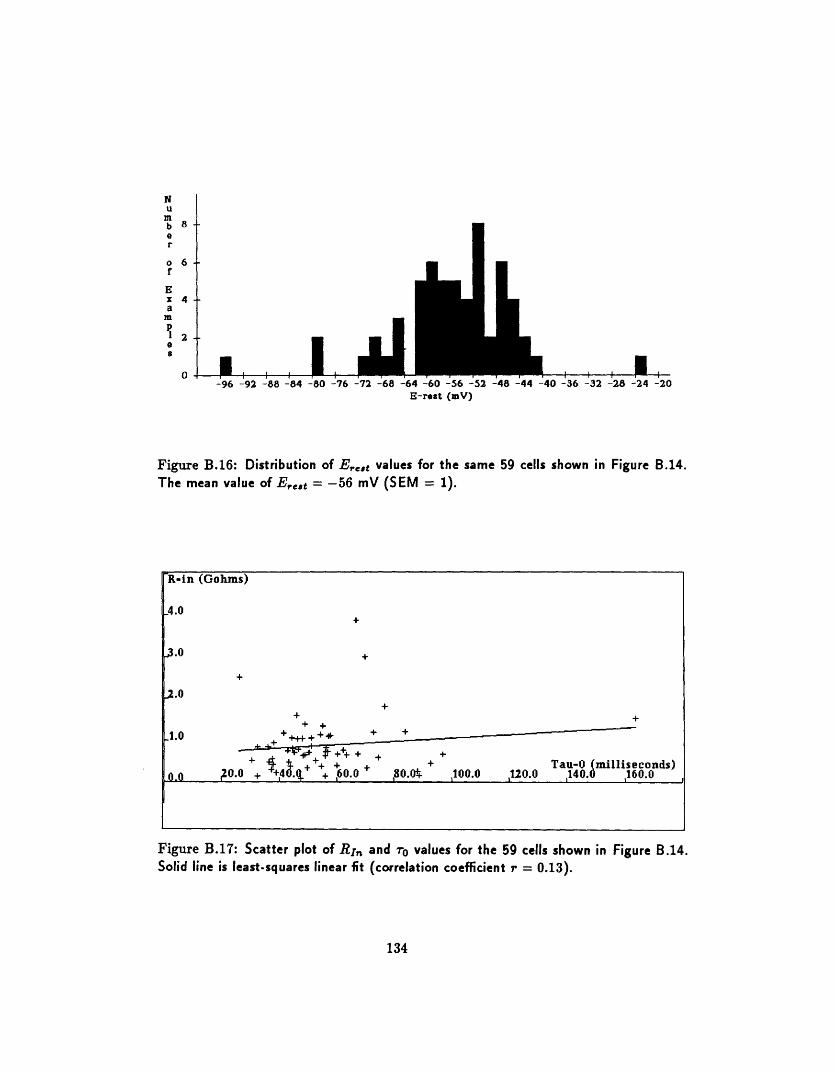
I -96 -92 -88 -84 -80 -76 -72 -68 -64 -60 -56 -52 -48 -44 -40 -36 -32 -28 -24 -20
E-rest (mV)
Figure B.16: Distribution of E,e,t values forThe mean value of E,,,t = -56 mV (SEM =
the same 59 cells shown in Figure B.14.1).
Figure B.17: Scatter plot of RI, and r0 values for the 59 cells shown in Figure B.14.Solid line is least-squares linear fit (correlation coefficient r = 0.13).
134
NUmb0r
orfEXa
m
p0S
8
6
4
2
0 _·I · _·g g g r ' I I f
I +I
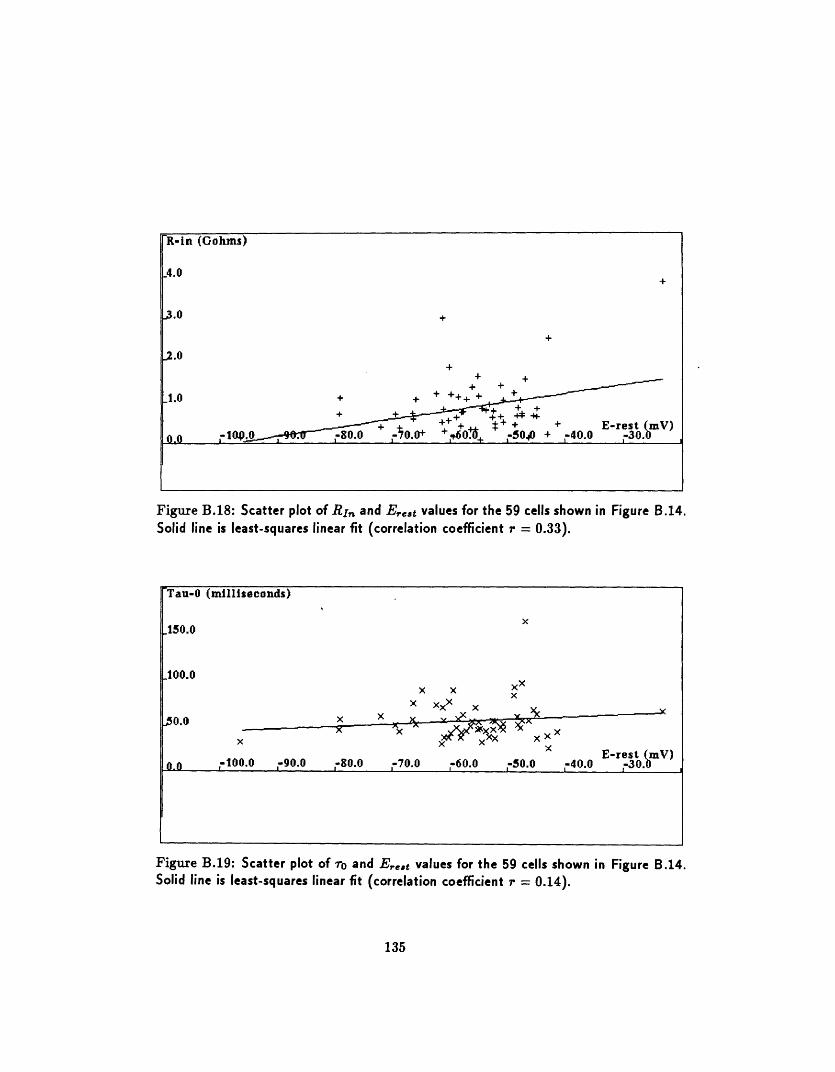
Figure B.18: Scatter plot of RIn and E,e,t values for the 59 cells shown in Figure B.14.Solid line is least-squares linear fit (correlation coefficient r = 0.33).
'Tau-0 (milliseconds)
x150.0
100.0x x xXx
x xxx x
xX x xXE-rest (mV)
0.0 ~-100.0 -90.0 -80.0 -70.0 -60.0 -50.0 -40.0 30.0
Figure B.19: Scatter plot of To and Er,.t values for the 59 cells shown in Figure B.14.Solid line is least-squares linear fit (correlation coefficient r = 0.14).
135
R-in (Gohms)
4.0
3.0 +
2.0+
-~~~1.0~+ +1.0 + ' + ++++ . +
l+++ + + E-rest mV)0l0 a-104. -8 0. -70.0 + +. + -40.0 -30.
Appendix C
The SURF-HIPPO NeuronSimulator
C.1 Introduction
The SURF-HIPPO Neuron Simulator is a circuit simulation package forinvestigating morphometricly and biophysically detailed models of singleneurons and small networks of neurons (Figure C.1). SURF-HIPPO is basedin part on the SURF circuit simulator, written by Don Webber, VLSI CADGroup at the University of California at Berkeley. SURF was written inboth Common LISP and *LISP, and SURF-HIPPO retains this option (the*LISP version for the Connection Machine (CM2) is under development).
SURF-HIPPO allows ready construction of multiple cells from variousfile formats (including the format used by the simulator package NEURON,written by Hines, see below), which can describe complicated dendritic treesin 3-space with distributed non-linearities and synaptic contacts betweencells. The retention of XYZ coordinates for each circuit node may be ex-ploited, for example, by simulations which use spatially-coded input, or withmultiple cell simulations that have contacts between cells defined by spatialproximity (Figure C.2). Stationary and moving two dimensional light input(for retinal simulations) is also provided. Multi-compartment intracellularcalcium accumulation is provided for modelling calcium-dependent processes(e.g. Ca++-dependent K+ channels).
This chapter provides an overview of SURF-HIPPO. Complete docu-mentation is included with the program code.
136
C.2 Numerical Methods
The serial version of SURF-HIPPO uses a numerical technique adapted fromthat of Hines ([37]) with some changes, including adaptive time steps. *LISPsimulations use the relaxation-based methods exclusively. At present, allsimulations are done with the direct (serial) methods.
Briefly, the key contribution of the Hines algorithm is an elegant orderingof tree circuit topologies - clearly relevant for neurons - that results in a tri-diagonal circuit matrix. The resulting matrix equation may then be solvedin O(n) time, as opposed to the O(n 2 ) time for a general matrix. Hinesalso proposed that the solving of voltage-dependent Hodgkin-Huxley channelparticle states may be done out of the loop (i.e. at times interleaved betweenthe node voltage time steps), since there is an inherent time delay between agiven node voltage and the state of any channel particles controlled by thatnode. This explicit solution of the particle states simplifies and speeds upthe overall circuit simulation.
C.3 Channel Models
All voltage-dependent channels are described with a modified Hodgkin-Huxley model ([10]). An advantage of this formulation is that channel par-ticle parameters are consistent and may be related to specific biophysicalmechanisms.
C.4 System Versions
One version of SURF-HIPPO, complete with extensive user interface (menus,3-D graphics of dendritic trees, automatic plotting) runs in the SymbolicsLISP Machine environment. Another (with a user interface currently underdevelopment) runs in the Sun environment (under Austin Kyoto CommonLisp (AKCL)). SURF-HIPPO is not "public domain" in the sense that it isnot supported, but inquiries are welcome.
C.5 SURF-HIPPO Basics
Functions which describe circuits may be written in a variety of differentways, allowing for a flexible and relatively general input base for circuitdescriptions. The simplest method is by calling the appropriate sequence
137
of "create-segment" functions. A more sophisticated method of construct-ing (complicated) cell geometries is with the "create-tree" function, whichtakes a list of tree node parameters and generates the "create-segment" callsautomatically.
Another method of entering cell descriptions is by tracing the histol-ogy directly on the screen, using SURF-HIPPO's Dynamic Neuron Builder(Figure C.3).
Finally, as mentioned above, SURF-HIPPO can read cell description filesin the format used for Hines's NEURON program.
C.6 Representation of Circuit Structure
Symbolically, circuits are composed of a set of object instances, of whichthere are several different types: nodes, segments, somata, channels, synapses,current sources, particles, concentration integrators, etc. There are manydifferent interrelationships between objects in a hierarchical fashion, e.g. aninstance of a channel object references an instance of a node object (corre-sponding to the electrical circuit node that it is attached to), an instance ofa segment or soma object that it is a part of, instances of particle and/orconcentration particle objects that determine the channel's conductance,and, indirectly, instances of particle nodes which correspond to the parti-cles' states.
The structure organization for a typical circuit element is as follows:
;Segment name is same a distal node name. Segments are added from soma out.(defstruct (segment :conc-name)(name "" :type string)
g-axial;Proximal node Prox o---/\/\/\--+---o Distal;Distal node I
memb-elements
Gnd(node-i nil :type node)(node-2 nil :type node)(cell nil :type cell)
;For retinal cells: 1 to 5 for dendrites in the inner;plexiform layer. IL if not in IPL.(ipl-stratum nil :type integer)
138
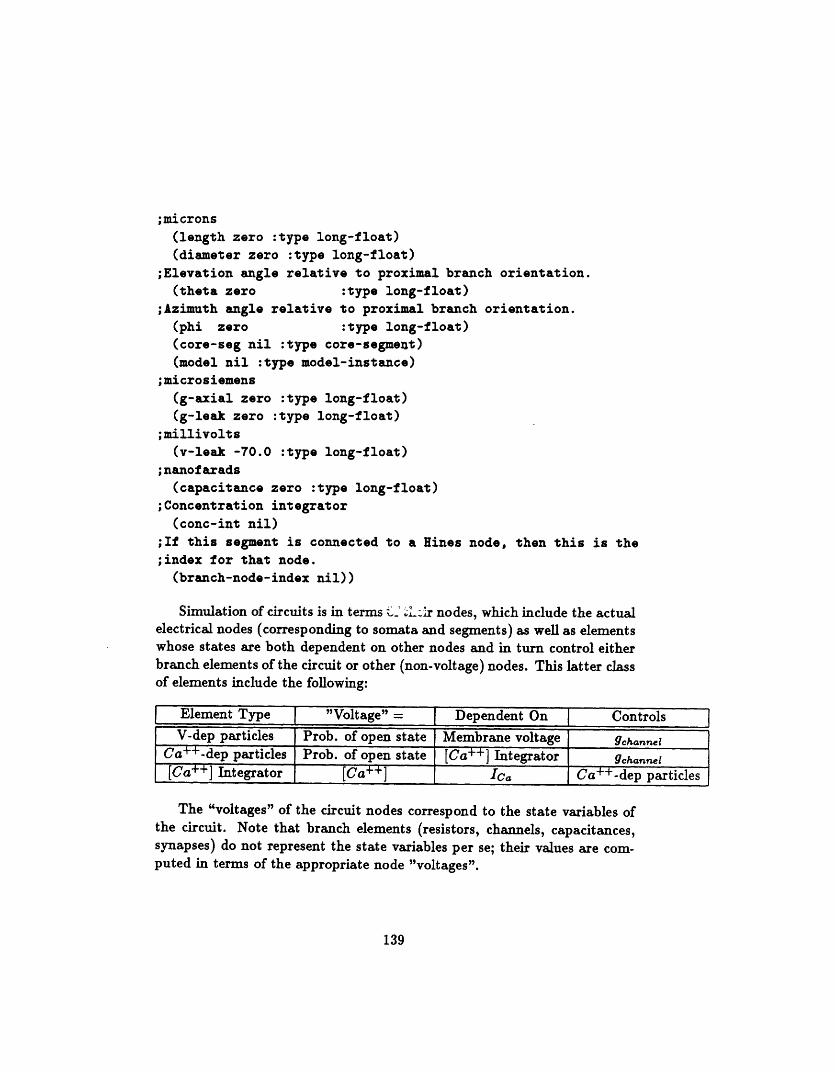
;microns
(length zero :type long-float)(diameter zero :type long-float)
;Elevation angle relative to proximal branch orientation.(theta zero :type long-float)
;Azimuth angle relative to proximal branch orientation.(phi zero :type long-float)(core-seg nil :type core-segment)(model nil :type model-instance)
;microsiemens
(g-axial zero :type long-float)(g-leak zero :type long-float)
;millivolts
(v-leak -70.0 :type long-float);nanofarads
(capacitance zero :type long-float);Concentration integrator
(conc-int nil)
;If this segment is connected to a Hines node, then this is the;index for that node.(branch-node-index nil))
Simulation of circuits is in terms X_ x..Lr nodes, which include the actualelectrical nodes (corresponding to somata and segments) as well as elementswhose states are both dependent on other nodes and in turn control eitherbranch elements of the circuit or other (non-voltage) nodes. This latter classof elements include the following:
Element Type "Voltage" = Dependent On , Controls
V-dep particles Prob. of open state Membrane voltage 9channel
Ca++-dep particles Prob. of open state [Ca++] Integrator 9channel
[Ca] Integrator [Ca++] Ca Ca++-dep particles
The "voltages" of the circuit nodes correspond to the state variables ofthe circuit. Note that branch elements (resistors, channels, capacitances,synapses) do not represent the state variables per se; their values are com-puted in terms of the appropriate node "voltages".
139
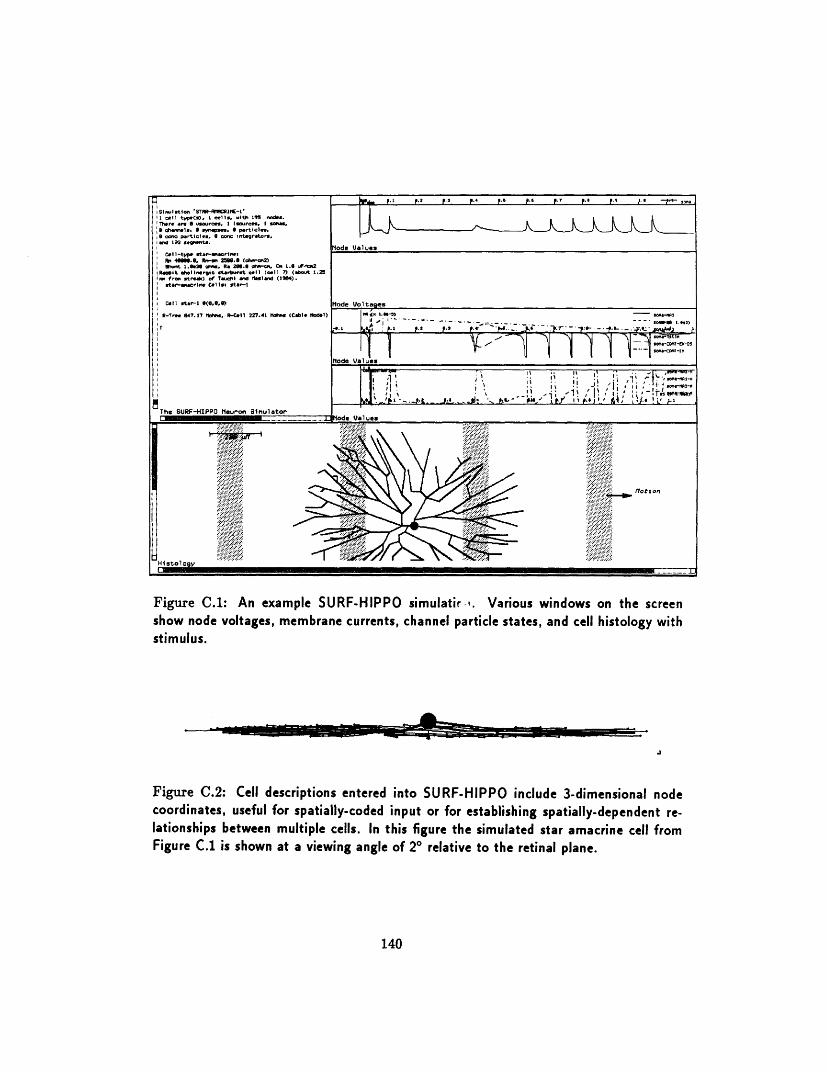
Figure C.1: An example SURF-HIPPO simulatir ,. Various windows on the screenshow node voltages, membrane currents, channel particle states, and cell histology withstimulus.
Figure C.2: Cell descriptions entered into SURF-HIPPO include 3-dimensional nodecoordinates, useful for spatially-coded input or for establishing spatially-dependent re-lationships between multiple cells. In this figure the simulated star amacrine cell fromFigure C.1 is shown at a viewing angle of 20 relative to the retinal plane.
140
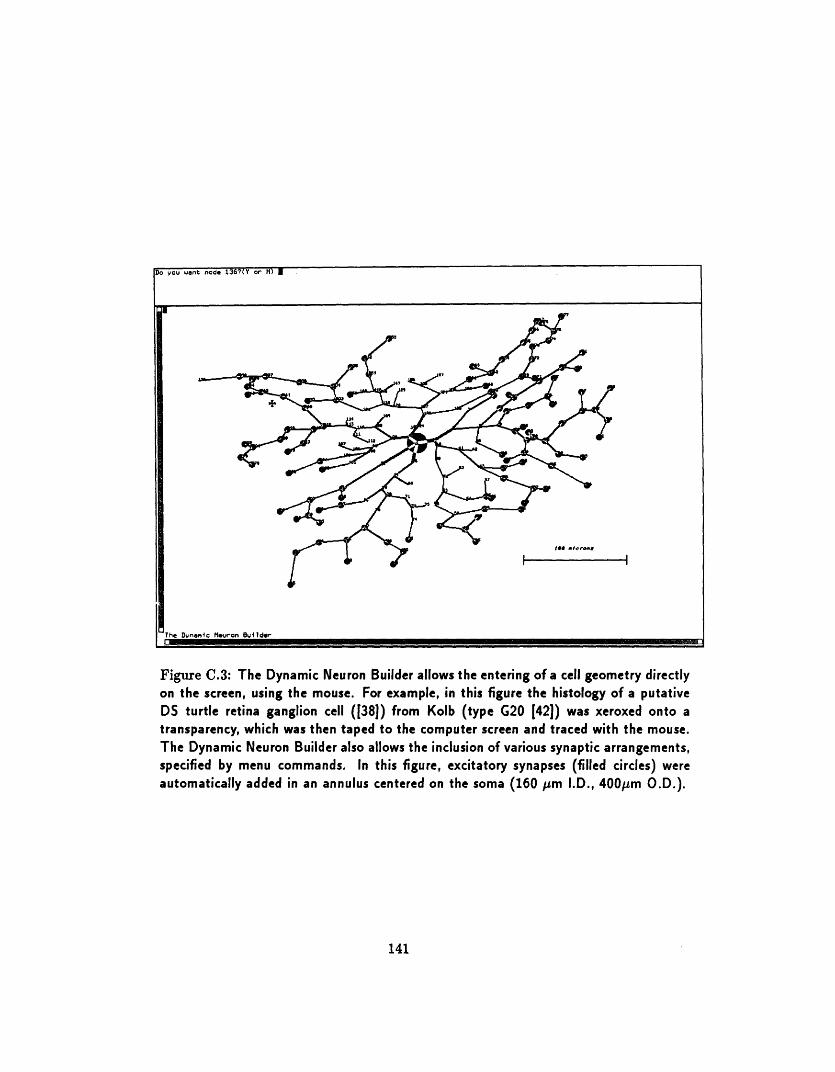
you uent node 1367b( or M1)
Figure C.3: The Dynamic Neuron Builder allows the entering of a cell geometry directlyon the screen, using the mouse. For example, in this figure the histology of a putativeDS turtle retina ganglion cell ([38]) from Kolb (type G20 [42]) was xeroxed onto atransparency, which was then taped to the computer screen and traced with the mouse.The Dynamic Neuron Builder also allows the inclusion of various synaptic arrangements,specified by menu commands. In this figure, excitatory synapses (filled circles) wereautomatically added in an annulus centered on the soma (160 Mm I.D., 400pm O.D.).
141
The Dynan1c Neuron Bu1lder
.__._. __
rll� II I �-·I�-- I- I -r - - - - r ' wwsl --·I II �n�aPmar�sa�AW
r
I
Bibliography
[1] A. Ames III and F.B. Nesbett. Intracellular and extracellular compart-ments of mammalian central nervous tissue. J. Physiology, London,184:215-238, 1966.
[2] F.R. Amthor and N.M. Grzywacz. The time course of inhibition andvelocity independence of direction selectivity in the rabbit retina. In-vestigative Opthalmology and Visual Science, 29(4):225, 1988.
[3] F.R. Amthor and N.M. Grzywacz. Nonlinearity of the inhibition inunderlying retinal directional selectivity. Visual Neuroscience, 6:95-104, 1991.
[4] F.R. Amthor, C.W. Oyster, and E.S. Takahashi. Morphology of on-offdirection-selective ganglion cells in the rabbit retina. Brain Research,298:187-190, 1984.
[5] M. Ariel and AR. Adolph. Neurotransmitter inputs to directionallysensitive turtle retinal ganglion cells. J Neurophysiol, 54(5):1123-43,nov 1985.
[6] M. Ariel and N.W. Daw. Pharmacological analysis of directionally sen-sitive rabbit retinal ganglion cells. J. of Physiology, 324:161-185, 1982.
[7] H.B. Barlow and R.M. Hill. Selective sensitivity to direction of move-ment in ganglion cells of the rabbit retina. Science, 139:412-414, 1963.
[8] H.B. Barlow and W.R. Levick. The mechanism of directionally selectiveunits in rabbit's retina. J. Physiol., 178:477-504, 1965.
[9] L. Borg-Graham. Modelling the somatic electrical behavior of hip-pocampal pyramidal neurons. Master's thesis, Massachusetts Institute
142
of Technology, 1987. Also appears as MIT AI Laboratory TechnicalReport 1161 (1989).
[10] L. Borg-Graham. Modelling the non-linear conductances of excitablemembranes. In J. Chad and H. Wheal, editors, Cellular Neurobiology: APractical Approach, chapter 13, pages 247-275. IRL/Oxford UniversityPress, 1991.
[11] L. Borg-Graham and N. M. Grzywacz. An isolated turtle retina prepa-ration allowing direct approach to ganglion cells and photoreceptors,and transmitted-light microscopy. Investigative Opthalmology and Vi-sual Science, 31(4:1039), 1990. ARVO Annual Meeting Abstract.
[12] L. Borg-Graham and N.M. Grzywacz. A model of the directional se-lectivity in retina: Transformations by neurons singly and in concert.In T. McKenna, J. Davis, and S.F. Zornetzer, editors, Single NeuronComputation. Academic Press, 1991.
[13] L. Borg-Graham and N.M. Grzywacz. Whole-cell patch recordingsanalysis of the input onto turtle directionally selective (ds) ganglioncells. Investigative Opthalmology and Visual Science, 32(4:2067), 1991.ARVO Annual Meeting Abstract.
[14] C. Brandon. CholiLergic neurons ;n the rabbit retina: Dendritic branch-ing and ultrastructural connectivity. Brain Research, 426:119-130,1987.
[15] T. H. Brown, E. W. Kairiss, and C. L. Keenan. Hebbian synapses: bio-physical mechanisms and algorithms. In W. M. Cowan, E. M. Shooter,C. F. Stevens, and R. F. Thompson, editors, Annual Review of Neuro-science, pages 475-511. Annual Reviews Incorporated, 1990. Vo1.13.
[16] H.H. Biilthoff and I. Bfilthoff. Gaba antagonist inverts movement andobject detection in flies. Brain Res., 407:152-158, 1987.
[17] B. Burnside and A.M. Laties. Actin filaments in apical projections ofthe primate pigmented epithelial cell. Investigative Opthalmology andVisual Science, 15(570), 1976.
[18] J.H. Caldwell, N.W. Daw, and H.J. Wyatt. Effects of picrotoxin andstrychnine on rabbit retinal ganglion cells: lateral interactions for cellswith more complex receptive fields. J. of Physiology, 276:277-298, 1978.
143
[19] P. A. Coleman and R. F. Miller. Measurement of passive membraneproperties with whole-cell recording from neurons in the intact amphib-ian retina. J. Neurophysiology, 61(1), jan 1989.
[20] M. H. Criswell. Cellular mechanism of movement detection and direc-tionality in the turtle retina. PhD thesis, Indiana University, 1987.
[21] F.M. DeMonasterio. Properties of ganglion cells with atypical receptive-field organization in retina of macaques. J. of Neurophys., 41(6):1435-1449, 1978.
[22] R.D. DeVoe and P.L. Carras. Directional selectivity and synaptic poten-tials of identified turtle retinal ganglion cells. Society of NeuroscienceAbstracts, 17(549.11), 1991.
[23] R.D. DeVoe, P.L. Carras, M.H. Criswell, and R.G. Guy. Not by ganglioncells alone: directional selectivity is widespread in identified cells of theturtle retina. In R. Weiler and N.N. Osborne, editors, Neurobiologyof the Inner Retina, pages 235-246, Berlin Heidelberg, 1989. Springer-Verlag.
[24] J.E. Dowling. The retina, an approachable part of the brain. HarvardUniversity Press, Cambridge, 1987.
[25] E.V. Famiglietti. On and off pathways through amacrine cells in mam-malian retina: the synaptic connection of starburst amacrine cells. Vi-sion Res, 23:1265-1279, 1983.
[26] E.V. Famiglietti. 'Starburst' amacrine cells and cholinergic neurons:Mirror-symmetric on and off amacrine cells of rabbit retina. BrainRes., 261:138-144, 1983.
[27] J.E. Fulbrook and A.M. Granda. Velocity-sensitive retinal ganglioncells in turtle. In preparation.
[28] A.M. Granda and J.E. Fulbrook. Classification of turtle retinal ganglioncells. Journal of Neurophysiology, 62(3):723-737, 1989.
[29] N.M. Grzywacz and F.R. Amthor. A computationally robust anatom-ical model for retinal directional selectivity. In D.S. Touretzky, editor,Advances in Neural Information Processing Systems, Vol. 1, pages 477-484. Morgan Kaufman, 1989.
144
[301 N.M. Grzywacz and F.R. Amthor. Facilitation in on-off directionallyselective ganglion cells of the rabbit retina. Neurosci. Abst., 15:969,1989.
[311 N.M. Grzywacz and F.R. Amthor. Independent on and off computationsof retinal directional selectivity in rabbit. Neurosci. Abst., 17:344, 1991.
[32] N.M. Grzywacz and C. Koch. Functional properties of models for di-rection selectivity in the retina. Synapse, 1:417-434, 1987.
[33] B. Hassenstein and W.E. Reichardt. Functional structure of a mech-anism of perception of optical movement. In Proceedings Ist Interna-tional Congress Cybernetics Namar, pages 797-801, 1956.
[34] K. Hausen. Monocular and binocular computation of motion in thelobula plate of the fly. Verh. Dtsch. Zool. Ges., 74:49-70, 1981.
[35] D. O. Hebb. The Organization of Behavior. Willey, New York, 1949.
[36] B. Hille. Ionic Channels of Excitable Membranes. Sinauer Associates,Sunderland, Massachusetts, 1984.
[37] M. Hines. Efficient computation of branched nerve equations. Int. J.Bio-Medical Computing, 15:69-76, 1984.
[38] RJ. Jensen and RD. DeVoe. Comparisons of directionally selectivewith other ganglion cells of the turtle retina: intracellular recordingand staining. J Comp Neurol, 217(3):271-87, jul 1 1983.
[39] C. Koch, T. Poggio, , and V. Torre. Computations in the vertebrateretina: gain enhancement, differentiation, and motion discrimination.CBIP paper 019, MIT, sep 1986.
[40] C. Koch, T. Poggio, and V. Torre. Retinal ganglion cells: a functionalinterpretation of dendritic morphology. Phil. Trans. R. Soc. Lond.,298:227-264, 1982.
[41] C. Koch, T. Poggio, and V. Torre. Nonlinear interactions in a dendritictree: Localization, timing, and role in information processing. Proc.Natl. Acad. Sci., 80:2799-2802, 1983.
[42] H. Kolb. The morphology of the bipolar cells, amacrine cells and gan-glion cells in the retina of the turtle pseudemys scripta elegans. PhilosTrans R Soc Lond [Biol], 298(1092):355-93, sep 13 1982.
145
[43] D.M. Linn and S.C. Massey. Gaba inhibits ach release from the rabbitretina: A direct effect or bipolar cell feedback? Society of NeuroscienceAbstracts, 16(297.10):713, 1990.
[44] L.E. Lipetz and R.M. Hill. Discrimination characteristics of turtle'sretinal ganglion cells. Ezperientia, 26:373-374, 1970.
[45] L.E. Lipetz, R.A. Normann, I. Perlman, and J.P. Chandler. A techniquefor reliable preparation of intact functional isolated retina of the turtle.Investigative Opthalmology and Visual Science, 30(3), 1989. ARVOAnnual Meeting Abstract.
[46] P. Lukasiewicz and F. Werblin. A slowly inactivating potassium currenttruncates spike activity in ganglion cells of the tiger salamander. J.Neurosci., 8(12):4470-4481, dec 1988.
[47] P. L. Marchiafava. The responses on retinal ganglion cells to stationaryand moving visual stimuli. Vision Research, 19:1203=1211, 1979.
[48] R. H. Masland, J. W. Mills, and C. Cassidy. The function of acetyl-choline in the rabbit retina. Proc. R. Soc. Lond., 223:121-139, 1984.
[49] H.R. Maturana. Functional organization of the pigeon retina. In 22ndIntern. Congr. Physiol. Sci., pages 170-178, Leiden, 1962.
[50] H.R. Maturana, J.Y. Lettvin, W.S. McCulloch, and W.H. Pitts.Anatomy and physiology of vision in the frog (rana pipiens). J. Gen.Physiol., 43 (Suppl. 2):129-171, 1960.
[51] M. Meister, R.O.L. Wong, D. A. Baylor, and C.J. Shatz. Synchronousbursting activity in ganglion cells of the developing mammalian retina.Investigative Opthalmology and Visual Science, 31(4:569), 1990. ARVOAnnual Meeting Abstract.
[52] R. B.Jr. Norgren and M.N. Lehman. Retrograde transneuronal trans-port of herpes simplex virus in the retina after injection in the superiorcolliculus, hypothalamus and optic chiasm. Brain Research (NETHER-LANDS), 479(2):374-378, 1989.
[53] P. O'Donnell, C. Koch, and T. Poggio. Demonstrating the nonlinearinteraction between excitation and inhibition in dendritic trees usingcomputer-generated color graphics: a film. Society of NeuroscienceAbstracts, 11(142), 1985.
146
[54] H. Ogmen. On the mechanisms underlying directional selectivity. Neu-ral Computation, 1991.
[55] T. Poggio and W.E. Reichardt. Considerations on models of movementdetection. Kybernetik, 13:223-227, 1973.
[56] W. Rall. Theoretical significance of dendritic tress for neuronal input-output relations. In R.F. Reiss, editor, Neural Theory and Modelling,pages 73-79. Stanford University Press, 1964.
[57] P.H. Schiller and J.G. Malpeli. Properties and tectal projections ofmonkey retinal ganglion cells. J. Neurophys., 40(2):428-445, 1977.
[58] D. P. Shelton. Membrane resistivity estimated for the Purkinje neuronby means of a passive computer model. Neuroscience, 14(1):111-131,1985.
[59] R.D. Smith, N.M. Grzywacz, and L. Borg-Graham. Picrotoxin's effecton contrast dependence of turtle retinal directional selectivity. Inves-tigative Opthalmology and Visual Science, 32(4:2913), 1991. ARVOAnnual Meeting Abstract.
[60] A. Stelzer, A. R. Kay, and R. K. S. Wong. Gaba-a-receptor function inhippocampal cells is maintained by phosphorylation factors. Science,241:339-341, 1988.
[61] J.F. Storm. Potassium currents in hippocampal pyramidal cells. InJ. Storm-Mathisen, J. Zimmer, and O.P. Ottersen, editors, Progress inBrain Research, volume 83, pages 161-187. Elsevier Science PublishersB. V. (Biomedical Division), 1990.
[62] M. Tauchi and R.H. Masland. The shape and arrangement of the cholin-ergic neurons in the rabbit retina. Proc. R. Soc. London, B, 223:101-119, 1984.
[63] V. Torre and T. Poggio. A synaptic mechanism possibly underlyingdirectional selectivity to motion. Proc. R. Soc. Lond., 202:409-416,1978.
[64] D. Vaney. The mosaic of amacrine cells in the mammalian retina. InN. Osborne and G. Chader, editors, Progress in Retinal Research, vol-ume 9, pages 49-100. Pergamon Press, 1990.
147
[65] D.I. Vaney. "coronate" amacrine cells in the rabbit retina have the"starburst" dendritic morphology. Proc. R. Soc. London, B,, 220:501-508, 1984.
[66] D.I. Vaney, Collin S.P., and Young H.M. Dendritic relationships be-tween cholinergic amacrine cells and direction-selective retinal ganglioncells. In R. Weiler and N.N. Osborne, editors, Neurobiology of the InnerRetina, pages 157-168. Springer-Verlag, 1989.
[67] S. Watanabe and M. Murakami. Synaptic mechanisms of directionalselectivity in ganglion cells of frog retina as revealed by intracellularrecordings. Jap. J. of Physiology, 34:497-511, 1984.
[68] F.S. Werblin, G. Maguire, and P. Lukasiewicz. Amacrine-bipolar cellinteractions mediate change detection in the retina of the tiger sala-mander. In R. Weiler and N.N. Osborne, editors, Neurobiology of theInner Retina, pages 401-411, Berlin Heidelberg, 1989. Springer-Verlag.
[69] H. J. Wyatt and N. W. Daw. Directionally sensitive ganglion cells inthe rabbit retina: specificity for stimulus direction, size, and speed. J.Neurophysiol., 38:613-626, 1975.
[70] Y.H. Yoon and M.F. Marmor. Effects on retinal adhesion of tempera-ture, cyclic amp, cytochalasin, and enzymes. Investigative Opthalmol-ogy and Visual Science, 29(6), 1988.
148