Embed Size (px)
Citation preview
WATER &
ENV
IRON
MEN
T
97
Abstract
BackgroundThe water industry faces a signifi cant challenge in aligning itself with the Government’s national target of reducing CO2 equivalent greenhouse gas emissions by 80% (against 1990 levels) within the next 40 years. Improved energy savings can be sought in all aspects of the industry, from reducing consumption, targeting leakage, and investing in new technologies. One such technology is the application of acid phase digestion to sewage sludge.
Anaerobic digestion has been the primary technology used to stabilise sewage sludge in the UK for over 30 years. In recent years, technological innovations have been developed to optimise this process. Acid Phase Digestion (APD) is just one of these. Anaerobic digestion takes place in three stages; hydrolysis, acetogenesis and methanogenesis. Acidogenic bacteria responsible for the fi rst two stages prefer an environment of pH 5 and 1-3 days retention time, while methanogenic bacteria prefer pH 7.5 and 7+ days retention time.
APD works on the principal of physically separating the two sets of bacteria allowing both to operate in optimal conditions, improving the overall effi ciency of the process. This technique serves the purpose of maximising volatile solids destruction (VSD) and therefore renewable energy production (from biogas), while simultaneously reducing solids for reuse.
Severn Trent Water processes around 150,000 tonnes of dry solids sewage sludge per annum, the majority of which is anaerobically digested. There is currently over 30MW of installed combined heat and power (CHP) capacity to harness the energy from the resultant biogas. Innovative technologies which provide even small improvements in effi ciency have the potential to yield signifi cant additional savings and revenue.
IntoductionA number of proprietary systems based on the APD concept are on the market, including Monsal’s Enzymic Hydrolysis and Veolia’s Thelys systems. In 2004 Thames Water designed and built their own system, utilising the concept of acid phase digestion, at the 220,000 Population Equivalent (PE) Swindon Sewage Treatment Works (STW)2.
Following research undertaken in 20046 and visits to other sites in the UK, Severn Trent Water were keen to take advantage of the technology’s benefi ts. Economic appraisal of Severn Trent Water’s version of APD showed it was 28% cheaper on capital costs than the Monsal Enzymic Hydrolysis process3. Severn Trent Water decided to follow Thames Water’s example and undertake their own detailed design for APD at their Derby STW.
Maximising the revenue generated from renewable energy production is increasingly important to water companies in Asset Management Period 5 (AMP 5) following tough price setting by the regulator, and given the current wider economic landscape. The anaerobic digestion of sewage sludge is an important source of renewable energy. Acid Phase Digestion (APD) is reported to increase volatile solids destruction and gas production from anaerobic digestion.
Following research into existing systems on the market, an APD plant of Severn Trent Water’s own design was retrofi tted into the existing digestion process at Derby sewage treatment works (STW). The plant was designed with exceptional operational fl exibility to determine optimum process parameter setpoints.
This paper relays the operational experience and data gathered by Atkins from the fi rst half of the optimisation programme, and compares the performance data against the benchmark of previous conventional anaerobic digestion performance at the site.
Water & Environment
Assistant Process Engineer
Alexander Bjorn
Acid Phase Digestion at Derby STW - Context and preliminary optimisation results
77
WAT
ER &
EN
VIR
ON
MEN
T
98
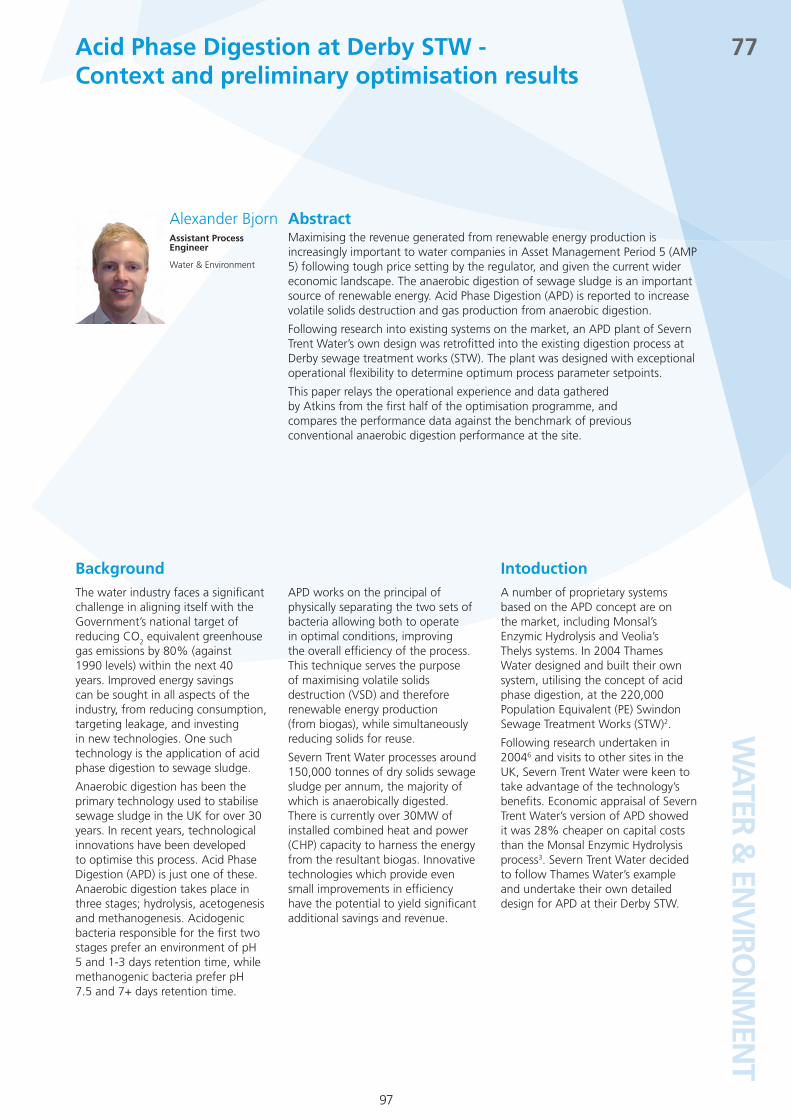
Two 800m3 APD tanks were constructed between the existing thickened sludge balance tank and the three existing MADs (each with a nominal volume of 3100m3). A 200m3 APD buffer tank (BT) was constructed immediately downstream of the APD tanks to ensure feed continuity to the MADs. The two APD tanks are fi tted with an unconfi ned gas mixing system, but the balance tank has no mixing. The fl owsheet for APD at Derby STW is shown in Figure 2.
Severn Trent Water have considerable experience in the design of MADs, having built dozens across the region in the last 50 years, and this was drawn on for the design of the APD plant. However, unlike MADs which are ‘fi ll and spill’ with a fi xed top sludge level and variable retention time, APD tanks are designed as ‘fi ll and draw’ with a variable top sludge level and fi xed retention time set point, providing unique design challenges. This is critical, as excessive retention in APD would allow methanogenic bacteria to establish themselves. Control of level allows us to establish exactly what the optimum retention time is.
Derby STW treats the sewage of 475,000 people, using conventional preliminary and primary treatment, followed by a biological nitrogen and phosphorous removal activated sludge plant. The sludge stream consists of primary sludge thickening by centrifuge and surplus activated sludge (SAS) thickened by belt thickeners, thickened sludge blending tank, APD, three Mesophilic Anaerobic Digesters (MADs) and dewatering of digested sludge by centrifuge, as shown in Figure 1.
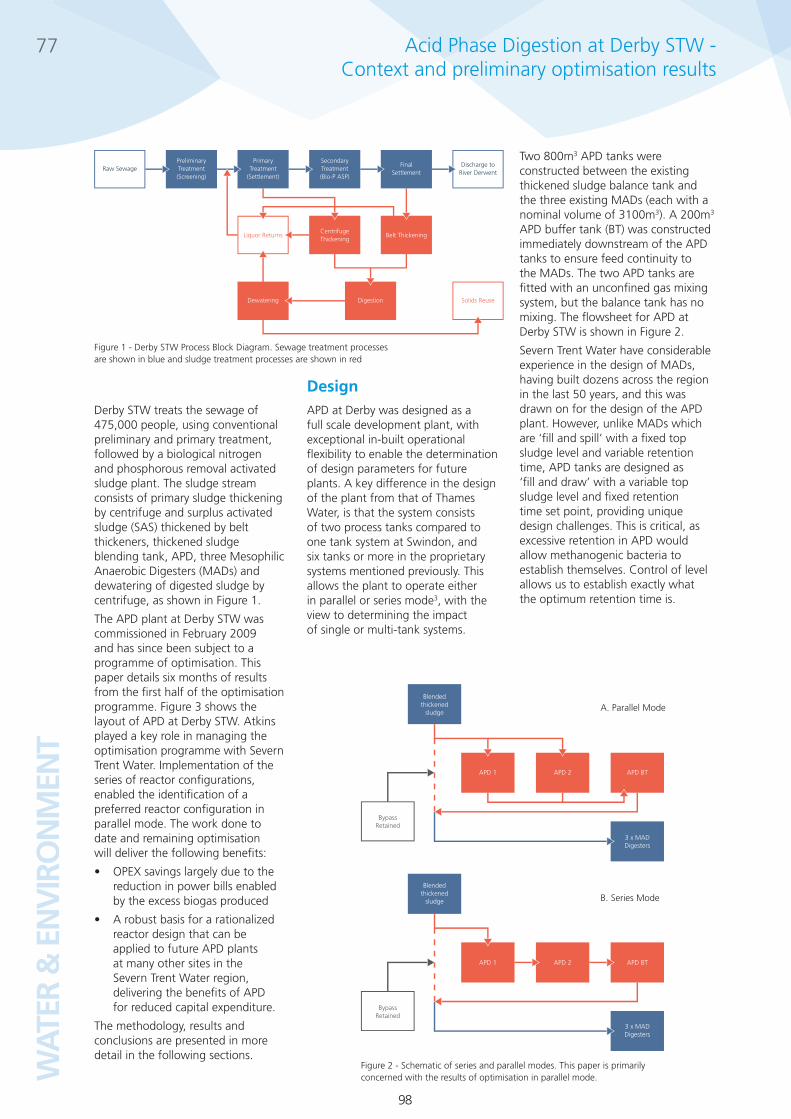
The APD plant at Derby STW was commissioned in February 2009 and has since been subject to a programme of optimisation. This paper details six months of results from the fi rst half of the optimisation programme. Figure 3 shows the layout of APD at Derby STW. Atkins played a key role in managing the optimisation programme with Severn Trent Water. Implementation of the series of reactor confi gurations, enabled the identifi cation of a preferred reactor confi guration in parallel mode. The work done to date and remaining optimisation will deliver the following benefi ts:
OPEX savings largely due to the • reduction in power bills enabled by the excess biogas produced
A robust basis for a rationalized • reactor design that can be applied to future APD plants at many other sites in the Severn Trent Water region, delivering the benefi ts of APD for reduced capital expenditure.
The methodology, results and conclusions are presented in more detail in the following sections.
DesignAPD at Derby was designed as a full scale development plant, with exceptional in-built operational fl exibility to enable the determination of design parameters for future plants. A key difference in the design of the plant from that of Thames Water, is that the system consists of two process tanks compared to one tank system at Swindon, and six tanks or more in the proprietary systems mentioned previously. This allows the plant to operate either in parallel or series mode3, with the view to determining the impact of single or multi-tank systems.
Acid Phase Digestion at Derby STW - Context and preliminary optimisation results
77
Raw SewagePreliminary Treatment (Screening)
PrimaryTreatment
(Settlement)
Liquor Returns
Dewatering Digestion Solids Reuse
Centrifuge Thickening
Belt Thickening
Secondary Treatment (Bio-P ASP)
Final Settlement
Discharge to River Derwent
Figure 1 - Derby STW Process Block Diagram. Sewage treatment processes are shown in blue and sludge treatment processes are shown in red
Blendedthickened
sludge
APD 1
Bypass Retained
APD 2 APD BT
3 x MADDigesters
Blendedthickened
sludge
APD 1
Bypass Retained
APD 2 APD BT
3 x MADDigesters
Figure 2 - Schematic of series and parallel modes. This paper is primarily concerned with the results of optimisation in parallel mode.
A. Parallel Mode
B. Series Mode
WATER &
ENV
IRON
MEN
T
99
As well as additional tankage, a new 500 kW CHP engine was added to the existing 1126kW generator capacity to harness the potential energy of the expected additional biogas.
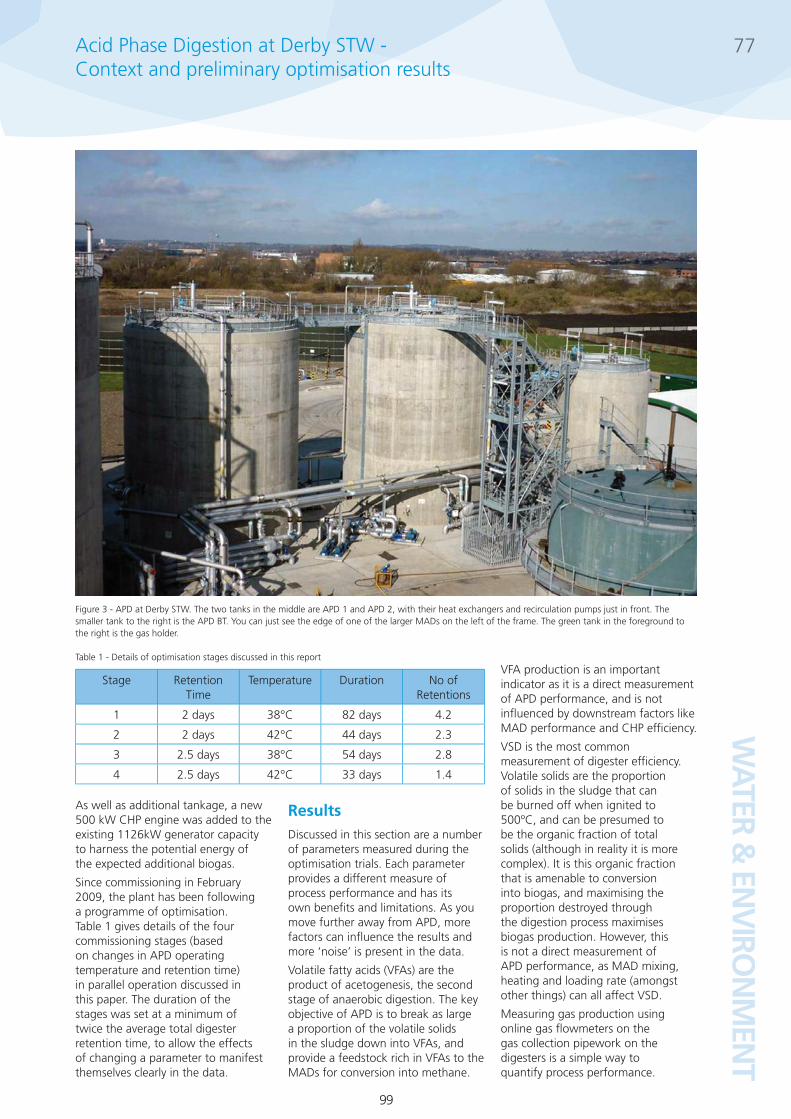
Since commissioning in February 2009, the plant has been following a programme of optimisation. Table 1 gives details of the four commissioning stages (based on changes in APD operating temperature and retention time) in parallel operation discussed in this paper. The duration of the stages was set at a minimum of twice the average total digester retention time, to allow the effects of changing a parameter to manifest themselves clearly in the data.
ResultsDiscussed in this section are a number of parameters measured during the optimisation trials. Each parameter provides a different measure of process performance and has its own benefi ts and limitations. As you move further away from APD, more factors can infl uence the results and more ‘noise’ is present in the data.
Volatile fatty acids (VFAs) are the product of acetogenesis, the second stage of anaerobic digestion. The key objective of APD is to break as large a proportion of the volatile solids in the sludge down into VFAs, and provide a feedstock rich in VFAs to the MADs for conversion into methane.
VFA production is an important indicator as it is a direct measurement of APD performance, and is not infl uenced by downstream factors like MAD performance and CHP effi ciency.
VSD is the most common measurement of digester effi ciency. Volatile solids are the proportion of solids in the sludge that can be burned off when ignited to 500ºC, and can be presumed to be the organic fraction of total solids (although in reality it is more complex). It is this organic fraction that is amenable to conversion into biogas, and maximising the proportion destroyed through the digestion process maximises biogas production. However, this is not a direct measurement of APD performance, as MAD mixing, heating and loading rate (amongst other things) can all affect VSD.
Measuring gas production using online gas fl owmeters on the gas collection pipework on the digesters is a simple way to quantify process performance.
77Acid Phase Digestion at Derby STW - Context and preliminary optimisation results
Stage Retention Time
Temperature Duration No of Retentions
1 2 days 38°C 82 days 4.2
2 2 days 42°C 44 days 2.3
3 2.5 days 38°C 54 days 2.8
4 2.5 days 42°C 33 days 1.4
Figure 3 - APD at Derby STW. The two tanks in the middle are APD 1 and APD 2, with their heat exchangers and recirculation pumps just in front. The smaller tank to the right is the APD BT. You can just see the edge of one of the larger MADs on the left of the frame. The green tank in the foreground to the right is the gas holder.
Table 1 - Details of optimisation stages discussed in this report
WAT
ER &
EN
VIR
ON
MEN
T
100
But as a measurement of APD performance, these are more factors that can skew results. Calibration of the fl owmeters, moisture content of the gas and changes in pressure can all infl uence readings.
Energy production from the CHP engines can be measured most accurately of all that parameters discussed. But it is also furthest away from direct measurement of APD performance. As well as the factors infl uencing VSD and gas production, engine effi ciency, gas fl ared off and engine down time all affect this measurement.
By looking at all available measures of performance we can increase our confi dence in the assessment of the impact APD is having on the digestion process.
Operational experience
Initial optimisation was hampered by scale formation in the external concentric tube heat exchangers, and reactor temperature could not be maintained at the stage setpoint. Following laboratory analysis this blue-grey scale was identifi ed as iron phosphate hydrate, or vivianite (Fe3(PO4)2.8H2O).
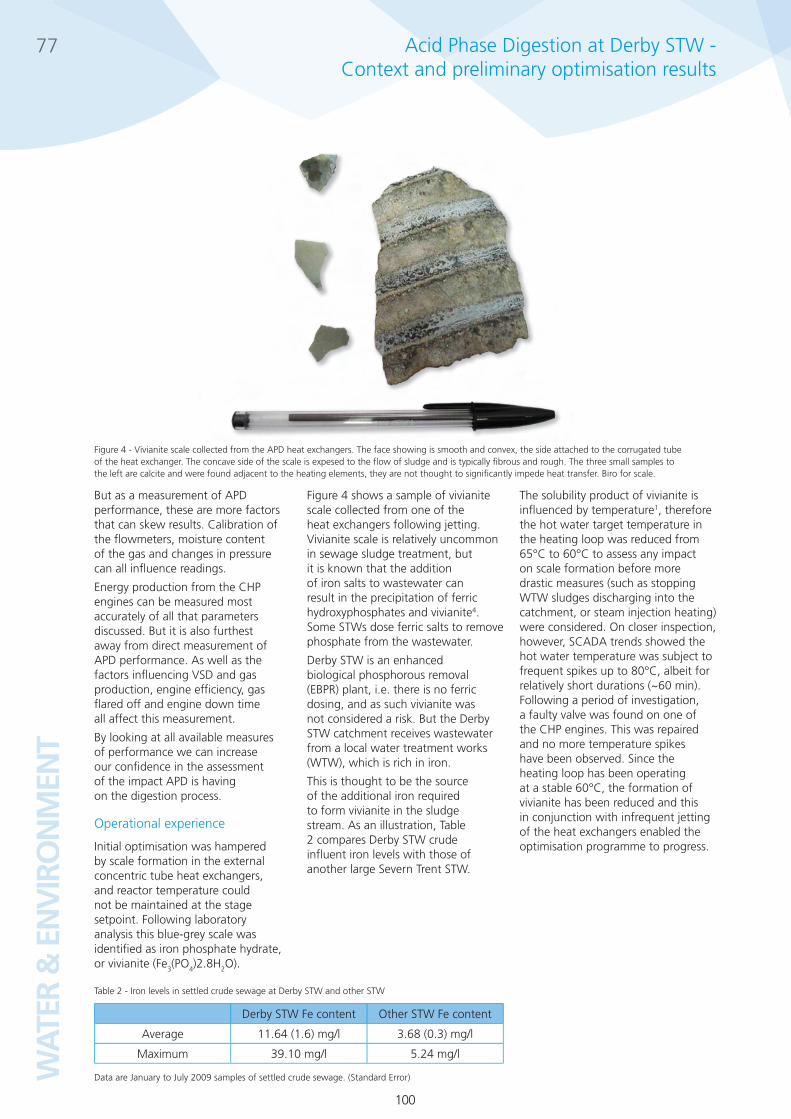
Figure 4 shows a sample of vivianite scale collected from one of the heat exchangers following jetting. Vivianite scale is relatively uncommon in sewage sludge treatment, but it is known that the addition of iron salts to wastewater can result in the precipitation of ferric hydroxyphosphates and vivianite4. Some STWs dose ferric salts to remove phosphate from the wastewater.
Derby STW is an enhanced biological phosphorous removal (EBPR) plant, i.e. there is no ferric dosing, and as such vivianite was not considered a risk. But the Derby STW catchment receives wastewater from a local water treatment works (WTW), which is rich in iron.
This is thought to be the source of the additional iron required to form vivianite in the sludge stream. As an illustration, Table 2 compares Derby STW crude infl uent iron levels with those of another large Severn Trent STW.
The solubility product of vivianite is infl uenced by temperature1, therefore the hot water target temperature in the heating loop was reduced from 65°C to 60°C to assess any impact on scale formation before more drastic measures (such as stopping WTW sludges discharging into the catchment, or steam injection heating) were considered. On closer inspection, however, SCADA trends showed the hot water temperature was subject to frequent spikes up to 80°C, albeit for relatively short durations (~60 min). Following a period of investigation, a faulty valve was found on one of the CHP engines. This was repaired and no more temperature spikes have been observed. Since the heating loop has been operating at a stable 60°C, the formation of vivianite has been reduced and this in conjunction with infrequent jetting of the heat exchangers enabled the optimisation programme to progress.
77
Figure 4 - Vivianite scale collected from the APD heat exchangers. The face showing is smooth and convex, the side attached to the corrugated tube of the heat exchanger. The concave side of the scale is expesed to the fl ow of sludge and is typically fi brous and rough. The three small samples to the left are calcite and were found adjacent to the heating elements, they are not thought to signifi cantly impede heat transfer. Biro for scale.
Table 2 - Iron levels in settled crude sewage at Derby STW and other STW
Data are January to July 2009 samples of settled crude sewage. (Standard Error)
Derby STW Fe content Other STW Fe content
Average 11.64 (1.6) mg/l 3.68 (0.3) mg/l
Maximum 39.10 mg/l 5.24 mg/l
Acid Phase Digestion at Derby STW - Context and preliminary optimisation results
WATER &
ENV
IRON
MEN
T
101
VFA production
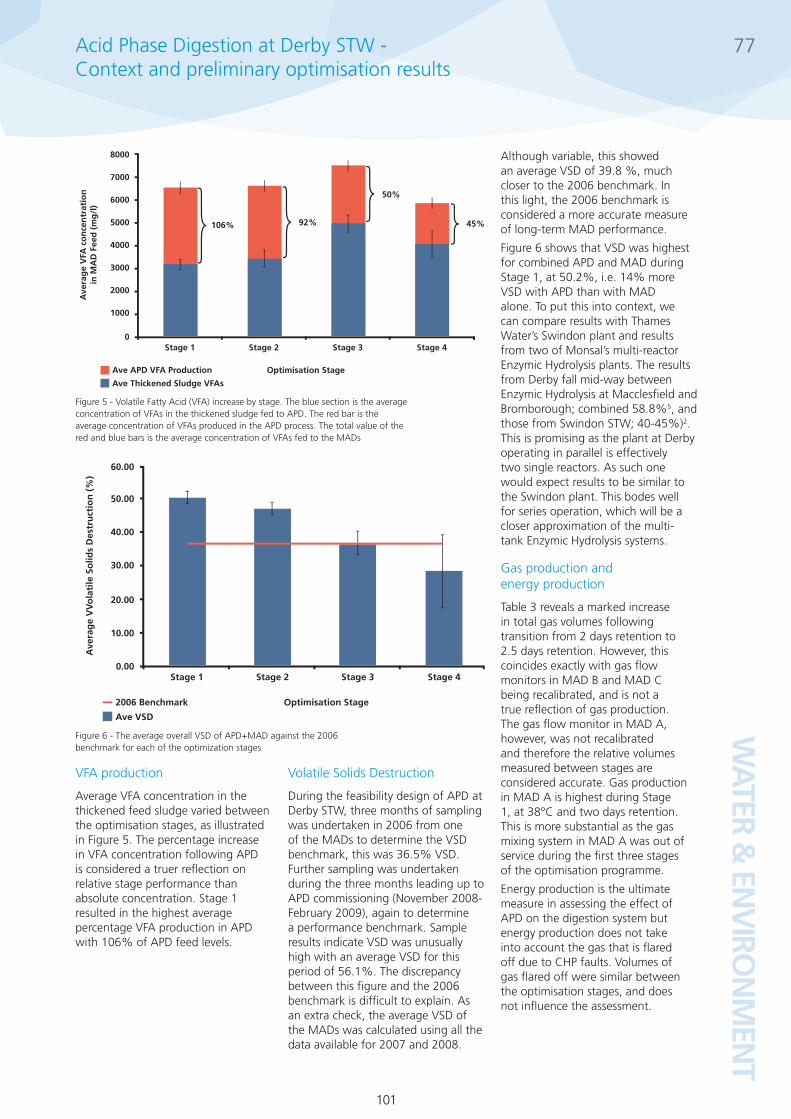
Average VFA concentration in the thickened feed sludge varied between the optimisation stages, as illustrated in Figure 5. The percentage increase in VFA concentration following APD is considered a truer refl ection on relative stage performance than absolute concentration. Stage 1 resulted in the highest average percentage VFA production in APD with 106% of APD feed levels.
Volatile Solids Destruction
During the feasibility design of APD at Derby STW, three months of sampling was undertaken in 2006 from one of the MADs to determine the VSD benchmark, this was 36.5% VSD. Further sampling was undertaken during the three months leading up to APD commissioning (November 2008-February 2009), again to determine a performance benchmark. Sample results indicate VSD was unusually high with an average VSD for this period of 56.1%. The discrepancy between this fi gure and the 2006 benchmark is diffi cult to explain. As an extra check, the average VSD of the MADs was calculated using all the data available for 2007 and 2008.
Although variable, this showed an average VSD of 39.8 %, much closer to the 2006 benchmark. In this light, the 2006 benchmark is considered a more accurate measure of long-term MAD performance.
Figure 6 shows that VSD was highest for combined APD and MAD during Stage 1, at 50.2%, i.e. 14% more VSD with APD than with MAD alone. To put this into context, we can compare results with Thames Water’s Swindon plant and results from two of Monsal’s multi-reactor Enzymic Hydrolysis plants. The results from Derby fall mid-way between Enzymic Hydrolysis at Macclesfi eld and Bromborough; combined 58.8%5, and those from Swindon STW; 40-45%)2. This is promising as the plant at Derby operating in parallel is effectively two single reactors. As such one would expect results to be similar to the Swindon plant. This bodes well for series operation, which will be a closer approximation of the multi-tank Enzymic Hydrolysis systems.
Gas production and energy production
Table 3 reveals a marked increase in total gas volumes following transition from 2 days retention to 2.5 days retention. However, this coincides exactly with gas fl ow monitors in MAD B and MAD C being recalibrated, and is not a true refl ection of gas production. The gas fl ow monitor in MAD A, however, was not recalibrated and therefore the relative volumes measured between stages are considered accurate. Gas production in MAD A is highest during Stage 1, at 38°C and two days retention. This is more substantial as the gas mixing system in MAD A was out of service during the fi rst three stages of the optimisation programme.
Energy production is the ultimate measure in assessing the effect of APD on the digestion system but energy production does not take into account the gas that is fl ared off due to CHP faults. Volumes of gas fl ared off were similar between the optimisation stages, and does not infl uence the assessment.
77
8000
7000
6000
5000
4000
3000
2000
1000
0Stage 1
106%
Stage 2
92%
Stage 3
50%
Stage 4
Optimisation Stage
Ave
rag
e V
FA c
on
cen
trat
ion
in
MA
D F
eed
(m
g/l
)
45%
Ave APD VFA Production
Ave Thickened Sludge VFAs
60.00
50.00
40.00
30.00
20.00
10.00
0.00Stage 1 Stage 2 Stage 3 Stage 4
Optimisation Stage
Ave
rag
e V
Vo
lati
le S
olid
s D
estr
uct
ion
(%
)
2006 Benchmark
Ave VSD
Figure 5 - Volatile Fatty Acid (VFA) increase by stage. The blue section is the average concentration of VFAs in the thickened sludge fed to APD. The red bar is the average concentration of VFAs produced in the APD process. The total value of the red and blue bars is the average concentration of VFAs fed to the MADs
Figure 6 - The average overall VSD of APD+MAD against the 2006 benchmark for each of the optimization stages
Acid Phase Digestion at Derby STW - Context and preliminary optimisation results
WAT
ER &
EN
VIR
ON
MEN
T
102
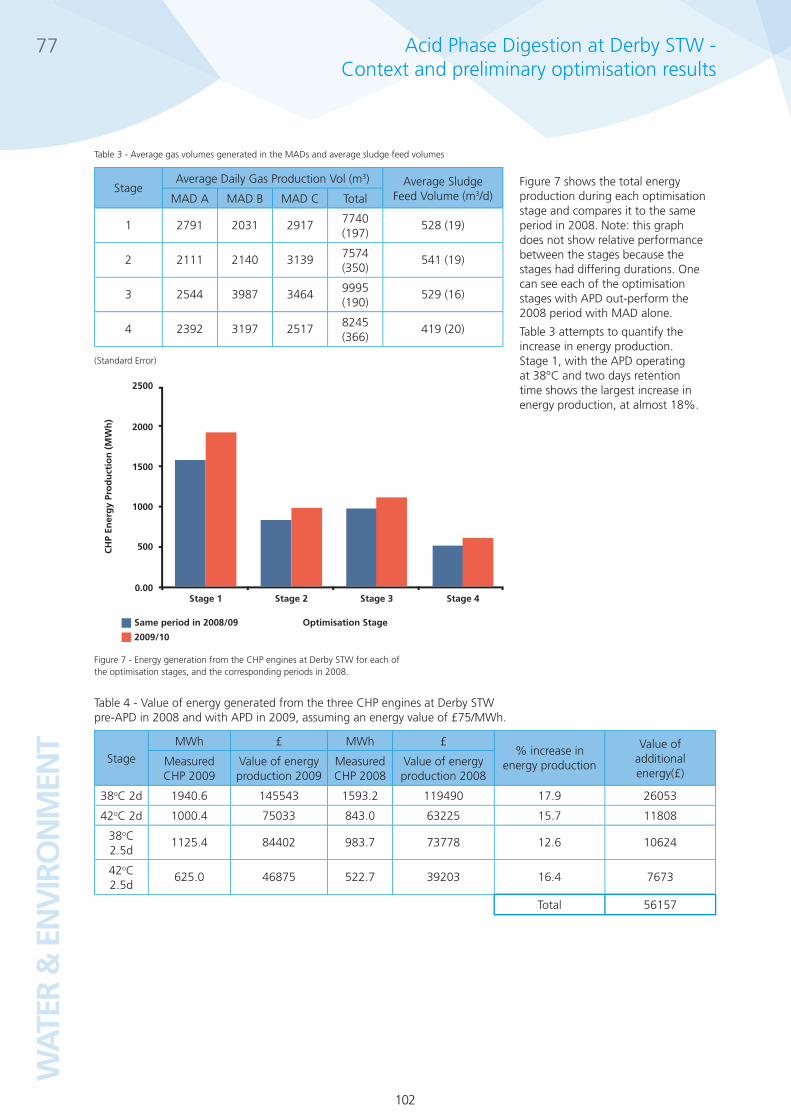
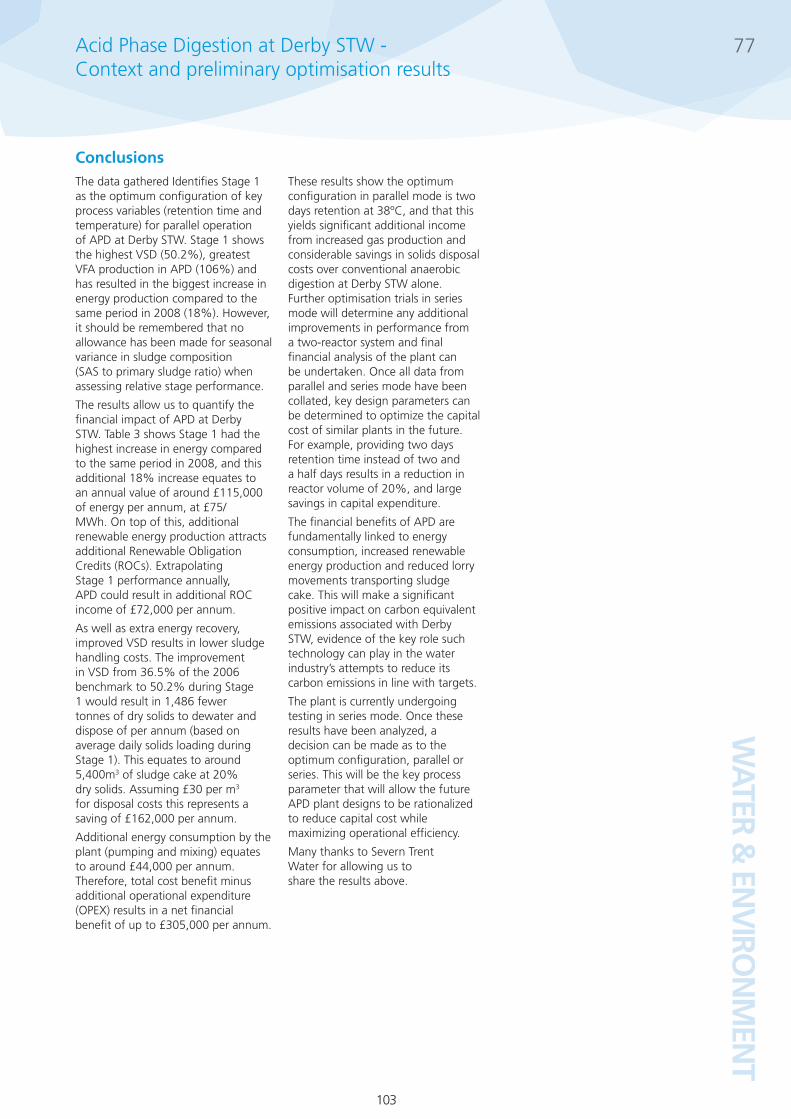
Figure 7 shows the total energy production during each optimisation stage and compares it to the same period in 2008. Note: this graph does not show relative performance between the stages because the stages had differing durations. One can see each of the optimisation stages with APD out-perform the 2008 period with MAD alone.
Table 3 attempts to quantify the increase in energy production. Stage 1, with the APD operating at 38°C and two days retention time shows the largest increase in energy production, at almost 18%.
77
Figure 7 - Energy generation from the CHP engines at Derby STW for each of the optimisation stages, and the corresponding periods in 2008.
StageAverage Daily Gas Production Vol (m3) Average Sludge
Feed Volume (m3/d)MAD A MAD B MAD C Total
1 2791 2031 2917 7740 (197)
528 (19)
2 2111 2140 3139 7574 (350)
541 (19)
3 2544 3987 3464 9995 (190)
529 (16)
4 2392 3197 2517 8245 (366)
419 (20)
Table 3 - Average gas volumes generated in the MADs and average sludge feed volumes
(Standard Error)
StageMWh £ MWh £
% increase in energy production
Value of additional energy(£)
Measured CHP 2009
Value of energy production 2009
Measured CHP 2008
Value of energy production 2008
38oC 2d 1940.6 145543 1593.2 119490 17.9 26053
42oC 2d 1000.4 75033 843.0 63225 15.7 11808
38oC 2.5d
1125.4 84402 983.7 73778 12.6 10624
42oC 2.5d
625.0 46875 522.7 39203 16.4 7673
Total 56157
Table 4 - Value of energy generated from the three CHP engines at Derby STW pre-APD in 2008 and with APD in 2009, assuming an energy value of £75/MWh.
Acid Phase Digestion at Derby STW - Context and preliminary optimisation results
2500
0.00Stage 1 Stage 2 Stage 3 Stage 4
Optimisation Stage
CH
P En
erg
y Pr
od
uct
ion
(M
Wh
)
500
1000
1500
2000
Same period in 2008/09
2009/10
WATER &
ENV
IRON
MEN
T
103
ConclusionsThe data gathered Identifi es Stage 1 as the optimum confi guration of key process variables (retention time and temperature) for parallel operation of APD at Derby STW. Stage 1 shows the highest VSD (50.2%), greatest VFA production in APD (106%) and has resulted in the biggest increase in energy production compared to the same period in 2008 (18%). However, it should be remembered that no allowance has been made for seasonal variance in sludge composition (SAS to primary sludge ratio) when assessing relative stage performance.
The results allow us to quantify the fi nancial impact of APD at Derby STW. Table 3 shows Stage 1 had the highest increase in energy compared to the same period in 2008, and this additional 18% increase equates to an annual value of around £115,000 of energy per annum, at £75/MWh. On top of this, additional renewable energy production attracts additional Renewable Obligation Credits (ROCs). Extrapolating Stage 1 performance annually, APD could result in additional ROC income of £72,000 per annum.
As well as extra energy recovery, improved VSD results in lower sludge handling costs. The improvement in VSD from 36.5% of the 2006 benchmark to 50.2% during Stage 1 would result in 1,486 fewer tonnes of dry solids to dewater and dispose of per annum (based on average daily solids loading during Stage 1). This equates to around 5,400m3 of sludge cake at 20% dry solids. Assuming £30 per m3 for disposal costs this represents a saving of £162,000 per annum.
Additional energy consumption by the plant (pumping and mixing) equates to around £44,000 per annum. Therefore, total cost benefi t minus additional operational expenditure (OPEX) results in a net fi nancial benefi t of up to £305,000 per annum.
These results show the optimum confi guration in parallel mode is two days retention at 38ºC, and that this yields signifi cant additional income from increased gas production and considerable savings in solids disposal costs over conventional anaerobic digestion at Derby STW alone. Further optimisation trials in series mode will determine any additional improvements in performance from a two-reactor system and fi nal fi nancial analysis of the plant can be undertaken. Once all data from parallel and series mode have been collated, key design parameters can be determined to optimize the capital cost of similar plants in the future. For example, providing two days retention time instead of two and a half days results in a reduction in reactor volume of 20%, and large savings in capital expenditure.
The fi nancial benefi ts of APD are fundamentally linked to energy consumption, increased renewable energy production and reduced lorry movements transporting sludge cake. This will make a signifi cant positive impact on carbon equivalent emissions associated with Derby STW, evidence of the key role such technology can play in the water industry’s attempts to reduce its carbon emissions in line with targets.
The plant is currently undergoing testing in series mode. Once these results have been analyzed, a decision can be made as to the optimum confi guration, parallel or series. This will be the key process parameter that will allow the future APD plant designs to be rationalized to reduce capital cost while maximizing operational effi ciency.
Many thanks to Severn Trent Water for allowing us to share the results above.
77Acid Phase Digestion at Derby STW - Context and preliminary optimisation results
WAT
ER &
EN
VIR
ON
MEN
T
104
ReferencesAl-Borno, A. and Mason, B. (1994) The Temperature Dependence of the Solubility Product 1. of Vivianite. Geochimica et Cosmochimica Acta. Vol. 58, No. 24, pp. 5373-5378.
Asaadi, M., Marsh, P. (2005) Acid Phase Digestion – Experience of Two Stage Anaerobic Digestion at 2. Swindon STW. Presented at 10th European Biosolids and Biowaste Conference. Aqua Enviro, Manchester.
Edgington, R. and Thompson, A. (2007) Every Molecule Counts. In Lowe P. and Horan, N.J. (ed) 3. Proceedings of the 12th European Biosolids and Organic Resources Conf. Aqua Enviro, Manchester.
Frossard, E., Bauer, J.P., Lothe, F. (1997) Evidence of Vivianite in FeSO4- 4. Flocculated Sludges. Wat. Res. Vol. 31, No. 10, pp. 2449-2454.
Harrison, D., Brade, C.E., Le, M.S. (2005) Engineering Aspects of Mesophilic Plug Flow Advanced Digestion 5. Facilities. Presented at 10th European Biosolids and Biowaste Conference. Aqua Enviro, Manchester.
Quinn, M. (2004) Identifying the Optimum Process Conditions for Acid Phase Digestion. MSc Thesis. 6.
77 Acid Phase Digestion at Derby STW - Context and preliminary optimisation results