Embed Size (px)
Citation preview
Journal of Naval Architecture and Marine Engineering June, 2012
DOI: 10.3329/jname.v9i1.7600 http://www.banglajol.info
1813-8235 (Print), 2070-8998 (Online) © 2012 ANAME Publication. All rights reserved. Received on: May 2011
LIQUID SLOSHING DYNAMICS IN A BARGE CARRYING
CONTAINER SUBJECTED TO RANDOM WAVE EXCITATION T. Nasar1, S.A.Sannasiraj2 and V. Sundar2
1Department of Civil Engineering, Noorul Islam Centre for Higher Education, Nagercoil-629180, India, Email: [email protected] 2Department of Ocean Engineering, Indian Institute of Technology Madras, Chennai-600036, India, Email: [email protected],, [email protected],
Abstract: The sloshing phenomenon of liquid in a partially filled tank mounted rigidly on a barge exposed to random beam waves has been investigated through a well controlled experimental program. Four relative liquid depths, (liquid depth, hs/ length of tank, l) of 0.163, 0.325, 0.488 and 0.585 were considered for the tests. The sloshing oscillation was measured along the length of the tank at predefined locations. The effect of variation of the peak wave excitation frequency on the sloshing oscillation in the frequency domain is studied. The dominant energy is found to be concentrated around lowest nth sloshing mode frequency and, secondary peaks are observed at higher order sloshing frequencies. Odd modes contributions are dominating even modes irrespective of the excitation peak frequency. The sacrifice of second mode is observed while the excitation peak frequency is closer to its primary resonance.
Keywords: Random wave, barge response, sloshing oscillation, natural mode frequency, secondary resonance, parametric resonance.
1. Introduction Liquid oscillation in a partially filled tank is associated with various engineering problems and dynamical systems. Liquid oscillation due to forced excitation is called sloshing. In maritime applications, it is experienced in LNG (Liquefied Natural Gas) – FPSO (Floating Production Storage and Offloading)/FSRU (Floating Storage and Re-gastification Unit) units, barges/ships equipped with oil tanks, storage tanks in compliant offshore platforms and in water ballasting tanks. The violent sloshing of liquid results in highly localized impact pressures on the container walls, which may in turn cause structural damages and may even create sufficient moment to destabilize the vessel that carries the liquid container. In order to design the tank walls for loads due to sloshing and to study the stability of floating vessels, it is necessary to understand the liquid motion either using numerical simulation or experimental measurements. In view of the importance of the liquid sloshing dynamics in all engineering applications, several studies have been carried out to understand the said phenomenon in a tank through analytical, numerical and experimental methods. The past studies described here are categorized under single degree freedom of excitation (translation or rotation), combined degrees of excitation and the interaction between sloshing and the floating vessel.
Faraday (1831) pioneered the earliest investigation on the liquid sloshing and subsequently by Benjamin and Ursell (1954) in a vertically oscillating tank. The free surface oscillation in a vertically oscillating basin is called parametric sloshing or faraday wave, in which, the free surface movement is normal to the plane of excitation. Nonlinear theory was then proposed by Moiseyev (1958) to predict sloshing motion in a sway excited liquid filled tank. Faltinsen (1974) used a nonlinear theory to simulate sloshing oscillation in a sway and roll excited tank. Lui and Lou (1990) carried out a linear analytical study to signify the importance of dynamic coupling of a roll excited liquid - tank system. Waterhouse (1994) elucidated the importance of tank aspect ratio (liquid depth, hs/ length of tank, l) in the field of liquid sloshing dynamics and arrived at its critical value as 0.337. Extensive studies on modal analysis of liquid sloshing have been carried out by Faltinsen et al. (2000), Faltinsen and Timokha (2001, 2002). The possible presence of harmonics in the system for the hs/l ranging between 0.1 and 1.0 was explored.
T. Nasar, S.A.Sannasiraj and V. Sundar/ Journal of Naval Architecture and Marine Engineering 9(2012) 43-65
Liquid sloshing dynamics in a barge carrying container subjected to random wave excitation 44
Several studies were carried out on the numerical simulation of sloshing motion in rectangular tanks excited by single degree of freedom. Faltinsen (1978) presented a nonlinear numerical model using boundary integral technique subjected to forced sway harmonic oscillation. Nakayama and Washizu (1980) used a finite element method in investigating a container subjected to pitching oscillation. Frandsen (2003) developed a finite difference based scheme and sigma – transformation mapping technique for the vertically excited containers. Wang and Khoo (2005) analyzed the sloshing behaviour using finite element approach subjected to random excitations in the sway mode and reported the effect of peak frequency on sloshing elevation and induced force. Sriram et al. (2006) investigated the effect of peak frequency in the horizontal and the vertical excitation, separately. Thus, most of the work focused on the sloshing oscillation due to individual sway, heave or roll excitation.
Under combined degree of excitation, Frandsen (2004) developed a finite difference scheme for the case of combined horizontal and vertical excitation. Kim et al. (2003) examined the sloshing behaviour in a rectangular tank using volume of fluid based numerical algorithm subjected to six degrees freedom of excitation. Wu et al. (1998) reported the finite element procedure for the combined translational degrees of excitation. The possibility of infinite resonance frequencies in contrast to unique resonance frequency was observed in a single degree of excitation and, unpredictable run-up behaviour is revealed in the combined degree of excitation. However, the past studies on the combined excitation of sway, heave and/ or roll are rather scanty. Based on the investigation of sloshing dynamics in fixed tanks, the sloshing oscillation and induced hydrodynamic forces cannot emulate the real scenario of sloshing that occur in a sloshing tank, which floats or fixed on the floating bodies. Hence, an interaction study is necessary to understand the sloshing oscillation and its’ importance on a floating tank motions as reported by Chen and Chiang (2000). Based on the linear potential theory, frequency domain formulations were developed by various authors to study the interaction effect [(Molin et al. (2002); Malenica et al. (2003); Kim et al. (2003); Lee et al. (2005); Newman (2005); Zhao et al. (20012)]. Also, Lee et al. (2007) developed a time domain simulation scheme for the interaction effect. Noteworthy experimental works [Francescutto and Contento (1994); Rognebakke and Faltinsen (2001); Molin et al. (2002); Nam and Kim (2007)] explored the response behaviour of a floating vessel with partially filled liquid on board. Mitra et al. (2012) formulated a time domain approach and explored the interaction between 3-D sloshing and floating vessel due to combined action of wave, wind and flow current.
It is deduced from the literature review that the completeness of the interaction study between the floating vessel and sloshing oscillation in the real time marine environment depends on the number of degrees of freedom of excitation and environmental parameters. By keeping the above issues in mind, the present study aims to investigate the sloshing dynamics in a rectangular tank fixed on a freely floating barge type vessel under the beam wave excitation. A barge tank system with a model scale of 1:43 was fabricated and the tests were carried out with zero forward speed of the barge. The barge was allowed to oscillate in combined three degrees of freedom viz sway, heave and roll and thus, sloshing induced in the liquid tank due to barge motions. The sloshing dynamics in a partially filled rectangular liquid tank under regular wave excitation has been presented by the authors’ [Nasar et al. (2008a)]. In continuation with the previous study, the present paper details the phenomenon of sloshing under random wave excitation. The paper presents the experimental program and measurement details.
2. Experimental Investigations
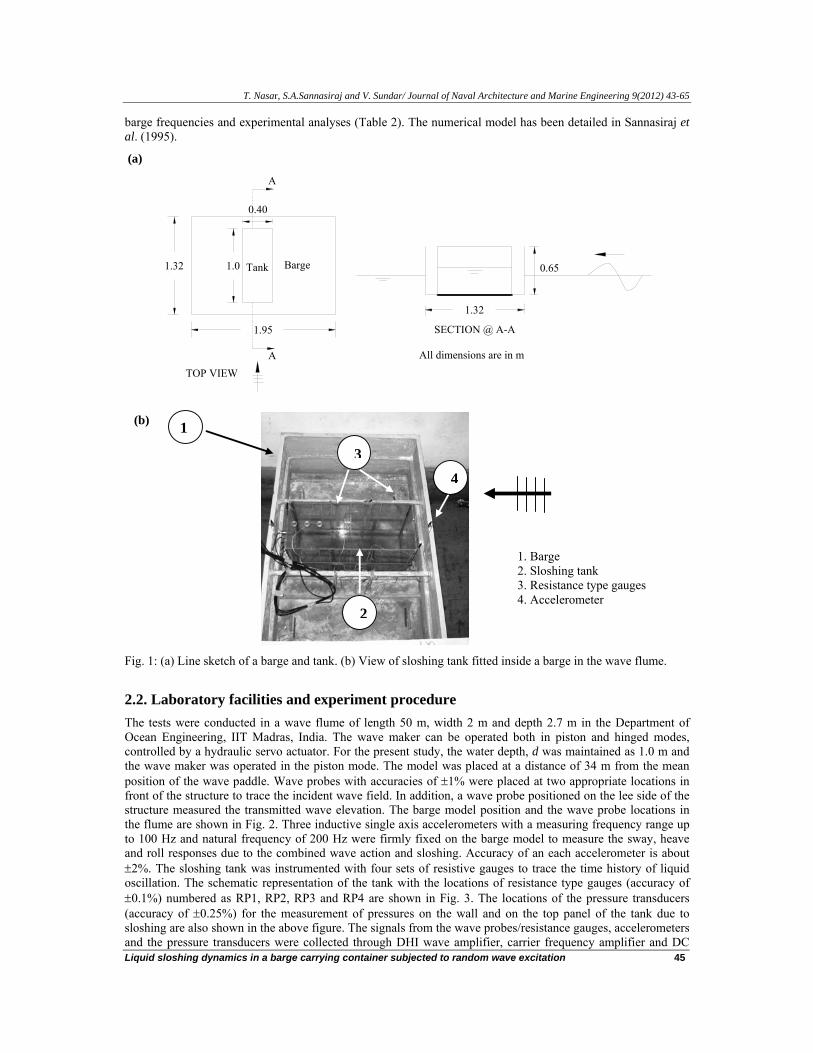
2.1. Model details A rectangular floating barge of breadth (B) 1.32 m and 0.65 m (D) deep was fabricated using fiber reinforced plastics. The length of the barge was 1.95 m to place across the wave flume such that beam sea test conditions were reproduced in the wave flume. A rectangular liquid tank of size, 1.0 m (l) X 0.40 m (b) X 0.65 m (h) was also fabricated using acrylic plate of thickness 12 mm. The longitudinal axis of the sloshing tank was oriented along the transverse width of the barge. The liquid tank was positioned inside the barge such that during the beam sea conditions, the sloshing oscillation occurred along the longitudinal axis of the tank. Fig. 1a shows the line sketch of the model details. A view of the sloshing tank rigidly fixed to a floating barge is shown in Fig. 1b. The liquid used for the present study is water. The linear sloshing modal frequencies [Ibrahim (2005)] for different liquid depths (hs) in the tank are provided in Table 1a. The draft of the barge for the four liquid depths in the sloshing tank and model parameters are presented in Table 1b. The heave and roll natural frequencies of the barge for equivalent dry weight condition were derived from the measured free response time histories in their respective modes in calm water condition. A reasonable agreement is found between numerically predicted
T. Nasar, S.A.Sannasiraj and V. Sundar/ Journal of Naval Architecture and Marine Engineering 9(2012) 43-65
Liquid sloshing dynamics in a barge carrying container subjected to random wave excitation 45
barge frequencies and experimental analyses (Table 2). The numerical model has been detailed in Sannasiraj et al. (1995).
(a)
1.32 Barge
TOP VIEW
1.0
1.95
Tank
A
0.40
All dimensions are in m
SECTION @ A-A
0.65
1.32
A
(b)
Fig. 1: (a) Line sketch of a barge and tank. (b) View of sloshing tank fitted inside a barge in the wave flume.
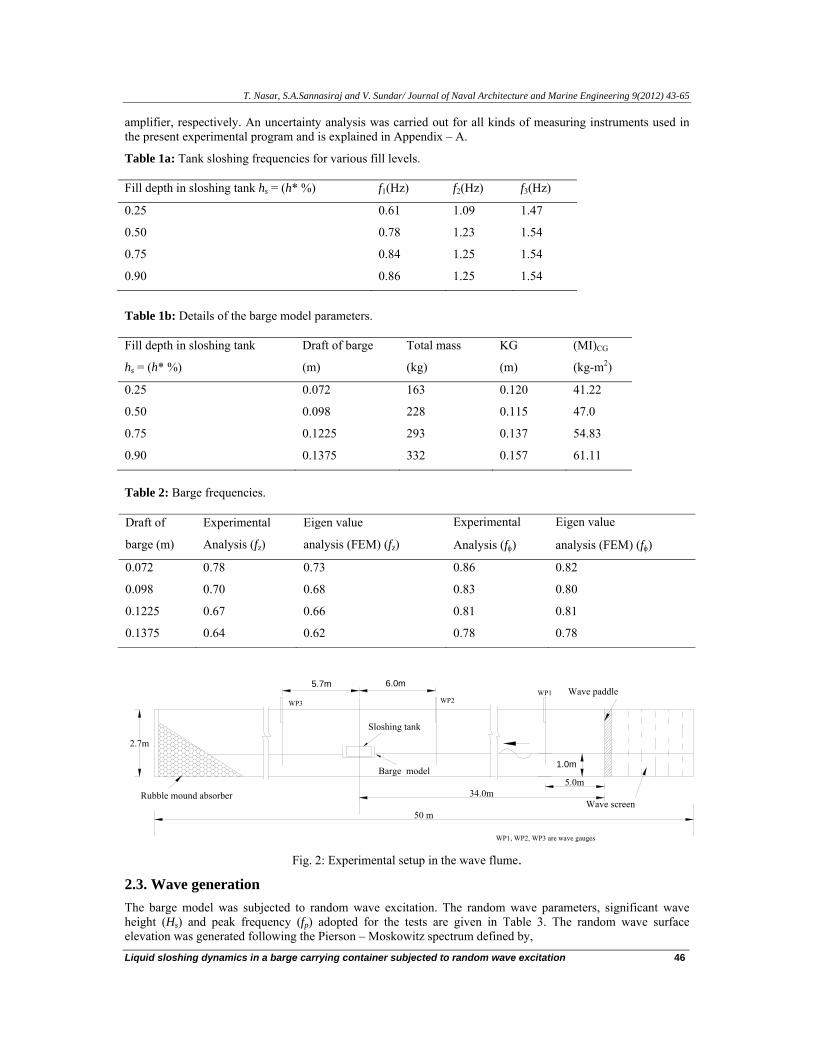
2.2. Laboratory facilities and experiment procedure The tests were conducted in a wave flume of length 50 m, width 2 m and depth 2.7 m in the Department of Ocean Engineering, IIT Madras, India. The wave maker can be operated both in piston and hinged modes, controlled by a hydraulic servo actuator. For the present study, the water depth, d was maintained as 1.0 m and the wave maker was operated in the piston mode. The model was placed at a distance of 34 m from the mean position of the wave paddle. Wave probes with accuracies of ±1% were placed at two appropriate locations in front of the structure to trace the incident wave field. In addition, a wave probe positioned on the lee side of the structure measured the transmitted wave elevation. The barge model position and the wave probe locations in the flume are shown in Fig. 2. Three inductive single axis accelerometers with a measuring frequency range up to 100 Hz and natural frequency of 200 Hz were firmly fixed on the barge model to measure the sway, heave and roll responses due to the combined wave action and sloshing. Accuracy of an each accelerometer is about ±2%. The sloshing tank was instrumented with four sets of resistive gauges to trace the time history of liquid oscillation. The schematic representation of the tank with the locations of resistance type gauges (accuracy of ±0.1%) numbered as RP1, RP2, RP3 and RP4 are shown in Fig. 3. The locations of the pressure transducers (accuracy of ±0.25%) for the measurement of pressures on the wall and on the top panel of the tank due to sloshing are also shown in the above figure. The signals from the wave probes/resistance gauges, accelerometers and the pressure transducers were collected through DHI wave amplifier, carrier frequency amplifier and DC
1. Barge 2. Sloshing tank 3. Resistance type gauges 4. Accelerometer
1
34
2
T. Nasar, S.A.Sannasiraj and V. Sundar/ Journal of Naval Architecture and Marine Engineering 9(2012) 43-65
Liquid sloshing dynamics in a barge carrying container subjected to random wave excitation 46
amplifier, respectively. An uncertainty analysis was carried out for all kinds of measuring instruments used in the present experimental program and is explained in Appendix – A.
Table 1a: Tank sloshing frequencies for various fill levels. Fill depth in sloshing tank hs = (h* %) f1(Hz) f2(Hz) f3(Hz)
0.25 0.61 1.09 1.47
0.50 0.78 1.23 1.54
0.75 0.84 1.25 1.54
0.90 0.86 1.25 1.54
Table 1b: Details of the barge model parameters. Fill depth in sloshing tank
hs = (h* %)
Draft of barge
(m)
Total mass
(kg)
KG
(m)
(MI)CG
(kg-m2)
0.25 0.072 163 0.120 41.22
0.50 0.098 228 0.115 47.0
0.75 0.1225 293 0.137 54.83
0.90 0.1375 332 0.157 61.11
Table 2: Barge frequencies. Draft of
barge (m)
Experimental
Analysis (fz)
Eigen value
analysis (FEM) (fz)
Experimental
Analysis (fφ)
Eigen value
analysis (FEM) (fφ)
0.072 0.78 0.73 0.86 0.82
0.098 0.70 0.68 0.83 0.80
0.1225 0.67 0.66 0.81 0.81
0.1375 0.64 0.62 0.78 0.78
Barge model
Sloshing tank
50 m
Rubble mound absorber
2.7m
WP3
5.7m 6.0m
WP1, WP2, WP3 are wave gauges
34.0m5.0m
Wave screen
1.0m
WP2Wave paddleWP1
Fig. 2: Experimental setup in the wave flume.
2.3. Wave generation The barge model was subjected to random wave excitation. The random wave parameters, significant wave height (Hs) and peak frequency (fp) adopted for the tests are given in Table 3. The random wave surface elevation was generated following the Pierson – Moskowitz spectrum defined by,
T. Nasar, S.A.Sannasiraj and V. Sundar/ Journal of Naval Architecture and Marine Engineering 9(2012) 43-65
Liquid sloshing dynamics in a barge carrying container subjected to random wave excitation 47
5 45 5( )= -16 4
2p ps
p
H f fS f expf f f
⎡ ⎤⎛ ⎞ ⎛ ⎞⎢ ⎥⎜ ⎟ ⎜ ⎟⎢ ⎥⎝ ⎠ ⎝ ⎠⎣ ⎦
(1)
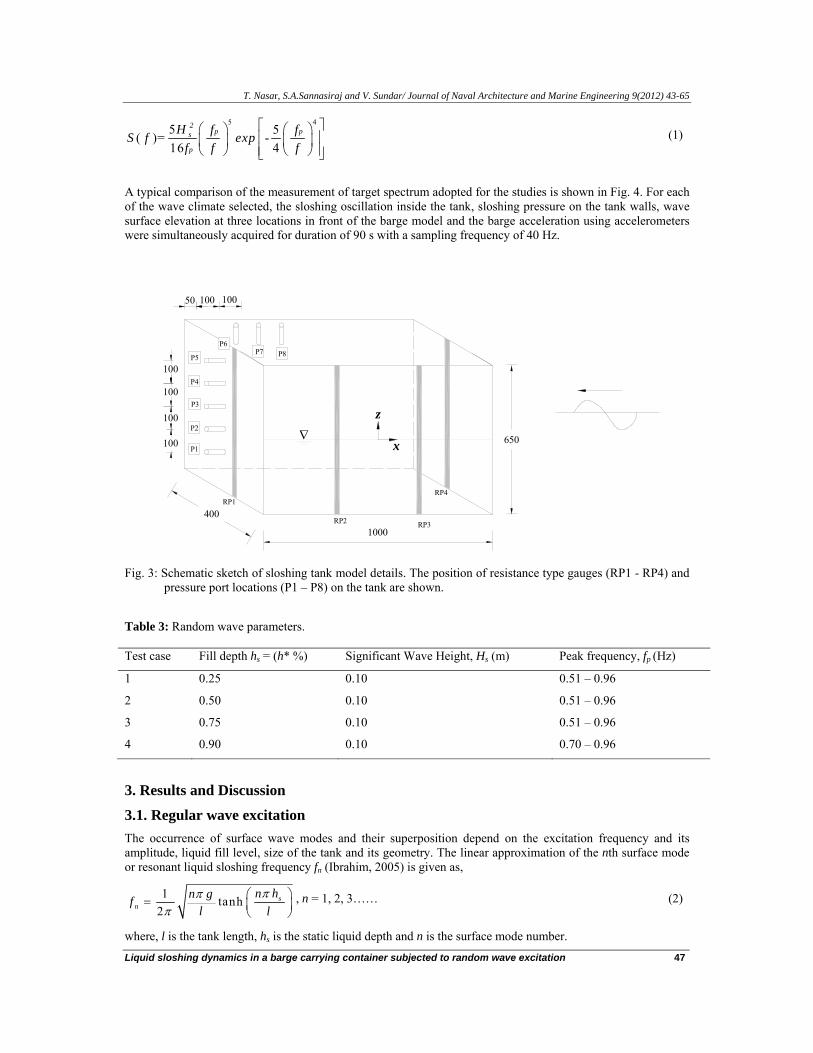
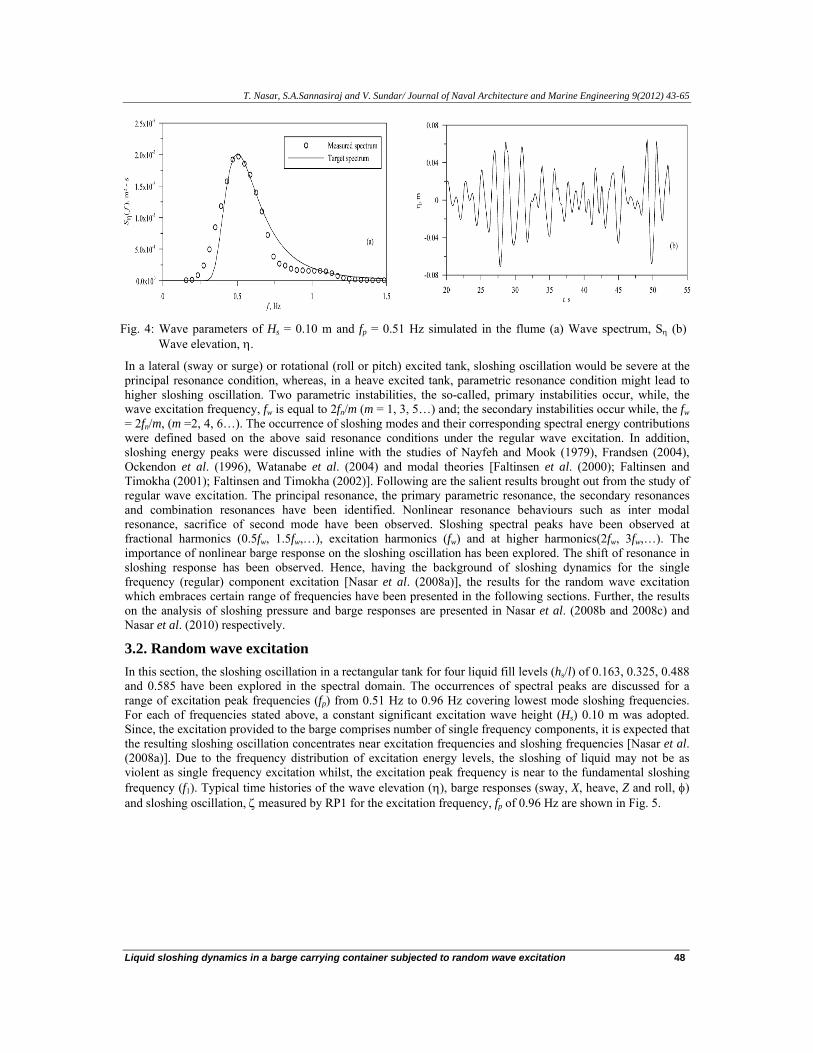
A typical comparison of the measurement of target spectrum adopted for the studies is shown in Fig. 4. For each of the wave climate selected, the sloshing oscillation inside the tank, sloshing pressure on the tank walls, wave surface elevation at three locations in front of the barge model and the barge acceleration using accelerometers were simultaneously acquired for duration of 90 s with a sampling frequency of 40 Hz.
50 100 100
P6P7 P8
100
100
100
100
P1
P2
P3
P4
P5
RP1
RP2 RP3
RP4
1000
400
650
z
x∇
Fig. 3: Schematic sketch of sloshing tank model details. The position of resistance type gauges (RP1 - RP4) and
pressure port locations (P1 – P8) on the tank are shown. Table 3: Random wave parameters. Test case Fill depth hs = (h* %) Significant Wave Height, Hs (m) Peak frequency, fp (Hz)
1 0.25 0.10 0.51 – 0.96
2 0.50 0.10 0.51 – 0.96
3 0.75 0.10 0.51 – 0.96
4 0.90 0.10 0.70 – 0.96
3. Results and Discussion
3.1. Regular wave excitation The occurrence of surface wave modes and their superposition depend on the excitation frequency and its amplitude, liquid fill level, size of the tank and its geometry. The linear approximation of the nth surface mode or resonant liquid sloshing frequency fn (Ibrahim, 2005) is given as,
s1 tanh2n
n hn gfl l
πππ
⎛ ⎞= ⎜ ⎟⎝ ⎠
, n = 1, 2, 3…… (2)
where, l is the tank length, hs is the static liquid depth and n is the surface mode number.
T. Nasar, S.A.Sannasiraj and V. Sundar/ Journal of Naval Architecture and Marine Engineering 9(2012) 43-65
Liquid sloshing dynamics in a barge carrying container subjected to random wave excitation 48
Fig. 4: Wave parameters of Hs = 0.10 m and fp = 0.51 Hz simulated in the flume (a) Wave spectrum, Sη (b)
Wave elevation, η.
In a lateral (sway or surge) or rotational (roll or pitch) excited tank, sloshing oscillation would be severe at the principal resonance condition, whereas, in a heave excited tank, parametric resonance condition might lead to higher sloshing oscillation. Two parametric instabilities, the so-called, primary instabilities occur, while, the wave excitation frequency, fw is equal to 2fn/m (m = 1, 3, 5…) and; the secondary instabilities occur while, the fw = 2fn/m, (m =2, 4, 6…). The occurrence of sloshing modes and their corresponding spectral energy contributions were defined based on the above said resonance conditions under the regular wave excitation. In addition, sloshing energy peaks were discussed inline with the studies of Nayfeh and Mook (1979), Frandsen (2004), Ockendon et al. (1996), Watanabe et al. (2004) and modal theories [Faltinsen et al. (2000); Faltinsen and Timokha (2001); Faltinsen and Timokha (2002)]. Following are the salient results brought out from the study of regular wave excitation. The principal resonance, the primary parametric resonance, the secondary resonances and combination resonances have been identified. Nonlinear resonance behaviours such as inter modal resonance, sacrifice of second mode have been observed. Sloshing spectral peaks have been observed at fractional harmonics (0.5fw, 1.5fw,…), excitation harmonics (fw) and at higher harmonics(2fw, 3fw,…). The importance of nonlinear barge response on the sloshing oscillation has been explored. The shift of resonance in sloshing response has been observed. Hence, having the background of sloshing dynamics for the single frequency (regular) component excitation [Nasar et al. (2008a)], the results for the random wave excitation which embraces certain range of frequencies have been presented in the following sections. Further, the results on the analysis of sloshing pressure and barge responses are presented in Nasar et al. (2008b and 2008c) and Nasar et al. (2010) respectively.
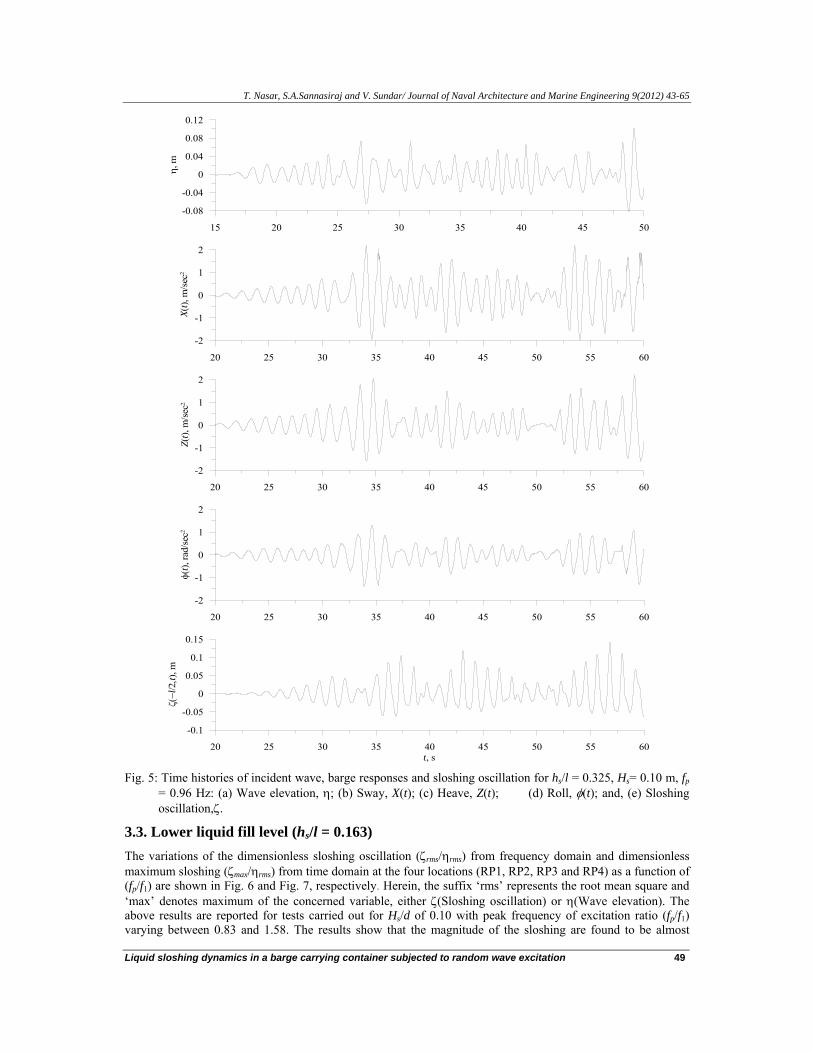
3.2. Random wave excitation In this section, the sloshing oscillation in a rectangular tank for four liquid fill levels (hs/l) of 0.163, 0.325, 0.488 and 0.585 have been explored in the spectral domain. The occurrences of spectral peaks are discussed for a range of excitation peak frequencies (fp) from 0.51 Hz to 0.96 Hz covering lowest mode sloshing frequencies. For each of frequencies stated above, a constant significant excitation wave height (Hs) 0.10 m was adopted. Since, the excitation provided to the barge comprises number of single frequency components, it is expected that the resulting sloshing oscillation concentrates near excitation frequencies and sloshing frequencies [Nasar et al. (2008a)]. Due to the frequency distribution of excitation energy levels, the sloshing of liquid may not be as violent as single frequency excitation whilst, the excitation peak frequency is near to the fundamental sloshing frequency (f1). Typical time histories of the wave elevation (η), barge responses (sway, X, heave, Z and roll, φ) and sloshing oscillation, ζ measured by RP1 for the excitation frequency, fp of 0.96 Hz are shown in Fig. 5.
T. Nasar, S.A.Sannasiraj and V. Sundar/ Journal of Naval Architecture and Marine Engineering 9(2012) 43-65
Liquid sloshing dynamics in a barge carrying container subjected to random wave excitation 49
20 25 30 35 40 45 50 55 60t, s
-0.1
-0.05
0
0.05
0.1
0.15
ζ(−l
/2,t)
, m
20 25 30 35 40 45 50 55 60
-2
-1
0
1
2
X(t),
m/s
ec2
15 20 25 30 35 40 45 50
-0.08
-0.04
0
0.04
0.08
0.12
η, m
20 25 30 35 40 45 50 55 60
-2
-1
0
1
2
Z(t),
m/s
ec2
20 25 30 35 40 45 50 55 60
-2
-1
0
1
2
φ(t),
rad/
sec2
Fig. 5: Time histories of incident wave, barge responses and sloshing oscillation for hs/l = 0.325, Hs= 0.10 m, fp
= 0.96 Hz: (a) Wave elevation, η; (b) Sway, X(t); (c) Heave, Z(t); (d) Roll, φ(t); and, (e) Sloshing oscillation,ζ.
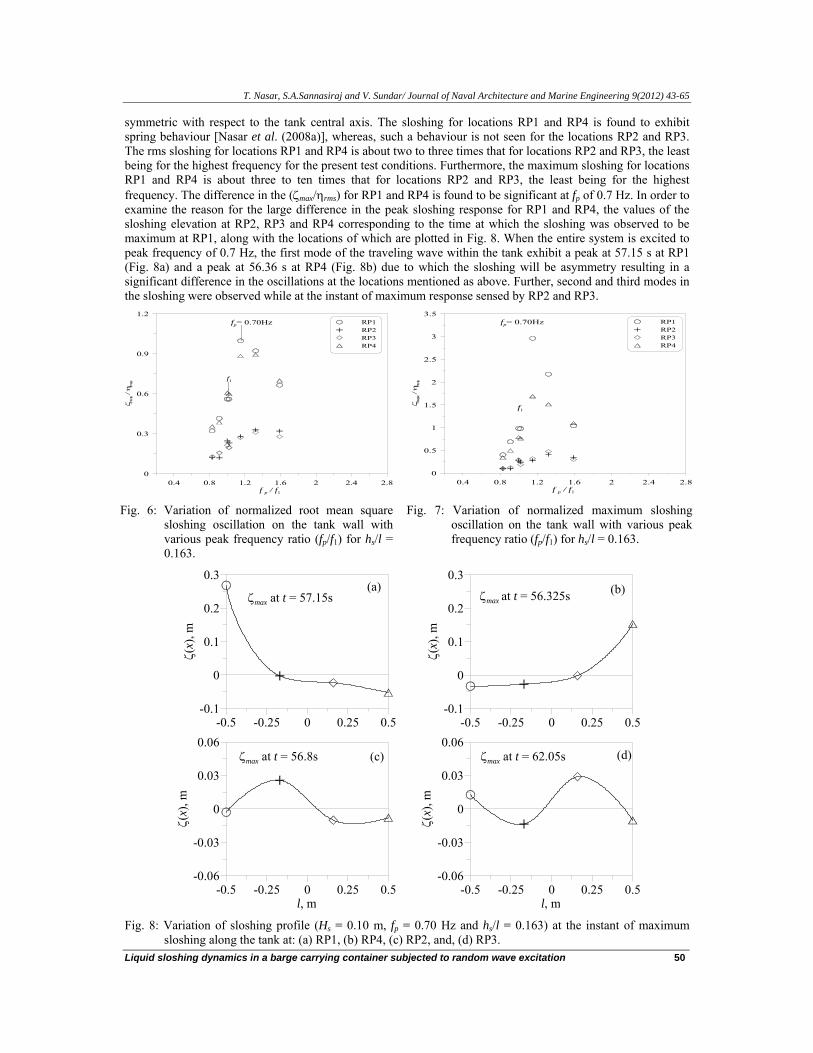
3.3. Lower liquid fill level (hs/l = 0.163) The variations of the dimensionless sloshing oscillation (ζrms/ηrms) from frequency domain and dimensionless maximum sloshing (ζmax/ηrms) from time domain at the four locations (RP1, RP2, RP3 and RP4) as a function of (fp/f1) are shown in Fig. 6 and Fig. 7, respectively. Herein, the suffix ‘rms’ represents the root mean square and ‘max’ denotes maximum of the concerned variable, either ζ(Sloshing oscillation) or η(Wave elevation). The above results are reported for tests carried out for Hs/d of 0.10 with peak frequency of excitation ratio (fp/f1) varying between 0.83 and 1.58. The results show that the magnitude of the sloshing are found to be almost
T. Nasar, S.A.Sannasiraj and V. Sundar/ Journal of Naval Architecture and Marine Engineering 9(2012) 43-65
Liquid sloshing dynamics in a barge carrying container subjected to random wave excitation 50
symmetric with respect to the tank central axis. The sloshing for locations RP1 and RP4 is found to exhibit spring behaviour [Nasar et al. (2008a)], whereas, such a behaviour is not seen for the locations RP2 and RP3. The rms sloshing for locations RP1 and RP4 is about two to three times that for locations RP2 and RP3, the least being for the highest frequency for the present test conditions. Furthermore, the maximum sloshing for locations RP1 and RP4 is about three to ten times that for locations RP2 and RP3, the least being for the highest frequency. The difference in the (ζmax/ηrms) for RP1 and RP4 is found to be significant at fp of 0.7 Hz. In order to examine the reason for the large difference in the peak sloshing response for RP1 and RP4, the values of the sloshing elevation at RP2, RP3 and RP4 corresponding to the time at which the sloshing was observed to be maximum at RP1, along with the locations of which are plotted in Fig. 8. When the entire system is excited to peak frequency of 0.7 Hz, the first mode of the traveling wave within the tank exhibit a peak at 57.15 s at RP1 (Fig. 8a) and a peak at 56.36 s at RP4 (Fig. 8b) due to which the sloshing will be asymmetry resulting in a significant difference in the oscillations at the locations mentioned as above. Further, second and third modes in the sloshing were observed while at the instant of maximum response sensed by RP2 and RP3.
0.4 0.8 1.2 1.6 2 2.4 2.8f p / f1
0
0.3
0.6
0.9
1.2
ζ rm
s / η
rms
RP1RP2RP3RP4
f1
fp= 0.70Hz
0.4 0.8 1.2 1.6 2 2.4 2.8
f p / f1
0
0.5
1
1.5
2
2.5
3
3.5
ζ max /
η rms
RP1RP2RP3RP4
f1
fp= 0.70Hz
Fig. 6: Variation of normalized root mean square
sloshing oscillation on the tank wall with various peak frequency ratio (fp/f1) for hs/l = 0.163.
Fig. 7: Variation of normalized maximum sloshing oscillation on the tank wall with various peak frequency ratio (fp/f1) for hs/l = 0.163.
-0.5 -0.25 0 0.25 0.5-0.1
0
0.1
0.2
0.3
ζ(x)
, m
(a)
-0.5 -0.25 0 0.25 0.5l, m
-0.06
-0.03
0
0.03
0.06
ζ(x)
, m
(c)
ζmax at t = 57.15s
-0.5 -0.25 0 0.25 0.5l, m
-0.06
-0.03
0
0.03
0.06
ζ(x)
, m
(d)
-0.5 -0.25 0 0.25 0.5-0.1
0
0.1
0.2
0.3
ζ(x)
, m
(b)
ζmax at t = 56.8s ζmax at t = 62.05s
ζmax at t = 56.325s
Fig. 8: Variation of sloshing profile (Hs = 0.10 m, fp = 0.70 Hz and hs/l = 0.163) at the instant of maximum
sloshing along the tank at: (a) RP1, (b) RP4, (c) RP2, and, (d) RP3.
T. Nasar, S.A.Sannasiraj and V. Sundar/ Journal of Naval Architecture and Marine Engineering 9(2012) 43-65
Liquid sloshing dynamics in a barge carrying container subjected to random wave excitation 51
-0.5 -0.25 0 0.25 0.5-0.1
-0.05
0
0.05
0.1
0.15
0.2
ζ(x)
, m
(a)
-0.5 -0.25 0 0.25 0.5l, m
-0.06
-0.03
0
0.03
0.06
ζ(x)
, m
(c)
ζmax at t = 59.925s
-0.5 -0.25 0 0.25 0.5l, m
-0.06
-0.03
0
0.03
0.06
ζ(x)
, m
(d)
-0.5 -0.25 0 0.25 0.5-0.1
-0.05
0
0.05
0.1
0.15
0.2
ζ(x)
, m
(b)
ζmax at t = 63.05s ζmax at t = 64.825s
ζmax at t = 60.625s
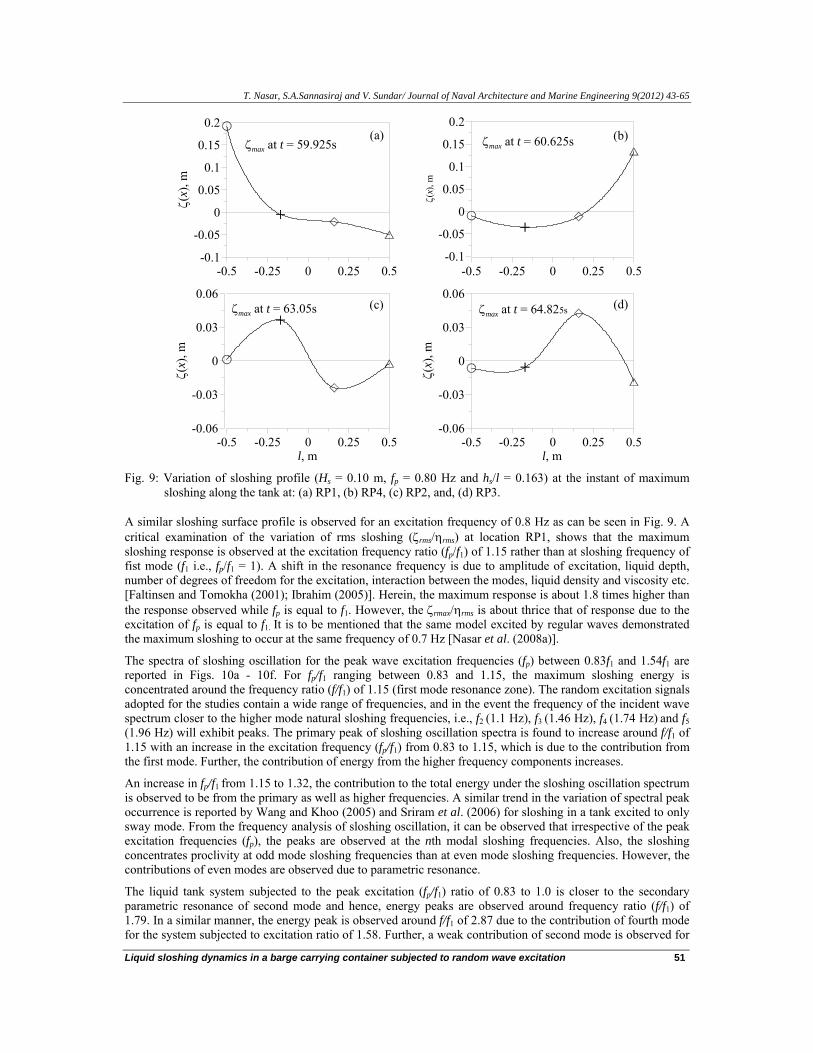
Fig. 9: Variation of sloshing profile (Hs = 0.10 m, fp = 0.80 Hz and hs/l = 0.163) at the instant of maximum
sloshing along the tank at: (a) RP1, (b) RP4, (c) RP2, and, (d) RP3.
A similar sloshing surface profile is observed for an excitation frequency of 0.8 Hz as can be seen in Fig. 9. A critical examination of the variation of rms sloshing (ζrms/ηrms) at location RP1, shows that the maximum sloshing response is observed at the excitation frequency ratio (fp/f1) of 1.15 rather than at sloshing frequency of fist mode (f1 i.e., fp/f1 = 1). A shift in the resonance frequency is due to amplitude of excitation, liquid depth, number of degrees of freedom for the excitation, interaction between the modes, liquid density and viscosity etc. [Faltinsen and Tomokha (2001); Ibrahim (2005)]. Herein, the maximum response is about 1.8 times higher than the response observed while fp is equal to f1. However, the ζrmax/ηrms is about thrice that of response due to the excitation of fp is equal to f1. It is to be mentioned that the same model excited by regular waves demonstrated the maximum sloshing to occur at the same frequency of 0.7 Hz [Nasar et al. (2008a)].
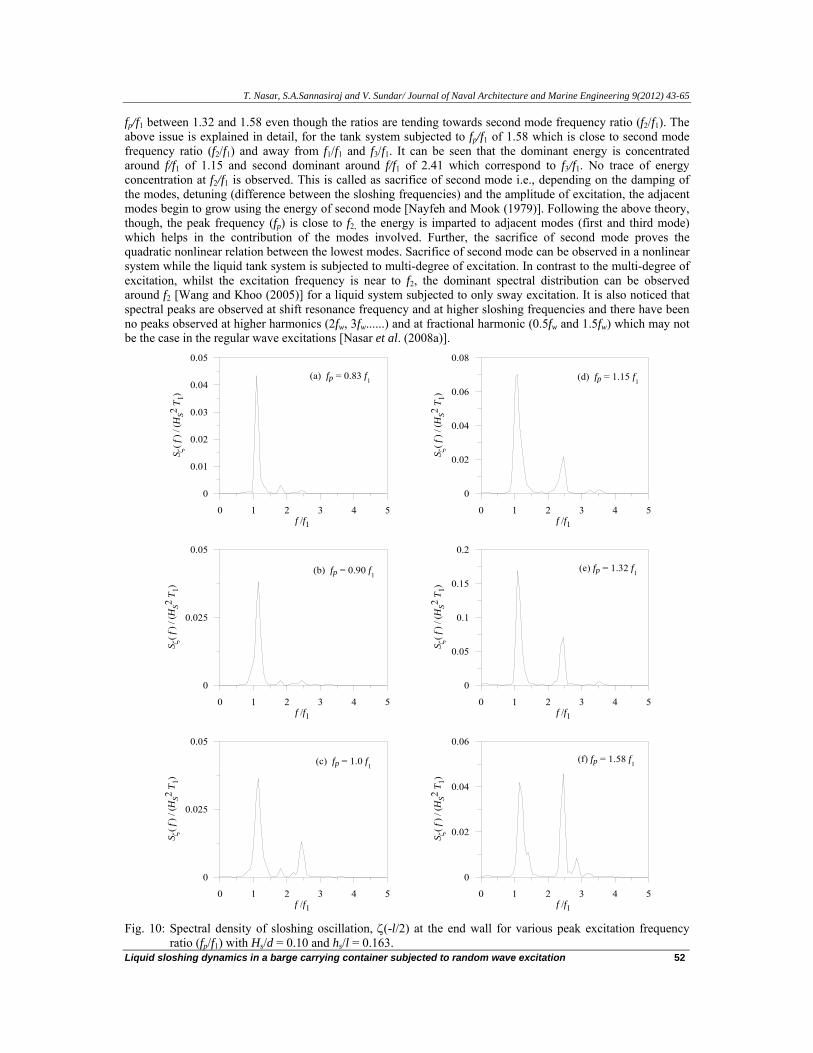
The spectra of sloshing oscillation for the peak wave excitation frequencies (fp) between 0.83f1 and 1.54f1 are reported in Figs. 10a - 10f. For fp/f1 ranging between 0.83 and 1.15, the maximum sloshing energy is concentrated around the frequency ratio (f/f1) of 1.15 (first mode resonance zone). The random excitation signals adopted for the studies contain a wide range of frequencies, and in the event the frequency of the incident wave spectrum closer to the higher mode natural sloshing frequencies, i.e., f2 (1.1 Hz), f3 (1.46 Hz), f4 (1.74 Hz) and f5 (1.96 Hz) will exhibit peaks. The primary peak of sloshing oscillation spectra is found to increase around f/f1 of 1.15 with an increase in the excitation frequency (fp/f1) from 0.83 to 1.15, which is due to the contribution from the first mode. Further, the contribution of energy from the higher frequency components increases.
An increase in fp/f1 from 1.15 to 1.32, the contribution to the total energy under the sloshing oscillation spectrum is observed to be from the primary as well as higher frequencies. A similar trend in the variation of spectral peak occurrence is reported by Wang and Khoo (2005) and Sriram et al. (2006) for sloshing in a tank excited to only sway mode. From the frequency analysis of sloshing oscillation, it can be observed that irrespective of the peak excitation frequencies (fp), the peaks are observed at the nth modal sloshing frequencies. Also, the sloshing concentrates proclivity at odd mode sloshing frequencies than at even mode sloshing frequencies. However, the contributions of even modes are observed due to parametric resonance.
The liquid tank system subjected to the peak excitation (fp/f1) ratio of 0.83 to 1.0 is closer to the secondary parametric resonance of second mode and hence, energy peaks are observed around frequency ratio (f/f1) of 1.79. In a similar manner, the energy peak is observed around f/f1 of 2.87 due to the contribution of fourth mode for the system subjected to excitation ratio of 1.58. Further, a weak contribution of second mode is observed for
T. Nasar, S.A.Sannasiraj and V. Sundar/ Journal of Naval Architecture and Marine Engineering 9(2012) 43-65
Liquid sloshing dynamics in a barge carrying container subjected to random wave excitation 52
fp/f1 between 1.32 and 1.58 even though the ratios are tending towards second mode frequency ratio (f2/f1). The above issue is explained in detail, for the tank system subjected to fp/f1 of 1.58 which is close to second mode frequency ratio (f2/f1) and away from f1/f1 and f3/f1. It can be seen that the dominant energy is concentrated around f/f1 of 1.15 and second dominant around f/f1 of 2.41 which correspond to f3/f1. No trace of energy concentration at f2/f1 is observed. This is called as sacrifice of second mode i.e., depending on the damping of the modes, detuning (difference between the sloshing frequencies) and the amplitude of excitation, the adjacent modes begin to grow using the energy of second mode [Nayfeh and Mook (1979)]. Following the above theory, though, the peak frequency (fp) is close to f2, the energy is imparted to adjacent modes (first and third mode) which helps in the contribution of the modes involved. Further, the sacrifice of second mode proves the quadratic nonlinear relation between the lowest modes. Sacrifice of second mode can be observed in a nonlinear system while the liquid tank system is subjected to multi-degree of excitation. In contrast to the multi-degree of excitation, whilst the excitation frequency is near to f2, the dominant spectral distribution can be observed around f2 [Wang and Khoo (2005)] for a liquid system subjected to only sway excitation. It is also noticed that spectral peaks are observed at shift resonance frequency and at higher sloshing frequencies and there have been no peaks observed at higher harmonics (2fw, 3fw......) and at fractional harmonic (0.5fw and 1.5fw) which may not be the case in the regular wave excitations [Nasar et al. (2008a)].
0 1 2 3 4 5f /f1
0
0.02
0.04
0.06
S ζ( f
) / (H
S2 T 1)
0 1 2 3 4 5f /f1
0
0.025
0.05
S ζ( f
) / (H
S2 T 1)
(c) fp = 1.0 f1(f) fp = 1.58 f1
0 1 2 3 4 5f /f1
0
0.05
0.1
0.15
0.2
S ζ( f
) / (H
S2 T 1)
0 1 2 3 4 5f /f1
0
0.025
0.05
S ζ( f
) / (H
S2 T 1)
(b) fp = 0.90 f1(e) fp = 1.32 f1
0 1 2 3 4 5f /f1
0
0.02
0.04
0.06
0.08
S ζ( f
) / (H
S2 T 1)
0 1 2 3 4 5f /f1
0
0.01
0.02
0.03
0.04
0.05
S ζ( f
) / (H
S2 T 1)
(a) fp = 0.83 f1 (d) fp = 1.15 f1
Fig. 10: Spectral density of sloshing oscillation, ζ(-l/2) at the end wall for various peak excitation frequency
ratio (fp/f1) with Hs/d = 0.10 and hs/l = 0.163.
T. Nasar, S.A.Sannasiraj and V. Sundar/ Journal of Naval Architecture and Marine Engineering 9(2012) 43-65
Liquid sloshing dynamics in a barge carrying container subjected to random wave excitation 53
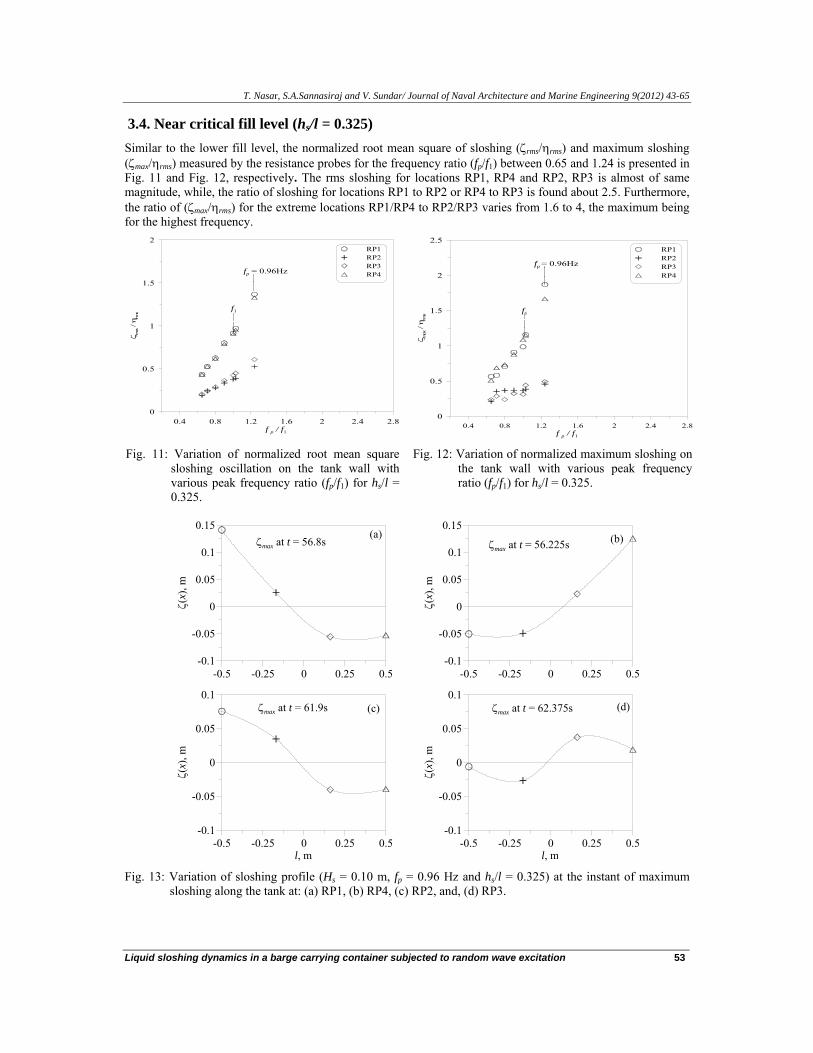
3.4. Near critical fill level (hs/l = 0.325) Similar to the lower fill level, the normalized root mean square of sloshing (ζrms/ηrms) and maximum sloshing (ζmax/ηrms) measured by the resistance probes for the frequency ratio (fp/f1) between 0.65 and 1.24 is presented in Fig. 11 and Fig. 12, respectively. The rms sloshing for locations RP1, RP4 and RP2, RP3 is almost of same magnitude, while, the ratio of sloshing for locations RP1 to RP2 or RP4 to RP3 is found about 2.5. Furthermore, the ratio of (ζmax/ηrms) for the extreme locations RP1/RP4 to RP2/RP3 varies from 1.6 to 4, the maximum being for the highest frequency.
0.4 0.8 1.2 1.6 2 2.4 2.8f p / f1
0
0.5
1
1.5
2
ζ rm
s / η
rms
RP1RP2RP3RP4
f1
fp = 0.96Hz
0.4 0.8 1.2 1.6 2 2.4 2.8f p / f1
0
0.5
1
1.5
2
2.5
ζ max /
η rms
RP1RP2RP3RP4
f1
fp = 0.96Hz
Fig. 11: Variation of normalized root mean square sloshing oscillation on the tank wall with various peak frequency ratio (fp/f1) for hs/l = 0.325.
Fig. 12: Variation of normalized maximum sloshing on the tank wall with various peak frequency ratio (fp/f1) for hs/l = 0.325.
-0.5 -0.25 0 0.25 0.5-0.1
-0.05
0
0.05
0.1
0.15
ζ(x)
, m
(a)
-0.5 -0.25 0 0.25 0.5l, m
-0.1
-0.05
0
0.05
0.1
ζ(x)
, m
(c)
ζmax at t = 56.8s
-0.5 -0.25 0 0.25 0.5l, m
-0.1
-0.05
0
0.05
0.1
ζ(x)
, m
(d)
-0.5 -0.25 0 0.25 0.5-0.1
-0.05
0
0.05
0.1
0.15
ζ(x)
, m
(b)
ζmax at t = 61.9s ζmax at t = 62.375s
ζmax at t = 56.225s
Fig. 13: Variation of sloshing profile (Hs = 0.10 m, fp = 0.96 Hz and hs/l = 0.325) at the instant of maximum
sloshing along the tank at: (a) RP1, (b) RP4, (c) RP2, and, (d) RP3.
T. Nasar, S.A.Sannasiraj and V. Sundar/ Journal of Naval Architecture and Marine Engineering 9(2012) 43-65
Liquid sloshing dynamics in a barge carrying container subjected to random wave excitation 54
0 1 2 3 4 5f /f1
0
0.15
0.3
0.45
S ζ( f
) / (H
S2 T 1)
0 1 2 3 4 5f /f1
0
0.02
0.04
0.06
0.08
S ζ( f
) / (H
S2 T 1)
(c) fp = 0.80 f1(f) fp = 1.24 f1
0 1 2 3 4 5f /f1
0
0.05
0.1
0.15
0.2
0.25
S ζ( f
) / (H
S2 T 1)
0 1 2 3 4 5f /f1
0
0.02
0.04
0.06
0.08
S ζ( f
) / (H
S2 T 1)
(b) fp = 0.71 f1(e) fp = 1.0 f1
0 1 2 3 4 5f /f1
0
0.03
0.06
0.09
0.12
0.15
S ζ( f
) / (H
S2 T 1)
0 1 2 3 4 5f /f1
0
0.02
0.04
S ζ( f
) / (H
S2 T 1)
(a) fp = 0.65 f1 (d) fp = 0.90 f1
Fig. 14: Spectral density of sloshing oscillation, ζ(-l/2) at the end wall for various peak excitation frequency
ratio (fp/f1) with Hs/d = 0.10 and hs/l = 0.325.
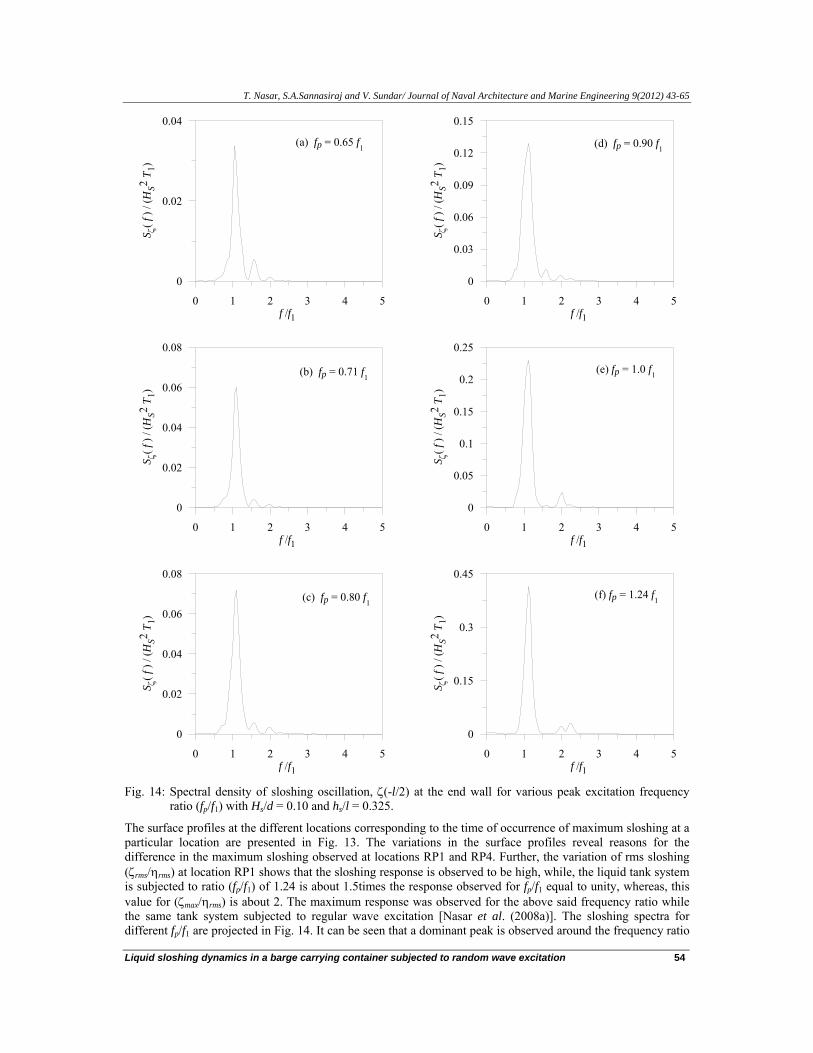
The surface profiles at the different locations corresponding to the time of occurrence of maximum sloshing at a particular location are presented in Fig. 13. The variations in the surface profiles reveal reasons for the difference in the maximum sloshing observed at locations RP1 and RP4. Further, the variation of rms sloshing (ζrms/ηrms) at location RP1 shows that the sloshing response is observed to be high, while, the liquid tank system is subjected to ratio (fp/f1) of 1.24 is about 1.5times the response observed for fp/f1 equal to unity, whereas, this value for (ζmax/ηrms) is about 2. The maximum response was observed for the above said frequency ratio while the same tank system subjected to regular wave excitation [Nasar et al. (2008a)]. The sloshing spectra for different fp/f1 are projected in Fig. 14. It can be seen that a dominant peak is observed around the frequency ratio
T. Nasar, S.A.Sannasiraj and V. Sundar/ Journal of Naval Architecture and Marine Engineering 9(2012) 43-65
Liquid sloshing dynamics in a barge carrying container subjected to random wave excitation 55
(f/f1) of 1.0 for the system subjected to the peak frequency ratios tested. Further, secondary peaks are observed for fp/f1 between 0.65 and 0.90. The smaller peaks observed at the ratio (f/f1) of 1.58 and 1.96 are due to the contribution of second mode (f2) and third mode (f3), respectively. For fp/f1 equal to unity, energy contributions are observed around odd mode sloshing frequencies f1 (dominant) and f3. Since, the fp/f1 of 1.24 is close to the parametric resonance of fourth mode, energy concentration is also noticed at the frequency ratio (f/f1) of 2.3 that correspond to f4/f1. As was discussed in the foregoing section, while, the excitation frequency ratio increases from 0.65 to 1.24, the magnitude of energy concentration increases around f/f1 of 1.0 which is due to the contribution of dominant first mode occurred in the system. Further, the contribution of second mode decreases, while, the fp/f1 increases from 1 to 1.32 and tend towards 1.58 which correspond to the second mode frequency zone. In general, it can be seen that the peaks are not observed at excitation harmonics and observed only at nth modal sloshing frequencies.
0.4 0.8 1.2 1.6 2f p / f1
0
0.3
0.6
0.9
1.2
1.5
1.8
ζ rms /
ηrm
s
RP1RP2RP3RP4
f1
fp = 0.96Hz
0.4 0.8 1.2 1.6 2f p / f1
0
0.3
0.6
0.9
1.2
1.5
1.8
2.1
ζ max /
η rms
RP1RP2RP3RP4
f1
fp = 0.96Hz
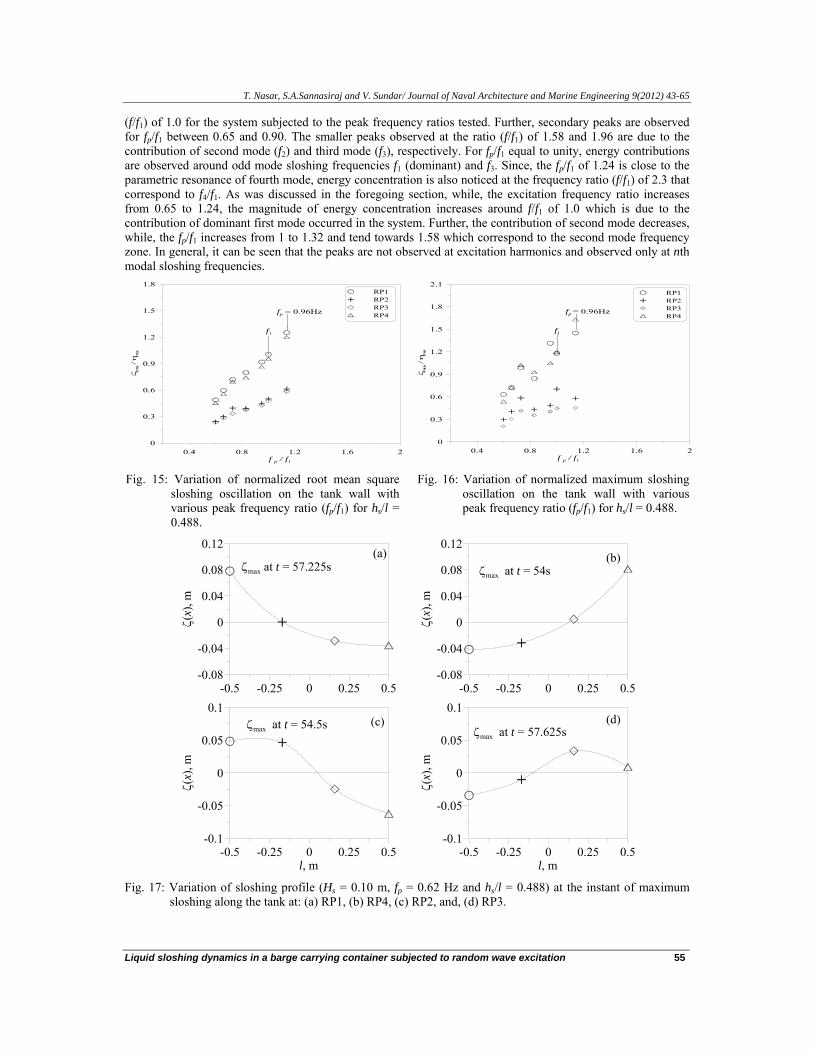
Fig. 15: Variation of normalized root mean square sloshing oscillation on the tank wall with various peak frequency ratio (fp/f1) for hs/l = 0.488.
Fig. 16: Variation of normalized maximum sloshing oscillation on the tank wall with various peak frequency ratio (fp/f1) for hs/l = 0.488.
-0.5 -0.25 0 0.25 0.5-0.08
-0.04
0
0.04
0.08
0.12
ζ(x)
, m
(a)
-0.5 -0.25 0 0.25 0.5l, m
-0.1
-0.05
0
0.05
0.1
ζ(x)
, m
(c)
ζmax at t = 57.225s
-0.5 -0.25 0 0.25 0.5l, m
-0.1
-0.05
0
0.05
0.1
ζ(x)
, m
(d)
-0.5 -0.25 0 0.25 0.5-0.08
-0.04
0
0.04
0.08
0.12
ζ(x)
, m
(b)
ζmax at t = 54.5sζmax at t = 57.625s
ζmax at t = 54s
Fig. 17: Variation of sloshing profile (Hs = 0.10 m, fp = 0.62 Hz and hs/l = 0.488) at the instant of maximum
sloshing along the tank at: (a) RP1, (b) RP4, (c) RP2, and, (d) RP3.
T. Nasar, S.A.Sannasiraj and V. Sundar/ Journal of Naval Architecture and Marine Engineering 9(2012) 43-65
Liquid sloshing dynamics in a barge carrying container subjected to random wave excitation 56
3.5. Above critical fill level (hs/l = 0.488) The variations of ζrms/ηrms and ζmax/ηrms measured at the tank walls as a function of fp/f1 when the model is subjected to a relative wave height (Hs/d) of 0.10 are depicted in Fig. 15 and Fig. 16, respectively. The rms sloshing for locations RP1, RP4 and RP2, RP3 is almost of same magnitude similar to that observed for other fill levels. The ratio of sloshing for locations RP1 to RP2 or RP4 to RP3 is found about 2.0 which is slightly less than that for hs/l = 0.325 reported earlier. Furthermore, the maximum sloshing for locations RP1 and RP4 is about 1.6 to 2.7 times that for locations RP2 and RP3, the maximum being for fp/f1 = 0.95.
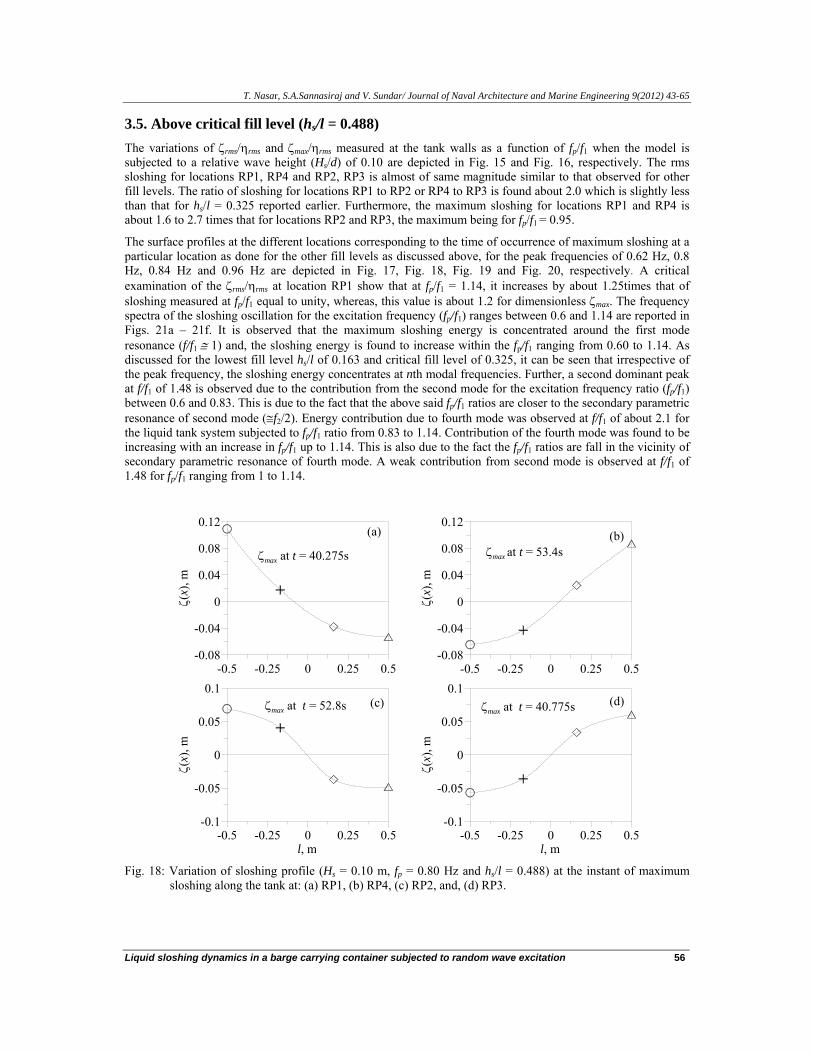
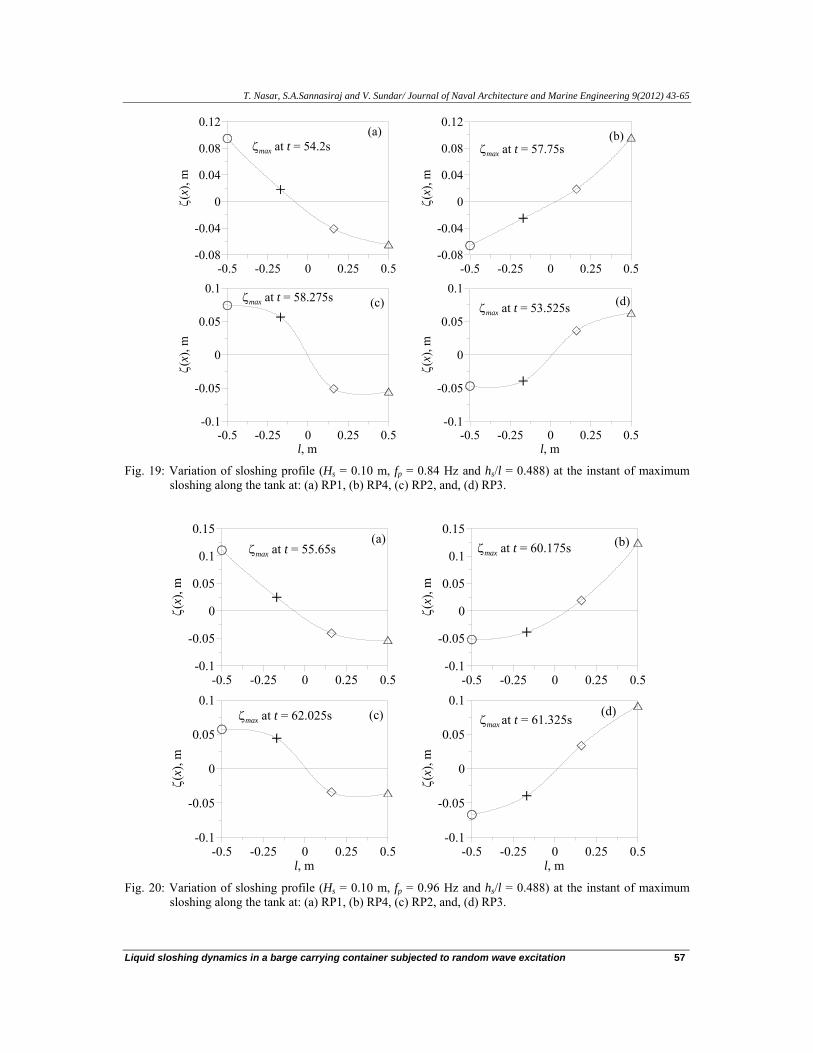
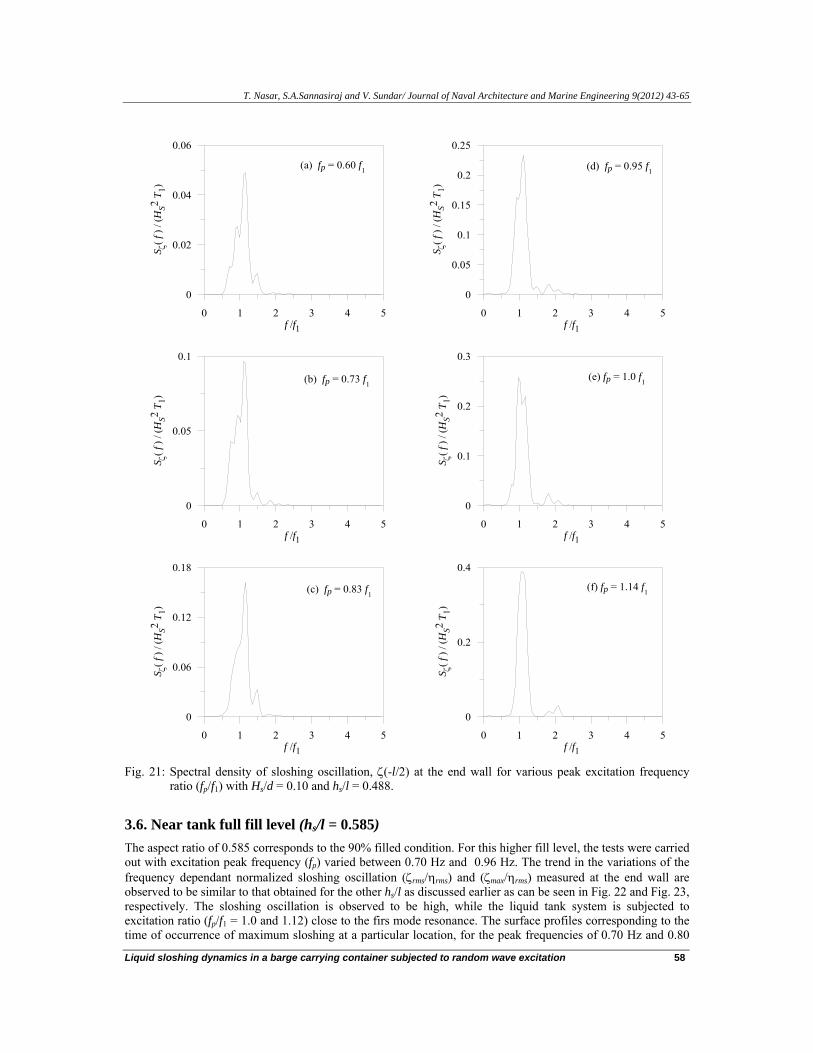
The surface profiles at the different locations corresponding to the time of occurrence of maximum sloshing at a particular location as done for the other fill levels as discussed above, for the peak frequencies of 0.62 Hz, 0.8 Hz, 0.84 Hz and 0.96 Hz are depicted in Fig. 17, Fig. 18, Fig. 19 and Fig. 20, respectively. A critical examination of the ζrms/ηrms at location RP1 show that at fp/f1 = 1.14, it increases by about 1.25times that of sloshing measured at fp/f1 equal to unity, whereas, this value is about 1.2 for dimensionless ζmax. The frequency spectra of the sloshing oscillation for the excitation frequency (fp/f1) ranges between 0.6 and 1.14 are reported in Figs. 21a – 21f. It is observed that the maximum sloshing energy is concentrated around the first mode resonance (f/f1 ≅ 1) and, the sloshing energy is found to increase within the fp/f1 ranging from 0.60 to 1.14. As discussed for the lowest fill level hs/l of 0.163 and critical fill level of 0.325, it can be seen that irrespective of the peak frequency, the sloshing energy concentrates at nth modal frequencies. Further, a second dominant peak at f/f1 of 1.48 is observed due to the contribution from the second mode for the excitation frequency ratio (fp/f1) between 0.6 and 0.83. This is due to the fact that the above said fp/f1 ratios are closer to the secondary parametric resonance of second mode (≅f2/2). Energy contribution due to fourth mode was observed at f/f1 of about 2.1 for the liquid tank system subjected to fp/f1 ratio from 0.83 to 1.14. Contribution of the fourth mode was found to be increasing with an increase in fp/f1 up to 1.14. This is also due to the fact the fp/f1 ratios are fall in the vicinity of secondary parametric resonance of fourth mode. A weak contribution from second mode is observed at f/f1 of 1.48 for fp/f1 ranging from 1 to 1.14.
-0.5 -0.25 0 0.25 0.5-0.08
-0.04
0
0.04
0.08
0.12
ζ(x)
, m
(a)
-0.5 -0.25 0 0.25 0.5l, m
-0.1
-0.05
0
0.05
0.1
ζ(x)
, m
(c)
ζmax at t = 40.275s
-0.5 -0.25 0 0.25 0.5l, m
-0.1
-0.05
0
0.05
0.1
ζ(x)
, m
(d)
-0.5 -0.25 0 0.25 0.5-0.08
-0.04
0
0.04
0.08
0.12
ζ(x)
, m
(b)
ζmax at t = 52.8s ζmax at t = 40.775s
ζmax at t = 53.4s
Fig. 18: Variation of sloshing profile (Hs = 0.10 m, fp = 0.80 Hz and hs/l = 0.488) at the instant of maximum
sloshing along the tank at: (a) RP1, (b) RP4, (c) RP2, and, (d) RP3.
T. Nasar, S.A.Sannasiraj and V. Sundar/ Journal of Naval Architecture and Marine Engineering 9(2012) 43-65
Liquid sloshing dynamics in a barge carrying container subjected to random wave excitation 57
-0.5 -0.25 0 0.25 0.5-0.08
-0.04
0
0.04
0.08
0.12
ζ(x)
, m
(a)
-0.5 -0.25 0 0.25 0.5l, m
-0.1
-0.05
0
0.05
0.1
ζ(x)
, m
(c)
ζmax at t = 54.2s
-0.5 -0.25 0 0.25 0.5l, m
-0.1
-0.05
0
0.05
0.1
ζ(x)
, m
(d)
-0.5 -0.25 0 0.25 0.5-0.08
-0.04
0
0.04
0.08
0.12
ζ(x)
, m
(b)
ζmax at t = 58.275sζmax at t = 53.525s
ζmax at t = 57.75s
Fig. 19: Variation of sloshing profile (Hs = 0.10 m, fp = 0.84 Hz and hs/l = 0.488) at the instant of maximum
sloshing along the tank at: (a) RP1, (b) RP4, (c) RP2, and, (d) RP3.
-0.5 -0.25 0 0.25 0.5-0.1
-0.05
0
0.05
0.1
0.15
ζ(x)
, m
(a)
-0.5 -0.25 0 0.25 0.5l, m
-0.1
-0.05
0
0.05
0.1
ζ(x)
, m
(c)
ζmax at t = 55.65s
-0.5 -0.25 0 0.25 0.5l, m
-0.1
-0.05
0
0.05
0.1
ζ(x)
, m
(d)
-0.5 -0.25 0 0.25 0.5-0.1
-0.05
0
0.05
0.1
0.15
ζ(x)
, m
(b)
ζmax at t = 62.025s ζmax at t = 61.325s
ζmax at t = 60.175s
Fig. 20: Variation of sloshing profile (Hs = 0.10 m, fp = 0.96 Hz and hs/l = 0.488) at the instant of maximum
sloshing along the tank at: (a) RP1, (b) RP4, (c) RP2, and, (d) RP3.
T. Nasar, S.A.Sannasiraj and V. Sundar/ Journal of Naval Architecture and Marine Engineering 9(2012) 43-65
Liquid sloshing dynamics in a barge carrying container subjected to random wave excitation 58
0 1 2 3 4 5f /f1
0
0.2
0.4
S ζ( f
) / (H
S2 T 1)
0 1 2 3 4 5f /f1
0
0.06
0.12
0.18
S ζ( f
) / (H
S2 T 1)
(c) fp = 0.83 f1(f) fp = 1.14 f1
0 1 2 3 4 5f /f1
0
0.1
0.2
0.3
S ζ( f
) / (H
S2 T 1)
0 1 2 3 4 5f /f1
0
0.05
0.1
S ζ( f
) / (H
S2 T 1)
(b) fp = 0.73 f1(e) fp = 1.0 f1
0 1 2 3 4 5f /f1
0
0.05
0.1
0.15
0.2
0.25
S ζ( f
) / (H
S2 T 1)
0 1 2 3 4 5f /f1
0
0.02
0.04
0.06S ζ(
f ) /
(HS2
T 1)(a) fp = 0.60 f1 (d) fp = 0.95 f1
Fig. 21: Spectral density of sloshing oscillation, ζ(-l/2) at the end wall for various peak excitation frequency
ratio (fp/f1) with Hs/d = 0.10 and hs/l = 0.488.
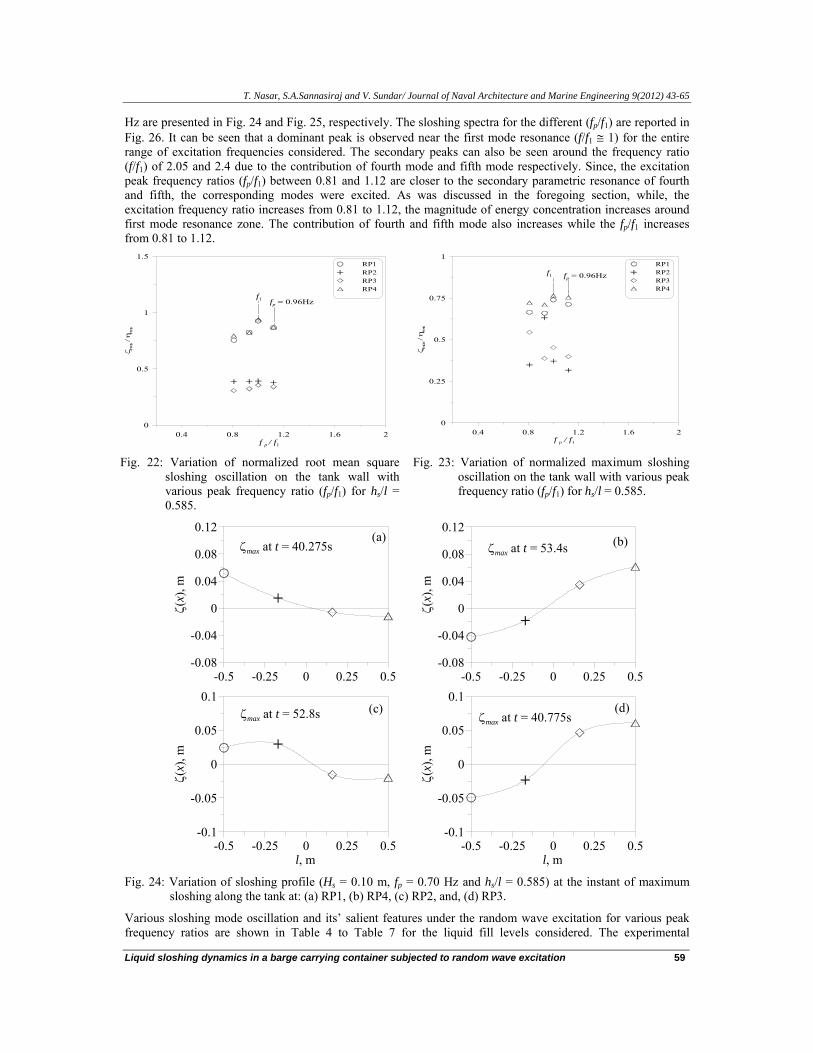
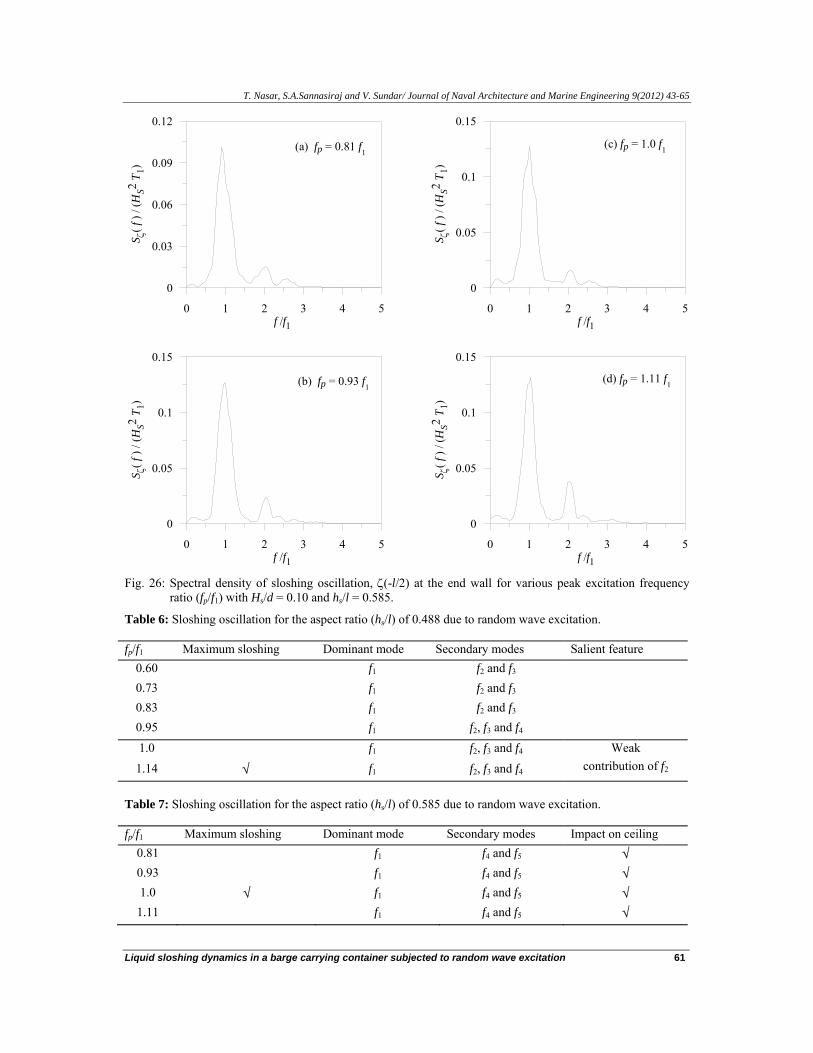
3.6. Near tank full fill level (hs/l = 0.585) The aspect ratio of 0.585 corresponds to the 90% filled condition. For this higher fill level, the tests were carried out with excitation peak frequency (fp) varied between 0.70 Hz and 0.96 Hz. The trend in the variations of the frequency dependant normalized sloshing oscillation (ζrms/ηrms) and (ζmax/ηrms) measured at the end wall are observed to be similar to that obtained for the other hs/l as discussed earlier as can be seen in Fig. 22 and Fig. 23, respectively. The sloshing oscillation is observed to be high, while the liquid tank system is subjected to excitation ratio (fp/f1 = 1.0 and 1.12) close to the firs mode resonance. The surface profiles corresponding to the time of occurrence of maximum sloshing at a particular location, for the peak frequencies of 0.70 Hz and 0.80
T. Nasar, S.A.Sannasiraj and V. Sundar/ Journal of Naval Architecture and Marine Engineering 9(2012) 43-65
Liquid sloshing dynamics in a barge carrying container subjected to random wave excitation 59
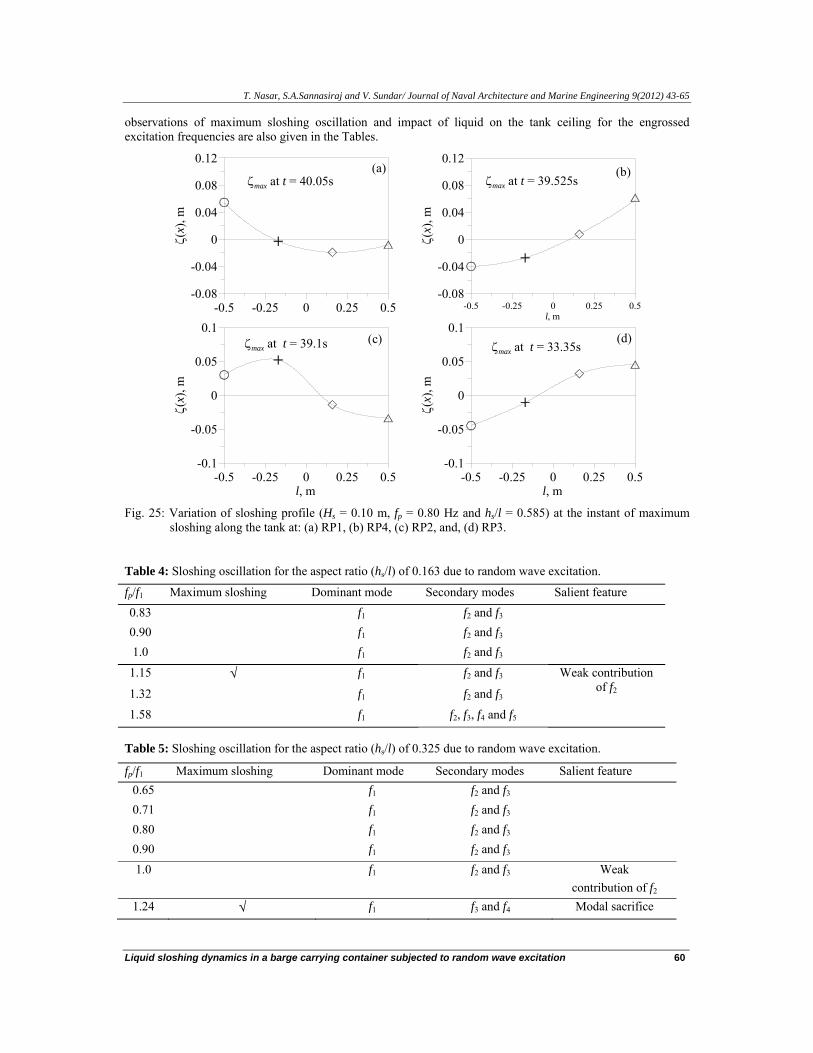
Hz are presented in Fig. 24 and Fig. 25, respectively. The sloshing spectra for the different (fp/f1) are reported in Fig. 26. It can be seen that a dominant peak is observed near the first mode resonance (f/f1 ≅ 1) for the entire range of excitation frequencies considered. The secondary peaks can also be seen around the frequency ratio (f/f1) of 2.05 and 2.4 due to the contribution of fourth mode and fifth mode respectively. Since, the excitation peak frequency ratios (fp/f1) between 0.81 and 1.12 are closer to the secondary parametric resonance of fourth and fifth, the corresponding modes were excited. As was discussed in the foregoing section, while, the excitation frequency ratio increases from 0.81 to 1.12, the magnitude of energy concentration increases around first mode resonance zone. The contribution of fourth and fifth mode also increases while the fp/f1 increases from 0.81 to 1.12.
0.4 0.8 1.2 1.6 2f p / f1
0
0.5
1
1.5
ζ rms /
ηrm
s
RP1RP2RP3RP4
f1 fp = 0.96Hz
0.4 0.8 1.2 1.6 2
f p / f1
0
0.25
0.5
0.75
1
ζ max /
η rm
s
RP1RP2RP3RP4
f1 fp = 0.96Hz
Fig. 22: Variation of normalized root mean square sloshing oscillation on the tank wall with various peak frequency ratio (fp/f1) for hs/l = 0.585.
Fig. 23: Variation of normalized maximum sloshing oscillation on the tank wall with various peak frequency ratio (fp/f1) for hs/l = 0.585.
-0.5 -0.25 0 0.25 0.5-0.08
-0.04
0
0.04
0.08
0.12
ζ(x)
, m
(a)
-0.5 -0.25 0 0.25 0.5l, m
-0.1
-0.05
0
0.05
0.1
ζ(x)
, m
(c)
ζmax at t = 40.275s
-0.5 -0.25 0 0.25 0.5l, m
-0.1
-0.05
0
0.05
0.1
ζ(x)
, m
(d)
-0.5 -0.25 0 0.25 0.5-0.08
-0.04
0
0.04
0.08
0.12
ζ(x)
, m
(b)
ζmax at t = 52.8s ζmax at t = 40.775s
ζmax at t = 53.4s
Fig. 24: Variation of sloshing profile (Hs = 0.10 m, fp = 0.70 Hz and hs/l = 0.585) at the instant of maximum
sloshing along the tank at: (a) RP1, (b) RP4, (c) RP2, and, (d) RP3.
Various sloshing mode oscillation and its’ salient features under the random wave excitation for various peak frequency ratios are shown in Table 4 to Table 7 for the liquid fill levels considered. The experimental
T. Nasar, S.A.Sannasiraj and V. Sundar/ Journal of Naval Architecture and Marine Engineering 9(2012) 43-65
Liquid sloshing dynamics in a barge carrying container subjected to random wave excitation 60
observations of maximum sloshing oscillation and impact of liquid on the tank ceiling for the engrossed excitation frequencies are also given in the Tables.
-0.5 -0.25 0 0.25 0.5-0.08
-0.04
0
0.04
0.08
0.12
ζ(x)
, m(a)
-0.5 -0.25 0 0.25 0.5l, m
-0.1
-0.05
0
0.05
0.1
ζ(x)
, m
(c)
ζmax at t = 40.05s
-0.5 -0.25 0 0.25 0.5l, m
-0.1
-0.05
0
0.05
0.1
ζ(x)
, m
(d)
-0.5 -0.25 0 0.25 0.5l, m
-0.08
-0.04
0
0.04
0.08
0.12
ζ(x)
, m
(b)
ζmax at t = 39.1s ζmax at t = 33.35s
ζmax at t = 39.525s
Fig. 25: Variation of sloshing profile (Hs = 0.10 m, fp = 0.80 Hz and hs/l = 0.585) at the instant of maximum
sloshing along the tank at: (a) RP1, (b) RP4, (c) RP2, and, (d) RP3.
Table 4: Sloshing oscillation for the aspect ratio (hs/l) of 0.163 due to random wave excitation.
fp/f1 Maximum sloshing Dominant mode Secondary modes Salient feature 0.83 f1 f2 and f3 0.90 f1 f2 and f3 1.0 f1 f2 and f3
1.15 √ f1 f2 and f3 Weak contribution of f2 1.32 f1 f2 and f3
1.58 f1 f2, f3, f4 and f5
Table 5: Sloshing oscillation for the aspect ratio (hs/l) of 0.325 due to random wave excitation.
fp/f1 Maximum sloshing Dominant mode Secondary modes Salient feature 0.65 f1 f2 and f3 0.71 f1 f2 and f3 0.80 f1 f2 and f3 0.90 f1 f2 and f3 1.0 f1 f2 and f3 Weak
contribution of f2 1.24 √ f1 f3 and f4 Modal sacrifice
T. Nasar, S.A.Sannasiraj and V. Sundar/ Journal of Naval Architecture and Marine Engineering 9(2012) 43-65
Liquid sloshing dynamics in a barge carrying container subjected to random wave excitation 61
0 1 2 3 4 5f /f1
0
0.05
0.1
0.15
S ζ( f
) / (H
S2 T 1)
0 1 2 3 4 5f /f1
0
0.05
0.1
0.15
S ζ( f
) / (H
S2 T 1)
(b) fp = 0.93 f1(d) fp = 1.11 f1
0 1 2 3 4 5f /f1
0
0.05
0.1
0.15
S ζ( f
) / (H
S2 T 1)
0 1 2 3 4 5f /f1
0
0.03
0.06
0.09
0.12S ζ(
f ) /
(HS2
T 1)(a) fp = 0.81 f1
(c) fp = 1.0 f1
Fig. 26: Spectral density of sloshing oscillation, ζ(-l/2) at the end wall for various peak excitation frequency
ratio (fp/f1) with Hs/d = 0.10 and hs/l = 0.585.
Table 6: Sloshing oscillation for the aspect ratio (hs/l) of 0.488 due to random wave excitation. fp/f1 Maximum sloshing Dominant mode Secondary modes Salient feature
0.60 f1 f2 and f3 0.73 f1 f2 and f3 0.83 f1 f2 and f3 0.95 f1 f2, f3 and f4 1.0 f1 f2, f3 and f4 Weak
contribution of f2 1.14 √ f1 f2, f3 and f4
Table 7: Sloshing oscillation for the aspect ratio (hs/l) of 0.585 due to random wave excitation. fp/f1 Maximum sloshing Dominant mode Secondary modes Impact on ceiling
0.81 f1 f4 and f5 √ 0.93 f1 f4 and f5 √ 1.0 √ f1 f4 and f5 √
1.11 f1 f4 and f5 √
T. Nasar, S.A.Sannasiraj and V. Sundar/ Journal of Naval Architecture and Marine Engineering 9(2012) 43-65
Liquid sloshing dynamics in a barge carrying container subjected to random wave excitation 62
4. Conclusions and Recommendations for future work In the present study, the sloshing dynamics in a tank under the combined degree of random excitation has been explored through a well controlled experimental program, from which the following salient conclusions are drawn:
The maximum root mean square sloshing oscillation for fill levels (hs/l) of 0.163, 0.325 and 0.488 is found to be about 1.8, 1.5 and 1.25 times of sloshing oscillation while the excitation peak frequency equals to the first mode frequency, respectively. The corresponding maximum sloshing for the above respective fill levels is found to be about 3.0, 1.9 and 1.25 times of sloshing oscillation observed at the excitation at first mode frequency.
The present study reiterates that irrespective of the excitation peak frequencies, the dominant sloshing energy concentrates near the first mode resonance. This is due to the fact that even though, the random oscillation embraces a wide range of frequencies which covers up to certain higher nth modal sloshing frequencies, the fundamental mode always dominates higher modes.
The sloshing oscillation peaks occur only at nth modal sloshing frequencies. Whereas, the sloshing also oscillates at excitation harmonics while system is subjected to regular wave excitation.
In general, the sloshing of odd modes contribution dominates even modes. However, if the excitation frequency is closer to secondary parametric resonance of a particular even mode, its energy contribution is observed to be high compared to that of adjacent odd modes.
The sacrifice of second mode is observed while the excitation peak frequency is close to the primary resonance of second mode. This nonlinear phenomenon has not been observed from the studies on single degree of excitation.
With the knowledge gained from the present and past studies of authors’ own work, the authors’ would like to mention the following recommendations for future work on this topic:
In the authors’ work, a tank partially filled with liquid and rigidly fixed inside a barge has been subjected to wave action and the freely floating barge responses have been analyzed. The study can be extended to multiple tanks with different fill levels inside the barge at same deck level. Further, it can be extended to tanks at different deck levels.
The sloshing dynamics and induced sloshing pressure in a 2-D sloshing tank has been explored out for the beam sea test conditions which is the worst scenario to arrive the design sloshing loads on the tank walls. The study can be extended in a 3-D sloshing tank.
The influence of nonlinear barge responses on the sloshing has been identified. It would be an interesting work finding the influence of mooring line on the sloshing oscillation.
The authors’ studies concentrate on three degrees of excitation, more information can be obtained under the action of multidirectional waves.
References Benjamin, T.B. and Ursell, H.W. (1954): The Stability of the Plane Free Surface of a Liquid in a Vertical Periodic Motion, Proceedings of Royal Society of London, Series A225, pp.505 – 515. http://dx.doi.org/10.1098/rspa.1954.0218 Chen, B.F. and Chiang, H.W. (2000): Complete Two Dimensional Analysis of Sea Wave Induced fully Nonlinear Sloshing Fluid in a Rigid Floating Tank, Ocean Engineering, Vol.27, pp.953 – 977. http://dx.doi.org/10.1016/S0029-8018(99)00036-0 Faraday, M. (1831): On the Forms and States assumed by Fluids in Contact with Vibrating Elastic Surfaces, Transactions of Royal Society of London, Vol.121, pp.309 - 346. Faltinsen, O.M. (1974): Nonlinear Theory of Sloshing in Rectangular Tanks, Journal of Ship Research, Vol.18, No.4, pp.224 – 241.
T. Nasar, S.A.Sannasiraj and V. Sundar/ Journal of Naval Architecture and Marine Engineering 9(2012) 43-65
Liquid sloshing dynamics in a barge carrying container subjected to random wave excitation 63
Faltinsen, O.M. (1978): A Numerical Nonlinear Method of Sloshing in Tanks with Two Dimensional Flow, Journal of Ship Research, Vol.22, No.3, pp.193 – 202. Faltinsen, O.M., Rognebakke, O.F., Lukovksky, I.A. and Timokha, A.N. (2000): Multimodal Analysis of Nonlinear Sloshing in a Rectangular Tank with Finite Water depth, Journal of Fluid Mechanics, Vol.407, pp.201 – 234. http://dx.doi.org/10.1017/S0022112099007569 Faltinsen, O.M. and Timokha, A.N. (2001): Adaptive Multimodal approach to Nonlinear Sloshing in a Rectangular Tank., Journal of Fluid Mechanics, Vol.432, pp.167 – 200. Faltinsen, O.M. and Timokha, A.N. (2002): Asymptotic Modal approximation of Nonlinear Resonant Sloshing in a Rectangular Tank with small Fuid depth, Journal of Fluid Mechanics, Vol.470, pp.319 – 357. http://dx.doi.org/10.1017/S0022112002002112 Francescutto, A. and Contento, G. (1994): An Experimental Study of the Coupling between Roll motion and Sloshing in a Compartment, Proceedings of the 4th International Offshore and Polar Engineering Conference, Osaka, Japan. Frandsen, J.B. (2003): Simulation of Sloshing motions in Fixed and Vertically Excited Containers using a 2-D Inviscid sigma-transformed Finite Difference Solver, Journal of Fluids and Structures, Vol.18, pp.197 – 214. http://dx.doi.org/10.1016/j.jfluidstructs.2003.07.004 Frandsen, J.B. (2004): Sloshing in Excited Tanks, Journal of Computational Physics, Vol.196, pp.53 – 87. http://dx.doi.org/10.1016/j.jcp.2003.10.031 Ibrahim, R.A. (2005): Liquid Sloshing Dynamics – Theory and Applications, Cambridge University press, Newyork. Kim, M.S., Park J.S. and Lee, W. (2003): A new VOF – based Numerical scheme for the Simulation of Fluid flow with Free Surface Part II: Application to the Cavity Filling and Sloshing problems, International Journal of Numerical Methods in Fluids, Vol.42, pp.791 - 812. http://dx.doi.org/10.1002/fld.554 Kim, Y., Shin, Y., Kim, W. and Yue, D. (2003): Study on Sloshing problem Coupled with Ship Motion in Waves, Proceedings of the 8th International Conference on Numerical Ship Hydrodynamics, Busan, Korea. Lui, A.P. and Lou, Y.K. (1990): Dynamic Coupling of a Liquid Tank system under Transient Excitations, Ocean Engineering, Vol.17, No.3, pp.263 – 277. http://dx.doi.org/10.1016/0029-8018(90)90005-Q Lee, D.H., Kim, M.H., Kwon, S.H., Kim, J.W. and Lee, Y.B. (2005): A Parametric and Numerical study on LNG-tank Sloshing loads, Proceedings of the 15th International Offshore and Polar engineering Conference, Seoul, Korea Lee, S.J., Kim, M.H., Lee, D.H., Kim, J.W. and Kim, Y.H. (2007): The Effects of LNG tank Sloshing on the Global motions of LNG carriers, Ocean Engineering, Vol.34, pp.10 – 20. http://dx.doi.org/10.1016/j.oceaneng.2006.02.007 Mitra, S., Wang, C.J., Reddy, J.N. and Khoo, B.C. (2012): A 3D fully Coupled analysis of Nonlinear Sloshing and Ship motion, Ocean Engineering, Vol.39, pp.1 – 13. http://dx.doi.org/10.1016/j.oceaneng.2011.09.015 Moiseyev, N.N. (1958): On the Theory of Nonlinear Vibrations of a Liquid of Finite volume. Applied Mathematics and Mechanics, Vol. 22, No.5, pp.612 – 621. Molin, B., Remy, F., Rigaud, S., and de Jouette, Ch. (2002): LNG-FPSO’s: Frequency Domain Coupled Analysis of Support and Liquid Cargo motion, Proceedings of the International Maritime Association of Mediterannean Conference, Rethymnon, Greece. Malenica, S., Zalar, M. and Chen, X.B. (2003): Dynamic Coupling of Sea keeping and Sloshing, Proceedings of the 13th International Offshore and Polar Engineering Conference, Honolulu, USA. Nayfeh, A.H. and Mook, D.T. (1979): Nonlinear Oscillations, John Wiley sons, Newyork. Nakayama, T. and Washizu, K. (1980): Nonlinear Analysis of Liquid motion in a Container subjected to Forced Pitching Oscillation. International Journal of Numerical Methods in Engineering, Vol.15, pp.1207 - 1220. http://dx.doi.org/10.1002/nme.1620150808 Nam, B.W. and Kim, Y. (2007): Effect of Sloshing on the motion Response of LNG – FPSO in Waves, Proceedings of the 22nd Workshop on Water Waves and Floating Bodies, Plitviz, Croatia. Nasar T., Sannasiraj S.A. and Sundar V. (2008a): Experimental Study of Liquid Sloshing Dynamics in a Barge carrying Tank. Fluid Dynamics Research, Vol.40, pp.427 - 458. http://dx.doi.org/10.1016/j.fluiddyn.2008.02.001
T. Nasar, S.A.Sannasiraj and V. Sundar/ Journal of Naval Architecture and Marine Engineering 9(2012) 43-65
Liquid sloshing dynamics in a barge carrying container subjected to random wave excitation 64
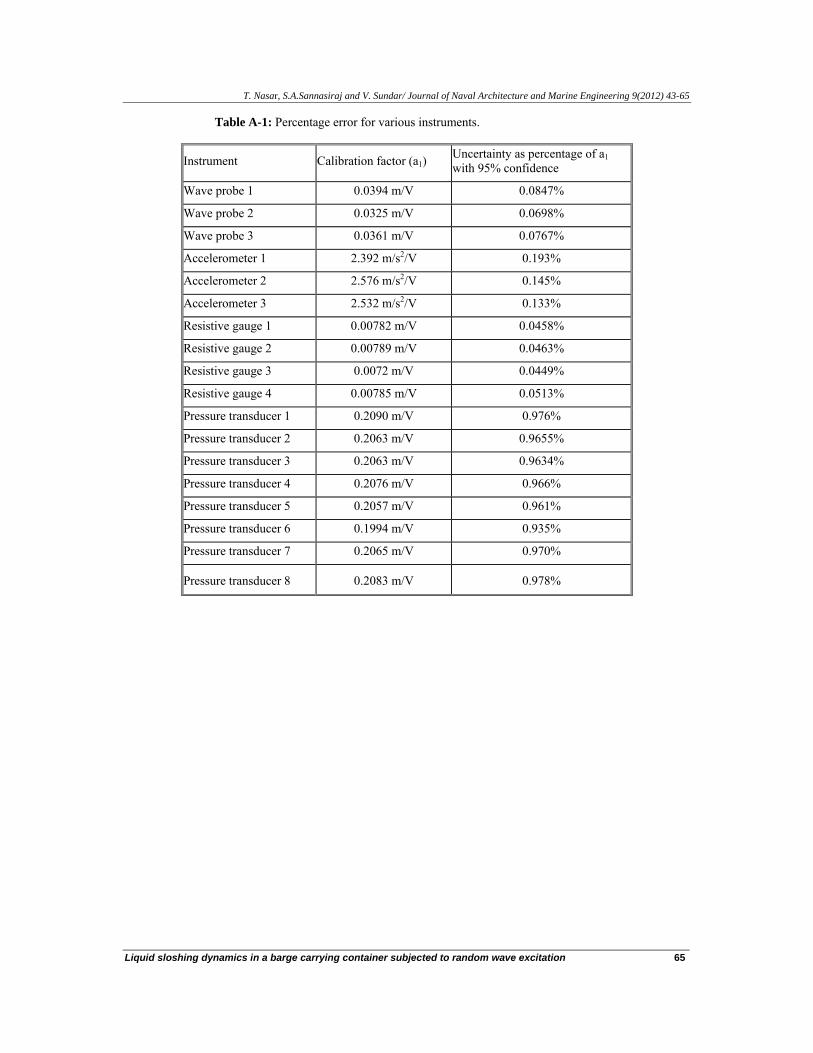
Nasar, T., Sannasiraj, S.A. and Sundar, V. (2008b): Sloshing Pressure Variation in a Barge carrying Tank, Ships and Offshore Structures, Vol.3, No.3, pp.185 - 203. http://dx.doi.org/10.1080/17445300802204363 Nasar, T., Sannasiraj, S.A. and Sundar, V. (2008c): Wave Induced Sloshing pressure in a Liquid Tank under Irregular Waves, Part M: Journal of Engineering for Maritime Environment, Vol.223, No.2, pp.145 - 161. doi: 10.1243/14750902JEME135 Nasar, T., Sannasiraj, S.A. and Sundar, V. (2010): Motion Responses of Barge carrying Liquid Tank, Ocean Engineering, Vol.37, pp.935 - 946. http://dx.doi.org/10.1016/j.oceaneng.2010.03.006 Newman J.N. (2005): Wave effects on Vessels with Internal Tanks, Proceedings of the 20th Workshop on Water Waves and Floating Bodies, Spitsbergen, Norway. Ockendon, H., Ockendon, J.R. and Waterhouse, D.D. (1996): Multimode Resonances in Fluids, Journal of Fluid Mechanics, Vol.315, pp.317 – 344. http://dx.doi.org/10.1017/S0022112096002443 Rognebakke, O.R. and Faltinsen O.M. (2001): Effects of Sloshing on Ship Motions, Proceedings of the 16th Workshop on Water Waves and Floating Bodies, Hiroshima, Japan. Sannasiraj, S.A., Sundar, V. and Sundaravadivelu, R. (1995): The Hydrodynamic behaviour of Long Floating Structures in Directional Seas, Applied Ocean Research, Vol.17, pp.233 - 243. http://dx.doi.org/10.1016/0141-1187(95)00011-9 Sriram V., Sannasiraj S.A. and Sundar V. (2006): Numerical Simulation of 2D Sloshing Waves due to Horizontal and Vertical Random Excitations, Applied Ocean Research, Vol.28, pp.19 – 32. http://dx.doi.org/10.1016/j.apor.2006.01.002 Waterhouse, D.D. (1994): Resonant Sloshing near Critical depth, Journal of Fluid Mechanics, Vol.281, pp.313 – 318. http://dx.doi.org/10.1017/S0022112094003125 Wu, G.X., Ma, Q.W. and Eatock Taylor, R. (1998): Numerical Simulation of Sloshing Waves in a 3D Tank based on a Finite Element Method, Applied Ocean Research, Vol.20, pp.337 – 355. http://dx.doi.org/10.1016/S0141-1187(98)00030-3 Wang C Z. and Khoo B.C. (2005): Finite Element Analysis of Two-Dimensional Nonlinear Sloshing problems in Random Excitations, Ocean Engineering, Vol.32, pp.107 – 133. http://dx.doi.org/10.1016/j.oceaneng.2004.08.001 Watanabe, M., Kobayashi, N. and Wada, Y. (2004): Dynamic Stability of Flexible Bellows subjected to Periodic Internal Fluid Pressure Excitation, Journal of Pressure Vessel Technology, Vol.126, No.2, pp.188 - 193. http://dx.doi.org/10.1115/1.1687380 Zhao, W., Yang, J., Hu, Z. and Xiao, L. (2012): Experimental investigation of Effects of inner- tank Sloshing on Hydrodynamics of an flng system, Journal of Hydrodynamics Ser. B, Vol.24, No.1, pp.107 – 115. http://dx.doi.org/10.1016/S1001-6058(11)60224-2 Appendix - A In the present experimental study, the various data from the different instruments were acquired through a computer based system and hence most of the observational and recording errors are eliminated. The auto zero adjustment in the data acquisition system minimizes the zero error to negligible values. The calibration factors were incorporated in the data acquisition program and thus, the possible mistakes in computation were also reduced. The uncertainties in the calibration and measurement stages for all the instruments in the system were estimated.
The results are reported as the most probable value and the 95% confidence interval. The most probable value is the value around which the observation would fall and for infinite number of observations (termed as population); this value would be the arithmetic mean. The 95% confidence interval is the range in which the observations would lie with a probability of 95%. For large samples, this value ranges from -2σ to +2σ, where σ is the standard deviation.
The methodology of linear regression analysis has been used to estimate the uncertainties in the estimation of the calibration factors for the wave probes, pressure transducers, resistive gauges and accelerometers. The estimated uncertainties of each instrument expressed as percentage of their respective slope of the regression fit (a1) with 95% confidence are given in Table A-1.
T. Nasar, S.A.Sannasiraj and V. Sundar/ Journal of Naval Architecture and Marine Engineering 9(2012) 43-65
Liquid sloshing dynamics in a barge carrying container subjected to random wave excitation 65
Table A-1: Percentage error for various instruments.
Instrument Calibration factor (a1) Uncertainty as percentage of a1 with 95% confidence
Wave probe 1 0.0394 m/V 0.0847%
Wave probe 2 0.0325 m/V 0.0698%
Wave probe 3 0.0361 m/V 0.0767%
Accelerometer 1 2.392 m/s2/V 0.193%
Accelerometer 2 2.576 m/s2/V 0.145%
Accelerometer 3 2.532 m/s2/V 0.133%
Resistive gauge 1 0.00782 m/V 0.0458%
Resistive gauge 2 0.00789 m/V 0.0463%
Resistive gauge 3 0.0072 m/V 0.0449%
Resistive gauge 4 0.00785 m/V 0.0513%
Pressure transducer 1 0.2090 m/V 0.976%
Pressure transducer 2 0.2063 m/V 0.9655%
Pressure transducer 3 0.2063 m/V 0.9634%
Pressure transducer 4 0.2076 m/V 0.966%
Pressure transducer 5 0.2057 m/V 0.961%
Pressure transducer 6 0.1994 m/V 0.935%
Pressure transducer 7 0.2065 m/V 0.970%
Pressure transducer 8 0.2083 m/V 0.978%