Embed Size (px)
Citation preview

7.4 Confidence Intervals for Variance and Standard DeviationStatistics

Essential Questions
Since variance and standard deviation are statistical quantities of a set of data, can we construct confidence intervals for these quantities?
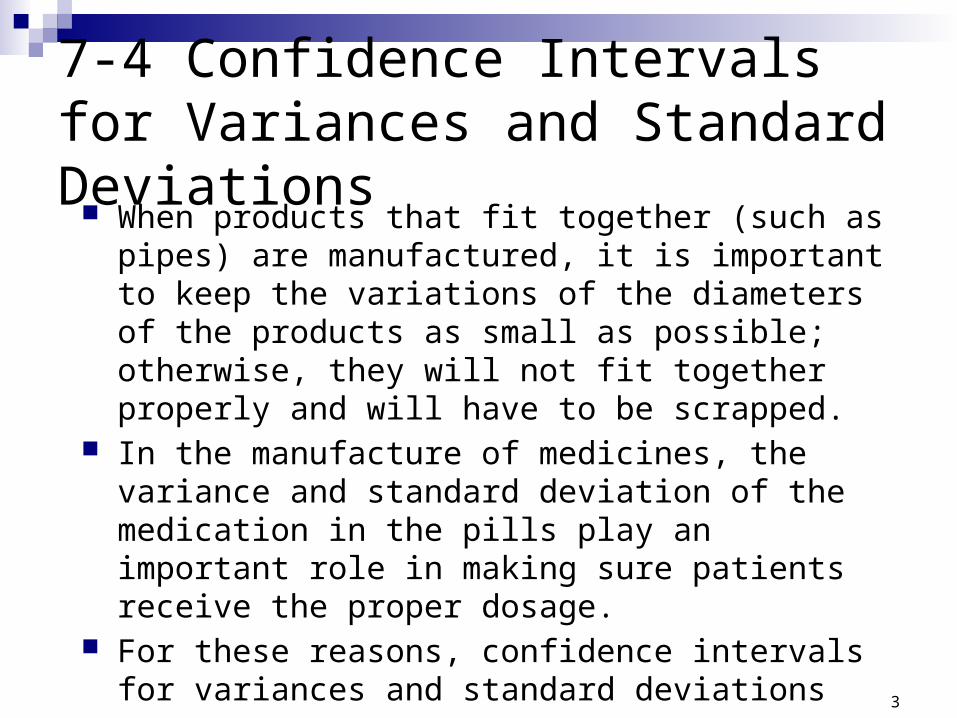
7-4 Confidence Intervals for Variances and Standard Deviations
When products that fit together (such as pipes) are manufactured, it is important to keep the variations of the diameters of the products as small as possible; otherwise, they will not fit together properly and will have to be scrapped.
In the manufacture of medicines, the variance and standard deviation of the medication in the pills play an important role in making sure patients receive the proper dosage.
For these reasons, confidence intervals for variances and standard deviations are necessary.
3
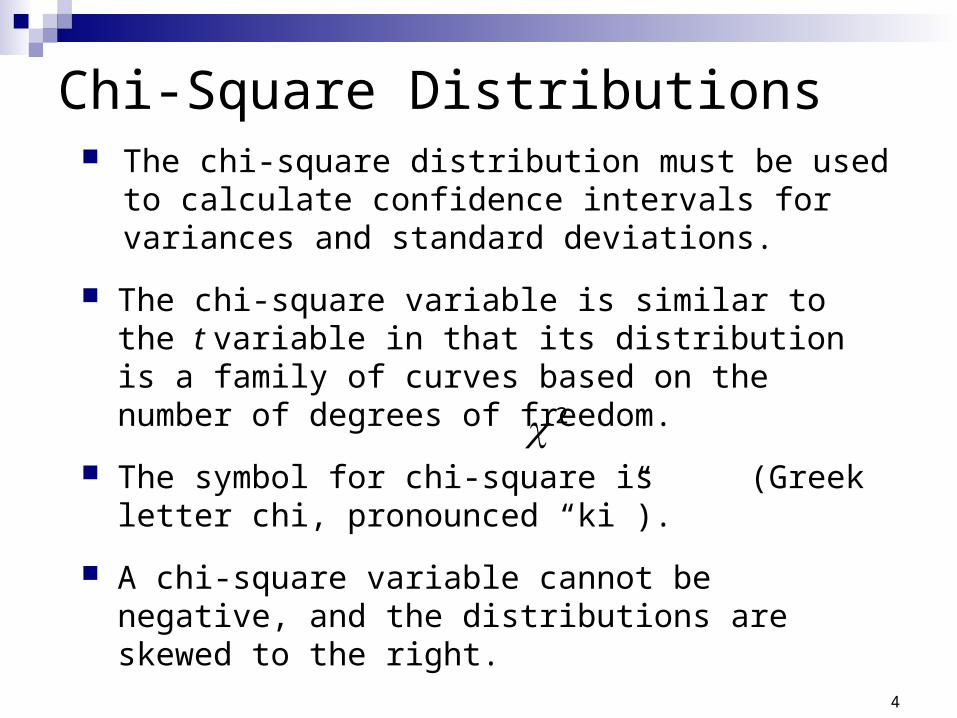
Chi-Square Distributions The chi-square distribution must be used to calculate
confidence intervals for variances and standard deviations.
The chi-square variable is similar to the t variable in that its distribution is a family of curves based on the number of degrees of freedom.
The symbol for chi-square is (Greek letter chi, pronounced “ki”).
A chi-square variable cannot be negative, and the distributions are skewed to the right.
2
4
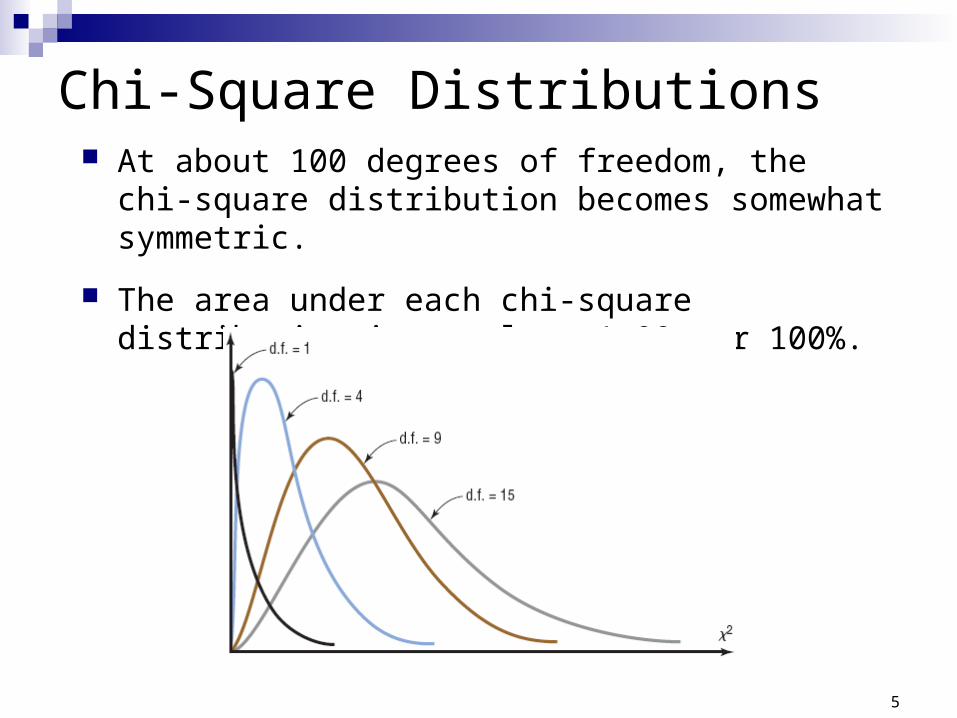
Chi-Square Distributions At about 100 degrees of freedom, the chi-square
distribution becomes somewhat symmetric.
The area under each chi-square distribution is equal to 1.00, or 100%.
5
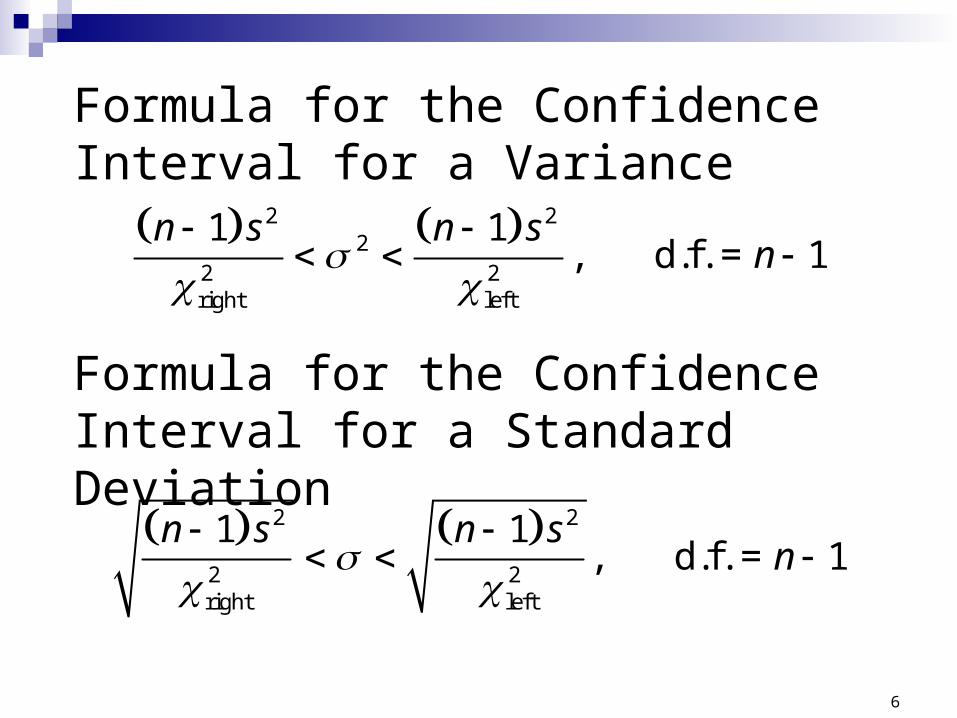
Formula for the Confidence Interval for a Variance
2 22
2 2right left
1 1, d.f. = 1
n s n sn
Formula for the Confidence Interval for a Standard Deviation
2 2
2 2right left
1 1, d.f. = 1
n s n sn
6

Critical Values
There are two critical values for each level of confidence. The value of represents the right-tail critical value and represents the left-tail critical value. The pink page lists critical values of X2 for various degrees of freedom and areas. Each area in the table represents the region under the chi-square curve to the RIGHT of the critical value.
RX
2
LX
2
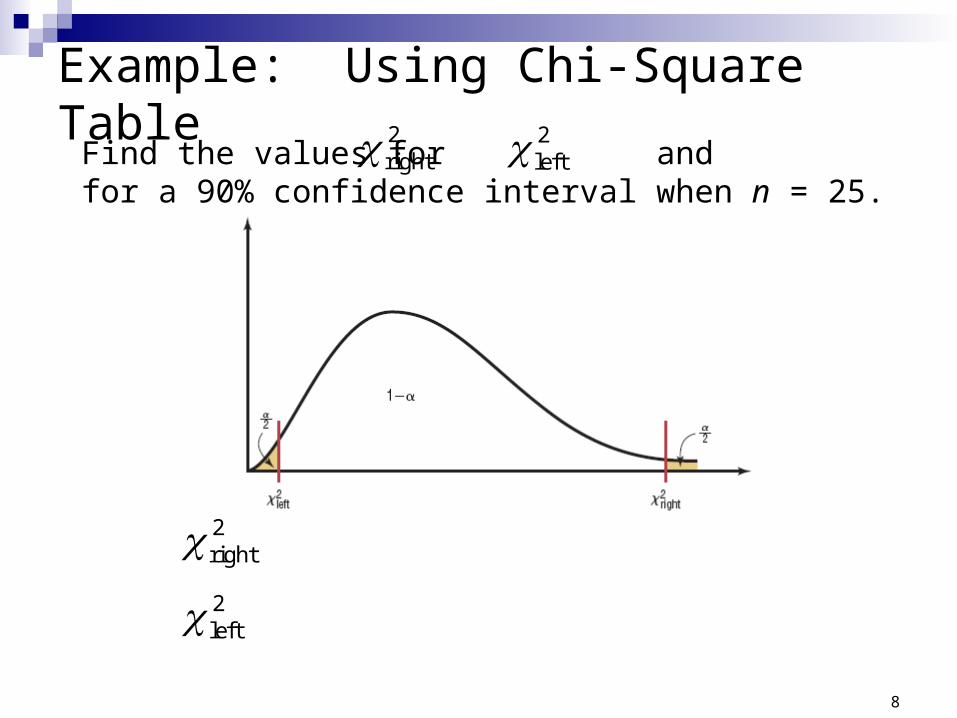
Find the values for and for a 90% confidence interval when n = 25.
Example: Using Chi-Square Table2left2
right
2right2left
8
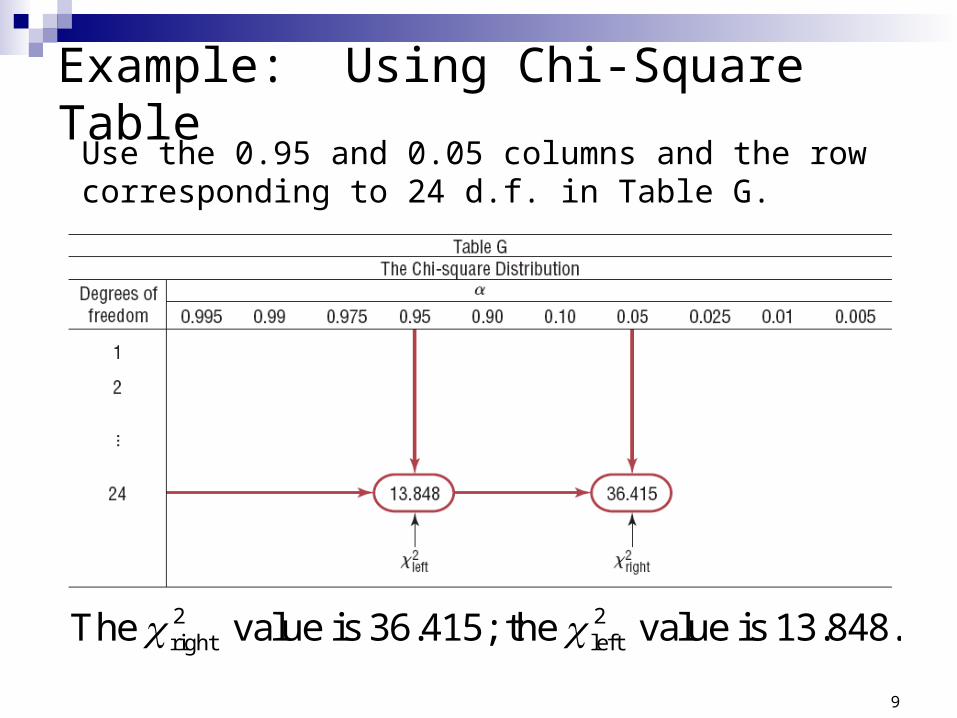
Use the 0.95 and 0.05 columns and the row corresponding to 24 d.f. in Table G.
Example: Using Chi-Square Table
2 2right leftThe value is 36.415; the value is 13.848.
9
Ex. 2: Finding Critical Values for X2
Find the critical values, and ,
for a 95% confidence interval when the
sample size is 20.
RX
2
LX
2

Essential Question
How do we use the chi square distribution to construct a confidence interval for the variance and standard deviation?
11
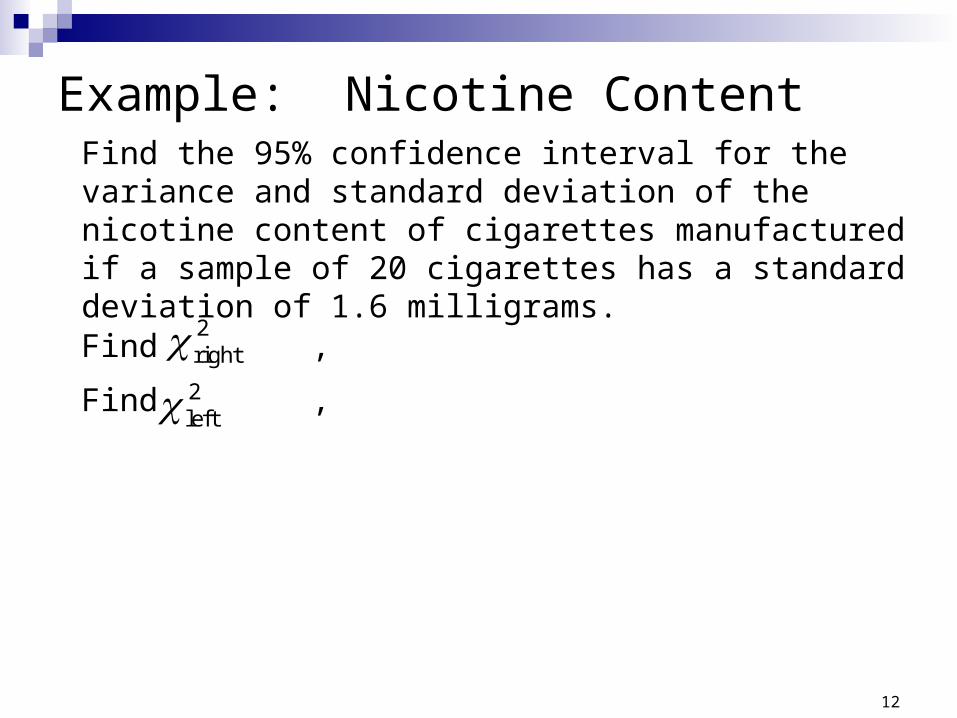
Find the 95% confidence interval for the variance and standard deviation of the nicotine content of cigarettes manufactured if a sample of 20 cigarettes has a standard deviation of 1.6 milligrams.
Example: Nicotine Content
Find ,
Find ,
2right2left
12
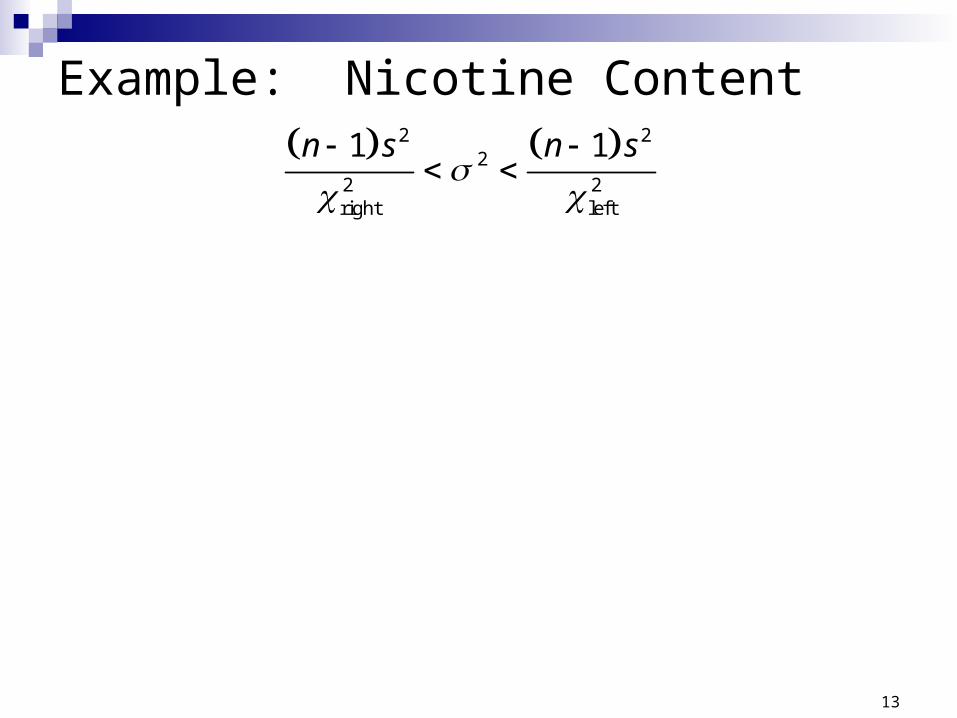
Example: Nicotine Content 2 2
22 2right left
1 1
n s n s
13
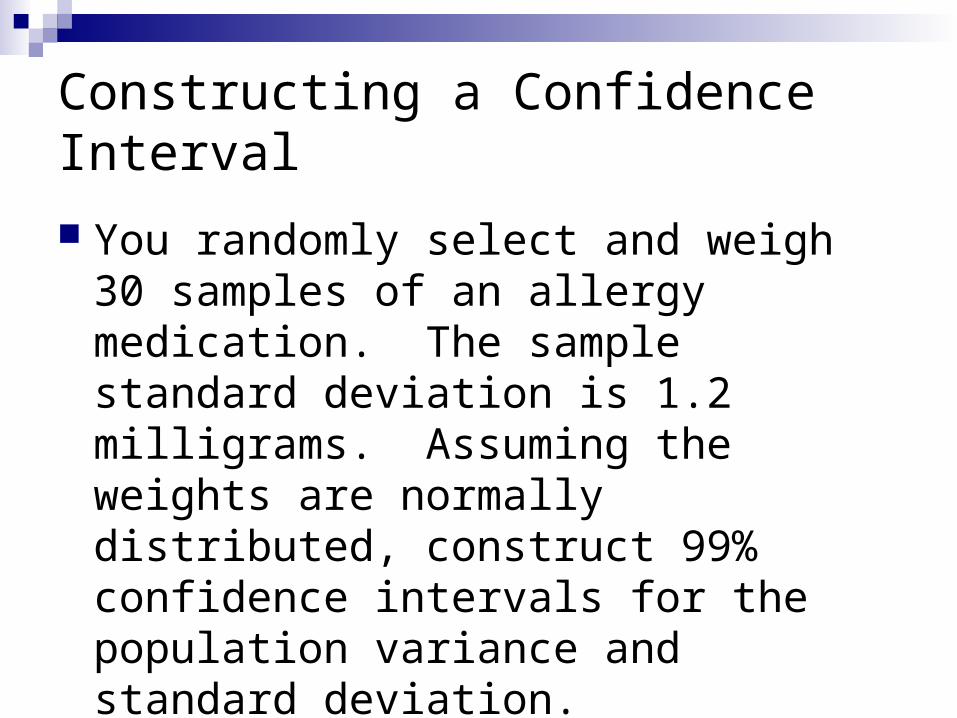
Constructing a Confidence Interval
You randomly select and weigh 30 samples of an allergy medication. The sample standard deviation is 1.2 milligrams. Assuming the weights are normally distributed, construct 99% confidence intervals for the population variance and standard deviation.
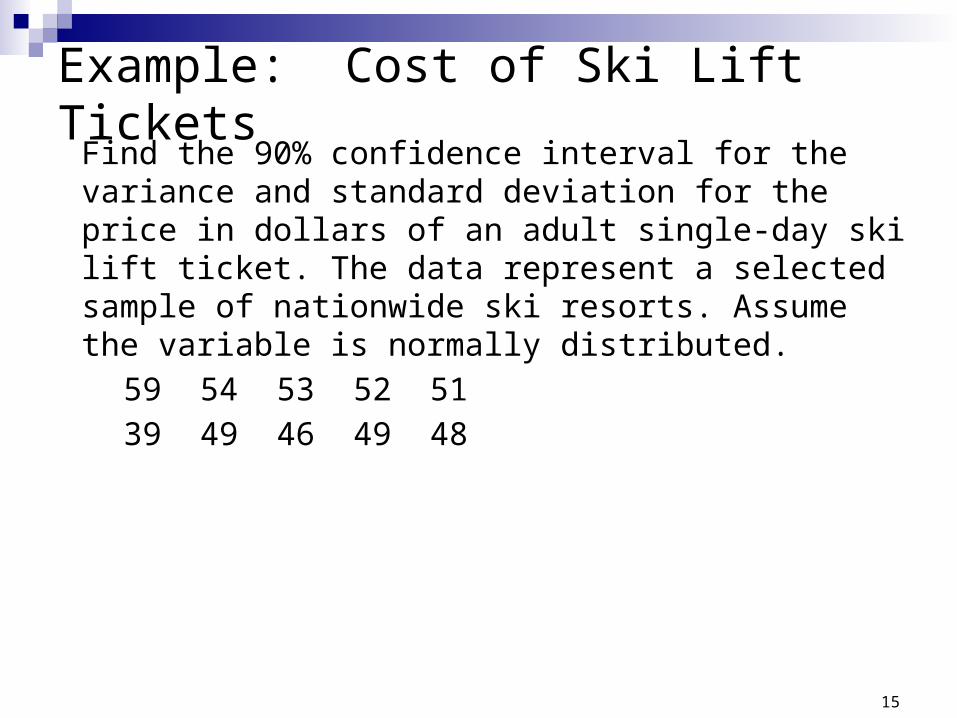
Find the 90% confidence interval for the variance and standard deviation for the price in dollars of an adult single-day ski lift ticket. The data represent a selected sample of nationwide ski resorts. Assume the variable is normally distributed.
59 54 53 52 51
39 49 46 49 48
Example: Cost of Ski Lift Tickets
15
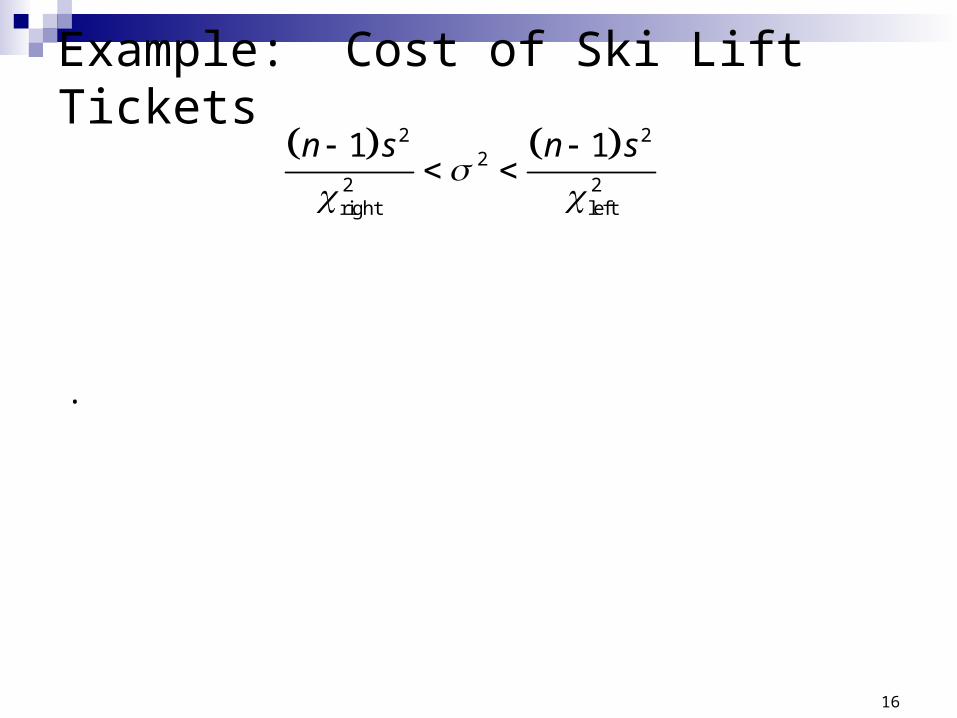
Example: Cost of Ski Lift Tickets 2 2
22 2right left
1 1
n s n s
.
16