Embed Size (px)
Citation preview
74
EUROPEAN ORGANIZATION FOR NUCLEAR RESEARCH
CERN/SI/Int/DL/72-1 10 January 1972
AN INTERACTIVE COMPUTER PROGRAM FOR ON-LINE EXPERIMENTS
The extended PARAM programs
(User 1 s guide)
A. Daneels
GENEVA
1972

1. INTRODUCTION
A series of new PARAM programs has been developed to assist in on
line PSB and PS measurements. These programs are essentially the same as
the ones which were originally developed for the PS and LINAC using the
computer keyboard-typewriter as a means of interaction 1) and later on
were modified for using the CODD display 2). Therefore their structure
will not be repeated.
However, an extended version has now been written so that the man
machine interaction is carried out through the PDS-1 display. At the
same time various facilities have been added for numerical and graphical
display of the measured parameters; and one might just as well say that
PARAM has now been extended to benefit at a maximum from all facilities
provided by the PDS-1 display 3 ,~).
This report describes the man-machine interaction, and the various
facilities provided by PARAM, and should therefore be regarded as a user's
guide.
2. MAN-MACHINE INTERACTION
A PSB and a PS operator may each call up to 14 different PARAM pro-
grams (PARA 1, ... , PARA 14) in their partition (thus PSB~PARAM and
PS-PARAM may work in parallel). The desired PARAM program is called
by pressing the "PARAM" push-button and next the "REQUEST" interrupt
button on the PSB and/or PS Program Request Unit. A message is dis
played asking the operator to specify his "PARAM" number which is any
number ranging from 1 to 14.
As a result a message is displayed on the PSB or PS PDS-1 display
unit, for example:
* PARA 8 * IS THE FOLLOWING STILL OF USE? IF YES, PRESS XMIT-KEY. IF NO WRITE
NEW INSTRUCTIONS OVER THE OLD ONES.
NUMBER OF STAR PARAMETERS:::il'.55 *)
NUMBER OF READING CYCLES=5510
Changes are introduced by typing in all characters from the = sign
on and introducing 0 (zero) for blank characters. Thus if one wants to
*) 5 means blank characters.
- 2 -
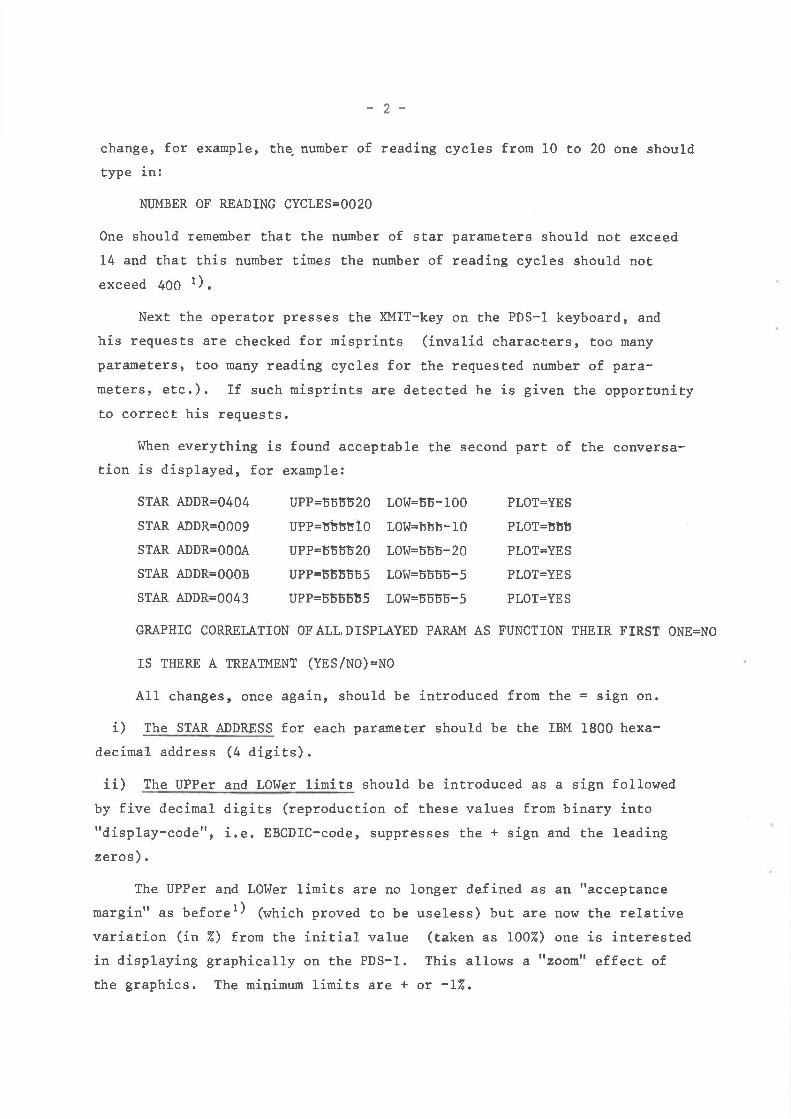
change, for example, th~ number of reading cycles from 10 to 20 one should
type in:
NUMBER OF REAPING CYCLES=0020
One should rememher that the number of star parameters should not exceed
14 and that this number times the number of reading cycles should not
exceed 400 1 ) •
Next the operator presses the XMIT-key on the PDS-1 keyboard, and
his requests are checked for misprints (invalid charac·ters, too many
parameters, too many reading cycles for the requested number of para
meters, etc.). If such misprints are detected he is given the opportunity
to correct his requests.
When everything is found acceptable the second part of the conversa
tion is displayed, for example:
STAR ADDR=0404
STAR ADDR=0009
STAR ADDR=OOOA
STAR ADDR=OOOB
STAR ADDR=0043
UPP=oo5o20 LOW=oo-100
UPP=bbbb10 LOW=bbb-10
UPP=oooo20 LOW=ooo-20
UPP=ooooos LOW=oooo-s
UPP=oooo~5 LOW=oooo-s
PLOT=YES
PLOT=bbb
PLOT=YES
PLOT=YES
PLOT= YES
GRAPHIC CORRELATION OFALL,DISPLAYED PARAM AS FUNCTION THEIR FIRST ONE=NO
IS THERE A TREATMENT (YES/NO)=NO
All changes, once again, should be introduced from the = sign on.
i) The STAR ADDRESS for each parameter should be the IBM 1800 hexa
decimal address (4 digits).
ii) The UPPer and LOWer limits should be introduced as a sign followed
by five decimal digits (reproduction of these values from binary into
"display-code", i.e. EBCDIC-code, suppresses the + sign and the leading
zeros).
The UPPer and LOWer limits are no longer defined as an "acceptance
margin" as before 1) (which proved to be useless) but are now the relative
variation (in %) from the initial value (taken as 100%) one is interested
in displaying graphically on the PDS-1. This allows a "zoom" effect of
the graphics. The minimum limits are + or -1%.
- 3 -
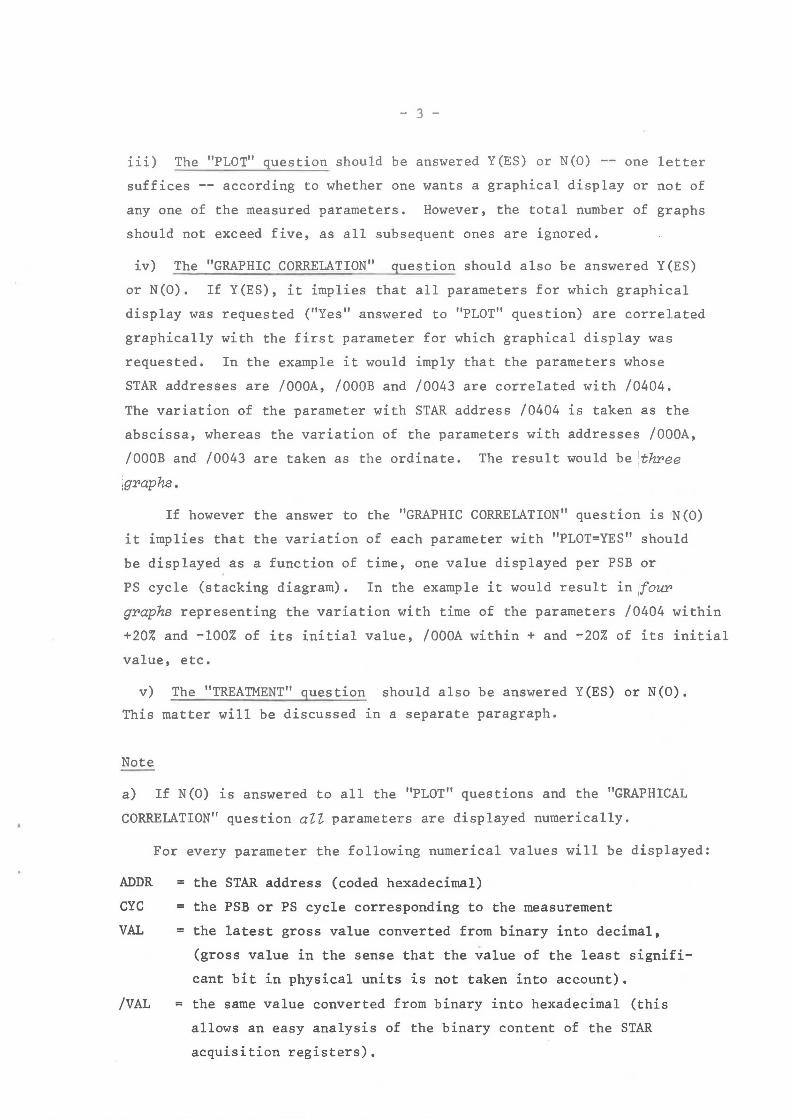
iii) The "PLOT" question should be answered Y(ES) or N(O) -- one letter
suffices -- according to whether one wants a graphical display or not of
any one of the measured parameters. However, the total number of graphs
should not exceed five, as all subsequent ones are ignored.
iv) The "GRAPHIC CORRELATION" question should also be answered Y(ES)
or N(O). If Y(ES), it implies that all parameters for which graphical
display was requested ("Yes" answered to "PLOT" question) are correlated
graphically with the first parameter for which graphical display was
requested. In the example it would imply that the parameters whose
STAR addresses are /OOOA, /OOOB and /0043 are correlated with /0404.
The variation of the parameter with STAR address /0404 is taken as the
abscissa, whereas the variation of the parameters with addresses /OOOA,
/OOOB and /0043 are taken as the ordinate. The result would be 1three I
:graphs.
If however the answer to the "GRAPHIC CORRELATION" question is 'N (O)
it implies that the variation of each parameter with "PLOT=YES" should
be displayed as a function of time, one value displayed per PSB or
PS cycle (stacking diagram). In the example it would result in /four
graphs representing the variation with time of the parameters /0404 within
+20% and -100% of its initial value, /OOOA within + and -20% of its initial
value, etc.
v) The "TREATMENT" question should also be answered Y(ES) or N(O).
This matter will be discussed in a separate paragraph.
Note
a) If N(O) is answered to all the "PLOT" questions and the "GRAPHICAL
CORRELATION" question all parameters are displayed numerically.
ADDR
CYC
VAL
/VAL
For every parameter the following numerical values will be displayed:
= the STAR address (coded hexadecimal)
= the PSB or PS cycle corresponding to the measurement
= the latest gross value converted from binary into decimal,
(gross value in the sense that the value of the least signifi
cant bit in physical units is not taken into account).
= the same value converted from binary into hexadecimal (this
allows an easy analysis of the binary content of the STAR
acquisition registers).
- 4 -
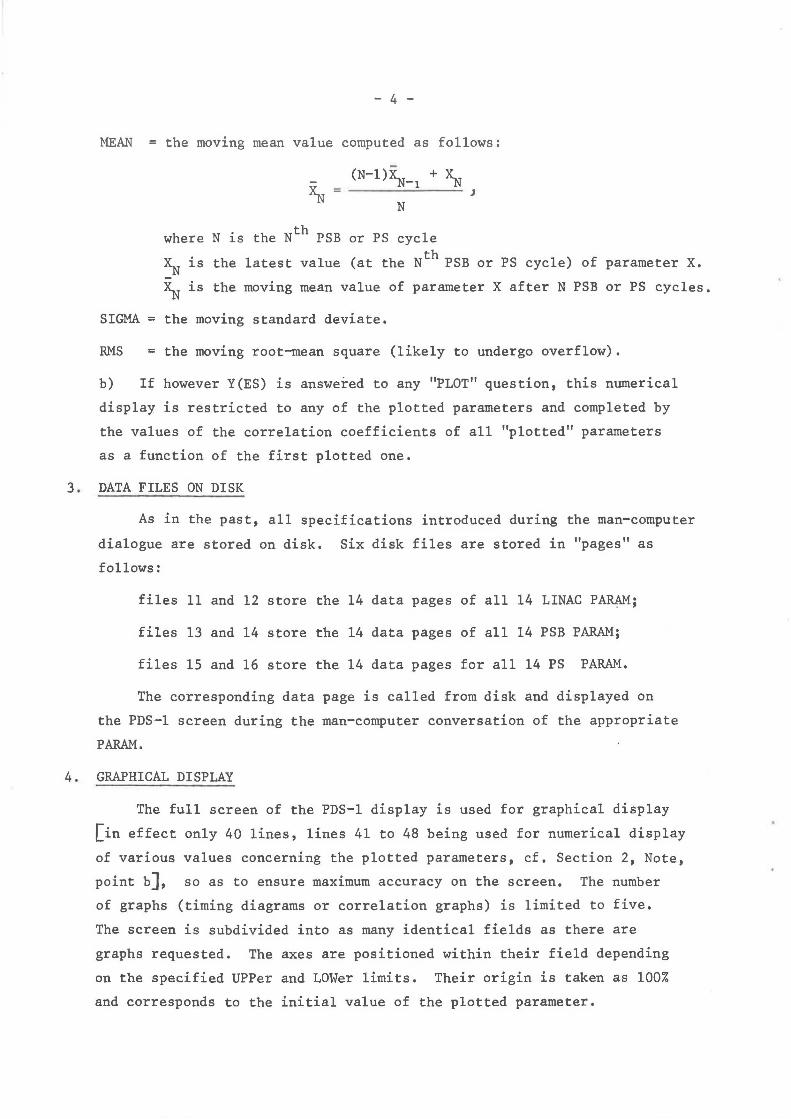
MEAN = the moving mean value computed as follows:
J
where N is the Nth PSB or PS cycle
XN is the latest value (at the Nth PSB or PS cycle) of parameter X. -~ is the moving mean value of parameter X after N PSB or PS cycles.
SIGMA = the moving standard deviate.
RMS =the moving root-mean square (likely to undergo overflow).
b) If however Y(ES) is answered to any "PLOT" question, this numerical
display is restricted to any of the plotted parameters and completed by
the values of the correlation coefficients of all "plotted" parameters
as a function of the first plotted one.
3. DATA FILES ON DISK
As in the past, all specifications introduced during the man-computer
dialogue are stored on disk. Six disk files are stored in "pages" as
follows:
files ll and 12 store the 14 data pages of all 14 LINAC PA~;
files 13 and 14 store the 14 data pages of all 14 PSB PARAM;
files 15 and 16 store the 14 data pages for all 14 PS PARAM.
The corresponding data page is called from disk and displayed on
the PDS-1 screen during the man-computer conversation of the appropriate
PARAM.
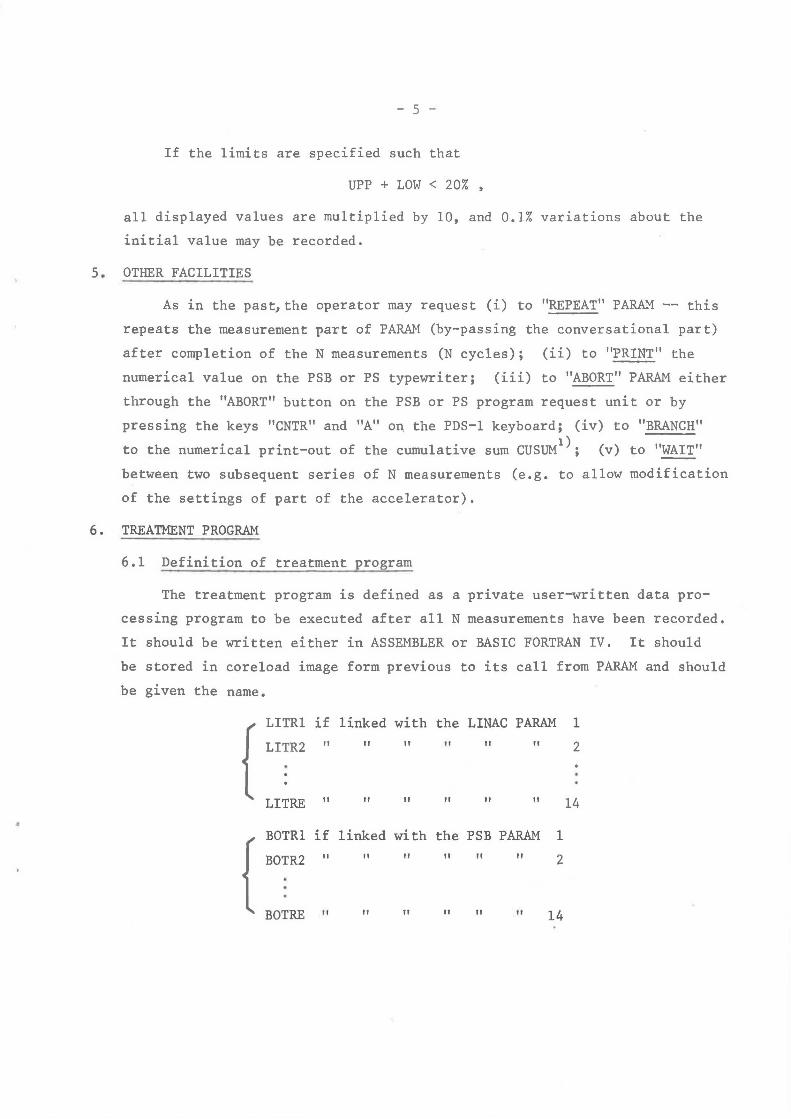
4. GRAPHICAL DISPLAY
The full screen of the PDS-1 display is used for graphical display
[in effect only 40 lines, lines 41 to 48 being used for numerical display
of various values concerning the plotted parameters, cf. Section 2, Note,
point b], so as to ensure maximum accuracy on the screen. The number
of graphs (timing diagrams or correlation graphs) is limited to five.
The screen is subdivided into as many identical fields as there are
graphs requested. The axes are positioned within their field depending
on the specified UPPer and LOWer limits. Their origin is taken as 100%
and corresponds to the initial value of the plotted parameter.
- 5 -
If the limits are specified such that
UPP + LOW < 20% ,
all displayed values are multiplied by 10, and 0.1% variations about the
initial value may be recorded.
S. OTHER FACILITIES
As in the past, the operator may request (i) to "REPEAT" PARAM -- this
repeats the measurement part of PARAM (by-passing the conversational part)
after completion of the N measurements (N cycles); (ii) to "PRINT" the
numerical value on the PSB or PS typewriter; (iii) to "ABORT" PARAM either
through the "ABORT" button on the PSB or PS program request unit or by
pressing the keys "CNTR" and "A" on the PDS-1 keyboard; (iv) to "BRANCH"
to the numerical print-out of the cumulative sum CUSUM 1); (v) to "WAIT"
between two subsequent series of N measurements (e.g. to allow modification
of the settings of part of the accelerator).
6. TREATMENT PROGRAM
6.1 Definition of treatment program
The treatment program is defined as a private user-written data pro
cessing program to be executed after all N measurements have been recorded.
It should be written either in ASSEMBLER or BASIC FORTRAN IV. It should
be stored in coreload image form previous to its call from PARAM and should
be given the name.
{ LITRl if linked with the LINAC PARAM 1
LITR2 " " II II " " 2
LITRE II " II " II " 14
{ BOTRl if linked with the PSB PARAM 1
BOTR2 " " " " " II 2
BOT RE " " " II " " 14
and
- 6 -
PSTR2 II II II II II II
.
.
1
2
{
PSTRl 1f linked with the PS PARAM
PSTRE II II II II II II 14
After completion of this private "TREATMENT" the user may benefit
from the existing editing facilities provided with PARAM by linking his
"LITR-" "BOTR-" a "PSTR-" coreload with the PARAM output coreload
"LUTPT", "UUTPT", "AUTPT".
In this case, the treatment program should be terminated by
in ASM
CALL LINK CALL LINK CALL LINK
CALL LUTPT (if LIN) CALL UUTPT (if PSB) CALL AUTPT (if PS)
or in FORTRAN
CALL LINK(LUTPT) CALL LINK(UUTPT) CALL LINK(AUTPT)
6.2 Data transfer in connnon
All data the user may need in his treatment is stored in a common
area located at the high address end of the partition, i.e.
hexadecimal address
{
/4FFE for LINAC
/ SFFE for PSB
I 6FFE J for PS
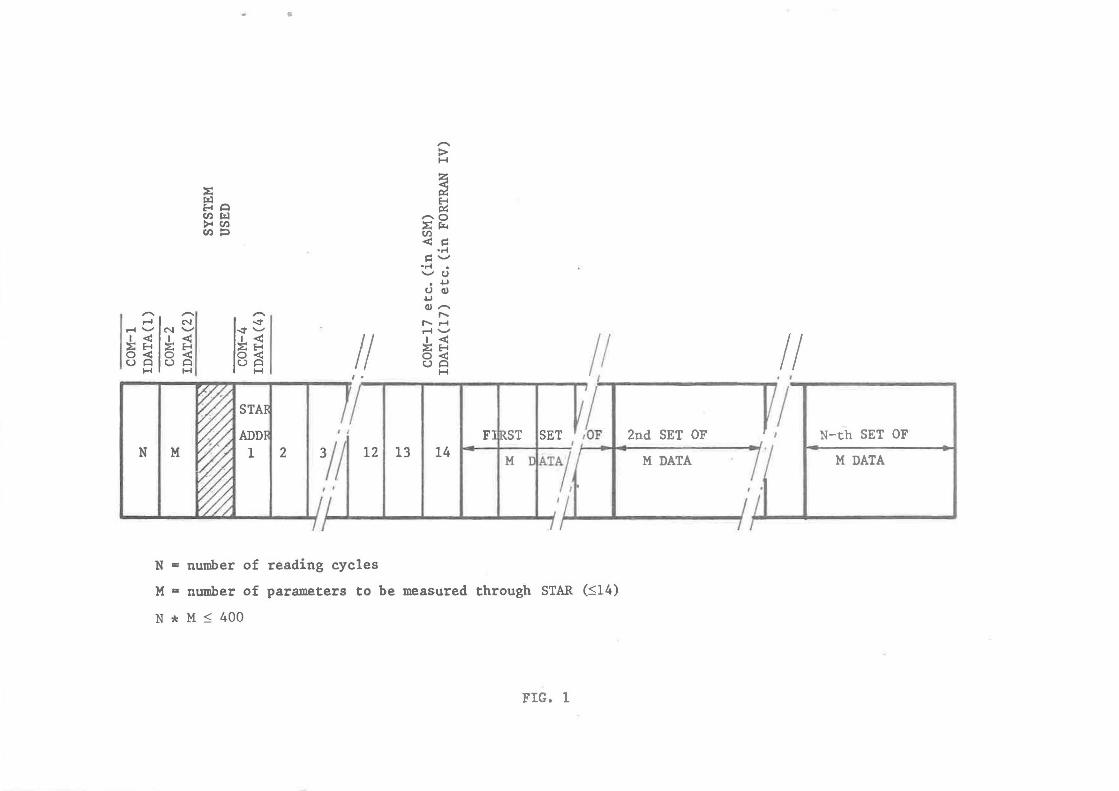
This common area contains in sequence.
a) the total number of readings N,
partition II
II
b) the number M of parameters to measure (M ~ 14),
c) one word "system-used",
d) 14 STAR addresses,
e) 400 data subdivided into N blocks of M data.
This arragement is illustrated in Fig. l; it allows one to write
the treatment program in either ASSEMBLER OR FORTRAN IV.
In ASSEMBLER, for example, one picks up the number of readings N
by loading LD L DATA
DATA EQU COM
I
- 7 -
provided COM has been defined previously as
COM EQU /4FFE (for LINAC PARAM)
or
/SFFE (for PSB " )
or
/6FFE (for PS " )
The equivalent operation in FORTRAN IV is
N = IDATA(l)
provided COMMON IDATA(417) has been declared. Note that all data in
coIIllilon are one word integers.
Note that all data in common are stored as single precision binary
integers (16 bits) and without normalization (i.e. not converted into
physical units taking into account the value of the least significant
bit. Negative data are not converted into the complement of two).
7. CONCLUSION
This program has proved its usefulness in the past three years. It
is expected to provide even more assistance to PSB and PS measurements
because of the various graphical displays and also when ,combined with the
"Shaft angle digitizer" program, allowing simultaneous control of various
elements.
DISTRIBUTION
LIST MPS-SI/l
s. Battisti E. Ratcliff L. Burnod w. Remmer B. Carpenter c. Serre G. Jennings G. Shering c. Poinard Mlle u. Tallgren J.P. Potier A. Van der Schueren
- 8 -
REFERENCES
1) A. Daneels, Towards on-line experimentation of the Proton Synchrotron; a parameter reading and treatment program for the IBM 1800, MPS/CO Computer 68-10, 21 October 1968.
2) A. Daneels, An on-line measurement facility for PS experiments, MPS/CO Note 69-37, 21 July 1969.
3) J,H.B. Madsen, private communication.
4) C. Bovet and A. Daneels, Memorandum SI/DL, 3 November 1971.
..
,..... > H
~ ~ ~A ~ en rz:i -o >< en ~~ en ~ en
< ~ •.-l
~ ......... •.-l ......... CJ
• .µ CJ Cl) .µ Cl)-,..... ,..... ,.....
" ....... N ...;!" " ....... ....... ......... N......, ...;!" ....... ....... .......
// :k E'.S 1< :k E'.S II 1< ~~ ~~ o< o< o< o<
UA UA UA UA H H H H
I
I F SET '10F ,
NIM ADD,
V///I 1 2 13/~ 12 13 14
I'
N = number of reading cycles
M • number of parameters to be measured through STAR (~14)
N * M ~ 400
FIG. 1
II ' I
I 2nd SET OF J I N-th SET OF
M DATA I I I M DATA