Embed Size (px)
Citation preview
1 Deutsche Bank Conference 2009 27th May 2009 Vodafone Italy
Paolo Bertoluzzo Chief Executive Officer
10th Deutsche Bank Conference Milan, 27th May 2009
Vodafone Italy
Deutsche Bank Conference 2009 2 27th May 2009 Vodafone Italy
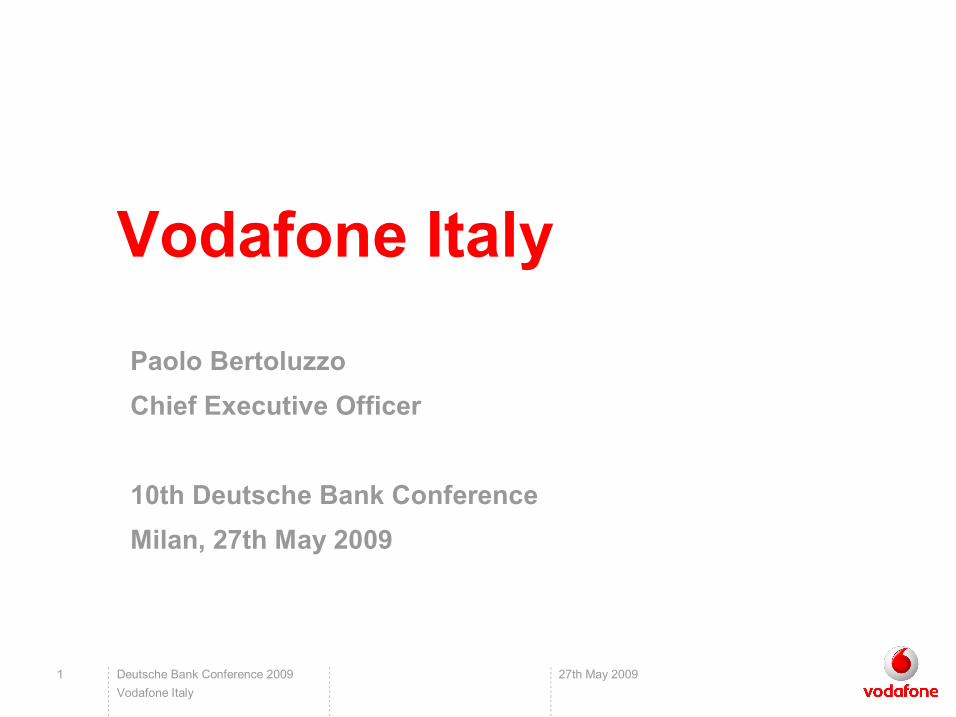
* Source: Deutsche Bank as of Apr ’09; for fixed BB internal analysis based on Analysys Mason and Company Reports
Mobile Mobile
Total Comms Total Comms
Fixed Fixed
o.w. Data:
o.w. BB:
Market Market
1%
2%
1%
Fixed Fixed
Vodafone 8%
7%
73%
8%
1% 3%
34%
16%
9%
41%
57%
11%
13%
6% 6%
6%
Year 2008
8%
6%
73%
8%
2% 3% Other
34%
16%
8%
41%
11%
13%
5% 7%
7%
~21 €bn ~22 €bn Mobile
(excl. Handsets) Mobile
(excl. Handsets) ow BB ow BB
o.w. ~4 €bn o.w.
~4 €bn
Other
<1%
+1.2%
+70%
+1%
+4%
+29%
YoY Growth 2008 YoY Growth
FY 200809
Outperforming the Total Communications market
TIM
WIND
3
Telecom Italia
Telecom Italia
Infostrada Fastweb
Tiscali
Deutsche Bank Conference 2009 3 27th May 2009 Vodafone Italy
12% YoY
+2% YoY
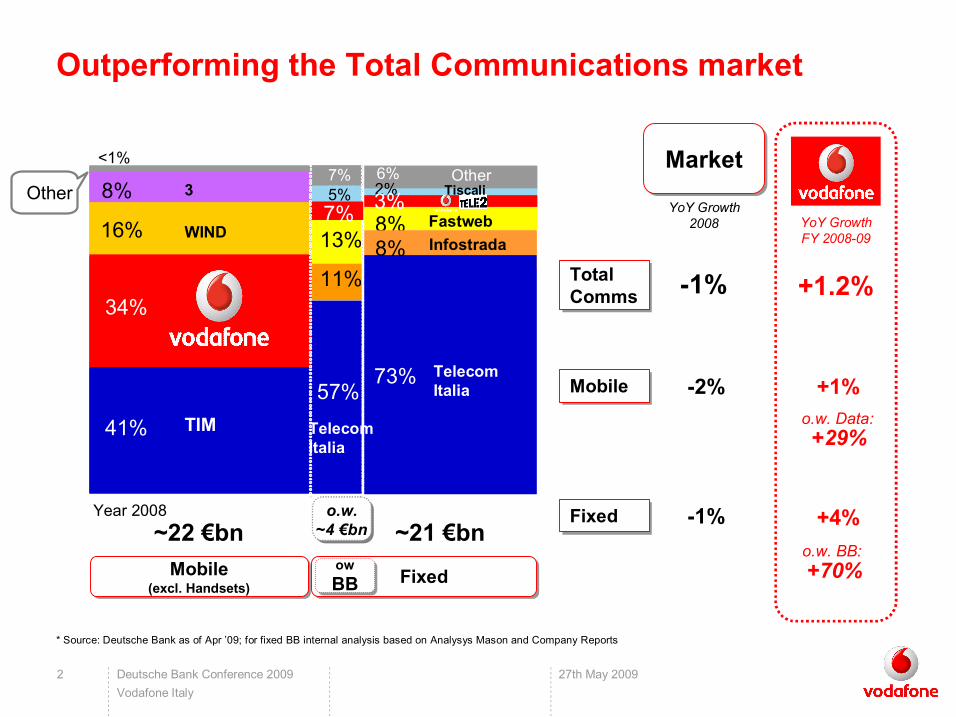
Driving growth in traditional and new business
• ARPU enhancing initiatives on Voice and SMS (eg: You&Me Senza Limiti, Family, Zero Limits)
• Business and Consumer contracts (800K contract net additions)
• PC Connectivity (∼500K new devices)
• Mobile Internet (∼ 1m bundles EOP FY 08/09)
• Fixed services, Vodafone and Tele2 (∼ 360k BB net additions)
Key drivers Vodafone service revenues (1) (€bn)
(1) Organic: including Tele2 full year contribution in FY 07/08 (2) Mobile core including Voice (excl. incoming), Messaging, Visitors on our network and other miscellaneous revenue;
excluding incoming voice
+4% YoY
+1.2% YoY
8.2
8.3
FY 07/08
Mobile core (2)
Incoming voice
Mobile data
Fixed FY 08/09
+29% YoY
Deutsche Bank Conference 2009 4 27th May 2009 Vodafone Italy
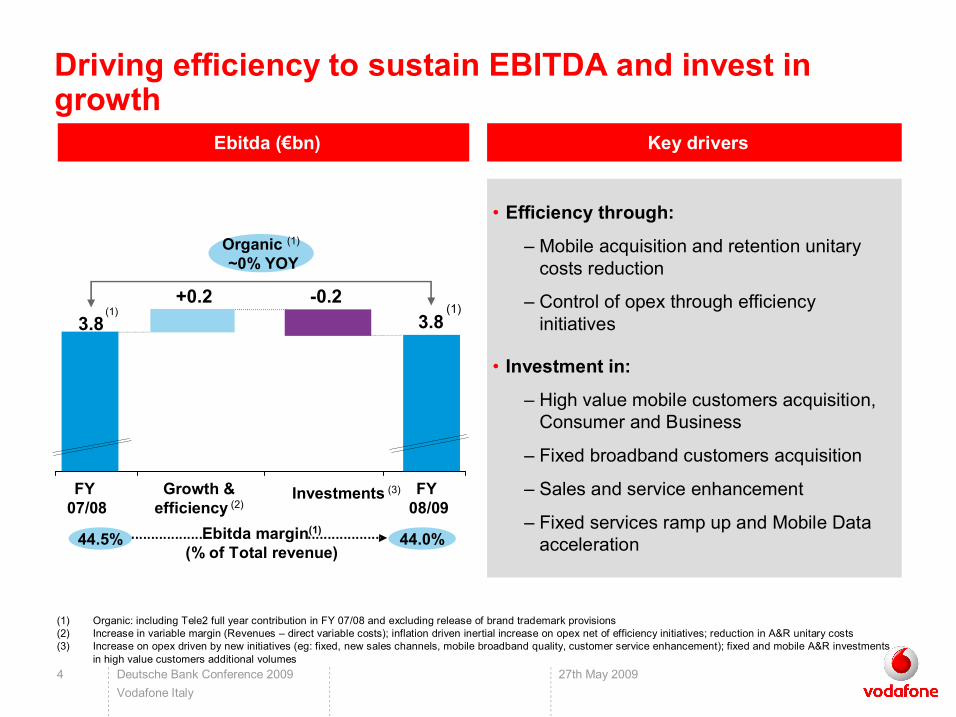
(1) Organic: including Tele2 full year contribution in FY 07/08 and excluding release of brand trademark provisions (2) Increase in variable margin (Revenues – direct variable costs); inflation driven inertial increase on opex net of efficiency initiatives; reduction in A&R unitary costs (3) Increase on opex driven by new initiatives (eg: fixed, new sales channels, mobile broadband quality, customer service enhancement); fixed and mobile A&R investments
in high value customers additional volumes
Ebitda (€bn) Key drivers
• Efficiency through:
– Mobile acquisition and retention unitary costs reduction
– Control of opex through efficiency initiatives
• Investment in:
– High value mobile customers acquisition, Consumer and Business
– Fixed broadband customers acquisition
– Sales and service enhancement
– Fixed services ramp up and Mobile Data acceleration
Driving efficiency to sustain EBITDA and invest in growth
3.8 0.2
3.8 (1)
Organic (1) ~0% YOY
(1)
FY 07/08
Growth & efficiency (2)
Investments (3) FY 08/09
44.5% 44.0% Ebitda margin (1) (% of Total revenue)
+0.2
Deutsche Bank Conference 2009 5 27th May 2009 Vodafone Italy
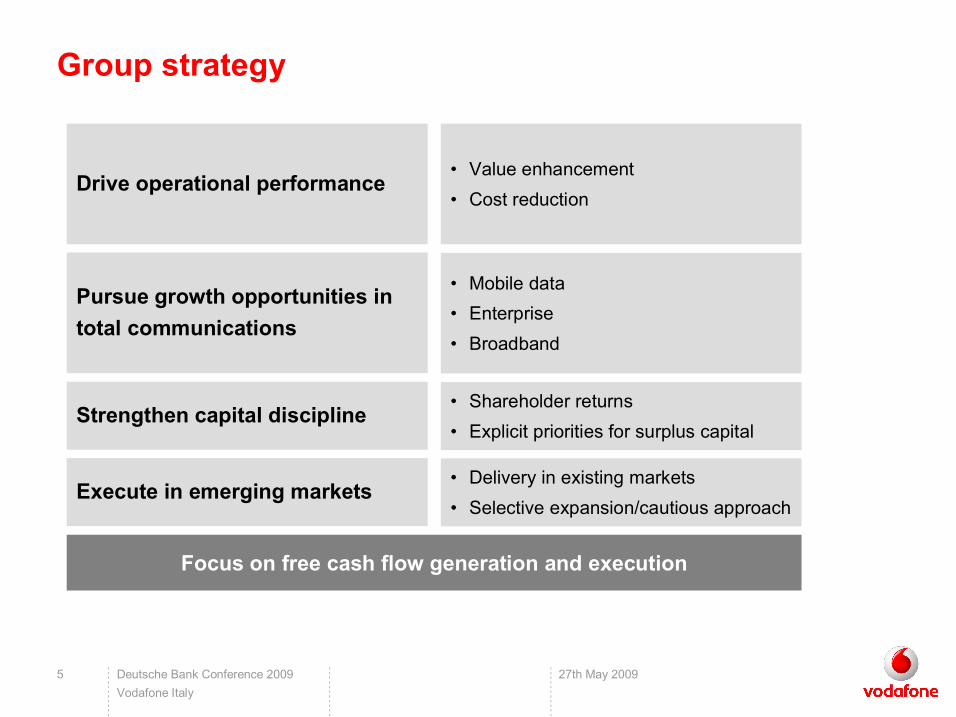
Group strategy
Focus on free cash flow generation and execution
• Value enhancement • Cost reduction
Drive operational performance
• Mobile data • Enterprise • Broadband
Pursue growth opportunities in total communications
• Delivery in existing markets • Selective expansion/cautious approach
Execute in emerging markets
• Shareholder returns • Explicit priorities for surplus capital
Strengthen capital discipline
Deutsche Bank Conference 2009 6 27th May 2009 Vodafone Italy
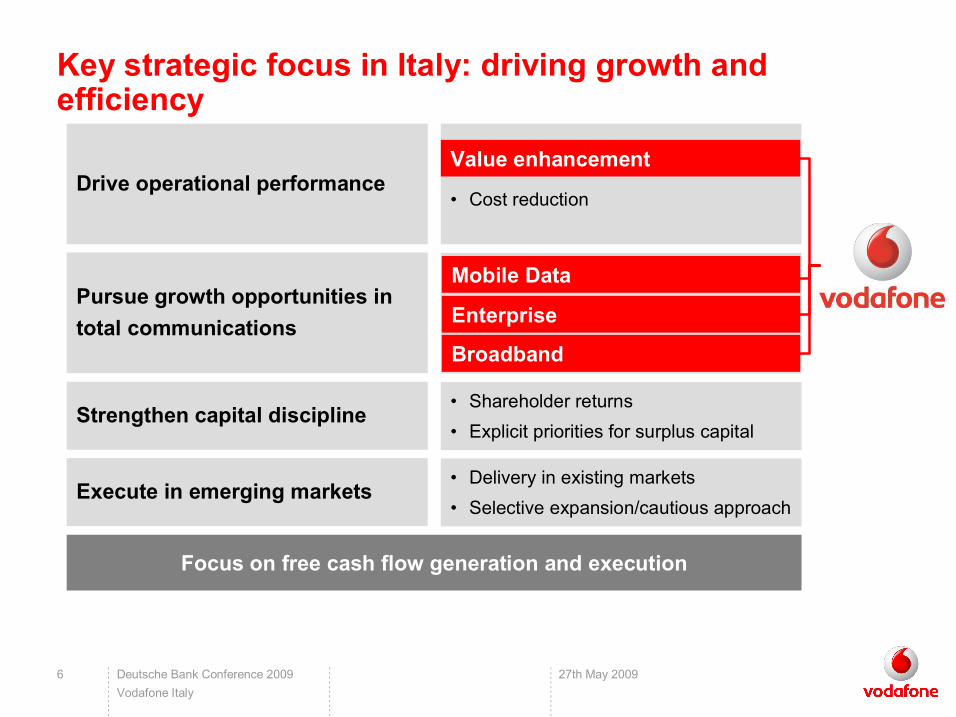
Focus on free cash flow generation and execution
• Value enhancement • Cost reduction
Drive operational performance
• Mobile data • Enterprise • Broadband
Pursue growth opportunities in total communications
• Delivery in existing markets • Selective expansion/cautious approach
Execute in emerging markets
• Shareholder returns • Explicit priorities for surplus capital
Strengthen capital discipline
Key strategic focus in Italy: driving growth and efficiency
Value enhancement
Mobile Data
Enterprise
Broadband
Deutsche Bank Conference 2009 7 27th May 2009 Vodafone Italy
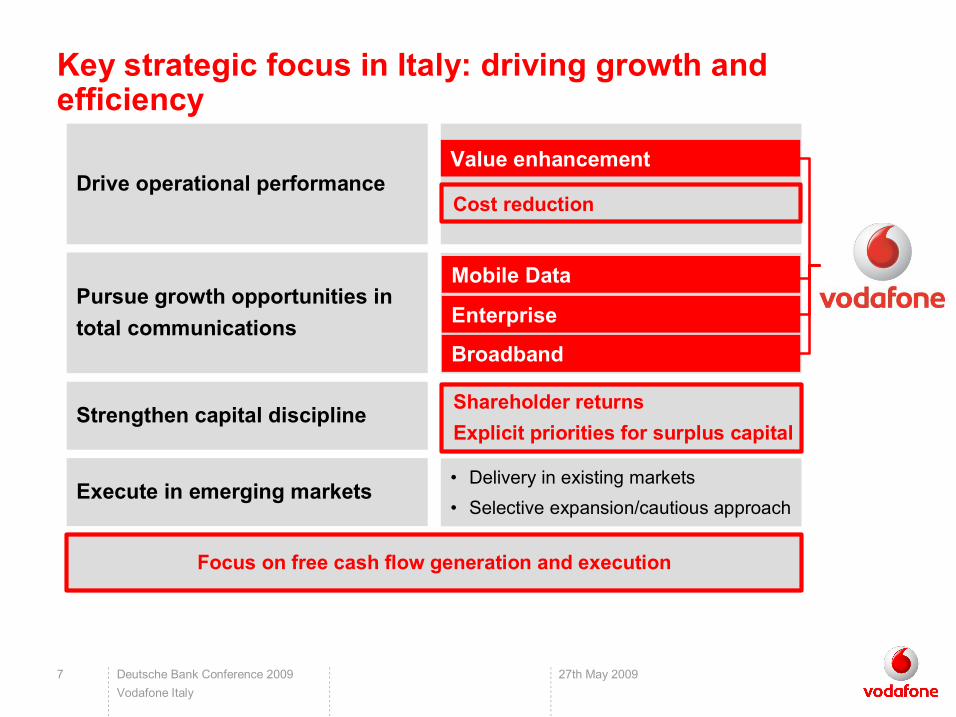
Focus on free cash flow generation and execution
• Value enhancement • Cost reduction
Drive operational performance
• Mobile data • Enterprise • Broadband
Pursue growth opportunities in total communications
• Delivery in existing markets • Selective expansion/cautious approach
Execute in emerging markets
• Shareholder returns • Explicit priorities for surplus capital
Strengthen capital discipline
Value enhancement
Mobile Data
Enterprise
Broadband
Cost reduction
Shareholder returns Explicit priorities for surplus capital
Key strategic focus in Italy: driving growth and efficiency
Deutsche Bank Conference 2009 8 27th May 2009 Vodafone Italy
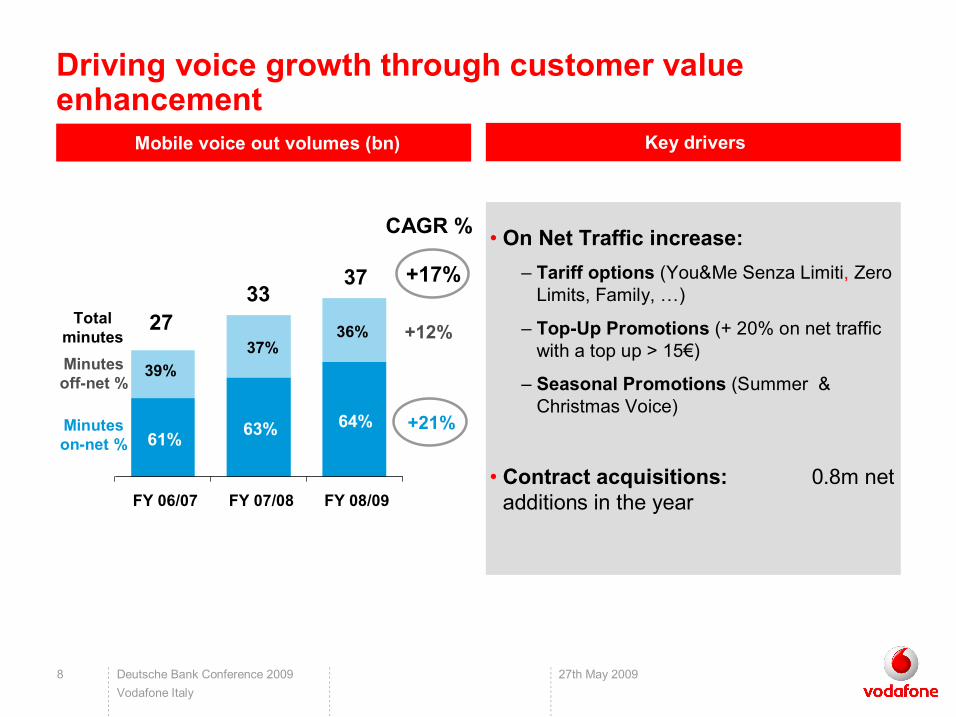
• On Net Traffic increase: – Tariff options (You&Me Senza Limiti, Zero Limits, Family, …)
– TopUp Promotions (+ 20% on net traffic with a top up > 15€)
– Seasonal Promotions (Summer & Christmas Voice)
• Contract acquisitions: 0.8m net additions in the year
Mobile voice out volumes (bn)
Driving voice growth through customer value enhancement
Total minutes
Key drivers
CAGR %
+17%
+21%
+12%
Minutes onnet %
Minutes offnet %
39% 37%
36% 27 33
37
64% 63% 61%
FY 06/07 FY 07/08 FY 08/09
Deutsche Bank Conference 2009 9 27th May 2009 Vodafone Italy
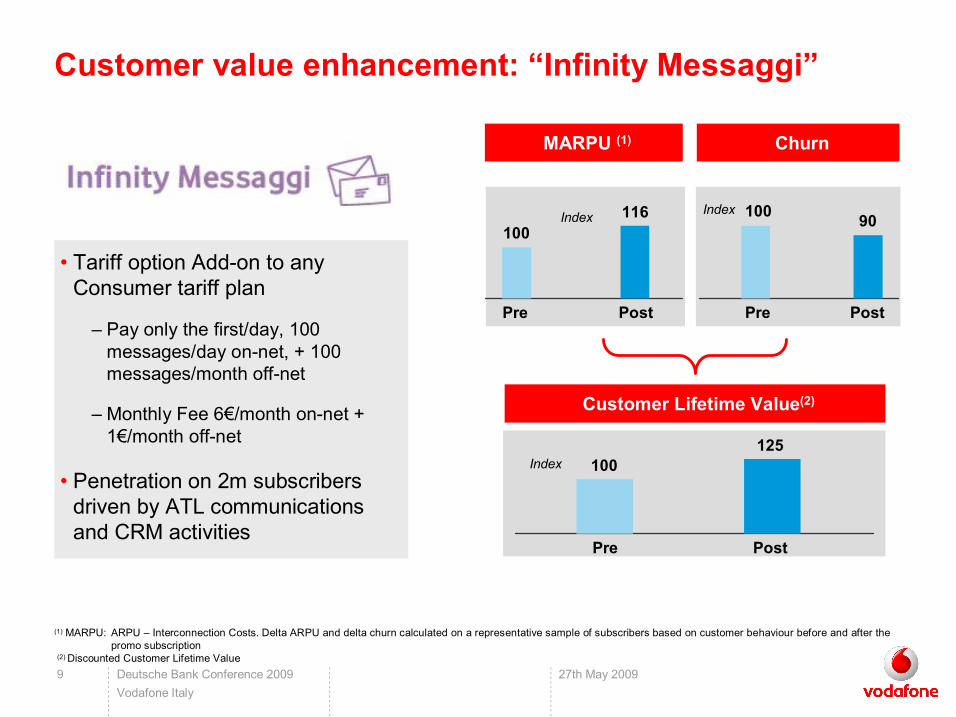
• Tariff option Addon to any Consumer tariff plan
– Pay only the first/day, 100 messages/day onnet, + 100 messages/month offnet
– Monthly Fee 6€/month onnet + 1€/month offnet
• Penetration on 2m subscribers driven by ATL communications and CRM activities
MARPU (1)
Pre Post
100 116
Pre Post
100 90
Pre
100 125
Post
(1) MARPU: ARPU – Interconnection Costs. Delta ARPU and delta churn calculated on a representative sample of subscribers based on customer behaviour before and after the promo subscription
(2) Discounted Customer Lifetime Value
Customer value enhancement: “Infinity Messaggi”
Churn
Customer Lifetime Value (2)
Index Index
Index
Deutsche Bank Conference 2009 10 27th May 2009 Vodafone Italy
Q2
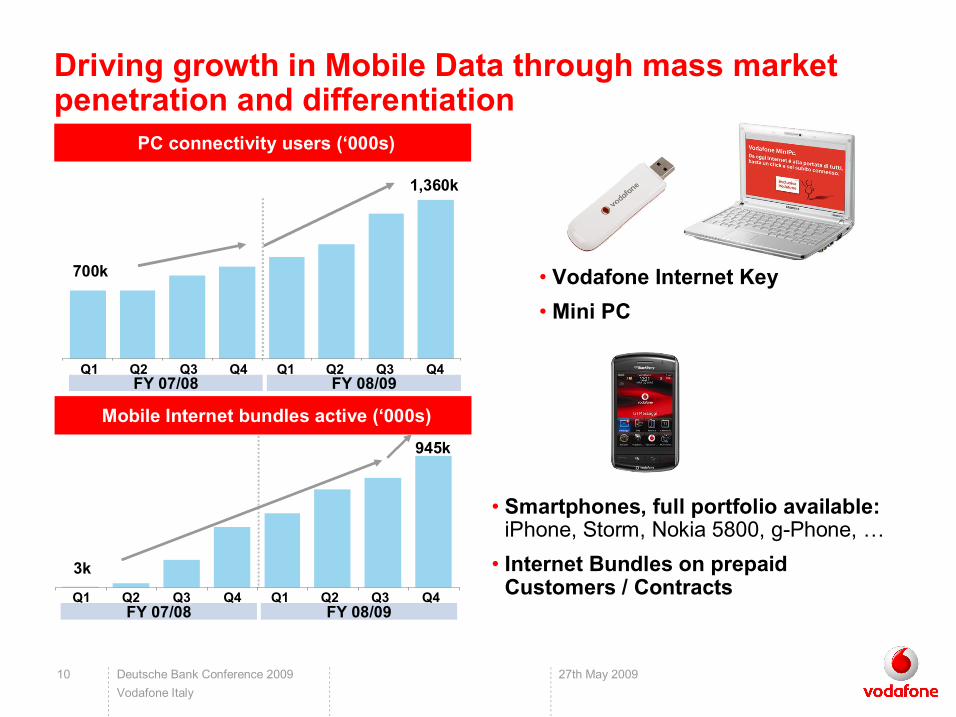
• Vodafone Internet Key • Mini PC
0.9M
PC connectivity users (‘000s)
• Smartphones, full portfolio available: iPhone, Storm, Nokia 5800, gPhone, …
• Internet Bundles on prepaid Customers / Contracts
Mobile Internet bundles active (‘000s)945k
Driving growth in Mobile Data through mass market penetration and differentiation
1,360k
700k
Q1 Q2 Q3 Q4 Q1 Q2 Q3 Q4 FY 07/08 FY 08/09
3k
Q1 Q3 Q4 Q1 Q2 Q3 Q4 FY 07/08 FY 08/09
Deutsche Bank Conference 2009 11 27th May 2009 Vodafone Italy
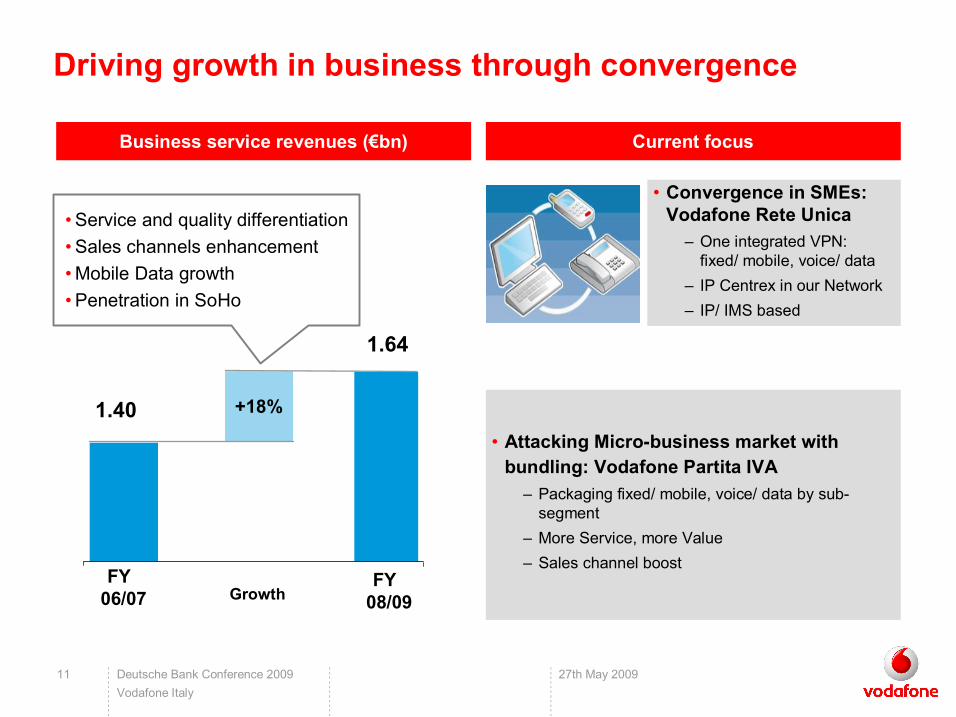
+18% 1.40
FY 06/07
FY 08/09
Driving growth in business through convergence
• Convergence in SMEs: Vodafone Rete Unica – One integrated VPN: fixed/ mobile, voice/ data
– IP Centrex in our Network – IP/ IMS based
• Service and quality differentiation • Sales channels enhancement • Mobile Data growth • Penetration in SoHo
1.64
Business service revenues (€bn)
• Attacking Microbusiness market with bundling: Vodafone Partita IVA – Packaging fixed/ mobile, voice/ data by sub segment
– More Service, more Value – Sales channel boost
Growth
Current focus
Deutsche Bank Conference 2009 12 27th May 2009 Vodafone Italy
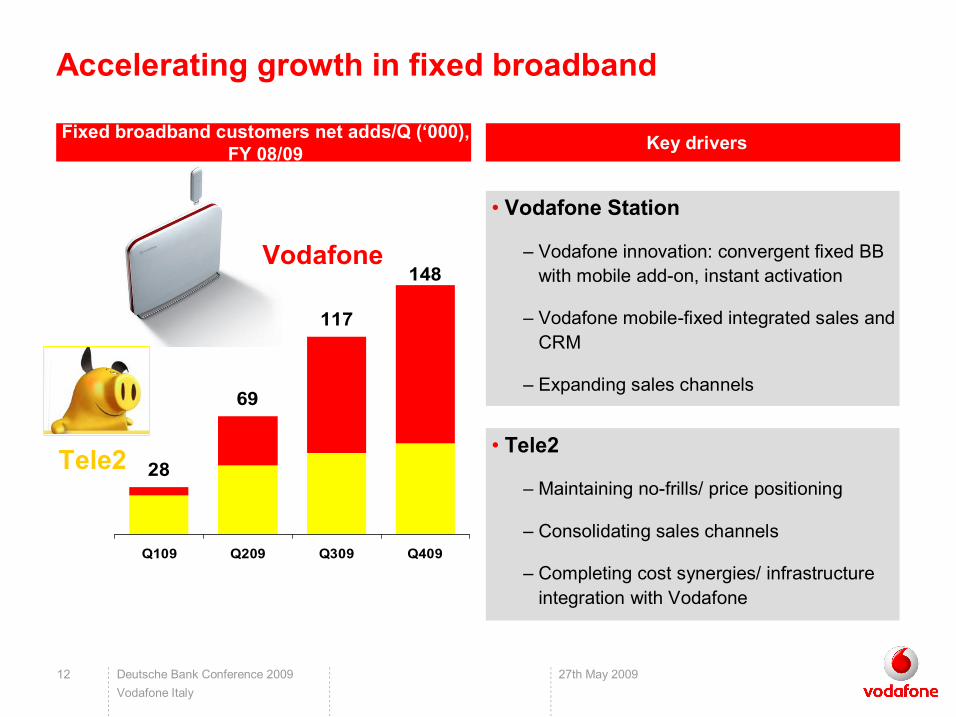
28
69
117
148
Q109 Q209 Q309 Q409
Vodafone
Tele2
• Vodafone Station
– Vodafone innovation: convergent fixed BB with mobile addon, instant activation
– Vodafone mobilefixed integrated sales and CRM
– Expanding sales channels
• Tele2
– Maintaining nofrills/ price positioning
– Consolidating sales channels
– Completing cost synergies/ infrastructure integration with Vodafone
Fixed broadband customers net adds/Q (‘000), FY 08/09 Key drivers
Accelerating growth in fixed broadband
Deutsche Bank Conference 2009 13 27th May 2009 Vodafone Italy
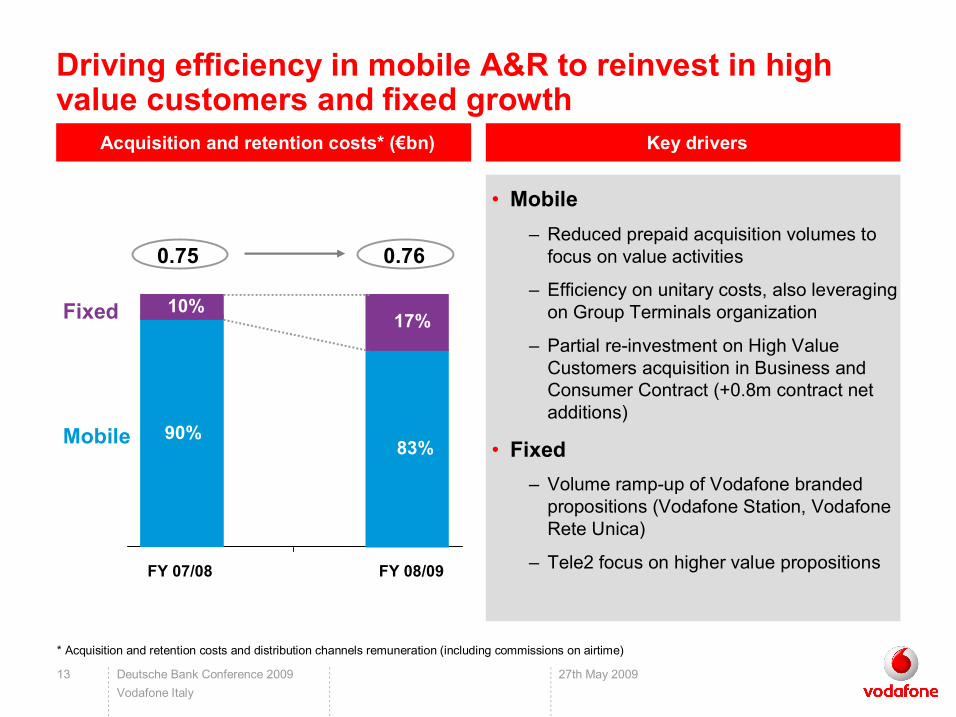
* Acquisition and retention costs and distribution channels remuneration (including commissions on airtime)
Acquisition and retention costs* (€bn)
• Mobile – Reduced prepaid acquisition volumes to focus on value activities
– Efficiency on unitary costs, also leveraging on Group Terminals organization
– Partial reinvestment on High Value Customers acquisition in Business and Consumer Contract (+0.8m contract net additions)
• Fixed – Volume rampup of Vodafone branded propositions (Vodafone Station, Vodafone Rete Unica)
– Tele2 focus on higher value propositions
Key drivers
Driving efficiency in mobile A&R to reinvest in high value customers and fixed growth
Fixed
Mobile
0.75 0.76
10%
FY 07/08 FY 08/09
17%
90% 83%
Deutsche Bank Conference 2009 14 27th May 2009 Vodafone Italy
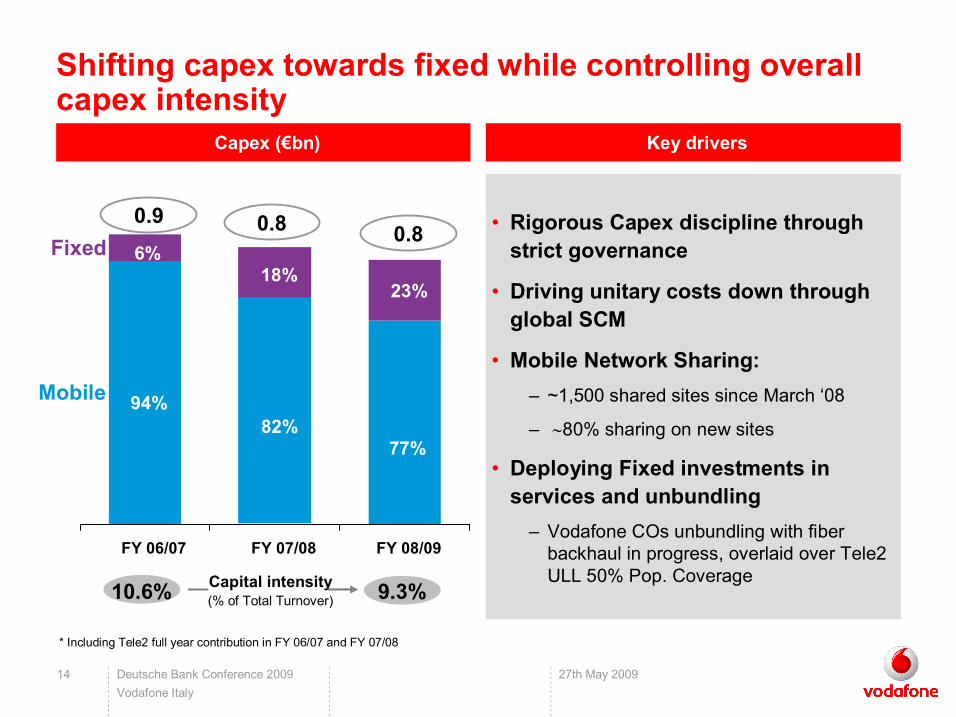
* Including Tele2 full year contribution in FY 06/07 and FY 07/08
Capex (€bn) Key drivers
• Rigorous Capex discipline through strict governance
• Driving unitary costs down through global SCM
• Mobile Network Sharing: – ~1,500 shared sites since March ‘08
– ∼80% sharing on new sites
• Deploying Fixed investments in services and unbundling – Vodafone COs unbundling with fiber backhaul in progress, overlaid over Tele2 ULL 50% Pop. Coverage
0.8
Mobile
Fixed
FY 06/07 FY 07/08 FY 08/09
18% 23%
6%
Capital intensity (% of Total Turnover)
0.9 0.8
9.3% 10.6%
6% 18%
23%
77% 82%
94%
Shifting capex towards fixed while controlling overall capex intensity
Deutsche Bank Conference 2009 15 27th May 2009 Vodafone Italy
Key messages
Outperforming the Total Communications market
Sustaining profitability through efficiency; investing in growth
Driving strategy execution deeper, to capture all growth opportunities in Total Communications
Jump start in fixed; expanding into a new market
Deutsche Bank Conference 2009 16 27th May 2009 Vodafone Italy
Disclaimer
The presentation contains certain nonGAAP financial information. The Group’s management believes these measures provide valuable additional information in understanding the performance of the Group or the Group’s businesses because they provide measures used by the Group to assess performance. Although these measures are important in the management of the business, they should not be viewed as replacements for, but rather as complementary to, the comparable GAAP measures.