Embed Size (px)
Citation preview

3,350+OPEN ACCESS BOOKS
108,000+INTERNATIONAL
AUTHORS AND EDITORS115+ MILLION
DOWNLOADS
BOOKSDELIVERED TO
151 COUNTRIES
AUTHORS AMONG
TOP 1%MOST CITED SCIENTIST
12.2%AUTHORS AND EDITORS
FROM TOP 500 UNIVERSITIES
Selection of our books indexed in theBook Citation Index in Web of Science™
Core Collection (BKCI)
Chapter from the book Chronic Kidney DiseaseDownloaded from: http://www.intechopen.com/books/chronic-kidney-disease
PUBLISHED BY
World's largest Science,Technology & Medicine
Open Access book publisher
Interested in publishing with IntechOpen?Contact us at [email protected]

14
Assessing Iron Status in CKD Patients: New Laboratory Parameters
Eloísa Urrechaga1, Luís Borque2 and Jesús F. Escanero2 1Laboratory, Hospital Galdakao, Usansolo Galdakao, Vizcaya
2Department of Pharmacology and Physiology, Faculty of Medicine University of Zaragoza, Zaragoza
Spain
1. Introduction
Chronic kidney disease (CKD) affects millions of people worldwide, with high incidence
and prevalence and increasing costs. Anemia, a common observation in CKD, can develop
in the early phases of the disease and contributes to a poor quality of life (Eknoyan et al.,
2004).
Anemia in patients with CKD is due to many factors. Erythropoiesis and iron homeostasis
are impaired as a result of a complex chain of events, including the relative deficiency of
erythropoietin, chronic inflammation, blood loss, decreased iron absorption and utilization,
exogenous iron and erythropoietin acquisition via biologically unregulated mechanisms
(blood transfusions and medicinal erythropoietin and iron administration) (Weiss, 2009;
Guidi & Santonastaso, 2010; Lankhorst & Wish, 2010).
The advent of erythropoiesis stimulating agents (ESA) and various intravenous iron
preparations has resulted in a much more effective management of anemia of CKD,
allowing us to maintain hemoglobin levels in certain desired ranges and to effectively treat
iron deficiency. Among the emerging challenges are the risks associated with administering
high ESA and iron doses, leading to elevated hemoglobin levels and iron overload (Zager et
al., 2002).
Recombinant human erythropoietin (rHuEpo) has been available for treatment of renal
disease anemia since 1989. However, rHuEpo therapy results in iron deficiency due to
insufficient iron stores for the accelerated erythropoiesis. Iron deficiency is the main cause of
suboptimal response to erythropoietin in dialysis patients (Cavill & Macdougall, 1993).
Maintenance iron supplementation is required to successfully treat anemia; intravenous iron
compounds are used to treat dialysis patients who become iron deficient.
Monitoring erythropoietin treated patients’ iron status is important to detect iron deficiency
and avoid the adverse effects of iron medication. The assessment of iron requirements and
monitoring of therapy require accurate markers. New alternative markers for iron status
that may be useful when serum ferritin and transferrin saturation are insufficient. These
newer tests include reticulocyte hemoglobin content, percentage of hypochromic red cells
www.intechopen.com

Chronic Kidney Disease
226
and soluble transferrin receptor, all of which have shown some promise in recent studies
(Goodnough et al., 2010).
The percentages of hypochromic red cells (%Hypo) and reticulocyte hemoglobin content (CHr) are reported by the Siemens analyzers (Siemens Medical Solutions Diagnostics, Tarrytown NY, USA).
Two other parameters correlate to %Hypo and CHr, erythrocyte hemoglobin equivalent (RBC-He) and reticulocyte hemoglobin equivalent (Ret-He), reported by the Sysmex XE-2100 analyzer (Sysmex Corporation, Kobe, Japan); percentages of hypochromic red cells (% Hypo He) are now available on the Sysmex analyzer XE 5000 (Sysmex Corporation, Kobe, Japan.
Beckman Coulter (Beckman Coulter Inc., Miami, Fl, USA) has introduced on the LH series analysers a new parameter, low hemoglobin density (LHD%), related to the iron availability for erythropoiesis in the previous weeks; derived from mean cell hemoglobin concentration (MCHC). In this chapter the potential clinical utility of this parameter in the assessment of iron status in CKD patients is discussed.
1.1 Iron homeostasis
The normal Western diet contains 15–20 mg iron in Hem (10%) and non-Hem (ionic, 90%) forms. Only 1–2 mg of iron is absorbed and lost every day. Importantly, the total amount of iron in the body can be regulated only by absorption, whereas iron loss occurs only passively from sloughing of skin and mucosal cells as well as from blood loss. Iron absorption is balanced against iron loss so daily iron absorption may increase in response to increased iron demand (eg, growth, pregnancy or blood loss) (Conrad et al., 2002; (Miret et al., 2003).
Nearly all absorption of dietary iron occurs in the duodenum. Several steps are involved, including the reduction of iron to a ferrous state, apical uptake, intracellular storage or
transcellular trafficking, and basolateral release. Molecular participants in each of these processes have been identified.
The non-Hem iron mainly exists in the Fe3+ state. The ferric iron is reduced to ferrous iron before it is transported across the intestinal epithelium. The reduction of iron from the ferric to the ferrous state occurs at the enterocyte brush border by means of a duodenal ferric reductase (Dcytb). Once the insoluble Fe3+ is converted to Fe2+. Ferrous iron is then
transported across the apical plasma membrane of the enterocyte by divalent metal transporter 1 (DMT1) DMT1 is expressed at the duodenal brush border where it controls uptake of dietary iron, and also traffics other metal ions such as zinc, copper and cobalt by a proton-coupled mechanism (Conrad et al., 2002).
Iron taken up by the enterocyte may be stored intracellularly as ferritin (and excreted in the feces when the senescent enterocyte is sloughed) or transferred across the basolateral membrane to the plasma. This iron is transferred out of the enterocyte by the basolateral transporter ferroportin; this process is facilitated by the ferroxidase activity of the ceruloplasmin homologue hephaestin (Fleming et al., 2005).
There are no substantial physiologic mechanisms that regulate iron loss. Accordingly, iron homeostasis is dependent on regulatory feedback between body iron needs and intestinal iron absorption.
www.intechopen.com

Assessing Iron Status in CKD Patients: New Laboratory Parameters
227
Iron stores, erythropoietic activity, hemoglobin, oxygen content, and inflammation modulates the dietary iron absorption (Nemeth et al., 2004).
Essentially all circulating plasma iron normally is bound to transferrin. The liver synthesizes transferrin and secretes it into the plasma. The chelation of ferric iron serves three purposes: it renders iron soluble under physiologic conditions, it prevents iron-mediated free radical toxicity, and it facilitates transport into cells. Transferrin is the most important physiological source of iron for red cells (Ponka, 1998).
Although transferrin was characterized fifty years ago, its receptor eluded investigators until the early 1980s.
The molecule is a transmembrane homodimer linked by disulfide bonds. This disulfide-linked homodimer has subunits containing 760 amino acids each. Oligosaccharides account for about 5% of the 90 kDa subunit molecular mass. A broad body of literature now supports the concept that the iron-transferrin complex is internalized by receptor-mediated endocytosis. (Beaumont et al., 2009).
Most of the body iron is associated to hemoglobin in circulating erythrocytes. Erythropoiesis is a very active process that takes place in the bone marrow and leads to the daily production of 200 billion new erythrocytes to compensate for the destruction of senescent red cells by tissue macrophages. The control of erythropoiesis depends mostly on erythropoietin production by the kidney and on the availability of iron.
Macrophages play a central role in the organism as they recycle iron after phagocytosis of senescent erythrocytes. This mechanism mainly occurs in the spleen and bone marrow and to a lesser extent in the Küpffer cells of the liver.
During aging, erythrocytes accumulate multiple modifications (cell shrinkage, externalization of phosphatidyl-serine, peroxydation of the membrane). The fixation and ingestion of red cells by macrophages are triggered by cellular receptor-mediated phagocytosis (through recognition of externalized phosphatidyl-serine or neoantigens of senescence) (Lang et al., 2005).
Iron can be stored in the macrophages associated to ferritin or hemosiderin or exported to the plasma. Iron export from macrophages to transferrin is accomplished by ferroportin, the same iron-export protein as expressed in the duodenal enterocyte, and reoxydized by ceruloplasmin (Knutson et al., 2005).
Metabolically inactive iron, is stored in ferritin and hemosiderin. Normally, 95% of the stored iron in liver tissue is found in hepatocytes as ferritin. The level of serum ferritin parallels the concentration of storage iron within the body, regardless of the cell type in which it is stored.
The control of iron homeostasis acts at both the cellular and the systemic level and involves a complex system of different cell types, transporters, and signals. To maintain systemic iron homeostasis, communication between cells that absorb iron from the diet (duodenal enterocytes), consume iron (mainly erythroid precursors), and store iron (hepatocytes and tissue macrophages) must be tightly regulated (Swinkels et al., 2006).
In the last 10 years, understanding of the regulation of iron homeostasis has changed substantially. A small peptide hormone, hepcidin, emerged as the central regulator of iron
www.intechopen.com

Chronic Kidney Disease
228
absorption, plasma iron levels, and iron distribution. Hepcidin is secreted by mainly by hepatocytes, and to a lesser extent by macrophages and adipocytes. The hormone inhibits iron flows into plasma from macrophages involved in recycling of senescent erythrocytes, duodenal enterocytes engaged in the absorption of dietary iron, and hepatocytes that store iron.( Ganz & Nemeth, 2009).
The human hepcidin gene is located on chromosome 19q13.1, encodes a precursor protein of 84 amino acids. During its export from the cytoplasm, this full-length pre-prohepcidin undergoes enzymatic cleavage, resulting in a 64 amino acids prohepcidin. Next, the 39 amino acids pro-region peptide is probably post-translationally removed, renders bioactive hepcidin-25. In human urine also are identified hepcidin-22 and hepcidin-20, which are N-terminally truncated iso-forms of hepcidin-25 (Kemna et al., 2008).
Hepcidin expression is controlled by various stimuli: iron, inflammation, erythropoiesis, and hypoxia. iron and inflammation induce hepcidin production, while iron deficiency, hypoxia, and stimulation of erythropoiesis completely inhibit its production. Hepcidin is secreted into the circulation, where it down-regulates the ferroportin-mediated release of iron from enterocytes, macrophages and hepatocytes and is the key for the regulation of systemic iron homeostasis (Fleming et al., 2005), reduces the quantity of circulating iron by limiting the egress of the metal from both intestinal and macrophage cells; the cellular process by which hepcidin acts, through its binding to ferroportin, thereby inducing internalization and subsequent degradation of the exporter (Bergamaschi & Villani., 2009).
In the intestine, delivery of dietary iron to plasma transferrin is inhibited by increasing concentrations of hepcidin, and iron is subsequently removed from the body, through the elimination of enterocytes (desquamation process). In macrophages, degradation of ferroportin by hepcidin results in the trapping of iron inside the cells, thereby limiting the acquisition of iron by erythroid cells (Nemeth et al., 2004).
Figure 1 shows and summarizes the information contained on the previous section.
1.2 Anemia in CKD
Anemia of chronic disease (ACD), the most frequent anemia among hospitalized patients,
occurs in chronic inflammatory disorders, such as chronic infections, cancer and
autoimmune diseases; is a hypoproliferative anemia, defined by low plasma iron
concentrations in the presence of high reticuloendotelial iron stores. Cytokines are
implicated in the ACD increasing iron sequestration in the reticuloendothelial system (Weiss
& Goodnough, 2005), results in hyposideremia. This results in limited availability of iron for
erythroid progenitor cells and iron restricted erythropoiesis.
A particular case of ACD is represented by anemia of chronic kidney disease (CKD).
CKD is becoming a major public health problem worldwide; the incidence and prevalence
of this disease is increasing and the costs of treatment lead to a large burden for the health
care systems, particularly in developing countries (Guidi & Santonastaso, 2010).
The severity of kidney disease is classified into five stages according to the glomerular
filtration rate (GFR). It is estimated that approximately half of the patients in stage 3 CKD
(GFR: 30–59 mL/min/1.73 m2) are anemic (Eknoyan et al., 2004).
www.intechopen.com

Assessing Iron Status in CKD Patients: New Laboratory Parameters
229
Fig. 1. Iron is absorbed from the diet by duodenal enterocytes and then bound to plasma transferrin (Tf). Fe-Tf is distributed to the bone marrow for erythropoiesis. At the end of their lifespan, senescent erythrocytes are phagocytosed by tissue macrophages and heme iron is recycled back to plasma transferrin. Hepcidin regulates the systemic iron homeostasis; synthesized by the liver is secreted into the circulation, where it down-regulates the ferroportin-mediated release of iron from enterocytes, macrophages, and hepatocytes. Swinkels, D. W. et al. Clin Chem 2006;52:950-968.
Anemia, a common observation in CKD, can develop in the early phases of the disease is associated to poor outcomes and contributes to a reduced quality of life, with symptoms including dyspnea, headache, light-headedness, and fatigue. Anemia in patients with CKD is due to many factors. The most well-known cause is inadequate production of erythropoietin. As renal failure progresses, the contribution of erythropoietin deficiency to anemia increases (Lankhorst & Wish, 2010).
Other causes which lead to impaired erythropoiesis contribute to anemia include diversion of iron traffic, diminished erythropoiesis, blunted response to erythropoietin, erythrophagocytosis, reduced proliferative activity of erythroid precursors in bone marrow, reduced survival of red cells, the decreased iron availability lead to impaired erythropoiesis (Weiss, 2009).
Absolute iron deficiency is defined as a decreased total iron body content. Iron deficiency anemia (IDA) occurs when iron deficiency is sufficiently severe to diminish erythropoiesis and cause the development of anemia. Functional iron deficiency describes a state where the total iron content of the body is normal or even elevated, but the iron is “locked away” and
www.intechopen.com
Chronic Kidney Disease
230
unavailable for the production of red blood cells. This condition is observed mainly in patients with chronic renal failure who are on hemodialysis.
Functional iron deficiency is defined as an imbalance between the iron needs for erythropoiesis and the iron supply, with the latter not maintained at sufficient rate for adequate hemoglobinization of reticulocytes and mature erythrocytes (Cavil & Macdougal, 1993).
In iron deficiency anemia (IDA) iron supply depends on the quantity of iron storage in the body, while in functional iron deficiency (iron restricted erythropoiesis) supply depends on the rate of mobilization of iron from the stores. The diagnosis of iron deficiency or functional iron deficiency is particularly challenging in patients with acute or chronic inflammatory conditions because most of the biochemical markers for iron metabolism are affected by acute phase reaction. This is the case of the anemia of chronic disease (ACD) and the anemia associated to chronic renal failure (CKD).
Recombinant human erythropoietin (rHuEpo) has been available for treatment of renal disease anemia since 1989 (Esbach et al., 1989). However, rHuEpo therapy results in functional iron deficiency due to insufficient iron stores for the accelerated erythropoiesis. Iron deficiency is the main cause of suboptimal response to erythropoietin in dialysis patients. Maintenance iron supplementation is required to successfully treat anemia. Long term orally administered iron therapy is limited by noncompliance, gastrointestinal side effects, insufficient absorption and drug interaction; intravenous iron compounds are used to treat dialysis patients who become iron deficient (Macdougal, 1995).
Monitoring erythropoietin treated patients’ iron status is important to detect iron deficiency and avoid the adverse effects of iron medication (Sunder-Plassmann & Hörl, 1997; Kletzmayr et al., 2002; Zager et al., 2002).
Biochemical indicators of iron metabolism (iron levels, transferrin, transferrin saturation, ferritin) although widely used, may be influenced by the acute phase response, which complicates clinical interpretation of the test results. Serum ferritin, an indicator of iron storage but not of iron supply, is an acute phase reactant and its levels are affected by inflammation. Because cytokines are commonly increased in CKD, serum ferritin levels might not reflect true iron stores (Mast, 2001; Coyne, 2006).
Transferrin is a negative acute phase reactant, rendering the calculation of transferrin saturation unreliable in this case. Transferrin fluctuates due to the diurnal variation of serum iron and is affected by nutritional status, leading to a lack of sensitivity and specificity in assessing iron’s availability (Fishbane et al., 1996). For these reasons, an iron deficient erythropoietic response to rHuEpo may occur despite normal serum ferritin and transferrin values.
1.2.1 Guidelines for diagnosis of anemia
After considerable review of the literature, Kidney Disease Outcomes Quality Initiative (K/DOQI) anemia work groups in 1997, 2001, and 2006 decided that the serum ferritin and the transferrin saturation (TSAT) should be the primary tools for assessing iron management in patients with anemia and chronic kidney disease, including end- stage renal disease. For patients with chronic kidney disease, absolute iron deficiency may be diagnosed when TSAT is
www.intechopen.com
Assessing Iron Status in CKD Patients: New Laboratory Parameters
231
< 20% and serum ferritin is < 100 ng/mL. Functional iron deficiency may be more difficult to diagnose since iron status parameters may indicate adequate iron stores. There are different criteria in defining functional iron deficiency, one of them is published by the Kidney Disease Outcomes Quality Initiative- K/DOQI (Eknoyan et al. 2001).
The serum ferritin reflects storage iron, and absolute iron deficiency, according to the
K/DOQI guidelines, correlates with serum ferritin <100 ng/mL. Absolute iron deficiency,
the iron deficiency that is characterized by low or absent bone marrow staining for iron, is to
be distinguished from functional or relative iron deficiency, which is defined as a response
to intravenous iron with an increase in hemoglobin (Hb) or a decrease in erythropoiesis-
stimulating agent requirement.
In 2004, European Best Practice Guidelines suggested an Hb target of 110 g/L (Locatelli et
al., 2004); values of >140 g/L were considered undesirable in general, and the limit for
patients with cardiovascular disease was set at 120 g/dL. Caution of not exceeding the value
of Hb concentrations 120 g/L was recommended to be given also for patients with diabetes,
especially if they had concurrent peripheral vascular disease.
Assessment of anemia should include the laboratory measurement of the following parameters:
Hb concentration, to assess the degree of anemia
Red blood cell indices (mean cell volume MCV, mean cell hemoglobin MCH), to assess
the type of anemia
absolute reticulocyte count , to assess erythropoietic activity
plasma ferritin concentration, to assess iron stores
To assess iron available for erythropoiesis
percentage of hypochromic red cells
plasma transferrin Saturation
reticulocyte hemoglobin content
Plasma C reactive protein, to assess inflammation
1.2.2 New parameters for the diagnosis of anemia
The question regarding anemia therapy in those patients is which are the best parameters to
assess the iron available for erythropoiesis. New laboratory parameters are reported by
different manufacturers as potential tools for anemia and iron restricted erythropoiesis
diagnosis. These tests include reticulocyte hemoglobin content, percentage of hypochromic
red cells and soluble transferrin receptor (Wish, 2006; Goodnough et al., 2010).
Serum transferrin receptor (sTfR) is a useful test for this purpose because it is not affected by
inflammation so is a reliable marker of iron deficiency in mixed situations (Punnonen et al.,
1997; Beguin, 2003; Skikne, 2008).
The sTfR test is based on the fact that erythroblasts in the bone marrow will increase the
presentation of membrane transferrin receptor in the setting of iron deficiency. If a patient is
not receiving sufficient iron and erythropoiesis is being stimulated by an ESA, then increased
transferrin receptors will become expressed on the erythroblasts, some of which come off and
will be detectable in the circulation. The sTfR correlates with this membrane expression of the
www.intechopen.com

Chronic Kidney Disease
232
transferrin receptor and also tends to be elevated in the presence of increased erythroid
activity. It does seem to be a reasonable index of erythropoietic activity (Chiang et al., 2002;
Tarng & Huang, 2002) and reflects the effect of stimulating bone marrow red cells production,
before an increase in reticulocytes is noted and well before the Hb rises; therefore an increase
in the sTfR may be the first detectable measure. It is not affected by inflammation (Beerenhout
et al., 2002) and this reason would make sTfR a more reliable test than serum ferritin.
Direct consequence of an imbalance between the erythroid marrow iron requirements and the actual supply is a reduction of red cell hemoglobin content, which causes hypochromic mature red cells and reticulocytes. Interest has been generated in the use of erythrocyte and reticulocyte parameters, available on the modern analysers based on flow cytometry technology.
The modern hematological parameters contribute to the advanced study of the anemia and depend on the technology employed; the debate about other parameters with the same clinical meaning and potential utility as reticulocyte hemoglobin content and percentage of hypochromic red cells is open.
1.3 Technology at a glance
The Hemogram is one of the more required tests by the clinicians; the analysis nowadays is totally automated and the correct interpretation of the results requires to unite the knowledge about the characteristics of the equipment and the clinical meaning of the results. The suppliers contribute innovations, providing new parameters that can help the clinicians to make a diagnosis in a fast, cheap and useful manner (Buttarello & Plebani, 2008).
The professionals of the Clinical Laboratory must obtain the maximum yield of the new technologies obtaining as much information as possible.
Automated blood cell counters have changed substantially during the last 20 years. Technological progress has meant that in recent years modern analyzers, fully automated, have been available. These analyzers report new parameters that provide further information from the traditional count; this information must be evaluated to prove the potential clinical utility in different clinical situations.
When a state of iron deficiency proceeds red blood cells are continuously produced in the bone marrow and as the iron stores progressively decrease, mean cell volume (MCV), mean cell hemoglobin (MCH) and red blood cell count (RBC) count tend to decline. In iron deficient erythropoiesis, synthesis of hemoglobin (Hb) molecules is severely impaired leading to the production of erythrocytes with low Hb concentration (hypochromic cells). Because of their long life span of approximately 3 months, several cohorts of normochromic and increasingly hypochromic red cells coexist in the peripheral blood leading to anisocytosis; red cell distribution width (RDW) reflects the variation of size of the red cells.
Flow cytometry provides information about individual cell characteristics. This is in contrast to previous measurements of MCV, MCH, and MCHC which only calculate mean indices for the total red cell population.
MCV is the mean of the volumes of all erythrocytes; RDW refers to the variety of volumes present in the red cell population, so the whole picture is clear and the contribution of marginal sized subpopulations to the calculated mean value can be assessed.
www.intechopen.com

Assessing Iron Status in CKD Patients: New Laboratory Parameters
233
This is not the case for MHC. MCH is calculated from red blood cell count and hemoglobin and represents the average; the percentage subsets of erythrocytes can give complementary information of the contribution of cell with extreme values (hypochromic and hyperchromic cells) to the mean values, reflecting the fluctuations of iron availability to the erythron in the previous weeks.
Modern counters provide information about the reticulocyte counts but also about the characteristics of these cells (size or hemoglobin content) related to the quality of the erythropoiesis.
Nevertheless, each Company applies the technology in a different way in the analyzers, with different algorithms to translate the electronic signals to graphs and numerical values. For this reason these new parameters are exclusive of each manufacturer and they are patented.
1.3.1 Siemens
On last decades, several new red blood cell and reticulocyte parameters have been reported having utilities in detection of iron deficiency and functional iron deficiency. Two of these parameters are hypochromic red cells (referred to as %Hypo) and CHr (reticulocyte hemoglobin content) reported by the Siemens ADVIA 120 hematology analyzer (Thomas & Thomas, 2002).
Reticulocyte hemoglobin content (CHr) and the percentage of hypochromic red blood cells (%Hypo) reflect iron availability and are reliable markers of functional iron deficiency (Cullen et al., 1999).
CHr is defined by the formula (CHr = MCVr X CHCMr), wherein MCVr is the mean reticulocyte cell volume and CHCMr is the mean hemoglobin concentration of reticulocytes, which is obtained by an optical cell-by-cell hemoglobin measurement.
Reticulocytes are immature red blood cells with a life span of only 1 to 2 days. When these are first released from the bone marrow, measurement of their hemoglobin content can provide the amount of iron immediately available for erythropoiesis. A less than normal hemoglobin content in these reticulocytes is an indication of inadequate iron supply relative to demand. The amount of hemoglobin in these reticulocytes also corresponds to the amount of hemoglobin in mature red blood cells. CHr has been evaluated recently in numerous studies as a test for iron deficiency and functional iron deficiency and has been found to be highly sensitive and specific. However, exact threshold values have not been established, as the threshold values vary (28-30 pg), depending on the laboratory and instrument used.
The measurement of CHr is a direct assessment of the incorporation of iron into erythrocyte hemoglobin and thus an estimate of the recent functional availability of iron into the erythron; due to the life span of the reticulocytes CHr is a sensitive indicator of iron deficient erythropoiesis (Fishbane et al., 1997; Mast et al., 2002; Brugnara 2003).
Epoetin is effective in stimulating production, of red blood cells, but without an adequate iron supply to bind to heme, the red blood cells will be hypochromic, i.e., low in hemoglobin content. Thus, in states of iron deficiency, a significant percentage of red blood cells leaving the bone marrow will have a low hemoglobin content. By measuring the percentage of red blood cells with hemoglobin concentration <280 g/L, iron deficiency can be detected.
www.intechopen.com

Chronic Kidney Disease
234
Hypochromic red cells percentages have been correlated with iron deficiency. %Hypo is reported by Siemens Advia 120 hematology analyzer based on the optical cell-by-cell hemoglobin measurement (Figures 2 and 3).
Fig. 2. RBC Scatter Cytogram. 1. Low-angle light scatter (2° to 3°) 2. High-angle light scatter (5° to 15°) 3. Mie map containing RBCs 4. Platelets detected in RBC method
The RBC Scatter cytogram is the graphical representation of two light-scatter measurements: the high-angle light scatter (5° to 15°) is plotted along the x axis, and the low-angle light scatter (2° to 3°) is plotted along the y axis. (Figure 2).
The RBC map shows the relationship between the light-scatter measurements and the cell-by-cell characteristics of volume and hemoglobin concentration. The map grid encompasses RBC volumes between 30 fL and 180 fL and hemoglobin concentrations between 190 g/L and 490 g/L. (Figure 3).
The measurement of %Hypo (defined as the percentage of red blood cells with Hb concentration less than 280 g/L) is a sensitive method for quantifying the hemoglobinization of mature red cells. Because of the long circulating life span of mature erythrocytes %Hypo values are related to iron status in the last 2-3 months, and have been recognised as an indicator of iron deficiency (Macdougal 1998; Bovy et al., 2005; Bovy et al., 2007). %Hypo < 5% is considered normal. Two different criteria, more specifically, %Hypo >5% and >10% have been used. %Hypo >10% has been more commonly used for defining absolute iron deficiency and functional iron deficiency (Locatelli et al., 2004).
www.intechopen.com

Assessing Iron Status in CKD Patients: New Laboratory Parameters
235
Fig. 3. Volume/Hemoglobin Concentration (V/HC) cytogram (Mie Map) is a linear version of the RBC scatter cytogram. Hemoglobin concentration is plotted along the x axis and cell volume is plotted along the y axis. Only red blood cells appear on this cytogram. Markers organize the cytogram into 9 distinct areas of red blood cell morphology. On the x axis, hemoglobin concentration markers are set at 280 g/L (3) and 410 g/L (4). Red blood cells with a hemoglobin concentration less than 280 g/L are hypochromic, while cells with a hemoglobin concentration greater than 410 g/L are hyperchromic. On the y axis, RBC volume markers are set at 60 fL (1) and 120 fL (2). Red blood cells with a volume less than 60 fL are microcytic, while cells with a volume greater than 120 fL are macrocytic.
CHr and %Hypo have been used as a diagnostic tool, together with biochemical markers, to distinguish IDA from ACD, and are incorporated to the guidelines for the monitoring of recombinant human erythropoietin rHuEpo therapy (Macdougall et al., 2000; Kotisaari 2002; Locateli et al., 2004).
1.3.2 Sysmex
Sysmex XE analyzers (Sysmex Corporation, Kobe, Japan) employ flow cytometry technology. In the reticulocyte channel blood cells are stained by a polymethine dye, specific for RNA/DNA, and analysed by flow cytometry using a semiconductor laser. A bi-dimensional distribution of forward scattered light and fluorescence is presented as a scattergram, indicating mature red cells and reticulocytes (Figure 4).
Forward scatter correlates with erythrocyte and reticulocyte hemoglobin content (Ret He, RBC He).
www.intechopen.com

Chronic Kidney Disease
236
Ret He is the mean value of the forward light scatter histogram within the reticulocyte population obtained in a reticulocyte channel on the Sysmex XE-2100 hematology analyzer. Measurements of Ret He provides useful information in diagnosing anemia, iron restricted erythropoiesis and functional iron deficiency and response to iron therapy during r-HuEpo (Buttarello et al, 2004; Canals et al, 2005; Brugnara et al, 2006; Thomas et al, 2006; Garzia et al., 2007).
Ret He, generated by all Sysmex XE analysers (Sysmex Corporation, Kobe, Japan), has been recognised as a direct assessment of the incorporation of iron into erythrocyte hemoglobin and a direct estimate of the recent functional availability of iron into the erythron, thus provides the same information as CHr (Thomas et al., 2005; David et al., 2006). Twenty nine pg is the cut off value that defines deficient erythropoiesis Several studies have demonstrated that Ret He and CHr have the same clinical meaning (Mast et al, 2008; Maconi et al., 2009; Miwa et al., 2010).
Fig. 4. In the reticulocyte channel blood cells are stained by a polymethine dye, specific for RNA/DNA, and analysed by flow cytometry using a semiconductor laser. A bi-dimensional distribution of forward scattered light and fluorescence is presented as a scattergram, indicating mature red cells and reticulocytes. Forward scatter correlates with erythrocyte and reticulocyte hemoglobin content (RBC He, Ret He).
The Sysmex XE 5000 analyzer incorporates flow fluorescence cytometry technology, which enables independent measurement of the volume and hemoglobin content of individual red
www.intechopen.com
Assessing Iron Status in CKD Patients: New Laboratory Parameters
237
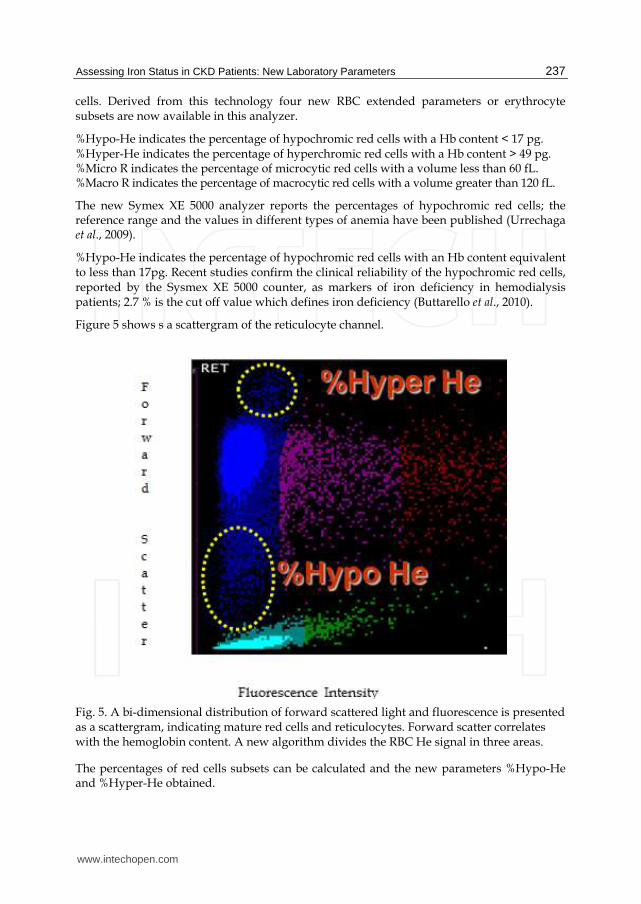
cells. Derived from this technology four new RBC extended parameters or erythrocyte subsets are now available in this analyzer.
%Hypo-He indicates the percentage of hypochromic red cells with a Hb content < 17 pg. %Hyper-He indicates the percentage of hyperchromic red cells with a Hb content > 49 pg. %Micro R indicates the percentage of microcytic red cells with a volume less than 60 fL. %Macro R indicates the percentage of macrocytic red cells with a volume greater than 120 fL.
The new Symex XE 5000 analyzer reports the percentages of hypochromic red cells; the reference range and the values in different types of anemia have been published (Urrechaga et al., 2009).
%Hypo-He indicates the percentage of hypochromic red cells with an Hb content equivalent to less than 17pg. Recent studies confirm the clinical reliability of the hypochromic red cells, reported by the Sysmex XE 5000 counter, as markers of iron deficiency in hemodialysis patients; 2.7 % is the cut off value which defines iron deficiency (Buttarello et al., 2010).
Figure 5 shows s a scattergram of the reticulocyte channel.
Fig. 5. A bi-dimensional distribution of forward scattered light and fluorescence is presented as a scattergram, indicating mature red cells and reticulocytes. Forward scatter correlates with the hemoglobin content. A new algorithm divides the RBC He signal in three areas.
The percentages of red cells subsets can be calculated and the new parameters %Hypo-He and %Hyper-He obtained.
www.intechopen.com

Chronic Kidney Disease
238
%Hypo-He indicates the percentage of hypochromic red cells with a Hb content < 17 pg. %Hyper-He indicates the percentage of hyperchromic red cells with a Hb content > 49 pg.
1.3.3 Beckman-Coulter
The percentage of hypochromic red cells are only available on Siemens analyzers (Siemens
Medical Solutions Diagnostics, Tarrytown N.Y., USA) and on the new Sysmex analyzer XE 5000 (Sysmex Corporation, Kobe, Japan); this fact limits its generalized use. Beckman
Coulter (Beckman Coulter Inc. Miami, Fl, USA) applies the Volume Conductivity Scatter technology to this field and new parameters are now available on the LH series analyzers.
Low hemoglobin density (LHD %) derives from the traditional mean cell hemoglobin concentration (MCHC), using the mathematical sigmoid transformation
LHD % 100 1 1 1 e 1.8 30 MCHC
MCHC is an all inclusive measure of both the availability of iron over the preceding 90–120 days, and of the proper introduction of iron into intracellular hemoglobin. In the same way
LHD% is related to iron availability and the hemoglobin concentration of the mature red cells. In this equation defining LHD %, in addition to the standard sigmoid function, a
square root is applied to further enhance numerical resolution in the region corresponding
to the lower end, to improve the differentiation between the normal and the abnormal among the blood samples having relatively low values of LHD %.
The reference range for LHD % and the values in normal population and different types of anemia have been established (Urrechaga, 2010). Then a study was conducted to investigate
its clinical usefulness in the assessment of iron status in terms of correlation with %Hypo (Urrechaga et al., 2010) and sTfR (Urrechaga et al., 2011).
Cells are identified and classified by simultaneous three-dimensional analysis using Volume, Conductivity, and Light Scatter (Figure 6). Volume, as measured by direct current,
is used to identify the size of the cell. Conductivity, or radio frequency measurements, provides information about the internal characteristics of the cell. Light scatter
measurements, obtained as cells pass through the helium-neon laser beam, provide information about cell surface characteristics and cell granularity.
2. Materials and methods
2.1 Criteria for selecting the groups of patients
Samples from 120 healthy individuals, 72 iron deficiency anemia (IDA), 60 IDA with acute
phase response (IDA APR), 71 chronic kidney disease (CKD) and 58 anemia of chronic disease (ACD) were randomly extracted from the routine workload and run sequentially on
both LH 750 (Beckman Coulter Inc. Miami, Fl, USA) and Advia 2120 (Siemens Medical Solutions Diagnostics, Tarrytown N.Y., USA) analyzers within 6 hours of collection.
Healthy group: 54 male and 66 female adult subjects, with no clinical symptoms of disease and with results of the complete blood count and biochemical iron metabolism markers within reference ranges.
www.intechopen.com

Assessing Iron Status in CKD Patients: New Laboratory Parameters
239
LEU
PLQ
RETERIT
LEU
PLQ
RETERIT
Fig. 6. the Beckman -Coulter cube in which the cells are classified according to the volume, conductivity and laser scatter signals. ERIT , erythrocytes; PLQ, platelets; RET, reticulocytes; LEU, leucocytes.
A group of 132 IDA patients fulfilled traditional diagnostic criteria for iron deficiency anemia diagnosis, serum iron < 7.5 μmol/L, transferrin saturation < 20 %, ferritin < 50 µg/L, and Hb < 110 g/L (Cook, 2005), were included before iron treatment. This group was divided into a non acute phase response group (n=72, CRP < 5 mg/L) and acute phase response group (n=60, CRP > 5 mg/L). Acute phase response included inflammation or infectious conditions, in addition to ferropenic status.
CKD patients were managed according to the recommendations of the NKF-K/DOQI guidelines (Locatelli et al., 2004). All patients were treated with a variety of erythropoietin doses, the majority of them were treated with a maintenance dose of intravenous iron weekly, in order to maintain Hb at the recommended level 110 - 120 g/L.
ACD group included patients with a variety of diseases: chronic infections (tuberculosis); neoplasic disorders (Hodgkin‘s disease, breast carcinoma); non infectious inflammatory diseases (rheumatoid arthritis, systemic lupus erythematosus). ACD patients received treatment to maintain normal erythropoiesis and presented the traditional diagnostic criteria for ‘Functional iron-deficiency’ diagnosis Transferrin saturation < 20%, Hb < 110 g/L and serum ferritin values normal or over the reference range (Weiss & Goodnough, 2005).
In a second phase of the study ACD group was extended to 85 patients. This group was further subdivided based on sTfR levels. ACD patients with sTfR higher than 21 nmol/L were considered to have storage iron depletion (iron deficiency associated, n=24) and patients with normal sTfR were considered to have functional iron deficiency (n=61).
www.intechopen.com

Chronic Kidney Disease
240
sTfR was measured with Access sTfR assay in the Access immunochemical analyzer (Beckman Coulter Inc., Miami Fl, USA).
2.2 Statistical evaluation of analytical results
Statistical software package SPSS (SPSS; Chicago, IL, USA) version 17.0 for Windows was applied for statistical analysis of the results.
Reference ranges were calculated from the results obtained in the group of healthy subjects (95 central percentiles of the distribution). Kolmogorov – Smirnoff test was applied to verify the Gaussian distribution of LHD% values.
When the parameters under study presented a non Gaussian distribution non parametric tests were applied. Correlation coefficients were calculated by Spearman method; independent samples Mann-Whitney U test was performed; p values less than 0.05 were considered to be statistically significant.
Receiver operating characteristic (ROC) curve analysis was utilized to illustrate the diagnostic performance of LHD% and other Laboratory tests in the detection of iron deficiency status; two analysis were performed; first iron deficiency was defined by %Hypo > 5 %, and second , including 85 ACD patients, the gold standard was sTfR > 21 nmol/L.
Cut off values were established based on the optimal combination of sensitivity and specificity.
Cohen’s Kappa Index of Inter-rater Reliability (κ index) was calculated to determine the concordance between LHD% and sTrR.
κ has a range from 0-1.0, the larger values indicate better reliability; κ > 0.7 is considered satisfactory.
RBC 1012/L
Hb g/L
MCV fL
MCH pg MCHC g/L
Iron µmol/L
Transf g/L
Ferritin µg/L
Sat %
Health
4.9 (0.27)
154 (6.4)
91.1 (2.55)
31.3 (1.53)
343 (5.2)
16.5 (0.62)
2.53 (0.2)
75 (2.8)
31 (1.9)
IDA
4.6 (0.61)
95 (14.2)
70 (10.3)
22.5 (4.23)
320 (17.3)
4.8 (2.15)
3.31 (0.53)
14 (9)
6 (3.6)
IDA APR
4.4 (0.43)
96 (12.1)
75.8 (3.7)
21.5 (1.3)
327 (9.2)
5.1 (3.5)
2.78 (0.28)
37 (25)
9 (5.6)
ACD 3.5 (0.48)
101 (11)
93.2 (6.0)
31.9 (2.23)
343 (10)
10.0 (6.8)
2.68 (0.66)
522 (704)
15 (5)
CKD 3.5 (0.45)
112 (8.5)
95.6 (6.67)
31.1 (2.23)
325 (8)
9.8 (4.47)
1.87 (0.43)
335 (204)
21 (10)
Table 1. shows the hematological and biochemical data, mean and (standard deviation), of the different groups. 120 healthy individuals, 72 iron deficiency anemia (IDA), 60 IDA with acute phase response (IDA APR), 71 chronic kidney disease (CKD) and 58 anemia of chronic disease (ACD).
www.intechopen.com

Assessing Iron Status in CKD Patients: New Laboratory Parameters
241
RBC, red blood cells; Hb, hemoglobin; MCV, mean cell volume; MCH, mean cell hemoglobin; MCHC, mean cell hemoglobin concentration; Transf, transferrin; Sat, % transferrin saturation.
3. Results
Table 1 shows the hematological and biochemical data, mean and (standard deviation). The parameters presented are of general use for every Laboratory in the evaluation of anemia.
The patients included in the study sufferered common clinical situations in our daily practice: anemia of chronic disease (ACD), chronic kidney disease (CKD), iron deficiency anemia (IDA) iron deficiency anemia and acute phase response (IDA APR)
The healthy group was recruited to assess the reference range for the new parameter LHD %.
LHD % values in a population of 120 healthy adult subjects were not normally distributed and showed a non Gaussian distribution (Kolmogorov-Smirnoff test, p=0.034; figure 7). Reference range 0 - 4.4 %.
Fig. 7. Low hemoglobin density (LHD %) values in a population of 120 healthy adult subjects. The values showed a non Gaussian distribution (Kolmogorov-Smirnoff test, p=0.034).
Table 2 exhibits %Hypo values, mean and standard deviation (SD) and LHD % values, median and 5th - 95th interquartiles (IQ), in the variety of anemias and healthy subjects included in the study.
www.intechopen.com

Chronic Kidney Disease
242
% Hypo Mean (SD)
LHD % Median (IQ)
Healthy 0.13 (0.15) 2.1 (0.9-4.1)
IDA 17.2 (17.4) 29.6 (7.5-76)
IDA APR 16.8 (15.5) 27.3 (8.3-71.2)
ACD 4.1 (4.4) 7.3 (5.1-30)
CKD 5.1 (6.7) 9.6 (5.6-27)
Table 2. %Hypo values, mean and standard deviation (SD) and LHD % values, median and 5th - 95th interquartiles (IQ), in the variety of anemias and healthy subjects included in the study.
IDA, iron deficiency anemia; IDA APR, iron deficiency anemia and acute phase response; ACD, anemia of chronic disease; CKD, chronic kidney disease.
Correlation between %Hypo and LHD% values, r = 0.869 (Spearman method) (p<0.001). y = 1.338 x + 4.40 (Figure 8).
Independent samples U test was performed in order to detect statistical deviations between the groups of patients.
Significant differences in LHD % values (p<0.001) were detected when groups with iron deficiency (IDA, median 29.6 % and IDA with APR, median 27.3 %) were compared with patients undergoing therapy (ACD, median 7.3 %; CKD, median 9.6 %) and the healthy subjects (median 2.1 %).
Fig. 8. Relationship between %Hypo and LHD% values (Spearman correlation) r = 0.869 y = 1.338 x + 4.4.
www.intechopen.com
Assessing Iron Status in CKD Patients: New Laboratory Parameters
243
No statistic difference was found between IDA group and IDA patients with acute phase response (p=0.578).
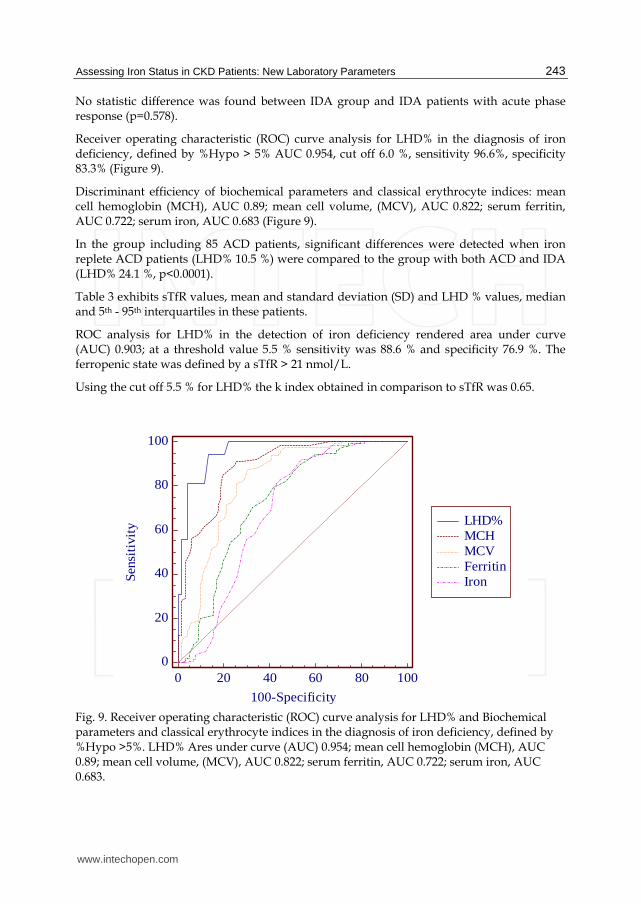
Receiver operating characteristic (ROC) curve analysis for LHD% in the diagnosis of iron deficiency, defined by %Hypo > 5% AUC 0.954, cut off 6.0 %, sensitivity 96.6%, specificity 83.3% (Figure 9).
Discriminant efficiency of biochemical parameters and classical erythrocyte indices: mean cell hemoglobin (MCH), AUC 0.89; mean cell volume, (MCV), AUC 0.822; serum ferritin, AUC 0.722; serum iron, AUC 0.683 (Figure 9).
In the group including 85 ACD patients, significant differences were detected when iron replete ACD patients (LHD% 10.5 %) were compared to the group with both ACD and IDA (LHD% 24.1 %, p<0.0001).
Table 3 exhibits sTfR values, mean and standard deviation (SD) and LHD % values, median and 5th - 95th interquartiles in these patients.
ROC analysis for LHD% in the detection of iron deficiency rendered area under curve (AUC) 0.903; at a threshold value 5.5 % sensitivity was 88.6 % and specificity 76.9 %. The ferropenic state was defined by a sTfR > 21 nmol/L.
Using the cut off 5.5 % for LHD% the k index obtained in comparison to sTfR was 0.65.
LHD%MCHMCVFerritinIron
0 20 40 60 80 100
100
80
60
40
20
0
100-Specificity
Sens
itiv
ity
Fig. 9. Receiver operating characteristic (ROC) curve analysis for LHD% and Biochemical parameters and classical erythrocyte indices in the diagnosis of iron deficiency, defined by %Hypo >5%. LHD% Ares under curve (AUC) 0.954; mean cell hemoglobin (MCH), AUC 0.89; mean cell volume, (MCV), AUC 0.822; serum ferritin, AUC 0.722; serum iron, AUC 0.683.
www.intechopen.com

Chronic Kidney Disease
244
Healthy
ACD ACD/ IDA
ACD/ Iron replete
LHD% 2.1 14.2 24.1 10.5
(0.9-4.1) (4.5-68.9) (5.1-68.9) (4.5-14.0)
sTfR (nmol/L) 15.1 (2)
20.3 (6.6)
30.8 (8.3)
17.9 (6.1)
Table 3. sTfR values, mean and standard deviation (SD) and LHD % values, median and 5th - 95th interquartiles in a group of 120 healthy subjects, 85 anemia of chronic disease patients (ACD), 61 of them iron replete and 24 iron deficient (ACD/IDA).
4. Discussion
CKD is a widespread health problem in the world and anemia is a common complication.
Anemia conveys significant risk for cardiovascular disease, faster progression of renal
failure and decreased quality of life.
Ferrokinetic studies provided on last decades important insights into human iron
homeostasis in vivo. More recently, modern molecular biology and genetic studies of model
organisms have extended our knowledge of normal iron biology and led to the
identification of new key players in iron homeostasis and the detailed understanding of
human iron disorders.
New insights in iron metabolism and the understanding of iron homeostasis, erythropoietin
production and regulation and the relationships between mediators of inflammation and
bone marrow erythropoiesis are modifying the traditional view on anemia, in special
anemia of chronic disease. The anemia of CKD is among them, with the added burden of
erythropoietin deficiency. Recent elucidations of specifically disrupted points of erythroid
marrow function by inflammatory mediators, especially proinflammatory cytokines and
inflammation-mediated induction of hepcidin, have improved our understanding of
erythropoiesis-stimulating agents (ESAs) hyporesponsiveness.
These patients require a thorough evaluation to identify and correct causes of anemia other
than erythropoietin deficiency. The mainstay of treatment of anemia secondary to CKD has
become ESAs. The use of ESAs does carry risks and these agents need to be used
judiciously. Iron deficiency often co-exists in this population and must be evaluated and
treated. Correction of iron deficiency can improve anemia and reduce ESA requirements.
Partial, but not complete, correction of anemia is associated with improved outcomes in
patients with CKD.
Undoubtedly, the advent of ESA and various intravenous iron preparations has resulted
in a much more effective management of anemia of CKD, allowing clinicians to maintain
hemoglobin levels in certain desired ranges and to effectively treat iron deficiency.
Among the emerging challenges are the risks associated with administering high ESA and
iron doses, leading to elevated hemoglobin levels and iron overload. Goal-oriented
treatment strategies targeting “desirable” hemoglobin and iron levels are now the norm in
clinical nephrology.
www.intechopen.com

Assessing Iron Status in CKD Patients: New Laboratory Parameters
245
The treatment of renal anemia with rHuEpo has improved the quality of life and outcome of hemodialysis patients. The efficacy of this therapy depends on the identification and correction of resistance factors, such as vitamin deficiency, inflammation, hyperparathyroidism. The major cause of resistance to rHuEpo is iron deficiency. The assessment of functional iron deficiency remains a daily challenge for nephrologists and their need to be careful of an appropriate use of the resources and the need to optimize patient treatment.
A better understanding of iron homeostasis enhance treatments for anemia. Subsequently, evidence-based diagnostic strategies must be developed, using both conventional and innovative laboratory tests, to differentiate between the various causes of distortions of iron metabolism.
Efforts have been made to evaluate some readily available and relatively inexpensive laboratory parameters as indirect markers of iron restricted erythropoiesis and iron availability in a clinical context influenced by inflammation and acute phase reaction.
The assessment of iron requirements and monitoring of therapy require accurate markers. It is desirable to seek alternative markers for iron status widely available. LHD% is related to iron availability for erythropoiesis in the previous weeks, derived from MCHC, it could be calculated in different hematological counters.
The data exposed show the reliability of LHD% in distinguishing iron deficient patients with and without inflammation. This parameter could help to the correct classification of patients with iron deficiency when the traditional markers become unreliable: it is particularly challenging the accurate assessment of iron status in chronically ill patients such as CKD.
LHD % correlates with the percentage of hypochromic erythrocytes as reported by Siemens analyzers (%Hypo) and comparing the results obtained for LHD% with those of sTfR the reliability of LHD% in distinguishing iron deficient patients with and without inflammation has been stated.
In conclusion, these results show that the new LHD% parameter is useful for diagnosing iron deficiency and a reliable parameter recognizing subsets of patients and therefore improving the diagnosis and management of anemia.The analysis of LHD% can be performed simultaneously in the course of routine blood counts, with no incremental costs and no additional needs of more blood sampling. In conjunction with standard blood cell counts and iron parameters could enable the diagnosis to be made rapid and accurately.
More prospective and longitudinal studies are needed in order to verify the results obtained, to determine their reliability for clinical purposes or whether the additional information provided could be used in managing the iron requirements of patients in different clinical situations.
5. Conclusion
Iron metabolism is a dynamic process which cannot be defined by one laboratory test only.
The analysis of these new parameters can be performed simultaneously in the course of
www.intechopen.com

Chronic Kidney Disease
246
routine blood counts, with no incremental costs and no additional needs of more blood
sampling. In conjunction with standard blood cell counts and iron parameters could enable
the diagnosis to be made rapid and accurately.
Prospective and longitudinal studies are needed in order to verify the published results, to
determine their reliability for clinical purposes or whether the additional information
provided could be used in managing the iron requirements of patients, allowing better
evaluation of the causes underlying apparently similar conditions of anemia and improving
the collaboration between laboratory professionals and clinicians.
6. References
Beaumont, C. & Delaby, C. (2009). Recycling iron in normal and pathological states. Seminars
in Hematology 46, 328-338.
Beerenhout, C., Bekers, O., Kooman, J.P., van der Sande, F.M. & Leunissen, K.M. (2002). A
comparison between the soluble transferrin receptor, transferrin saturation and
serum ferritin as markers of iron state in hemodialysis patients. Nephron 92, 32-
35.
Beguin, Y. (2003). Soluble transferrin receptor for the evaluation of erythropoiesis and iron
status. Clinica Chimica Acta 329, 9-22.
Bergamaschi, G. & Villani, L. (2009). Serum hepcidin: a novel diagnostic tool in disorders of
iron metabolism Haematologica 94, 1631-1633.
Bovy, C., Gothot, A., Krzesinski, J.M., & Beguin, Y. (2005). Mature erythrocyte indices: new
markers of iron availability. Haematologica 90, 549-551.
Bovy, C., Gothot, A., Delanaye, P., Warling, X., Krzesinski, J.M., & Beguin, Y. (2007). Mature
erythrocyte parameters as new markers of functional iron deficiency in
hemodialysis: sensitivity and specificity. Nephrology Dialysis Transplantation 22(1),
1156-1162.
Brugnara, C. (2003). Iron deficiency and erythropoiesis: New diagnostic approaches. Clinical
Chemistry 49, 1573-1578.
Brugnara, C., Schiller, B., & Moran, J. (2006). Ret He and assessment of iron deficient states.
Clinical and Laboratory Haematology 28(5), 303-308.
Buttarello, M., Temporin, V., Ceravolo, R., Farina, G. & Burian, P. (2004). The new
reticulocyte parameter RET Y of the Sysmex XE 2100. Its use in the diagnosis and
monitoring of post treatment sideropenic anemia. American Journal of Clinical
Pathology 121, 489-495.
Buttarello, M., Plebani, M. (2008). Automated blood cell counts. State of the art. American
Journal of Clinical Pathology 130, 104-116.
Buttarello, M., Pajola, R., Novello, E., Robeschini, M., Cantaro, S., Oliosi, F., Naso, A., &
Plebani, M. (2010). Diagnosis of iron deficiency diagnosis of iron deficiency in
patients undergoing hemodialysis. American Journal of Clinical Pathology 133, 949-
954.
Canals, C., Remacha, A.F., Sarda, M.P., Piazuelo, J.M., Royo, M.T., & Romero, M.A. (2005).
Clinical utility of the new Sysmex XE 2100 parameter – reticulocyte hemoglobin
equivalent in the diagnosis of anemia. Haematologica 90, 1133-1134.
www.intechopen.com

Assessing Iron Status in CKD Patients: New Laboratory Parameters
247
Cavill, I., & Macdougall, I.C. (1993). Functional iron deficiency. Blood 82, 1377.
Chiang, W.C., Tsai, T.J., Chen, Y.M., Lin, S.L. & Hsieh, B.S. (2002). Serum soluble transferrin
receptor reflects erythropoiesis but not iron availability in erythropoietin-treated
chronic hemodialysis patients. Clinical Nephrology 58, 363- 369.
Conrad, M.E. & Umbreit , J.N. (2002). Pathways of iron absorption. Blood Cells Molecular
Disorders 29, 336-355.
Coyne, D. (2006). Iron indices: what do they really mean? Kidney International Supp 101,
S4-8.
Cullen, P., Söffker, J., Höpfl, M., Bremer, c., Schlaghecken, R., Mehrens, T., Assmann, G., &
Schaefer, R.M. (1999). Hypochromic red cells and reticulocyte haemglobin content
as markers of iron-deficient erythropoiesis in patients undergoing chronic
haemodialysis. Nephrology Dialysis Transplantation 14, 659-665.
David, O., Grillo, A., Ceoloni, B., Cavallo, F., Podda, G., Biancotti, P.P., Bergamo, D., &
Canavese, C. (2006). Analysis of red cell parameters on the Sysmex XE 2100 and
Advia 120 in iron deficiency and in uraemic chronic disease. Scandinavian Journal of
Clinical and Laboratory Investigation 66, 113-120.
Eknoyan G, et al. (2001). Continuous quality improvement: DOQI becomes K/DOQI and is
updated. National Kidney Foundation's Dialysis Outcomes Quality Initiative.
American Journal of Kidney Disease 37(1), 179-194.
Eknoyan, G., Lameire, N., Barsoum, R., Eckardt, K., Levin, A., Levin, N., et al. (2004). The
burden of kidney disease: improving global outcomes. Kidney International 66,
1310–1314.
Eschbach, J.W., Downing, M.R., Egrie, J.C., Browne, J.K., & Adamson, J.W. (1989). USA
multicenter clinical trial with recombinant human erythropoietin. Contributions to
Nephrology 76, 160-165.
Fishbane, S., Imbriano, L.J., Kowalski, E.A., & Maesaka, J.K. (1996). The evaluation of iron
status in patients receiving recombinant human erythropoietin. Journal of the
American Society of Nephrology 7, 654-657.
Fishbane, S., Galgano, C., Langley, R.C. Jr, Canfield, W., & Maesaka, J.K. (1997). Reticulocyte
hemoglobin content in the evaluation of iron status of hemodialysis patients. Kidney
International 52, 217-222.
Fleming, R.E. & Bacon, B.R. (2005). Orchestration of iron homeostasis. New England Journal of
Medicine 352, 1741-1744.
Ganz, T. & Nemeth, E. (2009). Iron sequestration and Anemia of Inflammation. Seminars in
Hematology 46, 387-393.
Garzia, M., Di Mario, A., Ferraro, E., Tazza, L., Rossi, E., Luciani, G., & Zini, G. (2007).
Reticulocyte Hemoglobin Equivalent: an indicator of reduced iron availability in
chronic kidney diseases during erythropoietin therapy. Laboratory Haematology 13,
6-11.
Goodnough, L.T., Nemeth, E., & Ganz, T. (2010). Detection, evaluation and management of
iron-restricted erythropoiesis. Blood 116, 4754-4761.
Guidi, G.C., & Santonastaso, C.L. (2010). Advancements in anemias related to chronic
conditions. Clinical Chemistry and Laboratory Medicine 48, 1217-1226.
www.intechopen.com

Chronic Kidney Disease
248
Kemna, E.H.J.M., Tjalsma, H., Willems, H.L. & Swinkels, D.W. (2008). Hepcidin: from
discovery to differential diagnosis. Haematologica 93(1), 90-97.
Kletzmayr, J., Sunder-Plassmann, G., & Hörl, W.H. (2002). High dose intravenous iron: a
note of caution. Nephrology Dialysis Transplantation 17, 962-965.
Knutson, M.D., Oukka, M., Koss, L.M. et al. (2005). Iron release from macrophages after
erythrophagocytosis is up-regulated by ferroportin 1 overexpression and down-
regulated by hepcidin. Proceedings of the Academy of Natural Sciences USA 102, 1324-
1328.
Kotisaari, S., Romppanen, J., Penttila, I., & Punnonen, K. (2002). The Advia 120 red blood
cell and reticulocyte indices are useful in diagnosis of iron-deficiency anemia.
European Journal of Hematology 68, 150-156.
Lang, K.S., Lang, P.A. & Bauer, C. (2005). Mechanisms of suicidal erythrocyte death. Cell
Physiology and Biochemistry 15,195-202.
Lankhorst, C.E., & Wish, J.B. (2010). Anemia in renal disease: diagnosis and management.
Blood Reviews 24, 39–47.
Locateli, F., Aljama, P., Barany, P., Canaud, B., Carrera, F., Eckardt, K., Horl, W.H.,
MacDougall, I.C., MacLeod, A., Wiecek, A., & Cameron, S. (2004). European Best
Practice Guidelines Working Group. Revised European best practice guidelines for
the management of anaemia in patients with chronic renal failure. Nephrology
Dialysis Transplantation 19 (suppl 2), 1-47.
Macdougall, I.C. (1995). Poor response to EPO: practical guidelines on investigation and
management. Nephrology Dialysis Transplantation 10, 607-614.
Macdougall, I.C. (1998). Merits of hypochromic red cells as a marker of functional iron
deficiency. Nephrology Dialysis Transplantation 13, 847-849.
Macdougall, I.C., Horl, W.H., Jacobs, C., Valderrabano, F., Parrondo, I., Thompson, K., &
Cremers, S. (2000). European best practice guidelines 6–8: assessing and optimizing
iron stores. Nephrology Dialysis Transplantion 15, 20-32.
Maconi, M., Cavalca, I., Danise, P., Cardarelli, F., & Brini, M. (2009). Erythrocyte and
reticulocyte indices in chronic kidney diseases: comparison of two methods.
Scandinavian Journal of Clinical and Laboratory Investigation 69, 365-370.
Mast, A. (2001). The clinical utility of peripheral blood tests in the diagnosis of iron
deficiency anemia. Bloodline 1, 7-9.
Mast ,A.E., Blinder, M.A., Lu, Q., Flax, S., & Dietzen, D.J. (2002). Clinical utility of the
reticulocyte hemoglobin content in the diagnosis of iron deficiency. Blood 99, 1489-
1491.
Mast, A.E., Blinder, M.A., & Dietzen, D.J. (2008). Reticulocyte haemoglobin content.
American Journal of Hematology 83(4), 307-310.
Miret, S., Simpson, R.J. & McKie, A.T. (2003). Physiology and molecular biology of dietary
iron absorption. Annu Rev Nutr. 23, 283-301.
Miwa, N., Akiba, T., Kimata, N., Hamaguchi, Y., Arakawa, Y., Tamura, T., Nitta, K., &
Tsuchiya, K. (2010). Usefulness of measuring reticulocyte hemoglobin equivalent in
the management of haemodialysis patients with iron deficiency. International
Journal of Laboratory Hematology 32, 248-255.
www.intechopen.com

Assessing Iron Status in CKD Patients: New Laboratory Parameters
249
Nemeth, E., Tuttle, M.S., Powelson, J., Vaughn, M.B., Donovan, A., Ward, D.M., Ganz, T. &
Kaplan, J. (2004). Hepcidin regulates cellular iron efflux by binding to ferroportin
and inducing its internalization. Science 306, 2090-2093.
Ponka, P., Beaumont, C. & Richardson, D.R. (1998). Function and regulation of transferrin
and ferritin. Seminars in Hematology 35, 35-54.
Punnonen, K., Irjala, K., & Rajamaki, A. (1997). Serum transferrin receptor and its ratio to
serum ferritin in the diagnosis of iron deficiency. Blood 89, 1052-1057.
Skikne, B.S. (2008). Serum transferrin receptor. American Journal of Hematology 83, 872-875.
Sunder-Plassmann, G., Spitzauer, S., & Hörl, W.H. (1997). The dilemma of evaluating iron
status in dialysis patients – limitations of available diagnostic procedure.
Nephrology Dialysis Transplantation 12, 1575-1580.
Swinkels, D.W., Janssen, M.C.H., Bergmans, J. & Marx, J.J.M. (2006). Herediatary
hemochromatosis: genetic complexity and new diagnostics approaches. Clinical
Chemistry 52(6), 950-968.
Tarng, D.C. & Huang, T.P. (2002). Determinants of circulating soluble transferrin receptor
level in chronic haemodialysis patients. Nephrology Dialysis Transplantation 17,1063–
1069.
Thomas, C., & Thomas,L. (2002). Biochemical markers and hematologic indices in the
diagnosis of functional iron deficiency. Clinical Chemistry 48, 1066-1076.
Thomas, L., Franck, S., Messinger, M., Linssen, J., Thome, M., & Thomas, C. (2005).
Reticulocyte hemoglobin measurement – comparison of two methods in the
diagnosis of iron-restricted erythropoiesis. Clinical Chemistry and Laboratory
Medicine 43, 1193-1202.
Thomas, C., Kirschbaum, A., Boehm, D., & Thomas, L. (2006). The diagnostic plot. Medical
Oncology 23(1), 23-36.
Urrechaga, E., Borque, L., & Escanero, J.F. (2009). Potential utility of the new Sysmex XE
5000 red blood cell extended parameters in the study of disorders of iron
metabolism. Clinical Chemistry and Laboratory Medicine 47(11), 1411-1416.
Urrechaga, E. (2010). The new mature red cell parameter, low haemoglobin density of the
Beckman-Coulter LH750: clinical utility in the diagnosis of iron deficiency.
International Journal of Laboratory Hematology 32, e144-150.
Urrechaga, E., Borque, L., & Escanero J.F. (2010). Erythrocyte and reticulocyte indices on the
LH 750 as potential markers of functional iron deficiency. Anemia DOI
10:1155/2010/625919.
Urrechaga, E., Borque, L., & Escanero J.F. (2011).Low Hemoglobin density potential marker
of iron availability. International Journal of Laboratory Hematology DOI
10.1111/j.1751-553x.2011.01355.x.
Weiss, G., Goodnough, L.T. (2005). Anemia of chronic disease. New England Journal of
Medicine 352, 1011-1023.
Weiss, G. (2009). Iron metabolism in the anemia of chronic disease. Biochimica and Biophysica
Acta 1790, 682-693.
Wish, J.B. (2006). Assessing Iron status: beyond serum ferritin and transferrin saturation.
Clinical Journal of the American Society of Nephrology 1, S4-S8.
www.intechopen.com

Chronic Kidney Disease
250
Zager, R.A., Johnson, A.C.M., Hanson, S.Y., & Wasse, H. (2002). Parenteral iron
formulations: a comparative toxicologic analysis and mechanisms of cell injury.
American Journal of Kidney Disease 40, 90-103.
www.intechopen.com

Chronic Kidney DiseaseEdited by Prof. Monika Göőz
ISBN 978-953-51-0171-0Hard cover, 444 pagesPublisher InTechPublished online 16, March, 2012Published in print edition March, 2012
InTech EuropeUniversity Campus STeP Ri Slavka Krautzeka 83/A 51000 Rijeka, Croatia Phone: +385 (51) 770 447 Fax: +385 (51) 686 166www.intechopen.com
InTech ChinaUnit 405, Office Block, Hotel Equatorial Shanghai No.65, Yan An Road (West), Shanghai, 200040, China
Phone: +86-21-62489820 Fax: +86-21-62489821
Chronic kidney disease is an increasing health and economical problem in our world. Obesity and diabetesmellitus, the two most common cause of CKD, are becoming epidemic in our societies. Education on healthylifestyle and diet is becoming more and more important for reducing the number of type 2 diabetics andpatients with hypertension. Education of our patients is also crucial for successful maintenance therapy. Thereare, however, certain other factors leading to CKD, for instance the genetic predisposition in the case ofpolycystic kidney disease or type 1 diabetes, where education alone is not enough.
How to referenceIn order to correctly reference this scholarly work, feel free to copy and paste the following:
Eloísa Urrechaga, Luís Borque and Jesús F. Escanero (2012). Assessing Iron Status in CKD Patients: NewLaboratory Parameters, Chronic Kidney Disease, Prof. Monika Göőz (Ed.), ISBN: 978-953-51-0171-0, InTech,Available from: http://www.intechopen.com/books/chronic-kidney-disease/assessing-iron-status-in-ckd-patients-new-laboratory-parameters


![ERYTHROCYTES [RBCs]](https://img.pdfslide.us/doc/110x75/568130b1550346895d96c651/erythrocytes-rbcs-5687466751123.jpg)


![ERYTHROCYTES [RBCs]](https://img.pdfslide.us/doc/110x75/56813dc0550346895da78963/erythrocytes-rbcs-56ea22b2e2743.jpg)