Embed Size (px)
Citation preview
3,350+OPEN ACCESS BOOKS
108,000+INTERNATIONAL
AUTHORS AND EDITORS114+ MILLION
DOWNLOADS
BOOKSDELIVERED TO
151 COUNTRIES
AUTHORS AMONG
TOP 1%MOST CITED SCIENTIST
12.2%AUTHORS AND EDITORS
FROM TOP 500 UNIVERSITIES
Selection of our books indexed in theBook Citation Index in Web of Science™
Core Collection (BKCI)
Chapter from the book Macro To Nano SpectroscopyDownloaded from: http://www.intechopen.com/books/macro-to-nano-spectroscopy
PUBLISHED BY
World's largest Science,Technology & Medicine
Open Access book publisher
Interested in publishing with IntechOpen?Contact us at [email protected]
17
A Comparative Study of Analytical Methods for Determination of
Polyphenols in Wine by HPLC/UV-Vis, Spectrophotometry and Chemiluminometry
Vesna Weingerl*
University of Maribor, Faculty of Agriculture and Life Sciences, Hoče,
Slovenia
1. Introduction
Wine, especially red wine, is a very rich source of polyphenols, such as flavanols (catechin, epicatechin, etc.), flavonols (quercetin, rutin, myricetin, etc.), anthocyanins (the most abundant is malvidin-3-o-glucoside), oligomeric and polymeric proanthocyanidins, phenolic acids (gallic acid, caffeic acid, p-coumaric acid, etc.), stilbenes (trans-resveratrol) and many others polyphenols. Many of these compounds (e.g. resveratrol, quercetin, rutin, catechin and their oligomers and polymers proanthocyanidins) have been reported to have multiple biological activities, including cardioprotective, anti-inflammatory, anti-carcinogenic, antiviral and antibacterial properties (King et al., 2006; Santos- Buelega Scalbert, 2000). These biological properties are attributed mainly to their powerful antioxidant and antiradical activity.
Regular, moderate consumption of red wine reduced the incidence of many diseases such as risk of coronary heart disease (CHD), atherosclerosis, cancers, etc. (Cooper et al., 2004; Opie Lecour, 2007). The most intriguing are the studies which reported the possible association between red wine consumption and decrease in risk, and some suppression and inhibition of cancers (Briviba et al., 2002). Currently, chemoprevention is being used in medicine as a new strategy to prevent cancers. Natural phytochemicals, including red wine polyphenols, appear to be very promising substances to block, reverse, retard or prevent the process of carcinogenesis (Russo, 2007). Many epidemiological studies have found that regular intake of red wine or red wine polyphenols has positive effects on human health. Therefore, determination of the chemical composition, polyphenols content and antioxidant activity of red wine could be very useful for the interpretation of epidemiological studies.
Phenolic antioxidants define total antioxidant potential of wines and have the greatest influence on it. Authors showed that in grape seeds gallic acid, catechins and epicatechins prevailed, whereas in peel ellagic acid, quercetin and trans-resveratrol were most common.
* Corresponding Author
www.intechopen.com
Macro to Nano Spectroscopy 358
The high antioxidant potential of red wines can be ascribed to the synergistic effect of the mixture of natural phenolic antioxidants (Lopez-Velez et al., 2003).
Production technology is one of the main factors influencing the high antioxidant potential of red wines (Downey et al., 2006; Vršič et al., 2009). During winemaking the grape pulp is fermented, and fruit peel and seeds are very rich in phenolic antioxidants. The concentration of polyphenols in peel is higher than in the flesh (Darias-Martin et al., 2000; Fuhrman et al., 2001). During intensive pressing or during long contact of juice with pulp the content of phenolic compounds increases rapidly (Fuhrman et al., 2001). It was found that in wines fermented with peel the concentration of phenolic antioxidants was 2 times higher than in wines fermented without peel (Darias Martin et al., 2000).
Antioxidant potential and polyphenol composition were assessed in wine of Croatian origin (Katalinic et al., 2004). The concentration of total polyphenols in red wines ranged from 2200 to 3200 mg gallic acid per litter (mg GA/L).
In winemaking, phenolic antioxidants are extracted from berry skins, seeds and stems during crushing and fermentation. Due to the market demand, knowledge of the concentration of phenolic antioxidants in wine and their antioxidant potential is very important.
Wine, especially red wine, is a very rich source of flavonol quercetin and many others polyphenols. Various methods for characterisation of total antioxidant potential are presently in routine use, although some are non-stoichiometric (Alimelli et al., 2007; Campanella et al., 2004; Careri et al., 2003; Carralero Sanz et al., 2005; De Beer et al., 2005; Fernandez-Pachon et al., 2004; Giovanelli, 2005; Gomez-Alonso et al., 2007; Magalhaes et al., 2009; Makris et al., 2003; Malovana et al, 2001; Mozetič et al., 2006; Prior et al., 2005; Prosen et al., 2007; Recamales et al., 2006; Spigno De Faveri, 2007; Staško et al., 2008; Weingerl et al., 2009; Woraratphoka, 2007). Some of these methods allow for rapid characterization of wines, and allow for evaluation of synergistic effects of various wine components, e.g. transition metals (Strlič et al., 2002), which can have pro-oxidative effects in a mixture with phenolic compounds. The results of such analyses are usually given in equivalents of gallic acid or other reference compounds. Among these methods, determination of total phenolic content using the Folin-Ciocalteu reagent, as described by Singleton and Rossi (Singelton Rossi, 1965), is very common.
Considering the accumulated knowledge on the effect of phenolic antioxidants on human health and the resulting market requirements it is highly important to have well developed, robust and established methods for their determination (Minussi et al., 2003; Urbano-Cuadrado et al., 2004).
In this study we compared three analytical methods: high pressure liquid chromatography (HPLC) with UV-vis detection, UV-vis spectrophotometry and chemiluminometry.
For separation and determination of phenolic acids and flavonoids, HPLC is the established technique (Nave et al., 2007; Rodriguez-Delgado et al., 2001; Spranger et al., 2004; Vitrac et al., 2002). The chromatographic conditions include the use of, almost exclusively, a reversed phase C18 column; UV-vis diode array detector, and a binary solvent system containing acidified water and a polar organic solvent (Tsao Deng, 2004).
www.intechopen.com
A Comparative Study of Analytical Methods for Determination of Polyphenols in Wine by HPLC/UV-Vis, Spectrophotometry and Chemiluminometry 359
With use of HPLC we can reach separation of non-stabile and heavy volatile analytes on the base of different chemical interactions of the analytes with mobile phase and stationary phase. We use a non-polar stationary and polar mobile phase (reversed phase chromatography). HPLC with UV-visible detection was used for determination of antioxidant compounds content of gallic acid, (+)-catechin, (-)-epicatechin, trans-resveratrol, cis-resveratrol and quercetin in numerous wine samples. The selected phenolic compounds are the most important wine antioxidants. Gallic acid, the main hydroxybenzoic acid in red wines, is a very potent antioxidant with three free hydroxyl groups. Because of the relatively slow extraction of gallic acid from grape seeds, higher concentrations are obtained with longer maceration times, which is characteristic for red wines. As the most important flavonol, quercetin was also included in our research.
Spectrophotometric determination of total antioxidant potential (TAPSP) was performed with oxidation of phenolic compounds with Folin-Ciocalteu reagent after spectrophotometric method, described by Singelton in Rossi. Gallic acid was used as modelling solution.
Chemiluminometric determination of polyphenols was another possibility for evaluation of the total antioxidant potential in wine. Chemiluminescence, the emission of light as a consequence of relaxation of kind, which it is evoked between chemical reactions, has become very useful technique for studying oxidation of organic materials (Costin et al., 2003; Garcia-Campana Baeyens, 2001; Hötzer et al., 2005; Kočar et al., 2008; Kuse et al., 2008). ABEL® (analysis by emitted light) antioxidant test kit, which contains photo protein Pholasin®, was used. Photo protein Pholasin® is the protein-bound luciferin from the bivalve mollusc Pholas dactylus, which reacts with luciferase and molecular oxygen to produce light (Knight, 1997; Michelson, 1978; Roberts et al., 1987). In reaction system substrate-catalyser-oxidant we can therefore inhibit occurrence of chemiluminescence with antioxidants. If there are antioxidants in the sample capable of scavenging superoxide, then these antioxidants will compete with Pholasin® for the superoxide and less light will be detected. Control samples containing no antioxidants were running with each assay. With measuring of decrease of intensity of chemiluminescence we evaluate total antioxidant potential (TAPCL) of the sample (Hipler Knight, 2001)..
The reactions of Pholasin® have been studied extensively (Dunstan et al., 2000; Müller et al., 1989; Reichl et al., 2000). It was found to have a 50- to 100-fold greater sensitivity towards superoxide than luminol. In addition, the decay of the Pholasin® chemiluminescent product was more rapid than that of the luminol product, leading to a greater accuracy in real-time kinetic studies. For these reasons, Pholasin® offers several advantages over luminol (Roberts et al., 1987). The luminescence of Pholasin® elicited with luciferase has a maximum at 490 nm, and that with Fe2+ shows a maximum at 484 nm (Shimomura, 2006).
In addition, we compared the results of the chromatographic method with those obtained using the spectrophotometric and chemiluminometric method.
In order to evaluate their potential individual contributions to TAP, phenolic antioxidants were analysed as pure solutions in the same concentration. The order of contributions of individual phenolic antioxidants to TAP determined according to spectrophotometric method was different than those determined with chemiluminometric method. Generalised, cis-resveratrol has the biggest contribution to TAP, following by trans-resveratrol, (-)-
www.intechopen.com
Macro to Nano Spectroscopy 360
epicatechin, (+)-catechin and quercetin. Interesting, gallic acid, as modelling solution by spectrophotometric determination of TAPSP, shows the lowest contribution to TAP.
2. Experimental
137 wine samples (73 red, 54 white and 10 rosé wines) were purchased from wineries and directly analysed. Most of the red wine samples were from grape varieties Blue Frankish, Merlot, Cabernet Sauvignon, Pinot Noir, Refošk and Barbera. Cviček was used in the study as a typical Slovenian mixture of red and white wines, whereas from among the white wines, most samples were from grape varieties Welsh Riesling, Chardonnay, Traminer, Rhine Riesling, Yellow Muscat and Sauvignon. Vintages ranged from 1997 to 2006.
2.1 HPLC- UV/VIS method
The HPLC system Waters 600E was composed of isocratic pump W600, autosampler and Waters 996 photodiode array detector. The HPLC column Synergi Hydro RP 150 × 4.6 mm, 4 µm (Phenomenex, Torrance, California, USA) was used at 35 °C. Wavelengths of detection: (+)-catechin and (-)-epicatechin 210 nm, quercetin 253 nm, gallic acid 278 nm and trans-resveratrol 303 nm. Gallic acid, (+)-catechin hydrate, (-)-epicatechin, trans-resveratrol and quercetin dihydrate were purchased from Sigma-Aldrich (St. Louis, USA). All reagents and standards were prepared using Milli Q deionized water (Millipore, Bedford, USA).
The experimental conditions were: mobile phase A: 0.1% H3PO4; mobile phase B: MeOH; gradient elution: 0 min 90% A, 10% B; 15 min 78% A, 22% B; 25 min 50% A, 50% B; 34 min 34% A, 66% B; 35 min 90% A, 10% B for reconditioning of the system (8min); flow rate: 1.0 mL/min; injection volume: 50 μL; MeOH and ortophosphoric acid were HPLC-grade (Fluka, St. Gallen, Suisse) and were filtered and degassed before their use. The wine samples were diluted ten times with the respective mobile phases described above.
Stock solutions of standards were diluted in the mobile phase to obtain working standard solutions. Concentrations of the analytes were calculated from chromatogram peak areas on the basis of calibration curves. The method linearity was assessed by means of linear regression of the mass of analyte injected vs. its peak area. The repeatability was expressed as standard deviation (SD) of three separate determinations.
Typical standard deviations for determinations of the sum of phenolic antioxidants determined using HPLC/UV-vis were 0.015 mmol/L for red wines, 0.004 mmol/L for rosé and 0.050 mmol/L for white wines.
2.2 Spectrophotometry
Spectrophotometric determination of total antioxidant potential (TAPSP) was performed according to the Singleton-Rossi procedure (Singelton Rossi, 1965). TAPSP of an antioxidant sample was estimated by measuring its reducing capacity with the Folin-Ciocalteu reagent using a spectrophotometer. The Folin-Ciocalteu reagent is a mixture of phosphowolframic acid (H3PW12O40) and phosphomolybdenic acid (H3PMo12O40), the absorbance of which was measured after the reaction at 765 nm using a Cary 1E spectrophotometer (Varian, California, USA). The Folin–Ciocalteu reagent was purchased from Merck (Darmstadt, Germany). It contains sodium tungstate, sodium molybdate,
www.intechopen.com
A Comparative Study of Analytical Methods for Determination of Polyphenols in Wine by HPLC/UV-Vis, Spectrophotometry and Chemiluminometry 361
ortophosphoric acid, hydrochloric acid, lithium sulphate, bromine, hydrogen peroxide (Folin Ciocalteu, 1927).
Briefly, 25 µL of a red and rosé wine sample or 250 µL of a white wine sample, 15 mL of distilled water, 1.25 mL of the diluted (1:2) Folin–Ciocalteu reagent, 3.75 mL of a sodium carbonate solution (20%) were mixed and distilled water was added to make up the total volume of 25 mL. The solution was agitated and left to stand for 120 min at room temperature for the reaction to take place. The calibration curve was prepared with gallic acid solutions in the concentration range from 0 to 1000 mg/L. The results are expressed as mmol gallic acid per litter (gallic acid equivalents - GAE).
The results for standards were highly reproducible (calibration curve squared regression coefficient >0.9993). All determinations were performed in triplicates. Typical standard deviation for spectrophotometric determinations of total phenolic content (TAPSP) was 0.10 mmol/L for red wines, 0.09 mmol/L for rosé and 0.02 mmol/L for white wines.
2.3 Chemiluminometry
The Abel®-21 M2 antioxidant test kit (Knight Scientific Limited, Plymouth, UK) was used for chemiluminometric determination of total antioxidant potential (TAPCL). Superoxide, generated in a tube containing Pholasin® with and without a sample of wine with unknown antioxidant potential leads to appearance of chemiluminescence, which was measured using a micro plate luminometer model Lucy (Anthos Labtec Instruments, Wals, Austria). Pholasin® is a bioluminescent photo protein of Pholas dactylus, which is a marine, rock-boring, bivalve mollusc. Antioxidant test kit used contains assay buffer (pH 7.2).
The Antioxidant Test procedure for Superoxide is provided by the supplier of the test kit (Hipler and Knight, 2001). The amount of sample was optimised to obtain not more than 90% and typically 50% signal inhibition. This signal was then corrected for sample dilution: 10 µL of sample was used, however, red wines and rosé wines were first diluted with water (1:10) while white wines were not.
The results are calculated as TAPCL, expressed as % signal inhibition. Typical measurement uncertainty was 0.024 mmol/L for red wines, 0.016 mmol/L for rosé and 0.002 mmol/L for white wines.
2.4 Statistical analysis
Measurements are expressed as means ± standard deviations (SD) for three replicate determinations. Multivariate analysis was performed using SPSS 17.0 for Windows (SPSS Inc., Chicago, USA). As a typical data reduction and visualisation technique, principal component analysis (PCA) was used.
3. Results and discussion
Comparison of determinations of total antioxidant potential in different wines was performed with spectrophotometric and chemiluminometric method, while comparison of antioxidant compounds content in the same samples was performed using HPLC with UV/VIS detection.
www.intechopen.com
Macro to Nano Spectroscopy 362
Sum of phenolic compounds, determined using HPLC with UV-vis detection, summarized six manly phenolic compounds (gallic acid, (+)-catechin, (-)-epicatechin, trans-resveratrol, cis-resveratrol and quercetin). Regarding the knowledge about the influence of phenolic antioxidants on human health, selected phenolic compounds are the most important antioxidants of red wines. Gallic acid, the main hydroxybenzoic acid in red wines, is with three free hydroxyl groups a very strong antioxidant. Because of relative slow extraction of gallic acid from grape seeds, we obtain higher concentrations with longer maceration time, which is characteristic for red wines. In the group of non-flavonoid phenols we analysed also the main representative of stilbenes – resveratrol. Resveratrol (3,5,4'-trihydroxystilbene) is present in wine in four forms; we ware determining trans-resveratrol and cis-resveratrol. In the group of flavonoid phenols we choose isomers (+)-catechin and (-)-epicatechin, more specific, flavan-3-ols. As most important flavonol we include in our research quercetin. Chemically are flavonols 3-glycosides.
Relative good correlation is result between sum of phenolic compounds determined with HPLC/UV-vis and spectrophotometric determinations of total antioxidant potential TAPSP (r2 = 0.91) (Weingerl et al., 2009).
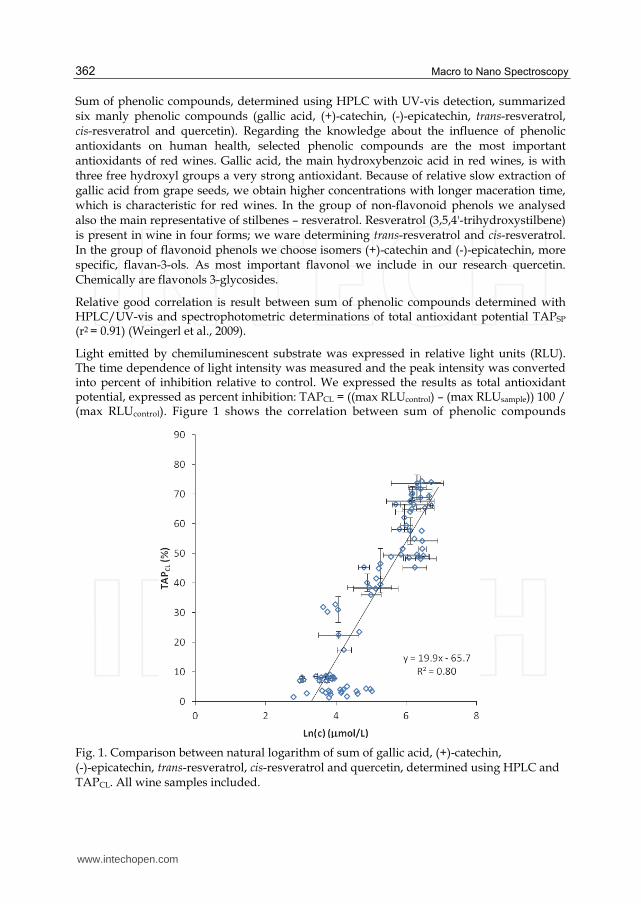
Light emitted by chemiluminescent substrate was expressed in relative light units (RLU). The time dependence of light intensity was measured and the peak intensity was converted into percent of inhibition relative to control. We expressed the results as total antioxidant potential, expressed as percent inhibition: TAPCL = ((max RLUcontrol) – (max RLUsample)) 100 / (max RLUcontrol). Figure 1 shows the correlation between sum of phenolic compounds
Fig. 1. Comparison between natural logarithm of sum of gallic acid, (+)-catechin, (-)-epicatechin, trans-resveratrol, cis-resveratrol and quercetin, determined using HPLC and TAPCL. All wine samples included.
www.intechopen.com
A Comparative Study of Analytical Methods for Determination of Polyphenols in Wine by HPLC/UV-Vis, Spectrophotometry and Chemiluminometry 363
determined with HPLC/UV-vis and total antioxidant potential TAPCL determined with chemiluminometry.
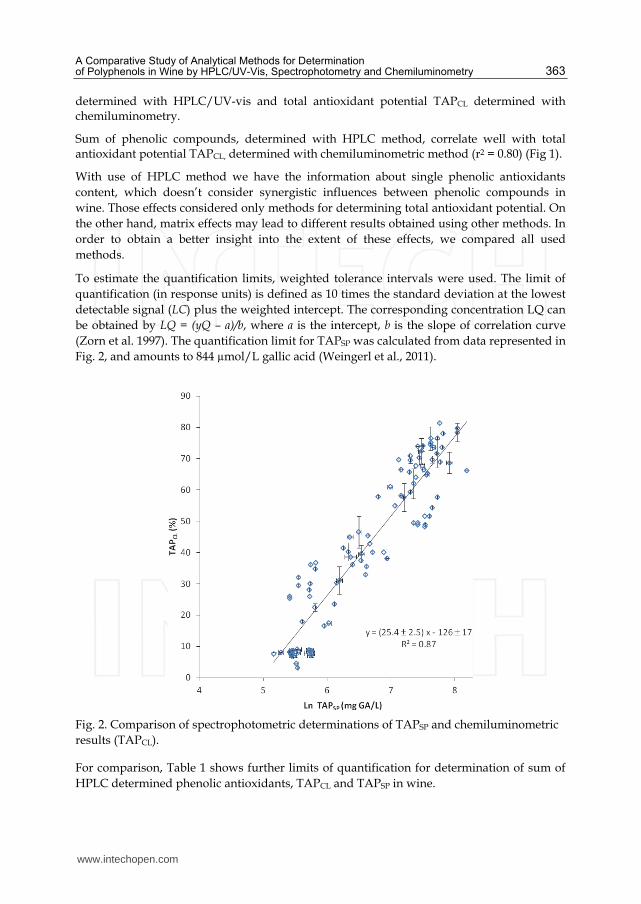
Sum of phenolic compounds, determined with HPLC method, correlate well with total antioxidant potential TAPCL, determined with chemiluminometric method (r2 = 0.80) (Fig 1).
With use of HPLC method we have the information about single phenolic antioxidants content, which doesn’t consider synergistic influences between phenolic compounds in wine. Those effects considered only methods for determining total antioxidant potential. On the other hand, matrix effects may lead to different results obtained using other methods. In order to obtain a better insight into the extent of these effects, we compared all used methods.
To estimate the quantification limits, weighted tolerance intervals were used. The limit of quantification (in response units) is defined as 10 times the standard deviation at the lowest detectable signal (LC) plus the weighted intercept. The corresponding concentration LQ can be obtained by LQ = (yQ – a)/b, where a is the intercept, b is the slope of correlation curve (Zorn et al. 1997). The quantification limit for TAPSP was calculated from data represented in Fig. 2, and amounts to 844 µmol/L gallic acid (Weingerl et al., 2011).
Fig. 2. Comparison of spectrophotometric determinations of TAPSP and chemiluminometric results (TAPCL).
For comparison, Table 1 shows further limits of quantification for determination of sum of HPLC determined phenolic antioxidants, TAPCL and TAPSP in wine.
www.intechopen.com
Macro to Nano Spectroscopy 364
Method LOQ Unit
Chemiluminometric method 32 µmol/L ascorbic acid
Sum HPLC/UV-vis 27 µmol/L
Spectrophotometric method 844 µmol/L gallic acid
Table 1. Limits of quantification (LOQ) for determination of polyphenols in wine.
As it is evident from Table 1, the chemiluminometric method exhibits similar quantification limits to the HPLC method for the determination of the sum of gallic acid, (+)-catechin, (-)-epicatechin, trans-resveratrol, cis-resveratrol and quercetin in wines (32 µmol/L). This is much lower quantification limit comparable with the spectrophotometric method, for the determination of total polyphenols, expressed in µmol/L of gallic acid.
Like total antioxidant potential determined with spectrophotometric or chemiluminometric method, like sum of six determined phenolic compounds are higher by red wines than white wines, rosé wines are giving intermediate results.
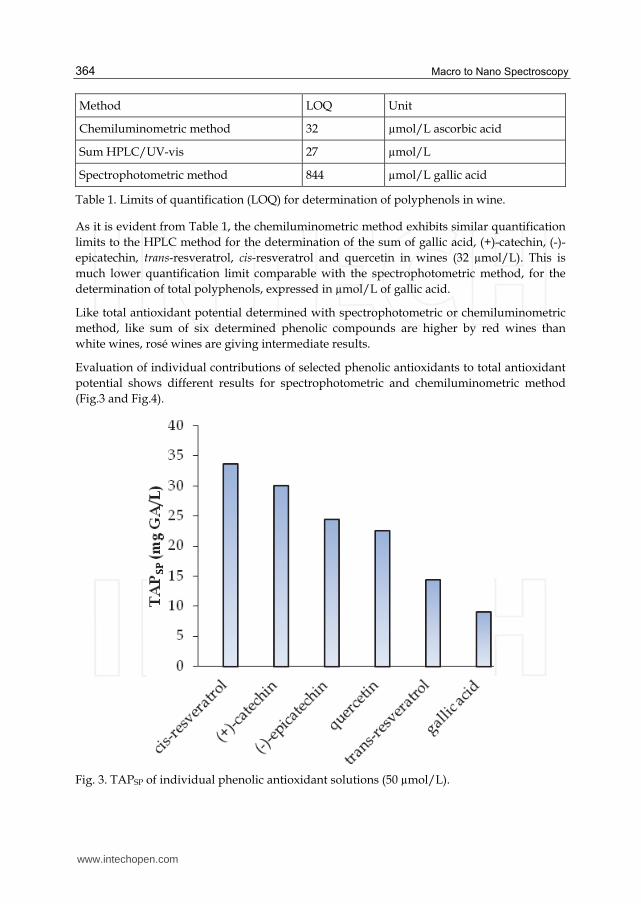
Evaluation of individual contributions of selected phenolic antioxidants to total antioxidant potential shows different results for spectrophotometric and chemiluminometric method (Fig.3 and Fig.4).
Fig. 3. TAPSP of individual phenolic antioxidant solutions (50 µmol/L).
www.intechopen.com
A Comparative Study of Analytical Methods for Determination of Polyphenols in Wine by HPLC/UV-Vis, Spectrophotometry and Chemiluminometry 365
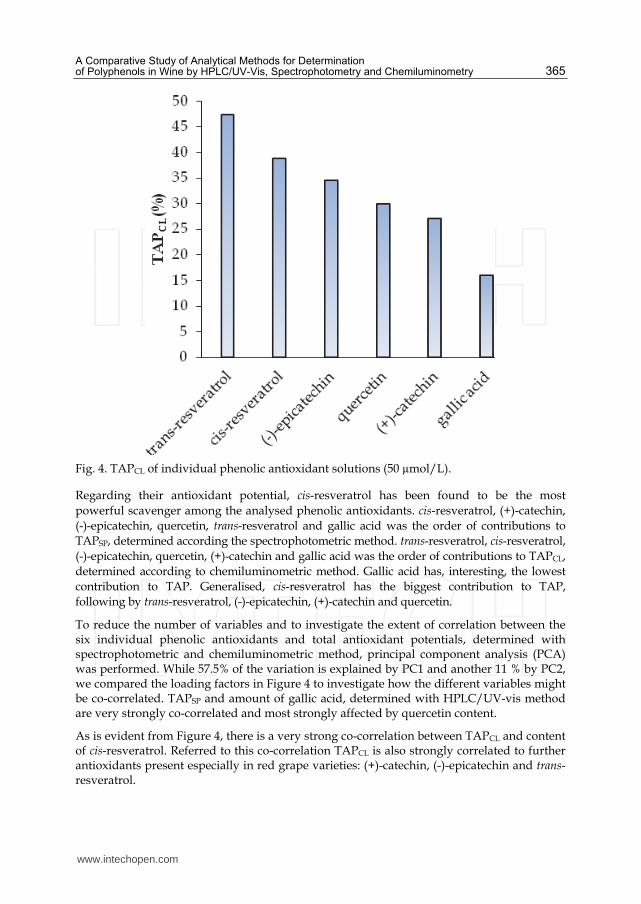
Fig. 4. TAPCL of individual phenolic antioxidant solutions (50 µmol/L).
Regarding their antioxidant potential, cis-resveratrol has been found to be the most powerful scavenger among the analysed phenolic antioxidants. cis-resveratrol, (+)-catechin, (-)-epicatechin, quercetin, trans-resveratrol and gallic acid was the order of contributions to TAPSP, determined according the spectrophotometric method. trans-resveratrol, cis-resveratrol, (-)-epicatechin, quercetin, (+)-catechin and gallic acid was the order of contributions to TAPCL, determined according to chemiluminometric method. Gallic acid has, interesting, the lowest contribution to TAP. Generalised, cis-resveratrol has the biggest contribution to TAP, following by trans-resveratrol, (-)-epicatechin, (+)-catechin and quercetin.
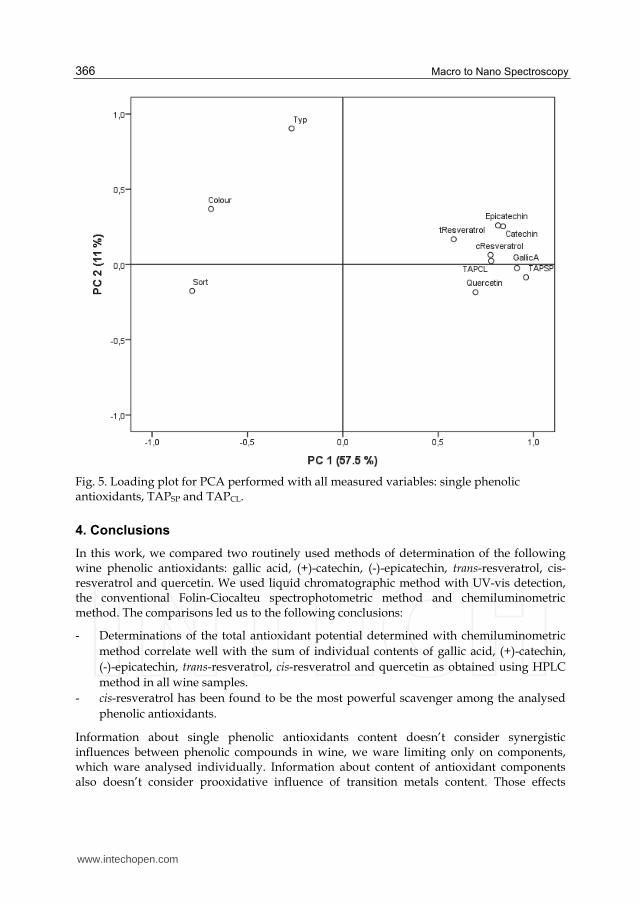
To reduce the number of variables and to investigate the extent of correlation between the six individual phenolic antioxidants and total antioxidant potentials, determined with spectrophotometric and chemiluminometric method, principal component analysis (PCA) was performed. While 57.5% of the variation is explained by PC1 and another 11 % by PC2, we compared the loading factors in Figure 4 to investigate how the different variables might be co-correlated. TAPSP and amount of gallic acid, determined with HPLC/UV-vis method are very strongly co-correlated and most strongly affected by quercetin content.
As is evident from Figure 4, there is a very strong co-correlation between TAPCL and content of cis-resveratrol. Referred to this co-correlation TAPCL is also strongly correlated to further antioxidants present especially in red grape varieties: (+)-catechin, (-)-epicatechin and trans-resveratrol.
www.intechopen.com
Macro to Nano Spectroscopy 366
Fig. 5. Loading plot for PCA performed with all measured variables: single phenolic antioxidants, TAPSP and TAPCL.
4. Conclusions
In this work, we compared two routinely used methods of determination of the following wine phenolic antioxidants: gallic acid, (+)-catechin, (-)-epicatechin, trans-resveratrol, cis-resveratrol and quercetin. We used liquid chromatographic method with UV-vis detection, the conventional Folin-Ciocalteu spectrophotometric method and chemiluminometric method. The comparisons led us to the following conclusions:
- Determinations of the total antioxidant potential determined with chemiluminometric method correlate well with the sum of individual contents of gallic acid, (+)-catechin, (-)-epicatechin, trans-resveratrol, cis-resveratrol and quercetin as obtained using HPLC method in all wine samples.
- cis-resveratrol has been found to be the most powerful scavenger among the analysed phenolic antioxidants.
Information about single phenolic antioxidants content doesn’t consider synergistic influences between phenolic compounds in wine, we ware limiting only on components, which ware analysed individually. Information about content of antioxidant components also doesn’t consider prooxidative influence of transition metals content. Those effects
www.intechopen.com
A Comparative Study of Analytical Methods for Determination of Polyphenols in Wine by HPLC/UV-Vis, Spectrophotometry and Chemiluminometry 367
considered both described methods for determining total antioxidant potential (TAPSP and TAPCL), on which indicates quality of correlation determining according to these two methods.
- PCA was applied to investigate the correlations between TAPSP, TAPCL and individual phenolic antioxidants and especially good co-correlation was found with TAPCL and cis-resveratrol. TAPSP and amount of gallic acid, determined with HPLC method are very strongly co-correlated and most strongly affected by quercetin content.
If we consider content of individually determined phenolic antioxidants and not only antioxidative capacity of wine, we may use only HPLC method with UV-vis detection.
5. Acknowledgements
I offer my regards and blessings to all of those precious people who supported me in any respect during my academic growth.
6. References
Alimelli, A., D. Filippini, R. Paolesse, S. Moretti, G. Ciolfi, A. D'Amico, I. Lundström, C. Di Natale. (2007). Direct quantitative evaluation of complex substances using computer screen photo-assisted technology: the case of red wine. Anal. Chim. Acta, 597, 103-112.
Briviba, K., L. Pan and G. Rechkemmer. (2002). Red wine polyphenols inhibit the growth of colon carcinoma cells and modulate the activation pattern of mitogen-activated protein kinases. The Journal of Nutrition. 132, 2814-2818.
Campanella, L., A. Bonanni, E. Finotti, M. Tomassetti. (2004). Biosensors for determination of total antioxidant capacity of phytotherapeutic integrators: comparison with other spectrophotometric, fluorimetric and voltammetric methods. Biosens. Bioelectr. 19, 641-651.
Careri, M., C. Corradini, L. Elviri, I. Nicoletti, and I. Zagnoni. (2003). Direct HPLC Analysis of Quercetin and trans-Resveratrol in Red Wine, Grape, and Winemaking Byproducts, J. Agric. Food Chem. 51, (18), 5226-5231.
Carralero Sanz, V., M. Luz Mena, A. González-Cortés, P. Yáñez-Sedeño, J. M. Pingarrón. (2005). Development of a tyrosinase biosensor based on gold nanoparticles-modified glassy carbon electrodes. Application to the measurement of a bioelectrochemical polyphenols index in wines, Anal. Chim. Acta, 528, 1-8.
Cooper, K. A., M. Chopra and D.I. Thurnham. (2004). Wine polyphenols and promotion of cardiac health. Nutrition Research Reviews, 17, 111-129.
Costin, J. W., N. W. Barnett, S. W., Lewis, D. J., McGillivery. (2003). Monitoring the total phenolic/antioxidant levels in wine using flow injection analysis with acidic potassium permanganate chemiluminescence detection. Anal. Chim. Acta. 499, 47-56.
Darias-Martin, J.J., O. Rodrigues, E. Diaz, R.M. Lamuela-Raventos. (2000). Effect of skin contact on the antioxidant phenolics in white wine. Food Chemistry, 71, 483-487.
De Beer, D., E. Joubert, W.C.A. Gelderblom, M. Manley. (2005). Changes in the Phenolic Composition and Antioxidant Activity of Pinotage, Cabernet Sauvignon, Chardonnay and Chenin blanc Wines During Bottle Ageing Food Chem. 90, 569-577.
www.intechopen.com
Macro to Nano Spectroscopy 368
Downey, M.O., N.K. Dokoozlian, M.P. Krstic. (2006). Cultural practice and environmental impacts on the flavonoid composition of grapes and wine: A review of recent research. Am. J. Enol. Vitic. 57, 257-268.
Dunstan, S. L., G. B. Sala-Newby, A. B. Fajardo, K. M. Taylor, and A. K. Campbell. (2000). Cloning and expression of the bioluminescent photoprotein pholasin from the bivalve mollusc Pholas Dactylus. J. Biol. Chem. 275, 9403.
Fernandez-Pachon, M. S., D. Villano, M.C. Garcia-Parrilla & A.M. Troncoso. (2004). Antioxidant activity of wines and relation with their polyphenolic composition. Analytica Chimica Acta, 513, 113-118.
Folin, O., V. Ciocalteu. (1927). On tyrosine and tryptophane determinations in proteins. J. Biol. Chem. 73, 627-650.
Fuhrman, B., N. Volkova, A. Suraski, M. Aviram. (2001). White wine with red winelike properties: increased extraction of grape skin polyphenols improves the antioxidant capacity of the derived white wine. Journal of Agricultural and Food Chemistry 49 (7), 3164-3168.
Garcia-Campana, A. M., and W. R. G. E. Baeyens. (2001). Chemiluminescence in Analytical Chemistry, Marcel Dekker, New york.
Giovanelli, G. (2005). Evaluation of the antioxidant activity of red wines in relationship to their phenolic content. Italian Journal of Food Science, 17, 381-393.
Gómez-Alonso, S., E. García-Romero, I. Hermosín-Gutiérrez. (2007). HPLC analysis of diverse grape and wine phenolics using direct injection and multidetection by DAD and fluorescence. J. Food Comp. Anal. 20, 618-626.
Hipler, B., and J. Knight. (2001). ABEL® Antioxidant test kit with Pholasin® for Vitamin C type antioxidants. Knight Scientific Ltd., Application note 108.
Hötzer, A. K., C. Henriquez, E. Po, S. Miranda-Rottmann, A. Aspillaga, F. Leighton, E. Lissi. (2005). Antioxidant and prooxidant effects of red wine and its fractions on Cu(II) induced LDL oxidation evaluated by absorbance and Chemiluminescence measurements. Free radical research. 39, 2, 175-183.
Katalinic, V., M. Milos, D. Modun, I. Music, M. Boban. (2004). Antioxidant effectiveness of selected wines in comparison with (+)-catechin. Food Chemistry. 86, 593-600.
King, R. E., J.A. Bomser and D.B. Min. (2006). Bioactivity of resveratrol. Comprehensive Reviews in Food Science and Food Safety. 5, 65-70.
Knight, J. (1997). The piddock and the immunologist. Immunol. News. 4, 26. Kočar, D., M. Strlič, J. Kolar, V. S. Šelih, and B. Pihlar. (2008). Peroxide-related
chemiluminescence of cellulose and its auto-absorption. Polymer Degradation and Stability. 93, 263-267.
Kuse, M., E. Tanaka, and T. Nishikawa. (2008). Pholasin luminescence is enhanced by addition of dehydrocoelenterazine. Bioorganic and Medicinal Chemistry Letters. 18, 5657-5659.
Lopez-Velez, M., F. Martinem-Martinez, C. Dell Valle-Ribes. (2003). The study of phenolic compounds as natural antioxidants in wine. Critical Reviews in Food Science and Nutrition. 43, 3, 233-244.
Magalhães, L.M., M. Santos, M. A. Segundo, S. Reis, J.L.F.C. Lima. (2009). Flow injection based methods for fast screening of antioxidant capacity. Talanta. 77, 5, 1559-1566.
www.intechopen.com
A Comparative Study of Analytical Methods for Determination of Polyphenols in Wine by HPLC/UV-Vis, Spectrophotometry and Chemiluminometry 369
Makris,D. P., E. Psarra, S. Kallithraka, P. Kefalas. (2003). The effect of polyphenolic composition as related to antioxidant capacity in white wines. Food Res. Int. 36, 805-814.
Malovana, S., F. J. Montelongo Garcia, J. P. Perez, and M. A. Rodriguez-Delgado. (2001). Optimisation of sample preparation for the determination of trans-resveratrol and other polyphenolic compounds in wines by high performance liquid chromatography. Anal. Chim. Acta. 428, 245-253.
Michelson, A. M. (1978). Purification and properties of Pholas dactylus luciferin and luciferase. In: DeLuca MA ed) Methods in Enzymology, Academic Press, London 57, 385.
Minussi, R.C., M. Rossi, L. Bologna, L. Cordi, D. Rotilio, G. M. Pastore. (2003). Phenolic compounds and total antioxidant potential of commercial wines. Food Chem. 82, 409-416.
Mozetič, B., I. Tomažič, A. Škvarč, P. Trebše. (2006). Determination of polyphenols in white grape berries cv. Rebula. Acta chim. slov. 53, 58-64.
Müller, T., E. V. Davies, and A. K. Campbell. (1989). Pholasin chemiluminescence detects mostly superoxide anion released from activated human neutrophils. J. Biolumin. Chemilumin. 3, 105.
Nave, F., M. João Cabrita, C. T. Da Costa. (2007). Use of solid-supported liquid-liquid extraction in the analysis of polyphenols in wine. J. Chromatogr. A. 1169, 23-30.
Opie, L. H. and S. Lecour. (2007). The red wine hypothesis: from concepts to protective signalling molecules. Eur. Heart J. 28, 14, 1683-1693.
Paixao, N., R. Perestrelo, J.C. Marques & J.S. Camara. (2007). Relationship between antioxidant capacity and total phenolic content of red, rose and white wines. Food Chemistry, 105, 204-214.
Prior, R. L., X. Wu, and K. Schaich. (2005). Standardized Methods for the Determination of Antioxidant Capacity and Phenolics in Foods and Dietary Supplements. J. Agric. Food Chem. 53, 4290-4302.
Prosen, H., D. Kočar, M. Strlič, and D. Rusjan. (2007). In vino veritas: LC-MS in wine analysis. LC-GC Eur. 20, 617-621.
Rastija, V., G. Srečnik & M. Medić-Šarić. (2009). Polyphenolic composition of Croatian wines with different geographical origins. Food Chemistry, 115, 54-60.
Recamales, A. F., A. Sayago, M. L. González-Miret, D. Hernanz. (2006). The effect of time and storage conditions on the phenolic composition and colour of white wine. Food Res. Int. 39, 220-229.
Reichl, S., J. Arnhold, J. Knight, J. Schiller, and K. Arnold. (2000). Reactions of Pholasin with peroxidases and hypochlorous acid. Free Radical Biol. Med. 28, 1555.
Roberts, P. A., J. Knight, A. K. Campbell. (1987). Pholasin: a bioluminescent indicator for detecting activation of single neutrophils. Anal. Biochem. 160, 139-148.
Rodríguez-Delgado, M.A., S. Malovaná, J. P. Pérez, T. Borges, F. J. García Montelongo. (2001). HPLC-analysis of polyphenolic compounds in spanish red Wines and determination of their antioxidant activity by Radical scavenging assay. J. Chromatogr. A 912, 249-25.
Russo, G. L. (2007). Ins and outs of dietary phytochemicals in cancer chemoprevention. Biochemical Pharmacology. 74, 533-544.
www.intechopen.com
Macro to Nano Spectroscopy 370
Santos-Buelga, C. And A. Scalbert. (2000). Proanthocyanidins and tannin-like compounds-nature, occurrence, dietary intake and effects on nutrition and health. Journal of the Science of Food and Agriculture. 80, 1094-1117.
Shimomura, O. (2006). Bioluminescence: chemical principles and methods. World Scientific Publishing, New Jersey, USA.
Singleton, V. L., and J. A. Rossi. (1965). Colorimetry of total phenolics with phosphomolybdic-phosphotungstic acid reagents. Am. J. Enol. Vitic. 16, 144.
Spigno, G., D. M. De Faveri, (2007). Assessment of process conditions on the extraction of antioxidants from grape marc. J. Food Eng. 78, 793-801.
Spranger, I.M., C. M. Clímaco, B. Sun, N. Eiriz, C. Fortunato, A. Nunes, C. M. Leandro, M. L. Avelar, P. A. Belchior. (2004). Total polyphenolic compounds contents (TPC), total antioxidant activities (TAA) and HPLC determination of individual polyphenolic compounds in selected Moravian and Austrian wines. Anal. Chim. Acta. 513, 151-161.
Staško, A., V. Brezova, M. Mazur, M. Čertik, M. Kalinak & G. Gescheidt. (2008). A comparative study on the antioxidant properties of Slovakian and Austrian wines. LWT- Food Science and Technology, 41, 2126-2135.
Strlič, M., T. Radovič, J. Kolar, and B. Pihlar. (2002). Anti- and pro-oxidative properties of gallic acid in Fenton-like systems. J. Agric. Food Chem. 50, 6313-6317.
Tsao, R., Z. Deng. (2004). Separation procedures for naturally occurring antioxidant phytochemicals. J. Chrom. B 812, 85-99.
Urbano-Cuadrado, M., M.D. Luque de Castro, P.M. Pérez-Juan, J. García-Olmo, M. A. Gómez-Nieto. (2004). Near infrared reflectance spectroscopy and multivariate analysis in enology Determination or screening of fifteen parameters in different types of wines. Anal. Chim. Acta. 527, 81-88.
Vitrac, X., J. P. Monti, J. Vercauteren, G. Deffieux, J. M. Mérillon. (2002). Direct liquid chromatographic analysis of resveratrol derivatives and flavanonols in wines with absorbance and fluorescence detection. Anal. Chim. Acta. 458, 103-110.
Vršič, S., B. Pulko, J. Valdhuber. (2009). Influence of defoliation on carbohydrate reserves of young grapevines in the nursery. European journal of horticultural science. 74, 5, 218-222.
Weingerl V, M. Strlič, D. Kočar. (2009). Comparison of methods for determination of polyphenols in wine by HPLC-UV/VIS, LC/MS/MS and spectrophotometry. Acta Chim. Slov. 56, 3, 698-703.
Weingerl, V., M. Strlič, D. Kočar. (2011). Evaluation of the chemiluminometric method for determination of polyphenols in wine. Analytical Letters. 44, 1310-1322.
Woraratphoka, J., K. O. Intarapichet, K. Indrapichate. (2007). Phenolic compounds and antioxidative properties of selected wines from the northeast of Thailand. Food Chem. 104, 1485-1490.
Zorn, M. E., R. D. Gibbons, and W. C. Sonzogni. 1997. Weighted least squares approach to calculating limits of detection and quantification by modeling variability as a function of concentration. Anal. Chem. 69 (15), 3069–3075.
www.intechopen.com
Macro To Nano SpectroscopyEdited by Dr. Jamal Uddin
ISBN 978-953-51-0664-7Hard cover, 448 pagesPublisher InTechPublished online 29, June, 2012Published in print edition June, 2012
InTech EuropeUniversity Campus STeP Ri Slavka Krautzeka 83/A 51000 Rijeka, Croatia Phone: +385 (51) 770 447 Fax: +385 (51) 686 166www.intechopen.com
InTech ChinaUnit 405, Office Block, Hotel Equatorial Shanghai No.65, Yan An Road (West), Shanghai, 200040, China
Phone: +86-21-62489820 Fax: +86-21-62489821
In the last few decades, Spectroscopy and its application dramatically diverted science in the direction of brandnew era. This book reports on recent progress in spectroscopic technologies, theory and applications ofadvanced spectroscopy. In this book, we (INTECH publisher, editor and authors) have invested a lot of effortto include 20 most advanced spectroscopy chapters. We would like to invite all spectroscopy scientists to readand share the knowledge and contents of this book. The textbook is written by international scientists withexpertise in Chemistry, Biochemistry, Physics, Biology and Nanotechnology many of which are active inresearch. We hope that the textbook will enhance the knowledge of scientists in the complexities of somespectroscopic approaches; it will stimulate both professionals and students to dedicate part of their futureresearch in understanding relevant mechanisms and applications of chemistry, physics and material sciences.
How to referenceIn order to correctly reference this scholarly work, feel free to copy and paste the following:
Vesna Weingerl (2012). A Comparative Study of Analytical Methods for Determination of Polyphenols in Wineby HPLC/UV-Vis, Spectrophotometry and Chemiluminometry, Macro To Nano Spectroscopy, Dr. Jamal Uddin(Ed.), ISBN: 978-953-51-0664-7, InTech, Available from: http://www.intechopen.com/books/macro-to-nano-spectroscopy/a-comparative-study-of-analytical-methods-for-determination-of-polyphenols-in-wine-by-hplc-uv-vi