Embed Size (px)
Citation preview

AICM 703: RESEARCH METHODS FOR AGRICULTURAL INFORMATION AND COMMUNICATION MANAGEMENT
Acknowledgements
This course was authored by:
Prof. Bockline Omedo Bebe
Department of Animal Sciences
Egerton University, Njoro, Kenya
Email:[email protected], [email protected]
The course was reviewed by:
Dr Edward George Mamati
Jomo Kenyatta University of Agriculture & Technology
Email: [email protected]
The following organisations have played an important role in facilitating the creation of this course:
1. The Association of African Universities through funding from DFID (http://aau.org/)
2. The Regional Universities Forum for Capacities in Agriculture, Kampala, Uganda (http://ruforum.org/)
3. Egerton University, Njoro, Kenya (http://egerton.ac.ke/)
These materials have been released under an open license: Creative Commons Attribution 3.0 Unported License (https://creativecommons.org/licenses/by/3.0/). This means that we encourage you to copy, share and where necessary adapt the materials to suite local contexts. However, we do reserve the right that all copies and derivatives should acknowledge the original author.

Course description
Role and characteristics of research in the development of scientific knowledge; AICM research approaches, Research process; Principles of scientific writing; Quantitative and qualitative research; Development of research proposals and thesis reports; Major areas of research in AICM: Agricultural information user studies, Access to agricultural data, information, and knowledge, Agricultural information retrieval research; Agricultural information systems research, Agricultural communications research; Principles and procedures of Sampling; AICM research data collection; Communicating AICM/agricultural research; Collaborative research project management. Prerequisite: AICM 702: Statistical Methods for AICM
Course aimsThe course Research Methods for AICM aims to impart to postgraduate students prerequisite knowledge, skills, attitude and ethics for systematic execution of research process including research strategy, problem formulation, study designs, data management, statistical modelling and exploration, and scientific reporting of results. The delivery aims at developing analytical thinking in students through comparisons and contrasts in conceptualising, designing, planning and implementing research projects in Agricultural Information and Communication Management.
Learning outcomesBy the completion of this course the students will be able to:
1. Describe the roles and characteristics of research in the development of scientific knowledge and research approaches
2. Describe examples of researchable issues in AICM3. Formulate a research problem and the study objectives, research questions and hypothesis
to guide the study.4. Design conceptual model of the research questions/hypothesis.5. Design qualitative and quantitative research studies and data collection process6. Design data collection and database management 7. Perform statistical modelling and report scientific results appropriately.
Instruction methodology1. Lectures and tutorials2. Case studies of postgraduate research projects, theses and Journal articles3. Group discussions 4. Writing a research project under supervision5. Class presentations 6. Practical use of computer software for database, spread sheet and statistical analysis

Course Outline
1. Research in AICM1.1. Researchable issues in AICM 1.2. Structure of research proposal and thesis
2. Research Process2.1. Components of research process2.2. Research implementation strategy
3. Conceptualisation of Research Problem3.1. Problem tree analysis3.2. Logframe development
4. Formulating Research Objectives, Hypothesis and Research Questions4.1. Research objectives4.2. Research hypothesis and research questions
5. Theoretical Framework and Conceptual Model5.1. Why present theoretical framework and conceptual model5.2. Defining theoretical and conceptual model for research problem
6. Study Designs6.1. Study designs6.2. Sampling techniques6.3. Sample size determination6.4. Randomization process6.5. Blocking and replication concepts
7. Data Collection7.1. Observations for data collection7.2. Questionnaires for data collection7.3. Interviews for data collection7.4. Focus Group Discussion for data collection7.5. Collecting secondary data
8. Data Measurements8.1. Guide to variables to measure in research process8.2. How often to measure the variables

9. Database Management9.1. Data processing 9.2. Principles of database design
10. Data Exploration and Description10.1. Data cleaning10.2. Dealing with outliers and zero values10.3. Checking for normality in dataset10.4. Data transformation options
11. Reporting Results11.1. Presenting tables and figures11.2. Presenting means and p values11.3. Scientific reporting
Assessment Class assignments 10% Research project proposal 15% CATS 15% Final written exam 60%
Course evaluation Process monitoring for every lesson Monkey survey at end of the course

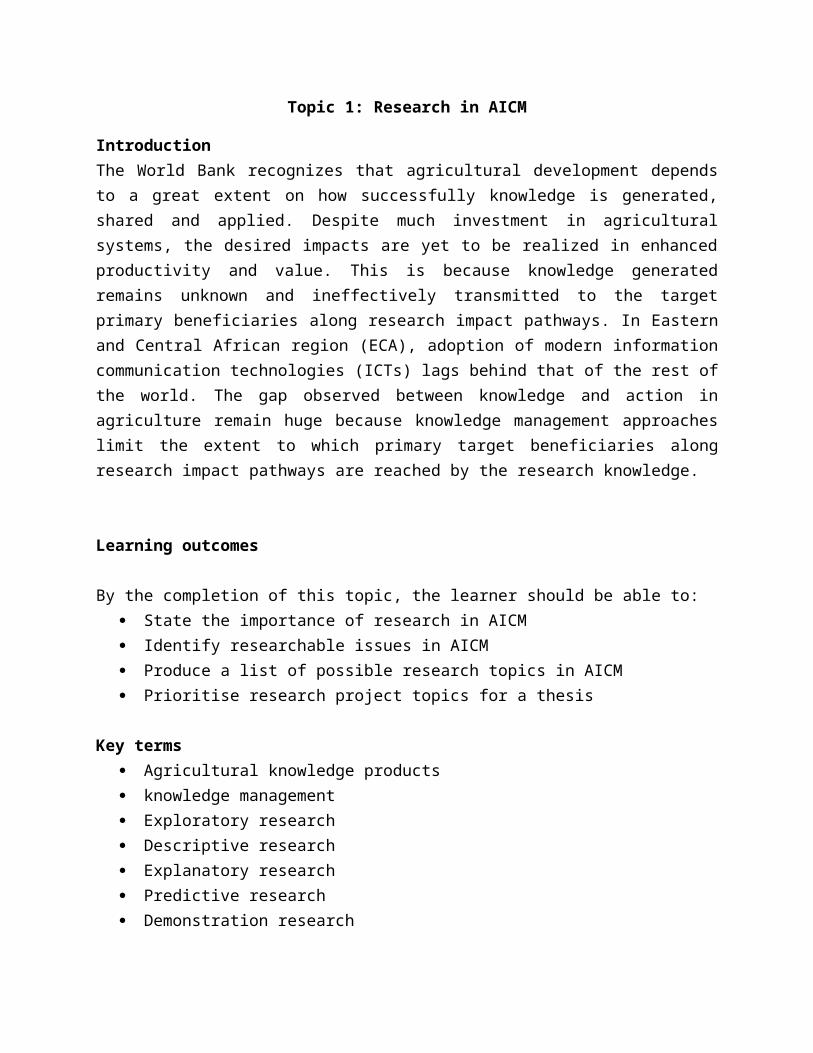
Topic 1: Research in AICM
IntroductionThe World Bank recognizes that agricultural development depends to a great extent on how successfully knowledge is generated, shared and applied. Despite much investment in agricultural systems, the desired impacts are yet to be realized in enhanced productivity and value. This is because knowledge generated remains unknown and ineffectively transmitted to the target primary beneficiaries along research impact pathways. In Eastern and Central African region (ECA), adoption of modern information communication technologies (ICTs) lags behind that of the rest of the world. The gap observed between knowledge and action in agriculture remain huge because knowledge management approaches limit the extent to which primary target beneficiaries along research impact pathways are reached by the research knowledge.
Learning outcomes
By the completion of this topic, the learner should be able to: State the importance of research in AICM Identify researchable issues in AICM Produce a list of possible research topics in AICM Prioritise research project topics for a thesis
Key terms Agricultural knowledge products knowledge management Exploratory research Descriptive research Explanatory research Predictive research Demonstration research
1.1. Researchable Issues in AICMThe role of research in AICM is to generate knowledge products and innovations for application in enhancing sustainable use of resources in agricultural systems, advancing agricultural development and promoting economic growth, fighting poverty, eradicating hunger. Research can bridge the gap between generation and utilization of research information, design use of appropriate communication channels for disseminating targeted agricultural knowledge and improving knowledge management including use of information and communication technology (ICT). The AICM research projects could be on issues of availability, accessibility and applicability of agricultural knowledge.

Types of research in AICM can be classified into exploratory research, descriptive research, explanatory research, predictive research, and demonstration research. Exploratory research can generate knowledge products or innovations. The descriptive research usually is about characterisation of some aspects of AICM. Explanatory research tries to explain observed causality to show how and why a phenomenon operates as it does. The predictive research is empirical approaches that quantify the change in response due to certain factors or intervention. The demonstration research is when research is designed to influence the application of research results and to attain impact. Products of AICM research include scientific knowledge product or an innovation.
The knowledge management and upscaling programme of ASARECA has identified what hampers effective knowledge management in ECA to include:
a. Inadequate analysis of agricultural sector communication stakeholders, their knowledge needs, attitudes and practices to knowledge management
b. Poor identification of the agricultural sector actual and anticipated knowledge products and services;
c. Inadequate mechanisms for capturing, systematizing and sharing available knowledge;d. Use of ineffective media and channels for communicating with different stakeholders;e. Weak monitoring and evaluation of knowledge management systems
1.2 Structure of Research Proposal and Thesis
AICM postgraduate students undertake research as a partial fulfilment of the requirements for the award of a degree and the topic may address solutions to an existing problem or contribute to scientific knowledge. The generic and detailed format of a research proposal and thesis can be found in the library or graduate school. The structure reflects the systematic steps involved in conduction research. The introduction chapter has background information, statement of the problem, the objectives, the research questions or hypotheses corresponding to the specific objectives, the expected outputs. The second chapter is traditionally literature review for the researcher to gain deeper understanding of what is known and is not known including approaches used in studying a related hypothesis or research questions. Literature review is guided by the objectives, the hypothesis or research questions of the study. The third chapter details the methodological approaches and procedures to data collection and data analysis. The next chapters are about results and discussion if in a thesis, otherwise it is about the details or work plan and budget for implementing the research if it is a project proposal. The details of what is involved in preparing these sections are covered in AICM seminar course.
Learning Activities
1. Sampling postgraduate theses and scientific papers to familiarise with the structure and
formats
2. Library and web search for journals of Agricultural Information and Communication and
their publication policies.
3. Interviews and web search for information on the importance of agricultural research
Assignments
From lessons learnt in AICM 701: Fundamental of AICM, identify researchable issues in AICM
Summarise AICM research objectives and topics from interviews with postgraduate students, lecturers, Library staff, the Division of Research and Extension, and from the websites of KARI, ILRI, ICRAF, ASARECA, RUFORUM, FAO
Compare the structure and formats of postgraduate proposals, theses and scientific papers
With use of key words, do an electronic search of journals that publish agricultural information and communication research and for each journal identified summarise research topics and publication policy statements.
From the course AICM 701: Fundamentals of AICM, identify potential areas of research in AICM
Synthesise research topics in MSc AICM theses and indicated where they fall within the areas you identified in 4 above
References and Additional Reading Materials1. AICM 701: Fundamentals of AICM course2. AICM 753: Farming systems and rural livelihoods3. Graduate school guidelines for research proposals and thesis presentations4. MSc and PhD research proposals and theses at the Graduate School.
Useful linkshttp://www.ruforum.org for summary and abstracts of postgraduate research projects


Topic 2: Research Process
Introduction
Research is a process of investigation for the unknown, searching for an answer to a question of concern about something. An investigation is conducted in order to know why things happen, why there are differences between interventions we make, how to explain the observed responses in a system. Research is scientific if investigation in a systematic process that runs through circle with several interdependent steps. Each step has a specific role in contributing to body of existing knowledge.
Learning outcomes
By the completion of this topic, the learner should be able to:a. Recognise the systematic implementation of research processb. Explain components of research processesc. Plan research implementation strategyd. Critique research implementation strategy in postgraduate theses.
Key terms
Research Issue: From personal experience, literature, clients demand, directed by lecturers, informed by collogues
Problem: Study objectives, hypothesis, research questions, theoretical framework, and conceptual framework.
Study designs: Data collection through experiments, observations, surveys. Data management: Variables coding, entry and cleaningData analysis; Descriptive, analytical model, hypothesis testing, interpretation of results,
presentation of resultsReporting: Thesis, journal articles, conference paper, policy brief
2.1. Components of Research Process
Research is a process of scientific investigation implemented in systematic approach. There are interdependent components in both organization and content. Figure 1 illustrates these components and their interdependency.
Research Process Circle
Questions What is known and what is not?
Formulate the problem
Formulate Hypothesis
Plan the project to test the hypothesis
ExperimentationSample data collection
Test statistics on the sample data
Interpretation of results and conclusions
New knowledge generated
Inform others
Scientific paper
The first step in research process is a question about the unknown for which an investigator attempts to understand the present state of knowledge on the issues of concern. The present state of knowledge about the issues can be found from literature about what is already known and documented. The literature review forms the basis for finding out what is known and the gaps in knowledge about the issue of concern.
The gap in knowledge may be sometimes documented in the literature, but often is a result of information synthesis by the investigator. From synthesis of existing information about knowledge of what is known, the investigator identifies the knowledge gap. The knowledge gap forms the basis which to formulate specific problem to study, therefore requires paying attention to details re emphasized in the shaded text below.
• Analyze literature relevant to deeper understanding of the problem • Use the literature to show how your research will contribute to greater
understanding of the subject• Synthesise and summarise the literature in a way that links together and
highlights and resolves conflicts between different approaches• Conduct a critical review to show the reader its relevance to the study.

Specific problem definition informs formulation of the research questions and/or hypotheses that will guide the subsequent process. Research questions and/or hypotheses are the basis for data collection hence the design of research and data collection tools and the materials needed to obtain the relevant data. Data collection for hypothesis testing is a systematic process on its own. It may be by making observations, doing experiment, using field data or interviewing people.
The data obtained through data collection process is subjected to appropriate statistical modeling procedures to obtain information in form of results. The obtained results are evidence on which the investigator interprets and builds a discussion to know why things happen as observed, why there are differences between interventions made, how to explain the observed responses in a system. In other words, results provide the answers to the questions the investigator was concerned about before implementing the research.
The interpretation and discussion of the results is in view of existing body of knowledge. The new knowledge contributed is the value of the research undertaken, therefore must be reported in a way that a wider audience will understand and use or apply.
2.2. Research implementation strategy
Research project must have a goal that direct mode of action with clarity about what is to be done to researcher and partners involved in the implementation of the research. Coherency in activities from the beginning provides researcher with insight into the various steps involved in preparing and implementing the research project. A well thought-out and planned approach is of essence. So what should be prioritized in planning research project?
Research planning has conceptual and technical design issues to deal with. In conceptual design the researcher determines what, why and how much will be studied. These are issues of concepts and have four elements: objective, framework, research issues and definition of concepts. The technical design issues in research are decisions to make about where and when to conduct the research. There are three elements to prioritize: research materials, strategy and planning.
Research objectives are formulated in the context of the problem. Problem definition is informative when specific in order to inform objectives that will be feasible to research on towards finding solutions for or solving the problem. Objectives are therefore a result of delineation of what is possible feasible within the acceptable timeframe and logistics.
Research framework is a schematic visual representation of the steps to be taken to realize the research objectives. This is useful tool to focus the research to its goals.
Research issues are the set of research questions and/or hypotheses to provide useful information for realizing the research objectives. The answers to the research questions and

hypotheses are the information to obtain from conducting research. Formulation of research questions and hypotheses inform data collection and study design necessary for obtaining reliable information to understand the underlying cause of the problem of concern.
Definition of concepts is a delineation process to improve clarity and inform empirical approach to undertake.
Research materials are the subjects needed to generate valuable and reliable information on the problem of concern. Choice of materials has implications on quality of data generated and cost involved in generating that data and does require logistics considerations also.
Research strategy is decision about breadth and depth necessary in achieving the research objectives and the appropriate study design to adopt.
Research planning is timeframe for the specific activities to be performed to achieve the objectives of the research. The table of contents of the research report need come clear at this stage before hand.
Summary
Put simply, research process is the systematic steps of what (research objectives and research issues), how (research materials and research strategy) and when (sequences and periods in which research activities are to be performed). The steps in implementation of research project are:
i. Exploring the context of research and isolating feasible research objectives
ii. Constructing research framework that indicate the individual stages in systematic manner for completion of the research objectives.
iii. Examining what information will be useful or necessary in form of research questions and hypothesis for achieving the research objectives.
iv. Determining key concepts and operationalise definitions in context of the research problem.
v. Examining type of materials needed for each research question and/or hypothesis that is needed to provide reliable data and answers.
vi. Determine research strategy that will guide the implementation process.
vii. Drawing work plan of activities with time frame for implementation.

Learning Activities
1. Interviews and web search for information on the importance of agricultural research
2. Sampling postgraduate theses and scientific papers to compare their structure and formats
3. Library and web search for journals of Agricultural Information and Communication and their publication policies.
Assignments
1. Students conduct a quick study to understand the importance of conducting research from postgraduate students, lecturers, Library staff, the Division of Research and Extension, and from the websites of KARI, ILRI, ICRAF, ASARECA, RUFORUM, FAO
2. Students do comparative analysis of the structure and formats of postgraduate theses and scientific papers to identify the components of research process
3. Students do a search from the web to identify the journals that publish agricultural information and communication research and for each journal make list of research topics that are of priority interest for the journal.
References and Additional Reading Materials
Useful links
http://thesisnotes.com/category/research-topic/
http://thesisnotes.com/conceptual-framework/sample-conceptual-framework/

Topic 3: Conceptualisation of Research Problem
Introduction
Research problem indicate specifically which issues of concern will be addressed out of the
general issues/problems. It specifies why addressing a particular aspect is important to academic
enquiry, to clients or to society in general. It informs the research questions to focus on and the
hypotheses to formulate for testing. Critical analysis of a problem is essential to get to cause-
effect relationships that the research will target to find answers to or solve.
Learning outcomes
By completing this topic, the learner should be able to:
Analyse researchable issues in AICM
Formulate statement of the problem for researchable issues
Develop logframe from problem analysis process
Key terms
• Problem tree
• Objective tree
• Logframe
3.1. Problem Tree Analysis
An analysis of a researchable issue to understand the cause-effect relationship is termed problem
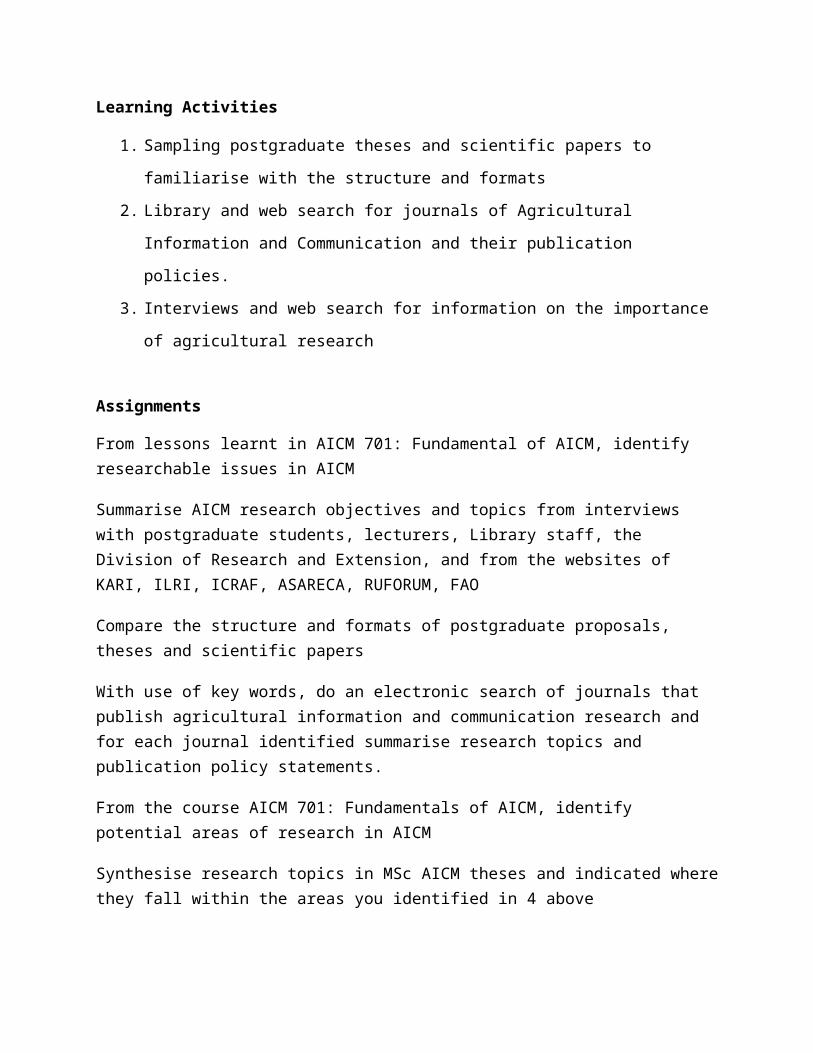
tree analysis. The analysis can be completed by the researcher alone applying knowledge and
based on literature review. For development projects, problem analysis is more effective if
involves primary beneficiaries in a participatory process with knowledgeable people.
The process of problem analysis is focused on identifying the existing situation which is the core
problem which the research will be designed to address by reversing or changing the primary
causes of the core problem. Note that absence of a solution is not a problem, but rather an
existing negative situation. For instance, stating that there is no pesticide available is not
available, but stating that harvest is pest infested is a practical existing problem demanding for a

solution. Through the process, researcher identifies the effects of the core problem impacting on
people, environment or development. The process is problem tree analysis because it produces
linkages with the middle being the situation and above it is effects while below is the cause-
effect. The causes and effects are expressed in negative conditions with identified specific
problems separately.
The problem tree can be translated into objective tree and eventually into logical framework.
This is a systematic analysis of the situation, trends and its causes and consequences. The
objective is translated into logframe. The process is illustrated with an example here.
Research problem definition
Mombasa highway has been experiencing high frequency of bus accidents resulting into injuries
and deaths of many people. Consequently, insurance companies now charge high insurance
premiums. It is possible that frequent bus accidents result from careless driving by drivers, poor
state of roads and poor condition of busses on the road, but knowledge of the underlying reasons
are yet to be established. Such knowledge could inform targeted interventions to reduce the
number of bus accidents on Mombasa road.
This statement of the problem has four important informative characteristics that define research
problem.
a. The problem/issue of concern is specific: frequent bus accidents
b. The effects/impacts directly resulting from the problem are clear: deaths, injuries and
high insurance premiums.
c. The hypotheses/research questions to address the problem can linked directly with the
problem statement:
Hypothesis is that the frequent bus accidents observed on Mombasa road can be
associated with careless driving, poor conditions of roads and buses.
Research question raised is that to what extent frequent bus accidents could be
associated with careless driving, poor conditions of roads and buses.
d. The gap in knowledge, solution needed and the expected results from implementing the
suggested research are well articulated.

Problem tree example
Many bus accidents occur
Bus drivers drive carelessly Roads are bad Busses are in
poor condition
Bus drivers are not well trained
Bus drivers arenot supervised
Roads are not maintained
Busses arebadly
maintainedBusses are old
High number of injured and dead people due to bus accidents
High insurance premiums have to be paid
Effects
Causes
Translating problem tree into objective tree
• Transform all negative conditions in problem tree into positive conditions that are
desirable, realistically achievable
• The cause-effect relationship turns into a means-ends relationship,
• Check validity and completeness of the cause-effect relationship, it’s the hypothesis
• Objectives seemingly not expedient or necessary may be deleted
• May rephrase statements to attain clarity

Number of bus accidents decreased
Bus drivers drive carefully Roads are improved Condition of busses improved
Bus drivers are well trained
Bus drivers aresupervised
Roads are maintained
Bus maintenance improved Busses are newer
Less passengers injured or dead due to bus accidents
A decrease in insurance premiums paid
effects
Causes
3.2. Logical framework development
The objective is then transformed into logframe, indicating the goal, the purpose, the outputs, the
activities and the inputs in rows and the verifiable indicators, sources of verification and
assumptions in the columns.
Objectives Objectively verifiable indicators
Means of verifications
Assumptions and risks
Results expected Measure of whether results have been achieved
Where to source information or evidence that achievement has been made
Impediments expected not to stand on the way the way, If true then specific objectives will be achieved

The objective tree turned into logframe for this case example of bus accidents is presented next.
Note that the indicators for the outputs/objectives are SMARTER, being specific, measurable,
achievable, realistic and time-bound.
Narratives Verifiable indicators
Sources of verifications
Assumptions
Goal: Less people injured or dead from bus accidentsPurposeBus accidents decreased
50% reduction in accidents by end year 1
•Police records•Hospital records•Insurance records
Outputs1. Condition of busses good2. Bus drivers drive carefully
25% new busses within 6months100% busses inspected yearly
•Vehicle inspectorate•Police records•Garage records
•Busses inspected regularly•Drivers re-training programmers are effectively supported
Activities1.1 Maintenance of busses1.2. Replacement of old busses2.1. Training bus drivers2. 2. Supervision of drivers
Inputs25 drivers trained 4th mth10 supervisors hired 5th mth10 garages improved 8th
mth50% busses new 1st year
Costs US$25,000125,000
250,000
4,000,000
•Many drivers take re-training courses •Adequate supervisors available •Owners buy new busses
Summary
Characteristics of well formulated research problem are:
• Specific problem/issue of the study
• Impacts/effects resulting from presence of the problem identified
• The hypotheses/research questions to guide the research articulated
• Hypotheses and research questions are stated in a way that clearly distinguishes the
dependent and independent variables
• The gap in knowledge, solution needed and the expected results from implementing the
research well articulated.

Learning activities
1. Case study analysis of research problems
2. Group discussions
3. Class presentations
1.2 Statement of the problem
Pesticides and chemical fertilizers are expensive and frequently unobtainable. Some smallholders in Western Kenya have been successful in increasing incomes and maintaining soil fertility by using an integrated pest management (IPM) scheme and crop rotation. However other farmers have been less successful. It has been suggested that soil type has a large impact on the viability of these management techniques, and that might explain varying adoption. If we knew which practices were better adapted for which soils, dissemination could be targeted and further research may develop techniques for problem soils.
Market milk price in the Molo peri-urban area, where smallholders invest on external inputs use
to support intensive milk production, fluctuates between diverse market outlets and seasonal
weather patterns. Though the actors in the formal and informal milk markets compete for milk,
many smallholders
dairying and need to sell their milk at competitive prices to ensure positive returns to investment.
Many small-scale dairy farmers producing milk in the Molo peri-urban invest on external inputs
use to support intensive dairying and need to sell their milk at competitive prices to ensure
positive returns to investment. Despite the competition for milk in the informal and formal
market outlets, many farmers sell their milk at prices not competitive enough to ensure profitable
milk production. It is suggested that market information flow between milk producers and
market actors has a large impact on the price that farmers receive for their milk, and access and
use of market information could explain why some are able to sell competitively and other not.
Farmers may not be seeking for market information among the market outlets, if they do, there
could be information barriers in access, timeliness and reliability. Knowledge of the flow and use
of market information on milk prices would be useful in designing effective price information
dissemination strategies to help farmers sell their milk at profitable prices and realise positive
returns to their investment for improved income and food security through dairy production.
2.7 Conceptual framework
The conceptual framework below illustrates the specific research questions to be addressedon
whether :
1. Small scale milk producers seek for market information to gain opportunity of selling
milk at competitive price?
2. How do those buying milk in the informal and formal market outlets communicate the
milk price they are offering to small scale milk producers?
3. How reliable and timely is the market information on market milk price communication
from market actors for small scale milk producers?

4. What is the influence of formal and informal market actors on the competitiveness of
milk sale price?
Figure 2: Conceptual framework describing hypothesized association between the market
information on milk price and the competitive price farmers obtain.
Source: own conceptualization
RQ1
RQ3
RQ2
RQ4
Farmers Perceptions ExperiencesEfforts
Market informationMilk priceReliabilityTimeliness
Market outletsInformalFormal
Competitive milk sale price

Assignments
Read the two problem statements of researchable issues and point out the characteristics of well formulated research problem you can isolate.
Case 1: Inability by farmers to maintain soil fertilityPesticides and chemical fertilizers are expensive and frequently unobtainable. Some smallholders in Western Kenya have been successful in increasing incomes and maintaining soil fertility by using an integrated pest management (IPM) scheme and crop rotation. However other farmers have been less successful. It has been suggested that soil type has a large impact on the viability of these management techniques, and that might explain varying adoption. If we knew which practices were better adapted for which soils, dissemination could be targeted and further research may develop techniques for problem soils.
Case 2: Access and use of information and services for adaptive capacity building to impacts of climate change People living in semi-arid environments of Kenya already classified hotspots of climate change are frequently exposed to impacts of climate change. The impacts include heat stress, droughts, forage scarcity and poor quality, water scarcity and poor quality, flooding, wind storm events and outbreak of disease epidemics. As a consequence, people suffer from food, nutrition, income and health insecurities, particularly women, children, and the elderly, making this group vulnerable to impacts of climate change. The vulnerable group could reduce their vulnerability to impacts of climate change if they access and use climate information and services to enable them build adaptive capacity. Climate information and services are disseminated through mass, print and electronic media and community channels. But vulnerable group in semi-arid environments could be constraint accessing and using such information and services through these channels because of their low literacy levels, low income, lack of basic infrastructural development and language barrier in the use of mass, print and electronic media. Identifying the preference for the dissemination channels and the user-friendly attributes can enhance effective delivery of climate information and services targeted to vulnerable people to build their adaptive capacity.
Translate each of the two cases into problem tree, objective tree and logframe for project proposal.

Critiques the problem statements in any two selected MSc / PhD proposals and theses bases on the how well the problem statements articulates the good characteristics of writing a statement of the problem for research projects.
References and Additional Reading MaterialsMSc and PhD research proposals and thesesGEAR CD supplied by RUFORUM
Useful link

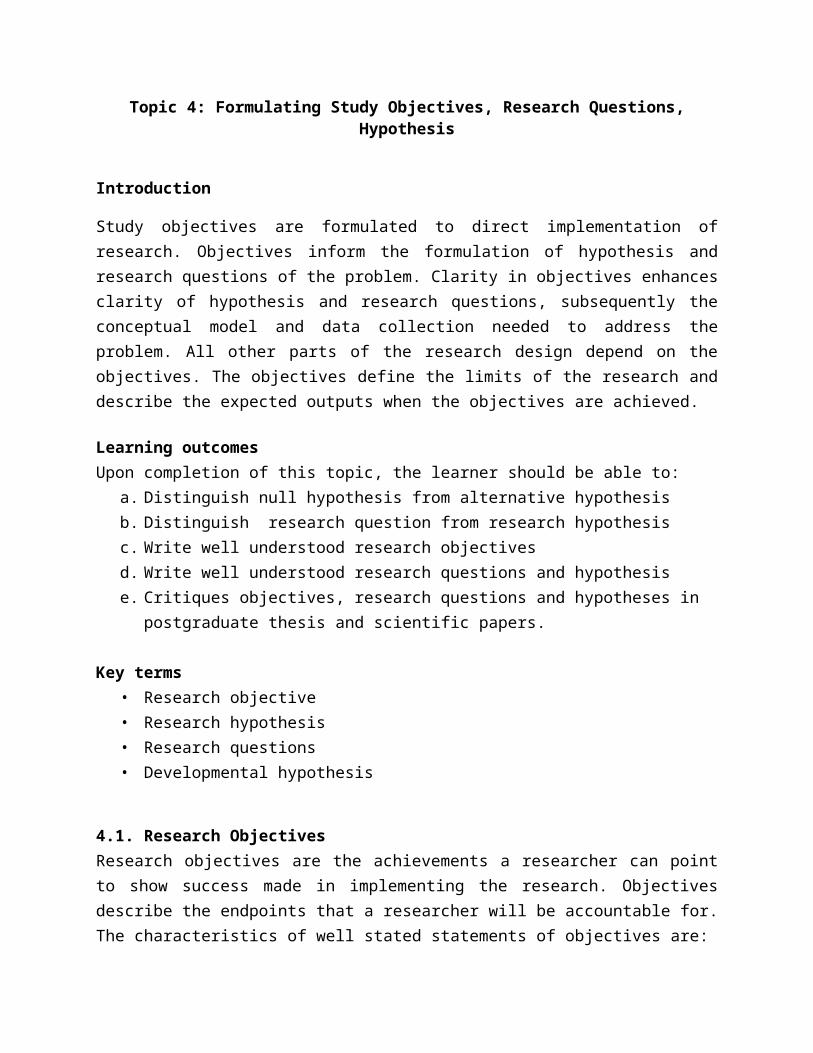
Topic 4: Formulating Study Objectives, Research Questions, Hypothesis
Introduction
Study objectives are formulated to direct implementation of research. Objectives inform the formulation of hypothesis and research questions of the problem. Clarity in objectives enhances clarity of hypothesis and research questions, subsequently the conceptual model and data collection needed to address the problem. All other parts of the research design depend on the objectives. The objectives define the limits of the research and describe the expected outputs when the objectives are achieved.
Learning outcomesUpon completion of this topic, the learner should be able to:
a. Distinguish null hypothesis from alternative hypothesisb. Distinguish research question from research hypothesisc. Write well understood research objectivesd. Write well understood research questions and hypothesis e. Critiques objectives, research questions and hypotheses in postgraduate thesis and
scientific papers.
Key terms• Research objective• Research hypothesis• Research questions• Developmental hypothesis
4.1. Research ObjectivesResearch objectives are the achievements a researcher can point to show success made in implementing the research. Objectives describe the endpoints that a researcher will be accountable for. The characteristics of well stated statements of objectives are:
Logical consequence of the background and problem statement Have active verbs such as: ‘Determining…’, ‘Measuring how much…’, ‘Identifying …’ ,
‘Establishing …’,. ‘Evaluating …’, or ‘Assessment …’,. Declare the relationships to be investigated, possibly identifying independent and
dependent variables• Make sense to an informed reader without additional information• Are achievable with data from surveys, observations and experiments

• Are not statement of the methods – such as ‘To carry out a survey…’ or ‘To compare treatments…’. The methods are developed to meet the objectives, not the other way around.
4.2. Research Hypothesis and Research QuestionsHypothesis is a statement of the expectation that a researcher states about the population characteristics for making statistical decisions on the basis of sample data. Statistical decisions to make is rejecting or accepting the hypothesis within a specified level of certainty. Hypothesis formulation is done at the stage of developing the proposal to guide collection of appropriate data.
There are two approaches of formulating hypothesis:
• The Statistical approach
• The developmental approach
Statistical hypothesis and population parameters
Statistical hypothesis approach is inferential statistics based on estimation of population parameters from a random sample to describe population characteristics. It is stated in mathematical/statistical terms that make it possible to calculate the probability of possible samples assuming the hypothesis is correct. It is comparative in nature for factor effects of interest. The hypothesis testing may be for one or more of the population parameter values:
• Mean μ
• Median M
• Standard deviation σ
• Proportion π
Statistical hypothesis can be stated in the Null or Alternative forms, and Non directional or directional form.
The Null hypothesis expects equality: Ho: μ1 – μ2 = 0 or Ho: μ1 = μ2
The Alternative expects non equality: Ha: μ1 – μ2 ≠ 0 or Ho: μ1 ≠ μ2
Directional and non-directional form of hypothesis is about the area of rejection of the hypothesis in the distribution function. Directional hypothesis has rejection area to one tail of the distribution:
Ho: μ1 = 5 a specified value: Ha: μ1 > 5 or Ha: μ1 < 5

While Non directional hypothesis has rejection area to either of the tail of the distribution
Ho: μ1 – μ2 = 0 ; Ho: μ1 = μ2
Ha: μ1 – μ2 ≠ 0 ; Ho: μ1 ≠ μ2
An example of hypothesis for testing single mean in non directional form is stated as:
Null Ho: μ1 - μ0 = 0 Alternative Ha: μ1 – μ0 ≠ 0
In the distribution function, rejection area is to either of the tail, hence the term two sided or two tailed test. In directional form, the rejection is within one specified tail area, hence the term one sided or one tailed test.
Ho: μ1 > μ0 Ha: μ1< μ0
Stating hypothesis for testing two means in non directional form:
Ho: μ1 = μ2 Ha: μ1 ≠ μ2
Stating hypothesis for testing two means in the directional form:
Ho: μ1 ≤ μ2 Ha: μ1 > μ2
The statistical approaches used to test hypothesis are addressed in AICM 702: Statistical methods course and includes:
1. Confidence Interval (CI) which define the range of values within which the true population mean (μ, π) lies with a certain probability (99%, 95%, 90%), and may be estimated for large or small sample size with the formula:
Large population size: CI = ỹ ± Zα x SE
Small sample size:
The decision to reject or not to reject the null hypothesis is based area where the CI estimate falls, which is illustrated in here.
Lower bound Upper bound
Do not rejection Ho
Rejection areas for null hypothesis
The illustration shows the area where the estimated CI is rejected when falling outside or is not rejected when falling within the area of expectation/assumption if the null hypothesis were true.
2. Test statistics is based on statistical procedures appropriate for the sample data distribution function to test the stated hypothesis. A general formula for test statistics is:
Test = Estimate – Hypothesis / SE
Commonly used test statistics for testing hypothesis include:
a. z - test
b. t – test, the student t test
c. F – test
d. Χ2 – chi square test
e. Sign rank test
f. Other speciliased tests statistics
Case example for the problem of frequent bus accidents earlier introduced in the previous chapter to illustrate stating of hypothesis
Statement of the problemMombasa highway has been experiencing high frequency of bus accidents resulting into injuries and deaths of many people. Consequently, insurance companies now charge high insurance premiums. It is possible that frequent bus accidents result from careless driving by drivers, poor state of roads and poor condition of busses on the road, but knowledge of the underlying reasons are yet to be established. Such knowledge could inform targeted interventions to reduce the number of bus accidents on Mombasa road.
Overall objective: To reduce number of bus accidents in order to reduce injuries and deaths to passengers and have insurance premiums reduced.
Specific objectives: To identify factors associated with frequent bus accidents along Mombasa highway
Research question: Is careless driving, poor state of roads and condition of busses associated with increased bus accidents?

Hypothesis: Careless driving, poor state of roads and condition of busses is associated with increased bus accidents.
Developmental hypothesis Developmental hypothesis may not be statistically tested. The hypotheses are on objectives relating to macro development goals such as the Millennium Development Goals or national development goals. These are the higher level goals in the logical framework. The definition can be developed through participatory problem analysis with the primary beneficiaries in identifying entry points for development intervention, analysis of the objectives and activities and analysis of important assumptions that is likely to be barriers to the attainment of the stated objectives. Therefore developmental hypothesis is more relevant to development projects rather than academic projects such as thesis.
SummaryHypothesis is formulated in comparative statement comparing:
• value of parameter estimates • the effects of factors/ treatments• Association between factors
Hypothesis is stated at the time of developing the research concept in order to:• Guide data collection • Aid design of questionnaire • Aid choice of appropriate analytical procedures
Learning activities Case study of theses and scientific papers
Group discussions
Class presentations
Literature search
Preparation of a research project
Assignments
1. Conduct an electronic search of Web based journals to identify any three journals that do publish Information and Communication Management (ICM) research. Give their titles and publishers.

2. Of the three ICM journals identified in 1 above, scan to identify any 3 titles published within the last five years that are closest to a topic of research you are interested in for your MSc thesis. For each title, give the author, title, year, journal name, volume and pages
3. From among the three paper titles you selected in question 2 above, choose one and from its contents, extract the excerpts on:
a) Statement of the problemb) The study objectives c) The research questions answeredd) The hypotheses testede) The conceptual frameworkf) The data collection approachesg) The statistical methods used
4. Review at least five MSc and PhD proposals and theses to evaluate the stated objectives, hypothesis and research questions if are clear on what is being tested, measurements
Identify the relationships hypothesised between dependent and independent variables
5. ICT Company has been experiencing revenue decline for the last two years. The company has identified that the problem is emanating from the declining number of people using their ICT products. Their analysis points to negative perception of the company by the public. Based on this brief, define the research objective and research question for this case.
6. Of the theses reviewed attempt to re write the objectives, hypotheses and research questions in clear and simple statements
References and Additional Reading Materials
• MSc and PhD research proposals and theses.
• GEAR CD supplied by RUFORUM
• Journals of communication and information management
• Trochim, W. (1989). Concept mapping: Soft science or hard art? In W. Trochim (Ed.) A Special Issue of Evaluation and Program Planning, 12, 87-110.
• Trochim, W. Reliability of Concept Mapping. Paper presented at the Annual Conference of the American Evaluation Association, Dallas, Texas, November, 1993.

Useful links
www.ilri.org/rmg/index.php?option=com_content : Customised courses for specific groups; On-line research methods resource materials; Biometrics and Research Methods Teaching Resource"
books.google.co.ke/books?isbn=0415223121: Catherine Hakim - 2000 - Social Science - 256 Covering both theoretical and policy research, this is a practical overview of the central issues involved in the design of social and economic research.http://thesisnotes.com/conceptual-framework/sample-conceptual-framework/

Topic 5: Theoretical Framework and Conceptual Model Development
IntroductionA theoretical framework specifies which key variables influence a phenomenon of interest and therefore what variables to measure, the rationale for relationships between the variables. This will inform what statistical relationships on which to focus the tests. Theory guides every aspect of research, from formulation of the research question through operationalization and discussion. Research has two realms: the theory and observation. Theory is the scientific basis to explain an observed phenomenon which the researcher applies to gain better understanding of the phenomenon. On the hand, observation is what occurs in the real world or measures. Researchers conduct research on the basis of theory about what is observed.A conceptual framework is an illustrated representation of an idea or body of knowledge based on the own understanding of the relationships between the variables. The illustration shows the variables and how the hypothesized relationship between them.
Learning outcomesUpon completion of this topic, the learner should be able to:
Explain the relationship between Theoretical framework and Conceptual model• Distinguish theoretical framework from conceptual model• Write well understood theoretical framework relating to research questions and
hypothesis of the study• Draw well understood conceptual model relating to research questions and hypotheses of
the study• Critique theoretical frameworks and conceptual models in postgraduate thesis and
scientific papers.
Key words Theoretical framework Conceptual model
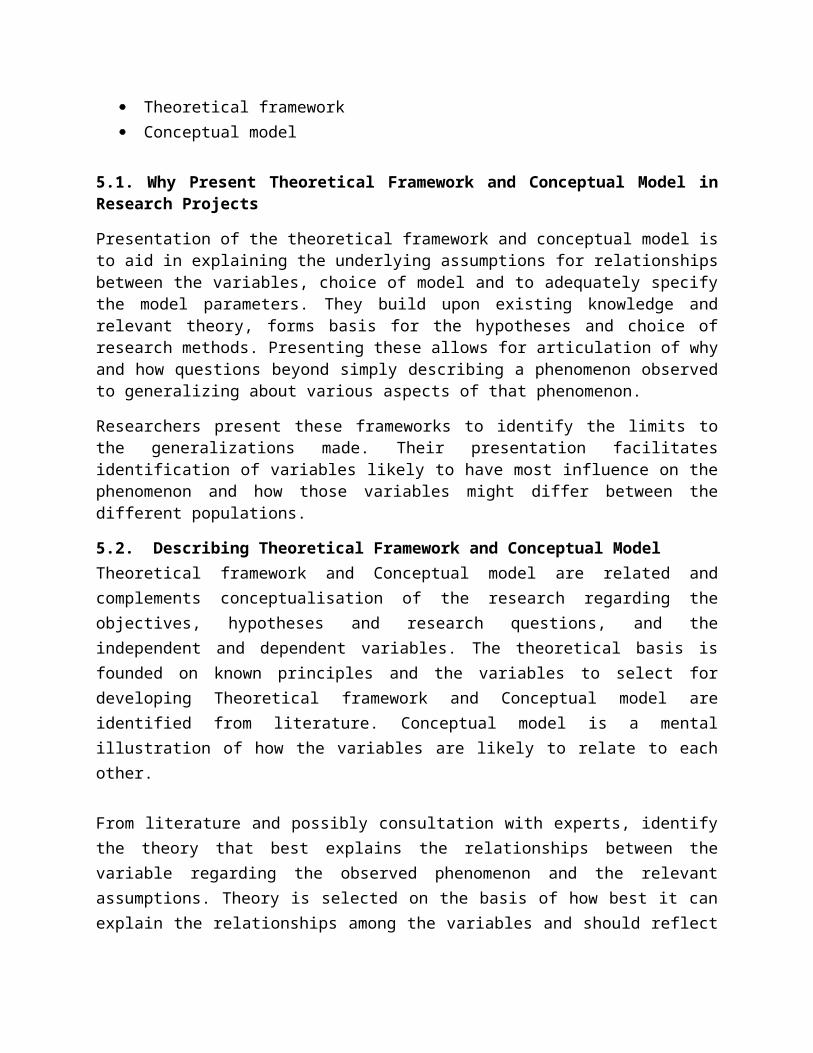
5.1. Why Present Theoretical Framework and Conceptual Model in Research Projects
Presentation of the theoretical framework and conceptual model is to aid in explaining the underlying assumptions for relationships between the variables, choice of model and to adequately specify the model parameters. They build upon existing knowledge and relevant theory, forms basis for the hypotheses and choice of research methods. Presenting these allows for articulation of why and how questions beyond simply describing a phenomenon observed to generalizing about various aspects of that phenomenon.
Researchers present these frameworks to identify the limits to the generalizations made. Their presentation facilitates identification of variables likely to have most influence on the phenomenon and how those variables might differ between the different populations.
5.2. Describing Theoretical Framework and Conceptual ModelTheoretical framework and Conceptual model are related and complements conceptualisation of the research regarding the objectives, hypotheses and research questions, and the independent and dependent variables. The theoretical basis is founded on known principles and the variables to select for developing Theoretical framework and Conceptual model are identified from literature. Conceptual model is a mental illustration of how the variables are likely to relate to each other.
From literature and possibly consultation with experts, identify the theory that best explains the relationships between the variable regarding the observed phenomenon and the relevant assumptions. Theory is selected on the basis of how best it can explain the relationships among the variables and should reflect a connection between the theoretical framework, conceptual framework, operationalization, and instrument.
The conceptual model of a research is an illustration of how the relationships between the variables are visualized. We use two case studies to illustrate this.
Case 1: Research objectives
The study was to test the hypothesis that farmers’ breeding goals have substantial influence on whether they seek for breeding information to inform their insemination decision (bull or Artificial Insemination) and replacement (purchase of a heifer or a cull cow for breeding). The breeding decisions made will subsequently impact on profitability of the dairy herd.
The specific objectives of the study were stated as:
i. To characterize breeding information that smallholders seek for in choosing and purchasing bull or AI for insemination decisions
ii. To characterize breeding information that smallholders seek for in purchasing heifers or cull cows for replacement decisions
iii. To identify the barriers in breeding information for insemination and replacement decisions between smallholders and breeders supplying the breeding stock
iv. To estimate the net margins associated with the insemination (bull or Artificial Insemination) and replacement (purchase of a heifer or a cull cow) decisions
v. To estimate the net margins associated with the insemination (bull or Artificial Insemination) and replacement (purchase of a heifer or a cull cow) for smallholders and breeders herds
For implementing this research, an investigator could conceptualise the associations of breeding information and decisions with the net margins, the proxy for profit, in a dairy herd with the illustration her presented.

Case study 2: problem statement
Many small-scale dairy farmers producing milk in the Molo peri-urban invest on external inputs use to support intensive dairying and need to sell their milk at competitive prices to ensure positive returns to investment. Despite the competition for milk in the informal and formal market outlets, many farmers sell their milk at prices not competitive enough to ensure profitable milk production. It is suggested that market information flow between milk producers and market actors has a large impact on the price that farmers receive for their milk, and access and use of market information could explain why some are able to sell competitively and other not. Farmers may not be seeking for market information among the market outlets, if they do, there could be information barriers in access, timeliness and reliability. Knowledge of the flow and use of market information on milk prices would be useful in designing effective price information dissemination strategies to help farmers sell their milk at profitable prices and realise positive returns to their investment for improved income and food security through dairy production.
For this research the specific objectives can be stated as:1. To establish whether small scale milk producers seek for market information about which
market outlets offer competitive prices?2. To characterize how actors in the informal and formal market outlets communicate milk
price to small scale milk producers in Molo peri-urban area: 3. To determine farmers’ perceived timeliness and reliability of market information on milk
price from actors in the formal and informal market outlets in Molo district.
Producer breeding goals
Breeding information
Use of AI insemination
Use of bull insemination
Average cow net margins
Purchase cull-cow for replacement
Purchase heifer for replacement

4. To identify where in the flow of information are greater barriers and the type of barrier experienced by small scale milk producers and the actors in the formal and informal market actors.
The problem described and the stated objectives could be conceptualized with the illustration here presented:
SummaryConceptual model is a mental illustration of how the variables are likely to relate to each other. Theoretical framework and Conceptual model are related and complements conceptualisation of the research regarding the objectives, hypotheses and research questions, and the independent and dependent variables. The theoretical basis is founded on known principles and the variables to select for developing Theoretical framework and Conceptual model are identified from literature.
Learning activitiesCritique of theoretical framework and conceptual model in thesis projects and journal papersWriting theoretical framework and conceptual model for research project
RQ1
RQ3
RQ2
RQ4
FarmersMilk sales
Market informationMilk priceReliabilityTimelinessMarket requirements
Market outletsInformalFormal
Competitive milk sale price

AssignmentsWrite a research thesis project with the following sections:
a) Statement of the problemb) The study objectives c) The research questions d) The hypotheses e) The conceptual frameworkf) Theoretical framework
Useful linkhttp://thesisnotes.com/category/theoretical-framework/

Topic 6: Study Designs
IntroductionA study design is a plan of systematic data collection process to meet the objectives for concluding whether a null hypothesis can be rejected or not or providing valid answers to the research questions. The process in design includes sampling techniques, the measurements and application of randomization, replication and blocking concepts. Data is collected on factors, treatments and response variables identified in the hypothesis and research questions to enable statistical testing. Planning and implementation of research is based solving the problem defined, finding valid answers to research questions and making decision to reject or not to reject the hypothesis. The planning builds on the theoretical framework and conceptual mode.
Learning outcomesBy completion of this topic, the learner should be able to:
a. Describe study designsb. Point out replicates and blocks in a research designc. Apply randomization process in research implementationd. Calculate appropriate sample size for a given research design.
Key terms
Population: A set of objects or individuals having certain characteristics which researcher wish
to make a statement about by means of empirical investigation of a sample (subset
population)
Sample: The subset of the population actually selected for measurements
Experimental unit: Individual or object which receives the intervention (factor, treatment) that
the researcher choices to give, or assign them to, to take measurement (response)
Sampling unit in a survey, observational unit in observational study: are equivalent to
experimental units
Location of the study: This is where you obtain the appropriate study population with set of values of the characteristics which the research objective is focusing on
Survey designsExperimental designsSample size determinationRandomization processReplication and blocking concepts

6.1. Study DesignsThere are several designs of study which research in AICM may apply to collect the needed data as summarised here below, depending on the type of the data needed for the research questions and hypotheses of interest. Study designs consider the type of environment in which an experiment is to be conducted and whether the experiment needs to be replicated in different locations.
Response values observed on imposed intervention on the sampling unit?
No,
response observed without an intervention
Yes,
response observed on intervention
Response observed on just one time moment, without any control factors
•Cross sectional survey
• Rapid Appraisal (PRA)
Response observed over time with some limited control on factors
•Observational study
•Longitudinal
Response observed with greater control on factors
Experimental study
Mostly overtime
a). Experimental study designsAn experimental design is where a researcher imposes intervention or treatment on the experimental units then measures the response. The Researcher measures the effect of intervention: factors/treatments, usually in multiples or replicates. Researcher compares response to the factors /treatments corresponding to the hypothesis. For example, teaching farmers how to use several ICT facilities in making farming decisions then after some time compare their farm productivity between those trained and untrained farmers to evaluate the impact of ICT use. The conditions that define an experimental design are:

Researcher can only control conditions under his/her control Control that the researcher effects helps in reducing experimental error variations Assessment can only be made of the factors imposed on the subjects: experimental units,
sampling units, observational units Effect of the treatment/intervention is observed to detect whether sampling units express
change in response: respond differently to the same treatment? A control treatment is included with change in response of other treatments are compared• The researcher chooses the factors /treatments relevant to the stated hypothesis/ research
questions• The sampling units are randomly and independently selected from the target population• Sampling units are randomly allocated to treatments/ interventions • Measurements are undertaken under controlled conditions• Response is random variable while Factors / treatments are fixed variables. Variables are
fixed when researcher selects them prior to start of the data collection and remains in the same state throughout the period of data collection.
b). Survey study designsSurvey is the process of using a questionnaire or interview protocol to collect data. Surveys may be cross sectional if measurement is taken only on one time on the respondent or subject. Survey is longitudinal if measurements on the respondent are over time, repeated. Cross sectional surveys are cheap, quick to implement, no risk on sampling units, multiple factors can be evaluated. However, there are a lot of noise factors not under control of the researcher as is the case in experimental designs.
The characteristics describing survey designs are:
Researcher impose no intervention on the sampling units Obtains information from sampling units on the existing situation now, in the past or in
the future, for instance adoption, attitudes, behaviour, preferences, practices Can capture response on basis of recall, perception or observation on as is basis Sampling units randomly selected from the target population
c). Participatory Rapid AppraisalRapid analysis of the situation on the ground through interviews with key informants within the community who are knowledgeable of the situation being investigated
d). Observational study designsObservational study designs are where the researcher:
• observes sampling units for factors/treatment of interest

• has limited control on what is done on the observation or response and the factors / treatment to include in the study
• Observation may be one time or overtime
a) Case control study• Sampling is intentionally targeted at the factor of interest• Sampling units exposed to disturbed and undisturbed conditions, • response then compared between disturbed and undisturbed conditions
b) Cohort study- groups• sample units grouped then one group exposed and the other not exposed to certain factors• Selected sampling units from each group observed overtime for response to the factor/
treatment/ • Time of observation for response may be in prospective or retrospective • Sampling units in prospective observation selected on basis of current exposure to the
factors • Sampling units in retrospective observation are selected on basis of past exposure to the
factors
6.2. Sampling TechniquesSampling is a process of selecting units on which to do measurements or allocating treatments to units (sampling, observational or experimental) in the research.
i. Simple random sampling: all sampling units have equal chance of being selected for the study
ii. Systematic random sampling: each sampling unit randomly selected at regular interval to
evenly spread the distribution of units within sampling frame
iii. Multistage sampling
• Divide population into distinct groups, based on priori information
• Then sampling process in ≥2 stages
• Zone, farming systems, households, individual members of the household
In this case the at first stage select k groups randomly from n groups and at the next stage you
sampling units within each group randomly
iv. Stratified sampling
• Sampling frame divided into groups: strata
• Next apply systematic or simple random sampling to obtain sample units from each strata
• Useful in heterogeneous population

• Allows for unequal proportion of sampling units within each strata
v. Cluster sampling
• Population divided into cluster units, then random sample of clusters selected among the
clusters
• All sampling units within selected clusters are then examined
• Cluster sampling vs stratified sampling
• Clusters are equivalent to strata
• In cluster sampling, clusters are randomly selected, but not necessarily random in
stratified sampling
• Sampling units within strata all sampled in cluster, but randomly selected within each
strata in stratified sampling
• Multistage sampling is an extension of Cluster sampling, with ≥ 2 stages of sampling
6.3 Sample Size DeterminationThe question of how large a sample size is appropriate for a study is often a challenge in research. In principle, the sample size used is:
• Large enough to have a good chance of detecting differences between the factors of interest,
• Yet not so large to be wasteful in terms labour, finance, facilities and time required to obtain access all the sampling units
• Not so small to yield unrepresentative sample, invalid information and estimates,• A compromise in statistics and reality. Sometimes the determination of an optimal
sample size may justify the need to rethink the original objectives and corresponding hypotheses. A decision needs to be made between what is desirable in terms of numbers of units from a statistical point of view, and the number of units that can be handled.
Calculating optimal sample size requires knowledge of: Residual variance in the target population Specification of precision desired Specification of acceptable difference in response to consider statistically
significant
6.4 Randomization Process

Randomisation is a process of selecting sampling units in which each individual has an equal chance of being selected, or ensuring that each individual within a block has the same chance of being selected for any of the treatments. Sample selected randomly allows for making statements about the population characteristics from where they were obtained.
There are two other approaches to obtaining sample units from the population that are not random. One is convenience sampling, which is used when there are access barriers to obtaining sampling units in a random manner or when there is need to conduct detailed case study of a population with unique attributes of interests to the researcher. Sometimes it is applied when resources are limited and have to be used efficiently.
The other sampling approach used in surveys is purposive sampling in which the selection of sampling units is based on prior knowledge of study population attributes. The approach does not yield a representative sample.
6.5. Blocking and Replication ConceptsBlocking is grouping study subjects into more homogenous groups where the study subjects exhibit large heterogeneity in characteristics. The purpose of blocking is to put the subjects together in more homogenous groups of units according to a particular characteristic before subjecting them to treatments, say level of market access, income, time of adoption or exposure to ICT tool or a production system. The subjects here are the sampling units, which in a survey can be selected within strata. Blocking is important in experiments in which experimental units are heterogeneous while stratification is important in surveys where sampling units are heterogeneous. In practice blocking and stratification are used interchangeably in research designs. The choice of blocks or strata leads to smaller variation among sampling units for within block /strata than among block/strata, reduce the size of the experimental error or residual variance, improve the precision with which estimates are obtained and will effectively reduce the total number of units that need to be sampled. In addition, stratification can be used for administrative convenience in conducting a survey if estimates for each stratum are required.
When the sampling units are randomly selected, the analysis will focus on the variations within and between the blocks/ strata. If blocking is successful in producing more homogeneous groups, then the residual variance will be less than if the study had been designed as a completely randomised design. For instance, having b blocks/strata with equal assignment to t treatments from within blocks/strata, the analysis of variance structure for this study designs becomes:
Source of variation Degree of freedom
Block /strata (e.g Market access in low, medium and high) b - 1
Treatment (e.g use of mobile phones in marketing) t - 1
Residual (b - 1) (t - 1)
Total (e.g number of farmers samples) n -1
Replication means repeating measurements at the level of sampling units at the same time. In experiments, replicates would be three animals receiving the same treatment at the same time within the same block. In a survey study, replication is rare, but would be measurements of same variable say feeding regime on more than one member of the household taken at same time and obtaining a mean of the measurements to represent the value estimate for them. Another example of replicate in survey is when taking say three measurements on a farmers’ field at the same time and obtaining a mean of the three measurements for the response measured. Otherwise, cross sectional surveys have one replicate because measurement is done once on the head of the household.
Replication in an experiment is used to yield balanced treatment designs by having the sampling units subjected to equal number of measurements, such the measurement are equal at any time of observation. This leads to balanced design, called orthogonal which makes interpretation of statistical results easy.
Summary
In summary, each of these different methods of sampling, namely random, representative, convenience and purposive, may feature within study design. As far as possible samples should be drawn at random to ensure that sample estimates can be extrapolated to the sub-population that they represent. Sampling procedure has implications on the results and on the inferences that can be made from the data.
Learning activities
a. Case study of published papers and thesesb. Designing individual research projectsc. Group discussiond. Defending individual research projects
Assignments

1.. Using the formula given, calculate sample size needed to distinguish between three land use systems a difference of 20% in some of the important farm/household variables within 95% confidence interval of 95% a coefficient of variation of 68% previously observed in the target population. Explain the elements in the formula:
2.. Evaluate the methods used to determine sample size in published papers and theses
Reference and further reading materials

Topic 7: Data Collection Methods
IntroductionData collection involves obtaining empirical data for testing the hypothesis or answering the research questions. The data collected is analysed and interpreted to turn into information and results or findings. An empirical research can apply one or more methods of data collection. The approaches available for data collection in AICM research includes:
Testing respondents about their level of knowledge, skills or information on reliability and validity
Questionnaires administration directly to respondent Interviews with the respondents Focus group involving small group discussion with a moderator guiding focus of the
discussion Observation of the actual present situation and what people actually do Extraction of existing data, usually termed secondary data when you use data that are
originally collected and then archived or any other kind of “data” that was simply left behind at an earlier time for some other purposes.
Learning outcomesBy completion of this topic the learner should be able to:
a. Explain activities in the data collection process in researchb. Explain the strengths and weaknesses of data collection methodsc. Point out type of data collection in published papers and theses d. Plan data collection for a researche. Design a questionnaire for data collectionf. Critique reported data collection methods in publications
Key terms Test Questionnaire Focus Group Discussion Observation Secondary data
7.1. Observations for Data Collection Observation is a method of data collection where the researcher observes participants in natural and/or structured environments. It is important to collect observational data in addition to attitudinal data, because what people say is not necessarily what they do! Observation can be carried out in a laboratory environment or just natural environment in real-world settings. Observations can be quantitative or qualitative. The quantitative observation involves

standardization procedures to generate quantitative data. The standardization can be in the respect of who and what is observed, when and where the observation takes place, and the instruments used, the time interval of observation and procedure of sampling.
The strengths of observational data • Allows one to directly see what people do without having to rely on what they say they do. • Provides firsthand experience, especially if the observer participates in activities. • Can provide relatively objective measurement of behavior when using standardized observations. • Observer can determine what does not occur. • Observer may see things that escape the awareness of people in the setting. • Excellent way to discover what is occurring in a setting. • Helps in understanding importance of contextual factors. • Can be used with participants with weak verbal skills. • May provide information on things people would otherwise be unwilling to talk about. • Observer may move beyond selective perceptions of people in the setting. • Good for description. • Provides moderate degree of realism when done outside of the laboratory.
The weaknesses of observational data • Reasons for observed behavior may be unclear. • Reactive effects may occur when respondents know they are being observed, • Investigator effects may occur from personal biases and selective perception of observer • Observer may “go native” if turn over-identifying with the group being studied. • Cannot observe large or dispersed populations. • Some settings and content of interest cannot be observed. • Collection of unimportant material may be moderately high. • More expensive to conduct than questionnaires and tests. • Data analysis can be time consuming.
7.2. Tests for Data Collection Tests may be used in research that wants to measure personality, aptitude, achievement, and performance on specific knowledge, skills, behavior, or cognitive activity and also can be used to complement other measures where necessary. Developed standard tests can be found in the internet, which researcher may consider using if relevant to the hypothesis or research questions of the study. There are strengths and weaknesses in using test methods in data collection now outlined below.
\Strengths of using standardized tests approaches in data collection• Can provide measures of many characteristics of people. • Standardized measure in subjected all respondents to same treatment.

• Allows comparability of common measures across research populations. • Strong psychometric properties yielding high measurement validity. • Availability of reference group data. • Many tests can be administered to groups which saves time. • Can provide “hard,” quantitative data. • Tests are usually already developed. • A wide range of tests can be used to tap more content. • Response rate is high for group administered tests. • Ease of data analysis because of quantitative nature of data.
Weaknesses of using tests approaches in data collection • Can be expensive if test must be purchased for each research participant. • Reactive effects such as social desirability can occur. • Test may not be appropriate for a local or unique population. • Open-ended questions and probing options are not available. • Tests are sometimes biased against certain groups of people. • Non response from the respondents to selected items on the test.
7.3. Questionnaires for Data CollectionA questionnaire is an instrument for data collection in survey studies which may involve person to person interview, telephone interview or web based for participants to fill out. A questionnaire is composed of questions and/or statements. Here is an example of a questionnaire designed to collect data on the adoption of AICM tools in marketing dairy products. This is closed questionnaire in which possible options of responses are pre determined, which enables coding of the data to facilitate data entry into a electronic database. Open ended questions may be preferred for qualitative data where opinion of the respondent can be captured. Open-ended questions are common in exploratory research and closed-ended questions are common in confirmatory research

Questionnaire on Adoption of ICM tools in marketing dairy productsObjectives : Collecting information on the adoption of ICM tools in marketing of dairy products by smallholder dairy farmers.
1.1. RESPONDENT’S NAME:______________________________1.2. Date interviewed [____ ____ ____ ____]
1.3. LOCATION [ ___ ___ ___ ___ ____ ________ ____ _____]
A/1. Characteristics of the enterprise owner
Gender1 = Male2 = Female
Age (years)
Primary occupation
Years of experience in dairy processing
Education level
[ ___ ] [ __ ___ ] [ ___ ] [ __ ___ ] [ ___ ]
PRIMARY OCCUPATION1 = Farmer; 2 = Employed ; 3 = Businessman; 4 = Retiree
EDUCATIONLEVEL0=No formaleducation 4 = Technical college (Agric.,
Teacher’setc)1=Primaryschool 5=Adult literacy education2=Secondary school (‘O’ level) 6= University___________3=Post secondary school (‘A’ level) 7=Other (specify)
Page 1

B/1. Which dairy product do you process? [_____]
DAIRY PRODUCT1 = Sour milk; 2 = Butter; 3 = Cheese; 4 = Yoghurt; 5 = Ghee; 6=other (specify) _____
B/2. What processing technology do you use for the dairy products in B1 above? [____]
DAIRY PROCESSING TECHNOLOGY USED1 = Traditional; 2 = Improved traditional; 3 = Modern technologies
B/3. Do you have difficulties selling your dairy products? [___] 1 = Yes, 2 = No
B/4. Rank three main reasons for searching for ICM tool s for marketing your products? [First _______ ] [Second _______] [ Third ________]
MAIN REASON REASONS FOR SEARCHING FOR ICM TOOLS FOR MARKETING YOUR PRODUCTS? 1.= Not applicable; 2 = Find better price; 3 = Find a single buyer; 4 = Want more buyers 5 = Find a “regular” buyer; 6 = Others (specify) _______________
Page 2
The guidelines for developing questionnaires
Divide the questionnaire into sections corresponding to the objectives of the study to ensure complete capture of all the data needed and to ease verification of completeness. The language use must be simple in away clearly understood by the respondents otherwise use a translator familiar with the language of the respondents to be interviewed. It is therefore necessary to consider the demographic and cultural characteristics of the potential study population.
Write the questions in clear, precise and short sentences in neutral wording. The responses will be misleading if the respondents cannot understand the questions well, which make the data collected invalid for the research questions or hypothesis being tested. Questions more easily understood are less stressful to and minimise emotional reaction or responses from the respondents. Avoid use of leading or loaded questions in order to get true position from the respondent. Equally avoid double-barrelled questions and double negative wordings. Such questions combine two or more issues in a single question. A question is likely to be double-barrelled if has the word “and” within the sentence. The question will be ambiguous because two or more ideas are confounded and the interviewer will not be clear of what the respondents are specifically answering, one or the other item or both items in the question.

.
The questionnaire can be designed to capture both objective and subjective measurement. The objective measurements can involve direct measurements while subjective measurements are commonly through rating and ranking in likert numerical scale. It is better to pilot the questionnaire before administering to respondents for data collection.
The strengths of questionnaires • Good for measuring attitudes and eliciting other content from research participants. • Can provide information about participants’ internal meanings and ways of thinking. • Can administer to probability samples. • Quick turnaround. • Can be administered to groups. • Perceived anonymity by respondent may be high. • Well constructed and validated questionnaires yields moderately high measurement validity and reliability • Closed-ended items can provide exact information needed by researcher. • Open-ended items can provide detailed information in respondents’ own words. • Ease of data analysis for closed-ended items. • Useful for exploration as well as confirmation.
The weaknesses of questionnaires • Reactive effects may occur when interviewee try to show only what is socially desirable • Non response to selective items is common • People filling out questionnaires may not recall important information and may lack self-awareness • Response rate may be low for mail and email questionnaires • Open-ended items may reflect differences in verbal ability, obscuring the issues of interest. • Data analysis can be time consuming for open-ended items. • Measures need validation, accuracy level is low.
7.4. Interviews for Data CollectionInterviews involve an interviewer asking the respondent questions either in-person or over the telephone. Interviewer uses structured or open ended questionnaire. Accuracy and validity of the data depends on the trust and rapport with the respondent. An interviewer sometimes needs to probe the respondent to reach clarity or gain additional information.
Interviews may be quantitative or qualitative. In quantitative interviews, the same information is provided to everyone, so making quantitative standardized. Qualitative interviews use closed-ended questions. There are three types of qualitative interviews. One is Informal Conversational

Interview, which is spontaneous, loosely structured because the no interview protocol us used. Two is Interview Guide Approach which is more structured and has a protocol unlike the informal conversational interview. The interviewer can use a list of open-ended questions about the items to capture. The questions can be asked in any order wording can be changed when deemed appropriate. Three is standardized Open-Ended Interview in which open-ended questions are written on an interview protocol, and are asked in the exact order given on the protocol. In this case the wording of the questions cannot be changed.
The strengths of using interviews in collection of research data• Good for measuring attitudes and most other content of interest. • Allows probing and posing of follow-up questions by the interviewer. • Can provide in-depth information. • Can provide information about participants’ internal meanings and ways of thinking. • Closed-ended interviews provide exact information needed by researcher. • Telephone and e-mail interviews provide very quick turnaround. • Well constructed and tested interview protocols yields moderately high measurement validity and reliability • Often relatively high response rates are attainable. • Useful for exploration as well as confirmation.
The weaknesses of using interviews in collection of research data• Can be expensive and time consuming if in-person interviews are used. •There is possibility of reactive effects if interviewees may try to show only what is socially desirable. • Investigator effects may occur if conducted by untrained interviewers who distort data because of personal biases and poor interviewing skills. • Interviewees may not recall important information and may lack self-awareness. • Perceived anonymity by respondents may be low. • Data analysis can be time consuming for open-ended items. • Measures need validation.
7.5. Focus Groups DiscussionsA focus group is a situation where a focus group moderator keeps a small and homogeneous group, usually less than 15 people, focused on the discussion of a research topic or issue. Focus group sessions may be recorded using audio and/or videotapes. The method is useful for exploring ideas and obtaining in-depth information about how people think about an issue.
The strengths of focus groups • Useful for exploring ideas and concepts. • Provides window into participants’ internal thinking.

• Can obtain in-depth information. • Can examine how participants react to each other. • Allows probing. • Most content can be tapped. • Allows quick turnaround.
The weaknesses of focus groups • Sometimes expensive. • May be difficult to find a focus group moderator with good facilitative and rapport building skills. • Reactive and investigator effects may occur if participants feel they are being watched or studied. • May be dominated by one or two participants. • Difficult to generalize results if small, unrepresentative samples of participants are used. • May include large amount of extra or unnecessary information. • Measurement validity may be low. • Usually should not be the only data collection methods used in a study. • Data analysis can be time consuming because of the open-ended nature of the data.
7.6. Collecting Secondary Data Secondary data is data that was originally used for a different purpose while primary data is original data collected specifically for the research study. The most commonly used secondary data are documents, physical data, and archived research data.
The documents may be personal if data was written or recorded for private purposes such as letters, diaries or family pictures. Alternative documents are official documents which were written or recorded for public or private organizations such as thesis, newspapers, annual reports, yearbooks or minutes. Physical data are any material thing created or left by humans that might provide information about a phenomenon of interest to a researcher. Archived research data are the research data collected by other researchers for other purposes and can be saved in tapes, CD, databases that are accessible to others.
The strengths of documents and physical data: • Can provide insight into what people think and what they do. • Unobtrusive, making reactive and investigator effects very unlikely. • Can be collected for time periods occurring in the past (e.g., historical data). • Provides useful background and historical data on people, groups, and organizations. • Useful for corroboration. • Grounded in local setting. • Useful for exploration.

The strengths of archived research data: • Archived research data are available on a wide variety of topics. • Inexpensive. • Often are reliable and valid (high measurement validity). • Can study trends. • Ease of data analysis. • Often based on high quality or large probability samples.
Weaknesses of documents and physical data: • May be incomplete. • May be representative only of one perspective. • Access to some types of content is limited. • May not provide insight into participants’ personal thinking for physical data. • May not apply to general populations.
Weaknesses of archived research data: • May not be available for the population of interest to you. • May not be available for the research questions of interest to you. • Data may be dated. • Open-ended or qualitative data usually not available. • Many of the most important findings have already been mined from the data
SummaryData collection is a series of activities:
1. Design of survey / experimental implementation process• Choice of study population and location• Design the survey/experiment• Determine the sample size • Sampling techniques• Design data collection tools
2. Implementation of survey / experimental process• Randomization • Replication• Blocking /stratification• Validate data collection tool: pre testing• Data collection and measurements
Learning Activities

a. Review data collection methods in journal papers and thesesb. Practical field application of data collection methodsc. Design of questionnaire for data collectiond. Critique the data collection methods in journal papers and theses
Assignmentsa. State the data collection methods relevant to your research project b. Explain how you will apply the chosen methods of data collection in your research
projectc. Design a questionnaire for collecting the data you need for your research project
References and further reading materials

Topic 8: Data Measurements
IntroductionData measurements are about obtaining the variables that will effectively produce appropriate answers to the research questions. Variable are measurements that take values which vary from one individual to another, from one sampling unit to another. The important considerations about data measurements are
What variables to measure / observe? How to measure the variables? How often to measure the variables?
Learning outcomesBy completion of this topic the learner should be able to:
a. To give examples of data measurementsb. Point out data measurements used in journal papers and thesesc. Apply the methods of data collection in research process
Key termsa. Variablesb. Scales of measurementsc. Nominal and ordinal scaled. Discrete, discontinuous and continuous scale
8.1. Guide to Variables to Measure in Research ProcessIn a research what variables to measure is guided by
• Hypothesis , Research questions• Theoretical and Conceptual frameworks• Literature review• Analysis of the problem – the causes and effects
The question of how to measure the variables relate to the scales of measurements to use. The scales are:
• Qualitative or categorical scales• Quantitative or continuous scales
The qualitative or categorical scales are measurements taking distinct categories, binary or dichotomous form such as male or female and yes or no responses. The measurements are in multi categories for instance education levels defined as: primary, secondary, diploma, graduate. The scales of measurements can be nominal or ordinal.
• i) Nominal scale: distinct categories which define the variable are unordered

• Each category can be assigned a name: Colour white, black, red.• ii) Ordinal scale: the categories which constitute the variable have some intrinsic order,
but have no consistent and defined intervals between the various categories: poor, average, good, excellent. The scales can be assigned values reflecting magnitude: 1=poor, 2=average, 3=good, 4=excellent using Likert scale rating or relative ranking measurement. The likert scales can be treated as quantitative variables in data analysis.
The quantitative or continuous scales consist of numerical values on well defined scale which may be discrete / discontinuous scale or continuous scale.
• Discrete scale take only particular integer values, typically counts: parity• Continuous scale can take any value within lower and upper bounds: weight• Interval between two adjacent points on the scale are of same magnitude: • Magnitude between: 1 to 2 kg interval same to 3 to 4 kg interval• Measurement process determines the accuracy: weighing scales- digital vs manual
Example1: In a survey of farm households to quantify uptake of ICT in herd recordingMeasurement /response is: uptake of ICT herd recordingExperimental /sampling/observational unit is: Individual households, the level where uptake of ICT is measured
8.2. How Often to Measure the VariablesThis is guided by
• The study design • The objectives• The resources available• The desired level of accuracy
Measurement are taken only once in cross sectional and PRA and occasionally in experimental designs. Measurements are taken repeatedly in observational and experimental designs.
Summary Concentrate on collecting data relevant to the objectives and hypotheses of the study. Record date Uniquely Identify the individual observational units Write in permanent ink to avoid easy rub off Maintain consistency in the number of decimal places used, realistic to accuracy of
measurement used Avoid copying data from sheet of paper to another to minimise errors Variables that can be calculated/derived from raw data be computed within the database
facilities

Learning activitiesa. Review of papers and thesesb. Measuring variables in AICM researchable issues
Assignmentsa. State the data measurement techniques relevant to your research project b. Explain how you will measure variables you need in your research projectc. Summarise data measurement techniques that are commonly used in MSc theses in
AICM, Agricultural Extension programmes
Useful links
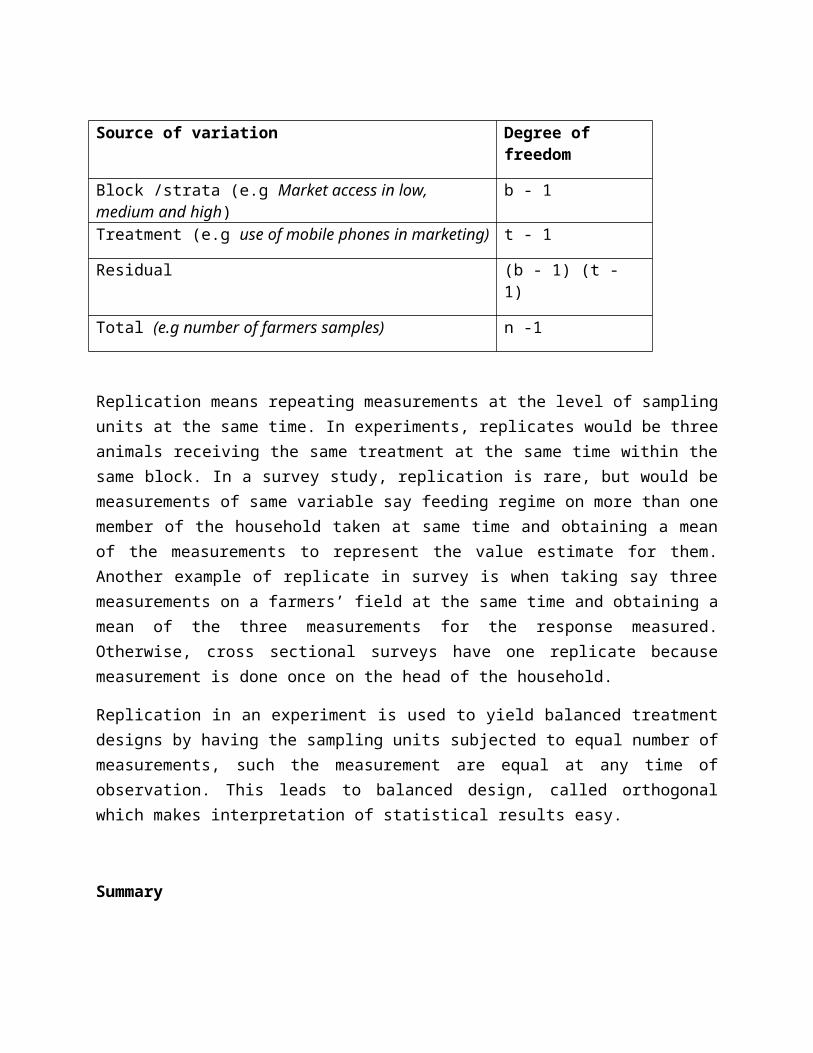
Topic 9: Database Management
IntroductionDatabase is the data processed into computer readable form for analysis. Management of the database management is an important aspect of research process. Collecting data is expensive and time consuming, but receive less attention. Poorly managed research data will:
• Comprise scientific analytical quality of the data and information generated• Lead to wrong conclusions, • Waste resources: time, money, labour, facilities
Learning outcomesBy completion of this topic the learner should be able to:
a. Describe database management processb. Explain principles of database measurementsc. Use some software to design database
Key termsa. Database b. Database software
9.1. Data Processing Procedure for Creating Database• Examine raw data collected• Uniquely Identify the individual observational units• Enter data directly from sheet/questionnaire to electronic database• Edit database and calculate new variables so desired when all data is entered• Manipulate the data when necessary for deriving new variables• Run descriptive statistics to recheck correctness of data entry and derived variables• Validate and clean the data for performing statistical analysis• Create data files for each research objective • Run descriptive summaries to check for anomalies• Re edit and re validate the data then subject the cleaned data to statistical analysis
9.2. Principles of Database DesignThe design of database and questionnaire are much alike in principle
• Identify observational units• Design coding for the variables • Matrix format design• Variables entered in columns for each observational unit entered in the rows

• Identity of observational units entered in the first columns followed with the measurements
• Data entry for missing values be consistent with the software design• May be: left blank, dot, BUT NOT zero value
Design may be simple to complex depending on the data structure• Hierarchical structure design• Multi level structure design• Relational structure design
The database design software could be statistical packages, spreadsheet packages or special database management software. The advantages and weaknesses of these are outlined below.
Statistical packages: SPSS, Genstat, SAS, STATA
AdvantagesData management and analysis possible
DisadvantagesUsually unsuitable for multi-level data structures
Do most that a spreadsheet package does
Lacks security of a relational database management system.
usually have programming capabilities
Graphical facilities not that quality
Spreadsheet: Excel
AdvantagesGood statistical exploratory facilities
DisadvantagesLacks security of a relational database management system
limited Statistical analysis capabilities to simple descriptive
Relational database management systems: Access, dbase
AdvantageSecure
DisadvantageNeeds expertise in database development
Handle complex multi-level data structures
Graphical facilities not good

Allows screen design for data input Analysis limited to descriptive statistics
Have standard facilities for reporting
SummaryThe activities in database management can be summarised as a process from the start to the end of research, because it entails:
1. Identify the observational units2. Designing data collection and recording tool3. Budgeting and planning for data management 4. Choosing the software for creating database5. Planning for electronic data entry and storage6. Data cleaning, and validation7. Organizing data for analysis – data files by each objective, hypothesis8. Calculating variables derived from input variables9. .Archiving data once analyzed and reported
Learning activitiesExercises in database designs using different software
Assignment
Design a database for the information captured with the questionnaire using Access, Excel, SPSS or Genstat
Reference and additional reading materials
Useful links

Topic 10: Data Exploration and Analysis
IntroductionOnce database is ready, it is necessary to ensure accuracy in the dataset before formal statistical analysis in order to obtain valid results. This can be achieved by:
1. Detecting any abnormal and missing values that have to be corrected2. Identifying definite patterns in the data that may have implications on the formal
statistical analysis3. Understanding the extent of variability in the data that may have implications on the
formal analysis
Learning outcomesUpon completion of this topic the learner should be able to:
Key terms
10.1 Data Exploration GoalsThere are two steps involved in data modelling
1. Data exploration and description to understand the data better2. Formal statistical analysis to meet the research objectives
Data exploration is check of data accuracy before performing formal statistical analysis. This enables the researcher to:
a. Detecting any abnormal and missing values that have to be correctedb. Identifying definite patterns in the data that may have implications on the formal
statistical analysisc. Understanding the extent of variability in the data that may have implications on the
formal analysis
Two methods to explore data before formal analysis are to check for normality in the data and perform descriptive statistics. Check for normality in the dataset:
a) Inform decision on whether to perform nonparametric or non parametric statistical procedures
b) Whether to analyse the data as is or to transform The descriptive statistics performed for data check helps the researcher:
a) to gain insight into the magnitude of the difference between samples and factorsb) to identify pattern of distribution, outliers, valid and invalid observations.

10.2. Checking for Normality in Data Distribution
a). Histogram approachOne way to check for normality in the dataset is use of histogram option available in statistical software. The Unimodal, Bell and Symmetrical shapes are good pictorial illustration of normality in the dataset. A histogram deviating from these shapes indicates non normality in the dataset. These shapes are illustrated here,
PCTSCORE
72.071.0
70.069.0
68.067.0
66.065.0
64.063.0
62.061.0
PCTSCORE
Freq
uenc
y
10
8
6
4
2
0
Std. Dev = 2.50
Mean = 66.5
N = 54.00
0.5 1 1.5 2 2.5 3 3.5
Skill in using GIS
0
2
4
6
8
10
Freq
uenc
y
Mean = 1.38Std. Dev. = 0.65N = 13
Skill in using GIS
Normal distribution violation of normality
b). Box plot to check for normalityBox plot can be used to evaluate dataset for normality based on the dispersion parameters: minimum and maximum values, mean, median values, upper and lower quartiles and outliers

2430N =
GROUP
2.01.0
PCTS
CO
RE
74
72
70
68
66
64
62
60
1010N =
groups
tuskervovida
TIM
E
3.5
3.0
2.5
2.0
1.5
1.0
.5
0.0
19
16
3
10
Group 1 normality better than Group 2 Outliers in both groups
c). Normality plot to check normal distribution in data set
The normality plot in statistical software will yield values that fall along the diagonal without substantial or systematic departures if the dataset conforms to normal distribution.
Normal Q-Q Plot of TIME
For GROUP= tusker
Observed Value
3.53.02.52.01.51.0.5
Expe
cted
Nor
mal
1.5
1.0
.5
0.0
-.5
-1.0
-1.5
Normal Q-Q Plot of PCTSCORE
For GROUP= 1.0
Observed Value
72706866646260
Expe
cted
Nor
mal
2
1
0
-1
-2
d). Scatter plot distributionScatter plot is a display of distribution individual values illustrating the association or correlation between two independent variables. The plot can used to present regression line.
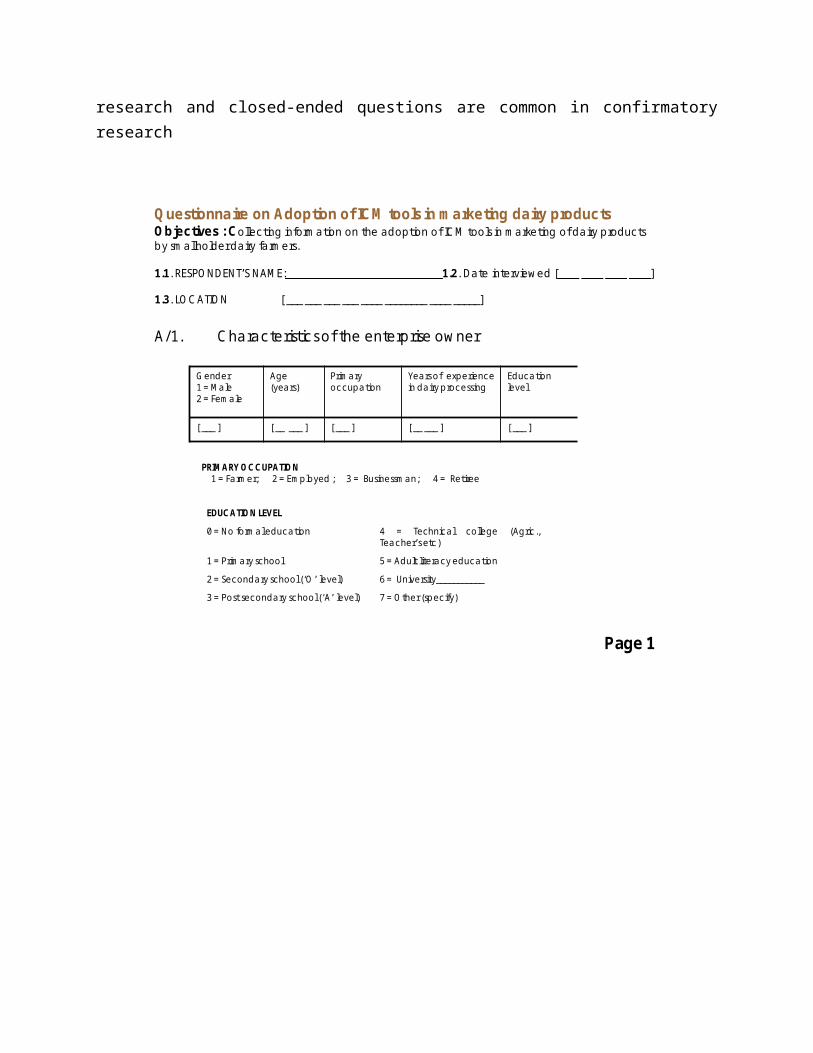
e). Using residuals to check for normality in the dataset
Residuals are the difference between the actual dependent variable value and its predicted value. Residuals are compared using studentized residuals versus the predicted value. Assumptions that residual plot checks are:1. Linearity pattern of linear regression when fitting general linear models. If many predictors are fitted, the regression model can be asked to reduce standardized residual plots and there is option to produce all partial regression plots for examination2. Constancy of residuals, no clear pattern of decreasing or increasing 3. Independence and randomness of residuals, no carry over from one observation to another (dependency)
The graphical analysis of the residuals and their interpretations are summarised here to guide decision making about the normality in a dataset.

Descriptive statisticsDescriptive statistics performed before formal statistics are useful for:
gaining insight into the magnitude of the difference between samples, factors detect pattern of distribution, outliers, valid and invalid observations
The descriptive statistics to guide data check: Frequencies Means, Standard deviations, Standard errors Median, Minimum and maximum observed values

Number of observations valid Coefficient of variations
Decisions to make before data analysis
1. Data transformation if data violates normality• May transform raw data using log, square root, cube root, sin functions• The results not easy to interpret, so transform back to original scale when reporting
2. Handling of missing values• They may be mistakes in recording, blanks during data collection, real values• Do not confuse missing from zero values• Each statistical software treats missing values uniquely , must familiarise yourself • SPPS and excel: . |Genstat: * | SAS: -9999.• May replace them with median, mode or mean, whichever best suits the data pattern• Alternatively omit them altogether
3. Handling outlier values• Values or observations not conforming to the general pattern in the data• To exclude outlier data or not?• Depend on the reason for their occurrence, exclude if mistake• Must formulate objective criteria for exclusion and declare the criteria in the
methodology
Good report writingA scientific research report has a structure reflecting the process of implementation strategy of research. The components of the report would include:
Abstract or summary,
Introduction is setting out the background to the research and defining the purpose of the particular study,
Literature review
Material and Methods is where you describe the way that the study was designed and the analytical methods applied
Results are about summarizing the outcome of the study. Results are presented in form of tables and figures of what the researcher found in the hypothesis testing or research questions analysis. This section is very important because the data is now synthesized or transformed into information. The text must be concise, clear and unambiguous, and allow clearer understanding

of the key points. For clarity, present results in sub headings corresponding to the specific objectives.
Discussion is the section researcher discusses the results key findings, explaining the meaning and potential implications in comparisons to other published work. Results and discussion can sometimes merged, though are better presented separately, unless the format of the report demands merging them.
Report writing is an iterative process, demanding repeated perfecting of the sentence and structure. For a thesis, first produce tables and figures of the results for each specific objective to guide your decision about what need necessarily be reported. With the tables and figures ready, the author can then add the text for the results and discussion. In practice, write the abstract after all sections are ready.
Ethics in scientific reportingEthics is important in scientific reporting to uphold good professionalism. The general principles to check ethics when writing scientific report are outlined here:
It is advisable being objective with a focus on the data clarity in presentation. Report both practical and theoretical implication of the results, whether they statistical
significance or not. Report both positive and negative results, which are interesting for the study objectives. Declare all data from the total sample study without selective reporting, contextualize the
whole study. Describe accurately the methods you used to select sampling units and how
randomization process was achieved. Report the procedures with the criteria you used in data cleaning and screening Report the procedure of data analysis with any assumptions applied and the bearing it has
on reliability of statistical inference. Respect and acknowledge contributions of others you have cited. Decide in advance co-authors of a publication and their order. Generally the first author
will be the one who owns the work, originator of the idea. Consultation is necessary between the co authors on the content.
Authors of a scientific report have the responsibility of acknowledging all who have contributed to the work, and also the source of any material used.

Data modelling• Chose appropriate statistical model for your modelling• Example: quantifying the preference for ICM tools in marketing of dairy products• Model: linear regression, logistic regression, ANOVA
where Yijk is the dependent variable preference, µ = mean,
Ti= technology (i =1-3),
Pj = product (j=1-6),
Mk = marketing difficultyl (k=1,2),
(TP)jk = interaction between technology and product
and eijk is the residual or error term.
Summary
Learning activities
Assignment
References and additional reading materials
Useful links
Topic 11: Reporting Results
IntroductionIntroductionScientific research becomes useful if reported in informative, clear, concise and attractive to readers. Scientific reports generally include an 'Introduction' section setting out the background to the research and defining the purpose of the particular study, a 'Material and Methods' section describing the way that the study was designed and the analytical methods applied, a 'Results' section that summarises the outcome of the study and a 'Discussion' section that discusses the results in the light of other published work.
Learning outcomes
Key terms
11.1. Reporting of results
• Use of tables and figures• Data presented in tables must not be repeated in figures, make a decision• Figures illustrate trends and for few data• Tables are more detailed on quantitative values, level of significance
Presenting tables• Orientation that is easy to read shows comparisons within columns rather than within
rows• The groups compared are presented within rows and the measurements forming basis for
comparison within columns• Reference or control group presented first in the row• Tables and figures must stand alone, self explanatory and numbered and referred in text
in the order they appear• Have clear titles, legends, units of measurements and clear labels• Means reported with SD if descriptive and with SE if ANOVA, regression results• Consistency in the number of decimal places be observed
The table of results here presented has inconsistency in decimal use (in red)

Season e-market information user
n Years
2002 2003 2004 2005 2006 2007 2008
-------------------Sheep prices -----------------------------
Normal users 62 2567 2750 2815 2946 3255 3550.5 4525
Non users 78 2658 2800 2825 2835 2905 2950.5 3275
Drought Non users 78 1957 2045.0 2250 2500 2450 2250 2195
users 62 1970 1985.0 2295 2775 2885 2935 2905
-------------------Goat prices-----------------------------
Drought Non users 58 1757 2045 2150 2600 2410 2050.4 2245
users 74 1870 1985 2195 2875 2845 2735.5 2955
Normal users 74 2567 2750 2815 2946 3255 3550.3 4525
Non users 58 2658 2800 2825 2835 2905 2950.9 3275
Presenting results neatly
Summary
Learning activities
Assignment
References and additional reading materials