Embed Size (px)
Citation preview

8/10/2019 7010-0944 - SokkiaSSF_rm.pdf
http://slidepdf.com/reader/full/7010-0944-sokkiassfrmpdf 1/623

8/10/2019 7010-0944 - SokkiaSSF_rm.pdf
http://slidepdf.com/reader/full/7010-0944-sokkiassfrmpdf 2/623

8/10/2019 7010-0944 - SokkiaSSF_rm.pdf
http://slidepdf.com/reader/full/7010-0944-sokkiassfrmpdf 3/623
SokkiaSpectrum Survey Field
Reference Manual
Part Number 7010-0944
Rev. A
©Copyright Topcon Positioning Systems, Inc.
August, 2009
All contents in this manual are copyrighted by Topcon Positioning Systems,
Inc. All rights reserved. The information contained herein may not be used,
accessed, copied, stored, displayed, sold, modified, published, distributed,
or otherwise reproduced without the expressed written consent from Topcon
Positioning Systems, Inc.

8/10/2019 7010-0944 - SokkiaSSF_rm.pdf
http://slidepdf.com/reader/full/7010-0944-sokkiassfrmpdf 4/623
ECO#3642

8/10/2019 7010-0944 - SokkiaSSF_rm.pdf
http://slidepdf.com/reader/full/7010-0944-sokkiassfrmpdf 5/623
P/N 7010-0944
TOC
i
Table of Contents
Introduction .......................................................... 1-1Security ............................................................................ 1-1Open Job .......................................................................... 1-3
Opening Old Jobs ............................................................ 1-4Main Screen ..................................................................... 1-7
Help Icon’s Pop-up Menu ......................................... 1-9Help .................................................................... 1-9Activate Modules ................................................ 1-10
Port Data Logging .............................................. 1-10Switch Menus ..................................................... 1-12
About .................................................................. 1-13
Working with a Job .............................................. 2-1Creating a New Job .......................................................... 2-2
Select Survey Configuration ..................................... 2-3Coordinate System .................................................... 2-5
Units .......................................................................... 2-6Display ...................................................................... 2-8
Alarms ....................................................................... 2-9Opening a Job .................................................................. 2-10Deleting a Job .................................................................. 2-11
Viewing Job Information ................................................. 2-12
Configuring a Job ................................................. 3-1Configuring the Survey .................................................... 3-2
GPS+ Configuration .................................................. 3-3Configuring the Survey ...................................... 3-4
Base Receiver ..................................................... 3-7Base PP Setup ..................................................... 3-10Base Radio .......................................................... 3-11

8/10/2019 7010-0944 - SokkiaSSF_rm.pdf
http://slidepdf.com/reader/full/7010-0944-sokkiassfrmpdf 6/623
Table of Contents
Sokkia Spectrum Survey Field Reference Manualii
Base Radio Configuration ................................... 3-13
Base Radio Parameters ........................................ 3-14Rover Receiver .................................................... 3-21
Rover PP Setup ................................................... 3-25Modem Connection ............................................. 3-27Laser Config ........................................................ 3-27
Rover Radio ........................................................ 3-29Rover Radio Input ............................................... 3-30Rover Radio Parameters ...................................... 3-30
RE-S1 FH915 Repeater ....................................... 3-31
Output Radio ....................................................... 3-33Config: Output NMEA ........................................ 3-33Config: Beacon .................................................... 3-34Config: BR1 ........................................................ 3-35
SBAS Setup ......................................................... 3-37CDGPS Radio ..................................................... 3-38Config: OmniSTAR ............................................ 3-38
mmGPS+ Parameters .......................................... 3-39
Initialization (Occupation) Times ....................... 3-40Survey Parameters ............................................... 3-41Point Numbering ................................................. 3-44Stake Parameters ................................................. 3-44
Staked Point Icon ................................................ 3-47Advanced ............................................................. 3-48RTK Settings ....................................................... 3-49Miscellaneous ...................................................... 3-50
Total Station Configuration ....................................... 3-50Configuring the Survey ....................................... 3-52Instrument ........................................................... 3-53Monitor Options .................................................. 3-55Connection Mode ................................................ 3-56Cable ................................................................... 3-57
Radio ................................................................... 3-58
Mode ................................................................... 3-59Search/Track ....................................................... 3-60Survey Parameters ............................................... 3-62Edit Prisms .......................................................... 3-66
Stakeout Parameters ............................................ 3-66

8/10/2019 7010-0944 - SokkiaSSF_rm.pdf
http://slidepdf.com/reader/full/7010-0944-sokkiassfrmpdf 7/623
Table of Contents
P/N 7010-0944 iii
Miscellaneous ..................................................... 3-68
Miscellaneous (Level Survey) ............................ 3-70Setting Coordinate System Parameters ............................ 3-72
Projections ................................................................. 3-74Custom Projections ............................................. 3-75From Grid-to-Ground/Ground-to-Grid Transformation
3-78Compute Rotation ............................................... 3-81Compute Azimuth ............................................... 3-82Custom Datums .................................................. 3-83
Geoid List ........................................................... 3-84Add a Geoid File ................................................. 3-85Setting Global Parameters for Job ................................... 3-87Setting Units .................................................................... 3-89
Customizing Data Display ............................................... 3-89Setting Alarms ................................................................. 3-90Modifying Menus ............................................................ 3-91
Exporting Data ...................................................... 4-1Exporting To a Job ........................................................... 4-2
Select a Job ................................................................ 4-2Export To the Job ...................................................... 4-3
Select Point Types To Export ............................. 4-4Select Points to Export ....................................... 4-5Select Code ......................................................... 4-6
Select Point List to Export .................................. 4-7Export Status ....................................................... 4-8Duplicate Objects ............................................... 4-9
Exporting to Device ......................................................... 4-10Selecting Port ............................................................ 4-10
Select File To Export ................................................ 4-11Exporting to File .............................................................. 4-12
Points and Point Lists ................................................ 4-13
Topcon Text Custom .......................................... 4-14Text Custom Report ............................................ 4-20Topcon Text Custom QC .................................... 4-22AutoCAD DXF and AutoCAD Drawing ............ 4-22ESRI Shape ......................................................... 4-24

8/10/2019 7010-0944 - SokkiaSSF_rm.pdf
http://slidepdf.com/reader/full/7010-0944-sokkiassfrmpdf 8/623
Table of Contents
Sokkia Spectrum Survey Field Reference Manualiv
TDS Coordinates ................................................. 4-26
Lines .......................................................................... 4-26Code Library .............................................................. 4-26
Raw Data ................................................................... 4-27Horizontal Alignments ............................................... 4-28Vertical Alignments ................................................... 4-29
X-Section Sets ........................................................... 4-30Roads ......................................................................... 4-30X-Section Templates ................................................. 4-31
Localization ............................................................... 4-32
Scanning Data ............................................................ 4-32Roads Survey ............................................................. 4-32Job History ................................................................. 4-32TINs Data ................................................................... 4-33
Layers ........................................................................ 4-33Multiple ...................................................................... 4-34
Exporting GPS Session .................................................... 4-37
Importing Data ..................................................... 5-1Importing From Job .......................................................... 5-2
Select a Job ................................................................ 5-2Import From the Job .................................................. 5-3
Select Point Types To Import ............................. 5-4Select Points to Import ........................................ 5-5Code .................................................................... 5-6
Select Point List to Import .................................. 5-7Import Status ....................................................... 5-8Duplicate Objects ................................................ 5-9
Importing From Device .................................................... 5-10Selecting Port ............................................................. 5-11
File Import Directory ................................................. 5-12Importing From a File ...................................................... 5-13
Points and Point Lists ................................................ 5-14
Topcon Text Custom ........................................... 5-15AutoCAD DXF and AutoCAD Drawing ............ 5-19TDS Coordinates ................................................. 5-21
Lines .......................................................................... 5-22Code Library .............................................................. 5-22

8/10/2019 7010-0944 - SokkiaSSF_rm.pdf
http://slidepdf.com/reader/full/7010-0944-sokkiassfrmpdf 9/623
Table of Contents
P/N 7010-0944 v
Horizontal Alignments .............................................. 5-23
Vertical Alignments .................................................. 5-23X-Section Sets ........................................................... 5-23
Roads ......................................................................... 5-23X-Section Templates ................................................. 5-24Localization ............................................................... 5-25
Scanning Data ........................................................... 5-25TINs ........................................................................... 5-25Layers ........................................................................ 5-26Multiple Data ............................................................ 5-26
Editing Job Data ................................................... 6-1Points ............................................................................... 6-2
Display Settings ........................................................ 6-4Finding Point by Name ............................................. 6-4
Finding Point by Code .............................................. 6-5Editing a Point ........................................................... 6-6
Edit Point Information ........................................ 6-6
Layer and Style ................................................... 6-11PTL Point ............................................................ 6-12Photo Note .......................................................... 6-13Check Points ....................................................... 6-14Weighted Average .............................................. 6-14
Codes ............................................................................... 6-16Edit Code ................................................................... 6-17
Edit Attributes ........................................................... 6-19Edit Layers ....................................................................... 6-23
View Objects on the Layer ........................................ 6-24
Layer Name ........................................................ 6-24Style Tab ............................................................. 6-24
Objects Tab ......................................................... 6-25Edit Multiple Layers ................................................. 6-26
Linework .......................................................................... 6-27
Edit Line .................................................................... 6-28Points in Line ...................................................... 6-28Layer/Style .......................................................... 6-30
Area .................................................................................. 6-30Edit Area ................................................................... 6-31

8/10/2019 7010-0944 - SokkiaSSF_rm.pdf
http://slidepdf.com/reader/full/7010-0944-sokkiassfrmpdf 10/623
Table of Contents
Sokkia Spectrum Survey Field Reference Manualvi
Points in Area ...................................................... 6-32
Edit a Layer/Style ................................................ 6-32Point Lists ......................................................................... 6-33
List of Point Lists ....................................................... 6-33Edit Point List ..................................................... 6-34
Raw Data .......................................................................... 6-37
Edit Raw Data ............................................................ 6-38Background Images .......................................................... 6-41
Add Image ................................................................. 6-43
Properties ................................................................... 6-44
Sessions ............................................................................ 6-45Session Setup ............................................................. 6-46Simulation Setup .............................................................. 6-47
Editing Roads ....................................................... 7-1Roads ................................................................................ 7-2
Edit Road ................................................................... 7-4Horizontal Alignment ....................................................... 7-5
Edit the Horizontal Alignment ................................... 7-6Add a Line ........................................................... 7-11Add a Curve ........................................................ 7-12Add a Spiral ......................................................... 7-13Intersection Point ................................................ 7-14
Vertical Alignments ......................................................... 7-16Add Vertical Alignments ........................................... 7-17
Edit Vertical Alignments ........................................... 7-18Elements .............................................................. 7-18Vertical Grade ..................................................... 7-22
Edit a Curve ......................................................... 7-23Long Sections ...................................................... 7-24
Cross Section Templates .................................................. 7-26Edit X-Section Template ........................................... 7-27
Cross Section Segments ...................................... 7-28
Cross Section Sets ............................................................ 7-29Edit Cross Section Set ............................................... 7-30
Cross-Section ...................................................... 7-32Calculate Road Points ...................................................... 7-33
Centerline Points Parameters ..................................... 7-34

8/10/2019 7010-0944 - SokkiaSSF_rm.pdf
http://slidepdf.com/reader/full/7010-0944-sokkiassfrmpdf 11/623
Table of Contents
P/N 7010-0944 vii
Right Offset Points Parameters ................................. 7-35
Left Offset Point Parameters ..................................... 7-37
Setting up GPS ..................................................... 8-1Starting the Base .............................................................. 8-2
Correct the Base ........................................................ 8-4Multi Base ................................................................. 8-5Grid to Ground .......................................................... 8-6
Starting Static Occupation ............................................... 8-6Localization ..................................................................... 8-8
Add Localization Point ............................................. 8-10Localization Details .................................................. 8-11
GPS+ Survey Status ......................................................... 8-12Position ...................................................................... 8-13
Elevation Mask ................................................... 8-14
System ....................................................................... 8-15Log History ............................................................... 8-16Multi Base ................................................................. 8-16
Position Plots ............................................................. 8-18Properties ............................................................ 8-19
Satellites .................................................................... 8-20Help Icon Options ..................................................... 8-22
Configure OmniSTAR ........................................ 8-23Configure Beacon ............................................... 8-25BR-1 Configuration ............................................ 8-26
Configure Radio ................................................. 8-27Configure RE-S1 Repeater ................................. 8-32mmGPS+ Options ............................................... 8-33
Known Point Initialization ............................................... 8-34Initialize mmGPS+ .......................................................... 8-35
Transmitter Data ........................................................ 8-35Transmitter .......................................................... 8-36
Transmitter Position .................................................. 8-37
Known Point ....................................................... 8-38Resection ............................................................ 8-39
Sensor ........................................................................ 8-42Field Calibration ........................................................ 8-43

8/10/2019 7010-0944 - SokkiaSSF_rm.pdf
http://slidepdf.com/reader/full/7010-0944-sokkiassfrmpdf 12/623
Table of Contents
Sokkia Spectrum Survey Field Reference Manualviii
GPS Survey .......................................................... 9-1Topo Survey ..................................................................... 9-2
The Topo Menu ......................................................... 9-3
Data ............................................................................ 9-7Offsets ........................................................................ 9-9
Line ..................................................................... 9-10Azimuth-Distance-Height ................................... 9-12Laser Configuration ............................................ 9-13
Grid Setup .................................................................. 9-16Auto Topo Survey ............................................................ 9-18
Auto Topo .................................................................. 9-19Data ............................................................................ 9-21
Map ............................................................................ 9-21X-Section .......................................................................... 9-22Find Station ...................................................................... 9-22
Tape Dimension ............................................................... 9-23
Setting up TS Survey ........................................... 10-1
Backsight Survey .............................................................. 10-2Multi-Point Backsight ................................................ 10-6Check Backsight ........................................................ 10-8
Station and Offset ...................................................... 10-8Set Measurement Mode ............................................. 10-9
Resection .......................................................................... 10-11Occupation Point ....................................................... 10-11Resection 3D .............................................................. 10-12
Store Point ................................................................. 10-14Resection Options ...................................................... 10-15
Remote Benchmarks ........................................................ 10-16Remote Control ................................................................ 10-18
Rotate ......................................................................... 10-20
Total Station Survey ............................................ 11-1
Topo ................................................................................. 11-2Sideshot-Direct .......................................................... 11-4PTL Mode .................................................................. 11-6Offsets ........................................................................ 11-9
Horizontal Angle Offset ...................................... 11-10

8/10/2019 7010-0944 - SokkiaSSF_rm.pdf
http://slidepdf.com/reader/full/7010-0944-sokkiassfrmpdf 13/623
Table of Contents
P/N 7010-0944 ix
Horizontal/Vertical Angle .................................. 11-13
Distance Offset ................................................... 11-14Hidden Point ....................................................... 11-16
Two Line Intersection ......................................... 11-17Line and Corner .................................................. 11-18Line and Offset ................................................... 11-19
Plane and Corner ................................................ 11-20Auto Topo ........................................................................ 11-22Cross-Section ................................................................... 11-25
XSection - Direct ....................................................... 11-26
Find Station ...................................................................... 11-27Tape Dimension ............................................................... 11-29Reference Line .......................................................... 11-29Tape Dimension Points ............................................. 11-30
Missing Line .................................................................... 11-31Scanning .......................................................................... 11-32
Scanning with an Image ............................................ 11-32
View Scan ........................................................... 11-33
Orientation .......................................................... 11-34Orientation Results ............................................. 11-37Selecting Scan Area ............................................ 11-38
Interval ...................................................................... 11-39Time Estimate ........................................................... 11-40Scanning without an Image ....................................... 11-41Area ........................................................................... 11-42Scan ........................................................................... 11-43
Monitor ............................................................................ 11-44Monitor PointList ...................................................... 11-44Monitor ...................................................................... 11-45
Digital Level Survey ............................................. 12-1Level Run ......................................................................... 12-2
DL Level Run ............................................................ 12-3
Display Settings .................................................. 12-6Two Peg Test ................................................................... 12-6
Two Peg Test Results ................................................ 12-8

8/10/2019 7010-0944 - SokkiaSSF_rm.pdf
http://slidepdf.com/reader/full/7010-0944-sokkiassfrmpdf 14/623
Table of Contents
Sokkia Spectrum Survey Field Reference Manualx
Staking out ........................................................... 13-1Points ................................................................................ 13-2
Stakeout Point ............................................................ 13-2
GPS+ Stakeout ........................................................... 13-4TS Stakeout ................................................................ 13-5
Configure Link .................................................... 13-7Store Design Pt/Layer ................................................ 13-7Design Offsets ........................................................... 13-8Store Point ................................................................. 13-9DL Stakeout ............................................................... 13-12
Stake Point .......................................................... 13-12Stakeout ............................................................... 13-13
Lines ................................................................................. 13-14GPS+ Stakeout .................................................... 13-15TS Stakeout ......................................................... 13-16
Offsets .............................................................................. 13-17Line & Offsets ........................................................... 13-17
Station & Offsets ................................................. 13-19
GPS+ Stakeout .................................................... 13-20Initial Point Name ............................................... 13-21TS Stakeout ......................................................... 13-22
Stakeout Intersections & Offsets ............................... 13-23GPS+ Stakeout .................................................... 13-25TS Stakeout ......................................................... 13-26
Three Point Curve & Offsets ..................................... 13-27
Curves & Offsets ....................................................... 13-29Spiral & Offset ........................................................... 13-30
Digital Terrain Model Stakeout ........................................ 13-32Open DTM ................................................................. 13-33
GPS+ Stakeout .................................................... 13-34
TS Stakeout ......................................................... 13-34Point in Direction ............................................................. 13-35
GPS+ Stakeout ........................................................... 13-36
TS Stakeout ................................................................ 13-37Point List .......................................................................... 13-38
Stakeout (GPS and TS) .............................................. 13-40Select Point for the Stakeout ............................... 13-40
Digital Level Stakeout ............................................... 13-41

8/10/2019 7010-0944 - SokkiaSSF_rm.pdf
http://slidepdf.com/reader/full/7010-0944-sokkiassfrmpdf 15/623
Table of Contents
P/N 7010-0944 xi
DL Stakeout of Elevations ............................................... 13-42
Curve ................................................................................ 13-43GPS+ Stakeout .................................................... 13-44
TS Stakeout ......................................................... 13-45Real Time Road ............................................................... 13-46
GPS+ Stakeout .................................................... 13-47
TS Stakeout ......................................................... 13-48Road ................................................................................. 13-49
GPS+ Stakeout .................................................... 13-51TS Stakeout ......................................................... 13-52
Slope ................................................................................ 13-53GPS+ Stakeout .................................................... 13-56TS Stakeout ......................................................... 13-56
Linework .......................................................................... 13-58
COGO Calculations .............................................. 14-1Inverse .............................................................................. 14-3
Point to Point ............................................................. 14-3
Point to Line .............................................................. 14-7Point to Points List .................................................... 14-9
Point in Direction ............................................................. 14-11Compute the Intersection Point ....................................... 14-14Calculator ......................................................................... 14-17Curve Solutions ............................................................... 14-18
Calculating the Parameters of a Curve ...................... 14-19
Three-Points Curve ................................................... 14-22PI & Tangents ........................................................... 14-24Radius & Points ......................................................... 14-27
Area .................................................................................. 14-29By Points ................................................................... 14-29
The Hinge Method .................................................... 14-31The Line Method ....................................................... 14-34
Corner Angle ................................................................... 14-37
Line Offset ....................................................................... 14-39Station & Offset ........................................................ 14-40
Curve Offset ..................................................................... 14-42Calculating a Road Offset ................................................ 14-44Adjusting Points ............................................................... 14-46

8/10/2019 7010-0944 - SokkiaSSF_rm.pdf
http://slidepdf.com/reader/full/7010-0944-sokkiassfrmpdf 16/623
Table of Contents
Sokkia Spectrum Survey Field Reference Manualxii
Rotate ......................................................................... 14-46
Select Points by Range ........................................ 14-47Translate .................................................................... 14-48
Scale ........................................................................... 14-502D Transform ............................................................. 14-51
Point Pair Info ..................................................... 14-53
Traverse Adjustment .................................................. 14-53Adjustment Parameters ....................................... 14-54Adjustment .......................................................... 14-55
Traverse ............................................................................ 14-56
BS Point ..................................................................... 14-58
Viewing Map ......................................................... 15-1Toolbar ............................................................................. 15-2
Select Point ................................................................ 15-3
Properties ................................................................... 15-3Actions on the Map .......................................................... 15-4
Switching Instruments ........................................ 16-1Observation Mode ............................................................ 16-1
File Formats ......................................................... A-1Point Coordinate Formats ................................................. A-1
Text (Custom Format) ............................................... A-1FC-4 ........................................................................... A-2
FC-5 ........................................................................... A-3GTS-6 ........................................................................ A-3FC-6/GTS-7 ............................................................... A-4GTS-7 with strings ..................................................... A-4
GT .............................................................................. A-5GT-FIN ...................................................................... A-5MMH360 ................................................................... A-6
DXF ........................................................................... A-7
KOF ........................................................................... A-7SHP ............................................................................ A-12Cut Sheet Standard .................................................... A-13Cut Sheet User Defined ............................................. A-13
Check Sheet ............................................................... A-14

8/10/2019 7010-0944 - SokkiaSSF_rm.pdf
http://slidepdf.com/reader/full/7010-0944-sokkiassfrmpdf 17/623
Table of Contents
P/N 7010-0944 xiii
PTL Sheet .................................................................. A-15
CMM ......................................................................... A-15Land XML ................................................................. A-15
CR5 ........................................................................... A-15MOSS GENIO .......................................................... A-16NEZ ........................................................................... A-17
NEZ with strings ....................................................... A-17Custom Format with Quality Control information .... A-18
Code Libraries ................................................................. A-19Topcon Data Dictionary Format (TDD) ................... A-19
XML File as Storage of the Code Library (XML) .... A-20Data Base Format as Storage of the Code Library (DBF) A-22
Roads Formats ................................................................. A-22
SSS Road ................................................................... A-22TDS Road .................................................................. A-23MC Road ................................................................... A-27
LandXML Road ........................................................ A-27
Sokkia SSF Road format v.2.0 .................................. A-27CLIP .......................................................................... A-29ISPOL ........................................................................ A-30MX GENIO ............................................................... A-31Tekla XRoad & XStreet (VGP) ................................ A-33
Horizontal Elements ........................................... A-33Vertical Elements ............................................... A-35
X-sect Templates Formats ............................................... A-36SSS Template ............................................................ A-36TDS X-section Template ........................................... A-36Sokkia SSF Template ................................................ A-37
Localization Format ......................................................... A-38GC3 ........................................................................... A-38
Roads Survey Formats ..................................................... A-38
X-Section Surveys ..................................................... A-38
Find Station Report ................................................... A-38Raw Data Formats ........................................................... A-39
FC-5 ........................................................................... A-39GTS-6 ........................................................................ A-39
FC-6/GTS-7 ............................................................... A-40

8/10/2019 7010-0944 - SokkiaSSF_rm.pdf
http://slidepdf.com/reader/full/7010-0944-sokkiassfrmpdf 18/623
Table of Contents
Sokkia Spectrum Survey Field Reference Manualxiv
Land XML ................................................................. A-43
TDS RawData ............................................................ A-43MOSS Survey ............................................................ A-43
Field Book ................................................................. A-44Berlin GNSS .............................................................. A-46
Scanning Data Format ...................................................... A-46
DI-3000 ...................................................................... A-46Job History ....................................................................... A-48
CSV ............................................................................ A-48
Report ........................................................................ A-48

8/10/2019 7010-0944 - SokkiaSSF_rm.pdf
http://slidepdf.com/reader/full/7010-0944-sokkiassfrmpdf 19/623

8/10/2019 7010-0944 - SokkiaSSF_rm.pdf
http://slidepdf.com/reader/full/7010-0944-sokkiassfrmpdf 20/623
Preface
Sokkia Spectrum Survey Field Reference Manualxvi
TRADEMARKS Topcon®, HiPer®, TopSURV™, Topcon Link™,Topcon Tools™, and Topcon Positioning Systems™ are trademarksor registered trademarks of TPS. Windows® and ActiveSync® are
registered trademarks of the Microsoft Corporation. Bluetooth® is aregistered trademark owned by Bluetooth SIG, Inc. and is used byTopcon Positioning Systems, Inc. under license. Sokkia Corporationand the names of Sokkia Corporation products referenced herein areeither trademarks or registered trademarks of Sokkia Corporation.Satel is a trademark of Satel, Oy. Other product and company namesmentioned herein may be trademarks of their respective owners.
DISCLAIMER OF WARRANTY EXCEPT FOR ANYWARRANTIES IN AN APPENDIX OR A WARRANTY CARDACCOMPANYING THE PRODUCT, THIS MANUAL, THEPRODUCT, AND ANY ACCOMPANYING SOFTWARE AREPROVIDED “AS-IS.” THERE ARE NO OTHER WARRANTIES.TPS DISCLAIMS ANY IMPLIED WARRANTY OFMERCHANTABILITY OR FITNESS FOR ANY PARTICULAR
USE OR PURPOSE. TPS AND ITS DISTRIBUTORS SHALL NOTBE LIABLE FOR TECHNICAL OR EDITORIAL ERRORS OROMISSIONS CONTAINED HEREIN; NOR FOR INCIDENTAL
OR CONSEQUENTIAL DAMAGES RESULTING FROM THEFURNISHING, PERFORMANCE OR USE OF THIS MATERIAL,
THE SOFTWARE, OR THE PRODUCT. SUCH DISCLAIMEDDAMAGES INCLUDE, BUT ARE NOT LIMITED TO, LOSS OFTIME, LOSS OR DESTRUCTION OF DATA, LOSS OF PROFIT,
SAVINGS OR REVENUE, OR LOSS OF THE PRODUCT’S USE.IN ADDITION, TPS IS NOT RESPONSIBLE OR LIABLE FORDAMAGES OR COSTS INCURRED IN CONNECTION WITHOBTAINING SUBSTITUTE PRODUCTS OR SOFTWARE,CLAIMS BY OTHERS, INCONVENIENCE, OR ANY OTHERCOSTS. IN ANY EVENT, TPS SHALL HAVE NO LIABILITYFOR DAMAGES OR OTHERWISE TO YOU OR ANY OTHERPERSON OR ENTITY IN EXCESS OF THE PURCHASE PRICE
FOR THE PORDUCT.
LICENSE AGREEMENT Use of the Software and any other computerprograms or software supplied by TPS or downloaded from a TPSwebsite (the “Software”) to be used with a Topcon Product

8/10/2019 7010-0944 - SokkiaSSF_rm.pdf
http://slidepdf.com/reader/full/7010-0944-sokkiassfrmpdf 21/623

8/10/2019 7010-0944 - SokkiaSSF_rm.pdf
http://slidepdf.com/reader/full/7010-0944-sokkiassfrmpdf 22/623
Preface
Sokkia Spectrum Survey Field Reference Manualxviii
should only be repaired by authorized TPS warranty service centers.
Users should review and heed the safety warnings in the manualaccompanying the Product.
MISCELLANEOUS The above Terms and Conditions may beamended, modified, superseded, or canceled, at any time by TPS. Theabove Terms and Conditions will be governed by, and construed inaccordance with, the laws of the State of California, without referenceto conflict of laws.
Manual ConventionsThis manual uses the following conventions:
Example Explanation
File
Exit tap the File menu and tap Exit.
Enter Indicates the button or key labeled Enter.
Notes Indicates a field on a dialog box or screen, or a tab
within a dialog box or screen.Topo Indicates the name of a dialog box or screen.
TIP
Supplementary information that can help youconfigure, maintain, or set up a system.
NOTICE
Supplementary information that can have an affecton system operation, system performance,measurements, personal safety.

8/10/2019 7010-0944 - SokkiaSSF_rm.pdf
http://slidepdf.com/reader/full/7010-0944-sokkiassfrmpdf 23/623

8/10/2019 7010-0944 - SokkiaSSF_rm.pdf
http://slidepdf.com/reader/full/7010-0944-sokkiassfrmpdf 24/623
Introduction
Sokkia Spectrum Survey Field Reference Manual1-2
modes: TS, Contractor, Robotic, GPS+, GIS (RT DGPS and PP
DGPS), Roads, and mmGPS.
Figure 1-1. Security
NOTICE
If upgrading existing Sokkia SSF to Sokkia SSF
7.3, the updated security key is required to completethe installation of this upgrade. For help inacquiring this security key, [email protected].

8/10/2019 7010-0944 - SokkiaSSF_rm.pdf
http://slidepdf.com/reader/full/7010-0944-sokkiassfrmpdf 25/623
Open Job
P/N 7010-0944 1-3
To run a demo version of Sokkia SSF, tap OK; a confirmation
message displays (Figure 1-2). Tap OK to confirm using Sokkia SSFin the Demo Mode.
Figure 1-2. Run Demo Mode?
Open Job
Initially, Sokkia SSF opens only a Default job created upon programinstallation (Figure 1-3). On the Open Job screen do the following:
Figure 1-3. Open Job
• Open – press to create the Default (current) job and returns to themain screen.

8/10/2019 7010-0944 - SokkiaSSF_rm.pdf
http://slidepdf.com/reader/full/7010-0944-sokkiassfrmpdf 26/623
Introduction
Sokkia Spectrum Survey Field Reference Manual1-4
• New – press to create a new job.
• Exit – press to quit the program.
• Browse – press to display browse directories to open a job from aremote directory. Highlight the file and press OK (Figure 1-4).
Figure 1-4. Open a New Job
Opening Old Jobs
Sokkia SSF job files are made universal to be compatible on both
controllers and personal computers. They have the tsj extension andneed no conversion.
• To open a job created in a previous version of Sokkia SSF, tapJob
Open Job, then tap the Browse button in the Open Job screen (Figure 1-3 on page 1-3). Then select the Ts6 Job Files

8/10/2019 7010-0944 - SokkiaSSF_rm.pdf
http://slidepdf.com/reader/full/7010-0944-sokkiassfrmpdf 27/623
Opening Old Jobs
P/N 7010-0944 1-5
(*.tsv) type, navigate to the desired tsv job, highlight it, and press
OK.
Figure 1-5. Open Job Created in Previous Version of Sokk ia SSF
• OK – starts upgrading the job.
The progress bar shows the upgrading in progress.• Cancel – aborts upgrading of software. When the process is
complete, the Cancel button turns into the Done button(Figure 1-6 on page 1-5).
• Done – closes the screen and opens the upgraded job.
Figure 1-6. Job Upgrade Progression Bar

8/10/2019 7010-0944 - SokkiaSSF_rm.pdf
http://slidepdf.com/reader/full/7010-0944-sokkiassfrmpdf 28/623
Introduction
Sokkia Spectrum Survey Field Reference Manual1-6
After pressing the Done button, the *.tsv file turns into the *.tsj file
and the Archive folder is created in the directory, where the *.tsv filewas located. This folder stores the tsv jobs.
Also, if the job had job history, a directory called by the same nameas the job, is created to store the *.xml file with the job history
(Figure 1-7).
Figure 1-7. Upgraded Jobs

8/10/2019 7010-0944 - SokkiaSSF_rm.pdf
http://slidepdf.com/reader/full/7010-0944-sokkiassfrmpdf 29/623
Main Screen
P/N 7010-0944 1-7
Main Screen
The Sokkia SSF main screen consists of a title bar and a main menu.
Figure 1-8. Sokkia SSF Main Screen
The title bar of the main menu screen shows the name of the job that
is open and the following icons (Table 1-1).
NOTICESokkia SSF has two implementations of thegraphical user interface: Icon-based and List-based.By default, Sokkia SSF uses the Icon-basedinterface for fast and easy program operation.
Table 1-1. Tit le Bar Icons
Icon Description
Topcon Logo Help Icon – opens a pop-up menu giving access to the
help files and some options specific to the current open screen
Controller Power Status Icon – shows power status
Reconnect Icon – reconnects other Bluetooth enabled devices to the
controller
Connection Status Icon – shows connection status
Exit Icon – closes Sokkia SSF. When in a submenu, it turns into the
button to return to the main menu.

8/10/2019 7010-0944 - SokkiaSSF_rm.pdf
http://slidepdf.com/reader/full/7010-0944-sokkiassfrmpdf 30/623
Introduction
Sokkia Spectrum Survey Field Reference Manual1-8
Within a menu option, the title bar displays the Help Icon, the name
of the open screen, and any system buttons (e.g., OK, Cancel,Finish) required for various operations (Figure 1-4 on page 1-4).
The Sokkia SSF Icon Menu of the main screen contains the followingicons to provide access to job configuration, setup, display, and other
jobsite functions, and to control data (Table 1-2):Table 1-2. Main Menu Icons
Icon Description
Job – opens a submenu to create, open, delete a job or get information
about an active job. For details on the options, see “Working with a
Job” on page 2-1.
Configure – opens a submenu to create or change a configuration for a
job. For details on the options, see “Configuring a Job” on page 3-1.
The icon changes its appearance and reflects the instrument set for use
in the current job.
Export – opens a submenu to export job data to a new job, controller
or a file. For details on the options, see “Exporting Data” on page 4-1.
Import – opens a submenu to import data from a job, controller or a
file. For details on the options, see “Importing Data” on page 5-1.
Edit Job – opens a submenu to edit the job data.
For details on the options, see “Editing Job Data” on page 6-1.
Edit Roads – opens a submenu to edit roads. For details on the options,
see “Editing Roads” on page 7-1.
Setup Base – is used to set up GPS surveying. For details on the
options, see “Setting up GPS” on page 8-1.
Setup – is used to set up backsight and occupation points to start a
Total Station survey. For details on the options, see “Setting up TS
Survey” on page 10-1.
Survey – opens a submenu to conduct a survey. For details on the
options, see “GPS Survey” on page 9-1, “Total Station Survey” on
page 11-1 and “Digital Level Survey” on page 12-1.

8/10/2019 7010-0944 - SokkiaSSF_rm.pdf
http://slidepdf.com/reader/full/7010-0944-sokkiassfrmpdf 31/623
Main Screen
P/N 7010-0944 1-9
Help Icon’s Pop-up Menu
The Help Icon opens a pop-up menu giving access to the help files,
module activation codes, port data logging, changing menu interface,and information about Sokkia SSF.
Help
The Help option opens the Sokkia SSF Help topics screen(Figure 1-9).
Figure 1-9. Help Topics
Stake – opens a submenu to stake out objects. For details on the
options, see “Staking out” on page 13-1.
COGO – opens a submenu to calculate cogo tasks. For details on the
options, see “COGO Calculations” on page 14-1.
Map – opens the map for the current job. For details on the options,
see “Viewing Map” on page 15-1.
Mode – switches between GPS and Total Station instruments for a
survey. For details on the options, see “Switching Instruments” on
page 16-1.
Table 1-2. Main Menu Icons (Continued)
Icon Description

8/10/2019 7010-0944 - SokkiaSSF_rm.pdf
http://slidepdf.com/reader/full/7010-0944-sokkiassfrmpdf 32/623
Introduction
Sokkia Spectrum Survey Field Reference Manual1-10
Activate Modules
To view or to add the ID’s for activating the main features in Sokkia
SSF, select the Activate Modules option.The Security screen (Figure 1-10) displays the following device
numbers and the IDs that have been entered.
• Key Value 1,2 – the default key values of the controller.
• Activation IDs – the codes needed to enable observation modesand usage of roads in Sokkia SSF.
• OK – saves the ID values, and if allowed, provides access to theobservation modes and creating and using roads.
Figure 1-10. Security
Port Data Logging
To view incoming and outgoing traffic information of a controllerport connected to Sokkia SSF and to save this data to a file, select thePort Data Logging option.
The Port Logging screen displays (Figure 1-11 on page 1-11) butinitially shows no data. Tap the Help Icon in the upper-left corner of
the screen to view data. The Help icon opens a pop-up menu thatcontains the following options:
• Show incoming port data – check mark to view incoming data.
• Show outgoing port data – check mark to view outgoing data.

8/10/2019 7010-0944 - SokkiaSSF_rm.pdf
http://slidepdf.com/reader/full/7010-0944-sokkiassfrmpdf 33/623
Main Screen
P/N 7010-0944 1-11
• Pause logging to screen – check mark to freeze showing port
traffic.
• Help – gives access to Help files.
Figure 1-11. Port Logging
• Log to file – check mark this box to save the data to a file. The
Save File screen displays (Figure 1-12). Assign a name and selecta desired directory in which to save the file on the controller.
Figure 1-12. Save File
Help Icon
8/10/2019 7010-0944 - SokkiaSSF_rm.pdf
http://slidepdf.com/reader/full/7010-0944-sokkiassfrmpdf 34/623
Introduction
Sokkia Spectrum Survey Field Reference Manual1-12
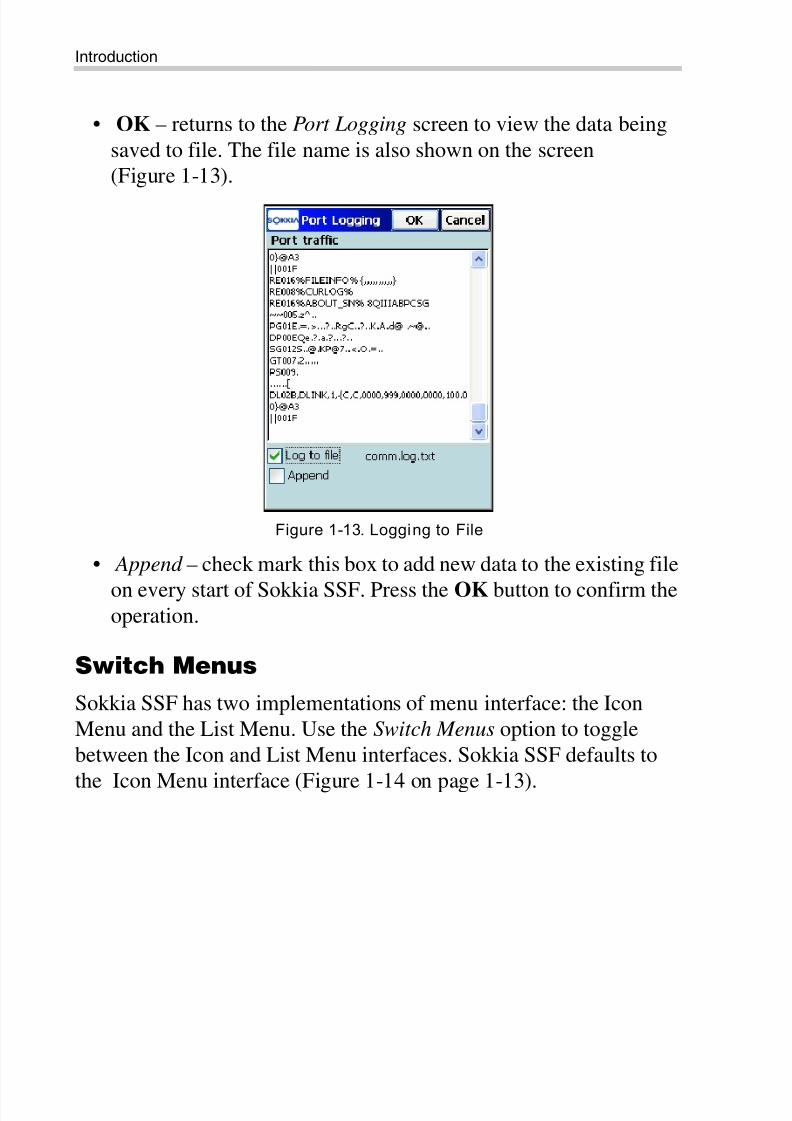
• OK – returns to the Port Logging screen to view the data being
saved to file. The file name is also shown on the screen(Figure 1-13).
Figure 1-13. Logging to File
• Append – check mark this box to add new data to the existing file
on every start of Sokkia SSF. Press the OK button to confirm theoperation.
Switch Menus
Sokkia SSF has two implementations of menu interface: the IconMenu and the List Menu. Use the Switch Menus option to togglebetween the Icon and List Menu interfaces. Sokkia SSF defaults to
the Icon Menu interface (Figure 1-14 on page 1-13).

8/10/2019 7010-0944 - SokkiaSSF_rm.pdf
http://slidepdf.com/reader/full/7010-0944-sokkiassfrmpdf 35/623
Main Screen
P/N 7010-0944 1-13
Figure 1-14. List Menu
About
To view basic information about Sokkia SSF, tap the About option.
The About Sokkia SSF screen (Figure 1-15) displays the softwarename, version, copyright, and build date.
Figure 1-15. About Sokkia SSF

8/10/2019 7010-0944 - SokkiaSSF_rm.pdf
http://slidepdf.com/reader/full/7010-0944-sokkiassfrmpdf 36/623
Introduction
Sokkia Spectrum Survey Field Reference Manual
Notes:
1-14

8/10/2019 7010-0944 - SokkiaSSF_rm.pdf
http://slidepdf.com/reader/full/7010-0944-sokkiassfrmpdf 37/623
P/N 7010-0944
Chapter 2
2-1
Working with a JobTo work with job files, tap the Job icon in the main menu(Figure 2-1)
The Job folder contains the following options:
1. New (create) a job2. Open a job
3. Delete a job
4. Job Information (Print information from an active job)
Figure 2-1. Job Menu
The Help Icon opens a pop-up menu, giving access to the Helpfiles, module activation codes, port data logging, changing menuinterface, and information about the Sokkia SSF used (for detail see“Help Icon’s Pop-up Menu” on page 1-9).
TIP
If the menu options you need are not visible, tapConfigure / Menus icons and enable these options inthe Config Menus screen.

8/10/2019 7010-0944 - SokkiaSSF_rm.pdf
http://slidepdf.com/reader/full/7010-0944-sokkiassfrmpdf 38/623
Working with a Job
Sokkia Spectrum Survey Field Reference Manual2-2
Creating a New Job
To create a new job, tap the New Job icon.
The New Job screen (Figure 2-2) starts the new job creation process,which is performed with the help of a Wizard.
Figure 2-2. New Job
Fill in the fields on the New Job screen (only the Name ismandatory). On controllers with pop-up soft keyboards, place the
cursor in the field to have the soft keyboard open on-screen (Figure 2-3).
Figure 2-3. On-screen Soft Keyboard

8/10/2019 7010-0944 - SokkiaSSF_rm.pdf
http://slidepdf.com/reader/full/7010-0944-sokkiassfrmpdf 39/623
Creating a New Job
P/N 7010-0944 2-3
• Name – the name of the new job.
• Created By – the name or some other identifier of the surveyor.
• Comments – any additional information about the project, forexample, the conditions of survey.
• Current Date – displays the current date and time.
• Browse – changes the directory in which to look for a job. Bydefault, job files are stored in the Jobs folder in the directorywhere the application was installed. The path to the job file
displays in the upper-part of the screen. The last specified filepath is retained.
• Next – opens the Survey Style screen (Figure 2-4).
• Finish – saves the information and returns to the main screen.The new job becomes the current job and uses the settings from
the previously open job, unless changed.
Select Survey Configuration
On the Survey Style screen (Figure 2-4 on page 2-3) select a surveyconfiguration for the new job.
Parameters for the survey configuration do not depend on the job.One configuration can be used for several Jobs.

8/10/2019 7010-0944 - SokkiaSSF_rm.pdf
http://slidepdf.com/reader/full/7010-0944-sokkiassfrmpdf 40/623
Working with a Job
Sokkia Spectrum Survey Field Reference Manual2-4
Figure 2-4. Select Survey Configuration
Sokkia SSF contains several pre-defined configurations: My RTK , My
Network RTK, My Network DGPS, My RT DGPS, My PP Static, My
PP Kinematic and My PP DGPS for GPS+ mode; My Conventional,
My Reflectorless, My Robotic and My Level for TS mode.
• GPS+ Config – shows the GPS+ configuration for the current job. The drop-down list shows the configurations available for
the GPS+ mode.
• TS Config – shows the total station configuration for the current
job. The drop-down list shows the configurations available forthe TS mode.
• – opens the Configurations screen to edit a configuration(see Figure 3-3 on page 3-3 for details).
• Back – returns to the previous screen.
• Next – opens the Coordinate Systems screen (Figure 2-5 onpage 2-5).
• Finish – saves the settings, and returns to the main screen.
NOTICE
The job settings of a survey configuration areapplied only after opening a Sokkia SSF screenwhich can perform and store measurements in the job file.
8/10/2019 7010-0944 - SokkiaSSF_rm.pdf
http://slidepdf.com/reader/full/7010-0944-sokkiassfrmpdf 41/623
Creating a New Job
P/N 7010-0944 2-5
For more information on how to work with configurations, see
“Configuring the Survey” on page 3-2.
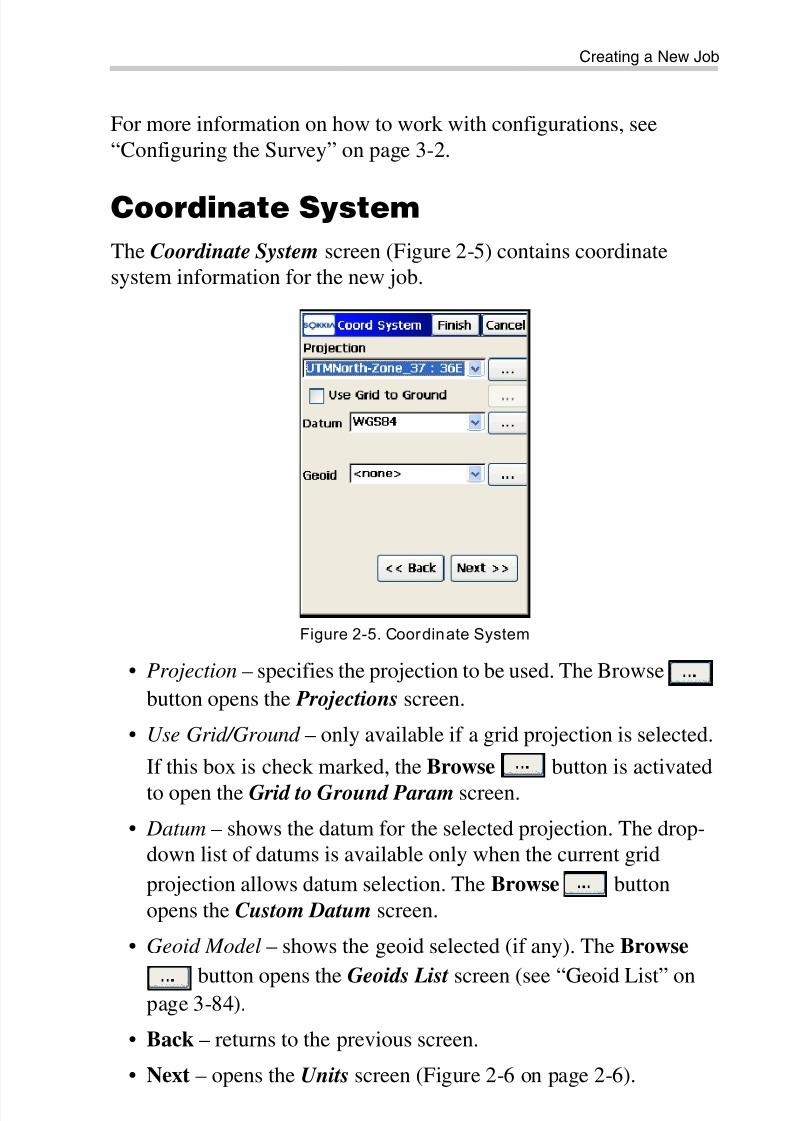
Coordinate System
The Coordinate System screen (Figure 2-5) contains coordinatesystem information for the new job.
Figure 2-5. Coordinate System
• Projection – specifies the projection to be used. The Browse
button opens the Projections screen.
• Use Grid/Ground – only available if a grid projection is selected.
If this box is check marked, the Browse button is activated
to open the Grid to Ground Param screen.
• Datum – shows the datum for the selected projection. The drop-down list of datums is available only when the current grid
projection allows datum selection. The Browse button
opens the Custom Datum screen.
• Geoid Model – shows the geoid selected (if any). The Browse
button opens the Geoids List screen (see “Geoid List” onpage 3-84).
• Back – returns to the previous screen.
• Next – opens the Units screen (Figure 2-6 on page 2-6).

8/10/2019 7010-0944 - SokkiaSSF_rm.pdf
http://slidepdf.com/reader/full/7010-0944-sokkiassfrmpdf 42/623
Working with a Job
Sokkia Spectrum Survey Field Reference Manual2-6
• Finish – saves the settings and returns to the main screen.
See “Setting Coordinate System Parameters” on page 3-72 for more
information.
Units
On the Units screen, the default units that are used in the job display.Set the following measurement units (Figure 2-6).
Figure 2-6. Units
• Distance – units of linear measurements; select either Meters, IFeet (International Feet, 1 Ifoot = 0.3048 Meters), US Feet (1USFt = 1200/3937 Meters); IFeet and Inches, or US Feet andinches formula).
TIP
If the selected units are US Feet , linear values canbe entered as meters, or international feet by
appending “m” or “if” to the entered value.
If the selected units are in meters, then a linear
value in US Feet or International Feet is entered byappending “f”or “if” to the end of the entered value.
If the selected units are in International Feet , enterlinear values in meters or USfeet by appending“m”or “f” to the entered value. The appendedcharacters “m”, “f”, or “if” are not case insensitive.You can also enter “M”, “F”, or “IF”.

8/10/2019 7010-0944 - SokkiaSSF_rm.pdf
http://slidepdf.com/reader/full/7010-0944-sokkiassfrmpdf 43/623
Creating a New Job
P/N 7010-0944 2-7
• Angle – units of angle measurements and parameters; select either DMS (degrees, minutes, seconds), Grads (Gons), Radians (for
Cogo use only), or Mils (for Cogo use only). (360 degrees = 400
grads = 2 radians = 6400 mils.)
• Temperature (for TS mode only) – units of temperature, used only
for the raw measurements; select either Celsius (C) or Fahrenheit
(F).
• Pressure (for TS mode only) – units of atmosphere pressure, usedonly for the raw measurements: mmHg, hPa, inHg, or bbar .
• Back – returns to the previous screen.
• Next – opens the Display screen (Figure 2-7 on page 2-8).
• Finish – saves the settings, and returns to the main screen.
• Cancel – closes the screen without saving the settings.
TIP
If the selected units are US or International Feet and
Inches, you can enter feet and inches in the
following formats:- feet.inches.fracNumerator.fracDenominator(displays as the next format)
- feet’inches’’fracNumerator/fracDenominator
(where the fracDenominator can be either 2, 4, 8, or
16)
TIP
Azimuth and distances can be entered as two points
separated by “-”, “,” or “;”. Certain angles can beentered as three points separated by “-”, “,” or “;”.
For instance, a value of 100-101 indicates theAzimuth or Distance from Point 100 to Point 101.
π

8/10/2019 7010-0944 - SokkiaSSF_rm.pdf
http://slidepdf.com/reader/full/7010-0944-sokkiassfrmpdf 44/623
Working with a Job
Sokkia Spectrum Survey Field Reference Manual2-8
Display
The Display screen (Figure 2-7) customizes the software interface.
Set the following parameters and press OK to save the settings.
Figure 2-7. Display
• Coord Type – selects the coordinate type for the coordinatesystem selected.
• Coord Order – selects the Northing/Easting order and displaysthe height type for the coordinate system selected.
• Azimuth Origin – selects the reference direction of azimuth.
• Disp Dir As – selects whether to display the direction as bearing or azimuth.
• Disp CL Pos As – selects how to display the position on the centerline; select either station or chainage.
• Full Station – available if Station is selected for Disp CL Pos As;sets the measurement units used for the full station value and isusually 100 units.
• Back – returns to the previous screen.
• Next – opens the Alarms screen (see Figure 2-8).
• Finish – saves the settings, and returns to the main screen.

8/10/2019 7010-0944 - SokkiaSSF_rm.pdf
http://slidepdf.com/reader/full/7010-0944-sokkiassfrmpdf 45/623
Creating a New Job
P/N 7010-0944 2-9
Alarms
The Alarms screen sets sound alerts for situations of low power, low
memory, poor radio link, and loss of fixed/float solutions. Thesealarms may occur for the controller, GPS+ receiver, or Total Station.
Figure 2-8. Alarms
• Audible Alarm – check mark this box to automatically sound analert when an alert situation occurs. Check mark available boxes
to select alerts for various instruments and situations: low power,memory limited, loosing/gaining radio link, or fixed solution with
GPS receiver, or tracking with Robotic Total Station.
• Back – returns to the previous screen.
• Finish – saves the settings and returns to the main screen.
• Cancel – closes the screen without saving the settings.

8/10/2019 7010-0944 - SokkiaSSF_rm.pdf
http://slidepdf.com/reader/full/7010-0944-sokkiassfrmpdf 46/623
Working with a Job
Sokkia Spectrum Survey Field Reference Manual2-10
Opening a Job
To open a job, tap the Open Job icon. The Open Job screen
(Figure 2-9) displays. Select a job from the list or create a new one.
Figure 2-9. Open Job
The Job List field contains the names of all existing jobs created/ opened using Sokkia SSF. Initially, the Job List contains only a
Default job created upon Sokkia SSF installation. The iconindicates a Sokkia SSF job.
When a job is selected from the list, the Created and Modified fieldsshows the date that the job was created and when it was last modified.
The path below the Job List shows the directory where the selected
job is located (Figure 2-10 on page 2-11).
• Open – opens a new job and returns to the main screen.
• Browse – displays the screen to browse directories to select a jobto open. Use the standard navigation buttons to move up or downto the directory where the desired file resides. Highlight the fileand press OK.
TIP
Make sure you select the appropriate InstrumentType to correctly show the name of the opened jobin the title bar. Use the Switch Mode Icon to select.

8/10/2019 7010-0944 - SokkiaSSF_rm.pdf
http://slidepdf.com/reader/full/7010-0944-sokkiassfrmpdf 47/623
Deleting a Job
P/N 7010-0944 2-11
Figure 2-10. Browse Jobs
The job files created in Sokkia SSF have the “.tsjob” extension.
Deleting a Job
To delete a job, tap the Delete Job icon. Once deleted from the JobList, the file is deleted from the controller (Figure 2-11 on page 2-12).
When a job is selected from the list, the Created and Modified fieldsreflect when the job was created and last modified.
• The path under the Job List displays the directory where theselected job was created.
• Browse – if a job is not listed in the job list, browse through thedirectories to select the job you want to delete.
• Delete – deletes the job.• Close – closes the screen.
TIP
To see the job files created in an earlier version ofSokkia SSF, select the Ts6 Job Files (*.tsv) or All
Files (*.*) type.

8/10/2019 7010-0944 - SokkiaSSF_rm.pdf
http://slidepdf.com/reader/full/7010-0944-sokkiassfrmpdf 48/623
Working with a Job
Sokkia Spectrum Survey Field Reference Manual2-12
Figure 2-11. Delete Job
Viewing Job Information
To view job information, tap the Job Info icon. The Job Info screencontains information about the current job (Figure 2-12).
Figure 2-12. Job Information
NOTICE
When a job is deleted, the job history file, images,etc., are also deleted.

8/10/2019 7010-0944 - SokkiaSSF_rm.pdf
http://slidepdf.com/reader/full/7010-0944-sokkiassfrmpdf 49/623

8/10/2019 7010-0944 - SokkiaSSF_rm.pdf
http://slidepdf.com/reader/full/7010-0944-sokkiassfrmpdf 50/623
Working with a Job
Sokkia Spectrum Survey Field Reference Manual2-14
• Firmware version – lists the number and build date of the
firmware loaded into the GPS receiver.
Figure 2-13. Job Info – OAF

8/10/2019 7010-0944 - SokkiaSSF_rm.pdf
http://slidepdf.com/reader/full/7010-0944-sokkiassfrmpdf 51/623
P/N 7010-0944
Chapter 3
3-1
Configuring a JobTo set up a job, tap the Configure icon in the main menu. The iconreflects the instrument used in survey. The Configure menu(Figure 3-1) includes options to:
1. Create or edit a survey configuration.
2. Set a coordinate system for a job.
3. Log job history to a file, and set global parameters.
4. Set default units to be used in a job.
5. Customize the interface to display data in a job.
6. Set alarm parameters.
7. Show/hide functions in the menus.
Figure 3-1. Configure Menu
The Help Icon opens a pop-up menu giving access to the help
files, module activation codes, port data logging, changing menuinterface, and information about the Sokkia SSF used (for details see“Help Icon’s Pop-up Menu” on page 1-9).
8/10/2019 7010-0944 - SokkiaSSF_rm.pdf
http://slidepdf.com/reader/full/7010-0944-sokkiassfrmpdf 52/623
Configuring a Job
Sokkia Spectrum Survey Field Reference Manual3-2
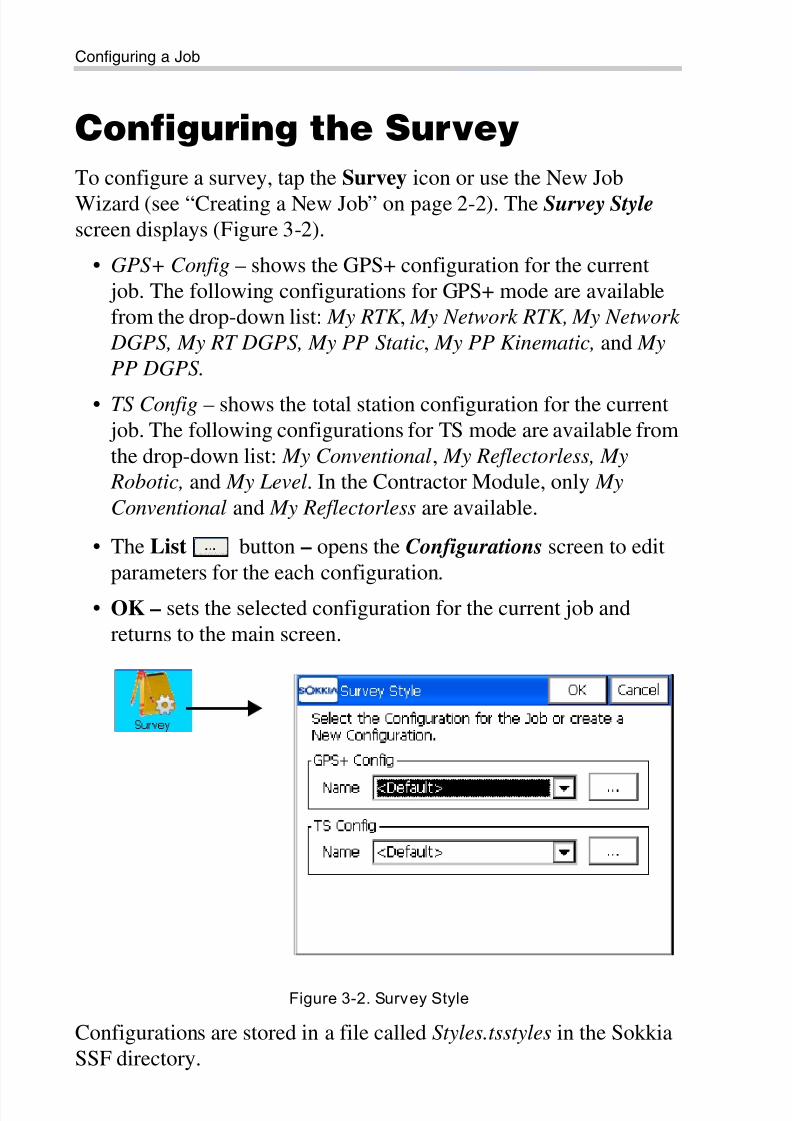
Configuring the Survey
To configure a survey, tap the Survey icon or use the New Job
Wizard (see “Creating a New Job” on page 2-2). The Survey Style screen displays (Figure 3-2).
• GPS+ Config – shows the GPS+ configuration for the current job. The following configurations for GPS+ mode are availablefrom the drop-down list: My RTK , My Network RTK, My Network
DGPS, My RT DGPS, My PP Static, My PP Kinematic, and My
PP DGPS.
• TS Config – shows the total station configuration for the current job. The following configurations for TS mode are available from
the drop-down list: My Conventional, My Reflectorless, My
Robotic, and My Level. In the Contractor Module, only My
Conventional and My Reflectorless are available.
• The List button – opens the Configurations screen to edit
parameters for the each configuration.
• OK – sets the selected configuration for the current job and
returns to the main screen.
Figure 3-2. Survey Style
Configurations are stored in a file called Styles.tsstyles in the SokkiaSSF directory.

8/10/2019 7010-0944 - SokkiaSSF_rm.pdf
http://slidepdf.com/reader/full/7010-0944-sokkiassfrmpdf 53/623
Configuring the Survey
P/N 7010-0944 3-3
GPS+ Configuration
To configure a GPS+ survey, press the List button in the GPS+
Config field of the Survey Style screen (Figure 3-3). On theConfigurations screen, a new configuration is performed with thehelp of a Wizard.
The Configurations screen (Figure 3-3) contains a list of pre-definedconfigurations. Either edit an existing configuration or create a newconfiguration.
• Delete – deletes the highlighted configuration.
• Edit – opens the Survey screen to edit the configuration settings.
• Add – opens the Survey screen to create a new configuration.
• OK – saves configuration settings and returns to the Survey Style screen.
Figure 3-3. GPS+ Configurations
NOTICE
The job settings of a survey configuration are
applied only after opening a Sokkia SSF screen,which enables you to perform and storemeasurements in the job file.

8/10/2019 7010-0944 - SokkiaSSF_rm.pdf
http://slidepdf.com/reader/full/7010-0944-sokkiassfrmpdf 54/623
Configuring a Job
Sokkia Spectrum Survey Field Reference Manual3-4
Configuring the Survey
The Srv screen (Figure 3-4 on page 3-6) contains general settings for
the configuration.• Name – the name of the configuration that is displayed in the
Configurations screen (Figure 3-3 on page 3-3).
• Type – the type of configuration; select either RTK , Network RTK , Network DGPS, Real Time DGPS , PP Static, PP Kinematic, orPP DGPS . (“PP” means Post-Processing.)
– RTK (Real Time Kinematic): implies, first, a pair of receivers
operating simultaneously and, secondly, a radio link has beenestablished between the two receivers. From a functionalpoint of view, the two receivers differ from each other. Oneof the receivers (usually referred to as the Base Receiver) islocated at a fixed point with known coordinates. The Base
receiver collects carrier measurements, generates RTKcorrections, and sends this data to the other receiver (usually
referred to as the Rover Receiver) via a radio link. Toestablish proper connection between the two receivers,specify necessary communication parameters first. The
Rover processes this transmitted data with its own carrierphase observations to compute its relative position withcentimeter accuracy.
A mmGPS aided RTK survey uses the usual RTK GPS+
survey system, but with a wireless PZS-1 sensor at the Roverto pick up the signal from the PZL-1 transmitter for(millimeter) accurate elevations.
– Network RTK (Network Real Time Kinematic): implies thatthe Rover uses RTK correction data received from operatingreference station networks to compute its position.
– Real Time DGPS (Real Time Differential GPS): implies that
the Rover uses differential pseudorange correction datatransmitted from DGPS services.
– Network DGPS (Network Differential GPS): implies theusage of pseudorange corrections received from operatingdifferential GPS reference station networks.

8/10/2019 7010-0944 - SokkiaSSF_rm.pdf
http://slidepdf.com/reader/full/7010-0944-sokkiassfrmpdf 55/623

8/10/2019 7010-0944 - SokkiaSSF_rm.pdf
http://slidepdf.com/reader/full/7010-0944-sokkiassfrmpdf 56/623
Configuring a Job
Sokkia Spectrum Survey Field Reference Manual3-6
Figure 3-4. Survey - Real Time DGPS
The Help Icon on the upper-left corner of the Srv screen (Figure 3-5)
displays a pop-up menu that contains the Help item to access the Helpfiles.
Figure 3-5. Survey – RTK Parameters
NOTICE
To use the differential corrections receiver BR-1,select the Beacon differential service.
Help Icon

8/10/2019 7010-0944 - SokkiaSSF_rm.pdf
http://slidepdf.com/reader/full/7010-0944-sokkiassfrmpdf 57/623
Configuring the Survey
P/N 7010-0944 3-7
• Next – opens the Base Recvr screen (Figure 3-6 on page 3-7).
For Network RTK, Network DGPS, and Real Time DGPS (exceptUser Based mode) without the post processing option, the Rover
Receiver screen displays (see Figure 3-20 on page 3-22). If a PPStatic survey type is selected, the Static Recvr screen opens (seeFigure 3-8 on page 3-9).
Base Receiver
The Base Receiver screen contains Base settings.
For RTK and RT DGPS (with a User Base) surveys, the Base Recvr screen contains the following parameters for configuring a
Base receiver and antenna (Figure 3-6).
Figure 3-6. Base Receiver
• Receiver Model – the model of the Topcon receiver being used
for survey. Select either GR-3, GMS-2/GMS-2 Pro, GMS X, NET
G3, or Topcon Generic for any other Topcon receiver.
• Elevation Mask – data from satellites below this elevation are notused.
NOTICE
Sokkia SSF 7.3 on the GMS-2 allows the selection
of an external receiver with connection mode:cable, external, or internal Bluetooth Module
(Figure 3-6).

8/10/2019 7010-0944 - SokkiaSSF_rm.pdf
http://slidepdf.com/reader/full/7010-0944-sokkiassfrmpdf 58/623
Configuring a Job
Sokkia Spectrum Survey Field Reference Manual3-8
• RTK Format / DGPS Format – the format of the Base receiver
corrections transmitted to the Rover.
• Ant Type – the type of the Topcon antenna being used for survey.Select either CR-3, CR-3 with Cone, CR-3 with SCIGN, CR-4,
CR-4 RD, CR-4 with cone, CR-G3, CR-G3 (TPSH), G3-A1,
G3-A1 with ground plane, G3-A1 with ground plane RD, GMS-2,
GR-3, HiPer Ga/Gb, HiPer GD/GGD, HiPer Lite/Lite+, HiPer
Pro, HiPerXT, HiPer+, Legant 2, Legant E , Legant L1, Legant3
with UHF , MapAnt B, MG-A1, MG-A2, MG-A5, MG-B5,
Odyssey, PG-A1, PG-A1 with ground plane, PG-A1 with ground
plane RD, PG-A2, PG-A5, Regant-DD, Regant-SD, Regency-DD, Regency-SD, or Unknown.
• Ant Ht – the height of the antenna, and the type of antenna heightmeasurement; either Vertical (measured to ARP, antennareference point) or Slant (measured to the edge of the antenna).The screen also illustrates the measurement type.
• Peripherals – if needed, check and enable the Multiple Ports
option to configure the Base to transmit data from different portsused for peripherals (Figure 3-7).
Figure 3-7. Peripherals
• Back – returns to the previous screen.

8/10/2019 7010-0944 - SokkiaSSF_rm.pdf
http://slidepdf.com/reader/full/7010-0944-sokkiassfrmpdf 59/623
Configuring the Survey
P/N 7010-0944 3-9
• Next – opens the Base Radio screen (Figure 3-10 on page 3-12).
For PP enabled RTK survey the Next button opens the Base PP
Setup screen (Figure 3-9 on page 3-11).
• Finish – saves the changes and returns to the Survey Style screen.
• Cancel – closes the screen without saving the settings.
The Help Icon in the upper-left corner of the Base Receiver screendisplays the pop-up menu that contains three options:
• Receiver Setting – check mark the box on the Receiver Settings
screen appear to turn the charger mode off.
• Use relative calibrations – select the option if needed to useRelative antenna model at the base station that transmits CMR+data. By default, Sokkia SSF 7.3 uses Absolute calibration offsets
for antennas. Also, you can select this option when editing thebase.
• Help – to access the Help files.
For PP Static, or PP Kinematic, and PP DGPS surveys, the Static Recvr screen (Figure 3-8) contains the same parameter fields as for
RTK survey type, except for the RTK Format field.
Figure 3-8. Static (Base) Receiver Settings

8/10/2019 7010-0944 - SokkiaSSF_rm.pdf
http://slidepdf.com/reader/full/7010-0944-sokkiassfrmpdf 60/623
Configuring a Job
Sokkia Spectrum Survey Field Reference Manual3-10
The Help Icon in the upper-left corner of the Static (Base) Recvr
screen displays a pop-up menu containing two items:
• Receiver Setting – check mark the box on the Receiver Settings screen to turn the charger mode off.
• Help – accesses the Help files.
• Next – opens the Base PP Setup screen.
Base PP Setup
On the Base PP Setup screen raw data logging parameters for the
base are set up (Figure 3-9 on page 3-11).
• Raw Data Logging – set raw data logging parameters:
– File Name: select a file name.
– Log To: select if the name of the receiver file is automaticallyset or user-defined (the corresponding dialog box is displayedat the logging start).
– Logging Rate: enter a logging rate.
• Back – returns to the previous screen.
• Next – opens the Base Radio screen (Figure 3-10 on page 3-12).
• Cancel – closes the screen without saving the settings.
• Finish – saves the settings and returns to the Survey Style screen(Figure 3-2 on page 3-2).

8/10/2019 7010-0944 - SokkiaSSF_rm.pdf
http://slidepdf.com/reader/full/7010-0944-sokkiassfrmpdf 61/623
Configuring the Survey
P/N 7010-0944 3-11
Figure 3-9. Base PP Setup
Base Radio
The Base Radio screen (Figure 3-10 on page 3-12) contains thesettings for configuring the radio modem connected to the Base
receiver for RTK and RT DGPS (user base) surveys.
• Radio Modem – select a modem type from the list of pre-definedmodem types; contents, will vary, depending upon the job
configuration selected.
• Receiver Port Connected to Radio – contains parameters for theconnection port (i.e., Port, Parity, Data, Baud, Stop), which arespecific to the connected modem. For example, Siemens cell
phones need a 19200 baud rate.
Internal GR-3 FH915+, Internal HiPer Lite, and Internal HiPer
Lite+ FH915+ modems require a 57600 baud rate.
• Defaults – returns all the values in the Receiver Port Connected
to Radio fields to the default value.
• Back – returns to the previous screen.
NOTICE
Raw data always records into the receiver memory.
Sokkia SSF allows logging data to the controllerwhen in PP DGPS survey mode only.

8/10/2019 7010-0944 - SokkiaSSF_rm.pdf
http://slidepdf.com/reader/full/7010-0944-sokkiassfrmpdf 62/623
Configuring a Job
Sokkia Spectrum Survey Field Reference Manual3-12
• Next – opens the Base Radio screen to set parameters for the
chosen modem (Figure 3-10 and Figure 3-11 on page 3-13).
AirLink GPRS, AirLink CDMA, AirLink CDPD
1
, CDMA2000,Generic, Sierra Wireless MP200 CDPD, Internal HiPer Pro
radios do not require additional settings.
• Finish – saves the changes and returns to the Survey Style screen(Figure 3-2 on page 3-2).
All settings are transmitted only when using the configuration.
• Cancel – closes the screen without saving the settings.
Figure 3-10. Base Radio Parameters
1. CDPD stands for “Cellular Digital Packet Data”. CDPD is an open
packet data service, defined as an autonomous overlay network,
specified for the cellular TDMA network.
NOTE
If Multiple Ports are set for peripherals (Figure 3-5
on page 3-6), several Base Radio screens display toconfigure the radio for data output, depending onthe job configuration (Figure 3-11 on page 3-13).

8/10/2019 7010-0944 - SokkiaSSF_rm.pdf
http://slidepdf.com/reader/full/7010-0944-sokkiassfrmpdf 63/623

8/10/2019 7010-0944 - SokkiaSSF_rm.pdf
http://slidepdf.com/reader/full/7010-0944-sokkiassfrmpdf 64/623
Configuring a Job
Sokkia Spectrum Survey Field Reference Manual3-14
• For FH915 Modem – Internal Hiper Lite. The Next button on the
Base Radio screen opens the Base Radio Parameters screen (seeFigure 3-15 on page 3-17).
• For FH915Plus Modem – Internal Hiper Lite+ FH915 Plus,
Internal GR-3 FH915 Plus and RE-S1 modem. The Next button
on the Base Radio screen opens the Base Radio Parameters screen (see Figure 3-16 on page 3-18).
• For Pacific Crest and Internal HiPer (Pac Crest) Radio Modem.
The Next button on the Base Radio screen opens the Base Radio
Parameters screen (see Figure 3-17 on page 3-19).
• For Satel modems, the Next button on the Base Radio screenopens the Base Radio Parameters screen (see Figure 3-18 on
page 3-20).
• For AirLink CDMA, Multicast UDP, the Next button on the Base
Radio screen opens the Base Radio Parameters screen (seeFigure 3-19 on page 3-20).
Base Radio Parameters
The Base Radio Parameters screen contains the following parameter
settings for the radio:
For the cell phone the screen contains the following parameters
(Figure 3-12 on page 3-15):
• Base Pin – a PIN number for a cell phone.
• Back – returns to the previous screen.
• Next – opens the Rover Receiver screen (if the selected modemtype does not require additional settings).
• Finish – saves the change and returns to the Base Radio screen.

8/10/2019 7010-0944 - SokkiaSSF_rm.pdf
http://slidepdf.com/reader/full/7010-0944-sokkiassfrmpdf 65/623
Configuring the Survey
P/N 7010-0944 3-15
Figure 3-12. Base Cell Phone Parameters
For a Digital UHF Modem: Internal GR-3 Digi tal UHF, Internal
HiPer Digital UHF, TRL-2 and TRL-35 External Digital UHF thescreen contains the following parameters (Figure 3-13 on page 3-16):
• Protocol – sets the following protocol for data transmission:– Simplex: ArWest’s proprietary protocol. Only works with
other ArWest (Digital UHF) radios.
– TRMB: works with Trimble Trim Talk and Trim MarkRadios.
– PDL: works with existing PDL radios and Hiper XTs set inPDL mode.
• Modulation – selects a modulation type for the base radio-modem; select either DBPSK (Differential Binary Phase Shift
Keying) if using the Simplex protocol or GMSK (Gaussian
Minimum Shift Keying) if using Trimble or PDL.
• Back – returns to the previous screen.

8/10/2019 7010-0944 - SokkiaSSF_rm.pdf
http://slidepdf.com/reader/full/7010-0944-sokkiassfrmpdf 66/623
Configuring a Job
Sokkia Spectrum Survey Field Reference Manual3-16
• Next – opens the Rover Receiver screen (if the selected modem
type does not require additional settings).
Figure 3-13. Parameters for Digital UHF Modems
For UHF Modems: the Internal HiPerXT (UHF) and Internal Map-
HP (UHF) the screen contains the following parameters (Figure 3-14
on page 3-17):
• Protocol – selects the protocol for data transmission: either TPS ,Topcon FSCS mode to scan for the best channel on which to
communicate or PDL to communicate with the Rover PDK radio.
• Channel – selects a dedicated channel for the PDL protocol.
• Power – selects the level of power for RF transmissions: either
1W or 2W .
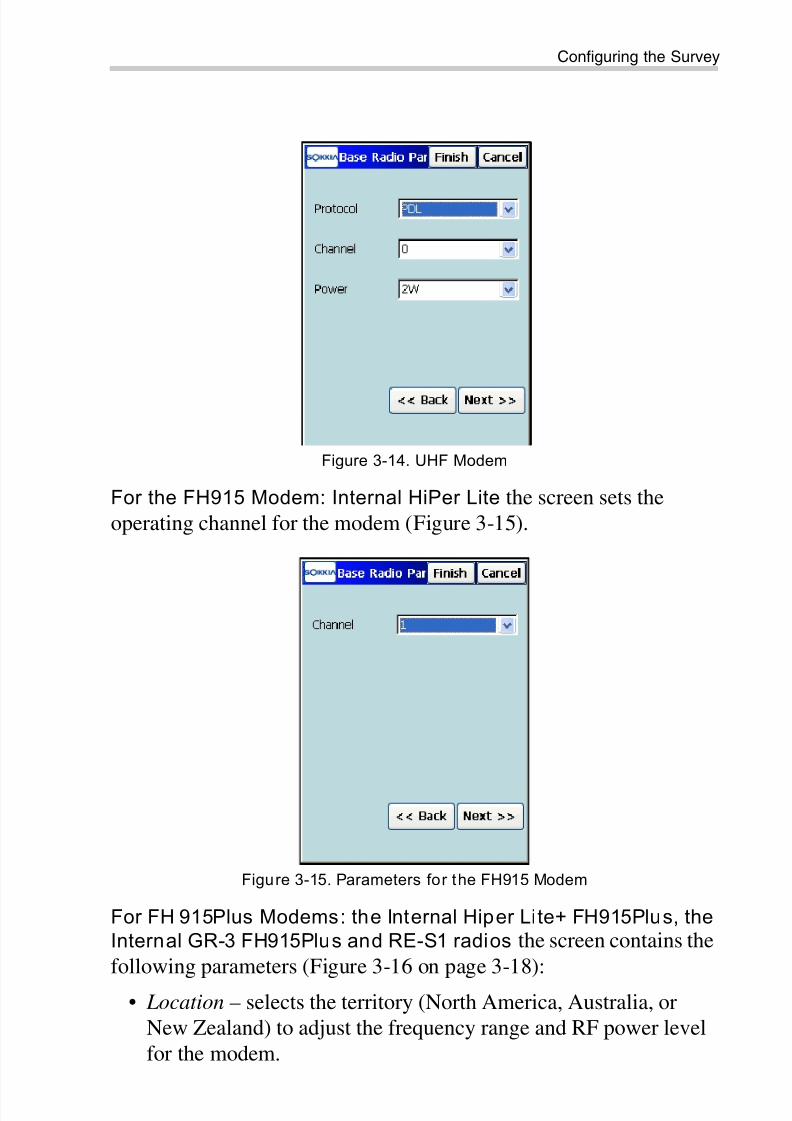
8/10/2019 7010-0944 - SokkiaSSF_rm.pdf
http://slidepdf.com/reader/full/7010-0944-sokkiassfrmpdf 67/623
Configuring the Survey
P/N 7010-0944 3-17
Figure 3-14. UHF Modem
For the FH915 Modem: Internal HiPer Lite the screen sets theoperating channel for the modem (Figure 3-15).
Figure 3-15. Parameters for the FH915 Modem
For FH 915Plus Modems: the Internal Hiper Lite+ FH915Plus, the
Internal GR-3 FH915Plus and RE-S1 radios the screen contains the
following parameters (Figure 3-16 on page 3-18):
• Location – selects the territory (North America, Australia, orNew Zealand) to adjust the frequency range and RF power levelfor the modem.

8/10/2019 7010-0944 - SokkiaSSF_rm.pdf
http://slidepdf.com/reader/full/7010-0944-sokkiassfrmpdf 68/623
Configuring a Job
Sokkia Spectrum Survey Field Reference Manual3-18
• Protocol – selects the operation protocol: either FH915 Ext,
recommended if all receivers on the jobsite are equipped withFH915Plus radios only, or FH915: recommended if there is a
mixture of receivers with FH915 and FH915Plus radios on the jobsite.
• Channel – selects the operating channel.
Figure 3-16. Parameters for FH915+ Modems
For Pacif ic Crest and Internal HiPer (Pac Crest) Radio Modem
the screen contains the following parameters (Figure 3-17 onpage 3-19):
• Channel – selects the operating channel to the radio modem.
• Sensitivity – selects the sensitivity level for the radio modem;either low, moderate, high, or off .

8/10/2019 7010-0944 - SokkiaSSF_rm.pdf
http://slidepdf.com/reader/full/7010-0944-sokkiassfrmpdf 69/623
Configuring the Survey
P/N 7010-0944 3-19
Figure 3-17. Pacific Crest Radio Parameters
For Satel Radio modems the screen contains the followingparameters (Figure 3-18 on page 3-20):
• Model – select the model of the radio.
• Channel – select the channel of the radio.
• Frequency – shows the frequency of the radio.
• Back – returns to the previous screen.
• Next – opens the Rover Receiver screen (Figure 3-20 onpage 3-22).
• Finish – saves changes and returns to the Survey Style screen
(Figure 3-2 on page 3-2). Settings are transmitted only when theconfiguration is used.

8/10/2019 7010-0944 - SokkiaSSF_rm.pdf
http://slidepdf.com/reader/full/7010-0944-sokkiassfrmpdf 70/623
Configuring a Job
Sokkia Spectrum Survey Field Reference Manual3-20
Figure 3-18. Satel Radio Parameters
For Air link Multicast CDMA (Multicast UDP) the screen containsthe following parameters (Figure 3-19):
• Address to Add – the field for IP address input
• IP Addresses list – displays all available IP addresses
Figure 3-19. Base Multicast Parameters
• Delete – deletes the highlighted IP address.
• Add – adds a new address from the Address to Add field to thelist of IP addresses below.
• Back – returns to the previous screen.

8/10/2019 7010-0944 - SokkiaSSF_rm.pdf
http://slidepdf.com/reader/full/7010-0944-sokkiassfrmpdf 71/623
Configuring the Survey
P/N 7010-0944 3-21
• Next – opens the Rover Receiver screen (Figure 3-20 on
page 3-22). For PP enabled surveys, the Rover PP Setup screendisplays first (Figure 3-24 on page 3-26). In the PP Static case,
the Occupation Times screen is opened (Figure 3-41 onpage 3-41).
• Finish – saves the changes and returns to the Survey Style screen(Figure 3-2 on page 3-2). Settings are transmitted only when the
configuration is used.
The Help Icon in the upper-left corner of the Base Radio Parameters screens displays the pop-up menu containing the Help item to accessthe Help files.
Rover Receiver
The Rover Recvr screen contains Rover settings (Figure 3-20 onpage 3-22).
For RTK surveys, the screen contains the following parameters
(Figure 3-20 on page 3-22) for configuring a Rover receiver andantenna.
• Receiver Model – the model of the Topcon receiver being usedfor survey. Select either GR-3, GMS-2/GMS-2 Pro, GMS X, NET
G3, or Topcon Generic for any other Topcon receiver.
• Elevation Mask – data from satellites below this elevation are notused.
• RTK Format – the format of the corrections received from theBase.
• Ant Type – the type of the Topcon antenna being used for survey.Select either CR-3, CR-3 with Cone, CR-3 with SCIGN, CR-4,CR-4 RD, CR-4 with cone, CR-G3, CR-G3 (TPSH), G3-A1,
G3-A1 with ground plane, G3-A1 with ground plane RD, GMS-2,
GR-3, HiPer Ga/Gb, HiPer GD/GGD, HiPer Lite/Lite+, HiPer
Pro, HiPerXT, HiPer+, Legant 2, Legant E , Legant L1, Legant3with UHF , MapAnt B, MG-A1, MG-A2, MG-A5, MG-B5,
Odyssey, PG-A1, PG-A1 with ground plane, PG-A1 with ground
plane RD, PG-A2, PG-A5, Regant-DD, Regant-SD, Regency-DD,
Regency-SD, or Unknown.

8/10/2019 7010-0944 - SokkiaSSF_rm.pdf
http://slidepdf.com/reader/full/7010-0944-sokkiassfrmpdf 72/623
Configuring a Job
Sokkia Spectrum Survey Field Reference Manual3-22
• Ant Ht – the height of the antenna, and the type of antenna height
measurement; either Vertical (measured to ARP, antennareference point) or Slant (measured to the edge of the antenna).
The screen also illustrates the measurement type.
Figure 3-20. Rover Receiver
• Back – returns to the previous screen.
• Next – opens the Rover Radio screen (see “Rover Radio” on
page 3-29). For PP enabled RTK survey the Next button opensthe Rover PP Setup screen (Figure 3-24 on page 3-26).
• Finish – saves the changes and returns to the Survey Style screen
(Figure 3-2 on page 3-2). Settings are transmitted only when theconfiguration is used.
• Peripherals – opens the Peripherals screen with three options toselect (Figure 3-21 on page 3-23):
– NMEA Ports: check mark this box to set the number of ports
available to output NMEA messages.
– Multiple Ports: check mark this box to set the number of portsto input data from peripherals.
– External Laser : check mark this box to use an external laser.When selected, the Laser Connect field displays to set the
device the laser is connected to: either Receiver or Controller .The Parameters button opens the Laser Config screen to

8/10/2019 7010-0944 - SokkiaSSF_rm.pdf
http://slidepdf.com/reader/full/7010-0944-sokkiassfrmpdf 73/623
Configuring the Survey
P/N 7010-0944 3-23
configure the laser device (Figure 3-26 on
page 3-28).
Figure 3-21. Rover Receiver Options
The Help Icon in the upper-left corner of the Rover Receiver screendisplays the pop-up menu containing four options:
• Receiver Setting – check mark the box on the Receiver Settings screen appear to turn the charger mode off.
• Relative calibrations on Base – (only for RTK surveys) select theoption if needed to use Relative antenna model at the base stationthat transmits CMR+ data. By default, Sokkia SSF 7.3 usesAbsolute calibration offsets for antennas. Also, you can selectthis option when editing the base.
• RTK Protocol – adds the RTK Protocol field to the Rover
Receiver screen to set the CSD Data protocol through a cellularphone used as modem.
• Help – to access the Help files.
For Real Time DGPS survey type the screen allows a selection ofDGPS correction format.
• DGPS Format – the format of the differential corrections receivedeither from the user base ( RTCM 2.1, RTCM 2.2, or RTCM 2.3)or from a Beacon station (in addition RTCM 3.0 can be selected).This field disappears when any other differential service ischosen on the Survey screen.

8/10/2019 7010-0944 - SokkiaSSF_rm.pdf
http://slidepdf.com/reader/full/7010-0944-sokkiassfrmpdf 74/623
Configuring a Job
Sokkia Spectrum Survey Field Reference Manual3-24
• Next – depending on the differential service selected on the
Survey screen (Figure 3-4 on page 3-6), this button opens one ofthe following screens:
– Config: Rover Radio (Figure 3-27 on page 3-29),
– Config: Beacon (Figure 3-34 on page 3-35),
– Config: SBAS (Figure 3-37 on page 3-37),
– CDGPS Radio (Figure 3-38 on page 3-38),
– Config: OmniSTAR screen (Figure 3-39 on page 3-39).
• Finish – saves the changes and returns to the Survey Style screen.Settings are transmitted only when the configuration is used.
For Network RTK and Network DGPS surveys the screen containscontains the same parameter fields as for RTK survey type, except forthe RTK Format field. In addition the Protocol field is turned on bydefault (Figure 3-22).
• Protocol – selects the protocol to receive the corrections:
– NTRIP: from a NTRIP Caster
– TCP/IP: through the Internet
– CSD Data: through a cellular phone used as a modem
Figure 3-22. Rover Receiver Options for Network RTK and Network DGPS

8/10/2019 7010-0944 - SokkiaSSF_rm.pdf
http://slidepdf.com/reader/full/7010-0944-sokkiassfrmpdf 75/623
Configuring the Survey
P/N 7010-0944 3-25
• Back – returns to the previous screen.
• Next – opens the Config: Modem Connect screen (Figure 3-25
on page 3-27).• Finish – saves the changes and returns to the Survey Style screen
(Figure 3-2 on page 3-2). Settings are transmitted only when theconfiguration is used.
For PP Kinematic and PP DGPS surveys, the screen contains thesame parameter fields as for RTK survey type, except for the RTK
Format field (Figure 3-23).
Figure 3-23. Rover Receiver Options for PP Kinematic and PP DGPS
The Help Icon in the upper-left corner of the Rover Receiver screen
displays the pop-up menu containing two items:
• Receiver Setting – check mark the box on the Receiver Settings screen appear to turn the charger mode off.
• Help – accesses the Help files.
The Next button opens the Rover PP Setup screen.
Rover PP Setup
The screen contains parameters for logging rover raw data(Figure 3-24 on page 3-26).

8/10/2019 7010-0944 - SokkiaSSF_rm.pdf
http://slidepdf.com/reader/full/7010-0944-sokkiassfrmpdf 76/623
Configuring a Job
Sokkia Spectrum Survey Field Reference Manual3-26
• Raw Data Logging – the set of logging parameters; log to the
receiver, set the logging rate, and select if the name of thereceiver file is automatically set or user-defined. In the latter case,
the corresponding dialog box displays at the logging start.
The Start Log option selects whether to start logging manually orautomatically as data are being collected. This option is absent
for PP Kinematic and PP DGPS surveys, the selection of manualstart of logging is not allowed.
• Back – returns to the previous screen.
• Next – opens the Rover Receiver screen (Figure 3-22 onpage 3-24).
• Finish – saves the changes and returns to the Survey Style screen
(Figure 3-2 on page 3-2).
Figure 3-24. Rover PP Setup

8/10/2019 7010-0944 - SokkiaSSF_rm.pdf
http://slidepdf.com/reader/full/7010-0944-sokkiassfrmpdf 77/623
Configuring the Survey
P/N 7010-0944 3-27
Modem Connection
The Config: Modem Connect screen (Figure 3-25) displays for the
Rover receiver configuration in Network RTK or Network DGPSsurveys.
Figure 3-25. Config: Modem Connect
• Modem Connect – select either Receiver or Controller to connectthe modem to.
• Next – opens the Rover Radio screen (Figure 3-27 on page 3-29).
Laser Config
The Config: Laser screen contains typical laser parameters andsettings (Figure 3-26 on page 3-28).
• Manufacturer – the manufacturer for the laser device.
• Model – the model of the laser device.
• Type – the type of laser measurement system.
• Laser Port Setting – the settings ( port, parity, data, baud rate, thenumber of stop bits) for the laser device’s connection port tooutput raw and calculated data to the peripheral device.
TIP
Refer to the Sokkia SSF User’s Manual for detailson configuring a Network RTK survey.
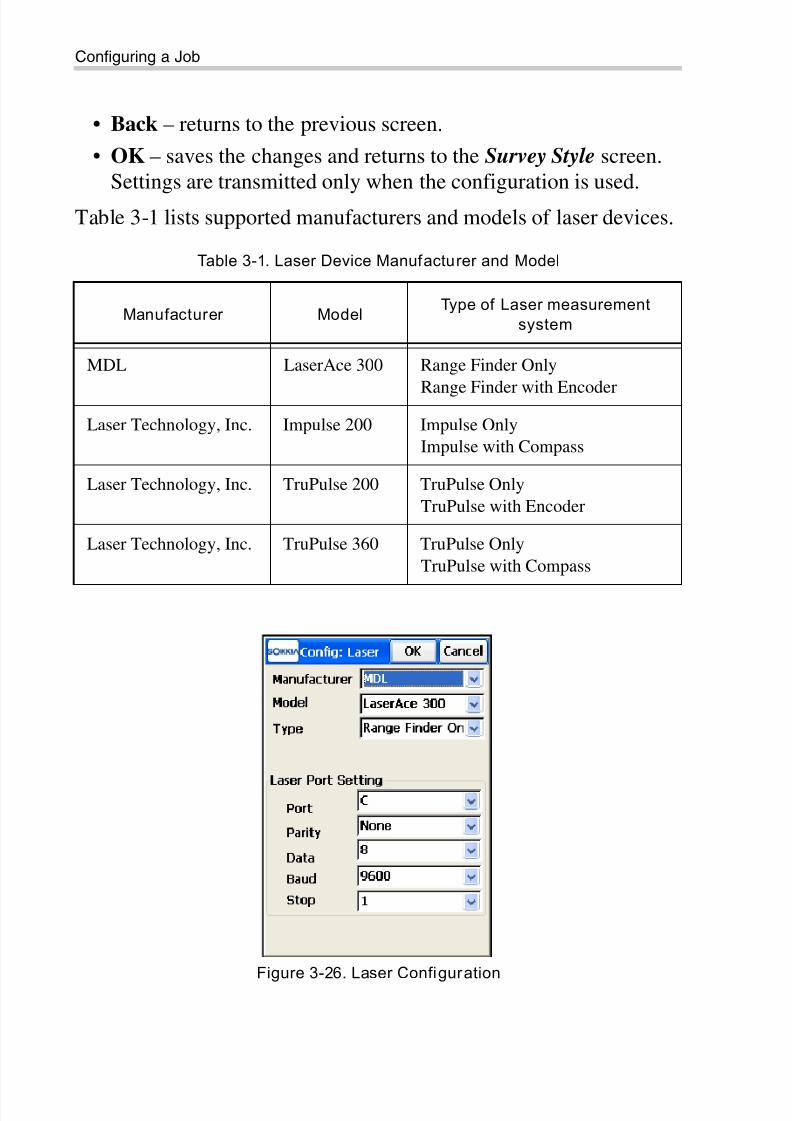
8/10/2019 7010-0944 - SokkiaSSF_rm.pdf
http://slidepdf.com/reader/full/7010-0944-sokkiassfrmpdf 78/623
Configuring a Job
Sokkia Spectrum Survey Field Reference Manual3-28
• Back – returns to the previous screen.
• OK – saves the changes and returns to the Survey Style screen.Settings are transmitted only when the configuration is used.
Table 3-1 lists supported manufacturers and models of laser devices.
Figure 3-26. Laser Configuration
Table 3-1. Laser Device Manufacturer and Model
Manufacturer ModelType of Laser measurement
system
MDL LaserAce 300 Range Finder Only
Range Finder with Encoder
Laser Technology, Inc. Impulse 200 Impulse Only
Impulse with Compass
Laser Technology, Inc. TruPulse 200 TruPulse Only
TruPulse with Encoder
Laser Technology, Inc. TruPulse 360 TruPulse Only
TruPulse with Compass

8/10/2019 7010-0944 - SokkiaSSF_rm.pdf
http://slidepdf.com/reader/full/7010-0944-sokkiassfrmpdf 79/623
Configuring the Survey
P/N 7010-0944 3-29
Rover Radio
The Rover Radio screen contains parameters for the radio modem
connected to the Rover receiver (Figure 3-27).
Figure 3-27. Rover Radio
• Radio Modem – the type of modem. The contents of the drop-down list depends upon a style used.
• Receiver Port Connected to Radio – contains the parameters ofthe connection port.
• Defaults – returns all the values to defaults in the Receiver Port
Connected to Radio fields.
• Back – returns to the previous screen.
• Next: – displays the parameters for the chosen modem (see“Rover Radio Parameters” on page 3-30). Opens the Survey
Parameters screen if the selected modem type does not requireadditional settings.
• Finish – saves the changes and returns to the Survey Style screen.
All settings are transmitted only when the configuration is used.
The Help Icon in the upper-left corner of the Rover Radio screendisplays the pop-up menu that contains an option:
• Config RE-S1 Repeater – enables using the RE-S1 radio asrepeater (see “RE-S1 FH915 Repeater” on page 3-31).

8/10/2019 7010-0944 - SokkiaSSF_rm.pdf
http://slidepdf.com/reader/full/7010-0944-sokkiassfrmpdf 80/623
Configuring a Job
Sokkia Spectrum Survey Field Reference Manual3-30
Rover Radio Input
If Multiple Ports mode is selected, depending on the number of ports
selected (Figure 3-23 on page 3-25), there can be two Rover Radio screens to configure radios for data input (Figure 3-28).
Figure 3-28. Rover Radio Input
Rover Radio Parameters
Modem parameters for the Rover receiver are the same as for the
Base receiver (for details, see “Base Radio Configuration” on page 3-13) except as provided for cell phones (Figure 3-29 on page 3-31).
• Rover PIN – a personal identification number for the Rover.
• Base Phone Number – the phone number for the Base.
• Add – adds it to the Phone number list .
• Back – returns to the previous screen.
• Next – opens the Survey Parameters screen.
• Finish – saves the changes and returns to the Survey Style screen(Figure 3-2 on page 3-2).
TIP
Use only one radio to receive corrections from theBase.
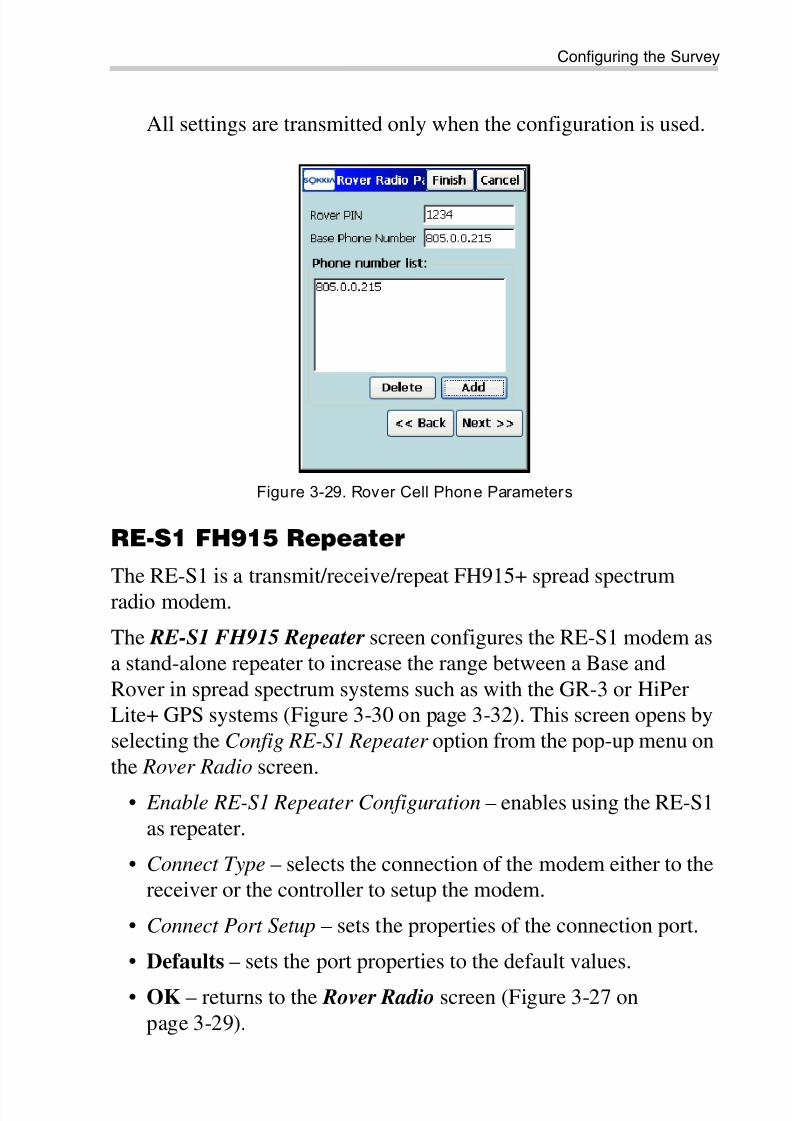
8/10/2019 7010-0944 - SokkiaSSF_rm.pdf
http://slidepdf.com/reader/full/7010-0944-sokkiassfrmpdf 81/623
Configuring the Survey
P/N 7010-0944 3-31
All settings are transmitted only when the configuration is used.
Figure 3-29. Rover Cell Phone Parameters
RE-S1 FH915 Repeater
The RE-S1 is a transmit/receive/repeat FH915+ spread spectrumradio modem.
The RE-S1 FH915 Repeater screen configures the RE-S1 modem asa stand-alone repeater to increase the range between a Base and
Rover in spread spectrum systems such as with the GR-3 or HiPerLite+ GPS systems (Figure 3-30 on page 3-32). This screen opens byselecting the Config RE-S1 Repeater option from the pop-up menu on
the Rover Radio screen.
• Enable RE-S1 Repeater Configuration – enables using the RE-S1as repeater.
• Connect Type – selects the connection of the modem either to thereceiver or the controller to setup the modem.
• Connect Port Setup – sets the properties of the connection port.
• Defaults – sets the port properties to the default values.
• OK – returns to the Rover Radio screen (Figure 3-27 on
page 3-29).

8/10/2019 7010-0944 - SokkiaSSF_rm.pdf
http://slidepdf.com/reader/full/7010-0944-sokkiassfrmpdf 82/623

8/10/2019 7010-0944 - SokkiaSSF_rm.pdf
http://slidepdf.com/reader/full/7010-0944-sokkiassfrmpdf 83/623
Configuring the Survey
P/N 7010-0944 3-33
Output Radio
If NMEA Ports mode is selected (see Figure 3-22 on page 3-24),
depending on the number of output ports set, there can be severalOutput Radio screens to configure radios for NMEA data output(Figure 3-32).
The Output Radio screen contains parameters for the radio modemconnected to the Rover (Figure 3-32 on page 3-33). For details, see“Rover Radio” on page 3-29.
• Next: opens the Config: Output NMEA screen. If needed the
Rover Radio Param screen displays first.
Figure 3-32. Output Radio
Config: Output NMEA
The Config: Output NMEA screen (Figure 3-33 on page 3-34)contains a list of NMEA messages. Select the types of messages to
issue via the specified receiver port at the interval set in seconds (upto 0.1 sec).
• GGA – outputs data on time, position and positioning.
• GLL – outputs data on the current latitude/longitude and
positioning state.
• GNS – outputs data on time, position, and positioning of
GPS+GLONASS (GNSS).

8/10/2019 7010-0944 - SokkiaSSF_rm.pdf
http://slidepdf.com/reader/full/7010-0944-sokkiassfrmpdf 84/623
Configuring a Job
Sokkia Spectrum Survey Field Reference Manual3-34
• GRS – outputs the residual error of distance, is used to support
RAIM.
• GSA – outputs the operation mode of the GNSS receiver, thesatellite used for positioning, and DOP.
• GST – outputs the statistics of position errors.
• GSV – outputs the number of satellites, satellite number,elevation angle, azimuthal angle, and SNR.
• HDT – outputs the direction (heading).
• RMC – outputs time, date, position, course and speed data
provided by a GNSS navigation receiver.
• VTG – outputs the traveling direction and velocity.
• ZDA – outputs UTC, day, month, year, and local time zone.
Figure 3-33. Config: Output NMEA
Config: Beacon
The Config: Beacon screen (Figure 3-34 on page 3-35) containssettings for a radio-beacon source of differential GPS corrections.
• Country – the country where the radio-beacon differential serviceis located.
• Station – the station that provides broadcasting differentialcorrections for the Rover.
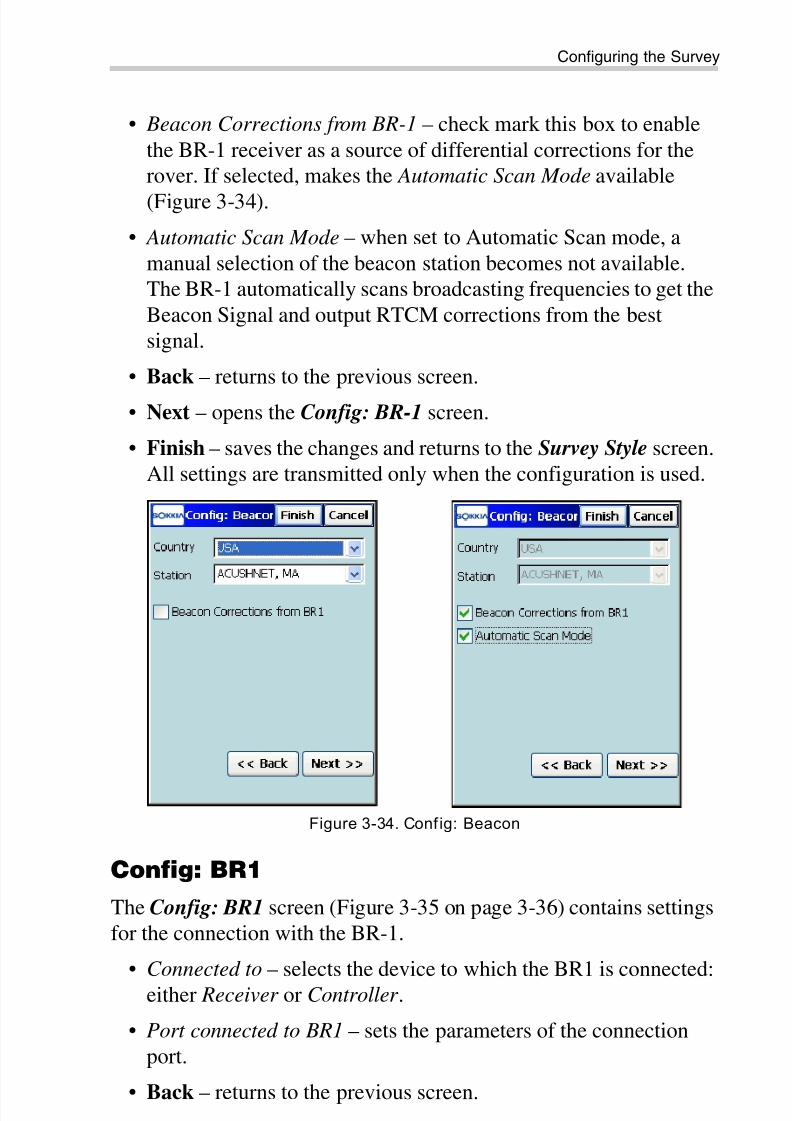
8/10/2019 7010-0944 - SokkiaSSF_rm.pdf
http://slidepdf.com/reader/full/7010-0944-sokkiassfrmpdf 85/623

8/10/2019 7010-0944 - SokkiaSSF_rm.pdf
http://slidepdf.com/reader/full/7010-0944-sokkiassfrmpdf 86/623
Configuring a Job
Sokkia Spectrum Survey Field Reference Manual3-36
• Next – opens the Survey Parameters screen. In case of Controller
connection, the Config: BR-1 Receiver Info displays first(Figure 3-36).
• Finish – saves the changes and returns to the Survey Style screen.All settings are transmitted only when the configuration is used.
Figure 3-35. Config: BR-1
• Virtual Radio Port – sets the receiver port on which the receiverreceives the RTCM messages from the controller. This port onthe receiver is used in addition to the receiver port that isconnected to the controller (Figure 3-36).
Figure 3-36. BR-1 Virtual Radio Port

8/10/2019 7010-0944 - SokkiaSSF_rm.pdf
http://slidepdf.com/reader/full/7010-0944-sokkiassfrmpdf 87/623
Configuring the Survey
P/N 7010-0944 3-37
SBAS Setup
The SBAS Setup screen (Figure 3-37) selects satellites of a satellite-
based augmentation system (WAAS/EGNOS/MSAS) to use toimprove accuracy of DGPS solutions. To select satellites, check theboxes near the PRN numbers of the satellites . All satellites can beselected. The most available satellite from the selected ones will beused in Code DGPS solution.
• PRN and Name – the SBAS satellite’s PRN number and name.
• GPS # – the GPS satellite’s PRN number, which is associated
with the SBAS PRN number.• Iono corr – enable/disable the use of ionospheric corrections
from the SBAS satellite when computing positions:
– None: ionospheric corrections are not used
– Apply if avail: use ionospheric corrections if available
– Use sat only if avail: use only the satellites for which
ionospheric corrections are available.
Figure 3-37. SBAS Setup
NOTE
For GMS-2, SBAS PRN# and Ionospheric
corrections are available.

8/10/2019 7010-0944 - SokkiaSSF_rm.pdf
http://slidepdf.com/reader/full/7010-0944-sokkiassfrmpdf 88/623
Configuring a Job
Sokkia Spectrum Survey Field Reference Manual3-38
• Next – opens the Survey Parameters screen.
• Finish – saves the changes and returns to the Survey Style screen
(Figure 3-2 on page 3-2).
CDGPS Radio
The CDGPS Radio screen (Figure 3-38) contains settings for the
receiver port connected to the CDGPS radio.
Figure 3-38. CDGPS Radio
• Receiver Port Connected to Radio – contains parameters for theconnection port: port, parity, number of data bits, baud rate, andthe number of stop bits.
• Next – opens the Survey Parameters screen.• Finish – saves the changes and returns to the Survey Style screen.
Settings are transmitted only when the configuration is used.
Config: OmniSTAR
The Config: OmniSTAR screen (Figure 3-39 on page 3-39) containssettings for an OmniSTAR source of differential correction data.
• Satellite – the satellite that delivers differential GPS corrections.
• Back – returns to the previous screen.
• Next – opens the Survey Parameters screen.

8/10/2019 7010-0944 - SokkiaSSF_rm.pdf
http://slidepdf.com/reader/full/7010-0944-sokkiassfrmpdf 89/623
Configuring the Survey
P/N 7010-0944 3-39
• Finish – saves the changes and returns to the Survey Style screen.
Settings are transmitted only when the configuration is used.
Figure 3-39. Config: OmniSTAR
mmGPS+ Parameters
For mmGPS aided RTK survey types (see Figure 3-5 on page 3-6),the configuration screens are the same as for the standard RTK surveytypes. A mmGPS survey (RTK or Network RTK) uses the usual RTKGPS+ survey system, but with a wireless PZS-1 sensor at the Rover topick up the Lazer Zone signal from the PZL-1 transmitter for accurate(millimeter) elevations.
The mmGPS+ Parameters screen adds a millimeter GPS+ selectionto the RTK survey (Figure 3-40 on page 3-40):
• Receiver port – selects the port used for communication betweenthe receiver and PZS-1 sensor (typically port D).
• Sensor Gain – select Auto to automatically control the mmGPS
receiver’s detection level of the transmitter’s signal.
• Height Difference Limit – sets the threshold for the differencebetween GPS and mmGPS+ height measurements.
TIP
When measuring the height of the Rover antenna,include the height of the PZS-1 sensor with 5/8 inchplug.

8/10/2019 7010-0944 - SokkiaSSF_rm.pdf
http://slidepdf.com/reader/full/7010-0944-sokkiassfrmpdf 90/623
Configuring a Job
Sokkia Spectrum Survey Field Reference Manual3-40
• Back – returns to the previous screen.
• Next – proceeds to the Survey Parameters screen. For RTK and
Network RTK surveys with enabled post processing, and PPKinematic surveys, the Init Times screen (Figure 3-41 onpage 3-41) displays.
• Finish – saves the changes and returns to the Survey Style screen.
All the settings will be transmitted only when the configuration isused.
Figure 3-40. mmGPS+ Parameters
Initialization (Occupation) Times
The Init Times/Occupation Times screens (Figure 3-41 on
page 3-41) contains timing settings for receiver loggings, used inautomatic mode during a PP Static Survey, and depends upon thenumber of satellites available and the number of frequencies used.
• Initialization (Occupation) Time in minutes – these are timevalues, dependent upon numbers of satellites and frequencies. Forexample, the default for six GPS/GLONASS (6+) dual frequencysatellites is ten minutes. This means that for PP enabled RTK and
PP Kinematic surveys, the complete Rover file should be at leastthis long. Individual occupations can be different. For Staticsurveys, this means that each station (Occupation) should beoccupied for at least ten minutes.
• Back – returns to the previous screen.

8/10/2019 7010-0944 - SokkiaSSF_rm.pdf
http://slidepdf.com/reader/full/7010-0944-sokkiassfrmpdf 91/623
Configuring the Survey
P/N 7010-0944 3-41
• Next – proceeds to the next screen (for PP Static, Stakeout
Parameters; for PP enabled RTK and PP Kinematic, Survey
Parameters).
• Finish – saves the changes and returns to the Survey Style screen.
Settings are transmitted only when the configuration is used.
Figure 3-41. Init ialization / Occupation Times
Survey Parameters
The Survey Parameters screen (Figure 3-42 on page 3-43) sets theparameters used by default during the survey. These parameters can
be changed with the help of the Settings button from any Survey screen in GPS+ mode.
• Solution Type – sets the solution type for each epoch. Dependingon the survey type chosen, select either “Fix mmGPS+”, “Fix
Only”, “Fix and Float mmGPS+”, “Fix and Float ”, “Fix , Float,
DGPS”, “DGPS”, “DGPS, Auto”, or “ All”.
– Fix mmGPS+: positions are computed by the RTK engineusing the carrier phase measurements from the Base receiver
and mmGPS aided Rover receiver. Integer ambiguities arefixed.
– Fix : positions are computed by the RTK engine using the
carrier phase measurements from Base and Rover receivers.Integer ambiguities are fixed.

8/10/2019 7010-0944 - SokkiaSSF_rm.pdf
http://slidepdf.com/reader/full/7010-0944-sokkiassfrmpdf 92/623
Configuring a Job
Sokkia Spectrum Survey Field Reference Manual3-42
– Float : positions are computed by the RTK engine using the
carrier phase measurements from Base and Rover receivers.Integer ambiguities, however, are NOT fixed (use float
estimates instead).
– DGPS : positions are determined using only the pseudo-range
measurements or carrier-phase pseudo-ranges.
– All: positions are computed using all epochs accepted,including autonomous solutions.
– Auto: autonomous positions when differential corrections are
not available.• The Auto Accept field sets the following parameters for automatic
acceptance during a stationary survey.
– Num Meas to Avg: sets the number of measurements used foraveraging, as needed.
– Precision (m) Hz: sets Horizontal and Vertical precisionvalues, if taken into account. If both the Precision and Num
Meas To Avg boxes are checked, both these conditions mustbe satisfied before the coordinates are accepted.
• The Auto Topo field sets the following parameters for kinematicsurveys.
– Method : defines the method for measuring the intervalbetween the received epochs; by time, by horizontal distance,or by slope distance.
– Interval: sets the value of this interval.
• The Help Icon in the upper-left corner of the screen opens thepop-up menu that contains two options:
– Point Properties: opens the Point Properties screen to definethe point increment value for Survey points (Figure 3-44 onpage 3-44).
– Help: accesses the Help files.
• Back – returns to the previous screen.
• Next – opens the Stake Parameters screen.

8/10/2019 7010-0944 - SokkiaSSF_rm.pdf
http://slidepdf.com/reader/full/7010-0944-sokkiassfrmpdf 93/623
Configuring the Survey
P/N 7010-0944 3-43
• Finish – saves the changes and returns to the Survey Style screen.
Settings are transmitted only when the configuration is used.
Figure 3-42. Survey Parameters
When configuring PP Kinematic or PP DGPS survey, the Survey
Parameters screen sets the following parameters (Figure 3-43).
Figure 3-43. Survey Parameters for PP Kinematic and PP DGPS
• Topo – enter the number of epochs to log on each location (forstop-and-go survey).
• Auto Topo – sets the time interval between locations (for
continuous kinematic survey). The only method currentlyavailable.

8/10/2019 7010-0944 - SokkiaSSF_rm.pdf
http://slidepdf.com/reader/full/7010-0944-sokkiassfrmpdf 94/623
Configuring a Job
Sokkia Spectrum Survey Field Reference Manual3-44
Point Numbering
The Point Properties screen sets a user-defined value to increment/
decrement the survey point number (Figure 3-44).
Figure 3-44. Point Numbering
Stake Parameters
The Stk Parms screen (Figure 3-45) sets the parameters that are usedby a job during a stakeout. These parameters can be changed with thehelp of the Settings button from any Stakeout screen in GPS+ mode.
Figure 3-45. Stake Parameters
• Hz Dist Tolerance – sets when the graph switches to a bull’s eyein Stakeout.

8/10/2019 7010-0944 - SokkiaSSF_rm.pdf
http://slidepdf.com/reader/full/7010-0944-sokkiassfrmpdf 95/623
Configuring the Survey
P/N 7010-0944 3-45
• Reference Direction – sets the reference direction for stakeout.
The reference direction can be North, moving direction, movingdirection +North, the direction to the reference point, or a
reference azimuth. Moving Direction +North is similar to theMoving Direction option, but displays the North direction whenthe user is within three meters of the design point.
• Solution Type (for real time surveys only) – defines the type of
position solutions that should be used for the stakeout: Fix Only;Fix and Float ; Fix , Float, DGPS; DGPS, Auto; or All.
• The Auto Accept field sets the parameters for automaticacceptance during a stakeout.
– Num Meas to Avg: sets the number of measurements used for
averaging, as needed.
– Precision (m) Hz: sets Horizontal and Vertical precisionvalues, if taken into account.
If both the Precision and Num Meas To Avg boxes are checked,
both these conditions must be satisfied before the coordinates areaccepted.
• Next – opens the next Stake Parameters screen (see Figure 3-45
on page 3-44).
• Finish – saves the changes and returns to the Survey Style screen.
• The Help Icon in the upper-left corner contains two items:
– Display: opens the Staked Point Icon screen (Figure 3-47 onpage 3-47) to set an icon for the staked point.
– Help: accesses the Help files.
The next Stake Parameters screen sets the rule for naming stakedpoints (Figure 3-46 on page 3-46).
• The Store Staked Point As field defines:
– Point : sets the rule for defining names for the staked-outpoints; either design point name, next point name, designpoint with a pre-defined prefix (that is, stk_01, where “stk_”is the prefix), or design point with a pre-defined suffix.
The choice of the prefix or suffix appears only when the

8/10/2019 7010-0944 - SokkiaSSF_rm.pdf
http://slidepdf.com/reader/full/7010-0944-sokkiassfrmpdf 96/623
Configuring a Job
Sokkia Spectrum Survey Field Reference Manual3-46
corresponding item is chosen from the drop-down menu.
Also, a specified numerical constant can be added toautomatically generate the staked point name.
For instance, if the constant specified is 1000, and the designpoint is 100, the staked point would be named 1100 (that is,
100+1000). If the design point is alphanumeric, the constantis appended to the name. For example, for the design point
ALPHA, the corresponding staked out point is namedALPHA1000.
– Note: sets the rule for setting Notes for the staked out points;either design point name, design point with a prefix, or
design point with a suffix. Also, it can be Station & Offsetinformation.
If the Station & Offset option is activated, an edit box forentering alphanumeric prefix appears. For the United States,this prefix is “Sta”, for the international markets the prefix is“Cha”, and for the Korean/Japanese markets the prefix is
“No”. With this option activated, depending on the choice forthe prefix, Sokkia SSF automatically generates one note foreach stakeout point: Sta5+5.5R5.0, Cha505.5R5.0, or
No.5+5.5R5.0 respectively.
Figure 3-46. Design Point Name + Constant
• Back – returns to the previous screen.
• Next – opens the Advanced screen.
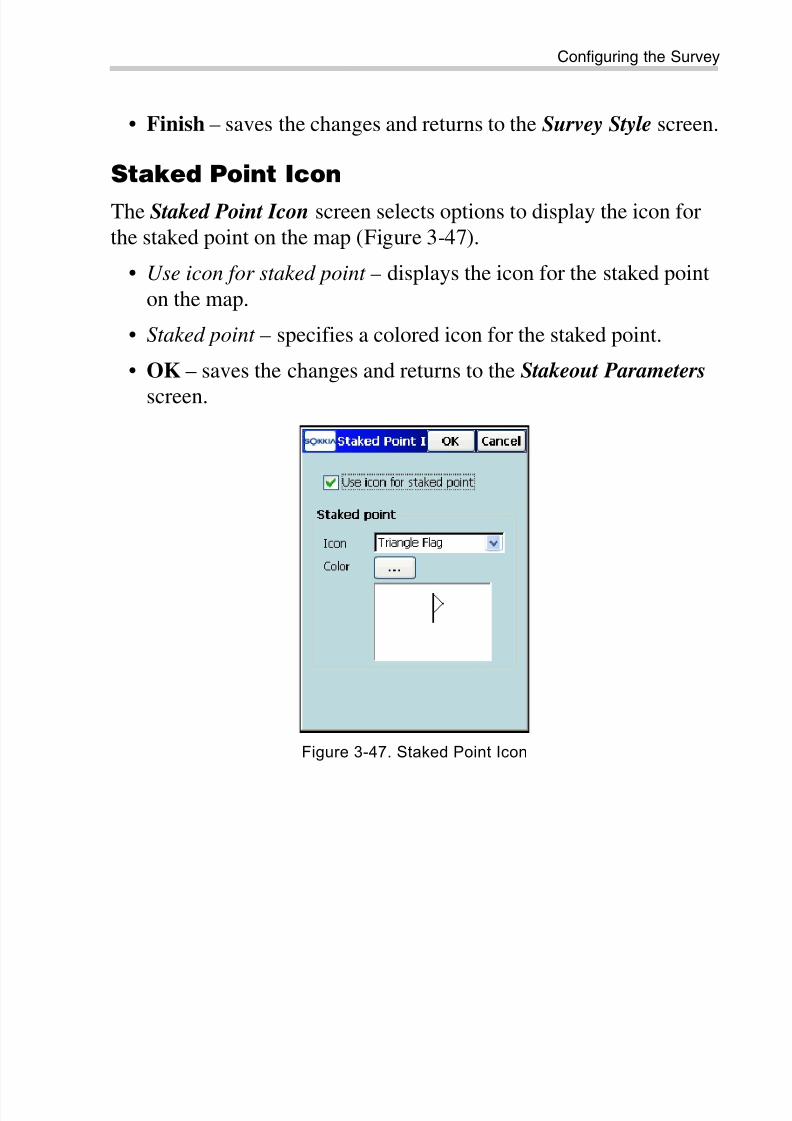
8/10/2019 7010-0944 - SokkiaSSF_rm.pdf
http://slidepdf.com/reader/full/7010-0944-sokkiassfrmpdf 97/623
Configuring the Survey
P/N 7010-0944 3-47
• Finish – saves the changes and returns to the Survey Style screen.
Staked Point Icon
The Staked Point Icon screen selects options to display the icon forthe staked point on the map (Figure 3-47).
• Use icon for staked point – displays the icon for the staked point
on the map.
• Staked point – specifies a colored icon for the staked point.
• OK – saves the changes and returns to the Stakeout Parameters
screen.
Figure 3-47. Staked Point Icon

8/10/2019 7010-0944 - SokkiaSSF_rm.pdf
http://slidepdf.com/reader/full/7010-0944-sokkiassfrmpdf 98/623
Configuring a Job
Sokkia Spectrum Survey Field Reference Manual3-48
Advanced
The Advanced screen sets several additional parameters for the GPS+
mode (Figure 3-48).
Figure 3-48. Advanced
• The Multipath reduction – enable when a signal received includesmultiple reflections from nearby objects. Check mark the Multipath Reduction field to use this mode during survey.
• Co-Op tracking – enable to involve additional resources foracquisition of the signal, phase-lock, and delay-lock loops.
• Satellite system – defines the system of satellites to use.
• RTK Position (only for real time surveys) – selects the method of
RTK corrections definition; either Extrapolation or Matched Epoch (sometimes described as asynchronous or synchronous,respectively).
• Back – returns to the previous screen.
• Next – opens the Miscellaneous screen (Figure 3-50 onpage 3-50.
• Finish – saves the changes and returns to the Survey Style screen.Settings are transmitted only when the configuration is used.
• The Help Icon in the upper-left corner contains two items:

8/10/2019 7010-0944 - SokkiaSSF_rm.pdf
http://slidepdf.com/reader/full/7010-0944-sokkiassfrmpdf 99/623
Configuring the Survey
P/N 7010-0944 3-49
– RTK Settings: opens the RTK Settings screen (Figure 3-49) to
set ambiguity resolution parameters for RTK engine.
– Help: accesses the Help files.
RTK Settings
The RTK Settings screen (Figure 3-49) sets parameters to govern the
RTK engine.
Figure 3-49. RTK Settings
• Ambiguity Level: select Low, Medium or High. The higherthe specified level, the longer the ambiguity search time.
• Resolution Period: defines the period at which the
ambiguities estimation is performed.
• Expected Correction Period : sets differential correctionupdate interval for base station, effective only in the RTKMatched Epoch mode.
The value should be set to the exact rate at which the basestation transmits its differential correction data. Thisparameter will instruct the rover receiver to output the RTK
position at the same rate at which differential corrections areupdated.

8/10/2019 7010-0944 - SokkiaSSF_rm.pdf
http://slidepdf.com/reader/full/7010-0944-sokkiassfrmpdf 100/623
Configuring a Job
Sokkia Spectrum Survey Field Reference Manual3-50
Miscellaneous
The Miscellaneous screen (Figure 3-50) is used to customize the user
interface using the following options:
Figure 3-50. Miscellaneous
• Display Coordinates after Measurement – if enabled, the Store
Point screen automatically displays computed coordinates after aGPS measurement is performed and the point information beforethe point coordinates are stored into the database.
• Prompt for antenna height – if enabled, the Antenna Setup screen appears to set the antenna parameters.
• Prompt for feature codes – if enabled, the Point Attributes screen
appears to specify the code and attributes, and notes before asurveyed point is stored.
• Beep on Storing Points – if enabled, makes a sound every time apoint is stored.
Total Station Configuration
On the Survey Style screen (Figure 3-51 on page 3-51), select a TS
configuration from the drop-down list; either My Conventional, My

8/10/2019 7010-0944 - SokkiaSSF_rm.pdf
http://slidepdf.com/reader/full/7010-0944-sokkiassfrmpdf 101/623
Configuring the Survey
P/N 7010-0944 3-51
Reflectorless, My Robotic, or My Level. The Configurations screen
displays (Figure 3-52 on page 3-52).
Figure 3-51. Survey Style
• – opens the Configurations screen for editing parametersfor the configurations.
• OK – sets the selected configuration for the current job and
returns to the main screen.
The Configurations screen shows the list of available configurations.
• Delete – deletes the configuration.
• Edit – changes the configuration settings.
• Add – adds a new configuration.
• OK – returns to the Survey Style screen (Figure 3-51 onpage 3-51.
NOTICE
In the Contractor Module, only My Conventional and My Reflectorless are available.

8/10/2019 7010-0944 - SokkiaSSF_rm.pdf
http://slidepdf.com/reader/full/7010-0944-sokkiassfrmpdf 102/623
Configuring a Job
Sokkia Spectrum Survey Field Reference Manual3-52
Figure 3-52. TS Configurations
If the Contractor Module is selected in the TS mode (see“Observation Mode” on page 16-1), only Conventional,
Reflectorless and Default-TS configurations are available for useby non-surveyors doing construction stakeout with total stations.
Configuring the Survey
The Survey screen selects a survey type (Figure 3-53 on page 3-53).
• Name – the name of the configuration that is displayed in the
Configurations screen.
• Type – the type of the Configuration; either Conventional,
Reflectorless, Robotic, or Level.
• Next – opens the Instrument screen.
• Finish – saves the changes and returns to the Survey Style screen.Settings are transmitted only when the configuration is used.

8/10/2019 7010-0944 - SokkiaSSF_rm.pdf
http://slidepdf.com/reader/full/7010-0944-sokkiassfrmpdf 103/623
Configuring the Survey
P/N 7010-0944 3-53
Figure 3-53. Survey Screen
Instrument
The Instrument screen (Figure 3-54) contains typical total stationparameters and communication settings.
Figure 3-54. Instrument Screen
• Manufacturer – defines if a Topcon instrument is used. ForConventional and Reflectorless surveys also Sokkia, Nikon andLeica instruments can be defined. For survey emulation, ManualMode can be used.

8/10/2019 7010-0944 - SokkiaSSF_rm.pdf
http://slidepdf.com/reader/full/7010-0944-sokkiassfrmpdf 104/623
Configuring a Job
Sokkia Spectrum Survey Field Reference Manual3-54
• Model – sets the model of the instrument, taking into account the
type of the configuration. For Robotic types, only motorizedmodels are displayed in the drop-down menu.
• Back – returns to the previous screen.
• Next – opens the Connection Mode screen for Total Stations andthe Cable screen for Levels.
• Finish – saves the changes and returns to the Survey Style screen.
Settings are transmitted only when the configuration is used.
Table 3-2 gives Topcon instrument models and their available
functionality.
In Robotic mode, the Help Icon in the upper-left corner of the screen
opens a pop-up menu that contains two options:– Monitor : opens the Monitor Options screen (Figure 3-55 on
page 3-55) to set a Monitor survey.
– Help: accesses the Help files.
Table 3-2. Instrument Model and Funct ionali ty
Topcon Instrument Models:
GTS Series – Conventional
GTS-100N
GTS-220 – Conventional
GTS-230/230W – Conventional
(Bluetooth)
GTS-600 – Conventional
GTS-720/720W – Conventional
GTS-800/810 – Conventional
GTS-800A/810A – Conventional and
Robotic
GTS-820A – Conventional and Robotic
GTS-900A – Robotic
GTS 3000 – Reflectorless
AP-L1A – Conventional and Robotic
AP-L1 – Conventional and Robotic
GMT100 – Conventional
GTS 1/GTS 3 – Conventional
GRT 2000 – Conventional and Robotic
GPT 1000 – Reflectorless
GPT 2000 – Reflectorless
GPT 3100W – Reflectorless
GPT 6000 – Reflectorless
GPT 3000/3000W/3000L – Reflectorless
GPT 7000/7000W/7000L – Reflectorless
GPT 8000 – Reflectorless
GPT 8200 – Reflectorless
GPT 9000 – Reflectorless
GPT 8000A/8200A/9000A –
Reflectorless and Robotic
IS Robot – Reflectorless and Robotic
DL-101 – Level
DL-102/102C – Level
Sokkia instrument models are: SET3, SET4, SET5, SET300, SET400, or SET500
Nikon instrument model is: DTM (SET)
Leica instrument models are: TCR400 or TCR700

8/10/2019 7010-0944 - SokkiaSSF_rm.pdf
http://slidepdf.com/reader/full/7010-0944-sokkiassfrmpdf 105/623
Configuring the Survey
P/N 7010-0944 3-55
Monitor Options
Selecting the Monitor item opens the Monitor Options screen
(Figure 3-55) to set the parameters for data output in the Monitorsurvey. Available options vary, depending on whether a File or aCOM port is selected for data output.
Figure 3-55. Monitor Option – File Selected
• Log To – sets whether the data is output to a File, COM1 port,
COM2 port, Bluetooth, Bluetooth2, or None.
• Output Type – currently sets only the Raw data to output.
• Output Format – sets the format in which to output the data:
FC-5, FC-6/GTS-7 or GTS-6 .
• File Name – sets the file name.
• – browses for the destination of the file and sets the default
file extension.
• Comm Settings – sets the communication parameters for the port(Figure 3-56 on page 3-56).
• OK – saves the settings and returns to the Instrument screen
(Figure 3-54 on page 3-53).

8/10/2019 7010-0944 - SokkiaSSF_rm.pdf
http://slidepdf.com/reader/full/7010-0944-sokkiassfrmpdf 106/623
Configuring a Job
Sokkia Spectrum Survey Field Reference Manual3-56
Figure 3-56. Monitor Options - COM1 Port selected
Connection Mode
On the Conn Mode screen (Figure 3-57 on page 3-57), select theconnection mode to manage communication between the Total
Station and the data controller.
• Initial TS Connection – selects a communication course betweenthe total station and the data controller depending on the optionaldevice used. Depending upon the type of the instrument, selectone of the following optional devices:
– Cable: for connection using the RS-232 cable
– Radios: for radio communication
– RC2 Only: for optical communication using the remotecontroller RC-2
– Bluetooth TS: for establishing a Bluetooth connection
• Optical – selects the connection course (either RC2 Cable, RC2
Bluetooth, or None) between the field controller and the remote
controller RC-2 in case carrying out optical communication withthe Total Station.
• Back – returns to the previous screen.
• Next – opens the Cable screen.

8/10/2019 7010-0944 - SokkiaSSF_rm.pdf
http://slidepdf.com/reader/full/7010-0944-sokkiassfrmpdf 107/623

8/10/2019 7010-0944 - SokkiaSSF_rm.pdf
http://slidepdf.com/reader/full/7010-0944-sokkiassfrmpdf 108/623
Configuring a Job
Sokkia Spectrum Survey Field Reference Manual3-58
Figure 3-58. Cable
Radio
The Radio screen sets the parameters of the modem connected to thetotal station (see Figure 3-59 on page 3-59).
• Type – the type of modem; either Satel, Pacific Crest or Generic.
• Radio Comm Settings – sets radio communication parameters:parity, number of data bits, baud rate, and the number of stop bits.
• Configure Radio – opens the Radio Parameters screen for a
Satel or Pacific Crest radio (Figure 3-17 on page 3-19 andFigure 3-18 on page 3-20).
• Back – returns to the previous screen.
• Next – opens the Search/Track screen (see “Search/Track” onpage 3-60).
• Finish – saves the changes and returns to the Select Survey
Config screen. Settings are transmitted only when theconfiguration is used.

8/10/2019 7010-0944 - SokkiaSSF_rm.pdf
http://slidepdf.com/reader/full/7010-0944-sokkiassfrmpdf 109/623
Configuring the Survey
P/N 7010-0944 3-59
Figure 3-59. TS Radio
Mode
The Mode screen contains the parameters defining the turning abilityof conventional total stations. This mode is available only formotorized instruments in Conventional and Reflectorless modes ofoperation (Figure 3-60 on page 3-60).
Table 3-3 lists Motorized total stations that support Auto Trackingand Auto Aiming mode.
• Enable Motor Turning – sets the motor to active mode if enabled.
• Auto Tracking – if motor turning is enabled, sets the motorizedtotal station into remote control, or a fully automatic mode of
operation. Select one of the following modes of auto tracking:
– Auto Tracking: causes the total station to track the reflector asthe surveyor moves from point to point.
Table 3-3. Motorized Total Stations
GTS-800/810/900 – Motorized
GTS-800A/810A/820A/900A –
Motorized and Auto Tracking/AimingGPT-8000 – Motorized
GPT-8000A/8200A – Motorized and
Auto Tracking/Aiming
AP-L1 – Motorized and Auto Tracking
AP-L1A – Motorized and Auto Tracking
GRT-2000 – Motorized and AutoTracking
GMT-100 – Motorized
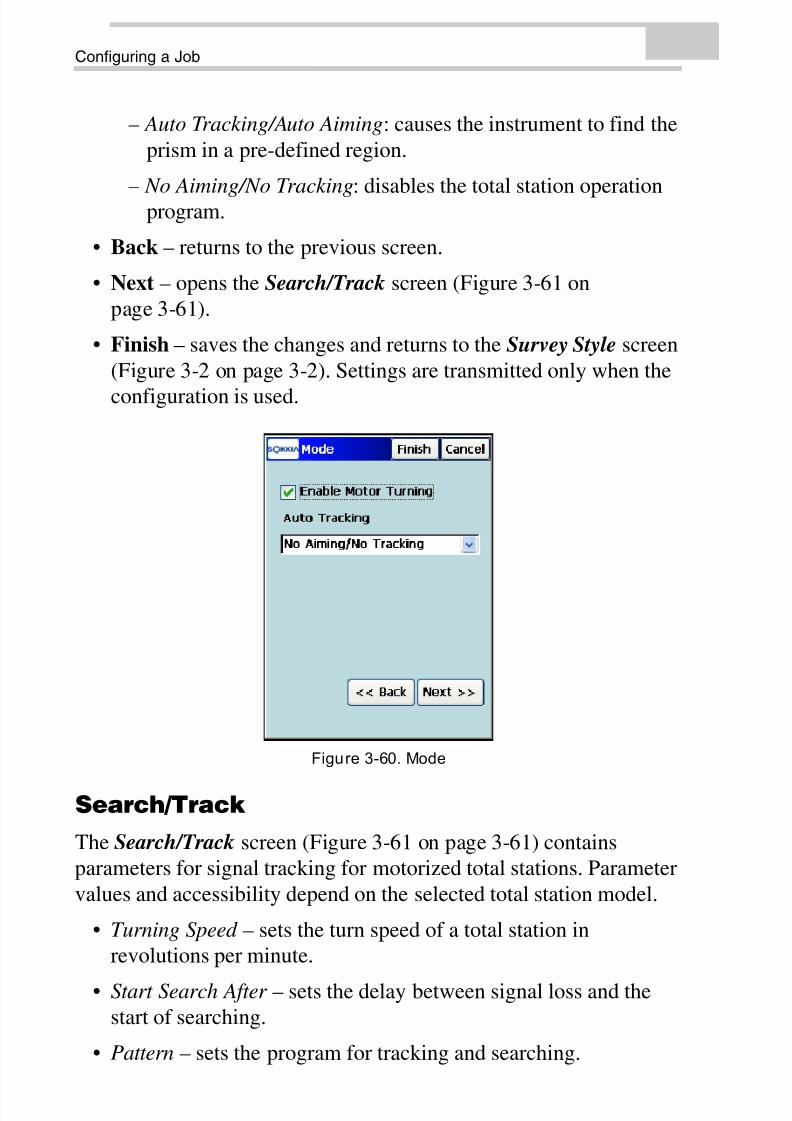
8/10/2019 7010-0944 - SokkiaSSF_rm.pdf
http://slidepdf.com/reader/full/7010-0944-sokkiassfrmpdf 110/623
Configuring a Job
Sokkia Spectrum Survey Field Reference Manual3-60
– Auto Tracking/Auto Aiming: causes the instrument to find the
prism in a pre-defined region.
– No Aiming/No Tracking: disables the total station operationprogram.
• Back – returns to the previous screen.
• Next – opens the Search/Track screen (Figure 3-61 onpage 3-61).
• Finish – saves the changes and returns to the Survey Style screen
(Figure 3-2 on page 3-2). Settings are transmitted only when the
configuration is used.
Figure 3-60. Mode
Search/Track
The Search/Track screen (Figure 3-61 on page 3-61) containsparameters for signal tracking for motorized total stations. Parameter
values and accessibility depend on the selected total station model.
• Turning Speed – sets the turn speed of a total station inrevolutions per minute.
• Start Search After – sets the delay between signal loss and thestart of searching.
• Pattern – sets the program for tracking and searching.

8/10/2019 7010-0944 - SokkiaSSF_rm.pdf
http://slidepdf.com/reader/full/7010-0944-sokkiassfrmpdf 111/623
Configuring the Survey
P/N 7010-0944 3-61
– Normal (for AP-L1A and GRT-2000) or Pattern 1 mode:
searches for the prism at the point where the prism was lost.The instrument gradually searches in up and down directions,
and continues until the prism is found.
– High (for AP-L1A and GRT-2000) or Pattern 2 mode:
searches for the prism for a set amount of time. Theinstrument searches from up to down and continues until the
prism is found, or after a maximum of six attempts.
Auto tracking mode changes to manual mode when the prismcannot be found within six attempts, and returns to the point
where the prism was lost.1
• Trk Speed – sets the speed for tracking; either slow, medium, or fast . For TS models with Auto Tracking, sets the speed mode
according to the purpose of measurement: Survey (for fixed pointobservation), Machine Control 1, 2 (to control constructionmachinery), or real time surveying of various traveling objects.
Figure 3-61. Search/Track Parameters
• Sensitivity – sets the detection sensitivity of the accepted signal;
either low, medium, or high.• Track Light – enables/disables the light on the line of sight.
1. For details, refer to the “Automatic Tracking Total Stations. GTS-800A
Series” Instruction Manual.

8/10/2019 7010-0944 - SokkiaSSF_rm.pdf
http://slidepdf.com/reader/full/7010-0944-sokkiassfrmpdf 112/623
Configuring a Job
Sokkia Spectrum Survey Field Reference Manual3-62
• Scan Range – sets the width of the tracking signal; either narrow,
middle, or wide. Available only in the AP-L1A and GRT-2000total stations.
• Range (dms) – sets the range of searching or tracking, in degrees,for vertical and horizontal planes.
• Back – returns to the previous screen.
• Next – opens the Config: Survey Parms screen (Figure 3-62).
• Finish – saves the changes and returns to the Select Survey
Config screen. Settings are transmitted only when the
configuration is used.
• Cancel – closes the screen without saving the settings.
Survey Parameters
The Survey Parms screen (Figure 3-63 on page 3-63) contains thedefault parameters that are used during the survey. They can bechanged with the help of the Settings button from any Survey screen
(Figure 3-62).
Figure 3-62. Survey Parameters – First Screen
• Meas Method – sets the mode of side-shot measurements; eitherSideshot-Direct , Sideshot Direct/Reverse, or Angle/Dist Sets-Dir/
Rev. See “Topo” on page 11-2 for a description of these methods.
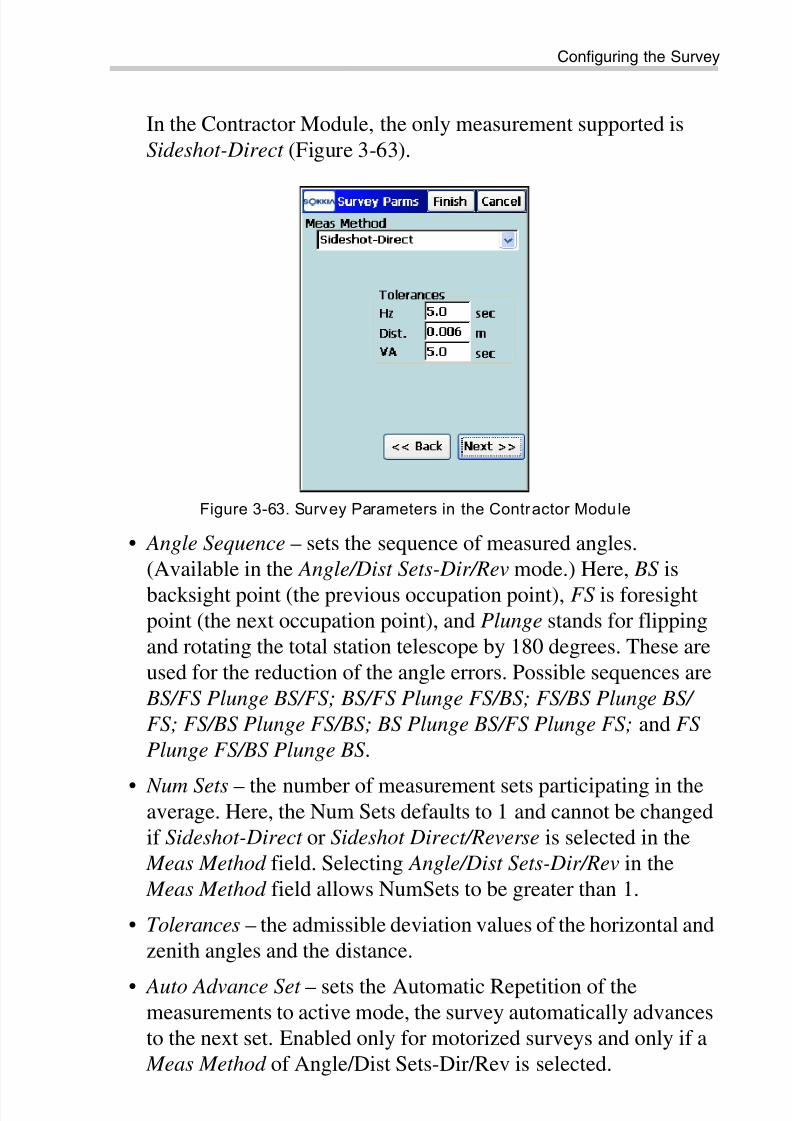
8/10/2019 7010-0944 - SokkiaSSF_rm.pdf
http://slidepdf.com/reader/full/7010-0944-sokkiassfrmpdf 113/623
Configuring the Survey
P/N 7010-0944 3-63
In the Contractor Module, the only measurement supported is
Sideshot-Direct (Figure 3-63).
Figure 3-63. Survey Parameters in the Contractor Module
• Angle Sequence – sets the sequence of measured angles.(Available in the Angle/Dist Sets-Dir/Rev mode.) Here, BS is
backsight point (the previous occupation point), FS is foresightpoint (the next occupation point), and Plunge stands for flippingand rotating the total station telescope by 180 degrees. These areused for the reduction of the angle errors. Possible sequences are
BS/FS Plunge BS/FS; BS/FS Plunge FS/BS; FS/BS Plunge BS/
FS; FS/BS Plunge FS/BS; BS Plunge BS/FS Plunge FS; and FS
Plunge FS/BS Plunge BS .
• Num Sets – the number of measurement sets participating in theaverage. Here, the Num Sets defaults to 1 and cannot be changedif Sideshot-Direct or Sideshot Direct/Reverse is selected in the
Meas Method field. Selecting Angle/Dist Sets-Dir/Rev in the Meas Method field allows NumSets to be greater than 1.
• Tolerances – the admissible deviation values of the horizontal andzenith angles and the distance.
• Auto Advance Set – sets the Automatic Repetition of themeasurements to active mode, the survey automatically advancesto the next set. Enabled only for motorized surveys and only if a Meas Method of Angle/Dist Sets-Dir/Rev is selected.
8/10/2019 7010-0944 - SokkiaSSF_rm.pdf
http://slidepdf.com/reader/full/7010-0944-sokkiassfrmpdf 114/623

8/10/2019 7010-0944 - SokkiaSSF_rm.pdf
http://slidepdf.com/reader/full/7010-0944-sokkiassfrmpdf 115/623
Configuring the Survey
P/N 7010-0944 3-65
Prism/Non-Prism: select the appropriate prism mode, either
Prism or Non-Prism (Enabled only if the Point Guide box ischeck marked).
• AutoTopo (only for robotic total stations) – the parameters of theautomatic survey.
– Method : select a method for taking auto measurements; either
by time, or by horizontal or slope distance.
– Interval: enter the interval for taking auto measurements.
• Back – returns to the previous screen.
• Next – opens the Stakeout Parameters screen.
• Finish – saves the changes and returns to the Survey Style screen.Settings are transmitted only when the configuration is used.
• Cancel – close the screen without saving the settings.
Figure 3-64. Survey Parameters – Second Screen
• The Help Icon in the upper-left corner of the screen opens thepop-up menu that contains the following two items:
– Point Properties: opens the Point Properties screen to define
the point increment value for Survey points (“PointNumbering” on page 3-44).
– Help: accesses the Help files.

8/10/2019 7010-0944 - SokkiaSSF_rm.pdf
http://slidepdf.com/reader/full/7010-0944-sokkiassfrmpdf 116/623

8/10/2019 7010-0944 - SokkiaSSF_rm.pdf
http://slidepdf.com/reader/full/7010-0944-sokkiassfrmpdf 117/623

8/10/2019 7010-0944 - SokkiaSSF_rm.pdf
http://slidepdf.com/reader/full/7010-0944-sokkiassfrmpdf 118/623

8/10/2019 7010-0944 - SokkiaSSF_rm.pdf
http://slidepdf.com/reader/full/7010-0944-sokkiassfrmpdf 119/623

8/10/2019 7010-0944 - SokkiaSSF_rm.pdf
http://slidepdf.com/reader/full/7010-0944-sokkiassfrmpdf 120/623
Configuring a Job
Sokkia Spectrum Survey Field Reference Manual3-70
• BS Is Always Required – if enabled, a warning to set the
Backsight to always display when attempting to access any of thescreens involving total station and level observations.
• Back – returns to the previous screen.
• Finish – saves the changes and returns to the Survey Style screen(Figure 3-2 on page 3-2). Settings are transmitted only when the
configuration is used.
• Cancel – closes the screen without saving the settings.
Figure 3-68. Miscellaneous
Miscellaneous (Level Survey)
For the Level survey type, the Miscellaneous screen contains thefollowing specific user interface parameters (Figure 3-69 onpage 3-71).
• Display Coordinates after Measurement – if enabled,
automatically displays computed coordinates after a total stationmeasurement is performed and before the point coordinates are
stored into the database.
• Apply Earth Curvature and Refraction – if enabled, corrects thecomputed heights for the Earth’s Curvature (Vertical Distance)and slope distances and vertical angles for atmospheric refraction.

8/10/2019 7010-0944 - SokkiaSSF_rm.pdf
http://slidepdf.com/reader/full/7010-0944-sokkiassfrmpdf 121/623
Configuring the Survey
P/N 7010-0944 3-71
• Prompt for Feature Codes – if enabled, the Code-Attributes
screen displays to specify the code and attributes before asurveyed point is stored.
• Stakeout Sound – if enabled, makes a sound each time a point isstaked-out.
• Beep on Storing Points – if enabled, makes a sound each time a
point is stored.
• Hold Vertical Offset – if enabled, the vertical offset is addedautomatically to each measurement. Available only for the digital
level.• Back – returns to the previous screen.
• Finish – saves the changes and returns to the Survey Style screen
(Figure 3-2 on page 3-2). Settings are transmitted only when theconfiguration is used.
• Cancel – closes the screen without saving the settings.
Figure 3-69. Miscellaneous – Level

8/10/2019 7010-0944 - SokkiaSSF_rm.pdf
http://slidepdf.com/reader/full/7010-0944-sokkiassfrmpdf 122/623

8/10/2019 7010-0944 - SokkiaSSF_rm.pdf
http://slidepdf.com/reader/full/7010-0944-sokkiassfrmpdf 123/623

8/10/2019 7010-0944 - SokkiaSSF_rm.pdf
http://slidepdf.com/reader/full/7010-0944-sokkiassfrmpdf 124/623

8/10/2019 7010-0944 - SokkiaSSF_rm.pdf
http://slidepdf.com/reader/full/7010-0944-sokkiassfrmpdf 125/623
Setting Coordinate System Parameters
P/N 7010-0944 3-75
Figure 3-71. Projections
Custom Projections
The Custom Projections screen (Figure 3-72) contains a list ofcustom projections (grid systems). Initially, this list is empty.
• Delete – press to delete the selected custom grid systems.
• Edit – opens the Custom Projection screen (Figure 3-73 onpage 3-76) to edit parameters of the selected custom grid system.
• Add – opens the Custom Projection screen (Figure 3-73 on
page 3-76) to enter parameters for the new custom grid system.
Figure 3-72. Custom Projections – Add New Custom Grid System

8/10/2019 7010-0944 - SokkiaSSF_rm.pdf
http://slidepdf.com/reader/full/7010-0944-sokkiassfrmpdf 126/623
Configuring a Job
Sokkia Spectrum Survey Field Reference Manual3-76
On the Custom Projection screen, enter or select the following
parameters for the custom grid (Figure 3-73).
• Name – enter the name of the new projection.• Type – select a sample projection to construct a custom projection
from the following list of available types:
– Albers Equal Area (orthembadic): conic projection.
– Cassini-Soldner: cylindrical projection.
– Double Stereographic: conformal azimuthal projection.
– Lambert: conformal conic projection.– Oblique Mercator: conformal cylindrical projection.
– Stereographic: conformal azimuthal projection.
– Transverse Mercator: conformal cylindrical projection (seeFigure 3-74 on page 3-77 for more information).
Figure 3-73. Custom Projections – Add New Custom Grid System
• Datum – select the datum for the projection from the list ofavailable types.
• Region – displays the region.• Note – enter any additional information about the projection, if
preferred.

8/10/2019 7010-0944 - SokkiaSSF_rm.pdf
http://slidepdf.com/reader/full/7010-0944-sokkiassfrmpdf 127/623

8/10/2019 7010-0944 - SokkiaSSF_rm.pdf
http://slidepdf.com/reader/full/7010-0944-sokkiassfrmpdf 128/623
Configuring a Job
Sokkia Spectrum Survey Field Reference Manual3-78
• East0, North0 – false Easting and Northing of the origin. These
constant values are added to all negative eastings and northingsso that only positive values of easting and northing are recorded.
• Back – returns to the previous screen.
• Finish – creates the custom projection and returns to the Custom
Projection screen with the new projection added.
• Cancel – closes the screen without saving the settings.
From Grid-to-Ground/Ground-to-Grid
Transformation
A ground projection is a grid mapping projection rescaled to convertpoint coordinates to another reference surface (up to the averageproject elevation) to produce near ground distance values. The groundsystem can be rotated and shifted relative to the grid system. The
ground coordinates can be converted back to the grid projection.
Sokkia SSF has three modes to set up grid-to-ground parameters.Select one of these modes from the Parameters field (Figure 3-75 on
page 3-79):• Scale Factor
• Average Job Height
• Origin Point
TIP
Latitudes is entered as a positive number in theNorthern Hemisphere, and as a negative number inthe Southern Hemisphere.
Longitudes are positive for Eastern directions andnegative for Western directions from the GMT line.

8/10/2019 7010-0944 - SokkiaSSF_rm.pdf
http://slidepdf.com/reader/full/7010-0944-sokkiassfrmpdf 129/623
Setting Coordinate System Parameters
P/N 7010-0944 3-79
For Scale Factor, the Grid to/from Ground screen (Figure 3-75) setsthe Combined Scale Factor for Grid-to-Ground or Ground-to-Grid coordinate transformation.
Figure 3-75. Grid to/from Ground - Scale Factor
• Direction – switches between the Grid to Ground and Ground to
Grid coordinate transformation types.
• Combined SF – sets the combined scale factor.
• Az Rotation – sets the angle between the North directions of thegrid and the ground coordinate systems. This angle defines thereference direction for ground azimuths.
• Offsets – enter offset values of the grid origin along the North and
East axes to reduce ground coordinates to manageable values.
For Average Job Height, the Grid to Ground screen (Figure 3-76 onpage 3-80) sets the Average Height of the job points for Grid-to-
Ground coordinate transformation.

8/10/2019 7010-0944 - SokkiaSSF_rm.pdf
http://slidepdf.com/reader/full/7010-0944-sokkiassfrmpdf 130/623

8/10/2019 7010-0944 - SokkiaSSF_rm.pdf
http://slidepdf.com/reader/full/7010-0944-sokkiassfrmpdf 131/623
Setting Coordinate System Parameters
P/N 7010-0944 3-81
Figure 3-77. Grid to Ground - Origin Point
• Direction – always show the Grid to Ground coordinatetransformation type.
• Combined SF – shows the combined scale factor.
• – opens the Compute Rotation screen (Figure 3-78 on
page 3-82) to compute the Azimuth Rotation value. For details,
see Figure 3-79 on page 3-83.
• Orig Point – sets a desired grid point from the job as a ground
origin; can be selected from a map, a list, or entered manually.
• Ground Pt – sets the ground coordinates for the origin point.
• OK – calculates all needed transformation parameters (offsets,scale factor, rotation) and returns to the Coord System screen.The scale factor for this mode is a calculated value. The value(not equal to "1") depends on the height of the origin point.
Compute Rotation
The Compute Rotation screen (Figure 3-78 on page 3-82) computesazimuth rotation using ground and grid azimuths.
• Azimuth – sets the azimuths in the ground and grid systems.
• Compute – opens the Compute Azimuth screen to computeazimuths in the ground and grid systems, respectively.

8/10/2019 7010-0944 - SokkiaSSF_rm.pdf
http://slidepdf.com/reader/full/7010-0944-sokkiassfrmpdf 132/623
Configuring a Job
Sokkia Spectrum Survey Field Reference Manual3-82
• Rotation – shows the azimuth rotation after pressing OK.
• OK – saves the results and returns to the Grid to Ground
Parameters screen.• Cancel – closes the screen without saving the settings.
Figure 3-78. Compute Rotation
Compute Azimuth
The Compute Azimuth screen (Figure 3-79 on page 3-83) computesthe azimuth of the direction using two points.
• From – sets the start point for the direction.
• To – sets the end point for the direction.
• Add to Azimuth – adds an additional value to the azimuth.
• Azimuth – displays the result after pressing the OK button for thefirst time.
• OK – saves the results and returns to the Compute Rotation
screen (Figure 3-78).
• Cancel – closes the screen without saving the settings.

8/10/2019 7010-0944 - SokkiaSSF_rm.pdf
http://slidepdf.com/reader/full/7010-0944-sokkiassfrmpdf 133/623
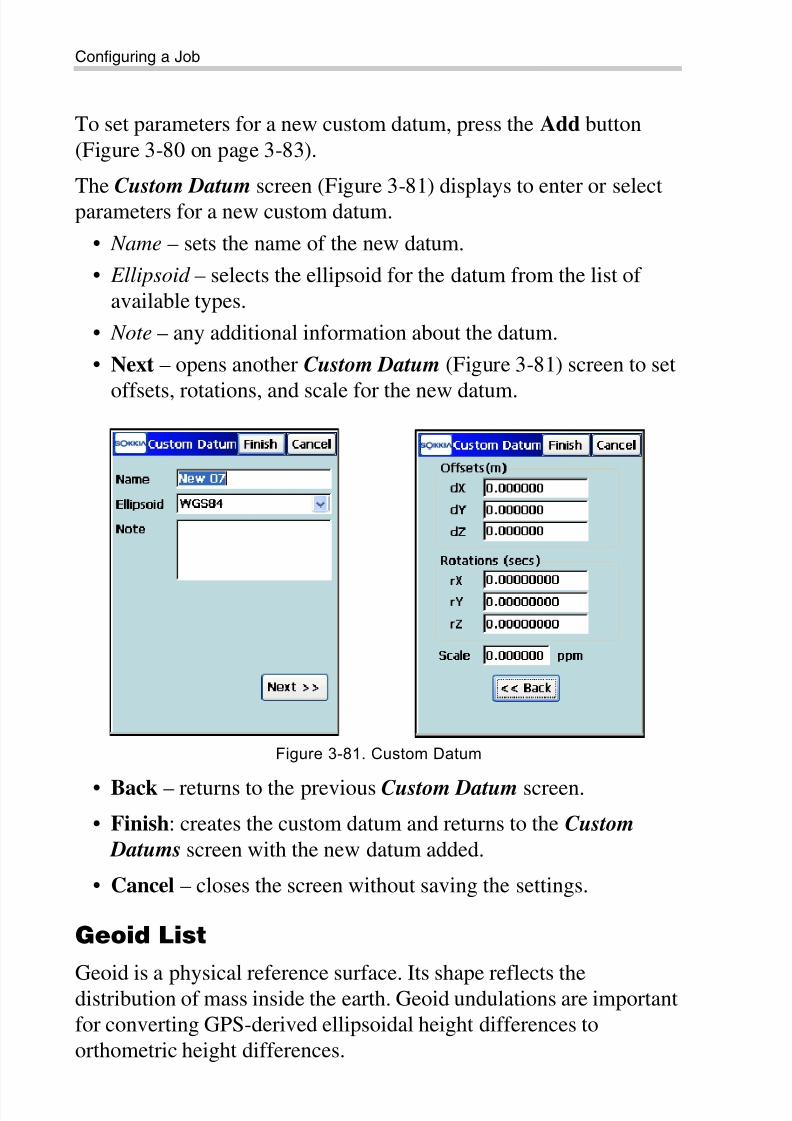
8/10/2019 7010-0944 - SokkiaSSF_rm.pdf
http://slidepdf.com/reader/full/7010-0944-sokkiassfrmpdf 134/623
Configuring a Job
Sokkia Spectrum Survey Field Reference Manual3-84
To set parameters for a new custom datum, press the Add button
(Figure 3-80 on page 3-83).
The Custom Datum screen (Figure 3-81) displays to enter or selectparameters for a new custom datum.
• Name – sets the name of the new datum.
• Ellipsoid – selects the ellipsoid for the datum from the list ofavailable types.
• Note – any additional information about the datum.
• Next – opens another Custom Datum (Figure 3-81) screen to set
offsets, rotations, and scale for the new datum.
Figure 3-81. Custom Datum
• Back – returns to the previous Custom Datum screen.
• Finish: creates the custom datum and returns to the Custom
Datums screen with the new datum added.
• Cancel – closes the screen without saving the settings.
Geoid List
Geoid is a physical reference surface. Its shape reflects thedistribution of mass inside the earth. Geoid undulations are importantfor converting GPS-derived ellipsoidal height differences toorthometric height differences.

8/10/2019 7010-0944 - SokkiaSSF_rm.pdf
http://slidepdf.com/reader/full/7010-0944-sokkiassfrmpdf 135/623
Setting Coordinate System Parameters
P/N 7010-0944 3-85
The Geoids List screen (Figure 3-82) contains a list of active Geoids
available for selection.
• Remove – deletes the geoid from the list.• Edit – opens the Add Geoid screen (Figure 3-83 on page 3-86) to
change the geoid.
• Add – opens the Add Geoid screen (Figure 3-83 on page 3-86) toadd a geoid file to the list. Install the geoid file on the controller
prior to adding it to the list. Some geoid files can be installed onthe controller during Sokkia SSF installation. They are provided
to the user with the Sokkia SSF installation program as ‘.gff’files.
• OK – the job refers to the selected geoid file when performingcalculations.
• Cancel – closes the screen without saving the settings.
Figure 3-82. Geoid List
Add a Geoid File
On the Add Geoid screen (Figure 3-83 on page 3-86), select a Geoid
file from the controller to view the boundaries of the geoidapplication.
• Geoid Format – the format of the geoid; either Geoid 99/2003, Australian, Canadian 2000, Canadian 95, Geoid File Format ,
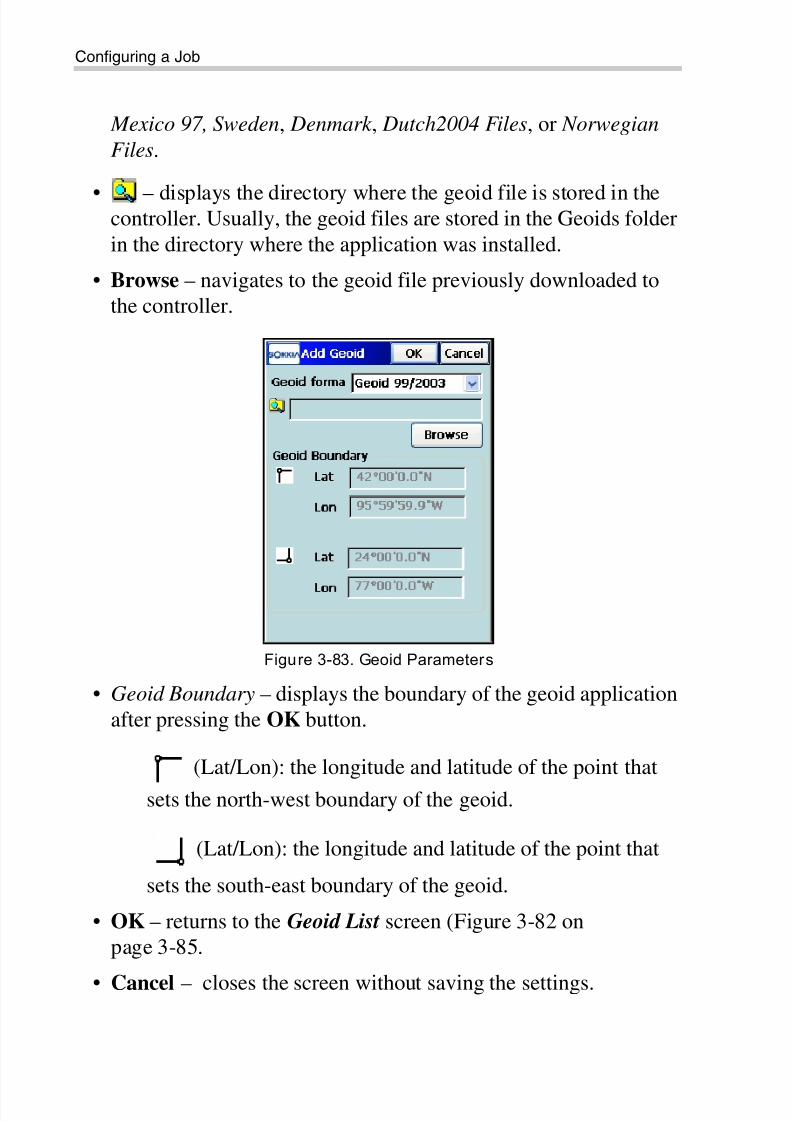
8/10/2019 7010-0944 - SokkiaSSF_rm.pdf
http://slidepdf.com/reader/full/7010-0944-sokkiassfrmpdf 136/623
Configuring a Job
Sokkia Spectrum Survey Field Reference Manual3-86
Mexico 97, Sweden, Denmark , Dutch2004 Files, or Norwegian
Files.
• – displays the directory where the geoid file is stored in thecontroller. Usually, the geoid files are stored in the Geoids folder
in the directory where the application was installed.
• Browse – navigates to the geoid file previously downloaded tothe controller.
Figure 3-83. Geoid Parameters
• Geoid Boundary – displays the boundary of the geoid applicationafter pressing the OK button.
(Lat/Lon): the longitude and latitude of the point that
sets the north-west boundary of the geoid.
(Lat/Lon): the longitude and latitude of the point that
sets the south-east boundary of the geoid.
• OK – returns to the Geoid List screen (Figure 3-82 onpage 3-85.
• Cancel – closes the screen without saving the settings.

8/10/2019 7010-0944 - SokkiaSSF_rm.pdf
http://slidepdf.com/reader/full/7010-0944-sokkiassfrmpdf 137/623

8/10/2019 7010-0944 - SokkiaSSF_rm.pdf
http://slidepdf.com/reader/full/7010-0944-sokkiassfrmpdf 138/623
Configuring a Job
Sokkia Spectrum Survey Field Reference Manual3-88
Figure 3-84. Global Screen
NOTICE
When using a Global Data Dictionary file, thecodes immediately become available for selection
from the Code drop-down list.
The layers from the Global Data Dictionary filedisplay in the Layer list of the current job only aspoints are saved with the file’s codes selected.

8/10/2019 7010-0944 - SokkiaSSF_rm.pdf
http://slidepdf.com/reader/full/7010-0944-sokkiassfrmpdf 139/623

8/10/2019 7010-0944 - SokkiaSSF_rm.pdf
http://slidepdf.com/reader/full/7010-0944-sokkiassfrmpdf 140/623
Configuring a Job
Sokkia Spectrum Survey Field Reference Manual3-90
In the Contractor Module, the Display screen does not contain the
Coordinate Type field because this module works only with groundcoordinates.
Setting Alarms
The Alarms icon opens the Alarms screen (Figure 3-87). For details,see “Setting Alarms” on page 3-90.
Figure 3-87. Alarms
• Check – pressing this button checks the status of selectedsituations for the instruments being used (Figure 3-88).
Figure 3-88. Checking Status

8/10/2019 7010-0944 - SokkiaSSF_rm.pdf
http://slidepdf.com/reader/full/7010-0944-sokkiassfrmpdf 141/623
Modifying Menus
P/N 7010-0944 3-91
Modifying Menus
Tap the Menus icon to modify the appearance of the menus. Some
rarely used functions are not displayed. If the menu optioins you needare not visible (available), enable these options in the correspondingmenu in the Config Menus screen (Figure 3-89).
The Config Menus screen displays a list of menus and submenus foreach special submenu for the current job configuration(Figure 3-89).
• Menu – shows the list of available menus.
• Sub Menu to Display – shows the list of the selected menu itemsavailable for display. Place a check mark next to the item youwant to display in the menu.
Figure 3-89. Config Menu Options
• OK – press to save the settings made and return to the mainscreen.
• Use Icons – check and enable this box to use the icon main menuinstead of the list of names (Figure 3-90 on page 3-92).
This operation makes sense only when Sokkia SSF is in the Listmenu mode (For details on switching to the List Menu, see“Switch Menus” on page 1-12.)

8/10/2019 7010-0944 - SokkiaSSF_rm.pdf
http://slidepdf.com/reader/full/7010-0944-sokkiassfrmpdf 142/623
Configuring a Job
Sokkia Spectrum Survey Field Reference Manual3-92
Figure 3-90. List Menu Icons

8/10/2019 7010-0944 - SokkiaSSF_rm.pdf
http://slidepdf.com/reader/full/7010-0944-sokkiassfrmpdf 143/623
P/N 7010-0944
Chapter 4
4-1
Exporting DataTo export data, tap the Export icon in the main menu.
The Export function is used to save points, codes and attributes, CodeLibraries, Roads, Cross Section Templates, Point Lists, Localization,Road Survey, and Raw Data in another job, controller, or file.
The Export menu (Figure 4-1) includes options to:
1. Export data from an active job to a new job
2. Export job data to another controller
3. Export data to a file
4. Export GPS session settings to the receiver
Figure 4-1. Export Menu
Tap the Help Icon to open a pop-up menu, giving access to the
help files, module activation codes, port data logging, changing menu
interface, and information about Sokkia SSF (for details see “HelpIcon’s Pop-up Menu” on page 1-9).

8/10/2019 7010-0944 - SokkiaSSF_rm.pdf
http://slidepdf.com/reader/full/7010-0944-sokkiassfrmpdf 144/623

8/10/2019 7010-0944 - SokkiaSSF_rm.pdf
http://slidepdf.com/reader/full/7010-0944-sokkiassfrmpdf 145/623

8/10/2019 7010-0944 - SokkiaSSF_rm.pdf
http://slidepdf.com/reader/full/7010-0944-sokkiassfrmpdf 146/623
Exporting Data
Sokkia Spectrum Survey Field Reference Manual4-4
Select Point Types To Export
The Pt List To Export screen (Figure 4-4) selects the types of points
to export if Code Library, Localization, or Roads are checked (ifpoints filter by type has been enabled in the Export screen). Placecheck marks near the desired point types.
Figure 4-4. Select Point Type(s) to Export
• Point Types – the point types available for import: either Design
Points, Control Points, Cogo Points, Base Station, Topo Points,
Offset Topo Points, Auto Topo Points, Sideshot, Offset, Remote,
Reflectorless, BackSight, Stake Points, Stake Line, Check Points,
Manually Typed, or Tape Dimension.
• Check – marks the highlighted entries.
• Uncheck – removes the mark from the highlighted code.
• Back – returns to the previous screen.
• Next – if available, opens the next screen to select objects; oncethe button becomes grayed out, tap the Finish button to start the
export process.
• Cancel – closes the screen without saving the settings.
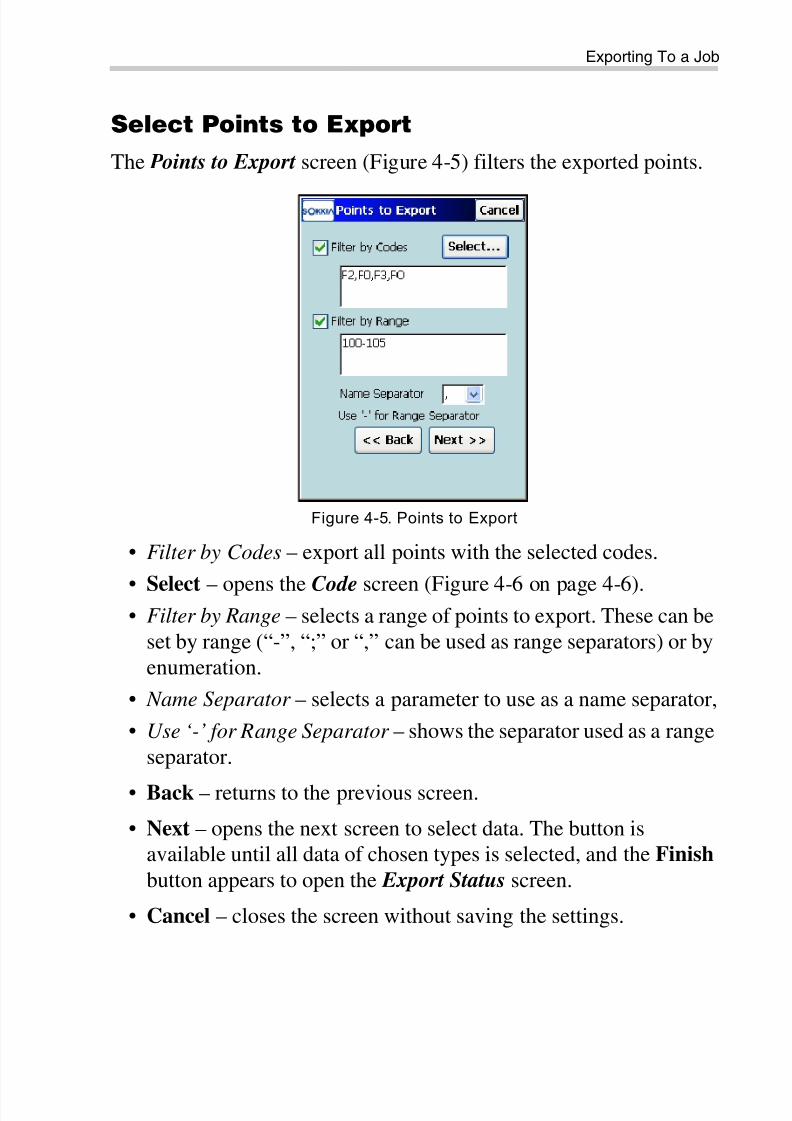
8/10/2019 7010-0944 - SokkiaSSF_rm.pdf
http://slidepdf.com/reader/full/7010-0944-sokkiassfrmpdf 147/623
Exporting To a Job
P/N 7010-0944 4-5
Select Points to Export
The Points to Export screen (Figure 4-5) filters the exported points.
Figure 4-5. Points to Export
• Filter by Codes – export all points with the selected codes.
• Select – opens the Code screen (Figure 4-6 on page 4-6).• Filter by Range – selects a range of points to export. These can be
set by range (“-”, “;” or “,” can be used as range separators) or byenumeration.
• Name Separator – selects a parameter to use as a name separator,
• Use ‘-’ for Range Separator – shows the separator used as a range
separator.
• Back – returns to the previous screen.
• Next – opens the next screen to select data. The button isavailable until all data of chosen types is selected, and the Finish
button appears to open the Export Status screen.
• Cancel – closes the screen without saving the settings.

8/10/2019 7010-0944 - SokkiaSSF_rm.pdf
http://slidepdf.com/reader/full/7010-0944-sokkiassfrmpdf 148/623
Exporting Data
Sokkia Spectrum Survey Field Reference Manual4-6
Select Code
The Code screen (Figure 4-6) contains a list of available codes. All
codes that have been check marked are imported.
Figure 4-6. Select Code
• Uncheck – removes the mark from the highlighted code.• Check – marks the highlighted codes.
• Select or OK – returns to the Points to Export screen with thecodes selected.
• Cancel – closes the screen without saving the settings.

8/10/2019 7010-0944 - SokkiaSSF_rm.pdf
http://slidepdf.com/reader/full/7010-0944-sokkiassfrmpdf 149/623
Exporting To a Job
P/N 7010-0944 4-7
Select Point List to Export
The Pt List To Export screen (Figure 4-7) selects the point lists to
export along with the data chosen.
Figure 4-7. Select Point List to Export
• Point Lists – the list of available point lists in the job.• Check – marks the highlighted entries.
• Uncheck – removes the mark from the highlighted entries.
• Back – returns to the previous screen.
• Next – available if other data is chosen to export on the To Job
screen (Figure 4-3 on page 4-3). Opens the next screen to select
other objects (horizontal alignments, vertical alignments, roads orx-section sets) which are similar to the Point List to Export screen. Once the button becomes grayed out, tap the Finish button to start the export process.
• Finish – if available, opens the Ex port Status screen and startsthe export process.
• Cancel – closes the screen without saving the settings.

8/10/2019 7010-0944 - SokkiaSSF_rm.pdf
http://slidepdf.com/reader/full/7010-0944-sokkiassfrmpdf 150/623
Exporting Data
Sokkia Spectrum Survey Field Reference Manual4-8
Export Status
The Export Status screen (Figure 4-8) reflects the export process and
contains a progress bar and a comments window. The progress bardisplays the percentage of the data being exported.
Figure 4-8. Expor t Status
• Cancel – cancels the export process.
• Close – returns to the main screen.

8/10/2019 7010-0944 - SokkiaSSF_rm.pdf
http://slidepdf.com/reader/full/7010-0944-sokkiassfrmpdf 151/623
Exporting To a Job
P/N 7010-0944 4-9
Duplicate Objects
If the existing job contains objects with the same names as the job
that the objects are exported to, the Duplicate <Objects> screendisplays (Figure 4-9) a warning that the code already exists.
Figure 4-9. Dupl icate <Objects>
The Duplicate <Objects> screen issues a warning that prevents theloss of points, roads, or point lists when names of these exportedobjects coincide with existing ones. Select from the followingoptions:
• Overwrite – the exported object overwrites the existing one.
• Rename – the imported object is renamed. The new name should
be noted in the corresponding field (Start Name).• Prefix/Suffix – the imported object differs from the existing object
by prefix or suffix. The prefix/suffix should be noted in thecorresponding field.
• Yes – press to accept the decision.
• Yes To All – press to accept the same decision for all similarcases.
• Skip – press to skip the object without exporting.
• Skip All – press to skip all the objects with names that coincidewith the names of existing objects, without exporting.

8/10/2019 7010-0944 - SokkiaSSF_rm.pdf
http://slidepdf.com/reader/full/7010-0944-sokkiassfrmpdf 152/623
Exporting Data
Sokkia Spectrum Survey Field Reference Manual4-10
• Close – disables the export process and opens the Export Status
screen to remove all the objects already exported.
Exporting to Device
To export a file to a controller, tap the To Device icon.
Selecting Port
On the Settings screen (Figure 4-10) you can select the port for data
transfer with another controller.
Figure 4-10. Select Port
• Com Port – selects the Communication port; select either COM1,
COM2, Ethernet or Bluetooth.
• Next – opens the Select File screen (Figure 4-11 on page 4-11).

8/10/2019 7010-0944 - SokkiaSSF_rm.pdf
http://slidepdf.com/reader/full/7010-0944-sokkiassfrmpdf 153/623

8/10/2019 7010-0944 - SokkiaSSF_rm.pdf
http://slidepdf.com/reader/full/7010-0944-sokkiassfrmpdf 154/623
Exporting Data
Sokkia Spectrum Survey Field Reference Manual4-12
Exporting to File
To export data to a file, tap the To File icon.
The To File screen selects data type from the current job to export tofiles of either pre-defined or custom formats. For a description ofthese formats, see Appendix A (Figure 4-13).
Figure 4-13. Export To File
• Data – select the data type to export: either Points, Lines, Point
Lists, Code Library, Raw Data, Horizontal Alignments, Vertical
Alignments, X-Section Sets, Roads, X-Sect Templates,
Localization, Scanning Data, Roads Survey, Job History, TINs,
Layers, or Multiple.
• Format – select the file type to export data to.
• Next – opens the To < name of Format> screen to specify the filename and the directory where the file will be saved.
• Cancel – returns to the main screen.
Follow up the export process with the help of the export wizard.

8/10/2019 7010-0944 - SokkiaSSF_rm.pdf
http://slidepdf.com/reader/full/7010-0944-sokkiassfrmpdf 155/623
Exporting to File
P/N 7010-0944 4-13
Points and Point Lists
For Point and Point Lists data, the following exports are allowed for
the formats:
Topcon Text Custom (*.txt), Text Custom Report (*.txt), Topcon Text
Custom QC (*.txt), Topcon FC-4 (*.fc4), Topcon FC-5 (*.fc5),
Topcon GTS-6 (*.gts6), Topcon FC-6/GTS-7 (*.pnt), Topcon GTS-7
with strings (*.txt), Topcon GT (*.pnt), Topcon GT Finland (*.gt),
MOSS GENIO (*.mgn), AutoCAD DXF (*.dxf), AutoCAD Drawing
(*.dwg), ESRI Shape (*.shp), Cut Sheet Standard (*.txt), Cut Sheet
User Defined (*.txt), Check Sheet (*.txt), TDS Coordinates (*.cr5),PTL Sheet (*.txt), LandXML (*.xml), NEZ (*.txt), NEZ with strings
(*.txt), CMM (*.cor), MMH360 (*.360), KOF (*.kof),
MMH360_Z000 (*.360), Microstation 95/ISFF (*.dgn), MicroStation
V8 (*.dgn), SBG Pxy (*.PXY) or SBG Geo (*.Geo)
For Points or Point Lists data and for most formats the To File screen(Figure 4-14 on page 4-14) has the following options.
• Select Types of the Points (for Points and Point Lists data types) –check mark this field if not all types of points should be exported.In this case the Point Types to Export screen first displays (seeFigure 4-4 on page 4-4).
• Use Filters (for Points and Point Lists data types) – check markthis field if filters (by code and by range) should be used forexported points.
In this case, the Points to Export screen first displays (seeFigure 4-5 on page 4-5).

8/10/2019 7010-0944 - SokkiaSSF_rm.pdf
http://slidepdf.com/reader/full/7010-0944-sokkiassfrmpdf 156/623

8/10/2019 7010-0944 - SokkiaSSF_rm.pdf
http://slidepdf.com/reader/full/7010-0944-sokkiassfrmpdf 157/623
Exporting to File
P/N 7010-0944 4-15
• ASCII File Properties (this field appears only for the text format
of the exported file) – defines the conditions of the exported fileinterpretation.
• Next – opens the To Text screen (Figure 4-16).
On the To Text screen (Figure 4-16), select a destination directoryand the name of the created file.
Figure 4-16. Select the File
• Type – specifies the file extension (file type).
• Name – the name of the created file.
• OK – opens the Text File Format screen.
• Cancel – returns to the main screen.

8/10/2019 7010-0944 - SokkiaSSF_rm.pdf
http://slidepdf.com/reader/full/7010-0944-sokkiassfrmpdf 158/623
Exporting Data
Sokkia Spectrum Survey Field Reference Manual4-16
On Text File Format screen (Figure 4-17), select a desired textformat.
Figure 4-17. Text File Format
• Delimiter – enables the delimiting symbol between the data in theexported file; either space, comma, tabs or Other delimiter
selected from the list.
• Header in First Row – enable to output a header in the file.
• File Style – selects the order of fields in the exported file.
• Delete – deletes an existing file format.
• Edit (Format) – edits an existing file format. The Custom Style screen displays (Figure 4-18 on page 4-17).
• Add (Format) – adds a new file format. The Custom Style screen(Figure 4-18 on page 4-17) displays.
• Back – returns to the previous screen.
• Next – opens the Coordinate System screen (Figure 4-19 on
page 4-18).
• Finish – press to start the export process (Figure 4-21 on
page 4-19).
• Cancel – closes the screen without saving the settings.

8/10/2019 7010-0944 - SokkiaSSF_rm.pdf
http://slidepdf.com/reader/full/7010-0944-sokkiassfrmpdf 159/623

8/10/2019 7010-0944 - SokkiaSSF_rm.pdf
http://slidepdf.com/reader/full/7010-0944-sokkiassfrmpdf 160/623
Exporting Data
Sokkia Spectrum Survey Field Reference Manual4-18
Figure 4-19. Coordinate System
• Coord Type – select either WGS84 (Lat/Lon/Ht), Datum (Lat/
Lon/Ht), Grid, or Ground .
• Dist Units – recalculate to either Meters, IFeet , or USFeet .
This screen also displays information about the coordinate system inthe job whose data is exported.
• Back – returns to the previous screen.
• Next – opens the Lat/Lon Record Format screen if the type of
geodetic coordinates is selected (Figure 4-20 on page 4-19).
• Finish – opens the Export Status screen and starts the export
process. (See Figure 4-21 on page 4-19.)• Cancel – close the screen without saving the settings.
On the Latitude/Longitude Record Format screen (Figure 4-20 onpage 4-19), select from the drop-down list the format you want to
represent the degrees of Latitude and Longitude in the file exported.
• Back – returns to the previous screen.
• Finish – opens the Export Status screen and starts the Exportprocess (see Figure 4-21.)
• Cancel – closes the screen without saving the settings.

8/10/2019 7010-0944 - SokkiaSSF_rm.pdf
http://slidepdf.com/reader/full/7010-0944-sokkiassfrmpdf 161/623
Exporting to File
P/N 7010-0944 4-19
Figure 4-20. Select Latitude/Longitude Format
On the Export Status screen (Figure 4-21), tap the Close button toreturn to main screen.
Figure 4-21. Export Status
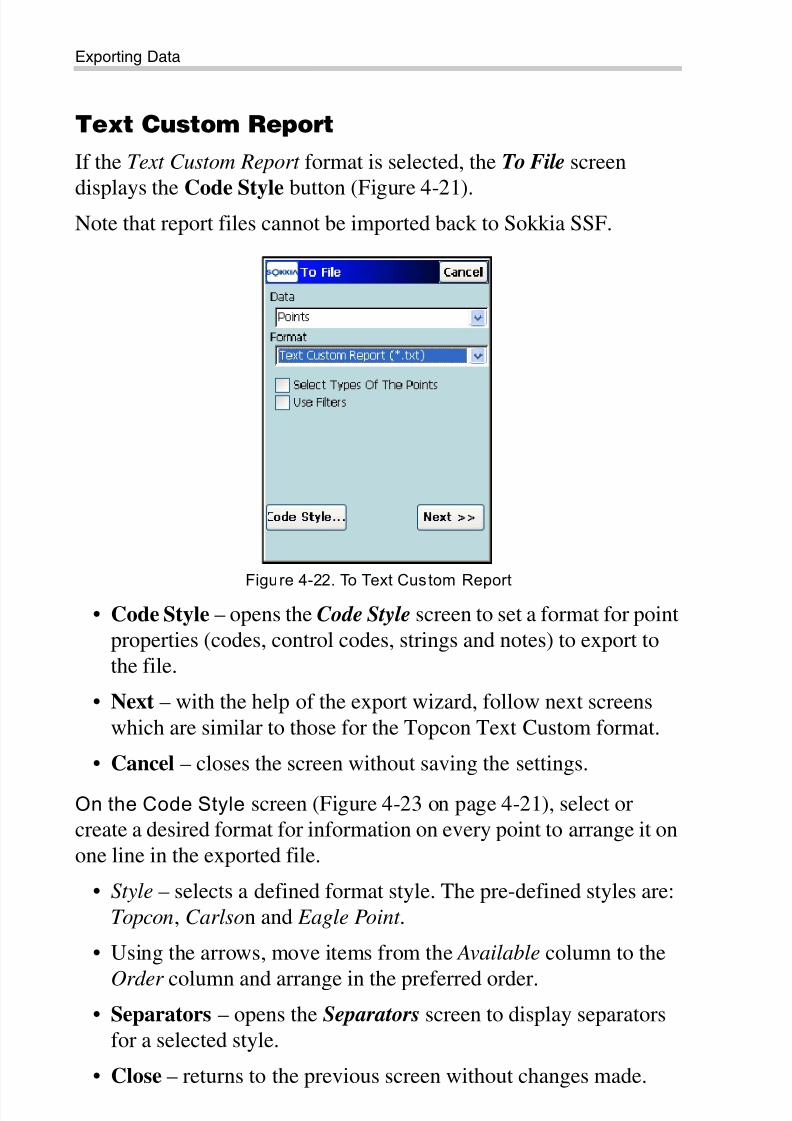
8/10/2019 7010-0944 - SokkiaSSF_rm.pdf
http://slidepdf.com/reader/full/7010-0944-sokkiassfrmpdf 162/623
Exporting Data
Sokkia Spectrum Survey Field Reference Manual4-20
Text Custom Report
If the Text Custom Report format is selected, the To File screen
displays the Code Style button (Figure 4-21).Note that report files cannot be imported back to Sokkia SSF.
Figure 4-22. To Text Custom Report
• Code Style – opens the Code Style screen to set a format for pointproperties (codes, control codes, strings and notes) to export tothe file.
• Next – with the help of the export wizard, follow next screens
which are similar to those for the Topcon Text Custom format.
• Cancel – closes the screen without saving the settings.
On the Code Style screen (Figure 4-23 on page 4-21), select orcreate a desired format for information on every point to arrange it onone line in the exported file.
• Style – selects a defined format style. The pre-defined styles are:
Topcon, Carlson and Eagle Point .
• Using the arrows, move items from the Available column to the
Order column and arrange in the preferred order.• Separators – opens the Separators screen to display separators
for a selected style.
• Close – returns to the previous screen without changes made.

8/10/2019 7010-0944 - SokkiaSSF_rm.pdf
http://slidepdf.com/reader/full/7010-0944-sokkiassfrmpdf 163/623
Exporting to File
P/N 7010-0944 4-21
• Delete – deletes the selected style from the list.
• Save – saves the custom report format and a new entry appears in
the Style drop-down menu.
Figure 4-23. Code Style
On the Separators screen (Figure 4-24), you can enter Code, String,Control Code, and Note separators for a new style.
Figure 4-24. Separators

8/10/2019 7010-0944 - SokkiaSSF_rm.pdf
http://slidepdf.com/reader/full/7010-0944-sokkiassfrmpdf 164/623

8/10/2019 7010-0944 - SokkiaSSF_rm.pdf
http://slidepdf.com/reader/full/7010-0944-sokkiassfrmpdf 165/623
Exporting to File
P/N 7010-0944 4-23
Figure 4-26. AutoCAD DXF
• Do not export code attributes – enable to not export code
attributes.
• Code Style – opens the Code Style screen to set a format for pointproperties (codes, control codes, strings and notes) to export tothe file. For details, refer to “On the Code Style” on page 4-20.
• Settings – opens the Settings screen to select point and line
styles.
• Next – with the help of the export wizard, follow next screens toexport points.
• Cancel – closes the screen without saving the settings.
On the Settings screen, you select desired drawing styles torepresent points and lines.
• Point Style – selects the style for points; either Sokkia SSF Point Blocks, AutoCAD Points, AutoCAD Points with Text Fields, orCarlson Point Blocks.
• Line Style – selects the style for lines; either Sokkia SSF Line
Blocks, AutoCAD Lines, or AutoCAD Lines with Text Fields.
NOTICE
Sokkia SSF only exports AutoCAD 2000 formatDWG files.

8/10/2019 7010-0944 - SokkiaSSF_rm.pdf
http://slidepdf.com/reader/full/7010-0944-sokkiassfrmpdf 166/623
Exporting Data
Sokkia Spectrum Survey Field Reference Manual4-24
• Use 3D coordinates – check mark this box to use 3D coordinates.
• OK – saves the settings and returns to the previous screen.
• Cancel – closes the screen without saving the settings.
Figure 4-27. Settings
ESRI Shape
If the ESRI Shape format type is selected, the To File screen has the
Store Description as Attribute option for point export available.Enable this option to save point descriptions as attributes in the file(Figure 4-28 on page 4-25).
• Store Description as Attribute – check mark this box to save
point descriptions as attributes in the file.

8/10/2019 7010-0944 - SokkiaSSF_rm.pdf
http://slidepdf.com/reader/full/7010-0944-sokkiassfrmpdf 167/623
Exporting to File
P/N 7010-0944 4-25
Figure 4-28. ESRI Shape
• Next – with the help of the export wizard, follow next screens toexport points. Note that while exporting, Sokkia SSF createsthree files for every code in the selected directory (Figure 4-29).
Figure 4-29. Select Directory

8/10/2019 7010-0944 - SokkiaSSF_rm.pdf
http://slidepdf.com/reader/full/7010-0944-sokkiassfrmpdf 168/623
Exporting Data
Sokkia Spectrum Survey Field Reference Manual4-26
TDS Coordinates
If the TDS Coordinates format is selected, the To File screen has the
following additional option to export points.
Figure 4-30. To TDS Coordinates
• When selected, the TDS Coordinate format demands points haveonly numerical names. The screen displays a number at whichSokkia SSF will start renaming points with alphanumeric names.
• Next – with the help of the export wizard, follow next screens toexport points.
Lines
For Lines data, the export is allowed for the formats: Topcon Text
Custom (*.txt), AutoCAD DXF (*.dxf), AutoCAD Drawing (*.dwg),
ESRI Shape (*.shp), LandXML (*.xml), KOF (*.kof), Topcon 3D
Linework (*.ln3), Microstation 95/ISFF (*.dgn), MicroStation V8
(*.dgn), MX GENIO (*.txt), SBG Pxy (*.PXY) or SBG Geo (*.Geo).
Code Library
For Code Library data, the export is allowed for the formats: Topcon
XML (*.xml), or DBF (*.dbf).
Code Library is a set of codes with attributes used in the job. Oncecreated, it can be saved as a file with *.xml, or *.dbf file extensions.
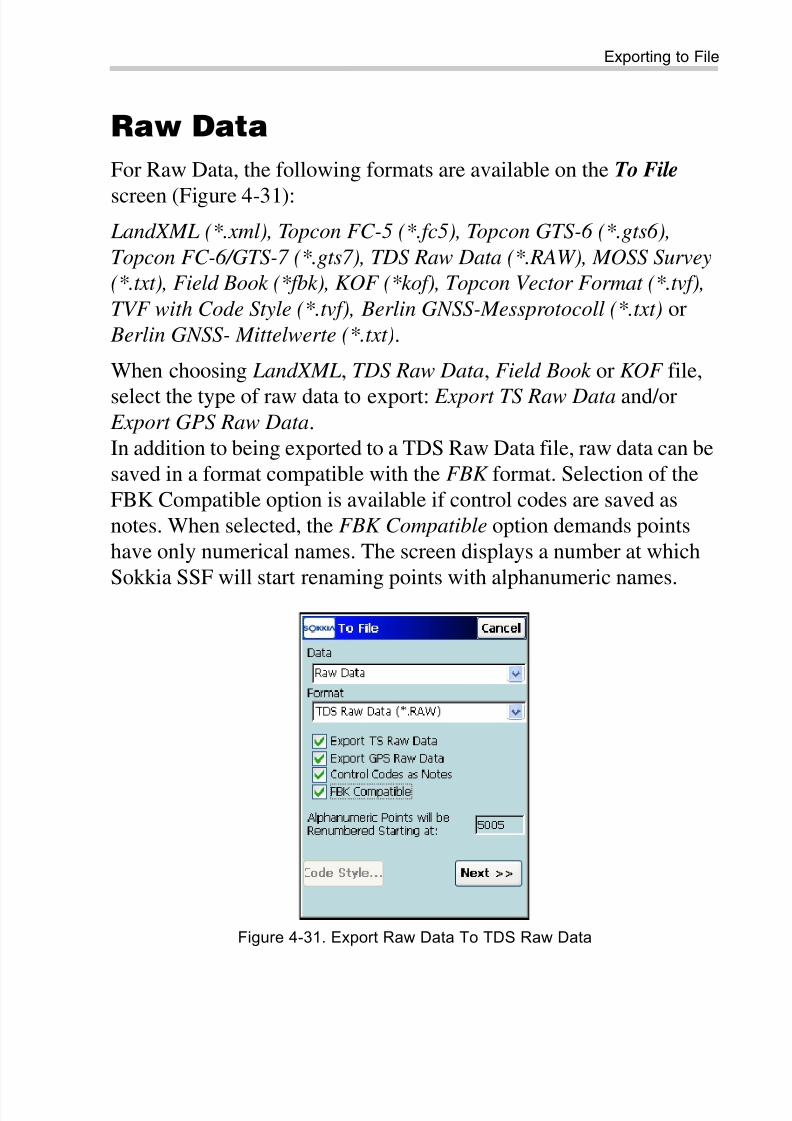
8/10/2019 7010-0944 - SokkiaSSF_rm.pdf
http://slidepdf.com/reader/full/7010-0944-sokkiassfrmpdf 169/623
Exporting to File
P/N 7010-0944 4-27
Raw Data
For Raw Data, the following formats are available on the To File
screen (Figure 4-31):
LandXML (*.xml), Topcon FC-5 (*.fc5), Topcon GTS-6 (*.gts6),
Topcon FC-6/GTS-7 (*.gts7), TDS Raw Data (*.RAW), MOSS Survey
(*.txt), Field Book (*fbk), KOF (*kof), Topcon Vector Format (*.tvf),
TVF with Code Style (*.tvf), Berlin GNSS-Messprotocoll (*.txt) or
Berlin GNSS- Mittelwerte (*.txt).
When choosing LandXML, TDS Raw Data, Field Book or KOF file,
select the type of raw data to export: Export TS Raw Data and/or Export GPS Raw Data.In addition to being exported to a TDS Raw Data file, raw data can besaved in a format compatible with the FBK format. Selection of theFBK Compatible option is available if control codes are saved asnotes. When selected, the FBK Compatible option demands pointshave only numerical names. The screen displays a number at whichSokkia SSF will start renaming points with alphanumeric names.
Figure 4-31. Export Raw Data To TDS Raw Data

8/10/2019 7010-0944 - SokkiaSSF_rm.pdf
http://slidepdf.com/reader/full/7010-0944-sokkiassfrmpdf 170/623
Exporting Data
Sokkia Spectrum Survey Field Reference Manual4-28
Horizontal Alignments
For Horizontal Alignments data, you can export the following
formats: SSS H. Alignment (*.hal), Sokkia SSF H. Alignment (*.thl),CLIP H. Alignment (*.PLT), or ISPOL H. Alignment (*.ALI)
(Figure 4-32) from the Format drop-down list.
Figure 4-32. Horizontal Alignments
• Next – opens the H.Alignments to Exp screen to selectalignments (Figure 4-33).
Figure 4-33. Select Horizontal Al ignments
• Horizontal Alignment(s) – lists the available horizontalalignments in the job.

8/10/2019 7010-0944 - SokkiaSSF_rm.pdf
http://slidepdf.com/reader/full/7010-0944-sokkiassfrmpdf 171/623
Exporting to File
P/N 7010-0944 4-29
• Check – marks the highlighted entries.
• Uncheck – removes the mark from the highlighted alignment.
• Back – returns to the previous screen.
• Next – opens the Select directory screen (Figure 4-34) to selectthe directory to save the file. The file will have the same name ofthe exported alignment .
• OK – opens the Ex port Status screen and starts the exportprocess.
• Cancel – closes the screen without saving the settings.
Figure 4-34. Select Directory
Vertical Alignments
For Vertical Alignments data, you can export the following formats:
SSS V. Alignment (*.val), Sokkia SSF V. Alignment (*.tvl), CLIP V. Alignment (*.ALZ), or ISPOL V. Alignment (*.RAS).
NOTICE
When exporting, Sokkia SSF opens similar screens,to select other objects (vertical alignments, roads,x-section sets or x-sections templates.

8/10/2019 7010-0944 - SokkiaSSF_rm.pdf
http://slidepdf.com/reader/full/7010-0944-sokkiassfrmpdf 172/623
Exporting Data
Sokkia Spectrum Survey Field Reference Manual4-30
X-Section Sets
For X-Section Sets data, you can export the following formats:
SSS Cross Section Set (*.rd), Sokkia SSF Cross Section Set (*.trd),CLIP Cross Section Set (*.TRV), ISPOL Cross Section Set (*.SC1), or Custom X-Sections (*.cxs).
Roads
For Roads data, you can export the following formats: Land XML (*.xml), SSS Road (*.hal; *.val; *.rd), TDS Road (*,rd5),
Topcon 3D Road (*.rd3), Sokkia SSF Road (*.thl; *.tvl; *.trd), CLIP
Road (*.PLT; *.ALZ; *.TRV), ISPOL Road (*.ALI; *.RAS; *.SC1),
Tekla Roads (*.vgp), MX GENIO Road (*.txt), or SBG Road (*.LIN).
In LandXML file, X-Sections are stored as Zones when the Use Zone
elements for x-sections box is check marked (Figure 4-35).
Figure 4-35. Roads to LandXML
In Sokkia SSF or TDS Road format, also select the desired distanceunits (Figure 4-36 on page 4-31).
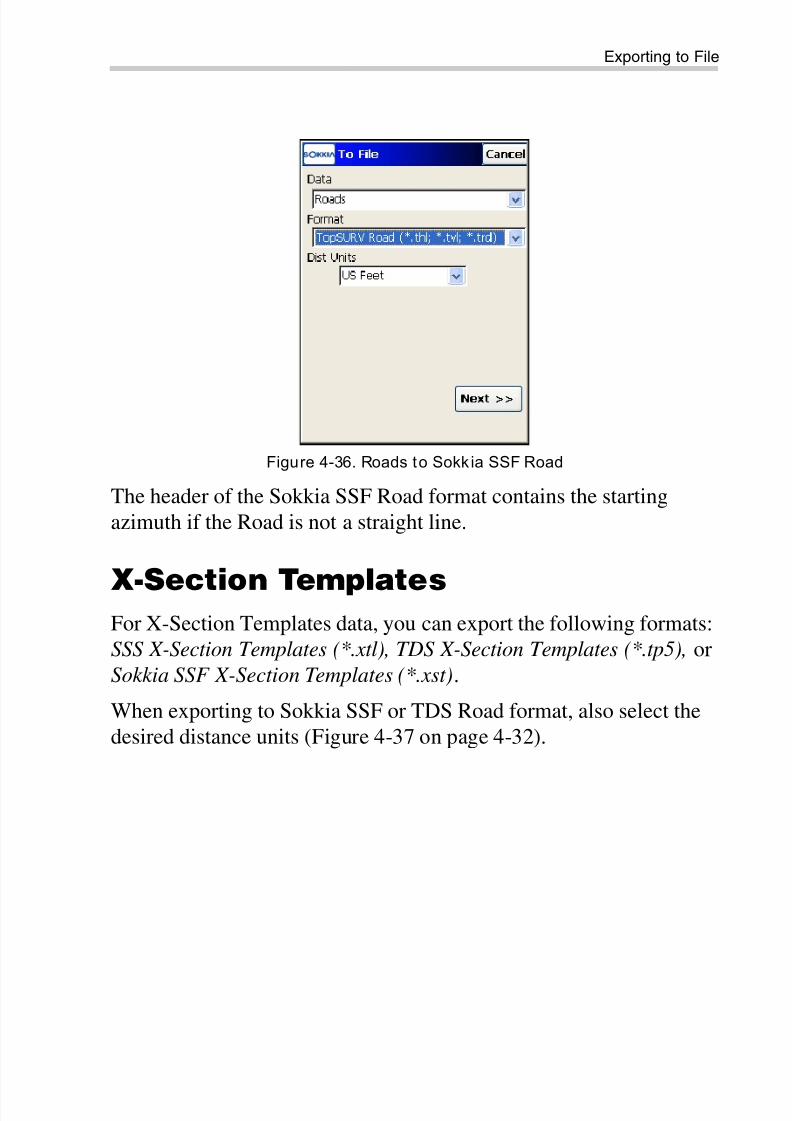
8/10/2019 7010-0944 - SokkiaSSF_rm.pdf
http://slidepdf.com/reader/full/7010-0944-sokkiassfrmpdf 173/623

8/10/2019 7010-0944 - SokkiaSSF_rm.pdf
http://slidepdf.com/reader/full/7010-0944-sokkiassfrmpdf 174/623
Exporting Data
Sokkia Spectrum Survey Field Reference Manual4-32
Figure 4-37. X-Section Templates to Sokkia SSF Templates
Localization
For Localization data, you can export the following formats:
Topcon 3D Localization (*.gc3), and TDS Raw Data (*.RAW).Control Points are exported together with Localization data.
Scanning Data
For Scanning Data, you can export the following formats: allscanning data are exported for DI-3000 Project (*.fsc).
Roads Survey
For Roads Survey data, you can export the following formats: Sokkia
SSF X-Section Survey (*.xss) or Find Chainage/Station Report (*.txt).
Job History
For Job History data, you can export the following formats:
CSV (Comma delimited) (*.csv), and Text report (*.txt).
The Job History file is formed if the Enable Job History box is check
marked on the Global Settings screen (see “Setting GlobalParameters for Job” on page 3-87).

8/10/2019 7010-0944 - SokkiaSSF_rm.pdf
http://slidepdf.com/reader/full/7010-0944-sokkiassfrmpdf 175/623
Exporting to File
P/N 7010-0944 4-33
TINs Data
For TINs data, you can export the following formats: AutoCAD DXF
(*.dxf), AutoCAD Drawing (*.dwg), or LandXML (*.xml).
When exporting to AutoCAD DXF or Drawing file, tap the Settings
button to select desired drawing styles to represent points and lines(for details, see “On the Settings” on page 4-23).
Sokkia SSF stores surfaces in TN3 files (in the DTM directory).Select a desired TN3 file to export in the Select TN3 screen (Figure 4-
38).
Figure 4-38. Select TN3/Select File
• OK – opens the To <Format> screen to select a destination
directory and the name of the created file.
• Cancel – closes the screen without saving the settings.
Layers
For Layers data, you can export the following formats:
Autodesk Layer States (*.las) , Topcon 3D Linework (*.ln3).

8/10/2019 7010-0944 - SokkiaSSF_rm.pdf
http://slidepdf.com/reader/full/7010-0944-sokkiassfrmpdf 176/623
Exporting Data
Sokkia Spectrum Survey Field Reference Manual4-34
Multiple
For Multiple data, you can export the following formats:
Topcon Text Custom (*.txt), AutoCAD DXF (*.dxf), AutoCAD Drawing (*.dwg), ESRI Shape (*.shp), LandXML (*.xml), KOF
(*.kof), Microstation 95/ISFF (*.dgn), MicroStation V8 (*.dgn), SBG
Pxy (*.PXY), or SBG Geo (*.Geo).
Sokkia SSF exports layers to DWG/DXF files, along with theappropriate data types.
The Next button on the To Fil e screen opens the Data Selection screen (Figure 4-39 on page 4-34).
On the Data Selection screen (Figure 4-39 on page 4-34), select aspecific data group in the job available to export to a specified format.
For the LandXML as an example, Points, Lines, Alignments, Codes,Surfaces, X-sections, TS and GPS Raw Objects are available forselection.
Figure 4-39. Export Multip le Data
• Next – depending on the data selected for export, opens differentscreens:
NOTICE
Sokkia SSF only exports AutoCAD 2000 formatDWG files.

8/10/2019 7010-0944 - SokkiaSSF_rm.pdf
http://slidepdf.com/reader/full/7010-0944-sokkiassfrmpdf 177/623
Exporting to File
P/N 7010-0944 4-35
– Points Selection for Points (Figure 4-40 on page 4-35)
– Roads to Export for Alignments (Figure 4-33 on page 4-28
which is similar to this one)– Select TN3 for Surfaces (Figure 4-41 on page 4-36)
– X-Sections to Export for X-Sections (Figure 4-33 onpage 4-28) which is similar to this one)
– To <name of Format> screen (Figure 4-16 on page 4-15).
On the Point Selection screen (Figure 4-40 on page 4-35), select the
filter type to select the exported Points (Figure 4-40).
Figure 4-40. Points Selection

8/10/2019 7010-0944 - SokkiaSSF_rm.pdf
http://slidepdf.com/reader/full/7010-0944-sokkiassfrmpdf 178/623
Exporting Data
Sokkia Spectrum Survey Field Reference Manual4-36
On the Select TN3 screen (Figure 4-41), select a destinationdirectory and the name of the created file.
Figure 4-41. Select TN3
• OK – starts the export process.
• Cancel – closes the screen without saving the settings.

8/10/2019 7010-0944 - SokkiaSSF_rm.pdf
http://slidepdf.com/reader/full/7010-0944-sokkiassfrmpdf 179/623
Exporting GPS Session
P/N 7010-0944 4-37
Exporting GPS Session
To export a session settings to the receiver, tap the GPS Session icon.
In the Sessions screen, the Receivers panel contains a tree of theavailable receivers and their session plans. The Active Sessions panelcontains a list of sessions to export (Figure 4-42).
Figure 4-42. Job Sessions
• – selects the highlighted session to export.
• – deletes the session from the export list.
• Goto sleep mode – puts the receiver into sleep mode (if the box is
check marked).
• Refresh – refreshes the export list.
• Export – starts the connection with the receiver.
• Close – closes the screen without performing export.
The Help Icon in the upper left corner of the screen opens the pop-up
menu that consists of two items:
• Edit Session – opens the Sessions screen to edit the sessions. Fordetails see “Sessions” on page 6-45.
• Help – accesses the Help files.

8/10/2019 7010-0944 - SokkiaSSF_rm.pdf
http://slidepdf.com/reader/full/7010-0944-sokkiassfrmpdf 180/623
Exporting Data
Sokkia Spectrum Survey Field Reference Manual
Notes:
4-38

8/10/2019 7010-0944 - SokkiaSSF_rm.pdf
http://slidepdf.com/reader/full/7010-0944-sokkiassfrmpdf 181/623
P/N 7010-0944
Chapter 5
5-1
Importing DataTo import data, tap the Import icon.
The Import function is used to add points, codes and attributes, CodeLibraries, Roads, Cross Section Templates, Point Lists andLocalization from another job, controller, or file.
The Import menu (Figure 5-1) includes options to:
1. Import data from a job (From Job)
2. Import data from another controller (From Device)
3. Import data from a file (From File)
Figure 5-1. Import Menu
The Help Icon opens a pop-up menu, giving access to help files,
module activation codes, port data logging, changing menu interface,and information about the Sokkia SSF used (for detail see “Help
Icon’s Pop-up Menu” on page 1-9).

8/10/2019 7010-0944 - SokkiaSSF_rm.pdf
http://slidepdf.com/reader/full/7010-0944-sokkiassfrmpdf 182/623
Importing Data
Sokkia Spectrum Survey Field Reference Manual5-2
Importing From Job
To import data from a job, tap the From Job icon. The Select Job
screen (Figure 5-2) displays.
Select a Job
The Select Job screen (Figure 5-2) selects the job for import througha wizard-based import process. The wizard guides you through the
import process by tapping the Next button. At the final stage, press
the Finish button to complete the process.• Current Job – shows the name of the job selected from the job
list.
• Created – shows the date the selected job was created.
• Modified – shows the last date the selected job was modified.
• – displays the directory where the job file is stored in the
controller.
• Browse – opens the browse screen for choosing the job file fromfiles previously downloaded to the controller.
• Select – selects the job file highlighted in the job list.
• Close – returns to the previous screen without changes beingmade.
Figure 5-2. Select Job

8/10/2019 7010-0944 - SokkiaSSF_rm.pdf
http://slidepdf.com/reader/full/7010-0944-sokkiassfrmpdf 183/623
Importing From Job
P/N 7010-0944 5-3
Import From the Job
On the From <name of Job> screen, select the data to import and, if
necessary, filter the imported points (see Figure 5-3).
• Points – select the points to import from the drop-down list; either
All Points, By Type, By Range and Code, By Type, Range and Code, or None.
• Check mark the data to be imported along with the points; eitherCode Library, Localizaiton, Point Lists, Horizontal Alignments,
Vertical Alignments, X-Section Sets, or Roads.
• Back – returns to the previous screen.
• Next – becomes available, depending on the data selection andopens the screens:
– Point Type(s) To Import if the points are filtered By Type (seeFigure 5-4 on page 5-4)
– Points To Import if the points are filtered By Range and Code
(see Figure 5-5 on page 5-6)
– Point List(s) (or Horizontal Alignments, Vertical
Alignments, X-Section Sets, Roads) To Import if thecorresponding data are check marked in the From Job screen
Figure 5-3. Impor t From Job

8/10/2019 7010-0944 - SokkiaSSF_rm.pdf
http://slidepdf.com/reader/full/7010-0944-sokkiassfrmpdf 184/623
Importing Data
Sokkia Spectrum Survey Field Reference Manual5-4
• Finish – starts the import process if only Code Library and/or
Localization items are selected and All Points is selected.Otherwise, the option becomes available after all data are selected
by the Next button.
• Cancel – closes the screen without saving the settings.
Select Point Types To Import
On the Pt Type(s) To Import (Figure 5-4), select the types of points to
be imported; only if the Code Library, Localization, or Roads box ischeck marked and if the points filter by type has been enabled in the Import From Default screen. Place a check mark next to the point
type that you want (Figure 5-3 on page 5-3).
• Point Types – check mark the point types for import; either Design Points, Control Points, Cogo Points, Base Station, Topo
Points, Offset Topo Points, Auto Topo Points, Sideshot, Offset,
Remote, Reflectorless, BackSight, Stake Points, Stake Line, Check
Points, Manually Typed, or Tape Dimension.
• Check / Uncheck – toggles the highlighted item(s) on or off,
depending on the button being pressed. To select more than oneitem, press Ctrl while making a selection.
Figure 5-4. Select Point Type(s) to Import

8/10/2019 7010-0944 - SokkiaSSF_rm.pdf
http://slidepdf.com/reader/full/7010-0944-sokkiassfrmpdf 185/623
Importing From Job
P/N 7010-0944 5-5
• Back – returns to the previous screen.
• Next – if available opens the next screen to select objects; once
the button becomes grayed out, tap Finish.• Finish – opens the Import Status screen and starts the export
process.
• Cancel – closes the screen without saving the settings.
Select Points to Import
The Points to Import screen filters imported points (Figure 5-5 on
page 5-6).
• Filter by Codes – if enabled, all points with the selected codes are
imported.
• Select – opens the Code screen (see Figure 5-6 on page 5-7) for
code selection.
• Filter by Range – select the points to import. These can be set by
range (“-”, “;” or “,” can be used as a range separator) or byenumeration.
– Name Separator : selects a delimiter to use for point names.
– Use ‘-’ for Range Separator : shows the delimiter being usedas a range separator.
• Back – returns to the previous screen.
• Finish – opens the Import Status screen and starts the importprocess.
• Cancel – closes the screen without saving the settings.

8/10/2019 7010-0944 - SokkiaSSF_rm.pdf
http://slidepdf.com/reader/full/7010-0944-sokkiassfrmpdf 186/623
Importing Data
Sokkia Spectrum Survey Field Reference Manual5-6
Figure 5-5. Points to Import
• Next – if available, opens the next screen to select objects; oncethe button becomes grayed out, tap the Finish button to start theexport process.
Code
The Code screen contains a list of available codes. All points withcodes selected here are imported (Figure 5-6 on page 5-7).
• Uncheck – deselects the highlighted code.
• Check – check marks the highlighted entries.
• Select and OK – returns to the Points to Import screen with theselected codes.
• Cancel – closes the screen without saving the settings.
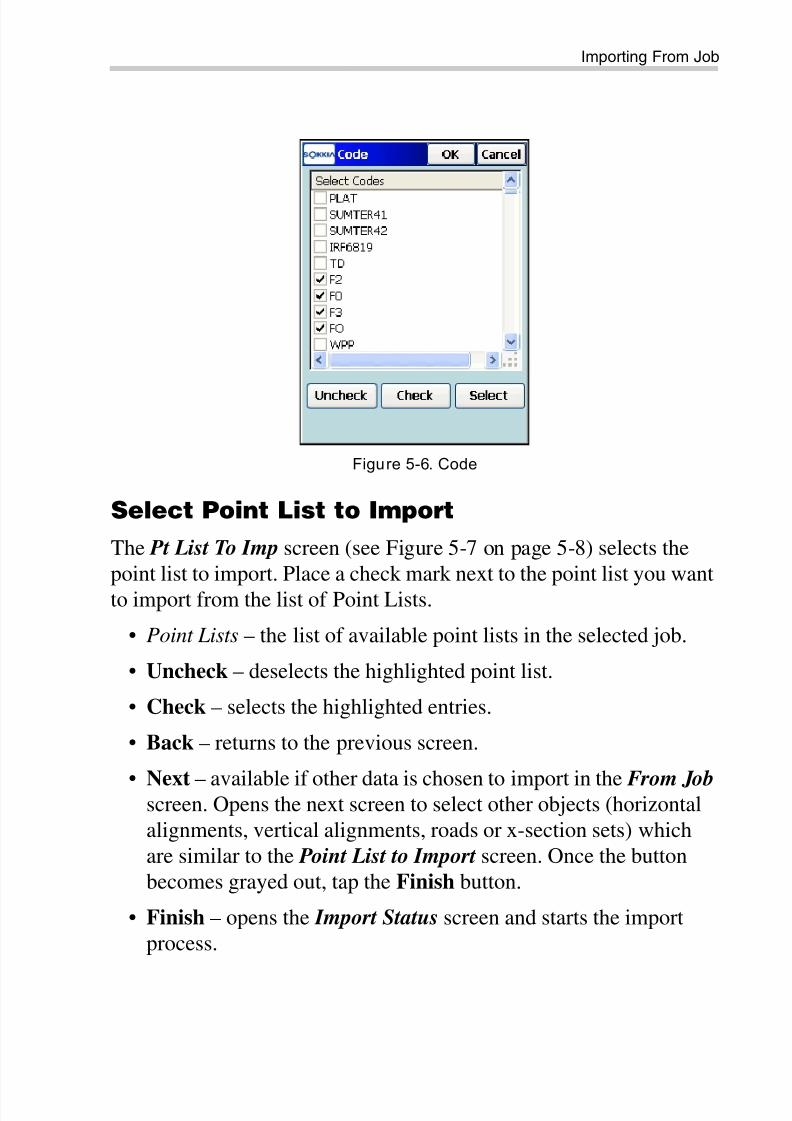
8/10/2019 7010-0944 - SokkiaSSF_rm.pdf
http://slidepdf.com/reader/full/7010-0944-sokkiassfrmpdf 187/623

8/10/2019 7010-0944 - SokkiaSSF_rm.pdf
http://slidepdf.com/reader/full/7010-0944-sokkiassfrmpdf 188/623

8/10/2019 7010-0944 - SokkiaSSF_rm.pdf
http://slidepdf.com/reader/full/7010-0944-sokkiassfrmpdf 189/623
Importing From Job
P/N 7010-0944 5-9
Duplicate Objects
If the existing job contains objects with the same names as the job
they are imported from, the Duplicate <Objects> screen displays(Figure 5-9).
Figure 5-9. Dupl icate <Objects>
The Duplicate Objects screen issues a warning that prevents the lossof points, roads, or point lists when names of these imported objectscoincide with existing ones. Select from the following options:
• Overwrite – the imported object overwrites the existing one.
• Rename – the imported object is renamed. The new name shouldbe noted in the corresponding field.
• Prefix/Suffix – the imported object differs from the existing objectby prefix or suffix. The prefix/suffix should be noted in thecorresponding field.
• Yes – accepts the decision.
• Yes To All – accepts the same decision for all similar cases.
• Skip – skips the object without importing.
• Skip All – skips all the objects with names that coincide with thenames of existing objects, without importing.
• Close – disables the import process and opens the Import Status screen to remove all the objects already imported (Figure 5-10).

8/10/2019 7010-0944 - SokkiaSSF_rm.pdf
http://slidepdf.com/reader/full/7010-0944-sokkiassfrmpdf 190/623
Importing Data
Sokkia Spectrum Survey Field Reference Manual5-10
Figure 5-10. Import Status for Removed Objects
Importing From Device
To import a job (or any other file) from a controller device, tap theFrom Device icon (Figure 5-11 on page 5-11).
NOTICE
The import process cannot skip duplicate templates.These objects must be renamed.

8/10/2019 7010-0944 - SokkiaSSF_rm.pdf
http://slidepdf.com/reader/full/7010-0944-sokkiassfrmpdf 191/623
Importing From Device
P/N 7010-0944 5-11
Selecting Port
The Settings screen (Figure 5-11), selects the port for file interchange
with another controller.
Figure 5-11. Select Port
• Com Port – select the Communication port; either COM1, COM2, IR Port , or Ethernet . Communication via Bluetooth is also
available.
• Next – opens the Select Directory screen (Figure 5-12 on
page 5-12).

8/10/2019 7010-0944 - SokkiaSSF_rm.pdf
http://slidepdf.com/reader/full/7010-0944-sokkiassfrmpdf 192/623
Importing Data
Sokkia Spectrum Survey Field Reference Manual5-12
File Import Directory
On the Select Directory screen (Figure 5-12), select the destination
directory for data import.
Figure 5-12. Select Directory
• OK – opens the Import File screen reflecting import status to theselected directory (Figure 5-13)
• Cancel – returns to the main screen.
Figure 5-13. Import File
A successful completion of the import file operation returns to themain screen.

8/10/2019 7010-0944 - SokkiaSSF_rm.pdf
http://slidepdf.com/reader/full/7010-0944-sokkiassfrmpdf 193/623
Importing From a File
P/N 7010-0944 5-13
Importing From a File
To import data from a file, tap the From File icon (Figure 5-14).
On the From File screen (Figure 5-14) you can import points, roads,cross section templates, and localization from files of either pre-defined or custom formats. For a description of these formats, seeAppendix A.
Figure 5-14. Impor t From File
• Data – select the data type to import from the file; either Points, Lines, Point Lists, Code Library, Horizontal Alignments, Vertical
Alignments, X-Section Sets, Roads, X-Sect Templates,
Localization, Scanning Data, TINs, Layers, or Multiple.
• Format – select the type of file being imported.
• Next – opens the From < name of Format> screen to navigate tothe directory where the file is located.
• Cancel – closes the screen without saving the settings.
Follow up the export process with the help of the export wizard.

8/10/2019 7010-0944 - SokkiaSSF_rm.pdf
http://slidepdf.com/reader/full/7010-0944-sokkiassfrmpdf 194/623
Importing Data
Sokkia Spectrum Survey Field Reference Manual5-14
Points and Point Lists
On the From File screen (Figure 5-15) for Points and Point Lists data,
you can import the following formats: Topcon Text Custom (*.txt),Topcon FC-4 (*.fc4), Topcon FC-5 (*.fc5), Topcon GTS-6 (*.gts6),
Topcon FC-6/GTS-7 (*.pnt), Topcon GTS-7 with strings (*.txt),
Topcon GT (*.pnt), Topcon GT Finland (*.gt), MOSS GENIO
(*.mgn), AutoCAD DXF (*.dxf), AutoCAD Drawing (*.dwg), ESRI
Shape (*.shp), TDS Coordinates (*.cr5), LandXML (*.xml), NEZ
(*.txt), NEZ with strings (*.txt), CMM (*.cor), MMH360 (*.360),
KOF (*.kof), MMH360_Z000 (*.360), Microstation 95/ISFF (*.dgn),
MicroStation V8 (*.dgn), SBG Pxy (*.PXY) or SBG Geo (*.Geo)
For Points or Point Lists data, the From File screen has an additional
option – Point Type.
• Point Type – selects a type of the imported points from the drop-
down list.
– Design Points: points used as targets for stakeout.
– Control Points: points with coordinates, known from thecatalog; used for localization.
– Topo Points: points collected during a stationary survey.
– Auto Topo Points: points collected during a kinematic survey.
Figure 5-15. Impor t From File
• Next – opens the From < name of Format> screen.

8/10/2019 7010-0944 - SokkiaSSF_rm.pdf
http://slidepdf.com/reader/full/7010-0944-sokkiassfrmpdf 195/623

8/10/2019 7010-0944 - SokkiaSSF_rm.pdf
http://slidepdf.com/reader/full/7010-0944-sokkiassfrmpdf 196/623
Importing Data
Sokkia Spectrum Survey Field Reference Manual5-16
• OK – approves the selection and opens the Text File Format
screen.
• Cancel – closes the screen without saving the settings.
Figure 5-17. Impor t From Format
The Text File Format screen (Figure 5-18 on page 5-17) imports afile of arbitrary text format.
• Delimiter – sets the separator symbol between data in the importfile; either a space, a comma, tabs or other (select from the list).
• Header in First Row – enable if the text file has a header.
• File Style – sets the order of fields in the selected file.
• Delete – deletes the selected file format.• Edit (Format) – changes the selected file format with the help of
the same Custom Style screen (see Figure 5-19 on page 5-17).
• Add (Format) – creates a new file format with the help of theCustom Style screen.
• Back – returns to the previous screen.
• Next – opens the Coordinate System screen (see Figure 5-20 onpage 5-18).
• Finish – opens the Import Status screen and starts the importprocess (see “Import Status” on page 5-8).
• Cancel – closes the screen without saving the settings.

8/10/2019 7010-0944 - SokkiaSSF_rm.pdf
http://slidepdf.com/reader/full/7010-0944-sokkiassfrmpdf 197/623

8/10/2019 7010-0944 - SokkiaSSF_rm.pdf
http://slidepdf.com/reader/full/7010-0944-sokkiassfrmpdf 198/623
Importing Data
Sokkia Spectrum Survey Field Reference Manual5-18
On the Coord System screen (Figure 5-20) select the coordinate
system, the coordinate type and distance units for the data in the fileimported.
• Coordinate Type – select either WGS84, Datum, Grid, or Ground .
• Dist Units – recalculate to either Meters, IFeet , or USFeet .
Figure 5-20. Coordinate System
• Back – returns to the previous screen.
• Next – opens the Lat/Lon Record Format screen if a type ofgeodetic coordinate is selected (Figure 5-21 on page 5-19).
• Finish – opens the Import Status screen and starts the import
process. See “Import Status” on page 5-8.
• Cancel – closes the screen without saving the settings.
On the Latitude/Longitude Record Format screen (Figure 5-21 on
page 5-19), select the format you want to represent the degrees ofLatitude and Longitude in the exported file from the drop-down list.
• Back – returns to the previous screen.
• Finish – opens the Import Status screen and starts the Exportprocess (Figure 5-21 on page 5-19).
• Cancel – closes the screen without saving the settings.

8/10/2019 7010-0944 - SokkiaSSF_rm.pdf
http://slidepdf.com/reader/full/7010-0944-sokkiassfrmpdf 199/623

8/10/2019 7010-0944 - SokkiaSSF_rm.pdf
http://slidepdf.com/reader/full/7010-0944-sokkiassfrmpdf 200/623
Importing Data
Sokkia Spectrum Survey Field Reference Manual5-20
Figure 5-22. AutoCAD DXF
• Settings – opens the Settings screen to select point and linestyles.
• Next – with the help of the import wizard, follow next screens to
import points.
• Cancel – closes the screen without saving the settings.
Sokkia SSF imports layers from DWG/DXF files, along with the
appropriate data types.
On the Settings screen (Figure 5-23 on page 5-21), select desireddrawing styles to represent points and lines.
• Import block base points – enable to import central points in
blocks as points.
• Load as background image – enable to load data as background.
NOTICE
Sokkia SSF only imports AutoCAD 2000 formatDWG files.

8/10/2019 7010-0944 - SokkiaSSF_rm.pdf
http://slidepdf.com/reader/full/7010-0944-sokkiassfrmpdf 201/623

8/10/2019 7010-0944 - SokkiaSSF_rm.pdf
http://slidepdf.com/reader/full/7010-0944-sokkiassfrmpdf 202/623
Importing Data
Sokkia Spectrum Survey Field Reference Manual5-22
• Cancel – closes the screen without saving the settings.
LinesFor Lines data, you can import the following formats:
Topcon Text Custom (*.txt), AutoCAD DXF (*.dxf), AutoCAD
Drawing (*.dwg), ESRI Shape (*.shp), LandXML (*.xml), KOF
(*.kof), Topcon 3D Linework (*.ln3), Microstation 95/ISFF (*.dgn),
MicroStation V8 (*.dgn), MX GENIO (*.txt), SBG Pxy (*.PXY) or SBG Geo (*.Geo).
On the Edit Line screen (Figure 5-25), Sokkia SSF linework consistsof lines and points, whereas the imported linework contains no points.
It includes positions only (names start with a question mark).
Figure 5-25. Edit Imported Linework
Code Library
For Code Library data, you can import the following formats: Topcon
Text (*.tdd), Topcon XML (*.xml), or DBF (*.dbf).Code Library is a set of codes with attributes used in the job. Once
created, it can be saved as a file with *.tdd, *.xml, or *.dbf extensions.

8/10/2019 7010-0944 - SokkiaSSF_rm.pdf
http://slidepdf.com/reader/full/7010-0944-sokkiassfrmpdf 203/623

8/10/2019 7010-0944 - SokkiaSSF_rm.pdf
http://slidepdf.com/reader/full/7010-0944-sokkiassfrmpdf 204/623
Importing Data
Sokkia Spectrum Survey Field Reference Manual5-24
Figure 5-26. Roads from Sokkia SSF Road
The header of the Sokkia SSF Road format contains the startingazimuth if the Road is not a straight line.
X-Section TemplatesFor X-Section Templates data (Figure 5-27 on page 5-25), you can
import the following formats: SSS X-Section Templates (*.xtl), TDS
X-Section Templates (*.tp5), or Sokkia SSF X-Section Templates
(*.xst).
When importing from Sokkia SSF or TDS Road format, select thedesired distance units.
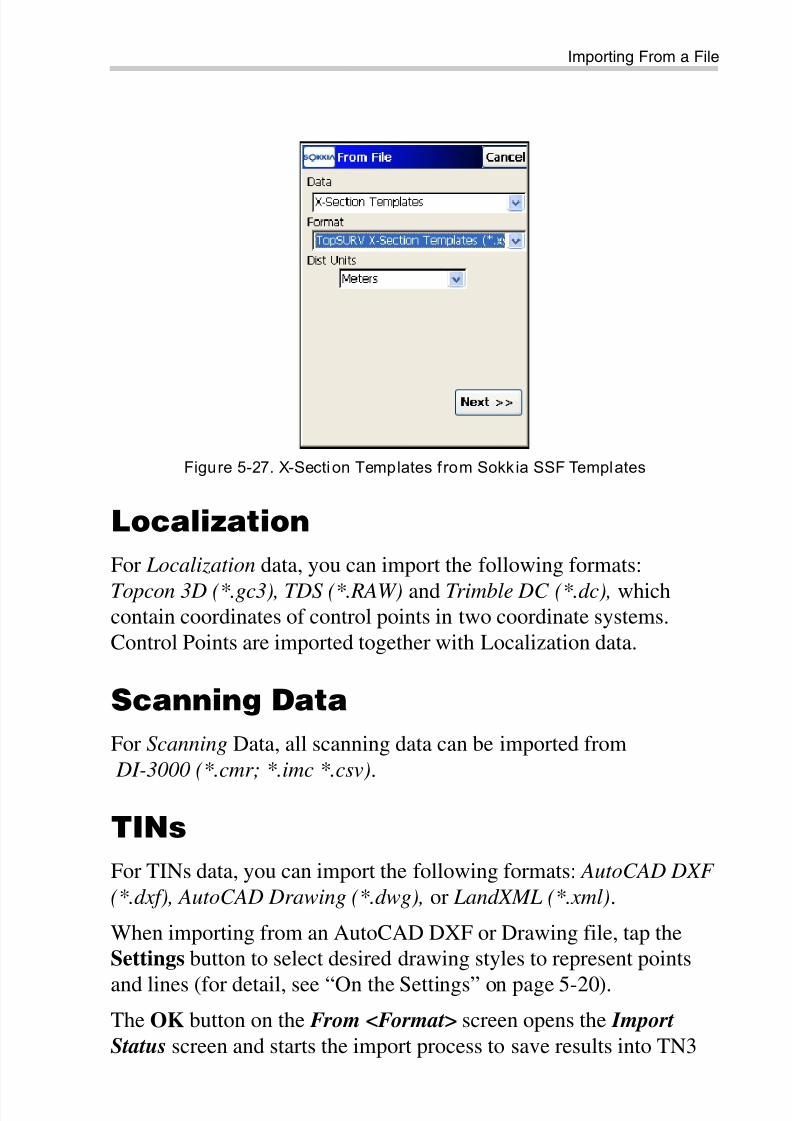
8/10/2019 7010-0944 - SokkiaSSF_rm.pdf
http://slidepdf.com/reader/full/7010-0944-sokkiassfrmpdf 205/623
Importing From a File
P/N 7010-0944 5-25
Figure 5-27. X-Section Templates from Sokk ia SSF Templates
Localization
For Localization data, you can import the following formats:
Topcon 3D (*.gc3), TDS (*.RAW) and Trimble DC (*.dc), whichcontain coordinates of control points in two coordinate systems.Control Points are imported together with Localization data.
Scanning Data
For Scanning Data, all scanning data can be imported from
DI-3000 (*.cmr; *.imc *.csv).
TINs
For TINs data, you can import the following formats: AutoCAD DXF
(*.dxf), AutoCAD Drawing (*.dwg), or LandXML (*.xml).
When importing from an AutoCAD DXF or Drawing file, tap theSettings button to select desired drawing styles to represent points
and lines (for detail, see “On the Settings” on page 5-20).
The OK button on the From <Format> screen opens the Import
Status screen and starts the import process to save results into TN3

8/10/2019 7010-0944 - SokkiaSSF_rm.pdf
http://slidepdf.com/reader/full/7010-0944-sokkiassfrmpdf 206/623
Importing Data
Sokkia Spectrum Survey Field Reference Manual5-26
files. The TN3 files will have the same name of the file imported, and
will be saved in the DTM directory.
Layers
For Layers data, you can import the following formats: Autodesk Layer States (*.las) , Topcon 3D Linework (*.ln3).
Multiple Data
For Multiple data, you can import the following formats:Topcon Text Custom (*.txt), AutoCAD DXF (*.dxf), AutoCAD
Drawing (*.dwg), ESRI Shape (*.shp), LandXML (*.xml), KOF
(*.kof), Microstation 95/ISFF (*.dgn), MicroStation V8 (*.dgn), SBG
Pxy (*.PXY), or SBG Geo (*.Geo).
Sokkia SSF imports layers to DWG/DXF files, along with theappropriate data types.
For Land XML file as an example, select the file from which youwant to import data on the From <Format> screen and tap the OK
button.
The Import Status screen first opens to retrieve information on thefile contents (Figure 5-28 on page 5-27).
NOTICE
Sokkia SSF only imports AutoCAD 2000 format
DWG files.

8/10/2019 7010-0944 - SokkiaSSF_rm.pdf
http://slidepdf.com/reader/full/7010-0944-sokkiassfrmpdf 207/623
Importing From a File
P/N 7010-0944 5-27
Figure 5-28. Import Preparation
The Data Selection screen displays to select desired data types(Figure 5-29).
On the Data selection screen (Figure 5-29), select the specific datagroup from the file to be imported. For LandXML as an example, you
can select Point Lists, Lines, Alignments, Codes, Surfaces, X-Sections and Parcels.
Figure 5-29. Data Select ion
• Next – if available opens the Select Data For Import screen
(Figure 5-30 on page 5-28).
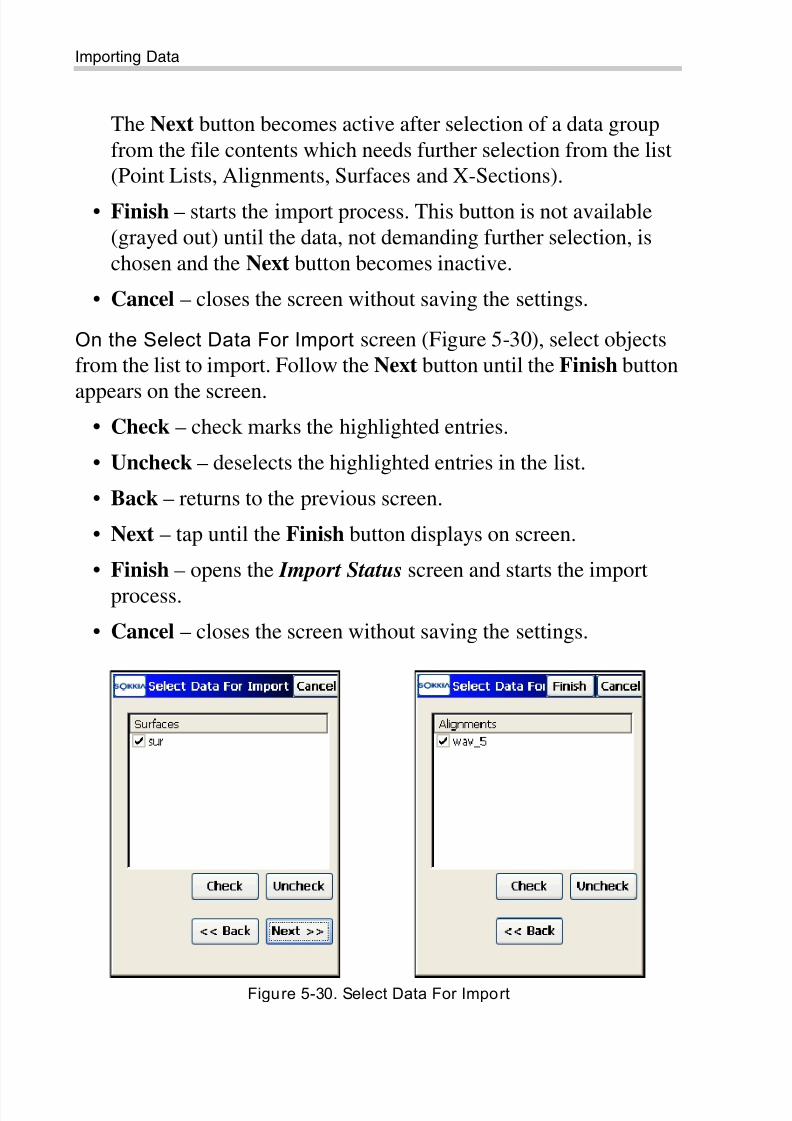
8/10/2019 7010-0944 - SokkiaSSF_rm.pdf
http://slidepdf.com/reader/full/7010-0944-sokkiassfrmpdf 208/623
Importing Data
Sokkia Spectrum Survey Field Reference Manual5-28
The Next button becomes active after selection of a data group
from the file contents which needs further selection from the list(Point Lists, Alignments, Surfaces and X-Sections).
• Finish – starts the import process. This button is not available(grayed out) until the data, not demanding further selection, is
chosen and the Next button becomes inactive.
• Cancel – closes the screen without saving the settings.
On the Select Data For Import screen (Figure 5-30), select objectsfrom the list to import. Follow the Next button until the Finish button
appears on the screen.• Check – check marks the highlighted entries.
• Uncheck – deselects the highlighted entries in the list.
• Back – returns to the previous screen.
• Next – tap until the Finish button displays on screen.
• Finish – opens the Import Status screen and starts the import
process.
• Cancel – closes the screen without saving the settings.
Figure 5-30. Select Data For Import

8/10/2019 7010-0944 - SokkiaSSF_rm.pdf
http://slidepdf.com/reader/full/7010-0944-sokkiassfrmpdf 209/623
P/N 7010-0944
Chapter 6
6-1
Editing Job DataTo edit data in a job, tap the Edit Job icon in the main menu.
The Edit Job menu (Figure 6-1) includes options to edit thefollowing data in the current job: Points, Codes, Layers, Linework,Area, Point Lists, Raw Data, Sessions (for GPS+ post processingmodes only), and Images. Also, you can Set Simulator in GPS mode.
Figure 6-1. Edit Job
The Help Icon opens a pop-up menu, giving access to the help
files, module activation codes, port data logging, changing menu
TIP
If the menu option you need is not visible, tap theConfigure / Menus icons to enable these options inthe Config Menus screen.
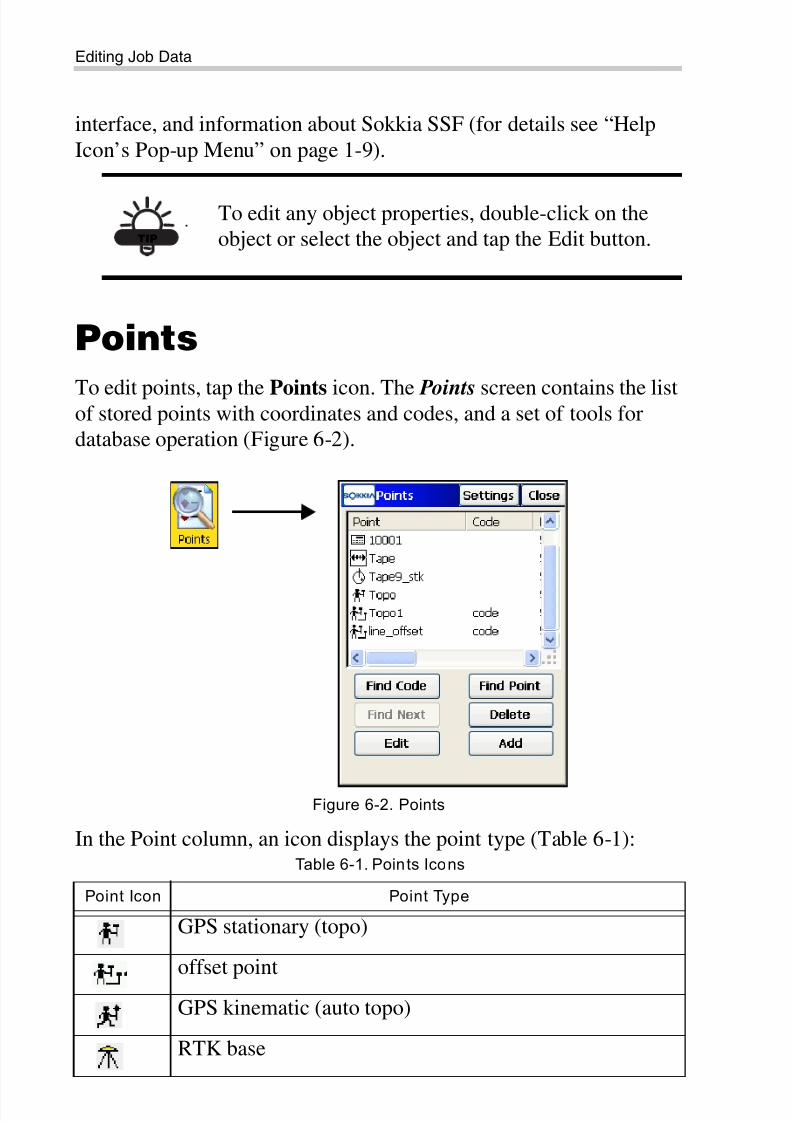
8/10/2019 7010-0944 - SokkiaSSF_rm.pdf
http://slidepdf.com/reader/full/7010-0944-sokkiassfrmpdf 210/623
Editing Job Data
Sokkia Spectrum Survey Field Reference Manual6-2
interface, and information about Sokkia SSF (for details see “Help
Icon’s Pop-up Menu” on page 1-9).
Points
To edit points, tap the Points icon. The Points screen contains the listof stored points with coordinates and codes, and a set of tools fordatabase operation (Figure 6-2).
Figure 6-2. Points
In the Point column, an icon displays the point type (Table 6-1):
TIP
To edit any object properties, double-click on theobject or select the object and tap the Edit button.
Table 6-1. Points Icons
Point Icon Point Type
GPS stationary (topo)
offset point
GPS kinematic (auto topo)
RTK base

8/10/2019 7010-0944 - SokkiaSSF_rm.pdf
http://slidepdf.com/reader/full/7010-0944-sokkiassfrmpdf 211/623
Points
P/N 7010-0944 6-3
• Find Code – opens the Find by Code screen to enter a code for
searching for a point.
• Find Point – opens the Find by Point screen to enter a point
name (or a part of the name) to perform a search.
• Find Next – finds next point that satisfies the same conditions asthe previously found point.
• Delete – deletes the point from the list.
• Edit – opens the Edit Point screen to edit the point parameters:name, code, coordinates and/or other parameters stored with thepoint.
• Add – opens the Add Point screen to create a new point.The Help Icon in the upper-left corner of the screen displays the pop-up menu containing five items:
• PTL Mode – switches on the PTL (Point-To-Line) Mode. (Thescreen changes its appearance on PTL Points). For details, see“PTL Point” on page 6-12.
• String – switches on the strings displaying function, along withthe codes.
• Show Scan Points – switches on the scan points displayingfunction.
TS observed
control
design or imported
staked out
TS scanned point
cogo
manually entered
Table 6-1. Points Icons (Continued)
Point Icon Point Type

8/10/2019 7010-0944 - SokkiaSSF_rm.pdf
http://slidepdf.com/reader/full/7010-0944-sokkiassfrmpdf 212/623

8/10/2019 7010-0944 - SokkiaSSF_rm.pdf
http://slidepdf.com/reader/full/7010-0944-sokkiassfrmpdf 213/623
Points
P/N 7010-0944 6-5
• Match partial name – set if a part of the searched name was
entered in the Point field.
Figure 6-4. Find by Point Name
• Search – starts the search process and returns to the Points screen, highlighting the point found.
Finding Point by Code
The Find by Code screen (Figure 6-5) searches for point informationby its code.
Figure 6-5. Find by Code
• Code – select a code from the drop-down list.
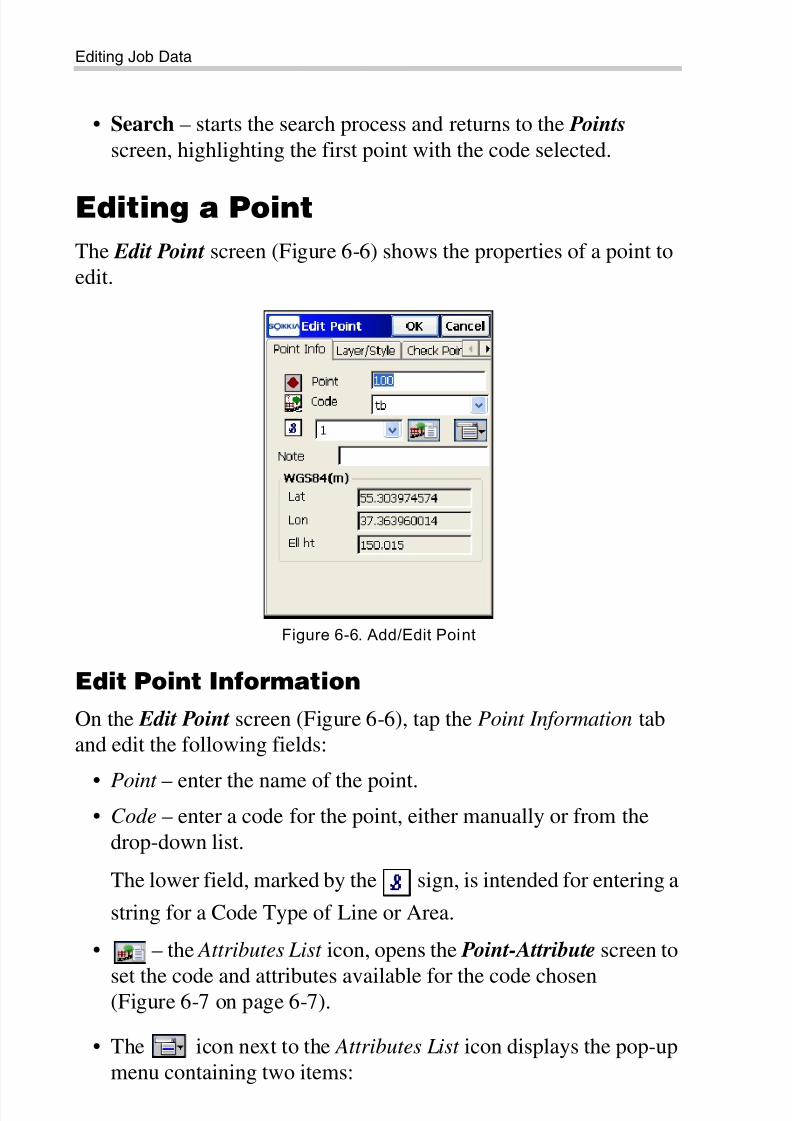
8/10/2019 7010-0944 - SokkiaSSF_rm.pdf
http://slidepdf.com/reader/full/7010-0944-sokkiassfrmpdf 214/623
Editing Job Data
Sokkia Spectrum Survey Field Reference Manual6-6
• Search – starts the search process and returns to the Points
screen, highlighting the first point with the code selected.
Editing a Point
The Edit Point screen (Figure 6-6) shows the properties of a point toedit.
Figure 6-6. Add/Edit Point
Edit Point Information
On the Edit Point screen (Figure 6-6), tap the Point Information taband edit the following fields:
• Point – enter the name of the point.• Code – enter a code for the point, either manually or from the
drop-down list.
The lower field, marked by the sign, is intended for entering a
string for a Code Type of Line or Area.
• – the Attributes List icon, opens the Point-Attribute screen to
set the code and attributes available for the code chosen(Figure 6-7 on page 6-7).
• The icon next to the Attributes List icon displays the pop-upmenu containing two items:

8/10/2019 7010-0944 - SokkiaSSF_rm.pdf
http://slidepdf.com/reader/full/7010-0944-sokkiassfrmpdf 215/623
Points
P/N 7010-0944 6-7
– Layer : opens the Select Layer screen (see “On the Select
Layer” on page 6-10).
– Note: opens the Note screen. For details, see “The TopoMenu” on page 9-3.
• WGS84 – the field for the coordinates of the point in the currentcoordinate system (the field name changes with the coordinate
type selection).
• Note – enter any additional information about the point (ifpreferred).
• OK – saves the changes and returns to the Points screen.Points that have no codes, or have codes, but no strings associatedwith the codes, are simply stored as points.
On the Point Attributes screen (Figure 6-7), you can set a code,control code, string and attributes’ values for the point on the Code Attributes tab.
Figure 6-7. Point Attributes
• Code – select a code. By default, the lower panel shows the
control code list available for a Code Type of Line or Area.
The Control Code is a special type of code that is used by thegraphic tool for the interpretation of survey results.

8/10/2019 7010-0944 - SokkiaSSF_rm.pdf
http://slidepdf.com/reader/full/7010-0944-sokkiassfrmpdf 216/623
Editing Job Data
Sokkia Spectrum Survey Field Reference Manual6-8
The supported control codes ( AS, AE, C, R) control line behavior
when creating arcs, closure of lines, and rectangles respectively. The AS control code indicates the start of an arc, and the AE control code
indicates the end of the arc. Arc parameters are determined usingadditional points in the line.
Sokkia SSF will not use this linework package if the Allow Custom
Control Code box on the Global screen is check marked. In this case,
the user can enter any string to mark it as a control code. Sokkia SSFwill not interpret these control codes.
• The field, marked by the sign is intended for entering a stringto generate a line for a Code Type of Line or Area. Code Type isset when editing the code.
• The lower panel shows the available attributes. Tap on the
attribute to display a field to enter its value.
• Properties – opens the Attrib Ranges screen (Figure 6-8 onpage 6-9) to view the ranges for the attributes.
• Repeat – erases the entered values.
• Default – sets default values.
• Multiple Codes – opens the Point Attributes screen withmultiple codes to edit (Figure 6-9 on page 6-9).
• OK – saves the changes and returns to the Edit (Add) Point screen. The program displays a message prompt if the attribute
value is not within the range specified.The Help icon in the upper-left corner of the screen displays the pop-up menu containing three items:
– Show Second Control Code: switches on the field to enteranother control code.
– Help: accesses the Help files
On the Attribute Ranges screen (Figure 6-8 on page 6-9), you canview the ranges for the attributes.

8/10/2019 7010-0944 - SokkiaSSF_rm.pdf
http://slidepdf.com/reader/full/7010-0944-sokkiassfrmpdf 217/623
Points
P/N 7010-0944 6-9
Figure 6-8. Attribute Range
Attributes can only be added on the Code-Attributes screen(Figure 6-18 on page 6-16).
On the Point Attributes, screen (Figure 6-9), tap the Multi-Code
Attrs tab. You can edit multiple codes and strings. Multiple codes andstrings associated with a point make the point a part of numerouslines.
Figure 6-9. Multiple Code-Attributes
• Delete – deletes the code from the list.

8/10/2019 7010-0944 - SokkiaSSF_rm.pdf
http://slidepdf.com/reader/full/7010-0944-sokkiassfrmpdf 218/623
Editing Job Data
Sokkia Spectrum Survey Field Reference Manual6-10
• Edit – opens the Codes-Attributes screen to edit the selected
code.
• Add – creates a new code through the Code-Attributes screen.• OK – saves the settings and returns to the Edit Point screen.
• Cancel – closes the screen without saving the settings.
On the Select Layer screen (Figure 6-10), select the layer in whichto locate the point.
Figure 6-10. Select Layer
• The List button opens the Layers screen to edit layers. (For
details on editing layers, see “Edit Layers” on page 6-23.)
• OK – saves the settings and returns to the Edit Point screen.
• Cancel – closes the screen without saving the settings.

8/10/2019 7010-0944 - SokkiaSSF_rm.pdf
http://slidepdf.com/reader/full/7010-0944-sokkiassfrmpdf 219/623
Points
P/N 7010-0944 6-11
Layer and Style
On the Edit Point screen, you can change the layer and graphic
properties of the point (Figure 6-11 on page 6-11):
Figure 6-11. Add/Edit Point – Layer/Style Tab
Tap the Layer/Style tab to change the layer and graphic properties ofthe point:
• Layer – selects the layer to locate the point.
• The List button opens the Layers screen to edit layers. (For
details on editing layers, see “Edit Layers” on page 6-23.)
• Point Style – select a point style from the drop-down list. The boxto the left shows the style to designate the point on the map.
• Color – opens the Select Color screen (see “On the Select Color”on page 6-11) to edit the color you desire.
On the Select Color screen (Figure 6-12), set the color of the pointmark to show on the map.

8/10/2019 7010-0944 - SokkiaSSF_rm.pdf
http://slidepdf.com/reader/full/7010-0944-sokkiassfrmpdf 220/623
Editing Job Data
Sokkia Spectrum Survey Field Reference Manual6-12
Figure 6-12. Select Color
Tap in the area of the color you want. You can select the color of thepoint for either the Layer or the Code by highlighting the Layer orCode node on the screen (Figure 6-12).
PTL Point
In PTL Mode, the PTL tab displays on the Edit Point screen with thefollowing parameters (Figure 6-13 on page 6-13).
• Start Ref Pt, End Ref Pt – selects reference points, either from themap, from the list, or when entered manually.
• PTL Offsets – the offsets from the reference line formed by the
reference points:
– Line: the distance from the start of the reference point alongthe reference line, where the perpendicular to this line passesthough the target.
– Offset : the horizontal distance from the target.
• Ell ht – the height of the target.
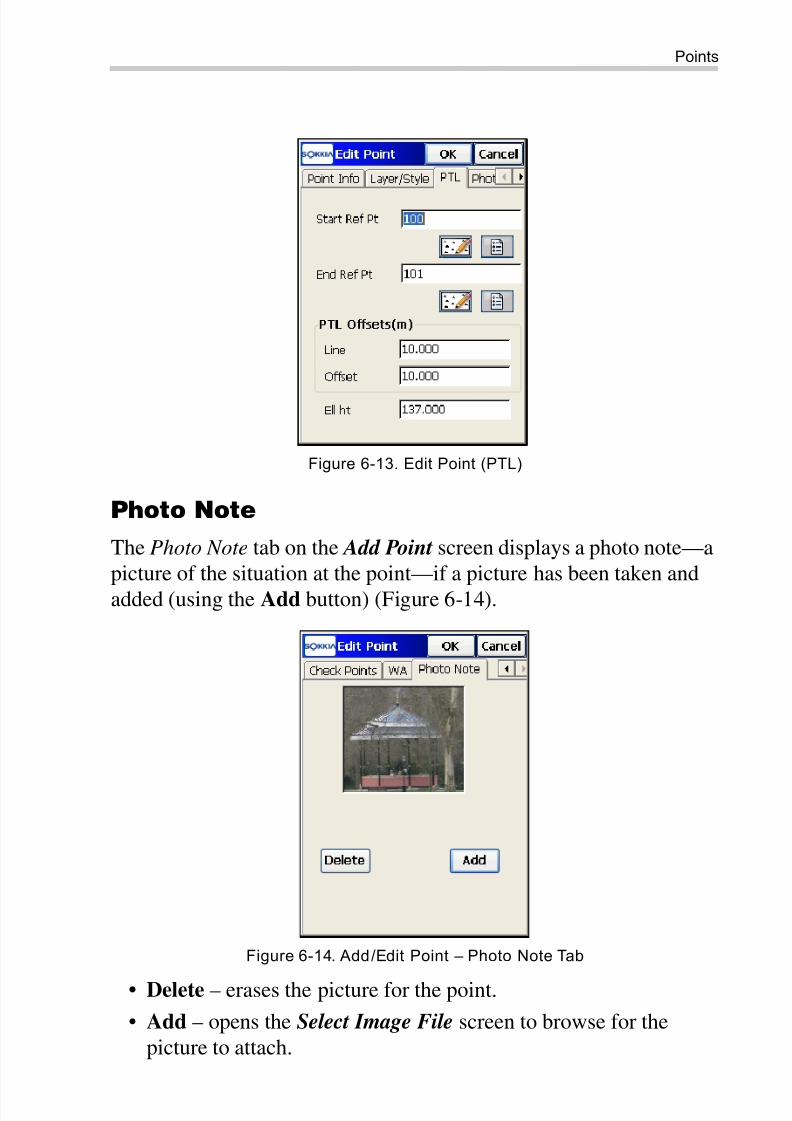
8/10/2019 7010-0944 - SokkiaSSF_rm.pdf
http://slidepdf.com/reader/full/7010-0944-sokkiassfrmpdf 221/623
Points
P/N 7010-0944 6-13
Figure 6-13. Edit Point (PTL)
Photo Note
The Photo Note tab on the Add Point screen displays a photo note—apicture of the situation at the point—if a picture has been taken andadded (using the Add button) (Figure 6-14).
Figure 6-14. Add/Edit Point – Photo Note Tab
• Delete – erases the picture for the point.
• Add – opens the Select Image File screen to browse for thepicture to attach.

8/10/2019 7010-0944 - SokkiaSSF_rm.pdf
http://slidepdf.com/reader/full/7010-0944-sokkiassfrmpdf 222/623
Editing Job Data
Sokkia Spectrum Survey Field Reference Manual6-14
Check Points
The Check Points tab appears on the Edit Point screen if the point has
duplicate points and these points are saved as check points(Figure 6-15).
The Check Points tab displays the check points coordinates and thedeviations from the original coordinate points.
Figure 6-15. Edit Point – Check Points
Weighted Average
The WA (Weighted Average) tab appears on the Edit Point screen ifthe point has check points which are used in a weighted average(Figure 6-16 on page 6-15). The Weighted Average tab displayscoordinate residuals of the check points used in a weighted average.

8/10/2019 7010-0944 - SokkiaSSF_rm.pdf
http://slidepdf.com/reader/full/7010-0944-sokkiassfrmpdf 223/623
Points
P/N 7010-0944 6-15
Figure 6-16. Edit Point – Weighted Average
To exclude a station from a weighted average, highlight the station.Tap the Exclude from WA / Use in WA button to delete/include the
highlighted station in averaging (Figure 6-17).
Figure 6-17. Exclude Station f rom Weighted Average

8/10/2019 7010-0944 - SokkiaSSF_rm.pdf
http://slidepdf.com/reader/full/7010-0944-sokkiassfrmpdf 224/623
Editing Job Data
Sokkia Spectrum Survey Field Reference Manual6-16
Codes
To edit codes and attributes, tap the Codes icon. The Code-Attributes
screen displays (Figure 6-18).
The Code-Attributes screen (Figure 6-18) contains a list of codesused for a survey, the list of attributes for each code, and a set of toolsfor editing the codes and attributes. Codes already in use cannot beedited or deleted.
Figure 6-18. Code – Attr ibutes
• Codes – contain a list of codes with their associated icons:
Point, Line, or Area.
• Attributes – contains a list of attributes for the selected code.• Delete – deletes the highlighted entry.
• Edit – opens the applicable Code (Figure 6-20 on page 6-18) or Attribute (Figure 6-23 on page 6-20) screen with the properties ofthe highlighted entry.
• Add – opens the applicable blank Code or the Attribute screen. Anew attribute can be added if at least one code exists and ishighlighted.
• The Help Icon in the upper-left corner of the screen opens thepop-up menu containing the Export To File option. The To File

8/10/2019 7010-0944 - SokkiaSSF_rm.pdf
http://slidepdf.com/reader/full/7010-0944-sokkiassfrmpdf 225/623
Codes
P/N 7010-0944 6-17
screen (Figure 6-19) displays to export the code library to the
selected file format.
On the To File screen (Figure 6-19) select the file format from whichto export codes of the current job. The Next button runs the exportprocess.
Figure 6-19. Export to Code Library
Edit Code
On the Code screen (Figure 6-20 on page 6-18), set the followingcode parameters:
• Name – the name of the code.
• Desc – the description for the code.
• Type – the type of objects the code describes: Point, Line or Area.A Code Style of Point, Line, or Area can be edited. Each style hasan associated plotting attributes and colors.
– Point : when Point is selected in the Type field, color andsymbol attributes for the point displays (Figure 6-20 onpage 6-18). The Color button opens the Color screen (see
“On the Select Color” on page 6-11).
– Line: when Line is selected in the Type field, color, symbol
for node, style, and thickness for line attributes display(Figure 6-21 on page 6-18).

8/10/2019 7010-0944 - SokkiaSSF_rm.pdf
http://slidepdf.com/reader/full/7010-0944-sokkiassfrmpdf 226/623
Editing Job Data
Sokkia Spectrum Survey Field Reference Manual6-18
– Area: when Area is selected in the Type field, color, symbol
for node, style and thickness for boundary, fill color, fill styleand transparency attributes display on the Area tab (Figure 6-
22 on page 6-19).
Figure 6-20. Edit Code - Point Type
• Layer – the name of the layer in which the code resides.
• The List button opens the Layers screen to edit layers. (For
details on editing layers, see “Edit Layers” on page 6-23.)
Figure 6-21. Edit Code - Line Type

8/10/2019 7010-0944 - SokkiaSSF_rm.pdf
http://slidepdf.com/reader/full/7010-0944-sokkiassfrmpdf 227/623

8/10/2019 7010-0944 - SokkiaSSF_rm.pdf
http://slidepdf.com/reader/full/7010-0944-sokkiassfrmpdf 228/623
Editing Job Data
Sokkia Spectrum Survey Field Reference Manual6-20
For Date-Time type, use the default (current date) and time for thecode attribute or set the date and time from the drop-down list(Figure 6-23).
Figure 6-23. Date-Time Attr ibute
• Attribute Name – the name of the code attribute.
• Required – enable to always use the default value with the code
attribute.
• OK – saves the changes, closes the screen and returns to the
Code-Attributes screen.

8/10/2019 7010-0944 - SokkiaSSF_rm.pdf
http://slidepdf.com/reader/full/7010-0944-sokkiassfrmpdf 229/623
Codes
P/N 7010-0944 6-21
For Integer type, the attribute value is an integer. Enter the minimumand maximum values of the attribute (Figure 6-24).
Figure 6-24. Integer Attr ibute
For Menu type, the attribute value is selected only from a list ofavailable values (Figure 6-25).
Figure 6-25. Menu Attr ibute
• Add – adds admissible values entered in the Add entry field.
• Sort List – enable to arrange the list in alphabetical order.
• Delete – deletes the selected entry from the menu.

8/10/2019 7010-0944 - SokkiaSSF_rm.pdf
http://slidepdf.com/reader/full/7010-0944-sokkiassfrmpdf 230/623
Editing Job Data
Sokkia Spectrum Survey Field Reference Manual6-22
For Real Number type, the attribute value is a real number. Enter theminimum and maximum values of the attribute (Figure 6-26).
Figure 6-26. Real Number Attribute
For Text type, the attribute value is an alpha-numeric string. Enterthe number of characters available for the text value (Figure 6-27).
Figure 6-27. Text At tribute

8/10/2019 7010-0944 - SokkiaSSF_rm.pdf
http://slidepdf.com/reader/full/7010-0944-sokkiassfrmpdf 231/623
Edit Layers
P/N 7010-0944 6-23
Edit Layers
To edit layers, tap the Layers icon.
The Layers screen (Figure 6-28) displays the list of all existing layersin the current job and the layer status of each.
Figure 6-28. Select Layer
• Layer Name – a list of Layers. Each layer has an icon to show
whether the layer is unhidden ( ) or hidden ( ). To turn on/
off the visibility of the selected Layer, tap on the Layer Namecolumn header.
• Status – shows whether the layer is empty or contains objects.
• – moves the highlighted layer up or down.
• Delete – deletes the highlighted layer.
• Edit – opens the applicable Edit Layer screen to display the
properties of the highlighted layer (Figure 6-29 on page 6-24).
• Insert – opens the Add Layer screen to insert a new layer belowthe selected layer.
• Add – opens the Add Layer screen to add a new layer.
• Close – closes the screen without saving the changes.

8/10/2019 7010-0944 - SokkiaSSF_rm.pdf
http://slidepdf.com/reader/full/7010-0944-sokkiassfrmpdf 232/623
Editing Job Data
Sokkia Spectrum Survey Field Reference Manual6-24
The Help Icon in the upper-left corner of the screen displays a pop-up
menu of the Help item.
View Objects on the Layer
The Edit Layer screen (Figure 6-29) is similar to the Add Layer
screen but has the additional Objects tab to view objects on the layer.
Layer Name
The Layer tab contains general settings. You can edit the following to
set new parameters for the layer:
• Layer Name – shows the name of the layer.
• Visible – hides/shows the layer objects on the map.
• Note – enter any additional information on the layer (ifpreferred).
• OK – saves the settings and returns to the Layers screen.
• Cancel – closes the screen without saving the changes.
Figure 6-29. Edit Layer Name
Style Tab
The Style tab plots parameters for lines and points on the layer. Do thefollowing to set parameters for the lines and points on the layer(Figure 6-30 on page 6-25).

8/10/2019 7010-0944 - SokkiaSSF_rm.pdf
http://slidepdf.com/reader/full/7010-0944-sokkiassfrmpdf 233/623
Edit Layers
P/N 7010-0944 6-25
• Point Style – selects a color and a symbol for the Point.
• Line Style – selects a color, a style, and thickness for Line.
• Area Style – selects a fill color, a fill style and transparency forthe Area.
• Color – opens the Select Color screen to set the color for thelayer (see Figure 6-12 on page 6-12).
Figure 6-30. Edit Layer Style
Objects Tab
If the layer has objects, the Objects tab (Figure 6-31 on page 6-26) onthe Edit Layer screen appears that displays points and other objects of
the current layer.

8/10/2019 7010-0944 - SokkiaSSF_rm.pdf
http://slidepdf.com/reader/full/7010-0944-sokkiassfrmpdf 234/623
Editing Job Data
Sokkia Spectrum Survey Field Reference Manual6-26
Figure 6-31. Edit Layer Objects
Edit Multiple Layers
To turn on/off the visibility of multiple layers at a time, select the
layers you want using the Ctrl or Shift buttons on the controller’skeyboard and tap on the Layer Name column (Figure 6-32).
Figure 6-32. Edit Multip le Layers
The Status column shows the status of the layer.

8/10/2019 7010-0944 - SokkiaSSF_rm.pdf
http://slidepdf.com/reader/full/7010-0944-sokkiassfrmpdf 235/623
Linework
P/N 7010-0944 6-27
Linework
Linework is a group of points connected with a line. Points defined by
the same code-string combination automatically form a linework.
To edit a linework, tap the Linework icon.The Linework screen (Figure 6-33) contains a list of existingLineworks on the left side of the screen, and the two windows on theright side that represent the view of the selected linework in thehorizontal and vertical planes (Figure 6-33).
• Delete – press to delete the Linework from the list.
• Edit – opens the applicable Edit Line screen (Figure 6-34 onpage 6-28).
• Add – opens a blank Add Line screen to create a new linework.The Linework can be created in four ways: by either selecting the
points with the desired codes and strings, by tapping the points onthe map, or by selecting the points from the list.
Figure 6-33. Linework
• Close – closes the screen without saving the settings.
To view the current selected linework in a larger map, double-tap oneof the map plots.
The Help Icon in the upper-left corner displays the pop-up menucontaining two items:

8/10/2019 7010-0944 - SokkiaSSF_rm.pdf
http://slidepdf.com/reader/full/7010-0944-sokkiassfrmpdf 236/623
Editing Job Data
Sokkia Spectrum Survey Field Reference Manual6-28
• Edit Points – displays the Points screen. For details, see “Points”
on page 6-2.
• Help – accesses the Help files.
Edit Line
On the Edit Line screen (Figure 6-34), you can edit the points and thelayer of the selected linework.
Points in Line
The Point in Line tab displays a list of existing points in the selectedLinework on the left side of the screen, and the general view of thelinework on the right side (Figure 6-34).The hand symbol on the plot indicates the point highlighted in the listof points. To view the current selected linework on a large map, tapon the map plot.
Figure 6-34. Edit Points in Line
• Linework Name – the name of the Linework.
• List of Points – points and their codes (if any) in the selected
linework.• The up and down arrows to the left of List of Points move the
highlighted point up or down in the order of the points in the
linework.

8/10/2019 7010-0944 - SokkiaSSF_rm.pdf
http://slidepdf.com/reader/full/7010-0944-sokkiassfrmpdf 237/623
Linework
P/N 7010-0944 6-29
• – toggles on/off the keyboard arrow keys that duplicate the
arrows on the screen.
• – deletes the highlighted point from the linework.• – closes the plot of the point list. Only the list of points table
will be available.
• Point Info – displays information on the selected point.
• Select Points – displays a floating menu of four items. Select oneof the following methods of adding points to the beginning of the
line:– By Code: select the codes with which the points are added to
the line.
– By Code String: select the codes and strings with which thepoints are added to the line.
– From Map: select the points by tapping them on the map;
points that are sequentially tapped are connected with a line.
– From List: select the points from the drop-down list.
The Help Icon in the upper-left corner displays the pop-up menucontaining two items:
• Edit Points – displays the Points screen. For details see “Points”on page 6-2.
• Help – accesses the Help files.

8/10/2019 7010-0944 - SokkiaSSF_rm.pdf
http://slidepdf.com/reader/full/7010-0944-sokkiassfrmpdf 238/623

8/10/2019 7010-0944 - SokkiaSSF_rm.pdf
http://slidepdf.com/reader/full/7010-0944-sokkiassfrmpdf 239/623
Area
P/N 7010-0944 6-31
Figure 6-36. Area Screen
• Delete – press to delete the highlighted Area from the list.
• Edit – opens the applicable Edit Area screen (Figure 6-37 onpage 6-32).
• Add – opens a blank Add Area screen to create a new area. TheArea can be created in five ways: by selecting the points with thedesired codes or code strings, by selecting the points from the listor from a line, by tapping the points on the map .
To view the current selected area in a larger map, tap one of the mapplots.
The Help Icon in the upper-left corner displays the pop-up menu
containing two items:
• Edit Points – displays the Points screen. For details, see “Points”on page 6-2.
• Help – accesses the Help files.
Edit Area
On the Edit Area screen (Figure 6-37 on page 6-32), you can edit thename, the points, and the layer of the selected area.

8/10/2019 7010-0944 - SokkiaSSF_rm.pdf
http://slidepdf.com/reader/full/7010-0944-sokkiassfrmpdf 240/623
Editing Job Data
Sokkia Spectrum Survey Field Reference Manual6-32
Points in Area
The Points in Area tab displays a list of existing points ( Area Name)
in the selected Area on the left side of the screen (Figure 6-37), andthe general view of the area lines on the right side.
The point highlighted in the list of points will be marked with ayellow circle. The Point Info button displays information on theselected point.
To view the current selected area on a large map, tap on the map plot.
Figure 6-37. Edit Points in Area
Edit a Layer/Style
On the Edit Area screen, tap the Layer / Style tab to edit a style andcolor to display the points, lines and area in the selected Area on themap (Figure 6-38 on page 6-33).
• Layer – selects the layer for the line from the drop-down list.
• The List icon opens the Layers screen to edit layers. (For
details on editing layers, see “Edit Layers” on page 6-23.)
• Point Style – selects the color and the symbol for the Point.
Color opens the Select Color screen (see “On the Select Color”on page 6-11) to choose the fill color for the point.
• Line Style – selects color, style and thickness for Line.
• Area Style – selects fill color, fill style and transparency for Area.

8/10/2019 7010-0944 - SokkiaSSF_rm.pdf
http://slidepdf.com/reader/full/7010-0944-sokkiassfrmpdf 241/623
Point Lists
P/N 7010-0944 6-33
Figure 6-38. Edit Area Layer/Style
Point Lists
The Point List is a group of points that can be simultaneouslyprocessed and is tightly intergrated throughout Sokkia SSF.Depending on the context, the points may or may not be connectedwith a line. A Point List with its points connected forms a polyline.
To use the Point Lists, tap the Point Lists icon. The List of Point
Lists screen displays (Figure 6-39).
List of Point ListsThe List of Pt Lists screen (Figure 6-39 on page 6-34) contains a listof existing Point Lists on the left side of the screen, and the twowindows on the right side, that displays a general view of the selectedlist in the horizontal and vertical planes. To view the current selectedpoint list on a larger map, double-click one of the map plots.

8/10/2019 7010-0944 - SokkiaSSF_rm.pdf
http://slidepdf.com/reader/full/7010-0944-sokkiassfrmpdf 242/623
Editing Job Data
Sokkia Spectrum Survey Field Reference Manual6-34
Figure 6-39. List of Point Lists
• Delete – deletes the Point List from the list.
• Copy – creates a copy of the selected List.
• Edit – edits the properties of the selected List. The Edit Point
List screen displays (Figure 6-40 on page 6-35).• Add – creates a new point List. The Add Point List screen
displays.
• The Help Icon in the upper-left corner of the screen displays thepop-up menu containing two items:
– Edit Points: displays the Points screen. For details, see
“Points” on page 6-2.
– Help: accesses the Help files.
Edit Point List
The Edit Point List screen (Figure 6-40 on page 6-35) is similar to the
Add Point List screen and consists of two tabs: Point List andProperties.
The Point List tab displays the points included in the list to edit.

8/10/2019 7010-0944 - SokkiaSSF_rm.pdf
http://slidepdf.com/reader/full/7010-0944-sokkiassfrmpdf 243/623
Point Lists
P/N 7010-0944 6-35
Figure 6-40. Edit Point L ist
• Point List Name – the name of the Point List.
• List of Points – the list of currently selected points. Use the up anddown arrows to the left to select a point. Adding a point to the list
can be performed in two ways.– Tap the map plot on the right: The large Map screen opens
(for details on the screen icons, see “Points” on page 6-2).
Select the points by tapping them on the map; the twosequentially tapped points are connected with a line. PressClose to return to the Edit Point List screen.
– Select Points: displays the five methods of adding points:select either By Range, By Code, By CodeString, By Radius,From Map, or From List . Enter in this sequence: set the range,check the codes, set the center point and the radius of thearea, then select the points from the map or use the list.
• Point Info – shows the point information of the currently selectedsingle point.
• – toggles on/off the keyboard arrow keys that duplicate the
arrows on the screen.
• – deletes the highlighted point from the list.

8/10/2019 7010-0944 - SokkiaSSF_rm.pdf
http://slidepdf.com/reader/full/7010-0944-sokkiassfrmpdf 244/623
Editing Job Data
Sokkia Spectrum Survey Field Reference Manual6-36
• – closes the plot of the point list. Only the list of points table is
available.
• The Help Icon in the upper-left corner of the screen displays thepop-up menu containing two items:
– Edit Points: displays the Points screen. For details see“Points” on page 6-2.
– Help: accesses the Help files.
The Properties tab shows the name of the point list selected on thePoint List screen (Figure 6-41).
Figure 6-41. Edit Point List Properties

8/10/2019 7010-0944 - SokkiaSSF_rm.pdf
http://slidepdf.com/reader/full/7010-0944-sokkiassfrmpdf 245/623
Raw Data
P/N 7010-0944 6-37
Raw Data
To edit raw data, tap the Raw Data icon.
The Raw Data screen has the following columns and buttons.
Figure 6-42. Raw Data - GPS
• Name – point name and the icon displaying the type of point
• Type – the type of measurement
• Codes – codes for the point
• HI – for TS mode, the height of the instrument; for a Level
survey, the elevation of the line of sight of the levelled instrument
above the datum.• Ant Ht – for GPS+ mode, the antenna height (S-stands for the
slope measurement of the antenna height).
• Coordinates – the coordinates of the point (TS and GPS+ modes).
• Mid Wire – the reading on the middle wire for Level survey.
• Distance – the horizontal distance between the Level and the rod
for Level survey.• Ctrl Code – control code for the point.
• Notes – additional information on the point.
• Local Time – the local time when the point is collected.

8/10/2019 7010-0944 - SokkiaSSF_rm.pdf
http://slidepdf.com/reader/full/7010-0944-sokkiassfrmpdf 246/623
Editing Job Data
Sokkia Spectrum Survey Field Reference Manual6-38
• First and Last – moves the cursor to the first or last point.
• Edit – opens the Edit Raw Data screen to edit user-entered raw
data.• Recompute – recomputes the point coordinates after editing the
point’s raw data.
• Find by Point – finds a point by its name or a part of its name.
• Find by Code – finds a point by its code or by a part of the code.
• Find Next – finds the next point that satisfies the same conditionsas the previous found point.
• Close – closes the screen.
• The Help Icon in the upper-left corner of the screen enables themenu of four items:
– Job Info: displays the Job Info screen (For details, see
“Viewing Job Information” on page 2-12).
– Show Raw GPS+/TS : toggles between displaying GPS+ rawdata and TS raw data.
– String: displays strings for points among raw data.
– Help: accesses the Help files.
Edit Raw Data
The Edit Raw Data screen (Figure 6-43 on page 6-39) is used to edit
the name and code of the surveyed point, and the antenna/instrumentheight at this point. Also, you can edit the antenna type for GPSmeasurements.
The title of the first tab is the survey type for the point being edited,for example:
• Topo or Auto Topo for GPS data (Figure 6-43 on page 6-39).
• BS and Side Shot for Total Station data.
• Side Shot for Digital Level data.

8/10/2019 7010-0944 - SokkiaSSF_rm.pdf
http://slidepdf.com/reader/full/7010-0944-sokkiassfrmpdf 247/623
Raw Data
P/N 7010-0944 6-39
Figure 6-43. Edit Raw Data
The Data tab (Figure 6-44) displays information on measurements:
• Vector components for GPS data (Figure 6-44).
• Angle and distance measurements for Total Station data.
• Horizontal distance, rod height and vertical offset for DigitalLevel data.
Figure 6-44. Edit Raw Data – Data Tab

8/10/2019 7010-0944 - SokkiaSSF_rm.pdf
http://slidepdf.com/reader/full/7010-0944-sokkiassfrmpdf 248/623
Editing Job Data
Sokkia Spectrum Survey Field Reference Manual6-40
For the Base Station, the Edit button displays the Base coordinates on
the PC Coords screen (Figure 6-45).
Figure 6-45. Base Station Coordinates
• Relative cal – enable to use relative parameters at the base with
CMR+ data transmission if necessary.
In addition, the Edit Raw Data screen (Figure 6-46 on page 6-41) for
DL measurements contains a Measurements tab to adjust verticaloffsets.
TIP
The Latitudes are considered to be positive in the
Northern Hemisphere and negative in the Southernone. The Longitudes are positive for the Easterndirection and negative for the Western direction,
relative to the GMT line.

8/10/2019 7010-0944 - SokkiaSSF_rm.pdf
http://slidepdf.com/reader/full/7010-0944-sokkiassfrmpdf 249/623
Background Images
P/N 7010-0944 6-41
Figure 6-46. Edit DL Raw Data – Measurements Tab
Background Images
To edit background images in the current job, tap the Images icon.Any raster image with a TIF, JPG, or BMP extension is supported. Tobe positioned correctly under all observed data on the map screen, the
images must have geo-referenced data. GeoTIFF images alreadyinclude geo-referenced data, while the others use a separate file that
references the geographic location of the image. This file is called aWorld File. The World File contains information about the size of thecorresponding image and the coordinates of the geo-reference point
(the upper left corner of the image) in the coordinate system of the job. The World File must have the same filename extensionassociated with the image format (TFW, JGW or BPW) and should belocated in the same directory as the image file.

8/10/2019 7010-0944 - SokkiaSSF_rm.pdf
http://slidepdf.com/reader/full/7010-0944-sokkiassfrmpdf 250/623
Editing Job Data
Sokkia Spectrum Survey Field Reference Manual6-42
The Background Images screen (Figure 6-47) displays a list of
available image files. Initially, the list is empty.
Figure 6-47. Select Image to Open
• Properties – opens the Properties screen for the highlighted file.
• Delete – deletes the currently selected file from the list.• Add – opens the Add Image screen (Figure 6-48 on page 6-43) to
browse the controller’s directories for the desired file.
• Up/Down arrows – moves the selected images up or down in thelist.
• OK – opens the selected file. If no World File exists for thebackground image file selected, a warning displays, and the
Background Images screen appears again to select another file.Multiple background images can be selected, but is limited by the
amount of free space in the controller memory.

8/10/2019 7010-0944 - SokkiaSSF_rm.pdf
http://slidepdf.com/reader/full/7010-0944-sokkiassfrmpdf 251/623
Background Images
P/N 7010-0944 6-43
Add Image
The Add Image screen (Figure 6-48) selects an image file to add to
the Background Images list.
Figure 6-48. Add Image
• Type – selects the type of the image to be added, either GeoTIFF,TIFF, JPEG, or BITMAP.
• Name – displays the name of the selected file.
• OK – opens the Properties screen (Figure 6-49 on page 6-44) forthe selected file.
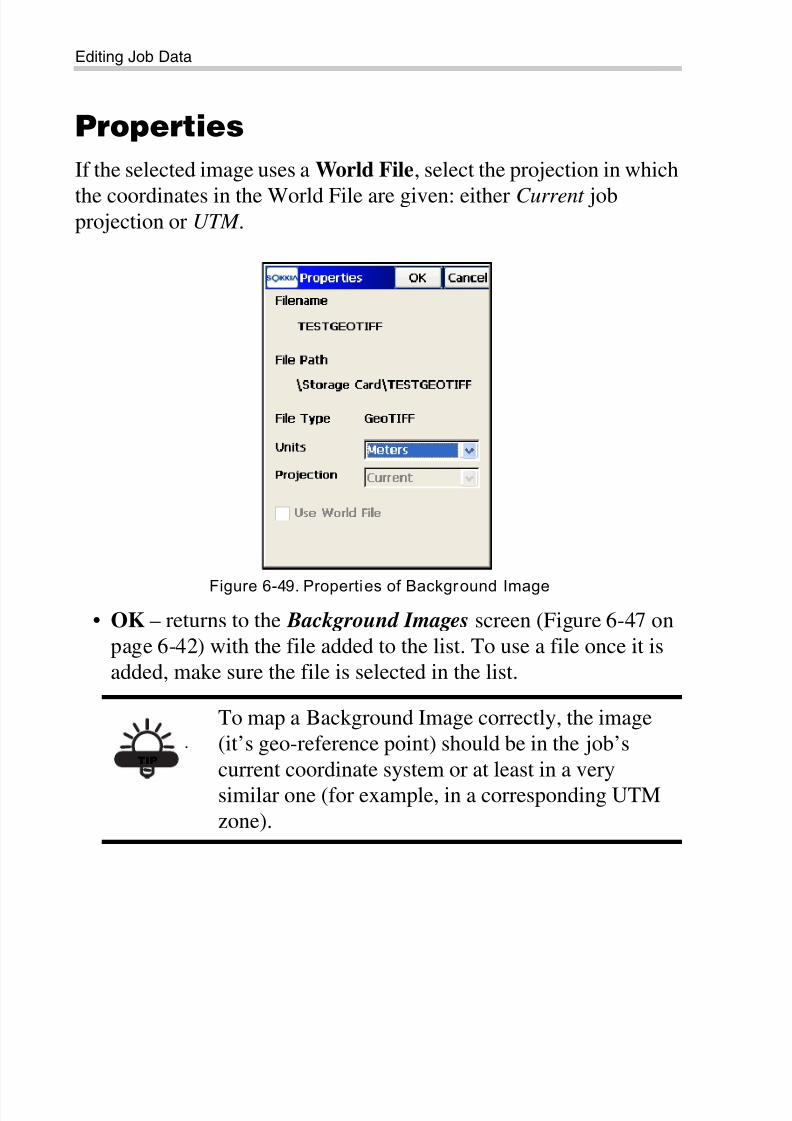
8/10/2019 7010-0944 - SokkiaSSF_rm.pdf
http://slidepdf.com/reader/full/7010-0944-sokkiassfrmpdf 252/623
Editing Job Data
Sokkia Spectrum Survey Field Reference Manual6-44
Properties
If the selected image uses a World File, select the projection in which
the coordinates in the World File are given: either Current jobprojection or UTM .
Figure 6-49. Properties of Background Image
• OK – returns to the Background Images screen (Figure 6-47 onpage 6-42) with the file added to the list. To use a file once it isadded, make sure the file is selected in the list.
TIP
To map a Background Image correctly, the image(it’s geo-reference point) should be in the job’s
current coordinate system or at least in a verysimilar one (for example, in a corresponding UTMzone).

8/10/2019 7010-0944 - SokkiaSSF_rm.pdf
http://slidepdf.com/reader/full/7010-0944-sokkiassfrmpdf 253/623
Sessions
P/N 7010-0944 6-45
Sessions
To create or edit GPS sessions of the automatic survey for post-
processing, tap the Sessions icon. The Sessions (Figure 6-50) screendisplays.
Figure 6-50. Sessions
• Sessions – on this panel, enter an ID name, survey type, the dayand time the survey began, and the day, time, and date the surveyended.
• Edit – press to edit the existing session. The Session Setup
screen opens (Figure 6-51 on page 6-46).
• Add – press to create a new session. The Session Setup screenopens (Figure 6-51 on page 6-46).
• Receivers – on this panel, is the list of the available receivers andtheir session plans. To hide/display the session plans of the
receiver, tap on the “-/+” sign located near the receiver name.
• Add – press to add a receiver. The Receiver Name screendisplays.
• – press to put a session to the session plan of the receiver. Onthe Sessions screen, highlight the preferred session in the
Sessions panel and highlight the necessary receiver in the
Receivers panel. Press this button.

8/10/2019 7010-0944 - SokkiaSSF_rm.pdf
http://slidepdf.com/reader/full/7010-0944-sokkiassfrmpdf 254/623
Editing Job Data
Sokkia Spectrum Survey Field Reference Manual6-46
• – press to delete the session from the sessions list or receiver.
• OK – saves the changes and closes the screen.
Session Setup
The Session Setup (Figure 6-51) screen contains the parameters of
the session.
Figure 6-51. Session Setup
• Site Name – the name of the occupation point.
• Type – sets the type of session survey, either static or kinematic.
• Start Time, End Time – sets the start and end time of the survey
• Interval – sets the interval between measurements,
• Min SVs – sets the minimum satellites available for the survey
• Ant Type – sets the type of antenna.
• Ant Ht – sets the value and type of the antenna height.
• OK – saves the changes and returns to the Sessions screen
(Figure 6-50 on page 6-45).
NOTICE
The antenna type specified in this screen does notdisplay in the receiver file. But the antenna heightrecorded in the file includes offsets for the specifiedantenna type.

8/10/2019 7010-0944 - SokkiaSSF_rm.pdf
http://slidepdf.com/reader/full/7010-0944-sokkiassfrmpdf 255/623
Simulation Setup
P/N 7010-0944 6-47
Simulation Setup
Simulation Setup becomes available in the Edit Job menu when GPS
Simulation mode is enabled (see Figure 3-6 on page 3-7).
To setup the simulation mode, tap the Set Simulator icon.The Simulation Setup screen (Figure 6-52) sets a reference positionfor GPS simulation. Set the reference position by selecting the point,either from the map or from the list, or enter manually.
Figure 6-52. Simulation Setup

8/10/2019 7010-0944 - SokkiaSSF_rm.pdf
http://slidepdf.com/reader/full/7010-0944-sokkiassfrmpdf 256/623
Editing Job Data
Sokkia Spectrum Survey Field Reference Manual
Notes:
6-48

8/10/2019 7010-0944 - SokkiaSSF_rm.pdf
http://slidepdf.com/reader/full/7010-0944-sokkiassfrmpdf 257/623
P/N 7010-0944
Chapter 7
7-1
Editing RoadsTo edit road data in a job, tap the Edit Roads icon in the main menu.
The Edit Roads menu opens (Figure 7-1), which includes options toedit road data in the current job: Roads, Horizontal Alignments,Vertical Alignments, Templates, X-Sections
Figure 7-1. Edit Roads Menu
The Help Icon opens a pop-up menu, giving access to the help
files, module activation codes, port data logging, changing menuinterface, and information about Sokkia SSF (for details see “HelpIcon’s Pop-up Menu” on page 1-9).
TIP
To edit object properties, double-click on the objector select the object and tap the Edit button.

8/10/2019 7010-0944 - SokkiaSSF_rm.pdf
http://slidepdf.com/reader/full/7010-0944-sokkiassfrmpdf 258/623
Editing Roads
Sokkia Spectrum Survey Field Reference Manual7-2
Roads
The road as an object can be described through the horizontal and
vertical projections of the center line, called alignments, and the linedescribing the surface of the road and lying in the plane perpendicularto the center line, called a cross section.
The alignment can be divided into sections, each described with thehelp of algebraic functions. The horizontal alignment can bedescribed through lines, spirals, arcs and intersection point s. Intersection point is defined as the intersection of the two lines
tangential to the 'incoming' and 'exiting' spirals, or to the central curveat the PC and PT points, if spirals are not specified. The verticalalignment can be described through vertical grades and parabolas, or
long sections.
The cross section can be described using templates (see “The next X-Sect Temp screen (Figure 7-26) displays the parameters of thehighlighted template to edit.” on page 7-27 for details).
To edit a road as a whole, tap the Roads icon.The Roads screen (Figure 7-2) displays a list of the created roads, andplots of the horizontal and vertical alignments for each road.
Figure 7-2. Select Road
The left side of the screen displays the list of created roads. The rightside displays the corresponding alignment plots.

8/10/2019 7010-0944 - SokkiaSSF_rm.pdf
http://slidepdf.com/reader/full/7010-0944-sokkiassfrmpdf 259/623
Roads
P/N 7010-0944 7-3
• Delete – deletes the road from the job.
• Edit – opens the Edit Road screen (Figure 7-3 on page 7-4),
displaying the parameters of the selected road.• Add – opens the Add Road screen blank parameter fields to set a
new road.
The Help Icon in the upper-left corner of the screen displays a pop-upmenu containing five items:
• Import Road(s) From Job – starts the import of roads from the job
selected (“Importing From Job” on page 5-2).
• Import Road(s) From File – starts the import of roads from thefile of the selected format (“Importing From a File” onpage 5-13).
• Export Road(s) To Job – starts the export of roads to the job
selected (“Exporting To a Job” on page 4-2).
• Export Road(s) To File – starts the export of roads to the file of
the selected format (“Exporting to File” on page 4-12).• Help – accesses the Help files.
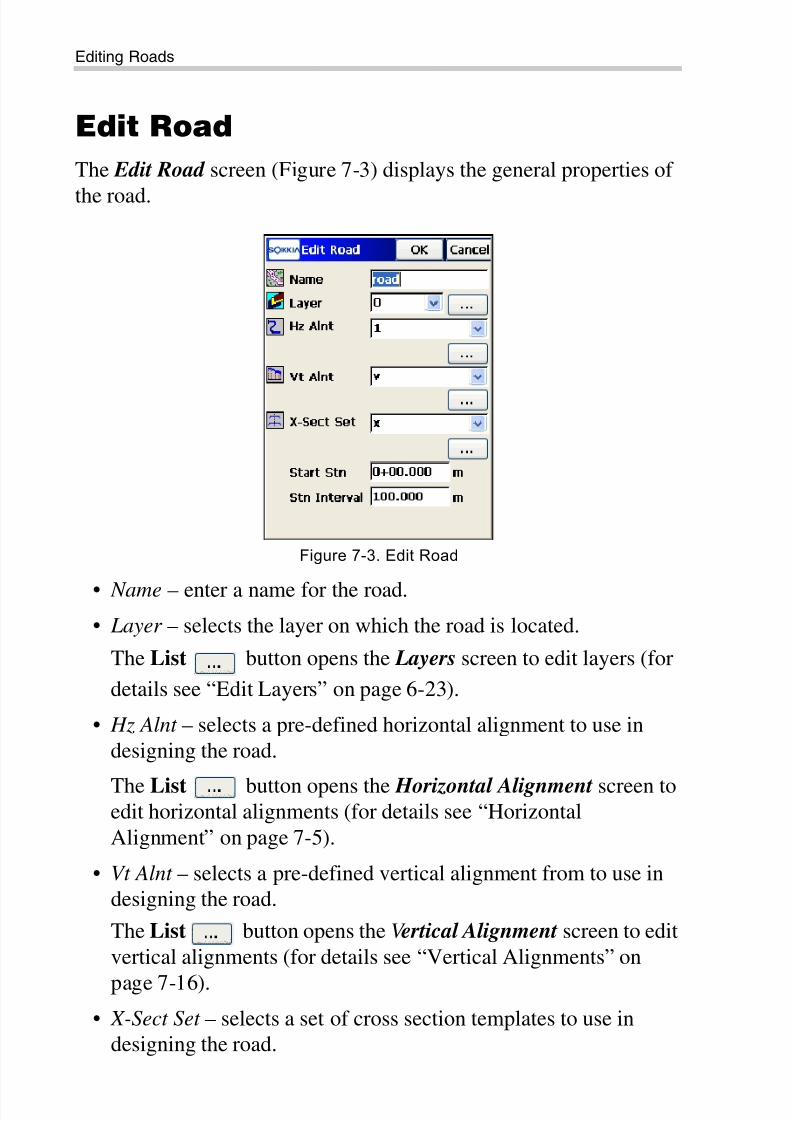
8/10/2019 7010-0944 - SokkiaSSF_rm.pdf
http://slidepdf.com/reader/full/7010-0944-sokkiassfrmpdf 260/623
Editing Roads
Sokkia Spectrum Survey Field Reference Manual7-4
Edit Road
The Edit Road screen (Figure 7-3) displays the general properties of
the road.
Figure 7-3. Edit Road
• Name – enter a name for the road.
• Layer – selects the layer on which the road is located.
The List button opens the Layers screen to edit layers (for
details see “Edit Layers” on page 6-23).
• Hz Alnt – selects a pre-defined horizontal alignment to use indesigning the road.
The List button opens the Horizontal Alignment screen toedit horizontal alignments (for details see “Horizontal
Alignment” on page 7-5).
• Vt Alnt – selects a pre-defined vertical alignment from to use indesigning the road.
The List button opens the V ertical Alignment screen to edit
vertical alignments (for details see “Vertical Alignments” on
page 7-16).
• X-Sect Set – selects a set of cross section templates to use indesigning the road.

8/10/2019 7010-0944 - SokkiaSSF_rm.pdf
http://slidepdf.com/reader/full/7010-0944-sokkiassfrmpdf 261/623
Horizontal Alignment
P/N 7010-0944 7-5
The List button opens the X-Section Set screen to edit cross
section sets (for details see “Cross Section Sets” on page 7-29).
• Start Stn/Start Chn – the starting station number with distance tothe station, or the starting chain distance, depending on a
selection made in the Display screen (for details see “Display” onpage 2-8).
• Stn Interval/Chain Interval – the interval between the pointswhere road related computations are made.
After the Road is created, calculate the road points. The Help Icon in
the upper-left corner of the screen displays a pop-up menu containingtwo items:
• Calculate Road Points – opens the Calculate Road Points screen(see “Calculate Road Points” on page 7-33).
• Help – accesses the Help files.
Horizontal AlignmentTo edit a horizontal alignment, tap the Horizontal icon. The Hz Alnt screen (Figure 7-4) displays a list of the horizontal alignments, andthe map area displaying the plot of the highlighted horizontalalignment.
Figure 7-4. Horizontal Alignment

8/10/2019 7010-0944 - SokkiaSSF_rm.pdf
http://slidepdf.com/reader/full/7010-0944-sokkiassfrmpdf 262/623

8/10/2019 7010-0944 - SokkiaSSF_rm.pdf
http://slidepdf.com/reader/full/7010-0944-sokkiassfrmpdf 263/623

8/10/2019 7010-0944 - SokkiaSSF_rm.pdf
http://slidepdf.com/reader/full/7010-0944-sokkiassfrmpdf 264/623
Editing Roads
Sokkia Spectrum Survey Field Reference Manual7-8
Figure 7-6. Edit Horizontal Al ignment Elements
On the Hz tab, the element list has the following columns:
• Element – the icon and the name of the element; either line,spiral, curve, or intersection point .
• Length – the length of the element.
• Azimuth – the azimuth at the beginning of the element.
• Radius – the radius of the curve, spiral, or intersection point (theradius of the spiral is the radius at the end of the ‘incoming’ spiral
or at the beginning of the ‘exiting’ spiral; the radius of theintersection point is the radius of the corresponding curve).
• Delete – deletes the element from the road.• Edit – opens a screen with properties of the selected element.
• Insert – inserts elements selected from a floating menu ( Line,Curve, Spiral, or Intersection Point ) at the selected location in the
list.
• Add – adds elements selected from the floating menu to the endof the list:
– Line: for more information, see “Add a Line” onpage 7-11.
– Curve: for more information, see “Add a Curve” on
page 7-12.
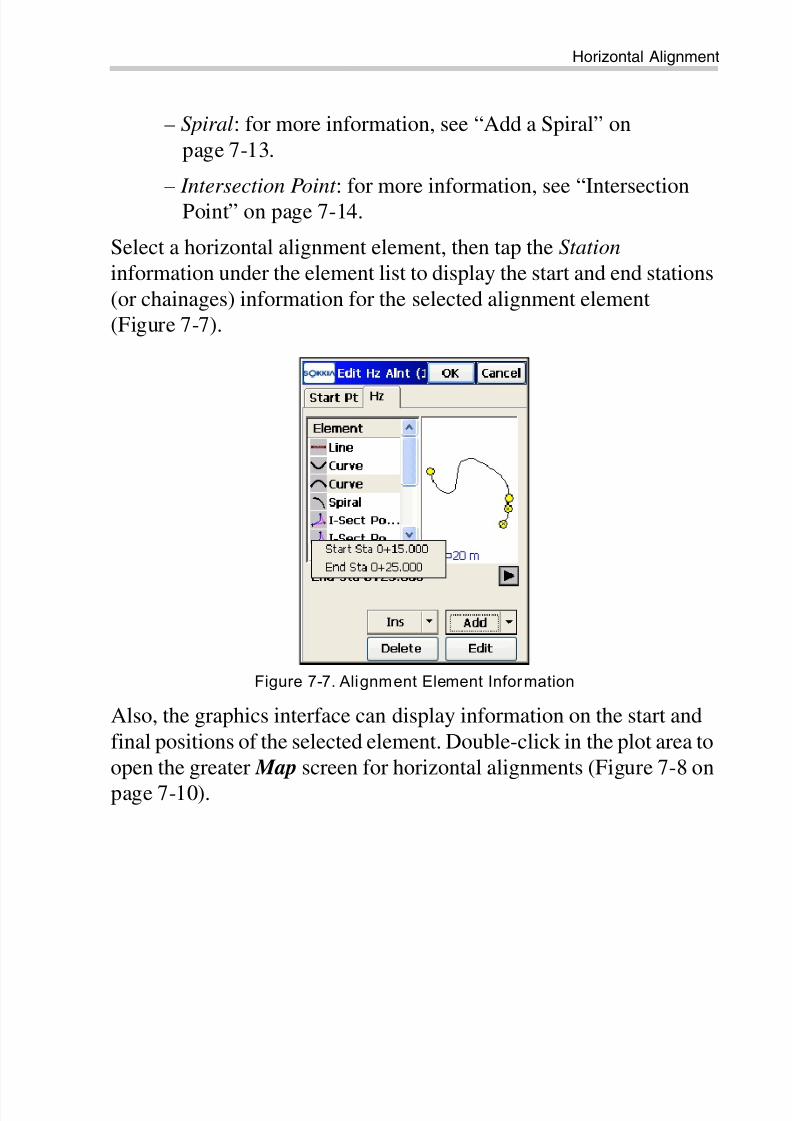
8/10/2019 7010-0944 - SokkiaSSF_rm.pdf
http://slidepdf.com/reader/full/7010-0944-sokkiassfrmpdf 265/623
Horizontal Alignment
P/N 7010-0944 7-9
– Spiral: for more information, see “Add a Spiral” on
page 7-13.
– Intersection Point : for more information, see “IntersectionPoint” on page 7-14.
Select a horizontal alignment element, then tap the Station information under the element list to display the start and end stations
(or chainages) information for the selected alignment element(Figure 7-7).
Figure 7-7. Alignment Element Information
Also, the graphics interface can display information on the start and
final positions of the selected element. Double-click in the plot area toopen the greater Map screen for horizontal alignments (Figure 7-8 on
page 7-10).

8/10/2019 7010-0944 - SokkiaSSF_rm.pdf
http://slidepdf.com/reader/full/7010-0944-sokkiassfrmpdf 266/623
Editing Roads
Sokkia Spectrum Survey Field Reference Manual7-10
Figure 7-8. Alignment Map
Select the alignment element you want to display on the Alignment
Element Info screen (Figure 7-9), then double-click to display
information for the selected horizontal alignment element from themap: either Start/End Station, Start NOrth, Start East, End North, or End East .
Figure 7-9. Alignment Element Information

8/10/2019 7010-0944 - SokkiaSSF_rm.pdf
http://slidepdf.com/reader/full/7010-0944-sokkiassfrmpdf 267/623
Horizontal Alignment
P/N 7010-0944 7-11
Add a Line
To add a line, select the Line option from the Insert or Add floating
menu on the Horizontal tab of the Edit Horizontal Alignment screen.The Line screen displays (Figure 7-10).
Figure 7-10. Line
The plot illustration at the bottom-left corner of the Line screenshows the element’s appearance (Figure 7-10).
• Length – the length of the line element.
• Azimuth – by default, the azimuth is set tangent to the previouselement. This field is editable only for the starting element of the
road. To change the azimuth of all other elements, remove the
check mark from the Tangent to Previous Item box on the HelpIcon in the upper-left corner of the screen.
• OK – saves the element to the road and returns to the Add
Horizontal Alignment screen.• Cancel – closes the screen without saving the settings.
NOTICE
Caution should be exercised when setting theazimuth, since road elements are usually tangential
to each other.

8/10/2019 7010-0944 - SokkiaSSF_rm.pdf
http://slidepdf.com/reader/full/7010-0944-sokkiassfrmpdf 268/623
Editing Roads
Sokkia Spectrum Survey Field Reference Manual7-12
Add a Curve
To add a curve, select the Curve option from the Insert or Add
floating menu on the Horizontal tab of the Edit Horizontal Alignment screen. The Curve screen displays (Figure 7-11).
Figure 7-11. Curve
The plot illustration at the bottom of the Curve screen shows theelement’s appearance.
• Radius/ Deg Chord/ Deg Curve – the radius of the curve, or one
of the two parameters unambiguously defining the radius: degree
of chord, or degree of curve.
Using the degree of chord (DCH) or degree of curve (DCV)
parameters, the radius can be calculated as follows:
• Length/Chord/Tangent/Mid Ord/External/Delta – the length ofthe curve element, or one of five parameters unambiguouslydefining the curve length: chord, tangent, middle ordinate (the
distance from the midpoint of a chord to the midpoint of thecorresponding curve), external (the distance from the midpoint ofthe curve to the tangent), or delta (the angle between the radii
corresponding to the curve).
R 50
DC H
2-------------
Π180---------×⎝ ⎠
⎛ ⎞sin
------------------------------------------ R, 100 180×
Π------------------------
1
DC V ------------×= =

8/10/2019 7010-0944 - SokkiaSSF_rm.pdf
http://slidepdf.com/reader/full/7010-0944-sokkiassfrmpdf 269/623
Horizontal Alignment
P/N 7010-0944 7-13
• Azimuth – by default, the azimuth is set tangent to the previous
element. This field is editable only for the starting element of theroad. To change the azimuth of all other elements, remove the
check mark from the Tangent to Previous Item menu on thebitmap icon in the upper-left corner of the screen.
• Turn – the direction of turn. Select either the Right value
(clockwise direction) or the Left value (counter-clockwisedirection).
• OK – saves the element to the road and returns to the Add
Horizontal Alignment screen.
Add a Spiral
To add a spiral, select the Spiral option from the Insert or Add
floating menu on the Horizontal tab of the Edit Horizontal Alignment screen. The Spiral screen displays (Figure 7-12).
Figure 7-12. Spiral
The plot at the bottom of the screen displays the element’sappearance.
• Radius/ Deg Chord/ Deg Curve – the radius of the curve, or oneof two parameters unambiguously defining the radius: the degree
NOTICE
Caution should be exercised when setting the
azimuth, since road elements are usually tangentialto each other.

8/10/2019 7010-0944 - SokkiaSSF_rm.pdf
http://slidepdf.com/reader/full/7010-0944-sokkiassfrmpdf 270/623
Editing Roads
Sokkia Spectrum Survey Field Reference Manual7-14
of chord, or the degree of curve (see “Add a Curve” on
page 7-12).
• Length/Sp Const – the parameter is the square root of the product
of the length and the radius of the spiral, as defined above.Consequently, the spiral constant has the units of length.
• Azimuth – by default, the azimuth is set tangent to the previouselement. This field is editable only for the starting element of theroad. To change the azimuth of all other elements, remove thecheck mark from the Tangent to Previous Item box on the bitmapin the upper-left corner of the screen.
• Turn – the direction of turn. Select either the Right value
(clockwise direction) or the Left value (counter-clockwisedirection).
• Dir – the direction of movement along the spiral, TS to SC
(entering the turn), or CS to ST (exiting the turn)1.
• OK – saves the element to the road and returns to the Add
Horizontal Alignment screen.
Intersection Point
To add an intersection point, select the Intersection Point option fromthe Insert or Add floating menu on the Horizontal tab of the Edit
Horizontal Alignment screen. The Intersection Pt screen
(Figure 7-13 on page 7-15) displays.
NOTICE
Caution should be exercised when setting theazimuth, since road elements are usually tangentialto each other.
1. The traverse points on the turn have the following markers:
TS-traverse-spiral; SC-spiral-circle; CS-circle-spiral; and ST-spiral
traverse.

8/10/2019 7010-0944 - SokkiaSSF_rm.pdf
http://slidepdf.com/reader/full/7010-0944-sokkiassfrmpdf 271/623
Horizontal Alignment
P/N 7010-0944 7-15
Figure 7-13. Intersection Point
• Point – the name of the intersection point. Either enter the name
manually (with the coordinates specified in the North and East fields and a height of zero) or select it from the map or the list.
• North, East – the local coordinates of the intersection point;cannot be changed for an existing point.
• Radius/ Deg Chord/ Deg Curve – the radius of the correspondingcurve, or the parameter, unambiguously defining the radius,degree of chord, or degree of curve. See “Add a Curve” onpage 7-12.
• Length1/Sp Const 1, Length2/Sp Const 2 – the length of the
corresponding spiral elements, or the spirals constants. The spiralconstants are defined. See“Add a Spiral” on page 7-13.
• OK – saves the element to the road and returns to the Add
Horizontal Alignment screen.
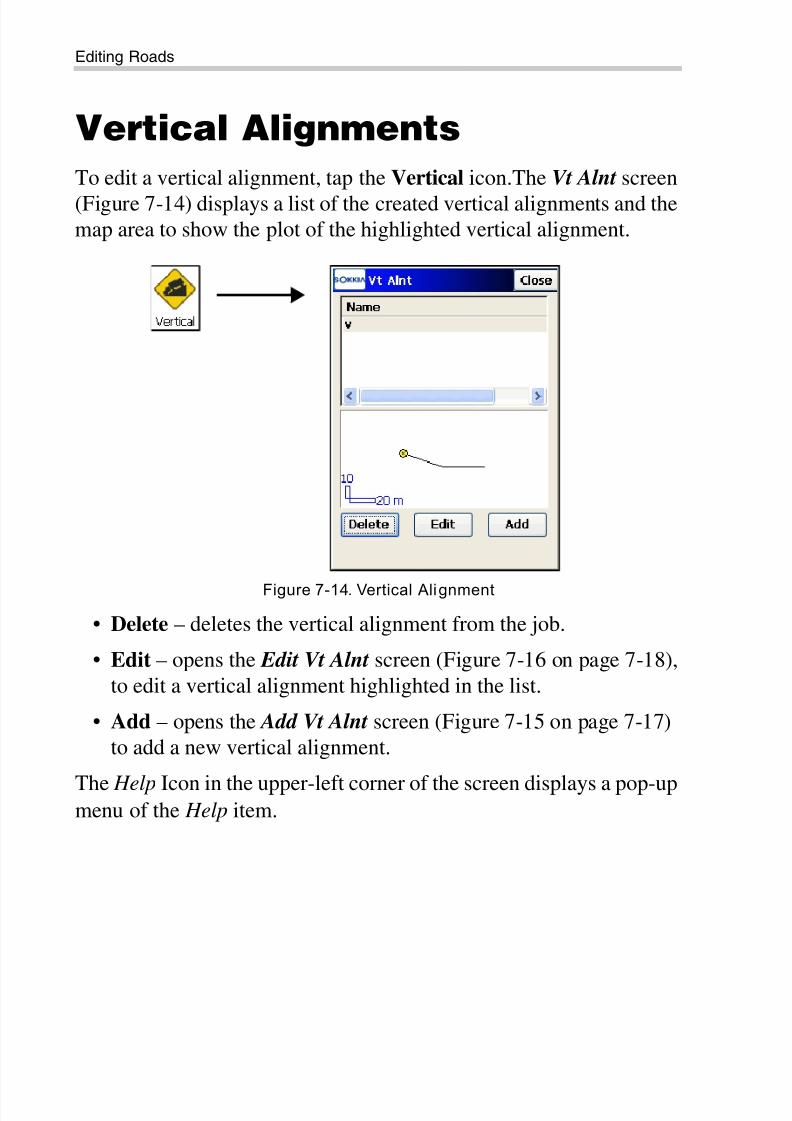
8/10/2019 7010-0944 - SokkiaSSF_rm.pdf
http://slidepdf.com/reader/full/7010-0944-sokkiassfrmpdf 272/623
Editing Roads
Sokkia Spectrum Survey Field Reference Manual7-16
Vertical Alignments
To edit a vertical alignment, tap the Vertical icon.The Vt Alnt screen
(Figure 7-14) displays a list of the created vertical alignments and themap area to show the plot of the highlighted vertical alignment.
Figure 7-14. Vertical Alignment
• Delete – deletes the vertical alignment from the job.
• Edit – opens the Edit Vt Alnt screen (Figure 7-16 on page 7-18),
to edit a vertical alignment highlighted in the list.
• Add – opens the Add Vt Alnt screen (Figure 7-15 on page 7-17)to add a new vertical alignment.
The Help Icon in the upper-left corner of the screen displays a pop-upmenu of the Help item.

8/10/2019 7010-0944 - SokkiaSSF_rm.pdf
http://slidepdf.com/reader/full/7010-0944-sokkiassfrmpdf 273/623
Vertical Alignments
P/N 7010-0944 7-17
Add Vertical Alignments
Tap the Add button on the Vertical Alignment screen (Figure 7-15).
The Add Vt Alnt screen selects a method of creating this alignmentand sets the name of the new vertical alignment.
Figure 7-15. Add Vertical A lignment
• Name – enter a name for the new vertical alignment.
• VAL Type – the method of creating the vertical alignment, whichinclude:
– Long Section: select to create the vertical alignment bysections. The vertical alignment is presented as a set ofsections between the stations where the heights are known
(usually these are the extremes of the vertical alignment line),and the interval around the station where the verticalalignment line has a parabolic shape.
– Elements: select to create the vertical alignment by element,
starting and finishing where you want and starting again.
• OK – opens the next Add Vt Alnt screens similar to those for
editing vertical alignments.

8/10/2019 7010-0944 - SokkiaSSF_rm.pdf
http://slidepdf.com/reader/full/7010-0944-sokkiassfrmpdf 274/623
Editing Roads
Sokkia Spectrum Survey Field Reference Manual7-18
Edit Vertical Alignments
Select the alignment and tap the Edit button on the Vertical
Alignment screen.
Elements
For Element vertical alignment types, the Start Pt tab on the Edit Vt
Alnt screen (Figure 7-16) sets the parameters of the point starting the
vertical alignment.
Figure 7-16. Edit Vertical A lignment
• Alnt Name – the vertical alignment name.
• Start Pt – the start point name. Enter manually (if a new point
name is entered, the point is created with the height entered in the Ell ht field or in one of two other ways:
– : select from the map
– : select from the point name list
• The Photo Notes icon opens the Add Photo Notes screen toenter a photo note for the point (if preferred).
• Code – the point code; enter either manually or select a pointcode from the drop-down list. The code of an existing point
cannot be edited. The Attributes List icon opens the Code-

8/10/2019 7010-0944 - SokkiaSSF_rm.pdf
http://slidepdf.com/reader/full/7010-0944-sokkiassfrmpdf 275/623
Vertical Alignments
P/N 7010-0944 7-19
Attributes screen to set the values for the attributes available for
the code selected.
• Ell ht – the point height.• The icon next to the Attributes List icon displays the pop-up
menu containing three items:
– String: toggles the String field. The sign icon also
appears.
– Layer – opens the Select Layer screen (see “On the Select
Layer” on page 6-10).– Note – opens the Note screen. For details, see “The Topo
Menu” on page 9-3.
• Start Sta/Start Chn – the starting station number with distance tothe station, or the starting chain distance, depending on aselection made in the Display screen (for details see “Display” onpage 2-8).
The Vert tab on the Edit Vt Alnt screen (Figure 7-17) displays a list ofvertical alignment elements, the vertical alignment plot, and theending station (or chainage) of each element.
Figure 7-17. Edit Vertical Al ignment Elements
The element list has the following columns for the vertical alignmentelements:

8/10/2019 7010-0944 - SokkiaSSF_rm.pdf
http://slidepdf.com/reader/full/7010-0944-sokkiassfrmpdf 276/623
Editing Roads
Sokkia Spectrum Survey Field Reference Manual7-20
• Element – the icon and name of the element: either vertical grade,
parabola, or arc.
• Length/Arc Radius – depending upon the selection: either the
length of the element or the radius of the circular arc.
• Start Grade, End Grade – the grades of the element, inpercentage, at the starting and ending points. For a Vertical grade element, values are the same.
• Insert – inserts elements selected from a floating menu (Vertical
Grad e and Curve) at the selected location in the list.
• Add – displays a menu of two elements: select to add eitherVertical Grade or Curve.
The Help Icon in the upper-left corner of the screen displays the pop-up menu containing two items:
• Edit Points – opens the Points screen to edit points (see “Edit X-Section Template” on page 7-27).
• Help – accesses the Help files.
Select a vertical alignment element, then tap the Station information
under the element list to briefly display information (Figure 7-18) onthe start and end stations (or chainages) for the selected alignmentelement.
Figure 7-18. Alignment Element Information
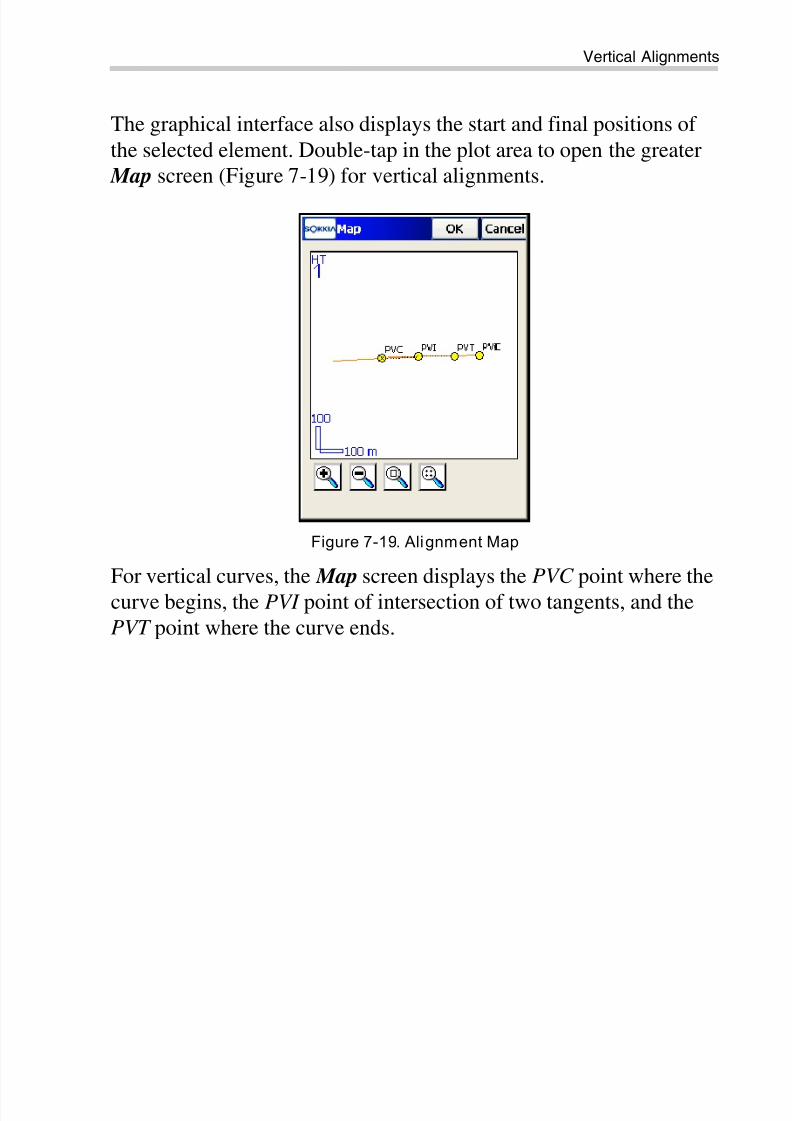
8/10/2019 7010-0944 - SokkiaSSF_rm.pdf
http://slidepdf.com/reader/full/7010-0944-sokkiassfrmpdf 277/623
Vertical Alignments
P/N 7010-0944 7-21
The graphical interface also displays the start and final positions of
the selected element. Double-tap in the plot area to open the greater Map screen (Figure 7-19) for vertical alignments.
Figure 7-19. Alignment Map
For vertical curves, the Map screen displays the PVC point where thecurve begins, the PVI point of intersection of two tangents, and thePVT point where the curve ends.
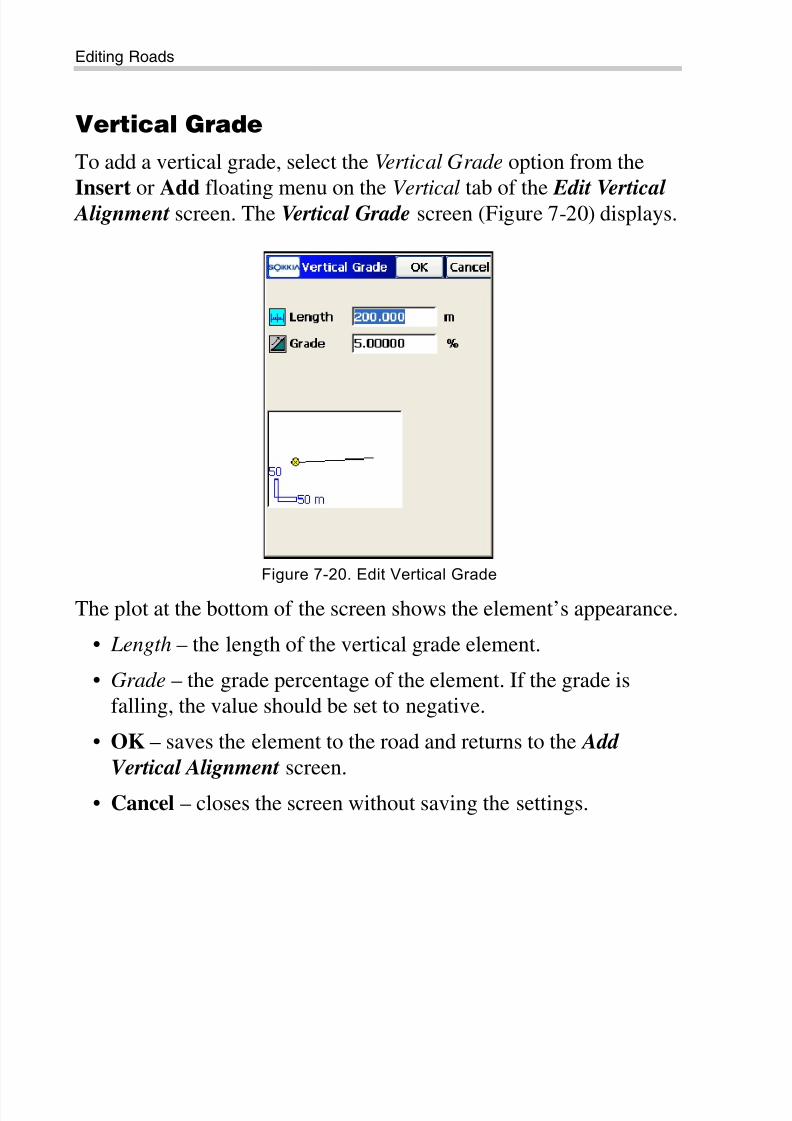
8/10/2019 7010-0944 - SokkiaSSF_rm.pdf
http://slidepdf.com/reader/full/7010-0944-sokkiassfrmpdf 278/623
Editing Roads
Sokkia Spectrum Survey Field Reference Manual7-22
Vertical Grade
To add a vertical grade, select the Vertical Grade option from the
Insert or Add floating menu on the Vertical tab of the Edit Vertical Alignment screen. The Vertical Grade screen (Figure 7-20) displays.
Figure 7-20. Edit Vertical Grade
The plot at the bottom of the screen shows the element’s appearance.
• Length – the length of the vertical grade element.
• Grade – the grade percentage of the element. If the grade isfalling, the value should be set to negative.
• OK – saves the element to the road and returns to the Add
Vertical Alignment screen.
• Cancel – closes the screen without saving the settings.

8/10/2019 7010-0944 - SokkiaSSF_rm.pdf
http://slidepdf.com/reader/full/7010-0944-sokkiassfrmpdf 279/623
Vertical Alignments
P/N 7010-0944 7-23
Edit a Curve
To edit a curve, select the Curve option from the Insert or Add
floating menu on the Vertical tab of the Edit Vertical Alignment screen. The Curve screen (Figure 7-21) displays.
Figure 7-21. Edit Vertical Curve
• Curve Type – selects the type of curve to add, either Circular Arc or Parabola. The plot in the bottom of the screen shows the
element appearance.
• Length / Arc Radius – the radius of the arc or the length of the
parabola element, depending on the type of curve selected.
• End Grade/Start Grade – the percentage of the starting and
ending grades of the element. If the grade is falling, use anegative value.
• OK – saves the element to the road and returns to the Add
Vertical Alignment screen.

8/10/2019 7010-0944 - SokkiaSSF_rm.pdf
http://slidepdf.com/reader/full/7010-0944-sokkiassfrmpdf 280/623
Editing Roads
Sokkia Spectrum Survey Field Reference Manual7-24
Long Sections
For Long Sections vertical alignment types (Figure 7-22), the Start Pt
tab displays only the vertical alignment name.
Figure 7-22. Edit Vertical Alignment Name
The Vert tab on the Edit Vt Alnt screen (Figure 7-23) displays the listof vertical long sections, the vertical alignment plot, and the endingstation (or chainage) at each element.
Figure 7-23. Edit Vertical Alignment Long Sections

8/10/2019 7010-0944 - SokkiaSSF_rm.pdf
http://slidepdf.com/reader/full/7010-0944-sokkiassfrmpdf 281/623
Vertical Alignments
P/N 7010-0944 7-25
The long section list has the following columns (Figure 7-23 on
page 7-24) for vertical long sections:
• Long Section – the name of the element.
• Station – the station distance.
• Elevation – the elevation value on the station.
• VC Length – the vertical curve length is the length of the intervalnear the station, where the alignment has a parabolic shape.
• Insert – opens a blank Long Section screen in which to insert an
element at the selected location in the list (Figure 7-24).
• Add – opens a blank Long Section screen for adding an elementto the end of the list (Figure 7-24).
• Delete – deletes the element from the road.
• Edit – opens a screen with properties of the selected long section.
The Long Sections screen (Figure 7-24) adds a new long section tothe vertical alignment.
Figure 7-24. Long Section
• Station – the station distance from the beginning of the road.
• Elevation – the height at the station.

8/10/2019 7010-0944 - SokkiaSSF_rm.pdf
http://slidepdf.com/reader/full/7010-0944-sokkiassfrmpdf 282/623
Editing Roads
Sokkia Spectrum Survey Field Reference Manual7-26
• Curve Type – selects the type of curve to add, either Parabola or
Circular Arc. The plot at the bottom of the screen shows theelement appearance.
• VC Length or Arc Radius – the length of the parabola at thestation (assuming that the station is located in the middle of theinterval), or the radius of the arc, depending on the type of curve
selected.
• OK – saves the element to the road and returns to the Add
Vertical Alignment screen.
Cross Section Templates
A cross-section template is a template for the creation of a complex
cross-section view of the road. The cross-section template consists ofseveral sets of segments, cut slopes, and fill slopes.
To create a template for a cross-section view of the road, tap the
Templates icon.The X-Sect Templates screen (Figure 7-25) displays a list of the
existing templates in the upper part of the screen and a plot of thehighlighted template in the lower part.
Figure 7-25. X-Sect Templates

8/10/2019 7010-0944 - SokkiaSSF_rm.pdf
http://slidepdf.com/reader/full/7010-0944-sokkiassfrmpdf 283/623
Cross Section Templates
P/N 7010-0944 7-27
• The list contains four columns – Name (the name of the
template), Num Segs (the number of segments), Cut Slope, andFill Slope values.
• Delete – deletes the template from the list.
• Edit – opens the properties of the selected template in the next X-Sect Templates screen (Figure 7-26).
• Add – opens the blank X-Sect Templates screen to enter the
properties for a new template.
• Close – returns to the main screen.
Edit X-Section Template
To edit an existing template, highlight it and tap the Edit button in the X-Sect Templates screen (Figure 7-25 on page 7-26).
The next X-Sect Temp screen (Figure 7-26) displays the parametersof the highlighted template to edit.
Figure 7-26. Edit X-Sect Template
• Name – the name of the template.
• Slope – the cut and fill parameter values (ratio of run values forcut and fill for a unit rise). These values represent the horizontalincrement of the slope for a unit vertical increment.

8/10/2019 7010-0944 - SokkiaSSF_rm.pdf
http://slidepdf.com/reader/full/7010-0944-sokkiassfrmpdf 284/623
Editing Roads
Sokkia Spectrum Survey Field Reference Manual7-28
– Cut : the cut slope is used when the road surface is below the
terrain.
– Fill: the fill slope is used when the road surface is above theterrain.
The X-Sect Temp screen (Figure 7-26 on page 7-27) also contains alist of segments comprising the template and a plot of the template. A
list of segments consists of three columns: Code (the code of thesegment), Hz (the horizontal offset),Vert (the vertical offset).
• Edit – opens the Segment screen (Figure 7-27 on page 7-29) with
the parameters of the highlighted segment.• Insert – opens a blank Segment screen. The inserted segment is
inserted in the list above the currently highlighted segment.
• Add – opens a blank Segment screen. The added segment isattached after the last segment in the list.
• Delete – deletes the segment from the template.
• OK – saves the changes and returns to the X-Sect Templates screen (Figure 7-25 on page 7-26).
• Cancel – closes the screen without saving the settings.
Cross Section Segments
The Segment screen (Figure 7-27 on page 7-29) contains theparameters of the highlighted segment

8/10/2019 7010-0944 - SokkiaSSF_rm.pdf
http://slidepdf.com/reader/full/7010-0944-sokkiassfrmpdf 285/623
Cross Section Sets
P/N 7010-0944 7-29
Figure 7-27. Segment Screen
• Code – the code of the segment. Select the code from the drop-down list or enter a new code.
• Offset – horizontal and vertical offsets. Press the Down/Up/
Grade button to select the type and value of the vertical offset.The “hand” symbol means the function is selectable. Althoughthe value is input as Grade (in percents), the vertical offset isrecalculated to meters (or another selected unit) after pressing the
OK button.
• OK – saves the changes and closes the screen.
Cross Section Sets
To edit cross-section sets in the current job, tap the X-Sections icon.
The X-Sect Set screen (Figure 7-28 on page 7-30) contains a list of
cross -section sets and a general scaled view of the highlighted crosssection set.
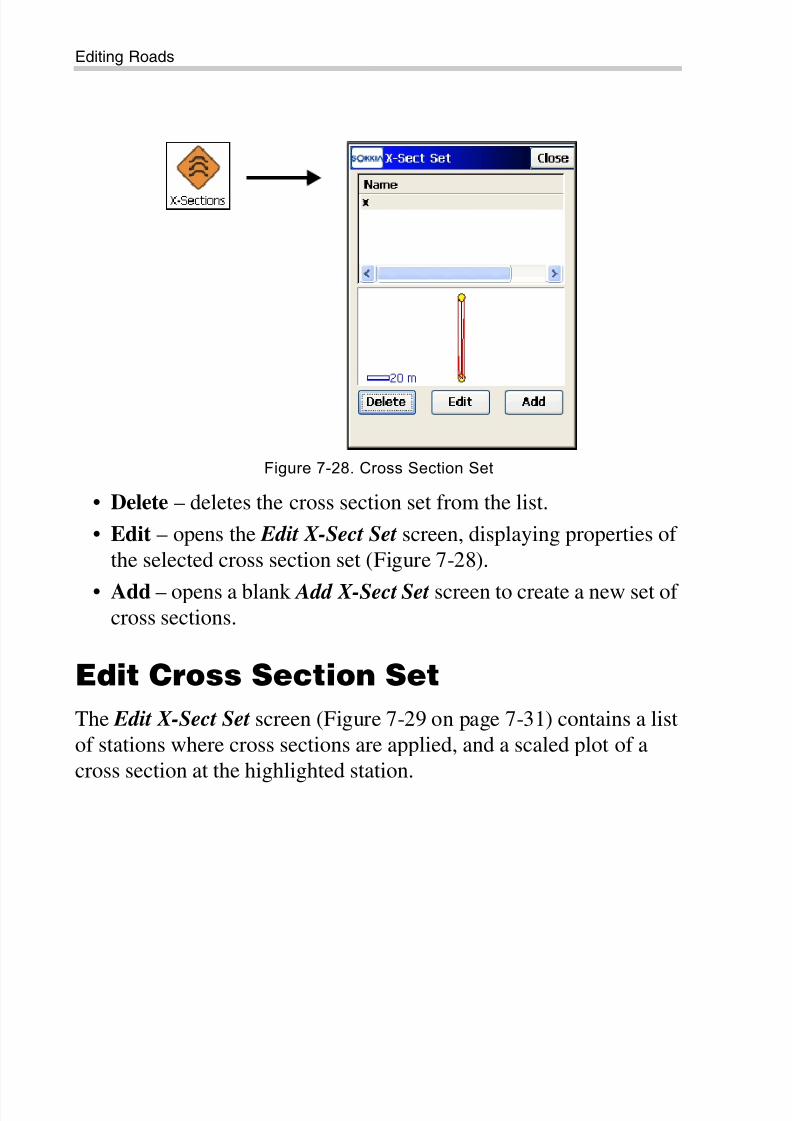
8/10/2019 7010-0944 - SokkiaSSF_rm.pdf
http://slidepdf.com/reader/full/7010-0944-sokkiassfrmpdf 286/623
Editing Roads
Sokkia Spectrum Survey Field Reference Manual7-30
Figure 7-28. Cross Section Set
• Delete – deletes the cross section set from the list.
• Edit – opens the Edit X-Sect Set screen, displaying properties ofthe selected cross section set (Figure 7-28).
• Add – opens a blank Add X-Sect Set screen to create a new set ofcross sections.
Edit Cross Section Set
The Edit X-Sect Set screen (Figure 7-29 on page 7-31) contains a listof stations where cross sections are applied, and a scaled plot of across section at the highlighted station.

8/10/2019 7010-0944 - SokkiaSSF_rm.pdf
http://slidepdf.com/reader/full/7010-0944-sokkiassfrmpdf 287/623
Cross Section Sets
P/N 7010-0944 7-31
Figure 7-29. Edit X-Section Set Parameters
• Name – the name of the cross-section set.
• The list of stations contains the following columns:
– Station: the station where the cross-section is applied.
– Left X-Section/Right X-Section: the names of the cross-section templates for the left and right side of the road crosssection relative to the center line. The left and right side crosssections can be different.
• Delete – deletes the station with the road cross-section from thelist.
• Edit – opens the X-Section screen (Figure 7-30 on page 7-32) to
edit the selected cross section.
• Add – opens a blank X-Section screen.
NOTICE
If two or more cross sections are defined, theintermediate cross sections are calculated using
interpolation.

8/10/2019 7010-0944 - SokkiaSSF_rm.pdf
http://slidepdf.com/reader/full/7010-0944-sokkiassfrmpdf 288/623
Editing Roads
Sokkia Spectrum Survey Field Reference Manual7-32
Cross-Section
The X-Section screen (Figure 7-30) contains parameters of the road
cross-section at a given distance and a plot of the cross-section.
Figure 7-30. Cross Section Parameters
• Station/Chainage – the station where the cross-section is applied,or the distance to this station.
• X-Sections – selects whether the cross-section is created for bothparts of the road or only for the left or right side of the road. Thescreen display changes, depending on the selection.
• Left X-Section/Right X-Section – the cross-section templates forthe left and right side of the road cross-section. These can be
selected only from the existing cross-section templates.• OK – saves the cross-section in the list and returns to the Add
Road screen.
The Help Icon in the upper-left corner of the screen displays the pop-
up menu containing two items:
• Edit X-Sect Templates – opens the X-Sect Templates screen toedit cross section templates (see “Edit X-Section Template” on
page 7-27).
• Help – accesses the Help files.

8/10/2019 7010-0944 - SokkiaSSF_rm.pdf
http://slidepdf.com/reader/full/7010-0944-sokkiassfrmpdf 289/623
Calculate Road Points
P/N 7010-0944 7-33
Calculate Road Points
To calculate road points, select the Calculate Road Points option
from the Help pop-up menu on the Edit Road screen (Figure 7-3 onpage 7-4).The Calculate Road Points screen (Figure 7-31) generates pointsalong to the right and to the left of the center line of the road, alongthe entire length.
Figure 7-31. Calculate Road Points
• Points to Generate – defines the points to generate, either center
line points, the points to the right of the center line, and/or thepoints to the left of the center line. Also, if you want to include
transition points, place a check mark in the corresponding fields,and select a prefix/suffix for them, if necessary, in the Prefix/
Suffix field drop-down list below the Points to Generate section.
• Station Interval/Chainage Interv – sets the interval between the
generated points. By default, it is the Station (or Chain) Intervalset in the Start Pt tab on the Roads screen.
• Next – opens the appropriate screen, depending on the selection
made in the Points to Generate panel. The last screen contains theCalc button to calculate the road points along the line.

8/10/2019 7010-0944 - SokkiaSSF_rm.pdf
http://slidepdf.com/reader/full/7010-0944-sokkiassfrmpdf 290/623
Editing Roads
Sokkia Spectrum Survey Field Reference Manual7-34
Centerline Points Parameters
The Centerline Points Params screen (Figure 7-32) displays the
parameters of points to be computed along the center line.
Figure 7-32. Centerline Points Parameters
• First Point – the name of the first point. The photo notes
icon opens the Add Photo Notes screen to enter a photo note forthe point.
• Code – the code of the points being generated; either enter
manually or select from the drop-down list. The Attributes List
icon accesses the attributes of the chosen code and opens the
Code-Attributes screen to set the values for the attributes
available for the selected code.
• The icon next to the Attributes List bitmap displays the pop-up menu containing three items:
– String: toggles on the String field. Also, the sign appears.
– Layer : opens the Select Layer screen (see “On the Select
Layer” on page 6-10).– Note: opens the Note screen. For details, see “The Topo
Menu” on page 9-3.
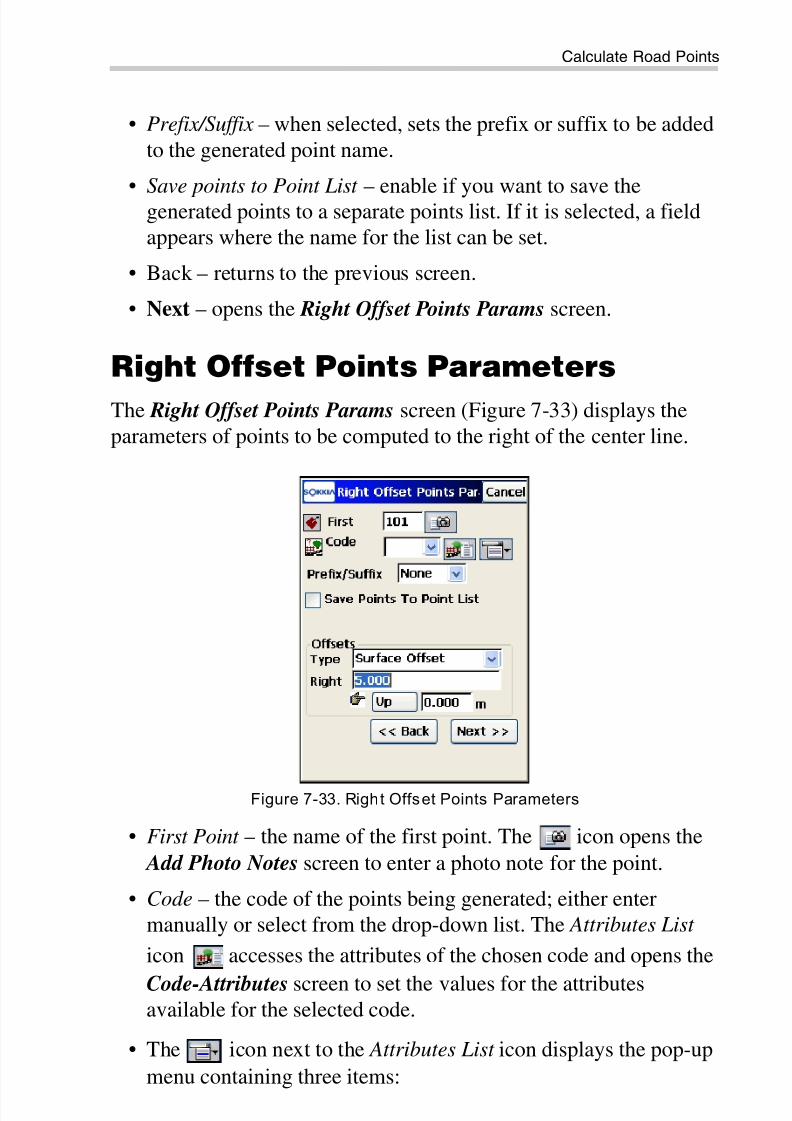
8/10/2019 7010-0944 - SokkiaSSF_rm.pdf
http://slidepdf.com/reader/full/7010-0944-sokkiassfrmpdf 291/623
Calculate Road Points
P/N 7010-0944 7-35
• Prefix/Suffix – when selected, sets the prefix or suffix to be added
to the generated point name.
• Save points to Point List – enable if you want to save thegenerated points to a separate points list. If it is selected, a fieldappears where the name for the list can be set.
• Back – returns to the previous screen.
• Next – opens the Right Offset Points Params screen.
Right Offset Points Parameters
The Right Offset Points Params screen (Figure 7-33) displays the
parameters of points to be computed to the right of the center line.
Figure 7-33. Right Offset Points Parameters
• First Point – the name of the first point. The icon opens the
Add Photo Notes screen to enter a photo note for the point.
• Code – the code of the points being generated; either entermanually or select from the drop-down list. The Attributes List
icon accesses the attributes of the chosen code and opens the
Code-Attributes screen to set the values for the attributesavailable for the selected code.
• The icon next to the Attributes List icon displays the pop-up
menu containing three items:

8/10/2019 7010-0944 - SokkiaSSF_rm.pdf
http://slidepdf.com/reader/full/7010-0944-sokkiassfrmpdf 292/623
Editing Roads
Sokkia Spectrum Survey Field Reference Manual7-36
– String: toggles on the String field. The sign also appears.
– Layer : opens the Select Layer screen (see “On the Select
Layer” on page 6-10).
– Note: opens the Note screen. For details, see “The Topo
Menu” on page 9-3.
• Prefix/Suffix – when selected, sets the prefix or suffix to be addedto the generated point name.
• Save points to Point List – enable (if necessary) to save the
generated points to a separate points list. When check marked, afield appears where the name for the list can be set.
• Offsets – set the offset of the point from the center line along twodimensions: horizontal (the Right field) and vertical (the Up/
Down field) relative to the surface (Surface Offset type) or to thehorizontal line (Flat Offset type).
• Back – returns to the previous screen.
• Next – opens the Left Offset Points Params screen (Figure 7-34on page 7-37).
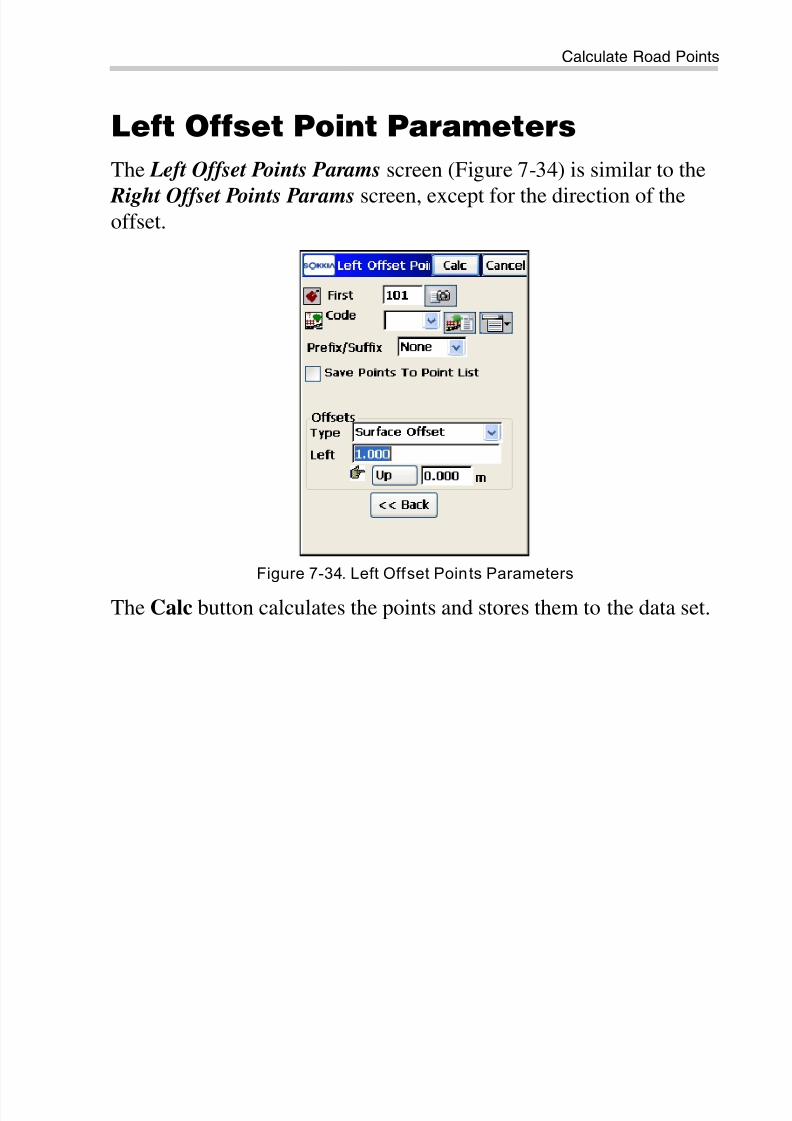
8/10/2019 7010-0944 - SokkiaSSF_rm.pdf
http://slidepdf.com/reader/full/7010-0944-sokkiassfrmpdf 293/623

8/10/2019 7010-0944 - SokkiaSSF_rm.pdf
http://slidepdf.com/reader/full/7010-0944-sokkiassfrmpdf 294/623
Editing Roads
Sokkia Spectrum Survey Field Reference Manual
Notes:
7-38

8/10/2019 7010-0944 - SokkiaSSF_rm.pdf
http://slidepdf.com/reader/full/7010-0944-sokkiassfrmpdf 295/623
P/N 7010-0944
Chapter 8
8-1
Setting up GPSTo set up a GPS survey, tap the Setup GPS icon in the main menu.The Setup GPS menu (Figure 8-1) includes options to:
1. Start a base station or static occupation
2. Perform a localization of the current job3. View current status information on positioning
4. Perform an initialization at a known point
5. Perform an initialization of mmGPS (only for mmGPS+ aidedRTK)
Figure 8-1. Setup GPS Menu
The Help icon opens a pop-up menu giving access to the help
files, module activation codes, port data logging, changing menu
interface, and information about the Sokkia SSF used (for details see“Help Icon’s Pop-up Menu” on page 1-9).

8/10/2019 7010-0944 - SokkiaSSF_rm.pdf
http://slidepdf.com/reader/full/7010-0944-sokkiassfrmpdf 296/623
Setting up GPS
Sokkia Spectrum Survey Field Reference Manual8-2
Starting the Base
To start a Base, tap the Start Base icon.
The Start Base screen contains information about the Base receiverand can be used for the Base Receiver setting in an RTK survey.
Figure 8-2. Start Base
• Point – select the name of the point of the Base receiver location
from a map or list icon, or enter manually. The photo
note icon opens the Add Photo Notes screen to enter a photonote for the point.
• Code – the code of the point; select from the list or enter
manually. Also, the attributes can be selected with the help of the Attributes List icon . The icon next to the Attributes List
icon displays the list of additional features: String, Layer and Note. For details, see “The Topo Menu” on page 9-3.
• Ant Ht – enter the antenna height and type of measurement; selecteither vertical or slant ).
• Local (m) – for RTK mode, the field for the coordinates of the
antenna in the selected coordinate system. Changes its namebased on the chosen value on the Coord System screen; that is,WGS84 or Local (see “Coordinate System” on page 2-5), the
Display screen (see “Display” on page 2-8), and the selecteddistance units (see “Units” on page 2-6).

8/10/2019 7010-0944 - SokkiaSSF_rm.pdf
http://slidepdf.com/reader/full/7010-0944-sokkiassfrmpdf 297/623
Starting the Base
P/N 7010-0944 8-3
• Auto Pos (for RTK mode) – measures the position of the current
point. Once pressed, the button becomes a Stop button; press tostop position averaging. The average of the coordinates displays
and the Pos field appears with the number of measurements usedfor averaging.
• Duration and Remaining Time (for PP Kinematic mode) –displays the time passed and the time that remains since the
beginning of the survey.
• Start Base – sets the receiver as a Base transmitting data.
The Help icon at the upper-left corner displays the pop-up menucontaining the following items, depending on the survey type andconfiguration chosen:
• Status – opens the Status screen (see “GPS+ Survey Status” onpage 8-12).
• String – toggles on the String field to enter a string for the code.
Also, the sign appears.
• Base Antenna Setup – opens the Antenna Setup screen to set theantenna for the current survey.
• Config Radio (for RTK mode) – opens the Configure Radio screen. For details, see “Configure Radio” on page 8-26.
• Config RE-S1 Repeater – opens the Configure Radio screen tosetup the RE-S1 radio as a repeater (see “Configure RE-S1
Repeater” on page 8-31).• Multi Base (for RTK survey type) – opens the Multi Base screen
(Figure 8-4 on page 8-5) to set the multi base mode. This mode
allows the base station to use a single frequency for transmittingdata. Setting a transmission delay for each station preventssignals from colliding.
• Grid to Ground – opens the Grid to Ground Params screen (see
“Grid to Ground” on page 8-5).

8/10/2019 7010-0944 - SokkiaSSF_rm.pdf
http://slidepdf.com/reader/full/7010-0944-sokkiassfrmpdf 298/623
Setting up GPS
Sokkia Spectrum Survey Field Reference Manual8-4
Correct the Base
If the Base starts in autonomous mode, and an observed Topo point
has known coordinates stored in the job, you can correct the baseposition. Use the Duplicate Points screen in this case (Figure 8-3).
Figure 8-3. Dupl icate Point
• Overwrite – overwrites the existing point.
• Rename – if enabled, the point is renamed. The new name isnoted in the field and is the point with observed coordinates.
• Store As Check Point? – if enabled, the observed point is stored asa check point of the existing point.
• Use in Weighted Average – available if the Store As Check Point radio button is selected. The OK button opens the Weighted
Average screen (see “Weighted Average” on page 6-14).
• Correct Base – if enabled, the existing coordinates of theobserved point are not replaced by the coordinates of theobserved point. Instead, the known coordinates of this point areused to correct the Base coordinates. After either closing the Topo screen or moving to another tab, recomputations are performed
and the coordinates of all points are updated using the new Basecoordinates. For the Correct Base option to work properly, the
coordinate type selected in Display (see “Customizing DataDisplay” on page 3-89) must be the same as for the knowncoordinates of the observed Topo point.

8/10/2019 7010-0944 - SokkiaSSF_rm.pdf
http://slidepdf.com/reader/full/7010-0944-sokkiassfrmpdf 299/623
Starting the Base
P/N 7010-0944 8-5
Multi Base
The Multi Base function in Sokkia SSF is implemented using Time
Division Multiple Access (TDMA) mode of transmission. This meansthat one Base can transmit at the beginning of the second and anotherBase can transmit a half second later on the same frequency. TheRover can recognize the two separate data streams.
The Multi Base screen (Figure 8-4) sets parameters for Base Stations.
• Base Station ID – the ID of the current Base Station.
• Transmit Delay – a signal transmission delay for the current Base.
• Use Multi Base – when check marked, enables multi base modefor surveying. On the Status screen on the Rover side, the Multi-
Base tab appears to select the Base.
Figure 8-4. Multi Base
NOTICE
All transmitters (Base receivers) must beconfigured to transmit at the same frequency and
must transmit CMR+ format corrections. The Rover
receiver must be configured to receive only CMR+messages.

8/10/2019 7010-0944 - SokkiaSSF_rm.pdf
http://slidepdf.com/reader/full/7010-0944-sokkiassfrmpdf 300/623
Setting up GPS
Sokkia Spectrum Survey Field Reference Manual8-6
Grid to Ground
The Grid to Ground Params screen (Figure 8-5) displays the Grid to
Ground (GG) system (in the defined coordinate system) for theOrigin Point option. This screen, available on the Start Base screen,provides a faster method for setting the calculated value of the Scale
Factor that will be applied to the job.
Figure 8-5. Grid to Ground from Start Base
For details, see “From Grid-to-Ground/Ground-to-GridTransformation” on page 3-78.
Starting Static OccupationTo start a Static Occupation, tap the Static Occupation icon.
The Static Occupation screen contains information about the pointoccupied for static observations and starts logging data in PP Staticsurvey (Figure 8-6 on page 8-7).
• Point – selects the name of the point of the Base receiver location
from a map or list icon, or entered manually. The photo note icon opens the Add Photo Notes screen to enter a photonote for the point.

8/10/2019 7010-0944 - SokkiaSSF_rm.pdf
http://slidepdf.com/reader/full/7010-0944-sokkiassfrmpdf 301/623
Starting Static Occupation
P/N 7010-0944 8-7
• Code – the code of the point; select from the list or enter
manually. Also, the attributes can be selected with the help of the
Attributes List icon .
• The icon next to the Attributes List icon displays the list ofadditional features: String, Layer, and Note. For details, see “The
Topo Menu” on page 9-3.
• Ant Ht – the antenna height and type of measurement (vertical orslant).
Figure 8-6. Static Occupation
• Duration – displays the time passed since the starting of theoccupation.
• Start Occ/Stop Occ – starts the survey in static occupationmode. When pressed, it changes to Stop Occ. The icon
displays the status of the log file. If the file is opened, the icon
changes to .
• Settings – opens the Base Receiver screen to set loggingparameters. (For details, see “Base Receiver” on page 3-7.)
The Help icon at the upper-left corner displays the pop-up menucontaining the following items, depending on the survey type andconfiguration chosen:
• Status – opens the Status screen (see “GPS+ Survey Status” onpage 8-12).

8/10/2019 7010-0944 - SokkiaSSF_rm.pdf
http://slidepdf.com/reader/full/7010-0944-sokkiassfrmpdf 302/623
Setting up GPS
Sokkia Spectrum Survey Field Reference Manual8-8
• Base Antenna Setup – opens the Antenna Setup screen to set the
antenna for the current survey.
• Help – accesses the Help files.
Localization
To set up a survey with localization, tap the Localization button.
Localization is used for transforming coordinates between a local
system and a WGS84 system. The basic approach of calculating the
mathematical conversion is to provide pairs of coordinates for eachpoint used for localization in the job.
The Localization screen (Figure 8-7) contains a list of points used forlocalization, called control points. Their coordinates are known inboth systems: Local and WGS84. Each point has a level of reliabilityspecified with the values of the residuals along the horizontal and thevertical axes and the Control parameters, that shows the status of the
point. The horizontal and vertical use of any of the control points canbe changed by selecting the line and then tapping on the header of theH Control or V Control. This toggles the display between “used” and“not used”.
Figure 8-7. Localization
• The Help icon at the upper-left corner displays a pop-up menu
containing two items:

8/10/2019 7010-0944 - SokkiaSSF_rm.pdf
http://slidepdf.com/reader/full/7010-0944-sokkiassfrmpdf 303/623
Localization
P/N 7010-0944 8-9
– Config Radio: opens the Configure Radio screen.
– Help: accesses the Help files.
• Keep scale 1.000 – preserves localization from a scaletransformation (if enabled).
• Details – opens the Localization Results screen.
• Remove – removes the highlighted points.
• Edit – creates localization parameters, using the localizationpoints.
• Add – opens the Add Point screen (Figure 8-8 on page 8-9) toadd a point to use in localization.
• Settings – opens the Survey parameters screen. For details, see“Survey Parameters” on page 3-41.
NOTICE
The more localization points used, the more precise
the localization is. The localization is updated(recomputed) every time a new point (local andWGS84 coordinates) is added to the localization listof points. The new parameters of the localizationare available through the Details button.

8/10/2019 7010-0944 - SokkiaSSF_rm.pdf
http://slidepdf.com/reader/full/7010-0944-sokkiassfrmpdf 304/623
Setting up GPS
Sokkia Spectrum Survey Field Reference Manual8-10
Add Localization Point
The Add Point screen (Figure 8-8) contains the coordinates of the
control points.
Figure 8-8. Add Localization Point
• The Local Point panel contains the name and coordinates of thepoint in the local coordinate system.
– Point : sets the name of the control point; either enter a point
name manually, select a point from the map icon, or
from the list icon.
– Use Horizontal: check and enable if the point should be used
for horizontal localization.
– Use Vertical: check and enable if the point should be used forvertical localization.
• The WGS84 Point panel contains the name and global coordinates
of the control points.
– Point : sets the name of the control point; either enter a point
name manually, select a point from the map, or from the list.
– Code: sets the code of the control point. Can be enteredmanually or chosen from the drop-down list.
• – the Attributes List icon, opens the Code-Attributes screen
to set the values for the attributes available for the code selected.

8/10/2019 7010-0944 - SokkiaSSF_rm.pdf
http://slidepdf.com/reader/full/7010-0944-sokkiassfrmpdf 305/623
Localization
P/N 7010-0944 8-11
• The icon next to the Attributes List icon displays the pop-up
menu containing three items:
– Layer – opens the Select Layer screen (see “On the SelectLayer” on page 6-10).
– Note – opens the Note screen. For details, see “The TopoMenu” on page 9-3.
• Start Meas – sets the control point to the current location. The
Epoch Count field shows the number of the accepted epochs. Theparameters of the logging are set through the Survey Parameters
screen. If the point name already exists, the Point Check notification screen displays, which prompts you to overwrite,rename, or store the point as a check point.
• OK – saves the point and opens the Localization screen todisplay a new point.
Localization Details
The Localization Details screen (Figure 8-9 on page 8-11) containsthe Results and Map tabs.
• The Results tab (Figure 8-9 on page 8-11) displays calculatedparameters of the localization: global coordinates, correspondinglocal coordinates, scale parameter, the azimuth, and plane slopeangles (deflections) corresponding to north and east directions.
Figure 8-9. Localization Results

8/10/2019 7010-0944 - SokkiaSSF_rm.pdf
http://slidepdf.com/reader/full/7010-0944-sokkiassfrmpdf 306/623
Setting up GPS
Sokkia Spectrum Survey Field Reference Manual8-12
• The Map tab (Figure 8-10) displays the job graphically with the
localization points marked by blue triangles.
Figure 8-10. Localization Map
After editing coordinates of a localization point, a confirmationmessage displays (Figure 8-11 on page 8-12) to select whether to
recompute the localization or not.
Figure 8-11. Recompute Localization
GPS+ Survey Status
To check the status of a GPS+ survey, tap the Status icon. The Status screen displays (Figure 8-12 on page 8-13). The Status screen

8/10/2019 7010-0944 - SokkiaSSF_rm.pdf
http://slidepdf.com/reader/full/7010-0944-sokkiassfrmpdf 307/623
GPS+ Survey Status
P/N 7010-0944 8-13
contains information about the current position of the receiver, RTK
status, and the satellite constellation.
Position
The Position tab displays the following information:
Figure 8-12. Status – Posit ion Tab
• Total number of available satellites. The lock icon signifies thenumber of the satellites tracked, the star icon shows the numberof satellites used in position determination.
• For mmGPS, the Position tab displays a mmGPS icon . This
icon displays when the receiver calculates mmGPS heights.
• UTC – the current UTC time.
• The type of the position calculation method – Autonomous,Fixed, Float, Code Differential.
• WGS84 – the coordinates of the antenna ( Local(m)) in theselected coordinate system; this field changes its name based onthe chosen value in the Coordinate System screen (see
“Coordinate System” on page 2-5), Display screen (see “Display” on page 2-8), and the selected distance units (see “Units” on
page 2-6
• PDOP – the PDOP value. A factor depending solely on satellitegeometry describing how the uncertainty in the coordinates
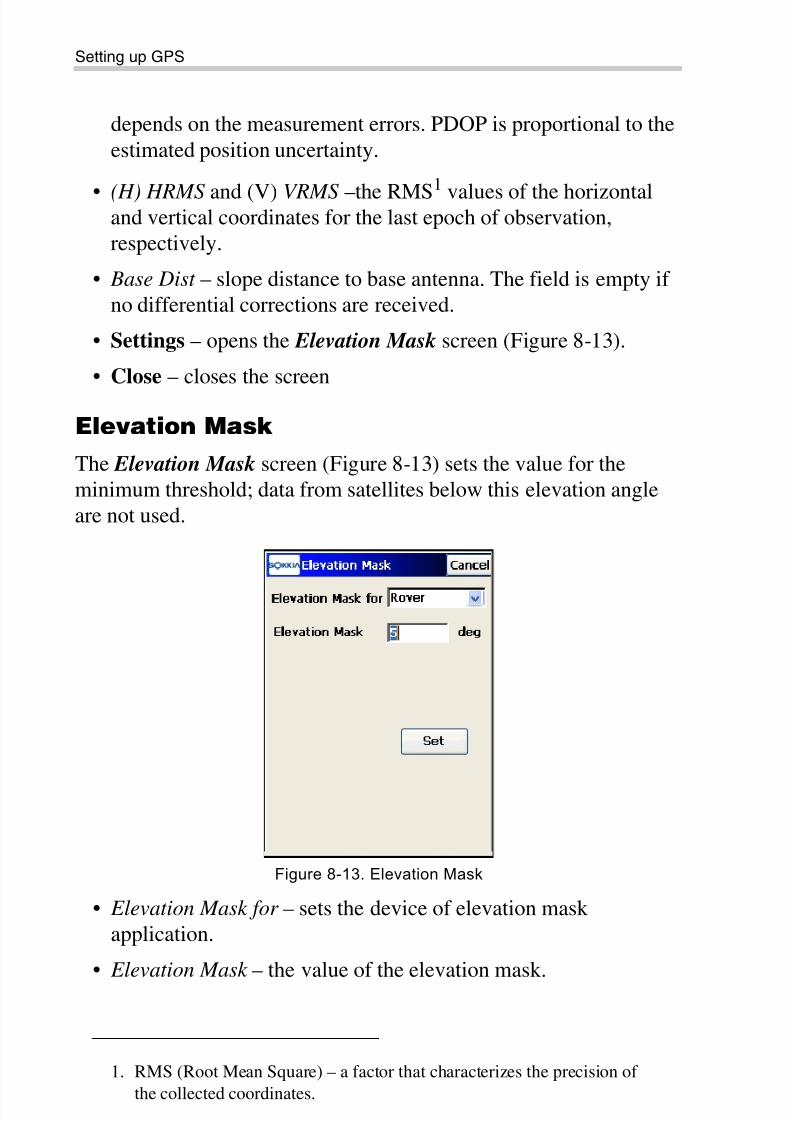
8/10/2019 7010-0944 - SokkiaSSF_rm.pdf
http://slidepdf.com/reader/full/7010-0944-sokkiassfrmpdf 308/623
Setting up GPS
Sokkia Spectrum Survey Field Reference Manual8-14
depends on the measurement errors. PDOP is proportional to the
estimated position uncertainty.
• (H) HRMS and (V) VRMS –the RMS1
values of the horizontaland vertical coordinates for the last epoch of observation,respectively.
• Base Dist – slope distance to base antenna. The field is empty ifno differential corrections are received.
• Settings – opens the Elevation Mask screen (Figure 8-13).
• Close – closes the screen
Elevation Mask
The Elevation Mask screen (Figure 8-13) sets the value for theminimum threshold; data from satellites below this elevation angleare not used.
Figure 8-13. Elevation Mask
• Elevation Mask for – sets the device of elevation maskapplication.
• Elevation Mask – the value of the elevation mask.
1. RMS (Root Mean Square) – a factor that characterizes the precision of
the collected coordinates.

8/10/2019 7010-0944 - SokkiaSSF_rm.pdf
http://slidepdf.com/reader/full/7010-0944-sokkiassfrmpdf 309/623
GPS+ Survey Status
P/N 7010-0944 8-15
• Set – sends the current elevation mask to the base or rover
receiver as selected above.
System
The System tab (Figure 8-14) displays the information about thecurrent state of RTK measurements.
Figure 8-14. Status – System
• Position Type – the type of the position calculation method:
Autonomous, Fixed , Float , or Code Differential.
• Common Sats – the number of satellites common to the Base and
Rover used in RTK solution.
• Initialized Sats – the number of satellites contributing to thesolution.
• Radio Link – a check sum reading from the radio as the Basegenerates packets. 100% means all packets have been received.
• RTK - Age(sec) – how much delay is seen between the marker of
the last RTK message received from the Base and the epochbeing solved at the Rover.
• Receiver Memory – the remaining memory of the receiver.
• Receiver Power – the current receiver power value.
• Controller Memory – the available memory in the controller.

8/10/2019 7010-0944 - SokkiaSSF_rm.pdf
http://slidepdf.com/reader/full/7010-0944-sokkiassfrmpdf 310/623
Setting up GPS
Sokkia Spectrum Survey Field Reference Manual8-16
• Controller Power – the current controller power value.
Log HistoryFor PP enabled RTK, PP Kinematic and PP DGPS, when file loggingstarts, the Status screen (Figure 8-15) also displays the Log History tab.
Figure 8-15. Status – Log History
The Log History tab graphically displays the usage of satellites overtime. The field is divided into 5-minute portions along dotted lineswith the starting time and each new hour marked.
Multi BaseIf the Rover receives CMR+ corrections from more than one Base, anadditional tab called Multi Base appears in the Status screen on theRover side. Muti Base mode is set in the Start Base screen(Figure 8-4 on page 8-5).

8/10/2019 7010-0944 - SokkiaSSF_rm.pdf
http://slidepdf.com/reader/full/7010-0944-sokkiassfrmpdf 311/623
GPS+ Survey Status
P/N 7010-0944 8-17
The Multi Base tab (Figure 8-16 on page 8-17) displays a list of the
Base Stations with their parameters (age, link quality, type, and soforth). Check mark the desired Base to use its corrections.
Figure 8-16. Status – Multi Base Tab
NOTICE
Currently, Sokkia SSF supports processing RTKbaselines from one base at a time. If the receiverswitches base stations when recording data, Sokkia
SSF warns the user.

8/10/2019 7010-0944 - SokkiaSSF_rm.pdf
http://slidepdf.com/reader/full/7010-0944-sokkiassfrmpdf 312/623
Setting up GPS
Sokkia Spectrum Survey Field Reference Manual8-18
Position Plots
The Plots tab (Figure 8-17) displays the current receiver position.
Figure 8-17. Status – Scatter Plots
Table 8-1 lists and describes the plot icons for the current positionreceiver.
Table 8-1. Plot Icons/Current Receiver Posi tion
Plot Icons Receiver Position Description
Zooms the plot inward.
Zooms the plot outward.
Switches the vertical position plot to the horizontal one.
Switches the horizontal position plot to the vertical one.
Opens the Properties screen (Figure 8-18) from which to
set graphical features for the scatter plots.
Vertical position plot
Horizontal position plot

8/10/2019 7010-0944 - SokkiaSSF_rm.pdf
http://slidepdf.com/reader/full/7010-0944-sokkiassfrmpdf 313/623
GPS+ Survey Status
P/N 7010-0944 8-19
Properties
On the Properties screen, you can set graphical features for scatter
plots (Figure 8-18).
Figure 8-18. Scatter Plot Properties
On the Properties screen (Figure 8-18 on page 8-18) for the verticalposition plot , enter the duration in seconds for the time axis. (Time
Window (secs)).
On the Properties screen (Figure 8-18 on page 8-18) for the
horizontal position plot, enter the following parameters:
• Show Grid – if enabled, displays the local coordinate axes.
• Auto Zoom – if enabled, automatically scales the horizontalposition plot to fit into the screen.
Vertical position plot
Horizontal position plot

8/10/2019 7010-0944 - SokkiaSSF_rm.pdf
http://slidepdf.com/reader/full/7010-0944-sokkiassfrmpdf 314/623
Setting up GPS
Sokkia Spectrum Survey Field Reference Manual8-20
Satellites
The SVs tab of the Status screen (Figure 8-19) displays the graphical
position of the satellites on the sky.
Figure 8-19. Status – SVs Plot
• Show GPS – shows/hides the GPS satellites images.
• Show GLNS – shows/hides the GLONASS satellite images.
GLONASS satellites are marked with a “+” sign.
NOTICE
The absence of “wings” on the satellite image
means that for some reason, the signal from thissatellite is not used in the positioning (for example,
below elevation cutoff).

8/10/2019 7010-0944 - SokkiaSSF_rm.pdf
http://slidepdf.com/reader/full/7010-0944-sokkiassfrmpdf 315/623
GPS+ Survey Status
P/N 7010-0944 8-21
• SNR – toggles the appearance of the screen to a table displaying
the signal-to-noise ratio of each of the satellites (Figure 8-20).
Figure 8-20. Status – SVs SNR
• List – toggles to the table (Figure 8-21) that displays the satelliteparameters.
Figure 8-21. Status – SVs List
– PRN : shows the number of the satellite.
– H/U : shows whether signal is healthy or unhealthy.
– EL: shows the elevation angle of the satellite.
– AZ : shows the azimuth of the satellite.

8/10/2019 7010-0944 - SokkiaSSF_rm.pdf
http://slidepdf.com/reader/full/7010-0944-sokkiassfrmpdf 316/623
Setting up GPS
Sokkia Spectrum Survey Field Reference Manual8-22
– SNR1: shows the L1 signal to noise ratio.
– SNR2: shows the L2 signal to noise ratio.
– L2C : shows the L2C signal to noise ratio.
– USED: shows whether a satellite is used in positioncomputation. The user can select whether a satellite should beused or not by selecting the corresponding row for thesatellite in the list and clicking on the USED column header.
This will toggle the use of the satellite.
• Back – return to the sky plot view (Figure 8-20 on page 8-20).
• Close – closes the screen.
Help Icon Options
The Help icon in the upper-left corner of the Status screen
displays a pop-up menu which varies depending on the configurationtype used:
• Rover Antenna Setup – opens the Antenna Setup Screen to set theantenna for the survey.
• Config OmniSTAR – available if OmniStar is configured; opensthe OmniSTAR screen to setup the OmniSTAR service (see“Configure OmniSTAR” on page 8-22).
• Config Beacon – available if Beacon is configured; opens the
Beacon screen to setup the Beacon service (see “ConfigureBeacon” on page 8-24).
• Config Radio – opens the Configure Radio screen to setup theradio (see “Configure Radio” on page 8-26). The option varies
depending on the radio selected for the rover (see “ConfigureRadio” on page 8-26). It can be: Config Radio, Config CDMA,
Config CDPD, Config GSM or Config UHF .
• Config RE-S1 Repeater – available if RE-S1 is configured as arepeater; opens the Configure Radio screen to setup the RE-S1repeater (see “Configure RE-S1 Repeater” on page 8-31).
• Reset RTK or Reset DGPS – reinitializes the receiver.
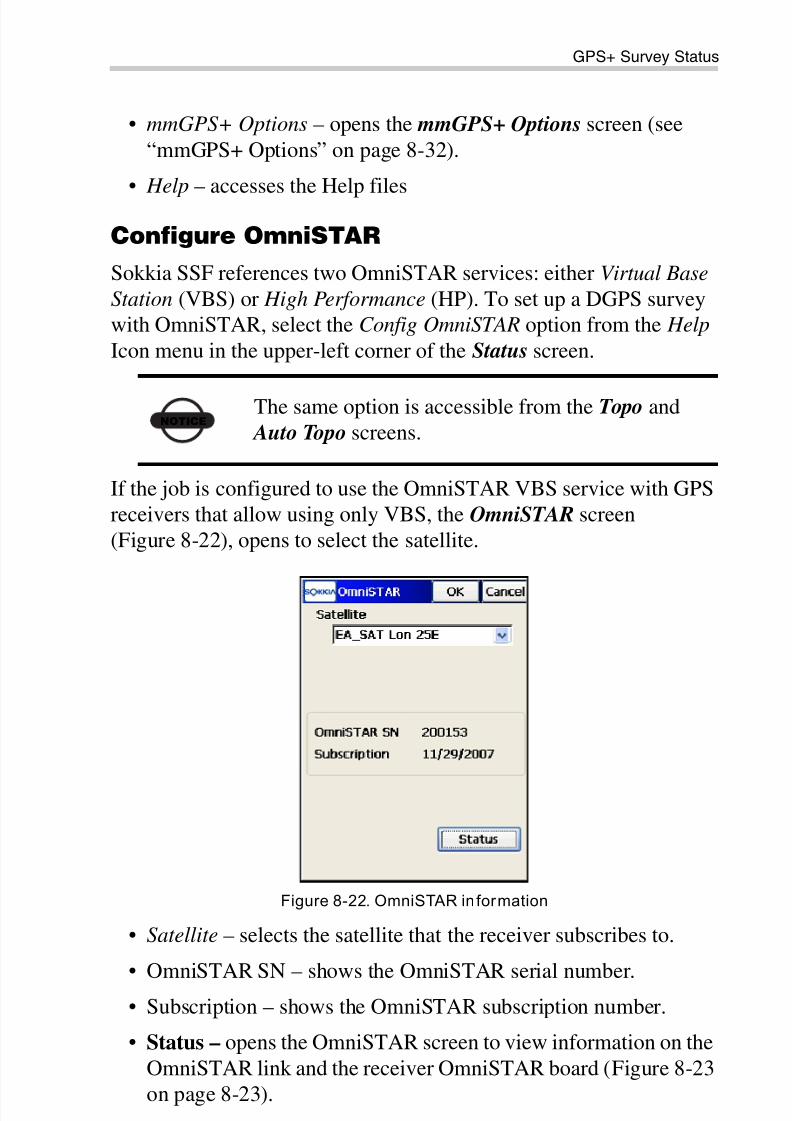
8/10/2019 7010-0944 - SokkiaSSF_rm.pdf
http://slidepdf.com/reader/full/7010-0944-sokkiassfrmpdf 317/623
GPS+ Survey Status
P/N 7010-0944 8-23
• mmGPS+ Options – opens the mmGPS+ Options screen (see
“mmGPS+ Options” on page 8-32).
• Help – accesses the Help files
Configure OmniSTAR
Sokkia SSF references two OmniSTAR services: either Virtual Base
Station (VBS) or High Performance (HP). To set up a DGPS surveywith OmniSTAR, select the Config OmniSTAR option from the Help
Icon menu in the upper-left corner of the Status screen.
If the job is configured to use the OmniSTAR VBS service with GPSreceivers that allow using only VBS, the OmniSTAR screen(Figure 8-22), opens to select the satellite.
Figure 8-22. OmniSTAR in formation
• Satellite – selects the satellite that the receiver subscribes to.
• OmniSTAR SN – shows the OmniSTAR serial number.• Subscription – shows the OmniSTAR subscription number.
• Status – opens the OmniSTAR screen to view information on the
OmniSTAR link and the receiver OmniSTAR board (Figure 8-23on page 8-23).
NOTICE
The same option is accessible from the Topo and
Auto Topo screens.

8/10/2019 7010-0944 - SokkiaSSF_rm.pdf
http://slidepdf.com/reader/full/7010-0944-sokkiassfrmpdf 318/623
Setting up GPS
Sokkia Spectrum Survey Field Reference Manual8-24
If the job is configured to use the OmniSTAR service with MAP-HP
receivers, the OmniSTAR screen begins to display the status ofOmniSTAR service directly after selecting the Config OmniSTAR
option. Wait for some time to get the information shown.
Figure 8-23. OmniSTAR HP Status
• Satellite – select an OmniSTAR satellite.
• Set Satellite connects to the selected satellite and begins loggingdata from this satellite.
The System tab will display (Figure 8-24) first DGPS VBS positiontype and then, HP DGPS solution.
Figure 8-24. HP DGPS
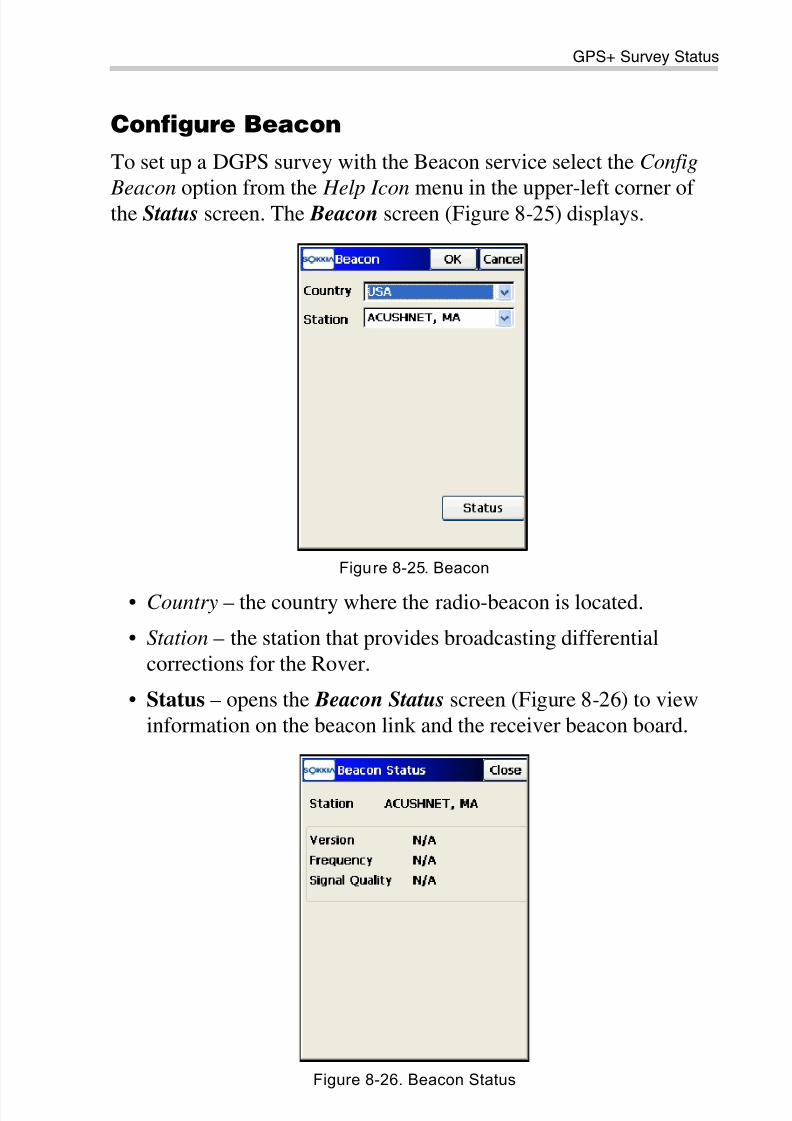
8/10/2019 7010-0944 - SokkiaSSF_rm.pdf
http://slidepdf.com/reader/full/7010-0944-sokkiassfrmpdf 319/623
GPS+ Survey Status
P/N 7010-0944 8-25
Configure Beacon
To set up a DGPS survey with the Beacon service select the Config
Beacon option from the Help Icon menu in the upper-left corner ofthe Status screen. The Beacon screen (Figure 8-25) displays.
Figure 8-25. Beacon
• Country – the country where the radio-beacon is located.
• Station – the station that provides broadcasting differentialcorrections for the Rover.
• Status – opens the Beacon Status screen (Figure 8-26) to viewinformation on the beacon link and the receiver beacon board.
Figure 8-26. Beacon Status

8/10/2019 7010-0944 - SokkiaSSF_rm.pdf
http://slidepdf.com/reader/full/7010-0944-sokkiassfrmpdf 320/623
Setting up GPS
Sokkia Spectrum Survey Field Reference Manual8-26
BR-1 Configuration
When a survey is configured to use the differential corrections
receiver BR-1 (see “Config: Beacon” on page 3-34), the Beacon screen (Figure 8-27) displays to set up the BR-1 radio.
Figure 8-27. Beacon BR-1 Setup
• Config – sends the appropriate configuration command for BR-1radio channels (Figure 8-28):
– When Automatic Scan mode is on, all four channels of theBR-1 automatically scans frequencies until one of thechannels find the available Beacon Signal. After the signal isfound, the channel maintains this frequency.
Figure 8-28. BR-1 Configuration
8/10/2019 7010-0944 - SokkiaSSF_rm.pdf
http://slidepdf.com/reader/full/7010-0944-sokkiassfrmpdf 321/623
GPS+ Survey Status
P/N 7010-0944 8-27
– When Automatic Scan mode is off, the frequency and data
transfer rate of the known Station selected is set only tochannel ‘a’ of the BR-1 receiver. The other channels do not
work.
Configure Radio
The Config Radio screen sets up the parameters for the rover/base/
repeater radio modem. This screen displays the parameters whichwere set in the job configuration (see “Base Radio” on page 3-11 and“Rover Radio” on page 3-29).
The set of the parameters depends upon the type of the radio selected.
For detailed description of the radio parameters see “Base RadioParameters” on page 3-14.
For a Digital UHF Modem: Internal GR-3 Digi tal UHF, Internal
HiPer Digital UHF, TRL-2 and TRL-35 External Digital UHF theConfig Radio screen (Figure 8-29 on page 8-27), after querying theradio for the frequency, sets the radio channel to the frequency on
which to receive or transmit correctional data.
• Radio Connected to – selects the modem from the configuredones to setup.
– Rover: selects the modem connected with the Rover receiver.
– Base: selects the modem connected with the Base receiver.
• Channel – selects the frequency that the radio broadcasts and/orlistens to.
NOTICE
Script file with Frequency list (Pac Crest
Channels.ccx) must be loaded (using the ModemTPS software) before any frequencies will bedisplayed in Sokkia SSF. Please do this BEFORE
configuring the radio.

8/10/2019 7010-0944 - SokkiaSSF_rm.pdf
http://slidepdf.com/reader/full/7010-0944-sokkiassfrmpdf 322/623
Setting up GPS
Sokkia Spectrum Survey Field Reference Manual8-28
Figure 8-29. Config Internal GR-3 Digital UHF
When using the GR-3 Digital UHF as the Base radio or when using arepeater, set the signal strength that the Base transmits (Figure 8-30).
Select either 100 mW, 250 mW, 500 mW, or 1W power.
Figure 8-30. Config Base GR-3 Digital UHF Radio
0 - 450.0000

8/10/2019 7010-0944 - SokkiaSSF_rm.pdf
http://slidepdf.com/reader/full/7010-0944-sokkiassfrmpdf 323/623
GPS+ Survey Status
P/N 7010-0944 8-29
For UHF Modems: the Internal HiPerXT (UHF) and Internal Map-
HP (UHF) the Config Radio screen (Figure 8-31) sets the following
parameters:
Figure 8-31. Conf ig Internal HiPerXT (UHF)
• Connect – opens a daisy chain and sends commands to setup the
UHF radio and get correctional data for the rover. For the baseradio this button changes into Set Radio. A confirmationmessage displays if the modem was setup successfully.
• Disconnect – turns off the UHF modem.
• OK – returns to the Status screen.
For the FH915 Modem: Internal HiPer Lite set the operatingchannel for the modem on the Config Radio screen (Figure 8-32 onpage 8-29).

8/10/2019 7010-0944 - SokkiaSSF_rm.pdf
http://slidepdf.com/reader/full/7010-0944-sokkiassfrmpdf 324/623
Setting up GPS
Sokkia Spectrum Survey Field Reference Manual8-30
Figure 8-32. Config Internal HiPer Lite
For FH 915Plus Modems: the Internal GR-3 FH915Plus, the
Internal Hiper Li te+ FH915Plus and RE-S1 radios the Config
Radio screen (Figure 8-33) contains the following parameters.
Figure 8-33. Conf ig Internal GR3 FH915Plus
The RE-S1 is a 1W radio extension system using FH915 Plus spread
spectrum radio. It can be used as a repeater with the GR-3 or HiPer
Lite+ GPS receivers, or as a transmit/receive external FH915 Plusradio for the GB or Legacy GPS receivers. For the RE-S1 radio used
as a repeater, see “Configure RE-S1 Repeater” on page 8-31.

8/10/2019 7010-0944 - SokkiaSSF_rm.pdf
http://slidepdf.com/reader/full/7010-0944-sokkiassfrmpdf 325/623
GPS+ Survey Status
P/N 7010-0944 8-31
For Satel modems the Config Radio screen (Figure 8-34) displaysthe model, channel and frequency to set for the radio.
Figure 8-34. Config Satel
For the Internal GR3 Satel radios the Config Radio screen
(Figure 8-35) allows to get the frequency from the radio or to turn
Free Channel Scan mode.
Figure 8-35. Conf ig Internal GR3 Satel
When using the Internal GR-3 Satel as the Base radio, set the signalstrength that the Base transmits. Select either 100 mW , 250 mW , 500
mW , or 1W power.

8/10/2019 7010-0944 - SokkiaSSF_rm.pdf
http://slidepdf.com/reader/full/7010-0944-sokkiassfrmpdf 326/623
Setting up GPS
Sokkia Spectrum Survey Field Reference Manual8-32
Configure RE-S1 Repeater
To setup the RE-S1 as a stand-alone repeater, during the survey
configuration, first enable the usage of the RE-S1 radio modem as arepeater (see “RE-S1 FH915 Repeater” on page 3-31). Then theConfig RE-S1 Repeater option appears in the pop-up menu of theStatus, Start Base and Topo screens. This option opens the Config
Radio screen to set RE-S1 as a repeater (Figure 8-36 on page 8-31).
• Radio Port – selects the radio port that connects with the receiveror controller.
• Location – selects the territory (North America, Australia or NewZealand) where the RE-S1 is used.
• Protocol – shows the compatibility protocol.
• Channel – sets the operating frequency channel.
• Disconnect – turns off the RE-S1 modem.
• Connect – opens a daisy chain and sends commands to setup the
RE-S1 radio as a repeater. A confirmation message displays if the modem was setup successfully.
• OK – saves and returns to previous screen.
• Cancel – closes the screen without making changes.
Figure 8-36. RE-S1 Repeater Configuration

8/10/2019 7010-0944 - SokkiaSSF_rm.pdf
http://slidepdf.com/reader/full/7010-0944-sokkiassfrmpdf 327/623
GPS+ Survey Status
P/N 7010-0944 8-33
mmGPS+ Options
The mmGPS+ Options screen (Figure 8-37) displays the status of
mmGPS+ in RTK survey mode. To open this screen, select themmGPS+ Options item from the Help Icon menu in the upper-leftcorner of the Status screen.
Figure 8-37. mmGPS+ Options
• Select “Turn mmGPS+ ON” to enable mmGPS+ height
computation.
• Use weighted height computations – check and enable to combinemmGPS elevations and GPS elevations. When selected, this
option forces the receiver/sensor to always consider the angle and
distance when determining the elevation, then combines the twoelevations accordingly. This option works well at large (300m)
distances and steep angles.
• Height Difference Limit – sets the threshold for the differencebetween GPS and mmGPS+ height measurements.

8/10/2019 7010-0944 - SokkiaSSF_rm.pdf
http://slidepdf.com/reader/full/7010-0944-sokkiassfrmpdf 328/623
Setting up GPS
Sokkia Spectrum Survey Field Reference Manual8-34
Known Point Initialization
To set up a survey with known points, tap the Known Point Init icon.
The Known Point Init screen (Figure 8-38) initializes the receiverusing known coordinates for the Rover station. This screen is usedwith single frequency receivers and for quality control on dualfrequency receivers.
Figure 8-38. Known Point Rover
• Point – sets the name of the point; select from either the list
icon or from the map icon.
• WGS84 – the coordinates of the point in the current coordinate
system. (Use theConfigure
Coord System and
Displayiconsselection to change the system and the name of the field. Its
contents also change.)
• Ant Ht – the height of the antenna reference point (ARP) above
the mark, and the type of height measurement (vertical or slant).
• Initialize – sends the information to the Rover receiver.
• The Help Icon in the upper-left corner of the Known Point Init
screen displays the pop-up menu containing four items:– Status: opens the Status screen (see “GPS+ Survey Status” on
page 8-12).

8/10/2019 7010-0944 - SokkiaSSF_rm.pdf
http://slidepdf.com/reader/full/7010-0944-sokkiassfrmpdf 329/623
Initialize mmGPS+
P/N 7010-0944 8-35
– Rover Antenna Setup: opens the Antenna Setup Screen to set
the antenna for the current survey.
– Config Radio – opens the Configure Radio screen (see“Configure Radio” on page 8-26). The option variesdepending on the radio selected for the rover (see “Configure
Radio” on page 8-26). It can be: Config Radio, Config
CDMA, Config CDPD, Config GSM or Config UHF .
– Help: accesses the Help files.
Initialize mmGPS+To setup mmGPS+ system for RTK surveying, tap the Init mmGPS
icon. The Init mmGPS+ screen contains information about thecalibration of the laser transmitter and initialization of the sensor(Figure 8-39 on page 8-35).
The Help Icon in the upper-left corner of the screen displays a pop-up
menu containing three items:• Field Calibration – opens the Calibration screen to set the
transmitter to calibrate (that is, to fix errors in incline in the self-leveling mechanism of the transmitter).
• Known Point Offset – opens the Known Point screen(Figure 8-42 on page 8-37).
• Help – accesses the Help files.
Transmitter Data
The Data tab (Figure 8-39 on page 8-35) calibrates the transmitterwith the correct channel and communication port:
• Name – the name of the transmitter.
• ID
– the ID that corresponds to the channel of the transmitter.• Data – the status of calibration data.
• Add – opens the Transmitter screen (Figure 8-40 on page 8-36)to get the transmitter data.

8/10/2019 7010-0944 - SokkiaSSF_rm.pdf
http://slidepdf.com/reader/full/7010-0944-sokkiassfrmpdf 330/623
Setting up GPS
Sokkia Spectrum Survey Field Reference Manual8-36
• Edit – opens the Transmitter screen (Figure 8-40 on page 8-36)
to change the information on the transmitter.
• Delete – removes the transmitter from the list.• OK – saves settings and returns to the previous screen.
• Cancel – closes the screen without saving the settings.
Figure 8-39. Initialize mmGPS – Data Tab
Transmitter
On the Transmitter screen (Figure 8-40 on page 8-36), set the
following parameters:
• Name – the name of the transmitter.
• Com Port – the communication port of the transmitter.• ID – the channel of the transmitter.
• Calibration Data – the status of calibration data.
• Clear Data – clears the ID and Calibration Data fields.
• Get Data – retrieves the transmitter’s data.
• OK – returns to the Init mmGPS+ screen (Figure 8-41 on
page 8-36) showing the calibration data.

8/10/2019 7010-0944 - SokkiaSSF_rm.pdf
http://slidepdf.com/reader/full/7010-0944-sokkiassfrmpdf 331/623
Initialize mmGPS+
P/N 7010-0944 8-37
Figure 8-40. Transmitter
Transmitter Position
The Position tab (Figure 8-41) sets up the transmitter’s height and
location at the jobsite.
Figure 8-41. Initialize mmGPS – Position Tab
• Name – the name of the transmitter.
• ID – the channel of the transmitter.
• Point – the point over which the transmitter is setup.

8/10/2019 7010-0944 - SokkiaSSF_rm.pdf
http://slidepdf.com/reader/full/7010-0944-sokkiassfrmpdf 332/623
Setting up GPS
Sokkia Spectrum Survey Field Reference Manual8-38
• Resect – opens the Resect mmGPS+ screen to perform a
resection for an unknown transmitter location.
• Edit – opens the Known Point screen to select the point overwhich the transmitter is setup.
• Delete – removes the transmitter from the list.
Known Point
On the Known Point screen (Figure 8-42) select the known point overwhich the transmitter is setup and enter the transmitter height.
Figure 8-42. Known Point
• Point – the point over which to set up the transmitter; select using
either the map or list icons next to the Point entry box.• Transmitter – enter transmitter parameters:
– Name: displays the name of the transmitter.
– ID: displays the transmitter channel.
– Ht and m: sets the height of the transmitter from the ground to
the mark on the transmitter’s side and the method of height
measurement.– 2m Fixed Tripod : check mark this box if using a 2 meter fixed
tripod.
• OK – uploads the transmitter calibration information to the
sensor.

8/10/2019 7010-0944 - SokkiaSSF_rm.pdf
http://slidepdf.com/reader/full/7010-0944-sokkiassfrmpdf 333/623
Initialize mmGPS+
P/N 7010-0944 8-39
Resection
On the Resect mmGPS+ screen (Figure 8-43), measure an unknown
transmitter location using the Rover and three or more points.The Sensor tab (Figure 8-43) is identical to the title tab on the Init
mmGPS+ screen and is used to set up the sensor.
Figure 8-43. Resect ion – Sensor Tab
• Receiver Port – sets the receiver port that connects the receiver tothe sensor.
• Transmitter ID – displays the channel of the transmitter.
• Sensor Gain – select Auto to automatically control the mmGPSreceiver’s detection level of the transmitter’s signal.
• Init Sensor – starts the initialization of the sensor.
• Init Time Improvement – enable to use the mmGPS signal to assistin initializing the GPS receiver. This option is useful to decreasethe initialization time when satellite visibility is limited (forexample, tracking only four or five satellites).
• Known Trans Horz Pos – if enabled, then after pressing the Init
Sensor button, the Known Point screen (Figure 8-42 onpage 8-37) displays. Select the point over which the transmitter issetup.

8/10/2019 7010-0944 - SokkiaSSF_rm.pdf
http://slidepdf.com/reader/full/7010-0944-sokkiassfrmpdf 334/623
Setting up GPS
Sokkia Spectrum Survey Field Reference Manual8-40
The Resect tab (Figure 8-44) is used to calculate the resectioncalculation from the Rover point to the point over which thetransmitter is set up.
Figure 8-44. Resection – Resect Tab
The icons on the status bar of the screen displays information about
the current state of measurement:
• – the mmGPS icon displays the sensor receives the
transmitter’s beam.
• – the quality of the radio link.
• – the type of the position calculation method.
• – the RMS errors for horizontal and vertical coordinates,
respectively.
• – the number of satellites tracked and used in position
calculation, respectively.
• Meas – the number of the measurement.
• Known Point – check mark this box when occupying a knownpoint, and select a point to occupy using the map and list icons.
• Ht and m – the antenna’s height and method of height
measurement.

8/10/2019 7010-0944 - SokkiaSSF_rm.pdf
http://slidepdf.com/reader/full/7010-0944-sokkiassfrmpdf 335/623
Initialize mmGPS+
P/N 7010-0944 8-41
• Start – starts the measurement process. After pressing, the button
toggles to Stop, and the counter of the epochs collected appears.
• Logging – displays the number of GPS epochs used in theresection calculation during the measurement.
Data tab (Figure 8-45) is used to view the results of resectionmeasurements. Data displays only after three or more points havebeen measured.
Figure 8-45. Resection – Data Tab
• Re-Meas – clears all data measurements and restarts the resectionprocess.
• Accept – opens the Add Point screen (Figure 8-46 on page 8-41)
to view the point information for the transmitter.The Add Point screen (Figure 8-46 on page 8-41) is used to viewand save the transmitter location.

8/10/2019 7010-0944 - SokkiaSSF_rm.pdf
http://slidepdf.com/reader/full/7010-0944-sokkiassfrmpdf 336/623
Setting up GPS
Sokkia Spectrum Survey Field Reference Manual8-42
Figure 8-46. Add Point
Sensor
The Sensor tab of the Init mmGPS+ screen (Figure 8-47) uploads
transmitter calibration information to the sensor and sets up thesensor for receiving the transmitter’s laser beam.
Figure 8-47. Init ialize mmGPS – Sensor Tab
• Receiver Port – connects the receiver and sensor.
• Transmitter ID – the transmitter’s channel. The ANY selectionallows the sensor to independently select the transmitter with thesmallest error rate.

8/10/2019 7010-0944 - SokkiaSSF_rm.pdf
http://slidepdf.com/reader/full/7010-0944-sokkiassfrmpdf 337/623
Initialize mmGPS+
P/N 7010-0944 8-43
• Sensor Gain – sets the sensitivity of the sensor to the transmitter’s
laser beam.
• Init Time Improvement – check mark this box to improve the RTKfix time for the receiver.
• Init Sensor – starts the initialization process.
Field Calibration
The Calibration screen (Figure 8-48) selects the transmitter for fieldcalibration.
Figure 8-48. Calibration
• Transmitter Name – the name of the transmitter to calibrate
• Next – starts the process of auto-leveling (Figure 8-49 onpage 8-43).

8/10/2019 7010-0944 - SokkiaSSF_rm.pdf
http://slidepdf.com/reader/full/7010-0944-sokkiassfrmpdf 338/623
Setting up GPS
Sokkia Spectrum Survey Field Reference Manual
Notes:
8-44
Figure 8-49. Check Angle of Sensor
• Next – opens the Calibrate screen with instructions to follow.
Figure 8-50. Calibrate
• Calibrate – press to collect calibration data after the auto-leveling process completes (Figure 8-50).

8/10/2019 7010-0944 - SokkiaSSF_rm.pdf
http://slidepdf.com/reader/full/7010-0944-sokkiassfrmpdf 339/623
P/N 7010-0944
Chapter 9
9-1
GPS SurveyTo perform a survey with GPS receivers, tap the Survey icon in themain menu. The GPS Survey menu (Figure 9-1) includes options toset up the following surveys:
1. Topo
2. Auto Topo
3. X-Section
4. Find Station
5. Tape Dimension
Figure 9-1. GPS Survey Menu
The Help Icon opens a pop-up menu giving access to the helpfiles, module activation codes, port data logging, changing menu
interface, and information about the Sokkia SSF used (for details see“Help Icon’s Pop-up Menu” on page 1-9).
TIP
If there is no choice for some needed menu options,tap Configure / Menus icons and enable theseoptions in the Config Menus screen.

8/10/2019 7010-0944 - SokkiaSSF_rm.pdf
http://slidepdf.com/reader/full/7010-0944-sokkiassfrmpdf 340/623
GPS Survey
Sokkia Spectrum Survey Field Reference Manual9-2
Topo Survey
To set up a survey with topo points, tap the Topo icon.
The Topo screen (Figure 9-2) records stop and go survey.
Figure 9-2. Topo Points Survey
The Help Icon in the upper-left corner of the screen displays the pop-up menu that varies, depending on survey mode used:
• Status – opens the Status screen (see “GPS+ Survey Status” onpage 8-12).
• Rover Antenna Setup – opens the Antenna Setup screen to set the
antenna for the current survey.
• Config Radio – opens the Configure Radio screen. For details,see “Configure Radio” on page 8-26.
• Config RE-S1 Repeater – opens the Configure Radio screen tosetup the RE-S1 radio as a repeater (see “Configure RE-S1
Repeater” on page 8-31).
• Config OmniSTAR – opens the OmniSTAR screen to start the
OmniSTAR service. For details, see “Configure OmniSTAR” onpage 8-22.
• Reset RTK – resets the ambiguities and sets the receiver in theRover RTK mode. The settings being used are based on theselections in the survey configuration.

8/10/2019 7010-0944 - SokkiaSSF_rm.pdf
http://slidepdf.com/reader/full/7010-0944-sokkiassfrmpdf 341/623
Topo Survey
P/N 7010-0944 9-3
• Reset DGPS – sets the receiver in the Rover DGPS mode. The
settings being used are based on the selections in the surveyconfiguration.
• mm GPS+ Options – opens the mmGPS+ Options screen in RTKsurvey (see “mmGPS+ Options” on page 8-32).
• Notes – opens the Notes screen (Figure 9-4 on page 9-5).
• Edit Points – opens the Points screen.
• Inverse – opens the Two-Point Inverse COGO task screen. For
details see “Inverse” on page 14-3.
• PTL Mode – switches on the PTL (Point-To-Line) Mode. (Thescreen changes its appearance to Topo (PTL).) For details see“PTL Point” on page 6-12.
• Grid Setup – opens the Grid Setup screen to set a grid to be
displayed with the Map (see “Grid Setup” on page 9-16).
• Help – accesses the Help files.
The Topo Menu
The Topo tab on the Topo screen (Figure 9-4 on page 9-5) containsthe initial data for the survey and displays the progress of the survey(Figure 9-2 on page 9-2). The upper-right corner of the screendisplays the status of information on the Status screen. For details,see “GPS+ Survey Status” on page 8-12.
• Point – displays the current point name. The icon opens the Add Photo Notes screen to enter a photo note for the point.
• Code – displays the current point code: enter manually or selectfrom the drop-down list.
• – tap on this icon to open the Code-Attributes screen to set
the attributes for the selected code (for details, see “On the Point
Attributes” on page 6-7).
• The icon next to the Attributes List bitmap displays the pop-
up menu containing three items:

8/10/2019 7010-0944 - SokkiaSSF_rm.pdf
http://slidepdf.com/reader/full/7010-0944-sokkiassfrmpdf 342/623
GPS Survey
Sokkia Spectrum Survey Field Reference Manual9-4
– Layer : opens the Select Layer screen to select the layer in
which to locate the point. See “On the Select Layer” onpage 6-10.
– Note: opens the Note screen (Figure 9-3). The Note screen isused for additional information. When exporting raw data
(for example, to a TDS Raw Data file), this information is inthe Point Description field. The note should be entered in the
Note field. Press OK to store the Note.
Figure 9-3. Note
• Ant Ht – sets the antenna height and its type (slant or vertical).
• Epoch count – shows the number of accepted epochs.
• Rem Time – shows remaining time to stop logging when in PP
Kinematic or PP DGPS mode.
TIP
When using mmGPS+, the height of the Rover
antenna includes the height of the PZS-1 sensorwith 5/8 inch plug.
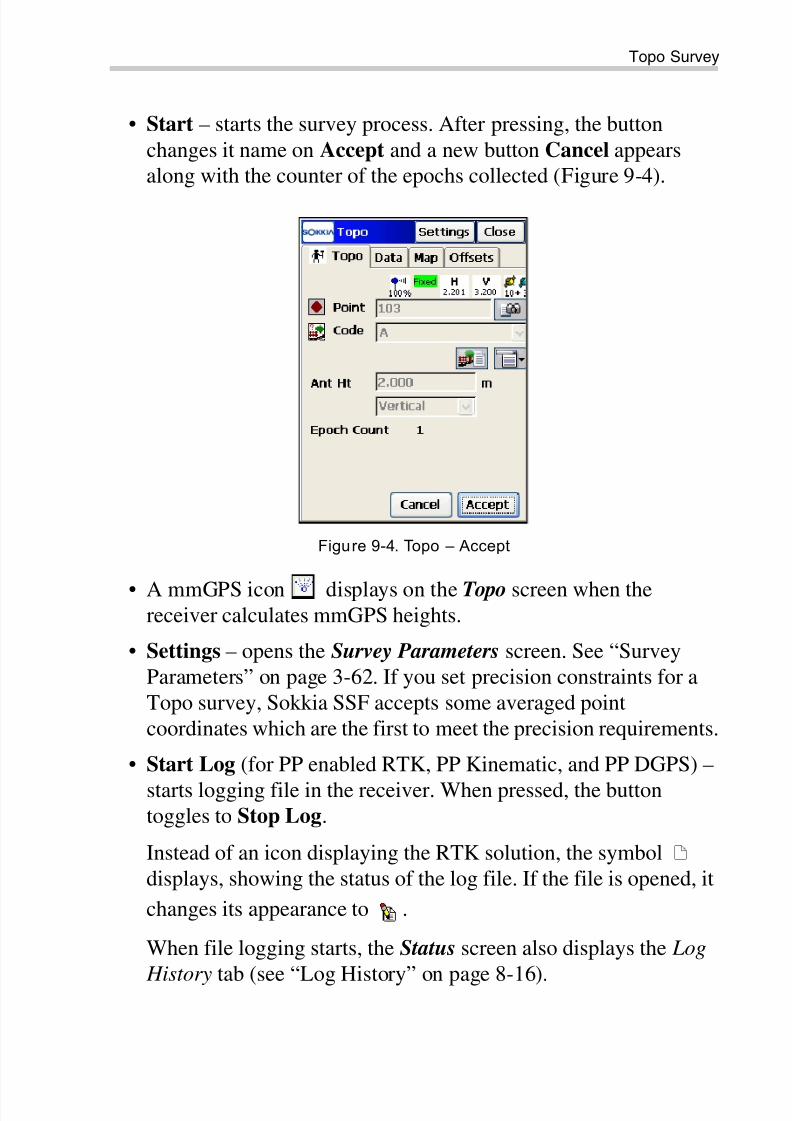
8/10/2019 7010-0944 - SokkiaSSF_rm.pdf
http://slidepdf.com/reader/full/7010-0944-sokkiassfrmpdf 343/623
Topo Survey
P/N 7010-0944 9-5
• Start – starts the survey process. After pressing, the button
changes it name on Accept and a new button Cancel appearsalong with the counter of the epochs collected (Figure 9-4).
Figure 9-4. Topo – Accept
• A mmGPS icon displays on the Topo screen when thereceiver calculates mmGPS heights.
• Settings – opens the Survey Parameters screen. See “SurveyParameters” on page 3-62. If you set precision constraints for aTopo survey, Sokkia SSF accepts some averaged pointcoordinates which are the first to meet the precision requirements.
• Start Log (for PP enabled RTK, PP Kinematic, and PP DGPS) –
starts logging file in the receiver. When pressed, the buttontoggles to Stop Log.
Instead of an icon displaying the RTK solution, the symboldisplays, showing the status of the log file. If the file is opened, it
changes its appearance to .
When file logging starts, the Status screen also displays the Log
History tab (see “Log History” on page 8-16).

8/10/2019 7010-0944 - SokkiaSSF_rm.pdf
http://slidepdf.com/reader/full/7010-0944-sokkiassfrmpdf 344/623
GPS Survey
Sokkia Spectrum Survey Field Reference Manual9-6
If an observed Topo point has a name existing in the job, the
Duplicate Points screen (Figure 9-5) displays.
• Overwrite – overwrites the existing point.• Rename – the point is renamed. The new name is noted in the
field and is the point with observed coordinates.
• Store As Check Point? – if enabled, the observed point is stored asa check point of the existing point.
• Use in Weighted Average – available if the Store As Check Point
radio button is selected. The OK button opens the Weighted
Average screen (see “Weighted Average” on page 6-14 fordetails).
• Correct Base – if enabled, the existing coordinates of the
observed point are not replaced by the coordinates of theobserved point. Instead, the known coordinates of this point areused to correct the Base coordinates. After pressing the OK button, a warning message displays that recomputations are being
performed. Then the coordinates of all points are updated usingthe new Base coordinates.
Figure 9-5. Duplicate Point
The Weighted Average screen (Figure 9-6 on page 9-7) displays
coordinate residuals of the check point.
• The WA tab lists the names of the coordinate residuals

8/10/2019 7010-0944 - SokkiaSSF_rm.pdf
http://slidepdf.com/reader/full/7010-0944-sokkiassfrmpdf 345/623
Topo Survey
P/N 7010-0944 9-7
• Use In WA – uses the check points in weighted averaging
positions.
Figure 9-6. Weighted Average
Data
The Data tab on the Topo screen (Figure 9-7) shows the results of thesurvey.
Figure 9-7. Topo – Data

8/10/2019 7010-0944 - SokkiaSSF_rm.pdf
http://slidepdf.com/reader/full/7010-0944-sokkiassfrmpdf 346/623
GPS Survey
Sokkia Spectrum Survey Field Reference Manual9-8
The Map tab on the Topo screen (Figure 9-8) shows the stored pointgraphically.
On the Map tab (Figure 9-8), just like the Topo tab, you can collecttopo points using the Start button. Use the Sim / Sim Off button toturn on/off Simulation mode.
Figure 9-8. Topo – Map
Table 9-1 describes the stored point icons that display on the Map tab.
For a detailed description of the Map view see “Viewing Map” onpage 15-1.
Table 9-1. Stored Point Descriptions
Icon Description
the name of a point
the code of a point
attributes for the code
/ toggles between the Start button and the status icons.

8/10/2019 7010-0944 - SokkiaSSF_rm.pdf
http://slidepdf.com/reader/full/7010-0944-sokkiassfrmpdf 347/623
Topo Survey
P/N 7010-0944 9-9
Offsets
The Offsets tab (Figure 9-9) sets the offset point for the measurement.
Figure 9-9. Topo – Offsets
• Line – opens the Line screen to define a point, set by the offset
from a line. See Figure 9-10 on page 9-10.
• Az Dis Ht – opens the Azimuth-Distance-Height screen to definea point specified by the offset from a point. See Figure 9-11 on
page 9-12.
• Laser – only available when a laser device has been added in theConfig Survey; opens either the Config Laser screen (see “LaserConfiguration” on page 9-13) or the Laser BS Meas screen to
define a point specified through a backsight (see “For the Laserwith an Encoder” on page 9-14).
• Settings – opens the Survey Parameters screen. See “SurveyParameters” on page 3-41.

8/10/2019 7010-0944 - SokkiaSSF_rm.pdf
http://slidepdf.com/reader/full/7010-0944-sokkiassfrmpdf 348/623
GPS Survey
Sokkia Spectrum Survey Field Reference Manual9-10
Line
The Line screen (Figure 9-10) is used to enter the parameters defining
a point that are not available physically, relative to some referenceline.
Figure 9-10. Line Screen
• Reference Line – a line specified by two known or measuredpoints: select either from the map, from the list, or measuredirectly.
• Meas – starts measuring the current location point.
• Offset point – sets the parameters of the offset point:
– the name of a point
– the code of a point (can be typed manually or chosen from the
drop-down list)
– the attributes of the code (can be entered through the Attributes List icon, see “On the Point Attributes” on page 6-7 for details)
• The icon next to the Attributes List icon displays the pop-up menu
containing three items:
– String: toggles the String field. Also, the sign appears.

8/10/2019 7010-0944 - SokkiaSSF_rm.pdf
http://slidepdf.com/reader/full/7010-0944-sokkiassfrmpdf 349/623
Topo Survey
P/N 7010-0944 9-11
– Layer : opens the Select Layer screen to select the layer in
which to locate the point (see “On the Select Layer” onpage 6-10).
– Note: opens the Note screen (see “Topo Survey”on page 9-2).
• Offsets From End Pt (m) – the offset values include (Figure 9-10
on page 9-10):
– Forward/Backward: the distance from Point 2 to theprojection of the target point along the Line of Sight.
– Right/Left: the distance from the target point to the line ofsight, either to the Right or to the Left of the line.
– Up/Down: the height difference from the target point, either
Up or Down.
• Store – calculates the coordinates of the offset point and savesthe point to the database.
• The Help Icon on the upper-left corner displays the pop-up menucontaining two items:
– Antenna Setup: opens the Antenna Setup screen to set the
antenna for the current survey.
– Help: accesses the Help files.
• Settings – opens the Survey Parameters screen. See “SurveyParameters” on page 3-62.

8/10/2019 7010-0944 - SokkiaSSF_rm.pdf
http://slidepdf.com/reader/full/7010-0944-sokkiassfrmpdf 350/623
GPS Survey
Sokkia Spectrum Survey Field Reference Manual9-12
Azimuth-Distance-Height
The Azimuth-Distance-Height screen (Figure 9-11) defines an offset
point using the current point as a reference.
Figure 9-11. Azimuth-Distance-Height
•Start Pt
– the starting point of the offset measurement.• Point – the name of the new point.
• Code – the code of the new point, either enter manually or select
from the drop-down list. The icon opens the Add Photo
Notes screen to enter a photo note for the point.
• – the Attributes List icon opens the Code-Attributes screen.
See “On the Point Attributes” on page 6-7.• The icon next to the Attributes List bitmap displays the pop-up
menu containing three items:
– String: toggles on the String field. Also, the sign appears.
– Layer : opens the Select Layer screen to select the layer inwhich to locate the point (“On the Select Layer” on page 6-
10).
– Note: opens the Note screen. For details, see “Topo Survey”on page 9-2.
• Azimuth/Az to Pt – sets the azimuth to the target point by value
or by point.

8/10/2019 7010-0944 - SokkiaSSF_rm.pdf
http://slidepdf.com/reader/full/7010-0944-sokkiassfrmpdf 351/623
Topo Survey
P/N 7010-0944 9-13
• Zenith Angle/Elev Ang/Vert Dist – sets the zenith angle (zenith
distance) to the target point or vertical distance.
• Horizontal Dist – sets the horizontal distance between the currentand the target point.
• Store – calculates and stores the point. The next screen shows theparameters of the current point, the PDOP value, the Sigma
values, and the epochs logged counter.
• The Help Icon on the upper-left corner displays the pop-up menucontaining two items:
– Antenna Setup: opens the Antenna Setup screen to set theantenna for the current survey.
– Help: accesses the Help files.
• Settings – opens the Survey Parameters screen (see “Survey
Parameters” on page 3-41).
Laser Configuration
Laser configuration depends on whether the laser selected in the jobconfiguration has an Encoder or not.
For the Laser without an Encoder the Config Laser screen(Figure 9-12) defines an occupation point and backsight azimuth or
point, and defines the laser height and point information.
Figure 9-12. Config Laser
8/10/2019 7010-0944 - SokkiaSSF_rm.pdf
http://slidepdf.com/reader/full/7010-0944-sokkiassfrmpdf 352/623
GPS Survey
Sokkia Spectrum Survey Field Reference Manual9-14
• Occ Point – enter an occupation or select an occupation using the
map or list buttons.
• (Az to Pt) BS Azimuth / BS Point – enter either a BS azimuthvalue or select a BS point using the map or list buttons.
• Laser HI – enter the height of the device above the occupationpoint.
• Point – enter the name of the point being measured. The photo
note icon opens the Add Photo Notes screen to enter a photonote for the point.
• Code – displays the current point code. Can be entered manuallyor chosen from the drop-down list.
• – the Attributes List icon opens the Code-Attributes screen.See “On the Point Attributes” on page 6-7.
• The icon next to the Attributes List icon displays the pop-up menu
containing three items:
– String: toggles on the String field. Also, the sign appears.
– Layer : opens the Select Layer screen to select the layer inwhich to locate the point. See “On the Select Layer” on
page 6-10.
– Note: opens the Note screen. For details, see “Topo Survey”on page 9-2.
• OK – saves the settings and returns to the Topo screen.
For the Laser with an Encoder the Laser BS Meas screen(Figure 9-13 on page 9-15) first defines an occupation point andbacksight azimuth or point.
• Occ Point – enter an occupation or select an occupation using the
map or list buttons.
• BS Azimuth / BS Point – enter either a BS azimuth value orselect a BS point using the map or list buttons.
• OK – saves the settings and opens the Config Laser screen(Figure 9-14 on page 9-15) for lasers with an Encoder.

8/10/2019 7010-0944 - SokkiaSSF_rm.pdf
http://slidepdf.com/reader/full/7010-0944-sokkiassfrmpdf 353/623
Topo Survey
P/N 7010-0944 9-15
Figure 9-13. Laser BS Meas
The Config Laser screen (Figure 9-14) defines the laser height and
point information.
Figure 9-14. Config Laser
• Occ Point – enter an occupation or select an occupation using themap or list buttons.
• BS Azimuth / BS Point – enter either a BS azimuth value or selecta BS point using the map or list buttons.
• Laser HI – enter the height of the device above the occupationpoint.

8/10/2019 7010-0944 - SokkiaSSF_rm.pdf
http://slidepdf.com/reader/full/7010-0944-sokkiassfrmpdf 354/623
GPS Survey
Sokkia Spectrum Survey Field Reference Manual9-16
• Point – enter the name of the point being measured. The photo
note icon opens the Add Photo Notes screen to enter a photo
note for the point. Also, the field appears to enter a string.
• Code – displays the current point code. Can be entered manuallyor chosen from the drop-down list.
• BS Setup – returns to the Laser BS Meas screen to set up a new
BS.
Grid SetupTap the Help Icon in the upper-left corner of the Topo screen. Selectthe Grid Setup option from the pop-up menu. The Grid Setup screen(Figure 9-15) displays. The Grid Setup screen sets up a grid for the
Map to help while collecting data.
Figure 9-15. Grid Setup
• Display Grid – check mark this box to display a grid on the Map
tab.
• Origin Point – specifies the origin point for the grid.
• Azimuth(Bearing)/Azimuth(Bearing) To Point – sets the
corresponding value to the direction of the grid lines.
• Spacing (m) – specifies the intervals between the grid lines alongthe y(North) and x(East) axes.

8/10/2019 7010-0944 - SokkiaSSF_rm.pdf
http://slidepdf.com/reader/full/7010-0944-sokkiassfrmpdf 355/623
Topo Survey
P/N 7010-0944 9-17
• OK – displays the grid on the Map tab (Figure 9-16) with the
specified settings.
Figure 9-16. Grid in Map
If a grid is set up, the Topo screen (Figure 9-17) displays an offset ofthe current position from the grid origin point.
Figure 9-17. Grid Offset
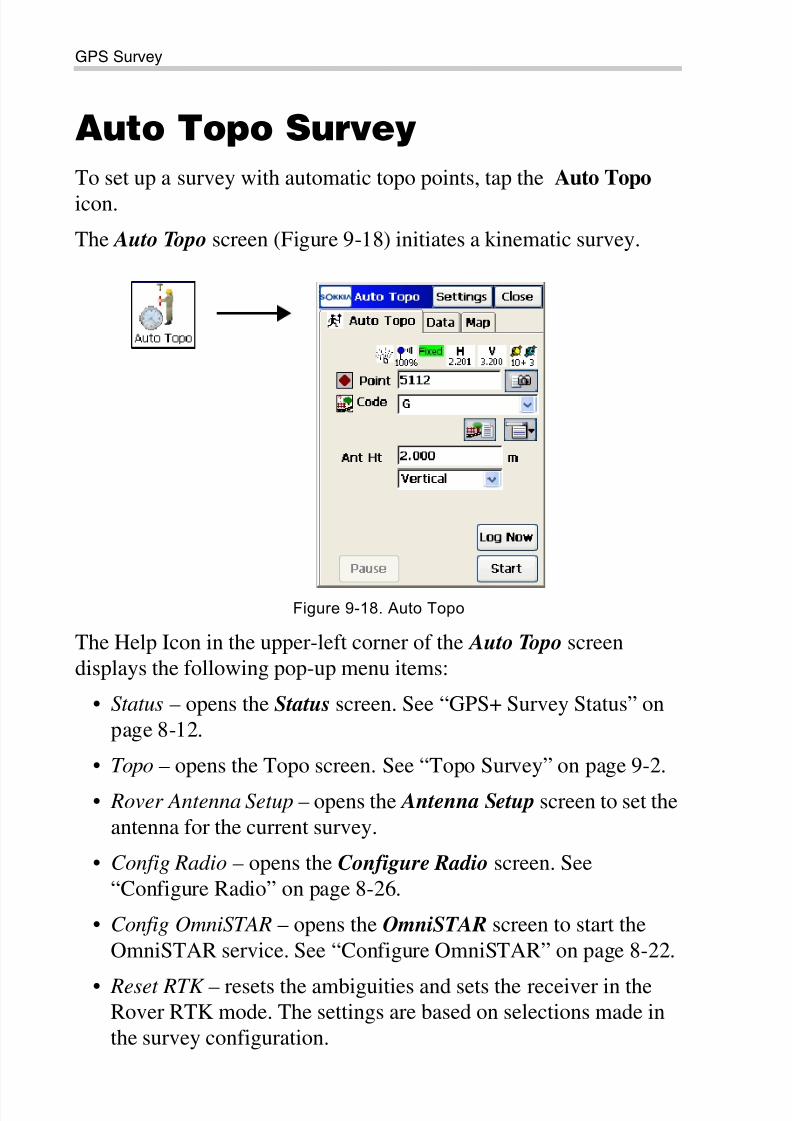
8/10/2019 7010-0944 - SokkiaSSF_rm.pdf
http://slidepdf.com/reader/full/7010-0944-sokkiassfrmpdf 356/623
GPS Survey
Sokkia Spectrum Survey Field Reference Manual9-18
Auto Topo Survey
To set up a survey with automatic topo points, tap the
Auto Topo
icon.
The Auto Topo screen (Figure 9-18) initiates a kinematic survey.
Figure 9-18. Auto Topo
The Help Icon in the upper-left corner of the Auto Topo screendisplays the following pop-up menu items:
• Status – opens the Status screen. See “GPS+ Survey Status” onpage 8-12.
• Topo – opens the Topo screen. See “Topo Survey” on page 9-2.
• Rover Antenna Setup – opens the Antenna Setup screen to set theantenna for the current survey.
• Config Radio – opens the Configure Radio screen. See“Configure Radio” on page 8-26.
• Config OmniSTAR – opens the OmniSTAR screen to start the
OmniSTAR service. See “Configure OmniSTAR” on page 8-22.
• Reset RTK – resets the ambiguities and sets the receiver in theRover RTK mode. The settings are based on selections made inthe survey configuration.

8/10/2019 7010-0944 - SokkiaSSF_rm.pdf
http://slidepdf.com/reader/full/7010-0944-sokkiassfrmpdf 357/623
Auto Topo Survey
P/N 7010-0944 9-19
• Reset DGPS – sets the receiver in the Rover DGPS mode. The
settings are based on the selections made in the surveyconfiguration.
• mm GPS+ Options – opens the mmGPS+ Options screen in RTKsurvey. See “mmGPS+ Options” on page 8-32.
• Note – opens the Notes screen (“Note” on page 9-4).
• Edit Points – opens the Points screen. See “Points” on page 6-2.
• PTL Mode – switches on the PTL (Point-To-Line) Mode. (Thescreen changes its appearance to Auto Topo (PTL)). For detailssee “PTL Point” on page 6-12.
Auto TopoThe Auto Topo tab contains the initial data for the survey and displays
the progress of the survey (Figure 9-18). The upper-right corner ofthe screen displays the status of information on the Status screen. Fordetails see “GPS+ Survey Status” on page 8-12.
• Point – displays the current point name. The icon opens the Add Photo Notes screen to enter a photo note for the point.
• Code – displays the current point code, enter either manually or
select from the drop-down list.
• – the Attributes List icon opens the Code-Attributes screen
(for details see “On the Point Attributes” on page 6-7).
• The icon next to the Attributes List icon displays the pop-up menu
containing three items:
– String: toggles on the String field. Also, the sign appears.
NOTICE
To display points in the list of points, ensure thatthe Show Auto Topo Point option is selected in the
Help Icon menu in the upper-left corner of thePoints screen.

8/10/2019 7010-0944 - SokkiaSSF_rm.pdf
http://slidepdf.com/reader/full/7010-0944-sokkiassfrmpdf 358/623
GPS Survey
Sokkia Spectrum Survey Field Reference Manual9-20
– Layer : opens the Select Layer screen to select the layer in
which to locate the point. See “On the Select Layer” onpage 6-10).
– Note: opens the Note screen. For details, see “Note” onpage 9-4.
• Ant Ht – sets the antenna height and its type (slant or vertical).
• Log Now – immediately stores the current position of thereceiver antenna.
• Pause/Resume – interrupts the survey. After pressing, Pause, thebutton changes to Resume. Press again to resume the survey.
• Start/Stop – starts the survey process. After pressing, Start, thebutton changes to Stop; the Pause button activates.
Figure 9-19. Auto Topo – Start
A mmGPS icon displays on the status bar of the Auto Topo screen to calculate mmGPS heights for the receiver.
• Settings – opens the Survey Parameters screen. See “SurveyParameters” on page 3-41.
TIP
When using mmGPS+, the height of the roverantenna includes the height of the PZS-1 sensor
with a 5/8 inch plug.

8/10/2019 7010-0944 - SokkiaSSF_rm.pdf
http://slidepdf.com/reader/full/7010-0944-sokkiassfrmpdf 359/623
Auto Topo Survey
P/N 7010-0944 9-21
Data
The Data tab (Figure 9-20) shows the properties of the last stored
point: the Point name and its coordinates.
Figure 9-20. Auto Topo – Data
Map
The Map tab (Figure 9-21) shows the stored points graphically. Allsurvey processes can be done through this page, and the Auto Topo tab, as all the controls are duplicated.
Figure 9-21. Auto Topo – Map

8/10/2019 7010-0944 - SokkiaSSF_rm.pdf
http://slidepdf.com/reader/full/7010-0944-sokkiassfrmpdf 360/623
GPS Survey
Sokkia Spectrum Survey Field Reference Manual9-22
Table 9-2 lists and describes the fields for stored points:
For a detailed description of the Map view, see “Viewing Map” onpage 15-1.
X-Section
To perform X-Section function, tap the X-Section icon .
The X-Section function is similar to that of the Total Station mode,except for the measurement screens, which are the correspondingGPS+ measurement screens. For details, see “Edit Cross Section Set”on page 7-30 and “Topo Survey” on page 9-2.
Find Station
To perform Find Station function, tap the Find Station icon .
The Find Station function is similar to that of the Total Station mode,
except for the measurement screens, which are the correspondingGPS+ measurement screens. For details, see “Find Station” on
page 11-27 and “Topo Survey” on page 9-2.
Table 9-2. Stored Points
Icon Description
the name of a point
the code of a point
the Attributes List icon, opens the Code-Attributes screen (for
details, see “On the Point Attributes” on page 6-7).
/toggles between the buttons and status icons on the right part
of the screen. When pressed, changes its appearance to thesecond icon.

8/10/2019 7010-0944 - SokkiaSSF_rm.pdf
http://slidepdf.com/reader/full/7010-0944-sokkiassfrmpdf 361/623
Tape Dimension
P/N 7010-0944 9-23
Tape Dimension
To perform Tape Dimension function, tap the Tape Dimension icon
.
The Tape Dimension function is similar to that of the Total Stationmode, except for the measurement screens, which are the
corresponding GPS+ measurement screens. For details, see “TapeDimension” on page 11-29 and “Topo Survey” on page 9-2.

8/10/2019 7010-0944 - SokkiaSSF_rm.pdf
http://slidepdf.com/reader/full/7010-0944-sokkiassfrmpdf 362/623
GPS Survey
Sokkia Spectrum Survey Field Reference Manual
Notes:
9-24

8/10/2019 7010-0944 - SokkiaSSF_rm.pdf
http://slidepdf.com/reader/full/7010-0944-sokkiassfrmpdf 363/623
P/N 7010-0944
Chapter 10
10-1
Setting up TS SurveyTo set up a TS survey, tap the Setup icon in the main menu when inTS mode. The Setup menu (Figure 10-1) includes options to:
1. Start a backsight survey (Backsight).
2. Calculate a resection task (Resection).3. Calculate a point’s elevation from remote benchmarks
(Remote BM).
4. Remote Control (for Robotic mode).
Figure 10-1. Setup GPS Menu
The Help Icon opens a pop-up menu giving access to the help
files, module activation codes, port data logging, changing menuinterface, and information about the Sokkia SSF used (for details see
“Help Icon’s Pop-up Menu” on page 1-9).

8/10/2019 7010-0944 - SokkiaSSF_rm.pdf
http://slidepdf.com/reader/full/7010-0944-sokkiassfrmpdf 364/623
Setting up TS Survey
Sokkia Spectrum Survey Field Reference Manual10-2
Backsight Survey
To set up a Total Station survey with localization, tap the Backsight
icon. The BS Survey screen (Figure 10-2) displays.
On the BS Survey screen (Figure 10-2), the BS Setup tab contains thefollowing Backsight parameters.
Figure 10-2. Backsight Survey
• Occ. Point – the name of the point where the total station islocated.
• – opens the map for choosing the occupation point (map icon).
• The menu icon next to the Occ Point field opens a pop-upmenu containing five items:
– From List : opens the list to choose the occupation point.
– Station Offset : opens the Station and Offset screen to add anarbitrary occupation point near a road.
– Properties: opens the Add/Edit Point screen that displays theproperties of the current point, or you can create a new pointif no point is selected yet.
– Resection: opens the Resection screen to determine the
occupation point coordinates by solving the resection task,

8/10/2019 7010-0944 - SokkiaSSF_rm.pdf
http://slidepdf.com/reader/full/7010-0944-sokkiassfrmpdf 365/623
Backsight Survey
P/N 7010-0944 10-3
using the known point’s coordinates (for details, see
“Resection” on page 10-11.)
– Elevation: opens the Remote BM screen (for details, see“Remote Benchmarks” on page 10-16).
• – shows battery status for the total station.
• – shows the status of communication between the controller
and the total station.
• – shows battery and memory status for the controller.
• (HI) – sets the height of the instrument above or below themark (the HR value can be negative, so points above the prism,such as those on a bridge, can be measured from below).
• (HR) – sets the height of the target above the mark.
• BS Point (BS Azimuth) – sets the backsight point location or thedirection to it.
• The menu icon next to the BS Point field displays the pop-upmenu to set the backsight point:
– From List : opens the list of points.
– Station Offset : opens the Station and Offset screen to add anarbitrary occupation point near a road.
– Properties: opens the Add/Edit Point screen that displays theproperties of the current point, or creates a new point if no
point is chosen yet.
– Multiple BS : opens the Multi-Point BS screen, to involveseveral Backsight points for performing a survey (see “Multi-Point Backsight” on page 10-6).
• BS Circle – displays the horizontal circle reading correspondingto the backsight point.
• The menu icon next to the BS Circle field displays the pop-up menu that sets the BS Circle value to zero, azimuth, inputvalue, obtains the value from the instrument, or changes the value
by +/- 90 or 180 degrees.

8/10/2019 7010-0944 - SokkiaSSF_rm.pdf
http://slidepdf.com/reader/full/7010-0944-sokkiassfrmpdf 366/623
Setting up TS Survey
Sokkia Spectrum Survey Field Reference Manual10-4
• Measure dist to BS – set if the distance to backsight point should
be measured.
• Turn To BS (available only for the Robotic mode) – select to turnthe total station to the Backsight Point.
• Fixed HR at BS – set if the height of the backsight point is fixedfor the whole set of measurements. If the box is check marked, an
additional HR box displays. This is useful when one target ismounted at the BS for the duration of an occupation and another
is used for the sideshots.
• Check BS – opens the Backsight Survey screen to check theBacksight point (see “Check Backsight” on page 10-8).
• HC Set – sets the horizontal circle as defined in the BS Circle field and opens the Data tab.
• Settings – opens the Mode screen (see “Set Measurement Mode”on page 10-9).
• The Help Icon in the upper-left corner displays the pop-upmenu containing seven items:
– Edit Points: opens the Points list screen (see “Points” onpage 6-2).
– Edit Raw: opens the Raw Data screen (see “Raw Data” onpage 6-37).
– Remote Control (for Robotic mode only): opens the Remote
Control screen, which controls the total station through theradio (see Figure 10-19 on page 10-18).
– Config Link (only for the Robotic mode): opens the
Configure Link screen (see “Configure Link” on page 13-7).
– Inverse: opens the Inverse COGO screen (see “Inverse” onpage 14-3).
– Intersection: opens the Intersection COGO screen (see“Compute the Intersection Point” on page 14-14).
– Help: accesses the Help files.
The Data tab on the Backsight Survey screen (Figure 10-3 on
page 10-5) displays the available values of the backsight point

8/10/2019 7010-0944 - SokkiaSSF_rm.pdf
http://slidepdf.com/reader/full/7010-0944-sokkiassfrmpdf 367/623
Backsight Survey
P/N 7010-0944 10-5
parameters: HR (Height of Rod/target), HA (Horizontal Angle), VA
(Vertical Angle), and SD (Slope Distance).
Figure 10-3. Backsight – Data
The two fields at the top of the page display the height of the
instrument and the azimuth respectively.
The Map tab (Figure 10-4) shows all points in a graphic mode. Fordetails on map properties and customizing, see “Viewing Map” onpage 15-1.
Figure 10-4. Backsight – Map

8/10/2019 7010-0944 - SokkiaSSF_rm.pdf
http://slidepdf.com/reader/full/7010-0944-sokkiassfrmpdf 368/623
Setting up TS Survey
Sokkia Spectrum Survey Field Reference Manual10-6
Multi-Point Backsight
To access the Multi-Pnt BS screen (Figure 10-5), press the menu icon
next to the Map icon in the BS Point field and select the Multiple BS item. Multiple backsight points can generate more precisemeasurements.
On the Meas tab, edit the following parameters:
Figure 10-5. Multi-Point BS
• Point – the known point name. Can be selected from the map orfrom the list.
• Code – the known point code.
• HR – the height of the rod (target).• Measure Foresight Direct – press the Meas button to take the
sideshot of the point.
• Settings – opens the Mode screen (see “Survey Parameters” onpage 3-41).
• The Help Icon on the upper-left corner of the Multi-Pnt BS screen displays a pop-up menu containing six items:
– Edit Points: opens the Points list (see “Points” on page 6-2).
– Inverse: opens the Inverse COGO screen (see “Inverse” on
page 14-3).

8/10/2019 7010-0944 - SokkiaSSF_rm.pdf
http://slidepdf.com/reader/full/7010-0944-sokkiassfrmpdf 369/623
Backsight Survey
P/N 7010-0944 10-7
– Notes: opens the Notes screen.
– PTL Mode: opens the PTL Mode screen (see “PTL Point” on
page 6-12).– Display Coord : if selected, the coordinates of the previous
point measured displays below HR data.
– Help: accesses the Help files.
The Data tab (Figure 10-6) on the Multi-Pnt BS screen shows theresults of the current measurement and the scale factor and standard
deviations of the coordinates.
The Map tab shows all points in graphic mode. For details on mapproperties and customizing, see “Viewing Map” on page 15-1.
The Set tab on the Multi-Pnt BS screen (Figure 10-6) displaysmeasurement results of the sideshots being done during one set: the
Res HA (residuals of the horizontal angles) and the measured andinitial parameters ( HR, HA, and so forth)
Figure 10-6. Multi Point BS – Meas Set Tab
• Remove – deletes the highlighted measurement from the set.
• Re-Meas – replaces the current measurement with a newmeasurement.
• Accept – stores the new coordinates in the database.

8/10/2019 7010-0944 - SokkiaSSF_rm.pdf
http://slidepdf.com/reader/full/7010-0944-sokkiassfrmpdf 370/623
Setting up TS Survey
Sokkia Spectrum Survey Field Reference Manual10-8
Check Backsight
The BS Survey screen (Figure 10-7) shows information about the
backsight point errors.
Figure 10-7. Check Backsight
There are two fields at the top of the page for the height of the
instrument and the azimuth.
Station and Offset
The Station and Offset screen (Figure 10-8 on page 10-9) calculates apoint defined by the number of stations on the road and an offset fromthis station.
Select the road from the list and enter the desired station, offset and
elevation.
Press the OK button to open the Add Point screen on which to add thecalculated point to the list of points. The Backsight Survey screenopens with this occupation point.
NOTICE
HD and VD does not display if only an azimuth
(direction) has been entered for the backsight.

8/10/2019 7010-0944 - SokkiaSSF_rm.pdf
http://slidepdf.com/reader/full/7010-0944-sokkiassfrmpdf 371/623
Backsight Survey
P/N 7010-0944 10-9
Figure 10-8. Station and Offset
Set Measurement Mode
To toggle between sideshot modes, press the Settings button on anySurvey screen. The Mode screen (Figure 10-9 on page 10-10)
displays. Select one of three measurement methods, Sideshot Dir ,Sideshot-Dir/Rev, or Ang/Dist Sets-Dir/Rev.
• Sideshot-Dir – defines the measurement to a single point, takenusing the Direct position of the Total Station.
• Sideshot - Dir/Rev – defines that the measurement to a single point
is taken using the Direct Position and the Reverse Position of theTotal Station (that is, Plunge – Flip and Rotate the Total stationby 180 degrees to get the reverse measurement). Thismeasurement method is known as Multiple, in which case the Set tab appears in the SS-Dir/Rev screen. One set consists of one
direct and one reverse measurement. These measurements areused to eliminate the Vertical and Horizontal circle centeringerrors.
• Ang/Dist Sets-Dir/Rev – during the measurement, defines the
instrument that uses the specified Angle sequence to performrepeated measurements. In this case the SS-Dir/Rev screen also
has the Set tab. The sequence of four measurements constitutes

8/10/2019 7010-0944 - SokkiaSSF_rm.pdf
http://slidepdf.com/reader/full/7010-0944-sokkiassfrmpdf 372/623
Setting up TS Survey
Sokkia Spectrum Survey Field Reference Manual10-10
one set. One measurement is the backsight in Direct face or the
Foresight in Reverse face in two positions of the Total Station.These measurements are used to eliminate the Vertical and
Horizontal circle centering errors.
Figure 10-9. Mode - Measurement Method
• Next – opens the next Mode screen to set the order and the typeof the measurements in one set (Figure 10-10).
Figure 10-10. Mode - Type of Measurements
For a description of other parameters on these screens, see “SurveyParameters” on page 3-41).

8/10/2019 7010-0944 - SokkiaSSF_rm.pdf
http://slidepdf.com/reader/full/7010-0944-sokkiassfrmpdf 373/623
Resection
P/N 7010-0944 10-11
Resection
The method of resection computes the coordinates of an occupation
point, where the instrument is set up, using measurements to two (ormore) points with known coordinates.
To access the Resection option, tap the Resection icon. TheOccupation Pt screen displays first to set the occupation point(Figure 10-11).
To perform resection for the occupation point selected in the BS
Survey screen, press the menu icon next to the Map icon in the Occ.
Point field of this screen and select the Resection item (Figure 10-2on page 10-2).
Occupation Point
The Occupation Pt screen sets the name of the point, the heights of
the instrument, and the target (Figure 10-11).
Figure 10-11. Occupation Point
• Next – opens the resection screen to take measurements to known
points.

8/10/2019 7010-0944 - SokkiaSSF_rm.pdf
http://slidepdf.com/reader/full/7010-0944-sokkiassfrmpdf 374/623
Setting up TS Survey
Sokkia Spectrum Survey Field Reference Manual10-12
Resection 3D
The Resection 3D screen calculates a three dimensional resection of
the occupied point (Figure 10-12). Use the 2D/3D option to selectperforming either a two or three dimensional resection.
Figure 10-12. Resection 3D
The Measurement tab takes the measurements to known points.
• Point – the known point name; select from either the map or fromthe list.
• Code – the known point code.
• HR – the height of the rod (target). Saves settings from theOccupation Pt screen.
• Meas – takes the sideshot to the point and displays the
measurements of the point below the HR data.
• Settings – opens the Mode screen (see “Survey Parameters” onpage 3-62).
• The Help Icon in the upper-left corner displays the followingpop-up menu items:
– Edit Points: opens the Points list (see “Points” on page 6-2).
– Inverse: opens the Inverse COGO screen (see “Inverse” on
page 14-3).

8/10/2019 7010-0944 - SokkiaSSF_rm.pdf
http://slidepdf.com/reader/full/7010-0944-sokkiassfrmpdf 375/623
Resection
P/N 7010-0944 10-13
– Notes: opens the Note screen for to add notes to the
measurement session (if preferred).
– PTL Mode: switches on the PTL (Point-To-Line) Mode. (Thescreen changes to Points (PTL).) For details, see “PTLMode” on page 11-6.
– Remote Settings (for Robotic mode only): opens the Search/
Track Parameters screen (see “Staked Point Icon” on page 3-47).
– Config Link (only for the Robotic mode): opens the
Configure Link screen (see “Configure Link” on page 13-7).– Options: opens the Resection Options screen (see “Resection
Options” on page 10-15).
– Help: accesses the Help files.
The Data tab shows the current measurement data.
The Map tab shows all points in a graphic mode and allows selection
of a point for measurement and performing measurements(Figure 10-13).
Figure 10-13. Resection 3D - Map Tab
For details on map properties and customizing, see “Viewing Map”on page 15-1.
The Set tab displays the result of the sideshots being done(Figure 10-14 on page 10-14).

8/10/2019 7010-0944 - SokkiaSSF_rm.pdf
http://slidepdf.com/reader/full/7010-0944-sokkiassfrmpdf 376/623
Setting up TS Survey
Sokkia Spectrum Survey Field Reference Manual10-14
Figure 10-14. Resection – Meas Set Tab
• Sd N , Sd E , Sd H – displays Standard deviations for North, Eastand Height, respectively.
• Ground to Grid scale – displays the calculated scale factor.
• Accept – opens the Store Point screen (Figure 10-15 onpage 10-15) to save the new point.
• Re-Meas – replaces the current measurement with a new
measurement.
• Remove – deletes the selected measurement.
• Use Ctrl – toggles through specific measurements in the
resection, for example the horizontal angle, but not the vertical,or vice versa. The used measurements are listed in the Usecolumn. For example, HVSD indicates that the Horizontal angle,Vertical angle and the Slope Distance were used.
Store Point
The Store Point screen (Figure 10-15 on page 10-15) saves the
resection point in the job.

8/10/2019 7010-0944 - SokkiaSSF_rm.pdf
http://slidepdf.com/reader/full/7010-0944-sokkiassfrmpdf 377/623
Resection
P/N 7010-0944 10-15
Figure 10-15. Store Point
This is a standard screen adding a new point. For details on thisscreen see “Editing a Point” on page 6-6.
Resection OptionsThe Resection Options screen (Figure 10-16) sets the resection type:whether to calculate the height (3-D) or just the horizontal
coordinates (2-D).
Figure 10-16. Resection Options
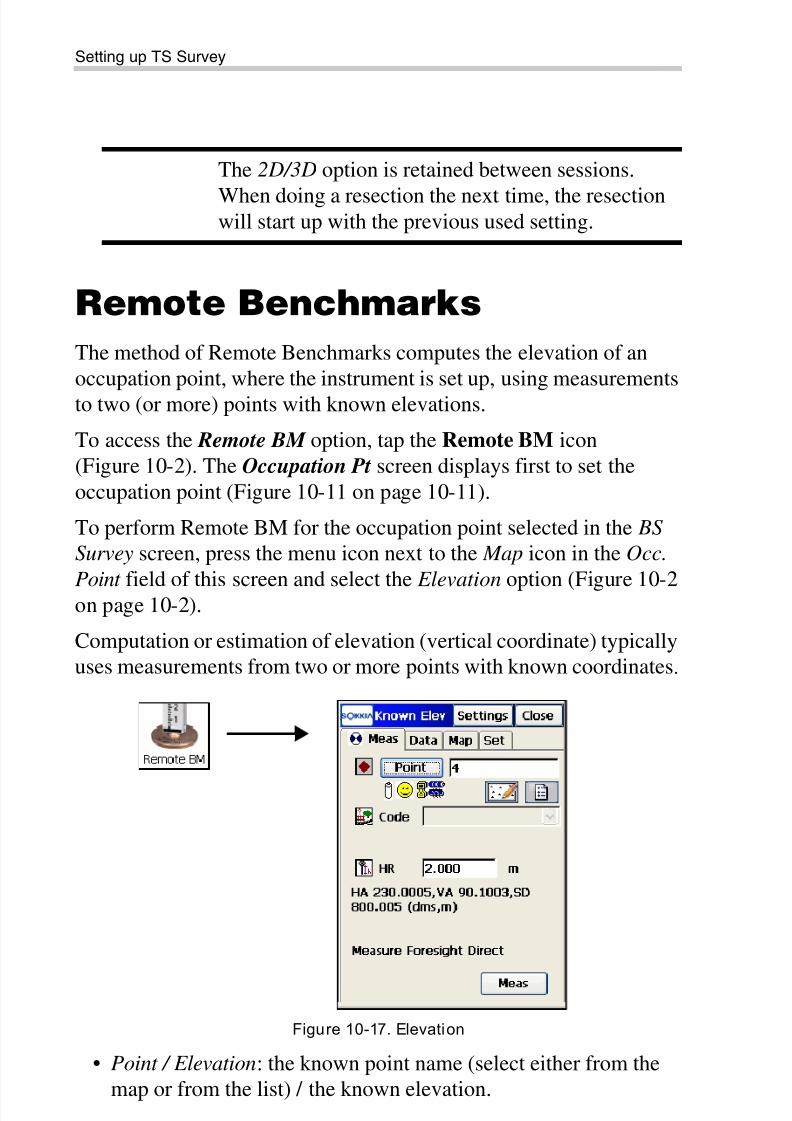
8/10/2019 7010-0944 - SokkiaSSF_rm.pdf
http://slidepdf.com/reader/full/7010-0944-sokkiassfrmpdf 378/623
Setting up TS Survey
Sokkia Spectrum Survey Field Reference Manual10-16
Remote Benchmarks
The method of Remote Benchmarks computes the elevation of anoccupation point, where the instrument is set up, using measurementsto two (or more) points with known elevations.
To access the Remote BM option, tap the Remote BM icon(Figure 10-2). The Occupation Pt screen displays first to set the
occupation point (Figure 10-11 on page 10-11).
To perform Remote BM for the occupation point selected in the BS
Survey screen, press the menu icon next to the Map icon in the Occ.
Point field of this screen and select the Elevation option (Figure 10-2on page 10-2).
Computation or estimation of elevation (vertical coordinate) typicallyuses measurements from two or more points with known coordinates.
Figure 10-17. Elevation
• Point / Elevation: the known point name (select either from themap or from the list) / the known elevation.
The 2D/3D option is retained between sessions.
When doing a resection the next time, the resectionwill start up with the previous used setting.

8/10/2019 7010-0944 - SokkiaSSF_rm.pdf
http://slidepdf.com/reader/full/7010-0944-sokkiassfrmpdf 379/623
Remote Benchmarks
P/N 7010-0944 10-17
• Code – the known point code.
• HR – the height of the rod (target).
• Measure Foresight Direct – press the Meas to take the sideshotto the point.
• Settings – opens the Mode screen (see “Set Measurement Mode”on page 10-9).
• The Help Icon on the upper-left corner displays the same pop-upmenu as for the Resection task, except the Options item displays.
The Data tab shows the results of the current measurement and the
scale factor and standard deviations of the coordinates.
The Map tab shows all points in a graphic mode. For details on mapproperties and customizing, see “Viewing Map” on page 15-1.
The Meas Set tab displays the results of the sideshots being doneduring one set, the same as for the Resection task.
Figure 10-18. Elevation – Meas Set Tab
The table (Figure 10-18) represents the result list of themeasurements being made: the residuals of the vertical and horizontalangles, the measured and initial parameters ( HR, HA, VA, and so
forth). The Ht Diff column represents the difference between thecalculated height and the height of that measurement.
• Remove – deletes highlighted measurements in the elevation.

8/10/2019 7010-0944 - SokkiaSSF_rm.pdf
http://slidepdf.com/reader/full/7010-0944-sokkiassfrmpdf 380/623
Setting up TS Survey
Sokkia Spectrum Survey Field Reference Manual10-18
• Re-Meas – replaces the current measurement with a new
measurement.
• Accept – stores the new coordinates in the database.• Settings –
• Close –
Remote Control
To set up a survey with remote control, tap the Remote Control icon.
If one person performs the survey process with a motorized
instrument, the remote control transmits commands from thecontroller to the total station. The radio modems need to be set andconnected to the controller and the instrument.
The Remote Cntrl screen (Figure 10-19) controls the total stationthrough the radio.
Figure 10-19. Remote Control o the Total Station
The Remote tab shows the current values of the total station
measurements and provides a set of tools for control:• – shows the battery status for the total station.
• – shows the status of communication between the controller
and total station.

8/10/2019 7010-0944 - SokkiaSSF_rm.pdf
http://slidepdf.com/reader/full/7010-0944-sokkiassfrmpdf 381/623
Remote Control
P/N 7010-0944 10-19
• – switches the keyboard control on/off; shows the current
status of the switch.
• Qlock – sends the “Quicklock” or “Turn Around” commandwhich causes the total station to search for the RC-21.
• Search – makes the instrument search for the prism.
• Lock – locks onto the prism or “tracks” it.
• Turn – opens the Rotate screen (Figure 10-21 on page 10-21)which allows the total station to turn to various angles or points.
• Stop – makes the total station stop tracking the prism and go into“Standby” mode.
• The Data Indicator above the Qlock button shows the currentstatus of the total station. There are four status types: no data,querying status, turning, and receiving data.
• All the observations can be done in remote mode as well if theinstrument chosen is robotic.
• The Help Icon in the upper-left corner of the screen displays the
pop-up menu containing seven items:
– Edit Points: opens the Points list.
– Inverse: opens the Inverse COGO screen.
– Notes: opens the Notes screen (see “The Topo Menu” on
page 9-3).
– PTL Mode: opens the PTL Mode screen (see “PTL Mode” onpage 11-6).
– Remote Settings: opens the Search/Track screen.
– Config Link : opens the Configure Link screen (for details,see “Configure Link” on page 13-7).
– Display Coord : if selected, the coordinates of the previous
point measured displays below the HR data.
1. RC-2 is the Remote Control System 2 for optical communications. For
instructions of how to operate the RC-2 device, consult the instruction
manual for RC-2.

8/10/2019 7010-0944 - SokkiaSSF_rm.pdf
http://slidepdf.com/reader/full/7010-0944-sokkiassfrmpdf 382/623
Setting up TS Survey
Sokkia Spectrum Survey Field Reference Manual10-20
– Help: accesses the Help files.
The Map tab shows all points in a graphic mode. For details, on map
properties and customizing, see “Viewing Map” on page 15-1.When the Robotic total station operates in Remote Control Mode,some of the screens change their appearance. The remote controltools display on the Measurement tab (Figure 10-20) of the Resection
screen.
Figure 10-20. Sample Screen for Remote Control Mode
Rotate
The Rotate screen (Figure 10-21 on page 10-21) contains settings for
rotation of the remote total station.
• Rotation Angles – sets the values of the horizontal and verticalrotation angles.
• Turn – sends the data to the total station. The corresponding iconshows the rotation process.
• Rotate to Point – selects a point by typing its name, selecting itfrom the map or a list, or inserting the HR value (height of rod ortarget). Press the Turn button.
• Plunge TS – press to plunge the instrument (rotate the telescopeand the body by 180 degrees).

8/10/2019 7010-0944 - SokkiaSSF_rm.pdf
http://slidepdf.com/reader/full/7010-0944-sokkiassfrmpdf 383/623
Remote Control
P/N 7010-0944 10-21
Figure 10-21. Rotate the Remote Total Station

8/10/2019 7010-0944 - SokkiaSSF_rm.pdf
http://slidepdf.com/reader/full/7010-0944-sokkiassfrmpdf 384/623
Setting up TS Survey
Sokkia Spectrum Survey Field Reference Manual
Notes:
10-22
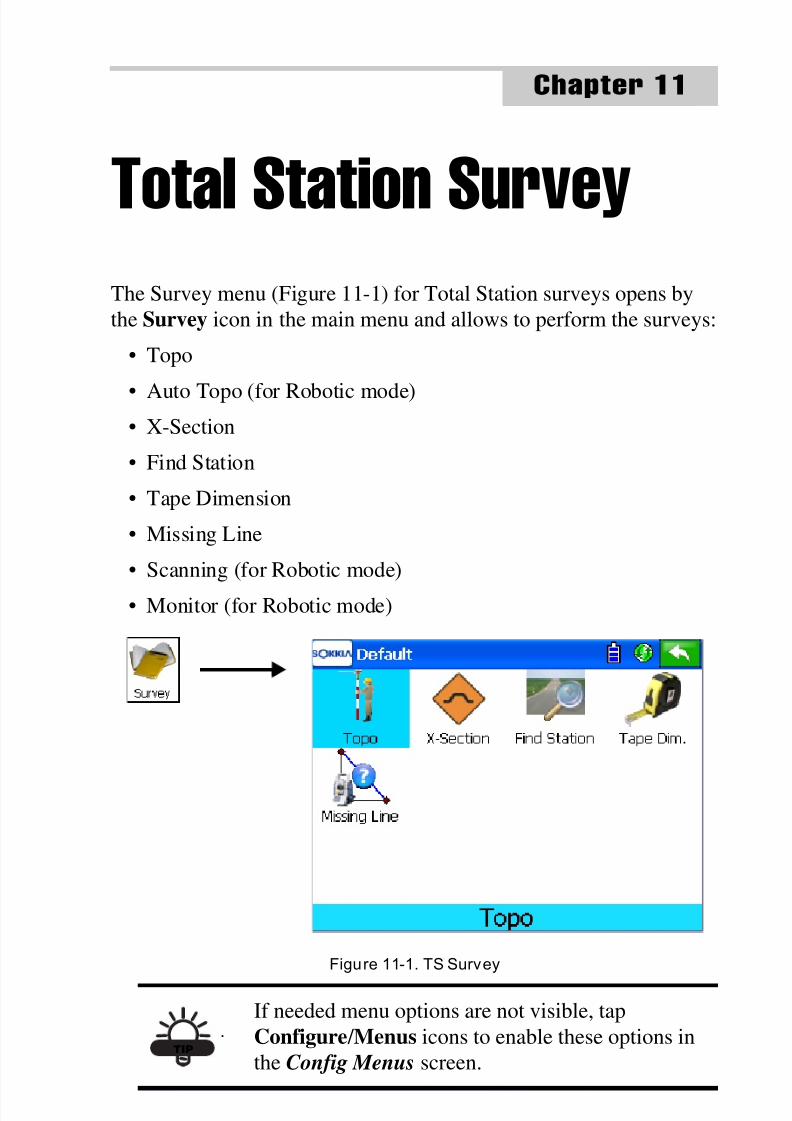
8/10/2019 7010-0944 - SokkiaSSF_rm.pdf
http://slidepdf.com/reader/full/7010-0944-sokkiassfrmpdf 385/623
P/N 7010-0944
Chapter 11
11-1
Total Station SurveyThe Survey menu (Figure 11-1) for Total Station surveys opens bythe Survey icon in the main menu and allows to perform the surveys:
• Topo
• Auto Topo (for Robotic mode)• X-Section
• Find Station
• Tape Dimension
• Missing Line
• Scanning (for Robotic mode)
• Monitor (for Robotic mode)
Figure 11-1. TS Survey
TIP
If needed menu options are not visible, tap
Configure / Menus icons to enable these options inthe Config Menus screen.

8/10/2019 7010-0944 - SokkiaSSF_rm.pdf
http://slidepdf.com/reader/full/7010-0944-sokkiassfrmpdf 386/623
Total Station Survey
Sokkia Spectrum Survey Field Reference Manual11-2
The Help Icon opens a pop-up menu giving access to the helpfiles, module activation codes, port data logging, changing menu
interface, and information about the Sokkia SSF used (for detail see“Help Icon’s Pop-up Menu” on page 1-9).
Topo
To toggle between sideshot modes (Figure 11-2), press the Settings button on any Survey screen. Select one of three measurement
methods from the Meas Method drop-down list, Sideshot Dir ,Sideshot-Dir/Rev, or Ang/Dist Sets-Dir/Rev. For a description of other
parameters on this screen, see “Survey Parameters” on page 3-62 formore information).
Figure 11-2. Mode
• Sideshot-Dir – defines that the measurement to a single point istaken using the Direct position of the Total Station.
• Sideshot - Dir/Rev – defines the measurement to a single point thatis taken using the Direct Position and the Reverse Position of the
Total Station (that is, Plunge – Flip and Rotate the Total stationby 180 degrees to get the reverse measurement). Thismeasurement method is known as Multiple, in which case the Set tab displays in the SS-Dir/Rev screen. One set consists of one
direct and one reverse measurement. These measurements are

8/10/2019 7010-0944 - SokkiaSSF_rm.pdf
http://slidepdf.com/reader/full/7010-0944-sokkiassfrmpdf 387/623
Topo
P/N 7010-0944 11-3
used to eliminate the Vertical and Horizontal circle centering
errors.
• Ang/Dist Sets-Dir/Rev – defines that during the measurement, theinstrument uses the specified Angle sequence to perform repeatedmeasurements. In this case the SS-Dir/Rev screen also has the Set
tab. The sequence of four measurements constitutes one set. Onemeasurement is the backsight in Direct face or the Foresight in
Reverse face in two positions of the Total Station. Thesemeasurements are used to eliminate the Vertical and Horizontalcircle centering errors.
• Next – opens the next Mode screen to set the order and the type
of the measurements in one set.
Figure 11-3. Mode - Type of Measurements
For a description of other parameters on the Mode screens, see“Survey Parameters” on page 3-41 for more information).

8/10/2019 7010-0944 - SokkiaSSF_rm.pdf
http://slidepdf.com/reader/full/7010-0944-sokkiassfrmpdf 388/623
Total Station Survey
Sokkia Spectrum Survey Field Reference Manual11-4
Sideshot-Direct
The Meas tab on the SS-Dir screen (Figure 11-4) contains the initial
data for performing single sideshots and displays the followinginformation during a survey.
Figure 11-4. Sideshot-Direct – Measurement Tab
• Point – sets the current point name. During the survey, thenumerical part of the name increments automatically by one. The
icon opens the Add Photo Notes screen to enter a photo note
for the point.
• Code – sets the Code for the current point: enter either manuallyor select a code from the drop-down list.
• – accesses the attributes of the selected code and opens theCode-Attributes screen (for details see “On the Point Attributes”on page 6-7).
• – shows battery status for the total station.
• – shows the status of communication between the controller
and the total station.
• – shows battery and memory status for the controller.

8/10/2019 7010-0944 - SokkiaSSF_rm.pdf
http://slidepdf.com/reader/full/7010-0944-sokkiassfrmpdf 389/623
Topo
P/N 7010-0944 11-5
• The menu icon next to the Attributes List icon displays a pop-up
menu containing three items:
– String: toggles on the String field. Also, the sign appears.– Layer : opens the Select Layer screen (see “On the Select
Layer” on page 6-10).
– Note: opens the Note screen. For details, see “The TopoMenu” on page 9-3.
• HR – sets the height of the target above the mark (rod height).
• The Help Icon in the upper-left corner of the screen displays apop-up menu containing seven items:
– Adv: opens the Backsight Survey screen for setting the nexttraverse point as the next occupation point. The current
occupation point becomes the next backsight point.
– Edit Points: opens the Points list.
– Inverse: opens the Inverse COGO screen.
– Notes: opens the Notes screen.
– PTL Mode: opens the PTL Mode screen (see “PTL Mode” onpage 11-6).
– Display Coord : if chosen, the coordinates of the previouspoint measured displays below the HR data(Figure 11-4 on page 11-4).
– Help: accesses the Help files.
• Measure Foresight Direct – Check and enable Traverse Point toopen the screen to set the coordinates of the point manually.
TIP
If more than two points have been tagged asTraverse Points, the ADV button displays a list box
with all tagged Traverse points from which to select
the next occupation point. Select OK, to display theBacksight screen, which automatically updates, asis the case when one TP point is available.
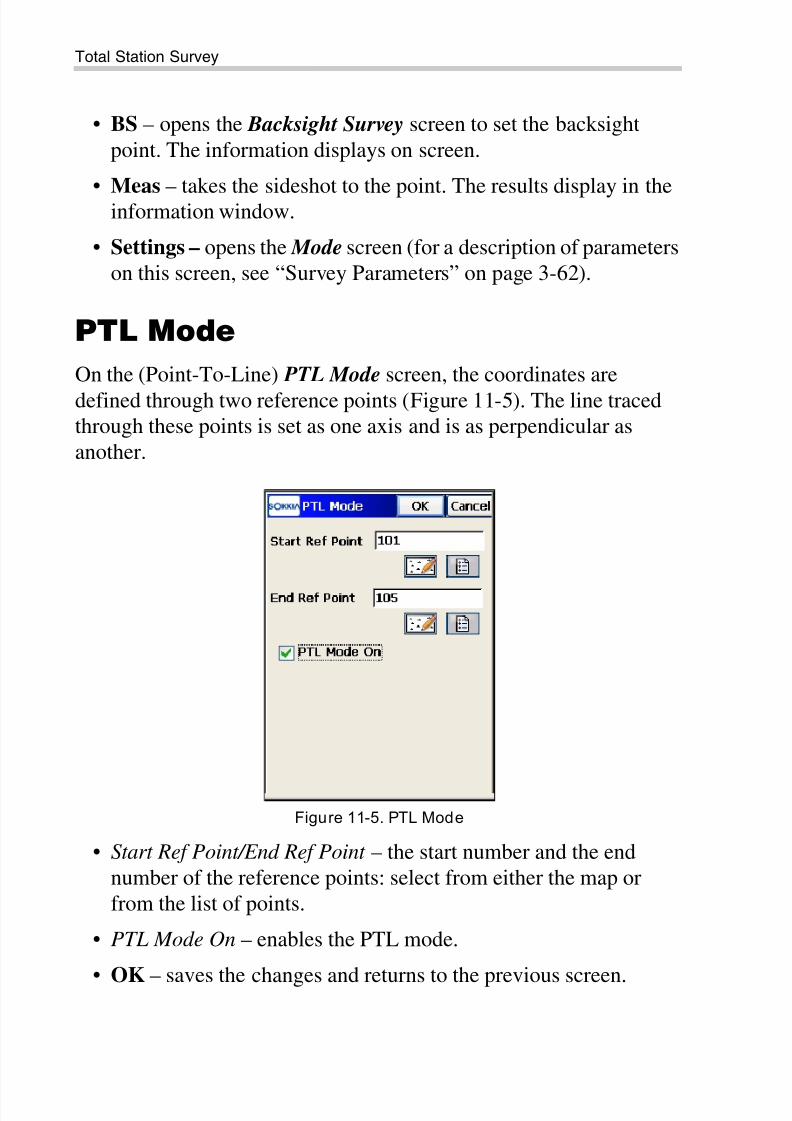
8/10/2019 7010-0944 - SokkiaSSF_rm.pdf
http://slidepdf.com/reader/full/7010-0944-sokkiassfrmpdf 390/623
Total Station Survey
Sokkia Spectrum Survey Field Reference Manual11-6
• BS – opens the Backsight Survey screen to set the backsight
point. The information displays on screen.
• Meas – takes the sideshot to the point. The results display in theinformation window.
• Settings – opens the Mode screen (for a description of parameterson this screen, see “Survey Parameters” on page 3-62).
PTL Mode
On the (Point-To-Line) PTL Mode screen, the coordinates are
defined through two reference points (Figure 11-5). The line tracedthrough these points is set as one axis and is as perpendicular asanother.
Figure 11-5. PTL Mode
• Start Ref Point/End Ref Point – the start number and the endnumber of the reference points: select from either the map orfrom the list of points.
• PTL Mode On – enables the PTL mode.
• OK – saves the changes and returns to the previous screen.

8/10/2019 7010-0944 - SokkiaSSF_rm.pdf
http://slidepdf.com/reader/full/7010-0944-sokkiassfrmpdf 391/623
Topo
P/N 7010-0944 11-7
The Data tab on the SS-Dir screen (Figure 11-6) contains the results
of the measurements, along with the initial data.
Figure 11-6. Sideshot-Direct – Data Tab
The Map tab (Figure 11-7) on the second SS-Dir screen performssideshots in the graphic mode. The buttons on the right duplicate the
controls on the first SS-Dir screen (Figure 11-4 on page 11-4).
Figure 11-7. Sideshot-Direct – Map Tab
For details on map properties and customizing, see “Viewing Map”
on page 15-1.
In the Sideshot Sets- Dir/Rev and Ang/dist Sets-Dir/Rev mode, the Set tab displays (Figure 11-8 on page 11-8).

8/10/2019 7010-0944 - SokkiaSSF_rm.pdf
http://slidepdf.com/reader/full/7010-0944-sokkiassfrmpdf 392/623
Total Station Survey
Sokkia Spectrum Survey Field Reference Manual11-8
The SS-Dir/Rev screen (Figure 11-8) contains the data collected
during the measurements, grouped by sets: the set for Multiple modecontains two measurements; the set of the Repeat mode contains four
measurements).
Figure 11-8. Ang/dist Sets-Dir/Rev – Meas Set Tab
• The columns on the Set tab displays the following parameters:
– Point : the name of the point.
– Res HA: Difference of each HA measurement within the setfrom the average of all the HAs in the set.
– Res VA: Difference of each VA measurement within the setfrom the average of all the VAs in the set.
– Res SD: Difference of each SD measurement within the setfrom the average of all the SDs in the set.
– HR: the height of the rod (target).
– HA: Horizontal Angle measurement in the corresponding set.
– VA: Vertical Angle measurement in the corresponding set.
– SD: Slope Distance measurement in the corresponding set.
• Remove – deletes all measurements from the set.
• Re-Meas – displays the sideshot page to measure a new angle set.
• Accept – saves the measured point.
• Settings – opens the Mode screen (see Figure 11-2 on page 11-2).

8/10/2019 7010-0944 - SokkiaSSF_rm.pdf
http://slidepdf.com/reader/full/7010-0944-sokkiassfrmpdf 393/623
Topo
P/N 7010-0944 11-9
Offsets
The Offsets tab (Figure 11-9) on the SS-Dir screen contains a set of
tools to define the offsets.
Figure 11-9. Offsets
• Hz Angle – defines a point using the horizontal angle from onepoint and the distance to another (see “Horizontal Angle Offset”on page 11-10).
• Hz-Vt Angle – defines a point using horizontal and vertical angles(see “Horizontal/Vertical Angle” on page 11-13).
• Dist. Offset – defines a point giving the ability to add or subtract
distances, horizontally and vertically (see “Distance Offset” on
page 11-14).• Hidden Point – defines a point on the ground surface, with a
slanted rod touching the ground point (see page 11-16).
• 2 Line ISection – determines a point by the intersection of the twolines. Each line is defined by two points or two measurements(see “Two Line Intersection” on page 11-17).
• Line & Corner – determines a point on the corner using one line
defined by two points and a horizontal angle measurement.• Line & Offset – determines a point distant from a line defined by
two points.

8/10/2019 7010-0944 - SokkiaSSF_rm.pdf
http://slidepdf.com/reader/full/7010-0944-sokkiassfrmpdf 394/623
Total Station Survey
Sokkia Spectrum Survey Field Reference Manual11-10
• Plane & Corner – determines a point (Corner) by a plane, which
is defined by three points and horizontal/vertical anglemeasurements.
Horizontal Angle Offset
The Measurement tab of the HorAng Ofst screen (Figure 11-10)contains data for definition of a point using the horizontal angle from
one point and the distance to another.
Figure 11-10. Horizontal Angle Offset – Measurement Tab
• Point – name for the offset point to be stored. The photo note
icon opens the Add Photo Notes screen to enter a photo note forthe point.
• Code – code for the offset point to be stored. Can be enteredmanually or chosen from the drop-down list.
• – the Attributes List icon opens the list of available attributes(for details see “On the Point Attributes” on page 6-7).
• The menu icon close to the Attributes List icon displays apop-up menu containing three items:
– String: toggles on the String field. Also, the sign appears.
– Layer : opens the Select Layer screen (see “On the Select
Layer” on page 6-10).

8/10/2019 7010-0944 - SokkiaSSF_rm.pdf
http://slidepdf.com/reader/full/7010-0944-sokkiassfrmpdf 395/623
Topo
P/N 7010-0944 11-11
– Note: opens the Note screen. For details, see “The Topo
Menu” on page 9-3.
• HR – sets the target height above the mark (rod height).• Settings – opens the Mode screen for setting the sideshot mode.
• Side and Center – on the Take measurements in any order panel,press Center, then Side. Take measurements to Center andobtain vertical angle and horizontal angle measurements; a Side
measurement then provides VA, HA, and distance measurements.With these two sets of measurements, the computation can be
made for a point at the center of a tree; for example, when takingmeasurements, a comment displays on the screen.
• The Help Icon on the upper-left corner of the screen displays thepop-up menu containing nine items:
– Adv (Advance): opens the Backsight Survey screen forsetting the next traverse point as the next occupation point.The current occupation point becomes the next backsight
point.– Edit Points: opens the Points list.
– Edit Raw: opens the Raw TS screen (see “Edit Raw Data” onpage 6-38).
– Inverse: opens the Inverse COGO screen (see “Inverse” onpage 14-3).
– Intersection: opens the Intersection COGO screen (see“Compute the Intersection Point” on page 14-14).
– Note: opens the Notes screen (see “The Topo Menu” onpage 9-3)
– PTL Mode: opens the PTL Mode screen (see “PTL Mode” onpage 11-6).
– Display Coord : if selected, the coordinates of the previouspoint measured displays below the HR data(see Figure 11-4 on page 11-4).
– Help: accesses the Help files.

8/10/2019 7010-0944 - SokkiaSSF_rm.pdf
http://slidepdf.com/reader/full/7010-0944-sokkiassfrmpdf 396/623
Total Station Survey
Sokkia Spectrum Survey Field Reference Manual11-12
The following three tabs are similar to the Offset options:
• The Data tab (Figure 11-11) on the Horizontal Angle Offset
screen contains the data collected during the offset measurement.
Figure 11-11. Horizontal Angle Offset – Data Tab
• The Map tab (Figure 11-12) on the Horizontal Angle Offset screen contains the graphic view and duplicated controls from the Measurement tab. For the details on viewing and customizingproperties, see “Viewing Map” on page 15-1.
Figure 11-12. Horizontal Angle Offset – Map Tab
• The Offsets tab toggles to another offset option.

8/10/2019 7010-0944 - SokkiaSSF_rm.pdf
http://slidepdf.com/reader/full/7010-0944-sokkiassfrmpdf 397/623
Topo
P/N 7010-0944 11-13
Horizontal/Vertical Angle
The Measurement tab (Figure 11-13) on the H/VAng screen contains
data for definition of a point using horizontal and vertical angles.
Figure 11-13. Horizontal/Vertical Angle – Measurement Tab
• Point – name for the offset point to be stored. The photo note icon opens the Add Photo Notes screen to enter a photo note forthe point.
• Code – code for the offset point to be stored, which can be
entered manually or selected from the drop-down list.
• – the Attributes List icon lists available attributes (see “On
the Point Attributes” on page 6-7).• The menu icon next to the Attributes List icon and in the upper-
left corner of the screen displays the same lists as for the
Horizontal Angle Offset screen.
• HR – sets the target height (Rod Height).
• Prism – stores horizontal distance and horizontal anglemeasurements (to prism).
• HA/VA – combines horizontal angle and zenith anglemeasurements with horizontal distance logged in Prism step todetermine point location.
• Settings – opens the Mode screen for setting the sideshot mode.

8/10/2019 7010-0944 - SokkiaSSF_rm.pdf
http://slidepdf.com/reader/full/7010-0944-sokkiassfrmpdf 398/623
Total Station Survey
Sokkia Spectrum Survey Field Reference Manual11-14
See the Horizontal Angle Offset measurement for other tabs.
Distance Offset
The Measurement tab (Figure 11-14) on the Dist Ofst screen containsthe parameters for definition of a point. You can add or subtract
distances, horizontally and vertically.
Figure 11-14. Distance Offset – Measurement Tab
• Point – name for the offset point to be stored. The photo note icon opens the Add Photo Notes screen to enter a photo note for
the point.
• Code – code for the offset point to be stored: enter either
manually or select from the drop-down list.• – The Attributes List icon opens the list of available
attributes.
• The menu icons next to the Attributes List icon, located in theupper-left corner of the screen, displays the same lists as thoseshown on the Horizontal Angle Offset screen.
• HR – sets the target height above the mark (rod height).
• – shows the battery and memory status for the controller.

8/10/2019 7010-0944 - SokkiaSSF_rm.pdf
http://slidepdf.com/reader/full/7010-0944-sokkiassfrmpdf 399/623
Topo
P/N 7010-0944 11-15
After the sideshot is taken, the Enter Distance Offsets screen
(Figure 11-15) displays to enter 3 distance offsets:
Figure 11-15. Distance Offset Screen
– Away/(Toward): sets the distance between the current pointand the projection of the offset point on the line of sight.
– Right/(Left): sets the distance between the offset point andits projection, taking into consideration the location relative
to the line of sight.
– Up/(Down): sets the height of the point, relative to the currentposition.
• Meas – performs the measurement (Figure 11-14 on page 11-14).
• Settings – opens the Mode screen for setting the sideshot mode.(Figure 11-14 on page 11-14)
The Data, Map and Offsets tabs are similar to those in the Horizontal
Angle Offset measurement.
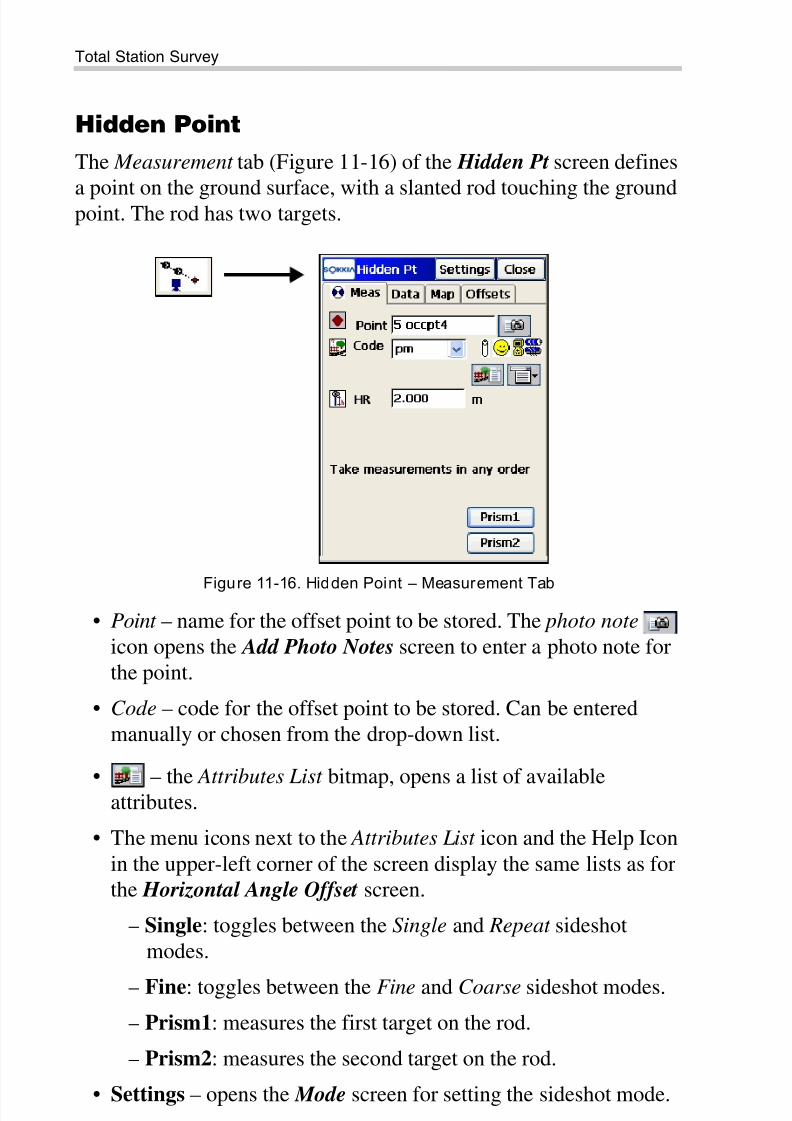
8/10/2019 7010-0944 - SokkiaSSF_rm.pdf
http://slidepdf.com/reader/full/7010-0944-sokkiassfrmpdf 400/623
Total Station Survey
Sokkia Spectrum Survey Field Reference Manual11-16
Hidden Point
The Measurement tab (Figure 11-16) of the Hidden Pt screen defines
a point on the ground surface, with a slanted rod touching the groundpoint. The rod has two targets.
Figure 11-16. Hidden Point – Measurement Tab
• Point – name for the offset point to be stored. The photo note icon opens the Add Photo Notes screen to enter a photo note forthe point.
• Code – code for the offset point to be stored. Can be enteredmanually or chosen from the drop-down list.
• – the Attributes List bitmap, opens a list of availableattributes.
• The menu icons next to the Attributes List icon and the Help Icon
in the upper-left corner of the screen display the same lists as forthe Horizontal Angle Offset screen.
– Single: toggles between the Single and Repeat sideshotmodes.
– Fine: toggles between the Fine and Coarse sideshot modes.
– Prism1: measures the first target on the rod.
– Prism2: measures the second target on the rod.
• Settings – opens the Mode screen for setting the sideshot mode.

8/10/2019 7010-0944 - SokkiaSSF_rm.pdf
http://slidepdf.com/reader/full/7010-0944-sokkiassfrmpdf 401/623
Topo
P/N 7010-0944 11-17
Two Line Intersection
The Measurement tab (Figure 11-17) on the 2Line Intersection
screen contains data for determination of a point by the intersection oftwo lines. Each line is defined by two points or by two measurements.
Figure 11-17. Two LIne Intersect ion – Measurement Tab
• Point – name for the offset point to be stored. The photo note icon opens the Add Photo Notes screen to enter a photo note for
the point.
• Code – code for the offset point to be stored. Can be entered
manually or chosen from the drop-down list.
• – the Attributes List icon, opens the list of available
attributes.
• The menu icons next to the Attributes List icon and the Help Iconin the upper-left corner of the screen display the same lists as for
the Horizontal Angle Offset screen.
• HR – sets the target height above the mark (rod height).
• Line 1 Pt1 and Line 1 Pt2 – obtains measurements to determine
the first and second points defining the first line.• Line 2 Pt 1 and Line 2 Pt 2 – obtains measurements to determine
the first and second points defining the second line.

8/10/2019 7010-0944 - SokkiaSSF_rm.pdf
http://slidepdf.com/reader/full/7010-0944-sokkiassfrmpdf 402/623

8/10/2019 7010-0944 - SokkiaSSF_rm.pdf
http://slidepdf.com/reader/full/7010-0944-sokkiassfrmpdf 403/623
Topo
P/N 7010-0944 11-19
• Line Pt2 – obtain measurements to determine first point defining
a line.
• Corner – obtain the horizontal angle to locate a point on line atthe corner.
• Settings – opens the Mode screen for setting the sideshot mode.
Line and Offset
The Measurement tab (Figure 11-19) on the Line&Ofst screencontains data for determination of a point distant from a line defined
by two points.
Figure 11-19. Line and Offset – Measurement Tab
• Point – name for the offset point to be stored. The photo note icon opens the Add Photo Notes screen to enter a photo note forthe point.
• Code – code for the offset point to be stored. Can be enteredmanually or chosen from the drop-down list.
• – the Attributes List icon, opens a list of available attributes.
• The menu icon next to the Attributes List icon and the Help Iconin the upper-left corner of the screen display the same lists as forthe Horizontal Angle Offset screen.
• HR – sets the target height above the mark (rod height).

8/10/2019 7010-0944 - SokkiaSSF_rm.pdf
http://slidepdf.com/reader/full/7010-0944-sokkiassfrmpdf 404/623
Total Station Survey
Sokkia Spectrum Survey Field Reference Manual11-20
• Line Pt1 – obtains measurements to first point on a line.
• Line Pt2 – obtains measurements to second point on a line.
• Settings – opens the Mode screen for setting the sideshot mode.
After the lines are measured, the Enter Distance Offsets screendisplays to enter offsets (see Figure 11-15 on page 11-15):
• Forward/Backward – sets the distance between the current pointand the projection of the offset point on the line of sight.
• Up/Down – sets the height of the point relatively to the currentposition.
• Right/Left – sets the distance between the offset point and itsprojection, taking into consideration its location relative to the
line of sight.
The Data, Map and Offsets tabs are similar to that of the Horizontal
Angle Offset measurement.
Plane and CornerThe Measurement tab (Figure 11-20) on the Pln&Corner screenhelps determine a point (Corner), using a plane defined with threepoints and an angle measurement.
Figure 11-20. Plane (Point) and Corner – Measurement Tab

8/10/2019 7010-0944 - SokkiaSSF_rm.pdf
http://slidepdf.com/reader/full/7010-0944-sokkiassfrmpdf 405/623
Topo
P/N 7010-0944 11-21
• Point – name for the offset point to be stored. The icon opens
the Add Photo Notes screen to enter a photo note for the point.
• Code – code for the offset point to be stored: enter eithermanually or select from the drop-down list.
• – the Attributes List icon opens a list of available attributes
for the selected code.
• The menu icons next to the Attributes List icon and the Help Iconin the upper-left corner of the screen display the same lists as for
the Horizontal Angle Offset screen.
• HR – sets the target (rod) height above the mark.
• Plane 1 – obtains measurements to determine the first point in aplane.
• Plane 2 – obtains measurements to determine the second point ina plane.
• Plane 3 – obtains measurements to determine the third point in a
plane.
• Crnr – obtains horizontal and vertical angle measurements todetermine corner point in a plane.
• Settings – opens the Mode screen to set the sideshot mode.
The Data, Map, and Offsets tabs are similar to that of the Horizontal
Angle Offset measurement.
NOTICE
The three points defining a plane must be not becolinear (all on the same line).

8/10/2019 7010-0944 - SokkiaSSF_rm.pdf
http://slidepdf.com/reader/full/7010-0944-sokkiassfrmpdf 406/623
Total Station Survey
Sokkia Spectrum Survey Field Reference Manual11-22
Auto Topo
This function is activated only with Robotic instruments, and collectspoints by Time and Distance. To open the Auto Topo screen(Figure 11-22), select the Auto Topo icon in the Robotic mode.
Figure 11-21. Auto Topo
The Help Icon in the upper-left corner of the screen displays a pop-upmenu containing nine items:
• Edit Points – opens the Points list.
• Inverse – opens the Inverse COGO screen.
• Notes – opens the Notes screen.
• PTL Mode – opens the PTL Mode screen (see “PTL Mode” onpage 11-6).
• Remote settings – opens the Search/Track Parameters screen(see “Stake Parameters” on page 3-44).
• Config Link – opens the Configure Link screen (see “ConfigureLink” on page 13-7).
• BS Setup – opens the Backsight Survey screen (see “BacksightSurvey” on page 10-2).

8/10/2019 7010-0944 - SokkiaSSF_rm.pdf
http://slidepdf.com/reader/full/7010-0944-sokkiassfrmpdf 407/623
Auto Topo
P/N 7010-0944 11-23
• Display Coord – if selected, the coordinates of the previous point
measured displays below the HR data (see Figure 11-4 onpage 11-4).
• Help – accesses the Help files.
The Measurement tab on the Auto Topo screen (Figure 11-21 onpage 11-22) contains the initial data for the survey:
• Point – displays the current point name. The photo note iconopens the Add Photo Notes screen to enter a photo note for thepoint.
• Code – displays the current point code: either enter manually orselect from the drop-down list.
• – selects attributes for the selected code.
• The menu icon next to the Attributes List icon displays a pop-upmenu containing three items:
– String: switches on the String field. (The sign also
appears.)
– Layer : opens the Select Layer screen (see “On the SelectLayer” on page 6-10).
– Note: opens the Notes screen (see “The Topo Menu” onpage 9-3).
• HR – the height of the rod (target).
• Log Now – immediately stores the current position.
• Start – starts the survey process. After pressing, the buttonchanges (toggles) to Stop. Press again to stop the survey process.
• Qlock – sends the “Quicklock” or “Turn Around” command
which causes the total station to search for the RC-21.
• Search – make the instrument search for the prism.
• Lock – lock onto the prism or “track” it.
1. RC-2 is the Remote Control System 2 for optical communications. For
instructions of how to operate the RC-2 device, consult the instruction
manual for RC-2.

8/10/2019 7010-0944 - SokkiaSSF_rm.pdf
http://slidepdf.com/reader/full/7010-0944-sokkiassfrmpdf 408/623
Total Station Survey
Sokkia Spectrum Survey Field Reference Manual11-24
• Turn – opens the Rotate screen, which allows the total station to
turn to various angles or points.
• Stop – causes the total station to stop tracking the prism and gointo “Standby” mode.
• Settings – opens the Mode screen (see Figure 11-2 on page 11-2).Press Next to access the Auto Topo settings (Figure 11-22 on
page 11-24):
– Method: sets the method of data collection; either By Time, By
Horizontal Distance, or By Slope Distance.
– Interval: the time interval for the data collection.
• Press Finish to save the changes and return to the Auto Topo screen.
Figure 11-22. Mode Screen – Auto Topo Settings
The Data tab displays the data being surveyed.
The Map tab shows the surveyed data graphically and duplicates thecontrols from the Meas tab to perform the survey to work in mapmode.

8/10/2019 7010-0944 - SokkiaSSF_rm.pdf
http://slidepdf.com/reader/full/7010-0944-sokkiassfrmpdf 409/623
Cross-Section
P/N 7010-0944 11-25
Cross-Section
To perform a cross-section survey of the selected road, select the
X-Section icon. The Cross Section screen displays.
The Cross Section screen contains station settings for a selected road,where the cross section survey is to be performed.
Figure 11-23. Cross Section
• Road – select the road from the Roads list.
• Cl Code – the code of the center line points: manually enter a
road or either select one from the drop-down list.
• – the Attributes List icon opens the list of available attributes
(for details see “On the Point Attributes” on page 6-7).
• The menu icon next to the Attributes List icon displays the String option to switch on the String field (see “Topo” on page 11-2).
• Station/Chainage: sets the station/distance where the crosssection is surveyed.
• Interval – the increment of distance towards the next station.
NOTICE
The Station/Chainage and Interval fields displayONLY if the road is selected.

8/10/2019 7010-0944 - SokkiaSSF_rm.pdf
http://slidepdf.com/reader/full/7010-0944-sokkiassfrmpdf 410/623
Total Station Survey
Sokkia Spectrum Survey Field Reference Manual11-26
• The Help Icon in the upper-left corner of the screen displays a
pop-up menu containing two items:
– Edit Roads: enables the Roads screen. See “Roads” onpage 7-2.
– Help: accesses the Help files.
• OK – saves the changes and opens a screen to perform sideshotmeasurements. Toggling between the sideshot modes is
performed from the Measurement Method field in the two Mode screens opened by the Settings button in the XSect-Dir
( XSect- Dir/Rev) screen.
XSection - Direct
The XSect-Dir screen (Figure 11-24) performs the usual observation
work, relative to the cross-section.
Figure 11-24. Cross Section - Direct
The survey is performed from one side of the road to another in aplane perpendicular to the center line. If the road has not been set,define the plane. On the first station, the survey is performed so that
the next point has a different code, for example A, B, C, cl, D, E, F .Press the Close button to automatically change the station number.The application suggests that the survey on the next station uses thesame codes in the opposite order: F, E, D, cl, C, B, A. The line iscreated along the points with the “cl” code.

8/10/2019 7010-0944 - SokkiaSSF_rm.pdf
http://slidepdf.com/reader/full/7010-0944-sokkiassfrmpdf 411/623
Find Station
P/N 7010-0944 11-27
For a detailed description of the survey process, see “Topo” on
page 11-2. The only difference lies in the presence of the Cur Stn/
Cur Chn button. Similar to the Meas button, it makes the
measurement, but does not store the point to the data set.
Find Station
To start working, select the Find Station icon.
The Meas tab (Figure 11-25) on the Find Station screen identifies the
station by computing the distance from the beginning of the road tothe projection of the station to the road, and the offset of the stationfrom the center line of the road.
Figure 11-25. Find Station – Measurement Tab
• Road – enter the name of the road or select it from the list.
• Point – select the name of the point from the map or the list.
• Code – enter either manually or select from the drop-down list.
• – the Attributes List icon opens a list of available attributes
(for details, see “On the Point Attributes” on page 6-7).
• – shows the battery and memory status for the controller.
• The menu icon next to the Attributes List icon displays the pop-upmenu containing three items:
8/10/2019 7010-0944 - SokkiaSSF_rm.pdf
http://slidepdf.com/reader/full/7010-0944-sokkiassfrmpdf 412/623
Total Station Survey
Sokkia Spectrum Survey Field Reference Manual11-28
– String: toggles on the String field. Also, the sign appears.
– Layer : opens the Select Layer screen (see “On the Select
Layer” on page 6-10).– Note: opens the Note screen.
• HR – sets the target height above the mark (rod height).
• BS (Setup) – opens the Backsight Survey screen to set thebacksight point. The information displayed is the same as hasbeen entered.
• PStn – computes the result of the point station.• CStn – computes the result of the current station, takes the
sideshot to the point, and stores the point to the data set.
• Meas – computes the result and takes the sideshot to the point.The result is reflected on the Results tab (Figure 11-25 onpage 11-27).
• Settings – opens the Mode screen to set the sideshot mode.
• The Help Icon in the upper-left corner of the screen displays apop-up menu containing six items:
– Edit Points: opens the Points list.
– Inverse: opens the Inverse COGO screen.
– Notes: opens the Notes screen.
– PTL Mode: opens the PTL Mode screen (see “PTL Mode” onpage 11-6).
– Display Coord : if selected, the coordinates of the previouspoint measured displays below the HR data (see Figure 11-4on page 11-4).
– Help: accesses the Help files.
The Result tab shows the results of the computation.
The Map tab shows all points in a graphic mode and duplicates thebutton controls from the first tab.
The Set tab (if available) displays the result of the sideshots beingdone during one set.

8/10/2019 7010-0944 - SokkiaSSF_rm.pdf
http://slidepdf.com/reader/full/7010-0944-sokkiassfrmpdf 413/623
Tape Dimension
P/N 7010-0944 11-29
Tape Dimension
To start working, select the Tape Dimension icon. The Tape
Dimension screen displays.
The Tape Dimension screen calculates the periphery of structuressuch as buildings that have features perpendicular to each other. Thisis done using tape measurements, relative to the two known pointsthat belong to one side of the structure (wall of the building), forminga so called reference line.
Reference Line
The Ref Line tab contains information about the two pointscomprising the reference line.
Figure 11-26. Tape Dimension - Ref Line Tab
• Start Point/End Point – contains properties of the starting and
ending point: the name (can be entered manually or selected fromthe map or list) and code. Also, the point can be measured by
pressing the Meas button.

8/10/2019 7010-0944 - SokkiaSSF_rm.pdf
http://slidepdf.com/reader/full/7010-0944-sokkiassfrmpdf 414/623
Total Station Survey
Sokkia Spectrum Survey Field Reference Manual11-30
Tape Dimension Points
The Tape Dim tab contains the following settings for performing the
survey.
Figure 11-27. Tape Dimension – Tape Dim Tab
• Point – the name of the next point in the survey. The photo note icon opens the Add Photo Notes screen to enter a photo note
for the point.
• Code – the code of the point: either enter manually or select fromthe drop-down list.
• – the Attributes List icon, opens the list of available
attributes (see “On the Point Attributes” on page 6-7 for moredetails).
• The menu icon next to the Attributes List icon contains the String,
Layer, and Note items.
• Dist Left – toggles between Dist Left and Dist Right values.
These set the direction of the next movement, relative to theprevious direction. The field below sets the distance to move.
• Accept – applies the taped distance to the perimeter line.
• Finish – opens the floating menu of two items:
– Close Polygon: connects the first and the last two points witha line.

8/10/2019 7010-0944 - SokkiaSSF_rm.pdf
http://slidepdf.com/reader/full/7010-0944-sokkiassfrmpdf 415/623
Missing Line
P/N 7010-0944 11-31
– Calc Closure: calculates the difference between the last and
the first points.
• The icon in the lower-left corner of the screen shows the plot ofthe already taped perimeter.
The Data tab shows the initial data and current results of themeasurements.
The Map tab displays the plot of the already made measurements.
Missing LineTo start working, select the Missing Line icon. The Missing Line
screen displays (Figure 11-28).
The Missing Line screen emulates the total station measurement fromone point to another and stores the result to the Raw Data database.
Figure 11-28. Missing Line – Ref Line Tab
• The Start and End Points can be entered manually, chosen fromthe map or from the list, or measured through the Meas button.
The Data tab displays the results of the measurements.The same results are reflected in the Raw Data screen.
The Map tab shows the relative position of the points and themeasured line.

8/10/2019 7010-0944 - SokkiaSSF_rm.pdf
http://slidepdf.com/reader/full/7010-0944-sokkiassfrmpdf 416/623
Total Station Survey
Sokkia Spectrum Survey Field Reference Manual11-32
Scanning
This function is activated only with robotic/reflectorless and
motorized/reflectorless total stations. Make sure that the Show Scan
Point option is selected in the Help Icon menu in the upper-left cornerof the Points screen (see “Points” on page 6-2).
To open the Scanning screen, select the Scanning icon in the Roboticmode. On the Scanning screen (Figure 11-42) select either, Scan w/o
Image or Scan with Image mode.
Scanning with an Image
To scanning with an image, tap Next to follow a scan wizard.
Figure 11-29. Scan wi th Image
Enter the following parameters on the Select Scan screen(Figure 11-30 on page 11-33).
• Session – sets a name for the session.
• Image – sets an Image file. Select a previous Image or browse for
a new one (Images are stored as a JPEG file with the *.jpg file
extension).
• Camera – sets the Camera parameters. If the Image exists in theJob, the Camera data is selected automatically. Otherwise, select

8/10/2019 7010-0944 - SokkiaSSF_rm.pdf
http://slidepdf.com/reader/full/7010-0944-sokkiassfrmpdf 417/623
Scanning
P/N 7010-0944 11-33
a previous Camera or browse for a new one (Cameras are stored
as text files with the *.cmr extension).
Figure 11-30. Enter Scan Session Information
• View – when available, opens the View Scan screen.
• Back – returns to the previous screen.• Next – click to open the Orient screen (Figure 11-32 on
page 11-34) to complete.
View Scan
The View Scan screen (when available) displays the image, along
with orientation and scanned points for completed scan sessions.

8/10/2019 7010-0944 - SokkiaSSF_rm.pdf
http://slidepdf.com/reader/full/7010-0944-sokkiassfrmpdf 418/623

8/10/2019 7010-0944 - SokkiaSSF_rm.pdf
http://slidepdf.com/reader/full/7010-0944-sokkiassfrmpdf 419/623

8/10/2019 7010-0944 - SokkiaSSF_rm.pdf
http://slidepdf.com/reader/full/7010-0944-sokkiassfrmpdf 420/623
Total Station Survey
Sokkia Spectrum Survey Field Reference Manual11-36
Figure 11-34. Select Orientation Point – Wide View
• Meas – measures the orientation point. The bitmap menu options( Meas, From Map, From List ) are used to take a measurement orto select an existing point from a map or list (Figure 11-35).
• – opens the Orientation Res screen(Figure 11-35 onpage 11-36) to delete the selected orientation points.
Figure 11-35. Delete Orientation Points
• Next – when four or more orientation points have beenestablished, click to display the orientation results (Figure 11-37on page 11-37).

8/10/2019 7010-0944 - SokkiaSSF_rm.pdf
http://slidepdf.com/reader/full/7010-0944-sokkiassfrmpdf 421/623
Scanning
P/N 7010-0944 11-37
Figure 11-36. Calculate Image Orientation
Orientation Results
The Orientation Results screen displays the results of the imageorientation (Figure 11-37). The results for each orientation point isdisplayed as dX and dY in image pixels.
Figure 11-37. Orientation Results
• Delete – removes the selected point to adjust the orientationcalculation. If four points still remain, the new results are
displayed. If less than four orientation points display, theOrientation Results screen closes automatically to continue theorientation procedure.
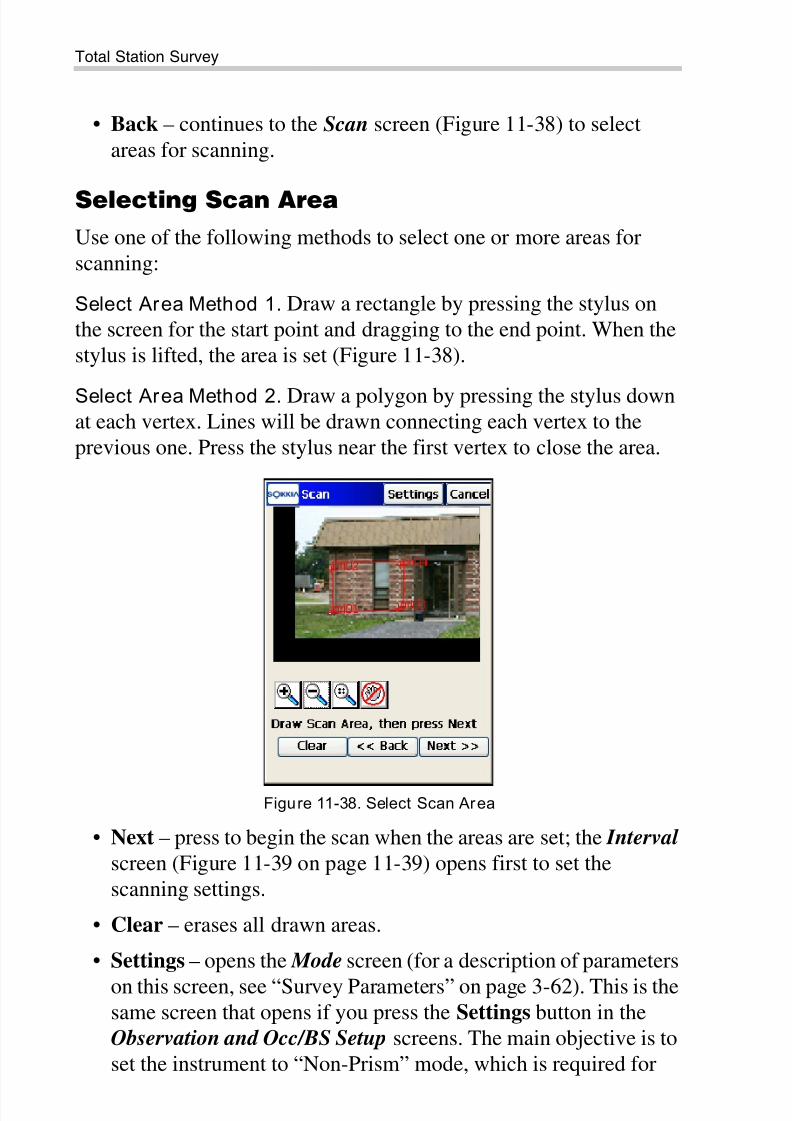
8/10/2019 7010-0944 - SokkiaSSF_rm.pdf
http://slidepdf.com/reader/full/7010-0944-sokkiassfrmpdf 422/623
Total Station Survey
Sokkia Spectrum Survey Field Reference Manual11-38
• Back – continues to the Scan screen (Figure 11-38) to select
areas for scanning.
Selecting Scan Area
Use one of the following methods to select one or more areas for
scanning:
Select Area Method 1. Draw a rectangle by pressing the stylus onthe screen for the start point and dragging to the end point. When thestylus is lifted, the area is set (Figure 11-38).
Select Area Method 2. Draw a polygon by pressing the stylus downat each vertex. Lines will be drawn connecting each vertex to theprevious one. Press the stylus near the first vertex to close the area.
Figure 11-38. Select Scan Area
• Next – press to begin the scan when the areas are set; the Interval screen (Figure 11-39 on page 11-39) opens first to set thescanning settings.
• Clear – erases all drawn areas.
• Settings – opens the Mode screen (for a description of parameters
on this screen, see “Survey Parameters” on page 3-62). This is thesame screen that opens if you press the Settings button in theObservation and Occ/BS Setup screens. The main objective is toset the instrument to “Non-Prism” mode, which is required for

8/10/2019 7010-0944 - SokkiaSSF_rm.pdf
http://slidepdf.com/reader/full/7010-0944-sokkiassfrmpdf 423/623
Scanning
P/N 7010-0944 11-39
scanning and also, to change the measurement mode (Fine, or
Coarse).
Interval
The Interval screen (Figure 11-39) sets the starting point and thehorizontal and vertical intervals for scanning.
Figure 11-39. Scanning Interval
• Start Pt – enter a name for starting point the scanned points.
• Scan Mode – select the scanning mode: either Fine or Coarse.
• Meas Mode – select the measuring mode:
– Normal NP: normal Non-Prism measurements.– Long NP: long distance Non-Prism measurements (200-300
meters away); only available for GPT-8200 and GPT-7000Total Stations.
– Normal/Long NP: attempts to take a normal NPmeasurement. If unsuccessful, the instrument automaticallyswitches to long NP mode for the measurement; only
available for GPT-8200 and GPT-7000 Total Stations.• Interval – select the scanning intervals either as Angle values or
Numbers of points.
• HA/Num H – enter the interval in the horizontal direction.

8/10/2019 7010-0944 - SokkiaSSF_rm.pdf
http://slidepdf.com/reader/full/7010-0944-sokkiassfrmpdf 424/623
Total Station Survey
Sokkia Spectrum Survey Field Reference Manual11-40
• VA/Num V – enter the interval in the vertical direction.
• Next – saves the settings and opens the Estimate Time screen
(Figure 11-40).
Time Estimate
Before scanning begins, the Estimate Time screen (Figure 11-40)displays the scanning information, including the total number ofpoints to be scanned and an estimate of the time it takes to complete
the scan. If the estimated time is too long, click Cancel and enter
larger intervals.
Figure 11-40. Estimate Time
• Stop – immediately stops the scan.• Finish – begins scanning points.
As the total station measures points within a predefined area, eachpoint displays on the image.

8/10/2019 7010-0944 - SokkiaSSF_rm.pdf
http://slidepdf.com/reader/full/7010-0944-sokkiassfrmpdf 425/623
Scanning
P/N 7010-0944 11-41
Figure 11-41. Scanning in Progress
Scanning without an Image
To start working, select the Scanning icon. The Scanning screen
displays.To scanning without an image, select the type of scan orientation;either Vertical, Horizontal, or Incline (Figure 11-42).
Figure 11-42. Scan without Image
• Next – opens the Area screen (Figure 11-43 on page 11-42).

8/10/2019 7010-0944 - SokkiaSSF_rm.pdf
http://slidepdf.com/reader/full/7010-0944-sokkiassfrmpdf 426/623
Total Station Survey
Sokkia Spectrum Survey Field Reference Manual11-42
Area
The Area screen (Figure 11-43) selects the starting and ending points
for the scanning area.
Figure 11-43. Select Area
• Meas – measures the orientation point. The menu icon opens themenu options ( Meas, From Map, From List ) used to take a
measurement or to select an existing point from a map or list.
• Next – displays the same Interval and Estimate Time screens asfor Scanning with Image mode (Figure 11-44).
Figure 11-44. Interval and Estimate Time

8/10/2019 7010-0944 - SokkiaSSF_rm.pdf
http://slidepdf.com/reader/full/7010-0944-sokkiassfrmpdf 427/623
Scanning
P/N 7010-0944 11-43
Scan
Press the Finish button on the Estimate Time screen (Figure 11-44 on
page 11-42) to start scanning (Figure 11-45).
Figure 11-45. Scanning in Progress
As the total station measures points within the predefined area, eachpoint displays on the screen.
• Stop – immediately stops the scan and returns to the Area screen.
After scanning is completed, the screen returns to the Area screen to
set a new area for scanning. The points icon denotes the scanned
points in the list of points (Figure 11-46 on page 11-44).

8/10/2019 7010-0944 - SokkiaSSF_rm.pdf
http://slidepdf.com/reader/full/7010-0944-sokkiassfrmpdf 428/623
Total Station Survey
Sokkia Spectrum Survey Field Reference Manual11-44
Figure 11-46. Scanned Points
Monitor
This function is activated only with robotic total stations. To enablethe monitor survey, select the Monitor icon in the Robotic mode. The
MonitorPoint List screen displays (Figure 11-47 on page 11-45).
Monitor PointList
The points to be measured are added to a point list which is thenloaded using the Monitor Pointlist screen (Figure 11-47 on
page 11-45) displays.

8/10/2019 7010-0944 - SokkiaSSF_rm.pdf
http://slidepdf.com/reader/full/7010-0944-sokkiassfrmpdf 429/623
Monitor
P/N 7010-0944 11-45
Figure 11-47. Monitor Point List
After the point list is selected, the Next button opens the Monitor screen.
MonitorThe Monitor function measures one or more prisms repeatedly anduses the measurements to detect changes in the position of the prisms.
The measurements are recorded into the raw data file.
Optionally, the raw measurements or the computed points can beoutput to a file or communication port in either an FC-6 or GTS-7format. The output format and destination is accessed from the
Monitor Options screen when configuring the total station (see“Monitor Options” on page 3-55).

8/10/2019 7010-0944 - SokkiaSSF_rm.pdf
http://slidepdf.com/reader/full/7010-0944-sokkiassfrmpdf 430/623
Total Station Survey
Sokkia Spectrum Survey Field Reference Manual11-46
The Monitor screen is used to control the monitor survey
(Figure 11-48).
Figure 11-48. Moni tor
• Points – the point name.
• Interval – interval listed as the Cycle Time. If a prism cannot befound after a period of 15 seconds, the total station rotates to thenext point in the sequence.
• Auto – If the Auto combo box is set to ON, the total stationautomatically rotates to the next point in the sequence and recordsa measurement. If it is set to OFF, the total station rotates to thepoint, but allows the user to verify or correct the centering to theprism prior to taking a measurement. The monitor functionalways completes the entire sequence, even if the measurements
take longer than cycle time.
• Start – initiates the sequence of measurements, which repeats atthe interval you want.
• Qlock – sends the “Quicklock” or “Turn Around” command,
which causes the total station to search for the RC-21.
• Search – causes the instrument to search for the prism.
1. RC-2 is the Remote Control System 2 for optical communications. For
instructions of how to operate the RC-2 device, consult the instruction
manual for RC-2.

8/10/2019 7010-0944 - SokkiaSSF_rm.pdf
http://slidepdf.com/reader/full/7010-0944-sokkiassfrmpdf 431/623
Monitor
P/N 7010-0944 11-47
• Lock – lock onto the prism or “track” it.
• Turn – opens the Rotate screen, which allows the Total station to
turn to various angles or points.• Start/Stop – makes the total station start or stop tracking the
prism and go into “Standby” mode.
The Data Indicator above the Qlock button shows the current state ofthe robotic total station with one of the following icons listed below:
The Data tab lists the differences between the coordinates of the
reference point and the measured point.
The Map tab shows all points in graphic mode. For details, on mapproperties and customizing. See “Viewing Map” on page 15-1.
– no data
– querying status
– turning
– receiving data

8/10/2019 7010-0944 - SokkiaSSF_rm.pdf
http://slidepdf.com/reader/full/7010-0944-sokkiassfrmpdf 432/623
Total Station Survey
Sokkia Spectrum Survey Field Reference Manual
Notes:
11-48

8/10/2019 7010-0944 - SokkiaSSF_rm.pdf
http://slidepdf.com/reader/full/7010-0944-sokkiassfrmpdf 433/623
P/N 7010-0944
Chapter 12
12-1
Digital Level SurveyThe Survey menu (Figure 12-1) for Level survey opens by tappingthe Survey icon in the main menu and allows to perform:
• Level Run
• Two Peg Test
Figure 12-1. Level Survey Menu
The Help Icon opens a pop-up menu giving access to the helpfiles, module activation codes, port data logging, changing menuinterface, and information about the Sokkia SSF used (for detail see“Help Icon’s Pop-up Menu” on page 1-9).

8/10/2019 7010-0944 - SokkiaSSF_rm.pdf
http://slidepdf.com/reader/full/7010-0944-sokkiassfrmpdf 434/623
Digital Level Survey
Sokkia Spectrum Survey Field Reference Manual12-2
Level Run
To set up a Level survey in running mode, tap the Level Run icon.
The Level Run screen (Figure 12-2) creates a new level run.
Figure 12-2. New Level Run
• Name – sets a name for the new level run.
• Note – adds optional information on the level run.
• Next – opens the screen to make leveling measurements (seeFigure 12-3 on page 12-3).

8/10/2019 7010-0944 - SokkiaSSF_rm.pdf
http://slidepdf.com/reader/full/7010-0944-sokkiassfrmpdf 435/623
Level Run
P/N 7010-0944 12-3
DL Level Run
The DL tab on the Level Run <run name> screen (Figure 12-3)
displays all leveling data in progress and contains tools to conductleveling.
Figure 12-3. DL Level Run
• – sets the point for rod reading; select from either the map orthe list of points.
• – sets the code for the measured point. The icon next to thefield opens the Code-Attributes screen to set a new code. Fordetails, see “On the Point Attributes” on page 6-7.
• BS – usually sighting back along the leveling line, the Level takesa rod reading on a point of known elevation.
• SS – the Level takes a sideshot to the point.
• FS – the Level takes a rod reading on a point of unknownelevation.
• The fieldbook displays the following information:
– Pt Name: point name and icon displaying point type. Icons
can be:– backsight point
– foresight point
– sideshot point
– closure

8/10/2019 7010-0944 - SokkiaSSF_rm.pdf
http://slidepdf.com/reader/full/7010-0944-sokkiassfrmpdf 436/623
Digital Level Survey
Sokkia Spectrum Survey Field Reference Manual12-4
– Code: the code of the point.
– BS : a rod reading taken on the backsight point.
– HI : the height of the leveled instrument; the elevation of theline of sight of the telescope above the datum.
– FS : a rod reading taken on the foresight point.
– Elev: elevation of the point.
– BS Dist : the horizontal distance from the level to the rod on abacksight point.
– FS Dist : the horizontal distance from the level to the rod on aforesight point.
– Sum BS Dist : the sum of backsight distances.
– Sum FS Dist : the sum of foresight distances.
– SumBS-SumFS : the difference between the sums of BS andFS measurements.
– Accumulated Ht : the difference between the sum of thebacksights and the sum of the foresights.
– Notes: any additional information on the point.
• The Help Icon in the upper-left corner of the screen displays apop-up menu containing eight items:
– Stake Point : opens the Stake Point screen to stake out a point.
– Stake Point List : opens the Stake Point List screen to stakeout points from the list (see “DL Stakeout” on page 13-12).
– Stake Elev: opens the Stake Elev screen to stake out at a rod
point (see “DL Stakeout of Elevations” on page 13-42).
– Vertical Offset: opens the Vertical Offset screen to set thevertical offset to apply at the point.
TIP
All columns except PT Name can be selected todisplay (see “Display Settings” on page 12-6).
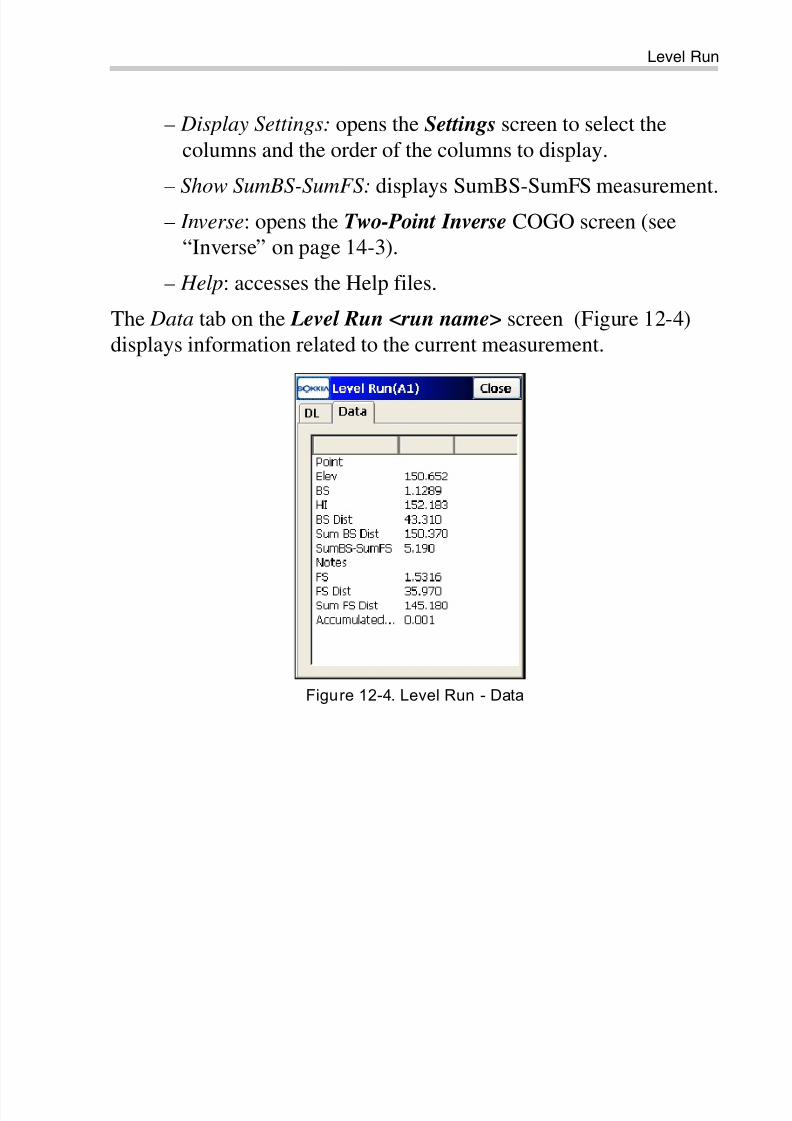
8/10/2019 7010-0944 - SokkiaSSF_rm.pdf
http://slidepdf.com/reader/full/7010-0944-sokkiassfrmpdf 437/623
Level Run
P/N 7010-0944 12-5
– Display Settings: opens the Settings screen to select the
columns and the order of the columns to display.
– Show SumBS-SumFS: displays SumBS-SumFS measurement.– Inverse: opens the Two-Point Inverse COGO screen (see
“Inverse” on page 14-3).
– Help: accesses the Help files.
The Data tab on the Level Run <run name> screen (Figure 12-4)displays information related to the current measurement.
Figure 12-4. Level Run - Data

8/10/2019 7010-0944 - SokkiaSSF_rm.pdf
http://slidepdf.com/reader/full/7010-0944-sokkiassfrmpdf 438/623
Digital Level Survey
Sokkia Spectrum Survey Field Reference Manual12-6
Display Settings
The Settings screen (Figure 12-5) selects the columns to display. The
Up/Down arrows are used to change the order of the selected column.
Figure 12-5. Display Settings
Two Peg Test
The Two Peg Test is performed to check if the line of sight of the
level telescope is horizontal when the instrument is leveled.
To perform the Two Peg Test, tap the Two Peg Test icon .
The Two Peg Test screen (Figure 12-6 on page 12-7) guides you
through a series of measurements to help determine any errors. First,it prompts you to take shots to the first point, assuming the level isfairly centered between the two points. Then the instrument should bemoved to one of the pegs and the shots are taken again to Pegs 1 and2.

8/10/2019 7010-0944 - SokkiaSSF_rm.pdf
http://slidepdf.com/reader/full/7010-0944-sokkiassfrmpdf 439/623
Two Peg Test
P/N 7010-0944 12-7
Figure 12-6. Two Peg Test
• Locate Peg2 – measures the horizontal distance to Peg2 andcompares it with the Peg1 measurement previously taken. Thismeasurement is not used in the error computations.
• Meas – takes measurements for the displayed prompted Peg. Theresults display on the Two Peg Test Results screen (Figure 12-7on page 12-8).

8/10/2019 7010-0944 - SokkiaSSF_rm.pdf
http://slidepdf.com/reader/full/7010-0944-sokkiassfrmpdf 440/623
Digital Level Survey
Sokkia Spectrum Survey Field Reference Manual12-8
Two Peg Test Results
The Two Peg Test Results screen (Figure 12-7) displays the results of
the test after all measurements are taken.
Figure 12-7. Two Peg Test Results
• The table displays all the shots taken.
• Error – computed error means inclination of the actual line ofsight from true horizontal. This error is proportional to the
distance from the level to the rod.

8/10/2019 7010-0944 - SokkiaSSF_rm.pdf
http://slidepdf.com/reader/full/7010-0944-sokkiassfrmpdf 441/623
P/N 7010-0944
Chapter 13
13-1
Staking outTo stake out points, tap the Stake icon in the main menu.
The Stake function is used to stake out Points, Lines, Offsets, DTM,Point in Direction, Point List, Curve, Road, Real Time Road, andSlope (Figure 13-1).
Figure 13-1. Stake Menu
For stake out with digital levels, the menu options include Points,Point List and Elevation.
The Help Icon opens a pop-up menu giving access to the help
files, module activation codes, port data logging, changing menuinterface, and information about the Sokkia SSF used (for details see“Help Icon’s Pop-up Menu” on page 1-9).
TIP
If you need menu options that are not visible, tapConfigure / Menus icons and enable these options inthe Config Menus screen.

8/10/2019 7010-0944 - SokkiaSSF_rm.pdf
http://slidepdf.com/reader/full/7010-0944-sokkiassfrmpdf 442/623
Staking out
Sokkia Spectrum Survey Field Reference Manual13-2
Points
To stakeout a point, tap the Points icon. The Stakeout Pt screen
(Figure 13-2) displays.
Stakeout Point
The Stakeout Point screen (Figure 13-2) contains initial data for thestakeout point.
Figure 13-2. Stakeout Point
• Design Point – sets the identifier of the design point: enter eithermanual or select from the map or from the list.
• Antenna Ht (for GPS mode) – sets the height of the antennareference point (ARP) above the mark and specifies themeasurement type for the height, either slant or vertical.
• HR (for TS mode) – the height of the rod (target).
• Settings – opens the Stakeout Parameters screen (see “Stake
Parameters” on page 3-44).
• Stakeout – opens the Stakeout screen.
For GPS stakeouts, the Help Icon in the upper-left corner of the
screen displays a pop-up menu with the following options:
• Status – opens the Status screen (see “GPS+ Survey Status” onpage 8-12).
8/10/2019 7010-0944 - SokkiaSSF_rm.pdf
http://slidepdf.com/reader/full/7010-0944-sokkiassfrmpdf 443/623
Points
P/N 7010-0944 13-3
• Rover Antenna Setup – opens the Antenna Setup screen to set the
antenna for the current survey.
• Config Radio – opens the Configure Radio screen (see“Configure Radio” on page 8-26).
• Edit Points – opens the Points screen (see “Points” onpage 13-2).
• PTL Mode – switches on the PTL (Point-To-Line) Mode. (The
screen changes its appearance to Stakeout Point (PTL).) Fordetails, see “PTL Mode” on page 11-6.
• Inverse – opens the Two-Point Inverse COGO task screen. Fordetails see “Inverse” on page 14-3.
• Help: accesses the Help files.
For Total Station stakeouts, the Help Icon in the upper-left corner of
stakeout screen displays a pop-up menu with the following options:
• BS Setup – opens the BS Setup screen (see “Backsight Survey”
on page 10-2).• Config Link (for Robotic mode only) – opens the Configure Link
screen (see “Configure Link” on page 13-7).
• Remote Control (for Robotic mode only) – opens the Remote
Control screen (see “Remote Control” on page 10-18).
• Edit Points – opens the Points screen (see “Points” on page 6-2).
• PTL Mode – switches on the PTL (Point-To-Line) Mode. (Thescreen changes its appearance to Stakeout Point (PTL).) Fordetails, see “PTL Mode” on page 11-6.
• Inverse – opens the Two-Point Inverse COGO task screen. For
details see “Inverse” on page 14-3.
• Help – accesses the Help files.

8/10/2019 7010-0944 - SokkiaSSF_rm.pdf
http://slidepdf.com/reader/full/7010-0944-sokkiassfrmpdf 444/623
Staking out
Sokkia Spectrum Survey Field Reference Manual13-4
GPS+ Stakeout
The Stakeout screen (Figure 13-3) assists in the stakeout process.
Figure 13-3. Stakeout
The graphic shows the north direction, the reference direction, and
the target point, if the distance to the target is less than the horizontaldistance tolerance. If the distance is greater than three meters, thearrow points to the target, showing the direction of movement. Whenthe target is closer than the Horizon Distance Tolerance value, thegraphic shows a bull’s-eye target point on the screen. The panel on
the right displays the parameters of the target.
• – opens the map of the layout of the target and current
position.• Store – saves the location. Check the parameters of the stored
point in the Store Point Information screen (see Figure 13-8 onpage 13-9).
• Next Pt – moves to the next point in the list.
• Close – closes the screen and returns to the Stakeout Point
screen.
• The Help Icon in the upper-left corner of the screen displays apop-up menu with the following options:
– Status: opens the Status screen (see “GPS+ Survey Status” onpage 8-12).

8/10/2019 7010-0944 - SokkiaSSF_rm.pdf
http://slidepdf.com/reader/full/7010-0944-sokkiassfrmpdf 445/623
Points
P/N 7010-0944 13-5
– Rover Antenna Setup: opens the Antenna Setup screen to set
the antenna for the current survey.
– Config Radio: opens the Configure Radio screen .– mmGPS+ Options: if mmGPS is used, opens the mmGPS+
Options screen .
– Auto Advance Sta: if check marked (enabled), after storing astaked point, automatically opens the Stakeout screen for the
next point.
– Design Offsets: opens the Design Elevation screen, allowing
you to change the design point elevation height, road offsets,and DTM offsets.
– Store Design Pt/Layer : opens the Design Pt/Layer screen to
select options to store the points .
– Display Coords: select this option to display coordinates,instead of directions.
– Edit Points: opens the Points screen .– Inverse: opens the Two-Point Inverse COGO task screen.
– Help: accesses the Help files.
TS Stakeout
The Stakeout screen reflects the status of the stakeout. On the Stake
out screen (Figure 13-4 on page 13-6), shows the current point name(in the upper-left corner of the screen), the layout of the target, andthe current position, the direction, and the values of the distances tothe target display.
• – opens the map of the target layout and the current position.
• EDM – select the distance measurement mode; either Coarse,Fine, or Coarse Tracking.

8/10/2019 7010-0944 - SokkiaSSF_rm.pdf
http://slidepdf.com/reader/full/7010-0944-sokkiassfrmpdf 446/623

8/10/2019 7010-0944 - SokkiaSSF_rm.pdf
http://slidepdf.com/reader/full/7010-0944-sokkiassfrmpdf 447/623
Points
P/N 7010-0944 13-7
Configure Link
The Configure Radio screen (Figure 13-5) displays parameters for
the radio modem.
Figure 13-5. Configure Link
• Conn Mode – select the connection mode, either Cable or RadiosOnly.
• Type – shows the current modem type set for the current surveyconfiguration. To change the modem, from the Survey menu, tap
the Configure icon in the main menu.
• Radio Port, Model, Channel, Frequency – parameters for theradio connection.
Store Design Pt/Layer
The Store Des Pt screen (Figure 13-6 on page 13-8) selectsparameters for storing staked points.
• Display Store Pt Info – check mark this box to display the Store
Point screen before storing a staked point.
• Layer – selects a layer from the drop-down list.
• – opens the Layers screen to edit layers (see “Edit Layers”
on page 6-23).

8/10/2019 7010-0944 - SokkiaSSF_rm.pdf
http://slidepdf.com/reader/full/7010-0944-sokkiassfrmpdf 448/623
Staking out
Sokkia Spectrum Survey Field Reference Manual13-8
Figure 13-6. Design Pt/Layer
Design Offsets
The Design Elev screen (Figure 13-7) sets an offset to add to the
elevation of the point when staking points, roads, or DTM’s.
Figure 13-7. Design Elevation
Initially, the point height is shown. To set the elevation offset, checkmark the appropriate box and enter the offset you want. Click OK tosave the setting.

8/10/2019 7010-0944 - SokkiaSSF_rm.pdf
http://slidepdf.com/reader/full/7010-0944-sokkiassfrmpdf 449/623
Points
P/N 7010-0944 13-9
Store Point
The Store Pt Info screen (Figure 13-8) displays stakeout results
before the point is stored.
Figure 13-8. Store Point Information
• Edit – opens the Store Point screen (Figure 13-9) to edit pointproperties.
• Next Pt – selects the next point to stake.
Figure 13-9. Staked Point Information

8/10/2019 7010-0944 - SokkiaSSF_rm.pdf
http://slidepdf.com/reader/full/7010-0944-sokkiassfrmpdf 450/623
Staking out
Sokkia Spectrum Survey Field Reference Manual13-10
The Point Info tab (Figure 13-9 on page 13-9) on the Store Point
screen contains the following fields:
• Point – sets the name of the point.• Code – sets the code for the point: either enter manually or select
a code from the drop-down list.
• – the Attributes List icon opens the Code-Attributes screen to
set the values for the attributes available for the code chosen (see“On the Select Layer” on page 6-10).
• Note – the name of the previous point.
• Cut/Fill – shows cut/fill information for the point if displayedbefore the point is stored.
• The menu icon next to the Attributes List icon opens thefollowing options:
– String: toggles on the String field. Also, the sign appears.
For details, see “The Topo Menu” on page 9-3.
– Layer : opens the Select Layer screen to place the point. Fordetails, see “The Topo Menu” on page 9-3.
– Note: opens the Note screen. For details, see “The TopoMenu” on page 9-3.
The Layer/Style tab (Figure 13-10 on page 13-11) on the Store Point
screen contains the following fields:

8/10/2019 7010-0944 - SokkiaSSF_rm.pdf
http://slidepdf.com/reader/full/7010-0944-sokkiassfrmpdf 451/623
Points
P/N 7010-0944 13-11
Figure 13-10. Store Point – Layer/Style Tab
• Layer – select the layer to locate the point.
• Point Style – select a point style from the drop-down list. Thefield to the left shows the symbol for the selected point.
• Color – opens the Select Color screen.
The Photo Note tab on the Store Point screen (Figure 13-11) adds aphoto note to the stakeout point. Initially the screen is empty.
Figure 13-11. Store Point – Photo Note
• Delete – erases the image from the screen.

8/10/2019 7010-0944 - SokkiaSSF_rm.pdf
http://slidepdf.com/reader/full/7010-0944-sokkiassfrmpdf 452/623
Staking out
Sokkia Spectrum Survey Field Reference Manual13-12
• Add – opens the Select Image File screen to browse for the
necessary file in the controller.
DL Stakeout
The DL Stakeout of design points can be accessed from the mainmenu or the top-left menu on the Level Run screen (for details, see“Level Run” on page 12-2).
Stake Point
The Stake screen (Figure 13-12) selects a design point to determinethe elevation and to compute a cut/fill value.
Figure 13-12. DL Stake Point
• Design Point – selects the point to stake (either enter manually orselect from the map or list).
• BS Point – selects the backsight point for the stake measurement(entered manually or selected from the map or list).
• BS – if not already measured, takes a BS measurement beforestaking.
• Stakeout – opens the level Stakeout screen (Figure 13-13 onpage 13-13).

8/10/2019 7010-0944 - SokkiaSSF_rm.pdf
http://slidepdf.com/reader/full/7010-0944-sokkiassfrmpdf 453/623
Points
P/N 7010-0944 13-13
Stakeout
The level Stakeout screen (Figure 13-13) displays the design point
and the BS point. For every measurement taken, Elevation and Cut/ Fill values are updated.
Figure 13-13. DL Stakeout
• Store – opens the Code-Attributes screen to set a code for the
staked out point (see “On the Point Attributes” on page 6-7), andthen opens the Edit Point screen (see “Editing a Point” on page 6-6).
• Meas – measures the elevation and computes a cut/fill value.
Staked out points are not added to the Level Run; instead they arelisted as observed points on the Points screen (Figure 13-14 onpage 13-14).

8/10/2019 7010-0944 - SokkiaSSF_rm.pdf
http://slidepdf.com/reader/full/7010-0944-sokkiassfrmpdf 454/623
Staking out
Sokkia Spectrum Survey Field Reference Manual13-14
Figure 13-14. Points – Staked Out
Lines
To stakeout a line, select the Lines icon. The Line screen(Figure 13-15) contains the initial data for the line stakeout.
Figure 13-15. Stakeout Line
• Start Point – sets the starting point of the reference line.
• End Point/Azimuth – sets the direction of the reference linethrough another point or azimuth.
• Ht Comp – the type of height computations for the stakeout point.

8/10/2019 7010-0944 - SokkiaSSF_rm.pdf
http://slidepdf.com/reader/full/7010-0944-sokkiassfrmpdf 455/623
Lines
P/N 7010-0944 13-15
– Ht of Start Pt (height of starting point): the stakeout point has
the same height as the starting point of the line.
– Interpolate Ht : the height of the stakeout point will becomputed through linear interpolation, using the height of thestarting and ending points of the line.
• Antenna Ht (for GPS mode) – sets the height of the antennareference point (ARP) above the mark. Also, specifies the
measurement type for the height: either slant or vertical.
• HR (for TS mode) – the height of the rod (target).
• Stakeout – opens the second Stakeout Line screen.• Settings – opens the Stakeout Parameters screen. For details, see
“Stakeout Point” on page 13-2.
GPS+ Stakeout
The Stakeout Line screen (Figure 13-16) displays the north direction,the reference direction, the movement direction, and the target line.
The panel on the right displays the parameters of the target.
Figure 13-16. Stakeout Line
• Store – saves the location. Check the parameters of the storedpoint on the Add/Edit point screen.
• – opens the map of the target layout and the current position.
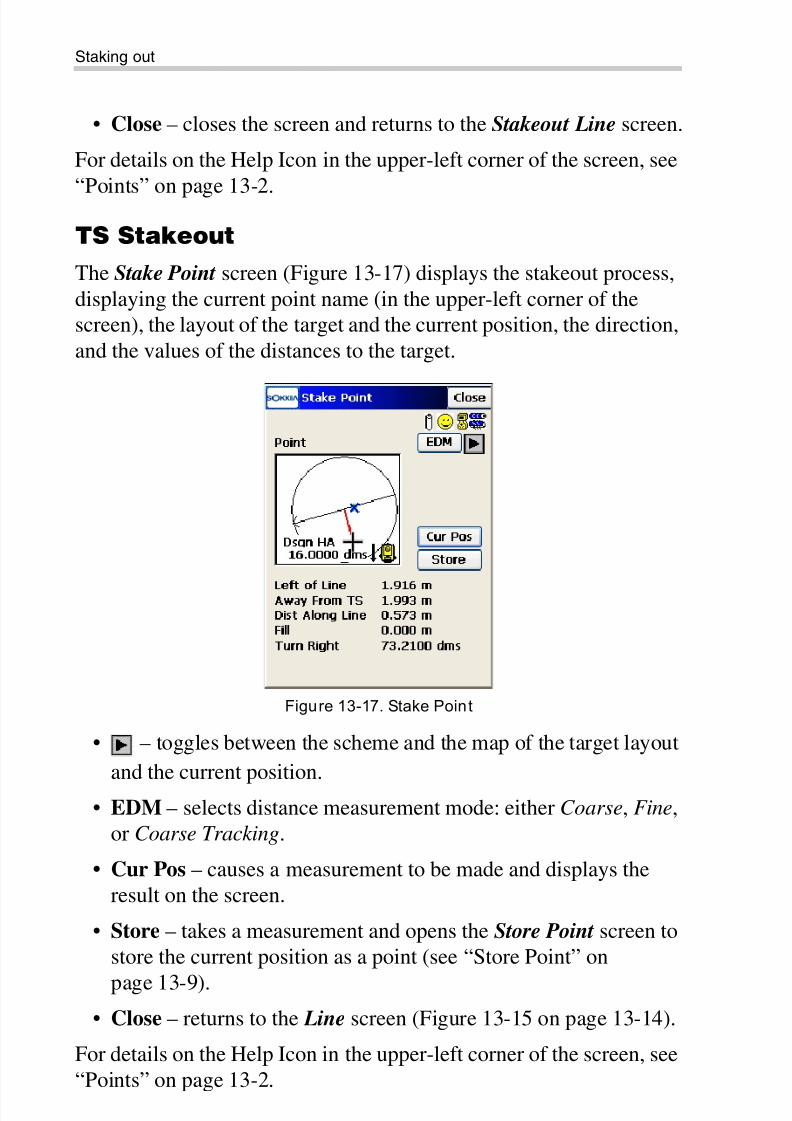
8/10/2019 7010-0944 - SokkiaSSF_rm.pdf
http://slidepdf.com/reader/full/7010-0944-sokkiassfrmpdf 456/623
Staking out
Sokkia Spectrum Survey Field Reference Manual13-16
• Close – closes the screen and returns to the Stakeout Line screen.
For details on the Help Icon in the upper-left corner of the screen, see
“Points” on page 13-2.
TS Stakeout
The Stake Point screen (Figure 13-17) displays the stakeout process,
displaying the current point name (in the upper-left corner of thescreen), the layout of the target and the current position, the direction,
and the values of the distances to the target.
Figure 13-17. Stake Point
• – toggles between the scheme and the map of the target layout
and the current position.
• EDM – selects distance measurement mode: either Coarse, Fine,or Coarse Tracking.
• Cur Pos – causes a measurement to be made and displays theresult on the screen.
• Store – takes a measurement and opens the Store Point screen tostore the current position as a point (see “Store Point” on
page 13-9).
• Close – returns to the Line screen (Figure 13-15 on page 13-14).
For details on the Help Icon in the upper-left corner of the screen, see“Points” on page 13-2.

8/10/2019 7010-0944 - SokkiaSSF_rm.pdf
http://slidepdf.com/reader/full/7010-0944-sokkiassfrmpdf 457/623
Offsets
P/N 7010-0944 13-17
Offsets
To stake Line, Intersection, Curve, 3 Pt Curves, or Spiral with
Offsets, tap the Offsets icon.
Figure 13-18. Offsets Menu
Line & Offsets
To stakeout lines and offsets, tap the Line icon. The Line&Ofstscreen displays.
The Line & Offset screen (Figure 13-19 on page 13-18) performs astakeout of a line with offsets in the Horizontal and Verticaldirections.
• Start Point – the starting point of the line. The line is defined by
the azimuth, the azimuth to another point, or the the End Point ofthe line.
• End Point/Azimuth – the direction of the line set through eitherthe azimuth of the line or the ending point of the line.
• Ht Comp – the type of height computations for the stakeout point.
– Ht of Start Pt (height of starting point): the stakeout point hasthe same height as the starting point of the line.

8/10/2019 7010-0944 - SokkiaSSF_rm.pdf
http://slidepdf.com/reader/full/7010-0944-sokkiassfrmpdf 458/623
Staking out
Sokkia Spectrum Survey Field Reference Manual13-18
– Interpolate Ht : the height of the stakeout point will be
computed through linear interpolation using the height of thestarting and ending points of the line
• Num Subs – designates the number of subdivisions you want tosubdivide the line. For instance, a value of 3 indicates the
stakeout of four points by subdividing the line into three equalsegments.
• Start Sta – the starting station (chainage) of the line.
• Next – opens the Sta&Ofst screen (Figure 13-20 on page 13-19)
(see “Station & Offsets” on page 13-19).• Settings – opens the Stakeout Parameters screen (see “Stake
Parameters” on page 3-44).
Figure 13-19. Stakeout Line & Offset
For details on the Help Icon in the upper-left corner of the screen, see“Points” on page 13-2.

8/10/2019 7010-0944 - SokkiaSSF_rm.pdf
http://slidepdf.com/reader/full/7010-0944-sokkiassfrmpdf 459/623
Offsets
P/N 7010-0944 13-19
Station & Offsets
The Sta&Ofst screen (Figure 13-20) contains the settings for the
stakeout stations with offsets from the line.
Figure 13-20. Stakeout
• Station – the station along the line being staked. The two arrowsto the right decrease or increase the station by the interval
specified in the Sta Interval shown in the next line.
• –left/right arrows decreases/increases the distance by
the station staking interval.
• – uses the right/left arrow keys of the keyboard to increase
or decrease the station.• Sta Interval – the station staking interval.
• Right Offset/Left Offset – the right or left offset of the stakeoutpoint, with respect to the line at the station shown in the Station
field.
• Up/Down – the Up or Down Height offset, with respect to theheight of the line at the station.
• Antenna Ht (for GPS mode) – sets the height of the antennareference point (ARP) above the mark. Also, select either slant or
vertical as the measurement type for the height.
• HR (for TS mode) – the height of the rod (target).

8/10/2019 7010-0944 - SokkiaSSF_rm.pdf
http://slidepdf.com/reader/full/7010-0944-sokkiassfrmpdf 460/623
Staking out
Sokkia Spectrum Survey Field Reference Manual13-20
• Back – returns to the previous screen.
• Stakeout – starts stakeout process.
GPS+ Stakeout
The Stake screen (Figure 13-21) shows the north direction, and therelative position of the antenna and the target. The panel on the right
displays the parameters of the target.
Figure 13-21. Stakeout
• NextSta – advances the station by the specified Station Interval
for staking out points at the Next station.
• Store – saves the location. Check the parameters of the stored
point in the Add/Edit point screen.
• Close – closes the screen and returns to the Stakeout Line screen.
• The Help Icon in the upper-left corner of the screen displays apop-up menu of options. For details, see “Points” on page 13-2.
In addition, the Initial Point Name option is available to name thefirst staked point (see “Initial Point Name” on page 13-21).

8/10/2019 7010-0944 - SokkiaSSF_rm.pdf
http://slidepdf.com/reader/full/7010-0944-sokkiassfrmpdf 461/623
Offsets
P/N 7010-0944 13-21
Initial Point Name
The Init Pt Name screen (Figure 13-22) specifies the starting name
for the points calculated for the stakeout task.
Figure 13-22. Calc Point Names
• First – the name of the first point.
• Code – the code of the points; either select from the list or entermanually.
• – accesses the attributes of the chosen code, opens the
Code-Attributes screen (see See “On the Point Attributes” on
page 6-7.).
• The menu icon next to the Attributes List icon displays thepop-up menu containing three items:
– String: toggles on the String field. Also, the sign appears.
For details, see “The Topo Menu” on page 9-3.
– Layer : opens the Select Layer screen to put the point. Fordetails, see “The Topo Menu” on page 9-3.
– Note: opens the Notes screen. For details, see “The TopoMenu” on page 9-3.
• OK – saves the changes and opens the Stakeout screen(Figure 13-21).

8/10/2019 7010-0944 - SokkiaSSF_rm.pdf
http://slidepdf.com/reader/full/7010-0944-sokkiassfrmpdf 462/623
Staking out
Sokkia Spectrum Survey Field Reference Manual13-22
TS Stakeout
The Stakeout screen (Figure 13-23) reflects the progress of the
stakeout, displaying the current station (in the upper-left corner of thescreen), the layout of the target, and the current position, thenecessary direction, and the values of the distances to the target.
Figure 13-23. Stakeout
• EDM – selects distance measurement mode: either Coarse, Fine,or Coarse Tracking.
• Stop – instructs the Robotic Total Station to stop tracking and gointo “Stand By” mode.
• Search – instructs the Robotic Total Station to start searching for
the prism.
• – advances the station by the specified Station Interval
for staking out points at the Next station.
• Store – takes a measurement and opens the Store Point screen to
store the current position as a point (see “Store Point” onpage 13-9).
• Cur Pos – causes a measurement to be made and displays theresult on the screen.

8/10/2019 7010-0944 - SokkiaSSF_rm.pdf
http://slidepdf.com/reader/full/7010-0944-sokkiassfrmpdf 463/623
Offsets
P/N 7010-0944 13-23
• Close – saves the changes and closes the screen.
Figure 13-24. General Stakeout information
• The Help Icon in the upper-left corner of the screen displays thepop-up menu of options. For details, see “Points” on page 13-2.
Stakeout Intersections & OffsetsTo stakeout Intersection & Offsets, tap the Intersection icon.The 2Line&Ofst screen (Figure 13-25 on page 13-24) stakes out theintersection point of two lines parallel to two other lines at specifiedoffsets. The first screen defines one line (Line 1) and the offset of thefirst parallel line. The second screen (Figure 13-26 on page 13-25)defines another line (Line 2) and the offset of the second parallel line.
The intersection point of these two parallel lines defines the stakeoutpoint.
The first screen contains parameters for Line 1.
TIP
Tapping in the current station string enables the
floating information screen to display the pointname, the note, design elevation (if enabled), thestation number and the offset value of the currentpoint. (Figure 13-25 on page 13-24).
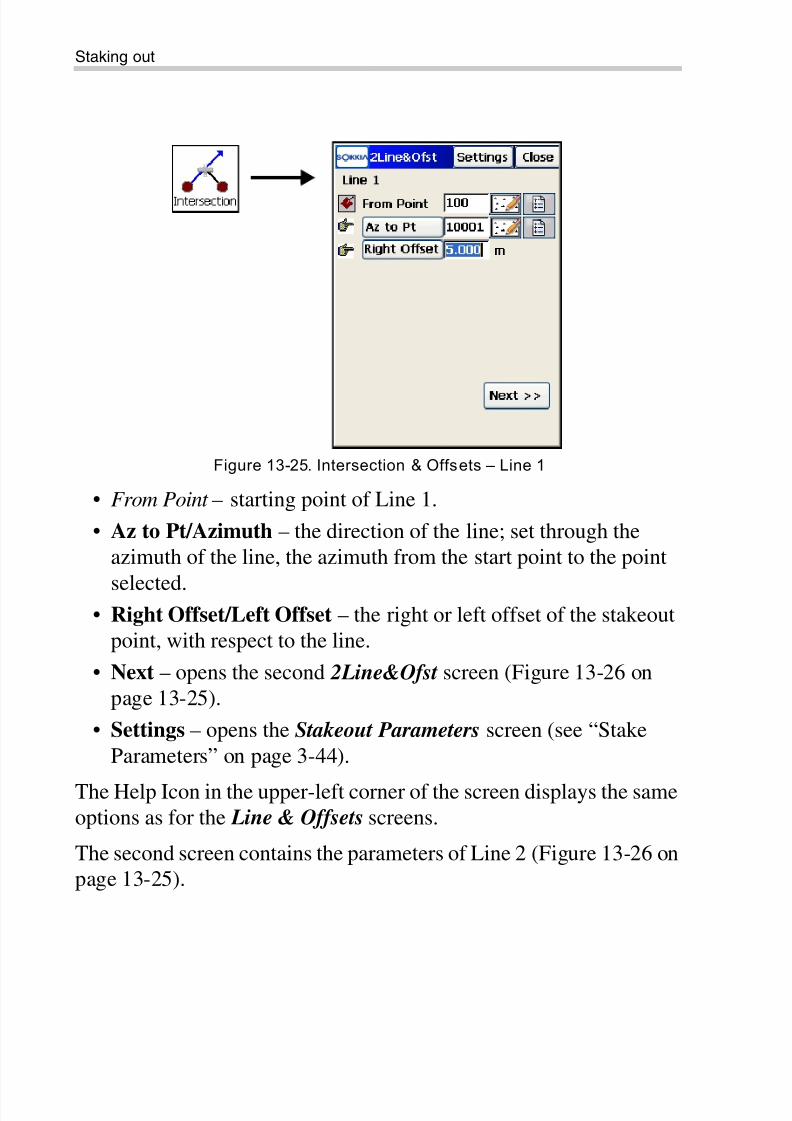
8/10/2019 7010-0944 - SokkiaSSF_rm.pdf
http://slidepdf.com/reader/full/7010-0944-sokkiassfrmpdf 464/623
Staking out
Sokkia Spectrum Survey Field Reference Manual13-24
Figure 13-25. Intersection & Offsets – Line 1
• From Point – starting point of Line 1.
• Az to Pt/Azimuth – the direction of the line; set through theazimuth of the line, the azimuth from the start point to the point
selected.• Right Offset/Left Offset – the right or left offset of the stakeout
point, with respect to the line.
• Next – opens the second 2Line&Ofst screen (Figure 13-26 onpage 13-25).
• Settings – opens the Stakeout Parameters screen (see “Stake
Parameters” on page 3-44).
The Help Icon in the upper-left corner of the screen displays the sameoptions as for the Line & Offsets screens.
The second screen contains the parameters of Line 2 (Figure 13-26 onpage 13-25).

8/10/2019 7010-0944 - SokkiaSSF_rm.pdf
http://slidepdf.com/reader/full/7010-0944-sokkiassfrmpdf 465/623
Offsets
P/N 7010-0944 13-25
Figure 13-26. Intersection & Offsets – Line 2
• From Point – starting point of Line 2.
• Az to Pt/Azimuth – the direction of the line; set through theazimuth of the line, the azimuth from the start point to the point
selected.• Right Offset/Left Offset – the right or left offset of the stakeout
point, with respect to the corresponding line.
• Intersect Ht – the height of the intersection point.
• Store Point – the name of the intersection point.
• Ant Ht (for GPS mode) – the height of the antenna.
• HR (for TS mode) – the height of the rod (target).
• Stakeout – opens the Stakeout screen.
• Settings – opens the Stakeout Parameters screen. See “StakeParameters” on page 3-44.
GPS+ Stakeout
The Stake screen (Figure 13-27 on page 13-26) reflects the progressof the stakeout, displaying the current point name (in the upper-leftcorner of the screen), the layout of the target and the current position,the direction, and the distance to the targets.

8/10/2019 7010-0944 - SokkiaSSF_rm.pdf
http://slidepdf.com/reader/full/7010-0944-sokkiassfrmpdf 466/623
Staking out
Sokkia Spectrum Survey Field Reference Manual13-26
Figure 13-27. Stakeout
• Store – saves the location. Check the parameters of the storedpoint in the Add/Edit point screen.
• Close – returns to the 2Line&Ofst screen (Figure 13-26 on
page 13-25).
TS Stakeout
The Stake screen (Figure 13-28) reflects the progress of the stakeout,displaying the current station (in the upper-left corner of the screen),
the necessary direction, and the value of the distance to the targets.
Figure 13-28. Stakeout

8/10/2019 7010-0944 - SokkiaSSF_rm.pdf
http://slidepdf.com/reader/full/7010-0944-sokkiassfrmpdf 467/623
Offsets
P/N 7010-0944 13-27
• EDM – selects distance measurement mode: either Coarse, Fine,
or Coarse Tracking.
• Store – opens the Store Point screen to store the current position
as a point (see “Store Point” on page 13-9).
• Cur Pos – causes a measurement to be made and displays theresult on the screen.
• Close – saves the changes and closes the screen.
The Help Icon in the upper-left corner of the screen displays the sameoption as for the Line @ Offsets.
Three Point Curve & Offsets
To stakeout a Three Point Curve and Offset, select the 3Pt Curve
icon (Figure 13-29).
The 3 Pt Curve screen (Figure 13-29) creates a curve by selectingthree points: PC point, PT point and either any curve point or the RPpoint.
Figure 13-29. Three Point Curve
The screen displays changes, depending on the first point chosen.
Enter either manually or select from the list or map the following setsof points:

8/10/2019 7010-0944 - SokkiaSSF_rm.pdf
http://slidepdf.com/reader/full/7010-0944-sokkiassfrmpdf 468/623
Staking out
Sokkia Spectrum Survey Field Reference Manual13-28
• PC Point, PT Point, Curve Point – the starting PC (Point of
Curvature) and ending PT (Point of Tangency) points on thecircle, and a third point on the curve.
• PC Point, PT Point, RP Point – the starting PC (Point ofCurvature) and ending PT (Point of Tangency) points on the
circle, and the center point (also called as Radius Point).
For this set of points, the distance between the RP and PC shouldbe equal to the distance between the RP and PT. The radius, andthe PC/PT points, define two curves: one with delta less than orequal to180° (small curve), the other with delta greater than or
equal to 180° (large curve). The value of Small or Large can beselected from the Curve drop-down box to indicate which ofthese two curves should be used for staking.
• SS – the starting station (chainage) of the line.
• Next – opens the Station and Offset screen (see “Station &Offsets” on page 13-19).
• Settings – opens the Stakeout Parameters screen (see “StakeParameters” on page 3-44).
The Help Icon in the upper-left hand corner displays the same pop-up
menu as for the Line & Offset screen (see “Line & Offsets” onpage 13-17).
GPS and TS stakeouts are performed in the same way described in“Line & Offsets” on page 13-17.

8/10/2019 7010-0944 - SokkiaSSF_rm.pdf
http://slidepdf.com/reader/full/7010-0944-sokkiassfrmpdf 469/623
Offsets
P/N 7010-0944 13-29
Curves & Offsets
To stakeout Curves & Offsets, select the Curve icon (Figure 13-30).
The Curv&Ofst screen (Figure 13-30) function performs a stakeoutof a curve (section of an arc) at a specified horizontal and vertical
offset from the curve.
Figure 13-30. Stakeout Curve & Offset
• PC Point – the Point of Curve, the starting point of the arc.
• PT Point (Tangent Azi) – the azimuth of the Tangent of the curve(arc) at the PC point.
• Radius/Deg Curve/Deg Chord – the radius parameters of thecurve.
• Num Subs – check and enable to designate the number ofsubdivisions you want to subdivide the line. For instance, a valueof 3 indicates a calculation of four points by subdividing the lineinto three equal segments.
• Turn – the direction of turn, relative to the PC Point.
• SS – the starting station (chainage) of the line.
• Next – opens the Station and Offsets screen (see “Station &Offsets” on page 13-19).
• Settings – opens the Stakeout Parameters screen (see “StakeParameters” on page 3-44).

8/10/2019 7010-0944 - SokkiaSSF_rm.pdf
http://slidepdf.com/reader/full/7010-0944-sokkiassfrmpdf 470/623
Staking out
Sokkia Spectrum Survey Field Reference Manual13-30
The Help Icon in the upper-left hand corner displays the same pop-up
menu as for the Lin&Ofst screen (see “Line & Offsets” onpage 13-17).
GPS and TS stakeouts are performed in the same way as described in“Line & Offsets” on page 13-17.
Spiral & Offset
To stakeout Spirals & Offset, select the Spiral icon (Figure 13-31).
On the Spiral&Ofst screen (Figure 13-31) you can stake points at
specified Horizontal and Vertical offsets with respect to a specifiedspiral.
Figure 13-31. Stakeout Spiral & Offset
• TS Point – enter a Tangent to the Spiral point (the starting point ofthe spiral).
• Tangent Azi – the azimuth of the tangent to the spiral at the pointTS.
• Radius/Deg Chord/Deg Curve – the radius parameter of the
spiral at the ending point.• Length/Sp Const – the length of the spiral at the ending point, or
the Spiral Constant (the constant of the spiral).

8/10/2019 7010-0944 - SokkiaSSF_rm.pdf
http://slidepdf.com/reader/full/7010-0944-sokkiassfrmpdf 471/623
Offsets
P/N 7010-0944 13-31
For any spiral point , where R is the
Radius, and Length is the length of the spiral, both at the same
specified point.• SS – the starting station (chainage) of the line.
• Turn – specifies whether the spiral turns right or left.
• Dir – the direction of “moving”:
– TS -> SC : Tangent Spiral->Spiral Circle. The incoming spiral
to the internal circle.
– CS -> ST : Circle Spiral->Spiral Tangent. The outgoing spiralfrom the circle to the Tangent.
• Next – opens the Station & Offsets screen (see “Station &Offsets” on page 13-19).
• Settings – opens the Stakeout Parameters screen (see “Stake
Parameters” on page 3-44).
• Close – closes the screen without any settings being made.The Help Icon in the upper-left hand corner displays the same pop-upmenu as for the Line&Ofst screen (see “Line & Offsets” onpage 13-17).
GPS and TS stakeouts are performed in the same way as described in
“Line & Offsets” on page 13-17.
R Le ng th× SpiralConst ( )2=

8/10/2019 7010-0944 - SokkiaSSF_rm.pdf
http://slidepdf.com/reader/full/7010-0944-sokkiassfrmpdf 472/623
Staking out
Sokkia Spectrum Survey Field Reference Manual13-32
Digital Terrain Model Stakeout
To start the DTM (Digital Terrain Model) stakeout, select the DTM
icon. The DTM Stk screen displays (Figure 13-32).
Figure 13-32. DTM Stakeout
• DTM – the name of the TN3 file, which is stored on disk.
• Ant Ht and m (for GPS+ stakeout) – the antenna height and
method of height measurement.
• Use Alignment – check mark and enable to report stations andoffsets.
• Create TIN – check mark and enable to generate a TIN (TN3 file)
cut/sheet model.• HR – for TS stakeout, the height of reflector.
• Stakeout – opens the Initial Point Name screen (see “InitialPoint Name” on page 13-21) and then the Stakeout screen bypressing OK.
• Close – closes the screen without any settings being made.

8/10/2019 7010-0944 - SokkiaSSF_rm.pdf
http://slidepdf.com/reader/full/7010-0944-sokkiassfrmpdf 473/623
Digital Terrain Model Stakeout
P/N 7010-0944 13-33
Open DTM
On the Open DTM screen (Figure 13-33), select a surface file to
open.
Figure 13-33. Open DTM
• Current File – displays the file that is currently open.
• DTM List – lists all surface files in the DTM directory on thecontroller.
• Browse – searches for the file on disk.
• Open – opens the selected file in the DTM Stk screen (Figure 13-
32 on page 13-32).

8/10/2019 7010-0944 - SokkiaSSF_rm.pdf
http://slidepdf.com/reader/full/7010-0944-sokkiassfrmpdf 474/623
Staking out
Sokkia Spectrum Survey Field Reference Manual13-34
GPS+ Stakeout
The Stake(out) screen (Figure 13-34) shows the relative position of
the antenna.
Figure 13-34. Stakeout -DTM
TS Stakeout
The Stake(out) screen (Figure 13-35) reflects the relative position ofthe target. The current point name displays at the top of the screen.
Figure 13-35. Stakeout (TS)
NOTICE
If a stakeout point is located on the outside of theDTM for the job, Sokkia SSF neither calculates nor
writes the coordinates of this point.

8/10/2019 7010-0944 - SokkiaSSF_rm.pdf
http://slidepdf.com/reader/full/7010-0944-sokkiassfrmpdf 475/623
Point in Direction
P/N 7010-0944 13-35
• EDM – selects distance measurement mode: either Coarse, Fine,
or Coarse Tracking.
• Store – saves the location. Check the parameters of the storedpoint in the Add/Edit point screen.
• Cur Pos – causes a measurement to be made and displays theresult on the screen.
• Close – saves the changes and closes the screen.
The Help Icon in the upper-left corner displays the pop-up menu that
contains the same options as in the Offsets stakeout.
Point in Direction
To perform the Point and Direction stakeout, select the Point in
Direction icon (Figure 13-36).
On the Point in Dir screen (Figure 13-36) you can stakeout a point
using a known point, the azimuth, and the offsets from the azimuthline.
Figure 13-36. Stakeout Point & Direct ion
• From Point – the starting point. Enter the name manually or selecta name either from the list or from the map.
• Az to Pt – the azimuth can be set by value or as the direction toanother known point.

8/10/2019 7010-0944 - SokkiaSSF_rm.pdf
http://slidepdf.com/reader/full/7010-0944-sokkiassfrmpdf 476/623
Staking out
Sokkia Spectrum Survey Field Reference Manual13-36
• Angle Offset – the angle offset from the azimuth line.
• Hz Dist – the distance offset along the angle offset line.
• Vert Dist – the height offset.
• Store Pt – enter a point in this field to store the computed point tothe data set.
• Ant Ht (for the GPS mode) – sets the height of the antennareference point (ARP) above the mark. Also, specifies themeasurement type: either slant or vertical.
• HR (for the TS mode) – the height of the rod (target).
• Stakeout – opens the Stakeout screen to perform the stakeout.
• Settings – opens the Stakeout Parameters screen (see “StakeoutParameters” on page 3-66).
• Close – saves the changes and closes the screen.
See the Points stakeout for a description on the options that display by
the Help Icon in the upper-left corner of the screen.
GPS+ Stakeout
The Stake(out) screen (Figure 13-37 on page 13-37) shows the statusof the stakeout, displaying the current point name (in the upper-left
corner of the screen), the layout of the target and the current position,the direction, and the values of the distances to the target.

8/10/2019 7010-0944 - SokkiaSSF_rm.pdf
http://slidepdf.com/reader/full/7010-0944-sokkiassfrmpdf 477/623
Point in Direction
P/N 7010-0944 13-37
Figure 13-37. Point in Direct ion – Stakeout
• Store – performs the measurement and opens the Store Point screen to store the current position as a point.
• Close – saves the changes and closes the screen.
TS Stakeout
The Stakeout screen (Figure 13-38 on page 13-38) reflects theprogress of the stakeout, displaying the current point name (in theupper-left corner of the screen), the layout of the target and currentposition, the necessary direction, and the values of the distances to thetarget.

8/10/2019 7010-0944 - SokkiaSSF_rm.pdf
http://slidepdf.com/reader/full/7010-0944-sokkiassfrmpdf 478/623
Staking out
Sokkia Spectrum Survey Field Reference Manual13-38
Figure 13-38. Point in Direct ion – Stakeout
• EDM – sets the distance measurement mode: either Coarse, Fine,or Coarse Tracking.
• – toggles between the scheme and the map of the layout of the
target and of the current position.• Store – opens the Store Point screen to store the current position
as a point (see “Store Point” on page 13-9).
• Cur Pos – causes a measurement to be made and displays theresult on the screen.
• Close – saves the changes and closes the screen.
The Help Icon in the upper-left corner displays the pop-up menu thatcontains the same options as in the Offsets stakeout.
Point List
To stakeout points from a list, select the Point List icon (Figure 13-
39 on page 13-39).
The stakeout of points from the list can be enabled from the Main
View (see “Actions on the Map” on page 15-4). Press Alt on thecontroller’s keyboard and tap the linework. The Stakeout Vertices item from the pop-up menu appears.

8/10/2019 7010-0944 - SokkiaSSF_rm.pdf
http://slidepdf.com/reader/full/7010-0944-sokkiassfrmpdf 479/623
Point List
P/N 7010-0944 13-39
The Point List screen (Figure 13-39) performs a stakeout of existing
points from a point list, selects the starting stakeout point, and listsstakeouts in direct or reverse order.
Figure 13-39. Stakeout Point List
• Point List – the preexisting points list: either select from the list or
enter manually.
• List of Points – the list of currently selected points.
• Up and down arrows moves the highlighted point(s) up and down
in the order of the points.
• – if activated, uses the up/down arrows on the keyboard to
move the highlighted point up and down.
• – deletes the highlighted point from the list.
• – closes the scheme of the polygon. Only the list of points are
available.
• Ant Ht (for GPS mode) – sets the height of the antenna referencepoint (ARP) above the mark. Also, specifies the measurementtype for the height: either slant or vertical.
• HR (for the TS mode) – the height of the rod (target).
• Reverse Order – check mark and enable to start a stakeout from
the end of the Point List.
• Stakeout – opens the Stake(out) screen.

8/10/2019 7010-0944 - SokkiaSSF_rm.pdf
http://slidepdf.com/reader/full/7010-0944-sokkiassfrmpdf 480/623
Staking out
Sokkia Spectrum Survey Field Reference Manual13-40
See the Points stakeout for a description of the options on the Help
Icon in the upper-left corner of the screen.
Stakeout (GPS and TS)
GPS and TS stakeouts are performed in the same way as described in“Stakeout Point” on page 13-2.
The Help Icon in the upper-left corner displays the pop-up menu thatcontains the same options as in the Offsets stakeout.
Here, points can be staked out in any order by selecting the next
stakeout point using an additional option from the Help Icon menu inthe upper-left corner: Select Stakeout Point opens the Select Point screen to select a stakeout point from the list.
Select Point for the Stakeout
The Select Point screen (Figure 13-40 on page 13-41) displays thePoint List being staked, from which points can be randomly selected
to continue the stakeout.
The new starting point can be selected from the list or by double-tapping a point on the map to the right of the list.
• Show Remaining Points – check mark and enable to show all thepoints that have not yet been staked out.
• Show Staked Points – check mark and enable to display points in
the list that have already been staked out.• Reverse Order – check mark and enable to stakeout points from
the last point in the list to the first.

8/10/2019 7010-0944 - SokkiaSSF_rm.pdf
http://slidepdf.com/reader/full/7010-0944-sokkiassfrmpdf 481/623
Point List
P/N 7010-0944 13-41
Figure 13-40. Select Point
Digital Level Stakeout
DL Stakeout of point lists can be accessed from the main menu or the
top-left menu icon in the Level Run screen (for details, see “LevelRun” on page 12-2).
The level Stake Point List screen (Figure 13-41 on page 13-42)selects a list of design points to determine the elevation and compute
a cut/fill value at every point on the list.
• BS Point – the backsight point for the stake measurement (eitherenter manually or select from the map or list).
• Point List – the point list point to stake (either enter manually orselect from the list). The point list is displayed in the tab and in
the plot.
• Reverse Order – stakes in reverse order of the point list.
• BS – if not already measured, takes a backsight measurementbefore staking.
• Stakeout – opens the level Stakeout screen for every point of thelist (see Figure 13-13 on page 13-13).

8/10/2019 7010-0944 - SokkiaSSF_rm.pdf
http://slidepdf.com/reader/full/7010-0944-sokkiassfrmpdf 482/623
Staking out
Sokkia Spectrum Survey Field Reference Manual13-42
Figure 13-41. DL Stake Point List
DL Stakeout of Elevations
The DL Stakeout of elevations can be accessed from the main menuby selecting the Elevation icon (Figure 13-42) or from top-left menuin the Level Run screen (for details, see “Level Run” on page 12-2).
On the Stakeout Elev screen (Figure 13-42), select a backsight point
and the elevation to determine the elevation.
Figure 13-42. Stakeout Elevation

8/10/2019 7010-0944 - SokkiaSSF_rm.pdf
http://slidepdf.com/reader/full/7010-0944-sokkiassfrmpdf 483/623
Curve
P/N 7010-0944 13-43
• BS – if not already measured, takes a BS measurement before
staking.
• Stakeout – opens the level Stakeout screen for the elevation youwant. This screen is identical to that shown in Figure 13-13 onpage 13-13.
Curve
To stakeout along a horizontal curve, select the Curve icon
(Figure 13-43). The Curve screen displays to select two points of thecurve.
Figure 13-43. Curve
• PC Point, PT Point – manually enter or select from the list or themap the starting PC (Point of Curvature) and ending PT (Point of
Tangency) points on the circle.
• Radius/Deg Chord/Deg Curve – the radius parameter of the
curve at the ending point.
• Turn – specifies whether the curve turns right or left.
The radius, and the PC/PT points, define two curves: one withdelta less than or equal to180° (small curve), the other with delta
greater than or equal to 180° (large curve). The value of Small or
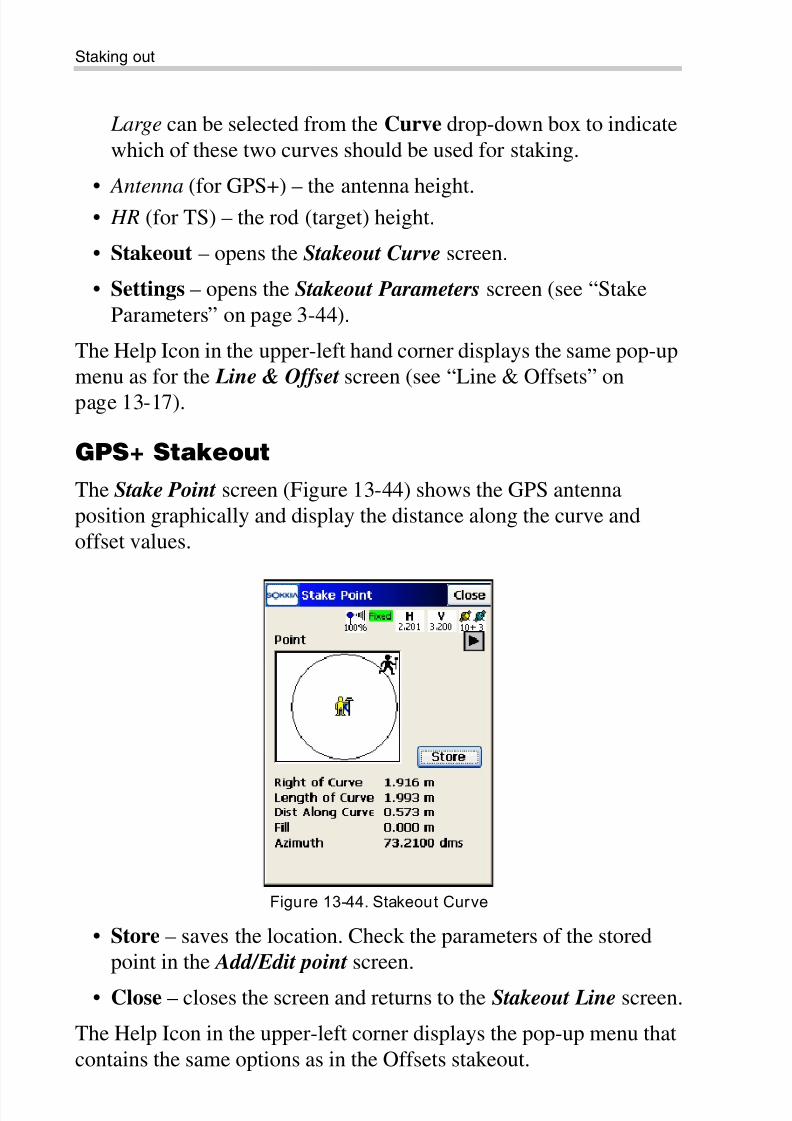
8/10/2019 7010-0944 - SokkiaSSF_rm.pdf
http://slidepdf.com/reader/full/7010-0944-sokkiassfrmpdf 484/623
Staking out
Sokkia Spectrum Survey Field Reference Manual13-44
Large can be selected from the Curve drop-down box to indicate
which of these two curves should be used for staking.
• Antenna (for GPS+) – the antenna height.• HR (for TS) – the rod (target) height.
• Stakeout – opens the Stakeout Curve screen.
• Settings – opens the Stakeout Parameters screen (see “Stake
Parameters” on page 3-44).
The Help Icon in the upper-left hand corner displays the same pop-upmenu as for the Line & Offset screen (see “Line & Offsets” onpage 13-17).
GPS+ Stakeout
The Stake Point screen (Figure 13-44) shows the GPS antennaposition graphically and display the distance along the curve andoffset values.
Figure 13-44. Stakeout Curve
• Store – saves the location. Check the parameters of the storedpoint in the Add/Edit point screen.
• Close – closes the screen and returns to the Stakeout Line screen.
The Help Icon in the upper-left corner displays the pop-up menu that
contains the same options as in the Offsets stakeout.

8/10/2019 7010-0944 - SokkiaSSF_rm.pdf
http://slidepdf.com/reader/full/7010-0944-sokkiassfrmpdf 485/623
Curve
P/N 7010-0944 13-45
TS Stakeout
The Stake Point screen (Figure 13-45) displays the rod position
graphically and reports the necessary direction, and the values of thedistances to the curve.
Figure 13-45. Stakeout
• EDM – selects distance measurement mode: either Coarse, Fine,or Coarse Tracking.
• Stop – instructs the Robotic Total Station to stop tracking and gointo “Stand By” mode.
• Search – instructs the Robotic Total Station to start searching for
the prism.
• Cur Pos – causes a measurement to be made and displays theresult on the screen.
• Store – takes a measurement and opens the Store Point screen tostore the current position as a point (see “Store Point” on
page 13-9).
• Close – saves the changes and closes the screen.
The Help Icon in the upper-left corner displays the pop-up menu thatcontains the same options as in the Offsets stakeout.

8/10/2019 7010-0944 - SokkiaSSF_rm.pdf
http://slidepdf.com/reader/full/7010-0944-sokkiassfrmpdf 486/623
Staking out
Sokkia Spectrum Survey Field Reference Manual13-46
Real Time Road
To start the road stakeout in real time, select the Real Time Rd icon
(Figure 13-46). The Stakeout Road screen displays.
The Stk Road screen (Figure 13-46) selects a road for stakeout anddisplays the plan of the chosen road.
The Help Icon in the upper-left hand corner displays the same pop-upmenu as the Line&Ofst screen.
Figure 13-46. Stakeout Road
• Road / H Alnt / HV Alnt – the road, horizontal alignment, andhorizontal/vertical alignments to be staked-out. Can be enteredmanually or chosen from the list.
• SS (Start Stn) – the starting point of the stakeout, the distance
from the beginning of the road.
• Antenna (for GPS+) – the antenna height.
• HR (for TS) – the rod (target) height.
• Settings – opens the Stakeout Parameters screen (see “StakeoutParameters” on page 3-66).
• Close – saves the changes and closes the screen.
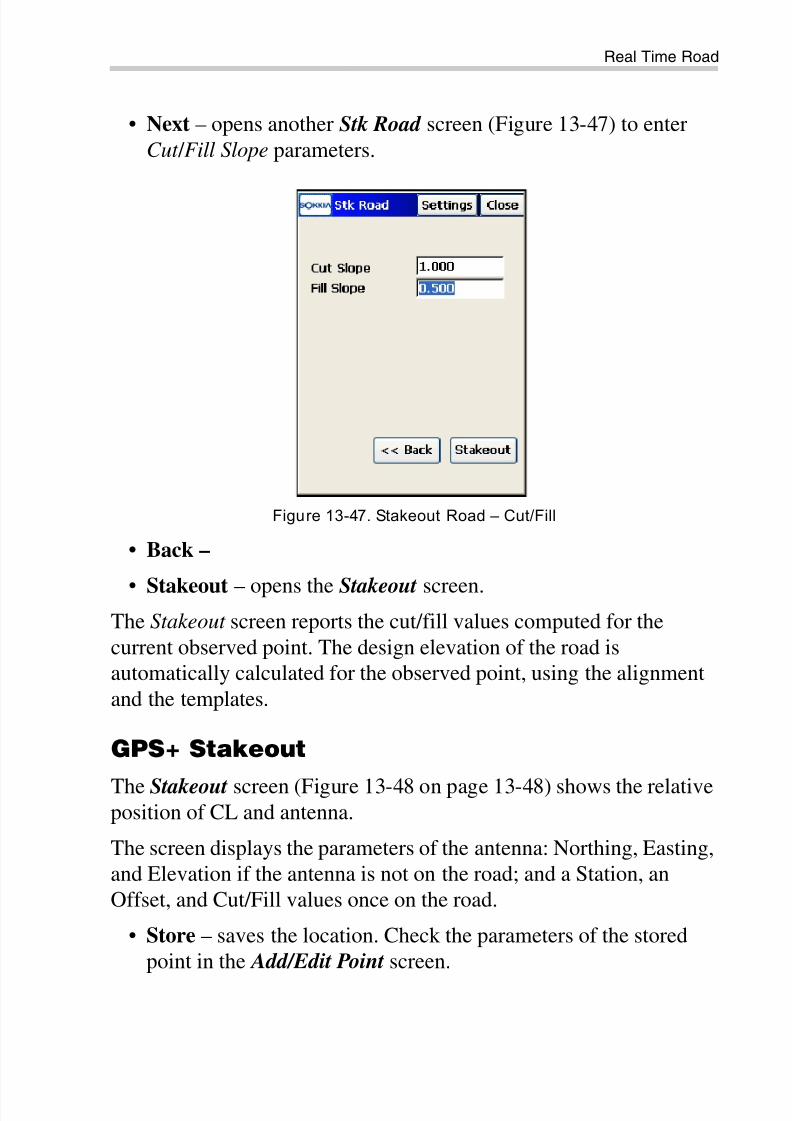
8/10/2019 7010-0944 - SokkiaSSF_rm.pdf
http://slidepdf.com/reader/full/7010-0944-sokkiassfrmpdf 487/623
Real Time Road
P/N 7010-0944 13-47
• Next – opens another Stk Road screen (Figure 13-47) to enter
Cut / Fill Slope parameters.
Figure 13-47. Stakeout Road – Cut/Fill
• Back –
• Stakeout – opens the Stakeout screen.The Stakeout screen reports the cut/fill values computed for the
current observed point. The design elevation of the road isautomatically calculated for the observed point, using the alignment
and the templates.
GPS+ Stakeout
The Stakeout screen (Figure 13-48 on page 13-48) shows the relativeposition of CL and antenna.
The screen displays the parameters of the antenna: Northing, Easting,and Elevation if the antenna is not on the road; and a Station, anOffset, and Cut/Fill values once on the road.
• Store – saves the location. Check the parameters of the storedpoint in the Add/Edit Point screen.

8/10/2019 7010-0944 - SokkiaSSF_rm.pdf
http://slidepdf.com/reader/full/7010-0944-sokkiassfrmpdf 488/623
Staking out
Sokkia Spectrum Survey Field Reference Manual13-48
Figure 13-48. Stakeout
TS Stakeout
The Stakeout screen (Figure 13-49) reflects the relative position of
CL and target. The screen displays the current point name (in theupper-left corner of the screen) and the parameters of the target.
Figure 13-49. Stakeout Real Time Road
• Store – stores the current position as a point.
• Cur Pos – measures the target.
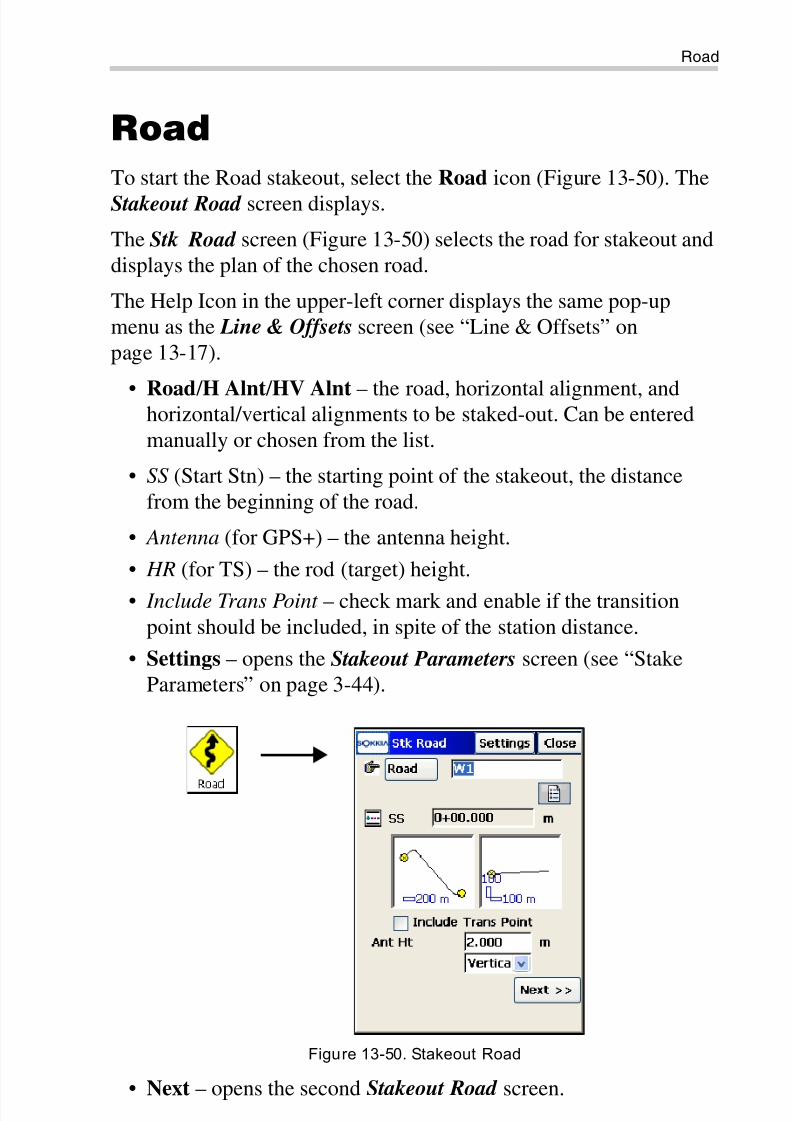
8/10/2019 7010-0944 - SokkiaSSF_rm.pdf
http://slidepdf.com/reader/full/7010-0944-sokkiassfrmpdf 489/623
Road
P/N 7010-0944 13-49
Road
To start the Road stakeout, select the Road icon (Figure 13-50). The
Stakeout Road screen displays.
The Stk Road screen (Figure 13-50) selects the road for stakeout anddisplays the plan of the chosen road.
The Help Icon in the upper-left corner displays the same pop-upmenu as the Line & Offsets screen (see “Line & Offsets” onpage 13-17).
• Road / H Alnt / HV Alnt – the road, horizontal alignment, andhorizontal/vertical alignments to be staked-out. Can be enteredmanually or chosen from the list.
• SS (Start Stn) – the starting point of the stakeout, the distancefrom the beginning of the road.
• Antenna (for GPS+) – the antenna height.
• HR (for TS) – the rod (target) height.
• Include Trans Point – check mark and enable if the transition
point should be included, in spite of the station distance.
• Settings – opens the Stakeout Parameters screen (see “StakeParameters” on page 3-44).
Figure 13-50. Stakeout Road
• Next – opens the second Stakeout Road screen.

8/10/2019 7010-0944 - SokkiaSSF_rm.pdf
http://slidepdf.com/reader/full/7010-0944-sokkiassfrmpdf 490/623
Staking out
Sokkia Spectrum Survey Field Reference Manual13-50
• Close – saves the settings and closes the screen.
The second Stk Road screen (Figure 13-51) displays the properties of
the cross section on the stakeout station and performs the stakeout ofall selected points.
Figure 13-51. Stakeout Road
• Station – the station where the stakeout is performed. The arrowbuttons change the station number by the value of StationInterval.
• – advances the station by the specified Station Interval
for staking out points at the Next station.
• Sta Interval – the interval of the station increment.
• Segment Pt – the point code of the current segment. The arrowicons next to this field moves the current segment point
along the cross-section. The result displays on the scheme at the
bottom of the screen.
• Right/Left Offset – the horizontal offset from the current segmentpoint.
• Up/Down Offset – the vertical offset from the current segment
point.• Select the type of template offsets:

8/10/2019 7010-0944 - SokkiaSSF_rm.pdf
http://slidepdf.com/reader/full/7010-0944-sokkiassfrmpdf 491/623
Road
P/N 7010-0944 13-51
– Centerline: both the horizontal and vertical offset starts at the
centerline.
– Segment : the horizontal offset starts at the beginning of thesegment; the vertical offset starts at the centerline.
– Surface: the horizontal offset starts at the beginning of thesegment; the vertical offset starts at the point on the surface
of the segment that corresponds with the horizontal offset.
• – switches on/off the arrow keys on the keyboard. The upper
button stands for the station increment/decrement, the lower
button stands for the current segment point location. Only onebutton can be enabled at a time.
• Back – returns to the first Stakeout Road screen.
• Stakeout – opens the Initial Point Name screen.
• Settings – opens the Stakeout Parameters screen (see “StakeParameters” on page 3-44).
• Close – saves the settings and closes the screen.
GPS+ Stakeout
The Stakeout screen (Figure 13-52) displays the relative position ofthe antenna and the target. The panel on the right displays theparameters of the target.
Figure 13-52. Stakeout

8/10/2019 7010-0944 - SokkiaSSF_rm.pdf
http://slidepdf.com/reader/full/7010-0944-sokkiassfrmpdf 492/623
Staking out
Sokkia Spectrum Survey Field Reference Manual13-52
• – advances the station by the specified Station Intervalfor staking out points at the Next station.
• Store – saves the location. Check the parameters of the storedpoint in the Add/Edit Point screen.
• Close – closes the screen and returns to the Stakeout Roads screen.
TS Stakeout
The Stk Slope screen (Figure 13-54 on page 13-54) reflects theprogress of the stakeout, displaying the current station (in the upper-left corner of the screen), the layout of the target and the currentposition, the necessary direction, and the value of the distance to thetargets (see Figure 13-53 on page 13-53).
Tapping in the current station string enables the bitmap menu todisplay the station number and the offset value of the current point.
• EDM – selects distance measurement mode: either Coarse, Fine,
or Coarse Tracking.• – advances the station by the specified Station Interval
for staking out points at the Next station.
• Store – takes a measurement and opens the Store Point screen(see “Store Point” on page 13-9) to store the current position as apoint.
• Cur Pos – causes a measurement to be made and displays theresult on the screen.
• Close – saves the changes and closes the screen.
The Help Icon in the upper-left corner displays a pop-up menu thatcontains the same options as in the Offsets stakeout.

8/10/2019 7010-0944 - SokkiaSSF_rm.pdf
http://slidepdf.com/reader/full/7010-0944-sokkiassfrmpdf 493/623
Slope
P/N 7010-0944 13-53
Figure 13-53. Stakeout Road – Stakeout
Slope
To start the slope stakeout, select the Slope icon (Figure 13-54 onpage 13-54). The Stk Slope screen displays.
The Stk Slope screen selects which slope should be staked out (seeFigure 13-54 on page 13-54).
The Help Icon in the upper-left corner displays the same pop-up
menu as for the Line & Offsets screen.
• Road / H Alnt / HV Alnt – the road, horizontal alignment,horizontal/vertical alignments to be staked-out. Can be entered
manually or chosen from the list.
• SS (Start Stn) – the starting point of the stakeout, the distance
from the beginning of the road.
• Antenna (for GPS+) – the antenna height.
• HR (for TS) – the rod height.
• Include Trans Point – check mark and enable if the transitionpoint should be included in spite of the station distance.
• Settings – opens the Stakeout Parameters screen (see “StakeParameters” on page 3-44).

8/10/2019 7010-0944 - SokkiaSSF_rm.pdf
http://slidepdf.com/reader/full/7010-0944-sokkiassfrmpdf 494/623
Staking out
Sokkia Spectrum Survey Field Reference Manual13-54
Figure 13-54. Stakeout Slope
• Next – opens another Stakeout Slope screen.
• Settings – opens the Stakeout Parameters screen (see “Stakeout
Parameters” on page 3-66).
• Close – saves the settings and closes the screen.
This second Stk Slope screen (Figure 13-54) displays the propertiesof the cross-section at the stakeout station and helps to perform thestakeout of the catch point (the point where the slope crosses the
surface of the terrain) and/or the offset of the catch point.
Figure 13-55. Stakeout Alignment

8/10/2019 7010-0944 - SokkiaSSF_rm.pdf
http://slidepdf.com/reader/full/7010-0944-sokkiassfrmpdf 495/623
Slope
P/N 7010-0944 13-55
• Sta – the station where the stakeout is performed. The arrow
buttons change the station number on the value of the Station Interval.
• Sta Interval – the interval of the station increment.
• Hinge Point – the hinge point code. The hinge point is a point ofrotation of the Cut/Fill slopes. The arrow in this field moves thehinge point along the cross section. This is reflected on thescheme in the bottom of this screen.
• Offset from CP – the offset from the catch point.
• Right/Left Slope – the values of the Cut/Fill slope parameters
applied to the hinge point.
• – switches the keyboard arrow keys on/off. The upper
arrows stands for the station increment/decrement, the lowerarrows stands for the current hinge point location. Only one set ofarrows can be enabled at a time.
• Back – returns to the Slope Stakeout screen.
• Stakeout – opens the Stakeout screen.• Settings – opens the Stakeout Parameters screen (see “Stakeout
Parameters” on page 3-66).
• Close – saves the settings and closes the screen.

8/10/2019 7010-0944 - SokkiaSSF_rm.pdf
http://slidepdf.com/reader/full/7010-0944-sokkiassfrmpdf 496/623
Staking out
Sokkia Spectrum Survey Field Reference Manual13-56
GPS+ Stakeout
The Stake(out) screen (Figure 13-56) shows the direction to target
and the parameters of the target. Cut/Fill values are computed fromCut/Fill Slope; other offsets are computed using the Catch Point.
Figure 13-56. GPS Stakeout Slope
• – advances the station by the specified Station Interval
for staking out points at the Next station.
• Store – saves the location. Edit the parameters of the stored pointin the Add/Edit Point screen.
• Close – closes the screen and returns to the Stakeout Roads screen.
The Help Icon in the upper-left corner displays a pop-up menu thatcontains the same options as in the Offsets stakeout.
TS Stakeout
The Stake (Stakeout Catch Point) screen (“TS Stakeout Slope” on
page 13-57) reflects the progress of the stakeout, displaying thecurrent station (in the upper-left hand corner of the screen), the layout
of the target and the current position, and the parameters of the

8/10/2019 7010-0944 - SokkiaSSF_rm.pdf
http://slidepdf.com/reader/full/7010-0944-sokkiassfrmpdf 497/623
Slope
P/N 7010-0944 13-57
stakeout. Cut/Fill values are computed from Cut/Fill Slope; other
offsets are computed using the Catch Point .
Figure 13-57. TS Stakeout Slope
• EDM – selects distance measurement mode: either Coarse, Fine
or Coarse Tracking.
• Cur Pos – causes a measurement to be made and displays the
result on the screen.
• Store – takes a measurement and opens the Store Point screen(see “Store Point” on page 13-9) to store the current position as a
point.
• Turn L/R – the horizontal angle to the left/right on which to turn
the total station.• To TS – the distance to move.
• F CP – cut/fill computed from cut/fill slope.
• To CL – distance away from the center line.
• Along CL – distance along the center line.
• Elev – the fill with respect to the Hinge Point.
• – advances the station by the specified Station Interval for staking out points at the Next station.
• Close – saves the changes and closes the screen.

8/10/2019 7010-0944 - SokkiaSSF_rm.pdf
http://slidepdf.com/reader/full/7010-0944-sokkiassfrmpdf 498/623
Staking out
Sokkia Spectrum Survey Field Reference Manual13-58
Linework
To start a Linework stakeout, select the Linework icon
(Figure 13-58). The Linework screen displays (Figure 13-58). Selecta desired code and string available for this code.
Figure 13-58. Limework
• Stakeout – opens the Stakeout screen.
• Settings – opens the Stakeout Parameters screen (see “StakeParameters” on page 3-44).
• Close – saves the changes and closes the screen.
GPS and TS stakeouts are performed in the same way as described in
“Point List” on page 13-38.The Help Icon in the upper-left corner displays a pop-up menu thatcontains the same options as in the Offsets stakeout.

8/10/2019 7010-0944 - SokkiaSSF_rm.pdf
http://slidepdf.com/reader/full/7010-0944-sokkiassfrmpdf 499/623
P/N 7010-0944
Chapter 14
14-1
COGO CalculationsTo calculate a COCGO task, tap on the COGO icon in the mainmenu.
The COGO menu (Figure 14-1 on page 14-2) allows calculation ofthe following tasks:
• Inverse
• Point in Direction
• Intersection
• Calculator
• Curves
• Area
• Corner Angle
• Line Offset
• Curve Offset
• Road Offset
• Adjust• Traverse
Also, it provides a Calculator for various calculations andconversions.

8/10/2019 7010-0944 - SokkiaSSF_rm.pdf
http://slidepdf.com/reader/full/7010-0944-sokkiassfrmpdf 500/623
COGO Calculations
Sokkia Spectrum Survey Field Reference Manual14-2
Figure 14-1. Cogo Menu
The Help Icon opens a pop-up menu giving access to the helpfiles, module activation codes, port data logging, changing menu
interface, and information about the Sokkia SSF used (for detail see“Help Icon’s Pop-up Menu” on page 1-9).The thumbnail image (icons) to the left of the tabs for every COGO
screen displays the type of task being performed. Tap this image to
open a larger map (see Figure 14-4 on page 14-5). Tap the largeimage to hide it.
TIP
If the menu options you need are not visible
(available), tap on the Configure / Menus icons toenable these options in the Config Menus screen.

8/10/2019 7010-0944 - SokkiaSSF_rm.pdf
http://slidepdf.com/reader/full/7010-0944-sokkiassfrmpdf 501/623
Inverse
P/N 7010-0944 14-3
Inverse
To perform an Inverse task, tap the Inverse icon (Figure 14-2). The
P_res screen displays.
Figure 14-2. Inverse Menu
Point to Point
To calculate the Point-to-Point Inverse, tap the Pt To Pt icon(Figure 14-2). The Two-Point Inverse screen displays (Figure 14-3 onpage 14-4).

8/10/2019 7010-0944 - SokkiaSSF_rm.pdf
http://slidepdf.com/reader/full/7010-0944-sokkiassfrmpdf 502/623
COGO Calculations
Sokkia Spectrum Survey Field Reference Manual14-4
On the Two-Point Inverse screen, compute the inverse between two
known points. Inverse is comprised of the azimuth from one point tothe other and the distance between these points.
Figure 14-3. Two-Point Inverse
The Inverse tab contains initial data for the following parameters:
• From Point – the first point name; either enter manually or selectfrom the map or from the list.
• To Point – the second point name; either enter manually or selectfrom the map or from the list.
• Calc – calculates the inverse.
The Help Icon in the upper-left corner of the screen displays a pop-up
menu containing two items:
• Edit Points – opens the Points screen (see “Points” on page 6-2).
• Help – accesses the Help files.
Tap the icon to the left of the tabs to open a larger map of the taskbeing performed (Figure 14-4 on page 14-5). Tap the large image tohide it.

8/10/2019 7010-0944 - SokkiaSSF_rm.pdf
http://slidepdf.com/reader/full/7010-0944-sokkiassfrmpdf 503/623
Inverse
P/N 7010-0944 14-5
Figure 14-4. Large Image of COGO Task
The Results tab shows the initial data (From Point, To Point ) and theresults of the calculation (Figure 14-5). The results can vary, based on
whether a geodesic display system is selected or not.
When Grid or Ground is the selected display system, the results tablists the following parameters (Figure 14-5).
Figure 14-5. Two-Point Inverse – Results in Non-Geodesic Display System
• Azimuth (or Bearing) – to the second point from the first point.
• HDist (Horizontal Distance)/ VDist (Vertical distance) – from onepoint to another (Horiz). The “-” sign means that the height of thesecond point is lower than the height of the first point (Vert).
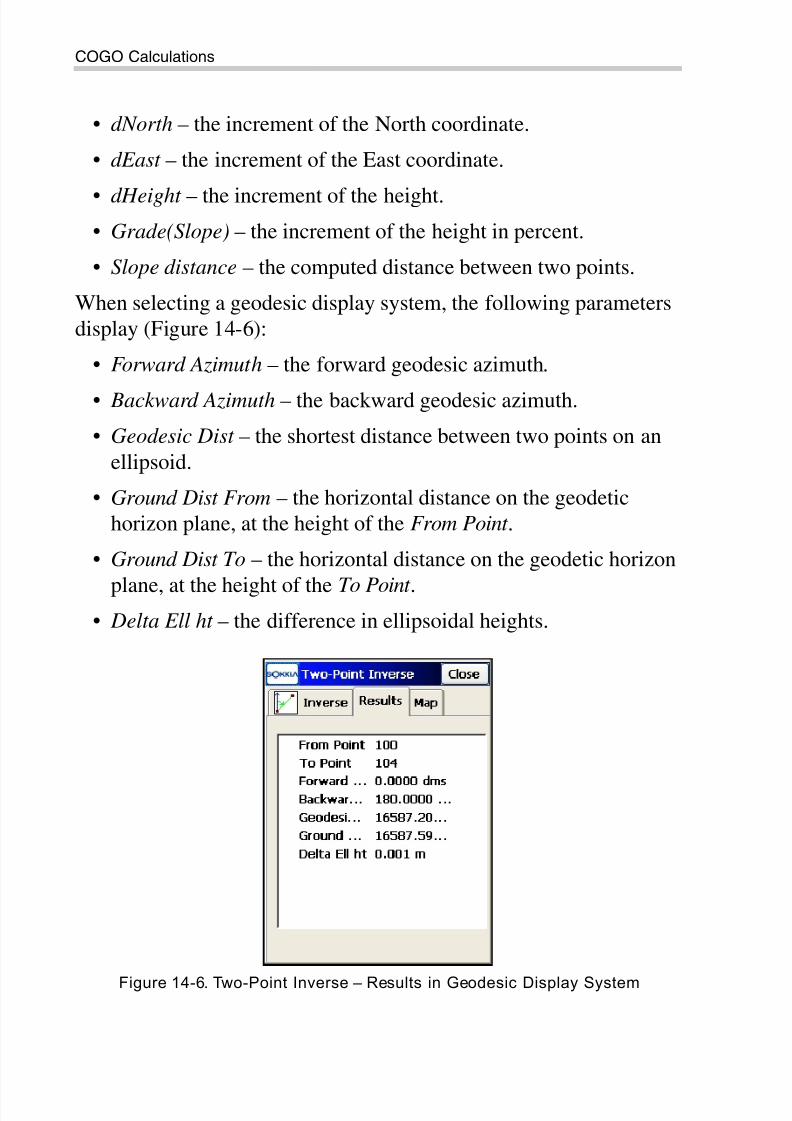
8/10/2019 7010-0944 - SokkiaSSF_rm.pdf
http://slidepdf.com/reader/full/7010-0944-sokkiassfrmpdf 504/623
COGO Calculations
Sokkia Spectrum Survey Field Reference Manual14-6
• dNorth – the increment of the North coordinate.
• dEast – the increment of the East coordinate.
• dHeight – the increment of the height.
• Grade(Slope) – the increment of the height in percent.
• Slope distance – the computed distance between two points.
When selecting a geodesic display system, the following parametersdisplay (Figure 14-6):
• Forward Azimuth – the forward geodesic azimuth.
• Backward Azimuth – the backward geodesic azimuth.
• Geodesic Dist – the shortest distance between two points on an
ellipsoid.
• Ground Dist From – the horizontal distance on the geodetichorizon plane, at the height of the From Point .
• Ground Dist To – the horizontal distance on the geodetic horizon
plane, at the height of the To Point .• Delta Ell ht – the difference in ellipsoidal heights.
Figure 14-6. Two-Point Inverse – Results in Geodesic Display System

8/10/2019 7010-0944 - SokkiaSSF_rm.pdf
http://slidepdf.com/reader/full/7010-0944-sokkiassfrmpdf 505/623
Inverse
P/N 7010-0944 14-7
The Map tab shows the illustration for the results (Figure 14-7).
Figure 14-7. Two-Point Inverse – Map
For a description of the icons to the left, see “Toolbar” on page 15-2
Point to LineTo calculate the station of the known point inverse to the known line,select the Point to Line icon. The Inverse Point to Line screen
displays (Figure 14-8).
On the Inverse Point to Line tab, enter the following parameters.
Figure 14-8. Inverse Point to Line

8/10/2019 7010-0944 - SokkiaSSF_rm.pdf
http://slidepdf.com/reader/full/7010-0944-sokkiassfrmpdf 506/623
COGO Calculations
Sokkia Spectrum Survey Field Reference Manual14-8
• Point – sets the current point name: either enter manually, or
select from the map or from the list.
• Start Point – the starting point of the reference line.• Azimuth/Az to Pt – sets the azimuth of the reference line.
Rotates through selections when tapped.
– Azimuth: sets the azimuth from the starting point by value.
– Az to Pt: sets another known point to which the direction iscalculated and input as azimuth.
• Start Stn – the starting station of the reference line.
• Store PTL Point – store the point as PTL point (see “PTL Mode”on page 11-6).
• Calc – calculates the inverse and displays the results on the
Results tab.
The Help Icon in the upper-left corner of the screen displays a pop-upmenu containing two items:
• Edit Points – opens the Points screen to edit the points (see
“Points” on page 6-2).
• Help – accesses the Help files.
The Results tab (Figure 14-9) shows the initial data and the results of
the calculation: Station, Offset , and Height parameters.
Figure 14-9. Inverse Point to Line – Results Tab

8/10/2019 7010-0944 - SokkiaSSF_rm.pdf
http://slidepdf.com/reader/full/7010-0944-sokkiassfrmpdf 507/623
Inverse
P/N 7010-0944 14-9
The Map tab (Figure 14-10) shows the results graphically.
Figure 14-10. Inverse Point to L ine – Map Tab
Point to Points List
To calculate the inverse for all the points in the Points list withrespect to a known point, tap the Point to List icon. The I nverse Point
to Point List screen displays (Figure 14-11).
The Inverse Pt to Pt List tab illustrates the point inverse operation.
Figure 14-11. Inverse Point to Point L ist
• Point – sets the known point name: either enter manually or
select from the map or from the list.

8/10/2019 7010-0944 - SokkiaSSF_rm.pdf
http://slidepdf.com/reader/full/7010-0944-sokkiassfrmpdf 508/623
COGO Calculations
Sokkia Spectrum Survey Field Reference Manual14-10
• Point List – the Point List name: either enter manually or from the
list of Point Lists.
• List of Points – the list of currently selected points. For details see“Point Lists” on page 6-33.
• – closes the plot of the polygon. Only the list of points is
available.
• Calc – calculates the inverse and displays the results on the Results tab.
The Help Icon in the upper-left corner of the screen displays a pop-upmenu containing three items:
• Edit Points – opens the Points screen to edit the points (see“Points” on page 6-2).
• Edit Point Lists – opens the List of Point Lists screen to edit thepoint lists (see “Point Lists” on page 6-33).
• Help – accesses the Help files.
The Results tab (Figure 14-12) shows the initial data and the results ofthe calculation: closest point, azimuth, distance, height, slope andgrade parameters.
Figure 14-12. Inverse Point to Point List – Results Tab
The Map tab shows the inverse point to point operation resultsgraphically.
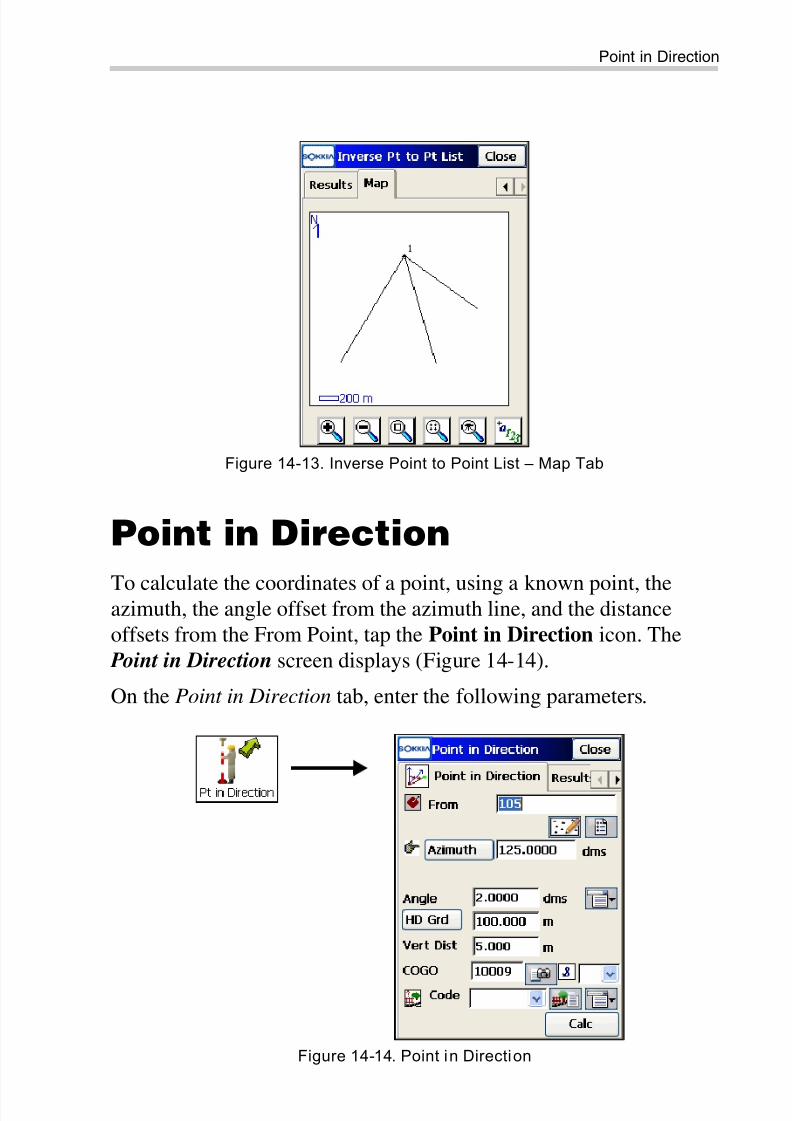
8/10/2019 7010-0944 - SokkiaSSF_rm.pdf
http://slidepdf.com/reader/full/7010-0944-sokkiassfrmpdf 509/623
Point in Direction
P/N 7010-0944 14-11
Figure 14-13. Inverse Point to Point List – Map Tab
Point in Direction
To calculate the coordinates of a point, using a known point, theazimuth, the angle offset from the azimuth line, and the distanceoffsets from the From Point, tap the Point in Direction icon. The Point in Direction screen displays (Figure 14-14).
On the Point in Direction tab, enter the following parameters.
Figure 14-14. Point in Direction

8/10/2019 7010-0944 - SokkiaSSF_rm.pdf
http://slidepdf.com/reader/full/7010-0944-sokkiassfrmpdf 510/623
COGO Calculations
Sokkia Spectrum Survey Field Reference Manual14-12
• From Point – the starting point: either enter manually or select
from the list or from the map.
• Azimuth/Az to Pt – sets the azimuth of the line from the FromPoint. Rotates through selections when tapped.
– Azimuth: sets the azimuth by value.
– Az to Pt: sets another known point to which the direction iscalculated and input as azimuth.
• Angle (Offset) – the angle offset from the azimuth line.
• Hz Dist – the distance offset along the angle offset line.
• Vert Dist – the height offset.
• Cogo Pt – the computed point name.
• Code – the computed point code.
• Calc – calculates the coordinates and displays the results on the Results tab.
The Help Icon in the upper-left corner of the screen displays a pop-upmenu containing two items:
• Edit Points – opens the Points screen to edit the points (see“Points” on page 6-2).
• Help – accesses the Help files.
The Results tab (Figure 14-15) on the Point in Direction screen(Figure 14-15 on page 14-13) shows the initial data and results of the
calculation.
Tap Save to save the results of the calculation

8/10/2019 7010-0944 - SokkiaSSF_rm.pdf
http://slidepdf.com/reader/full/7010-0944-sokkiassfrmpdf 511/623
Point in Direction
P/N 7010-0944 14-13
Figure 14-15. Point in Direction – Results Tab
The Map tab (Figure 14-16) shows the results graphically.
Figure 14-16. Point in Direction – Map Tab

8/10/2019 7010-0944 - SokkiaSSF_rm.pdf
http://slidepdf.com/reader/full/7010-0944-sokkiassfrmpdf 512/623
COGO Calculations
Sokkia Spectrum Survey Field Reference Manual14-14
Compute the Intersection
Point
To compute the intersection point or points when given two knownpoints and either the directions or distances from the known points,tap the Intersection icon. The Intersection screen displays
(Figure 14-17).
The Intersection tab contains initial data for the intersection task(Figure 14-17).
Figure 14-17. Intersection
• Point 1 – the first point; either enter manually or select from the
map or the list.• Azimuth/Distance/Az to Pt: rotates through selections.
– Azimuth: sets the azimuth from the first point to theunknown point.
– Distance: sets the distance between the first point to the
unknown point.
– Az to Pt: sets another known point to which the direction willbe calculated and input as azimuth.
• Point 2 – the second point; either enter manually or select fromthe map or the list.
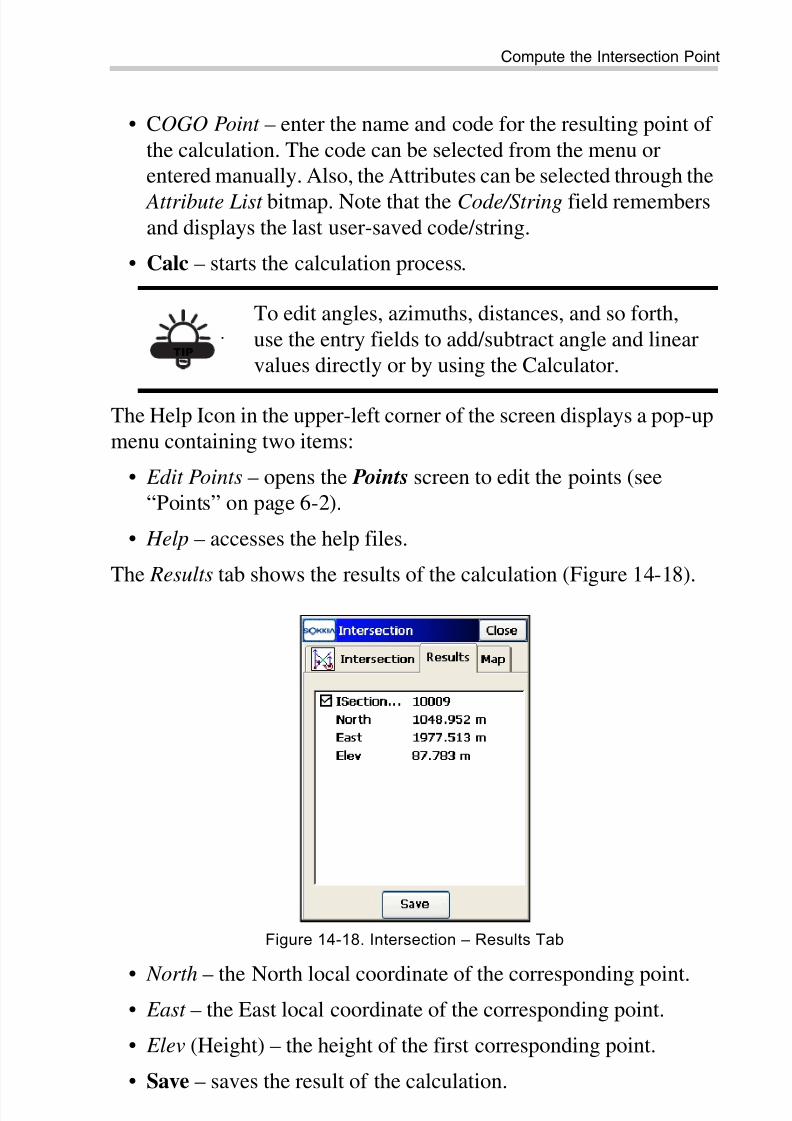
8/10/2019 7010-0944 - SokkiaSSF_rm.pdf
http://slidepdf.com/reader/full/7010-0944-sokkiassfrmpdf 513/623
Compute the Intersection Point
P/N 7010-0944 14-15
• COGO Point – enter the name and code for the resulting point of
the calculation. The code can be selected from the menu orentered manually. Also, the Attributes can be selected through the
Attribute List bitmap. Note that the Code/String field remembersand displays the last user-saved code/string.
• Calc – starts the calculation process.
The Help Icon in the upper-left corner of the screen displays a pop-upmenu containing two items:
• Edit Points – opens the Points screen to edit the points (see“Points” on page 6-2).
• Help – accesses the help files.
The Results tab shows the results of the calculation (Figure 14-18).
Figure 14-18. Intersection – Results Tab
• North – the North local coordinate of the corresponding point.• East – the East local coordinate of the corresponding point.
• Elev (Height) – the height of the first corresponding point.
• Save – saves the result of the calculation.
TIP
To edit angles, azimuths, distances, and so forth,
use the entry fields to add/subtract angle and linearvalues directly or by using the Calculator.

8/10/2019 7010-0944 - SokkiaSSF_rm.pdf
http://slidepdf.com/reader/full/7010-0944-sokkiassfrmpdf 514/623
COGO Calculations
Sokkia Spectrum Survey Field Reference Manual14-16
The Map tab (Figure 14-19) shows the solution of the task
graphically. In the example below, there are two solutions for the Intersection calculation.
Figure 14-19. Intersect ion – Map Tab
For a detailed description of the Map view, see “Viewing Map” on
page 15-1.
If Distances instead of Azimuths are specified between the known
points to the unknown points in the Intersection tab (see Figure 14-17on page 14-14), then there can be two points of intersection to save(Figure 14-20).
Figure 14-20. Two Points of Intersection

8/10/2019 7010-0944 - SokkiaSSF_rm.pdf
http://slidepdf.com/reader/full/7010-0944-sokkiassfrmpdf 515/623
Calculator
P/N 7010-0944 14-17
Calculator
A built-in calculator in Sokkia SSF performs calculations and
conversions. To access the calculator, tap the Calculator icon.The Calculator screen displays (Figure 14-21).
Figure 14-21. Calculator
• Input field – enter the entire equation here, then press the equals [=] button to calculate the result.
• Result field – shows calculation results. This field is also used asthe ‘y’ or ‘theta’ values for rectangular/polar conversions.
• Previous Result field – once equals is pressed, the previous result
is moved up to this field. This field is also used as the ‘x’ or ‘r’values for rectangular/polar conversions.
• MC – clears the memory.
• MR – recalls the memory value, indicated by M in the Input field.
• MS – saves the already computed result into memory.
TIP
To enter a calculated value to any entry field inSokkia SSF, start the calculator from this field bypressing the F1 button on the controller keyboard,
or by tapping the button on the pop-up
keyboard for controllers with soft input panels.

8/10/2019 7010-0944 - SokkiaSSF_rm.pdf
http://slidepdf.com/reader/full/7010-0944-sokkiassfrmpdf 516/623
COGO Calculations
Sokkia Spectrum Survey Field Reference Manual14-18
• M+ – adds the already computed result to the value in memory.
• C – clears all the fields.
• backspace (<-) – removes the last entry.
• copy – if the calculator was started from a field in Sokkia SSF,copies calculation results to that field; closes the calculator incase it was started from the COGO menu.
• sci – brings up the scientific calculator.
Figure 14-22. Scientifi c Calculator
Curve Solutions
A Curve is part of a circle and can thus be described through thecenter point (also called a Radius Point), the radius value and the
starting and ending points on the circle, also called a PC (Point ofCurvature) and PT (Point of Tangency). Using these values, theCurve Solutions finds other Curve parameters.
Tap the Curve icon to access the Curve menu for various curve
solutions: Curve, Three-Points Curve, PI & Tangents, and Radius &
Points.

8/10/2019 7010-0944 - SokkiaSSF_rm.pdf
http://slidepdf.com/reader/full/7010-0944-sokkiassfrmpdf 517/623
Curve Solutions
P/N 7010-0944 14-19
Figure 14-23. Curve Menu
Calculating the Parameters of a
Curve
To calculate the full set of parameters for any curve, given one foreach of the curvature parameter and the length parameter of the curve,tap the Curve icon. The Curve Solution screen displays
(Figure 14-24).
The Curve Solution tab (Figure 14-24) contains the initial data and awindow for the curve plan.
Figure 14-24. Curve Solution

8/10/2019 7010-0944 - SokkiaSSF_rm.pdf
http://slidepdf.com/reader/full/7010-0944-sokkiassfrmpdf 518/623
COGO Calculations
Sokkia Spectrum Survey Field Reference Manual14-20
• Radius/Deg Chord/Deg Curve – the curvature parameters of the
curve.
• Length/Chord/Tangent/Mid Ord – the length parameters of thecurve.
• Turn – the direction of turn relative to the starting point.
• Calc – press to calculate the parameters of the curve.
The Results tab shows the calculated parameters (Figure 14-25).
Figure 14-25. Curve Solution – Results Tab
The first three parameters display the radius and the length of the
curve and the length of the chord connecting the PC and PT points.
• Chord – PC-PT length. If the Chord is defined, then taking into
account, that
the Length can be calculated as Length = R x Delta
(note that delta is the angle subtended at the center).
The Degree Curve defines the angle in degrees, which is used tocompute the radius of a curve with a length of 100 units:
where R is Radius.
De lt a
2--------------sin
Chord
2---------------- R( ) ⁄ =
De gr eeC ur ve π×180
--------------------------------------------- 100
R---------=

8/10/2019 7010-0944 - SokkiaSSF_rm.pdf
http://slidepdf.com/reader/full/7010-0944-sokkiassfrmpdf 519/623
Curve Solutions
P/N 7010-0944 14-21
The Degree Chord defines the angle in degrees, which is used to
compute the radius of a curve whose chord is 100 units long. So
where R is Radius.
• Delta – internal angle from center to tangent points (PC-RP-PT).
• Tangent – the PI-PT length, where PI is the Point of Intersection.If the Tangent is defined, then taking into account, that:
where R is the Radius, the Length is Length = R x Delta.
Mid Ord – mid ordinate, the piece of PI-RP section from thecurve to the chord. If the Mid Ord is known, then assuming that:
where R is the Radius, the Length is Length = R x Delta.
• External – the piece of PI-RP section from PI to the curve. If theExternal is defined, then assuming that:
where R is the Radius, the Length is Length = R x Delta.
• Sector – the area of a circle bounded by two radii and the minorarc they determine.
• Segment – the area of a circle bounded by a chord and the minorarc that it cuts off.
• Fillet – the area between the arc of a circle and the two tangents atthe end points of the arc.
The Map tab (Figure 14-26 on page 14-22) shows graphically theresults of the calculation.
De gr eeCh or d π×180
---------------------------------------------- 2
⁄ sin
100
2 R×------------
⎝ ⎠⎛ ⎞
R ⁄ =
De lt a
2
--------------tan Tangent
R
---------------------=
De lta
2--------------cos
R Mid Ord –
R------------------------------=
De lta
2--------------cos
R E xt er na l+
R---------------------------------=

8/10/2019 7010-0944 - SokkiaSSF_rm.pdf
http://slidepdf.com/reader/full/7010-0944-sokkiassfrmpdf 520/623
COGO Calculations
Sokkia Spectrum Survey Field Reference Manual14-22
Figure 14-26. Curve Solution – Map Tab
Three-Points Curve
To define the curve using three points: PC point, any curve point, and
PT point or the RP, PC, and PT points, tap the Three Pt Curve icon.The Three Pt Curve screen displays (Figure 14-27). The screendisplay changes, depending upon the first point selected.
The Three Points Curve tab displays the initial data.
Figure 14-27. Three Pt Curve
Either enter manually or select from the list or from the map, thefollowing sets of points.

8/10/2019 7010-0944 - SokkiaSSF_rm.pdf
http://slidepdf.com/reader/full/7010-0944-sokkiassfrmpdf 521/623
Curve Solutions
P/N 7010-0944 14-23
• RP Point, PC Point, PT Point – for these set of points, the distance
between the RP Point and the PC point should be an equaldistance between the RP Point and the PT point. The radius and
the PC and PT points define two curves, one with delta, less thanor equal to 180 degrees (Small curve), and the other with deltagreater than or equal to 180 degrees (Large curve). Select either
Small value or Large value from the Curve drop-down list toindicate which of these two curves should be used forcomputations.
• PC Point, Curve Point, PT Point – for these set of points, the
coordinates for the RP Point are calculated, along with curveparameters. The name and the code for this calculated point canbe set.
• Calc – press to calculate the curve parameters.
The Help Icon in the upper-left corner of the screen displays a pop-upmenu containing two items:
• Edit Points – opens the Points screen to edit the points (see“Points” on page 6-2).
• Help – accesses the Help files.
The Results tab (Figure 14-28) displays the results of the calculation.
Figure 14-28. Three Pt Curve – Resul ts Tab

8/10/2019 7010-0944 - SokkiaSSF_rm.pdf
http://slidepdf.com/reader/full/7010-0944-sokkiassfrmpdf 522/623
COGO Calculations
Sokkia Spectrum Survey Field Reference Manual14-24
For a description of curve parameters, see “Calculating the
Parameters of a Curve” on page 14-19.
• Save – press to store the point being found.The Map tab (Figure 14-29) displays the results of the calculationgraphically.
Figure 14-29. Three Pt Curve – Map Tab
PI & Tangents
To compute the the PC point, the PT point and the center (RadiusPoint) of a Curve, given the Point of Intersection (PI), the radius, andthe azimuths from the PI point to the PC, and PT points respectively,
tap the PI & Tangents icon. The PI & Tangents screen displays(Figure 14-30 on page 14-25).
The PI & Tangents tab contains the initial data.

8/10/2019 7010-0944 - SokkiaSSF_rm.pdf
http://slidepdf.com/reader/full/7010-0944-sokkiassfrmpdf 523/623
Curve Solutions
P/N 7010-0944 14-25
Figure 14-30. PI & Tangents
• PI Point – the Point of Intersection. Can be manually entered, or
chosen from the map or from the list.
• Az PI to PC – the azimuth from the PI point to the starting curve
point.
• Az PI to PT – the azimuth from the PI point to the ending curvepoint.
• Radius/ Deg Curve/Deg Chord/Tangent – the radius parameters
of the curve.
• PC Point – the name and the code for the calculated starting curve
point.• PT Point – the name and the code for the calculated ending curve
point.
• RP Point – the name and the code for the calculated radius point.
• Calc – calculates the parameters of the curve and the coordinates
of the PC, PT, and RP points.
The Results tab (Figure 14-31 on page 14-26) shows the results of thecalculation.

8/10/2019 7010-0944 - SokkiaSSF_rm.pdf
http://slidepdf.com/reader/full/7010-0944-sokkiassfrmpdf 524/623
COGO Calculations
Sokkia Spectrum Survey Field Reference Manual14-26
Figure 14-31. PI & Tangents – Results Tab
Put a check mark next to the points you want to save, then press theSave button.
The Map tab shows graphically the results of the calculation.
Figure 14-32. PI & Tangents – Map Tab
The Help Icon in the upper-left corner of the screen displays a pop-upmenu containing two options: Edit Points (see “Points” on page 6-2)
and Help to access the help files.

8/10/2019 7010-0944 - SokkiaSSF_rm.pdf
http://slidepdf.com/reader/full/7010-0944-sokkiassfrmpdf 525/623
Curve Solutions
P/N 7010-0944 14-27
Radius & Points
To define a curve using the PC and PT points, and a radius parameter,
tap the Radius & Points icon. The Radius & Points screen displays(Figure 14-33).
The Radius & Point tab contains the initial data for the task.
Figure 14-33. Radius & Points
• PC Point – the Point of Curvature: either enter manually or selectfrom the map or from the list of points.
• PT Point – the Point of Tangency: either enter manually or selectfrom the map or from the list of points.
• Radius/Deg Curve/Deg Chord – the radius parameters of thecurve.
• Turn – the direction of turn, relative to the PC Point.
• Curve – defines the curve in the circle that should be considered.The radius and the PC and PT points define two curves, one withdelta less than or equal to 180 degrees (Small curve), and theother with delta greater than or equal to 180 degrees (Large
curve).• RP Point – the point to be defined. Enter the name and select the
code, if necessary.
• Calc – press to calculate the curve parameters.

8/10/2019 7010-0944 - SokkiaSSF_rm.pdf
http://slidepdf.com/reader/full/7010-0944-sokkiassfrmpdf 526/623
COGO Calculations
Sokkia Spectrum Survey Field Reference Manual14-28
The Help Icon in the upper-left corner of the screen displays a pop-up
menu containing two options: Edit Points (see “Points” on page 6-2)and Help to access the help files.
The Results tab (Figure 14-34) displays the results of the calculation.
Figure 14-34. Radius & Points – Results Tab
For a description of curve parameters, see “Calculating theParameters of a Curve” on page 14-19.
• Save – press to store the point being found.
The Map tab (Figure 14-35) displays the results of the calculationgraphically.
Figure 14-35. Radius & Points – Map Tab

8/10/2019 7010-0944 - SokkiaSSF_rm.pdf
http://slidepdf.com/reader/full/7010-0944-sokkiassfrmpdf 527/623
Area
P/N 7010-0944 14-29
Area
Tap the Area icon to access the Area menu to calculate the area of a
polygon formed by any points or the coordinates of a point/points thatforms a polygon of the desired area
Figure 14-36. Area Menu
By Points
To calculate the area of a polygon formed by any points, tap the By
Points icon. The Comp Area screen displays (Figure 14-37).
Figure 14-37. Area by Points

8/10/2019 7010-0944 - SokkiaSSF_rm.pdf
http://slidepdf.com/reader/full/7010-0944-sokkiassfrmpdf 528/623
COGO Calculations
Sokkia Spectrum Survey Field Reference Manual14-30
The Area tab contains the list of points, vertices of the polygon, and
the plot of the polygon.
• Point List – the Point List name, either enter manually or selectfrom the Point Lists drop-down box.
• List of Points – the list of currently selected vertices for thepolygon.
• Up and down arrows move the highlighted point up and down in
the order of the points.
• – switches the keyboard arrow keys on/off (duplicates the
operation of the arrows on the screen).
• – closes the plot of the polygon. Only the list of points is
available.
• Calc – calculates the area of the polygon and displays it on the Results tab.
The Results tab (Figure 14-38) shows the results of the calculation.
Figure 14-38. Area – Results Tab
NOTICE For the correct operation of the application, thesides of the polygon should not cross each other.

8/10/2019 7010-0944 - SokkiaSSF_rm.pdf
http://slidepdf.com/reader/full/7010-0944-sokkiassfrmpdf 529/623
Area
P/N 7010-0944 14-31
The Map tab (Figure 14-39) shows a view of the polygon.
Figure 14-39. Area – Map Tab
The Help Icon in the upper-left corner of the screen displays a pop-upmenu containing two options: Edit Points (see “Points” on page 6-2)and Help to access the help files.
The Hinge Method
The Hinge method generates a polygon of the desired area by rotatinga ray from a fixed rotation point. This method calculates thecoordinates of a point of intersection of the ray with the boundaryformed by selected points in a list.
To start the Hinge task, select the Hinge icon. The Known Area -
Hinge screen displays (Figure 14-40 on page 14-32).
NOTICE
For the correct operation of the application, thesides of the polygon should not cross each other,that is, the polygon should be simple and convex.

8/10/2019 7010-0944 - SokkiaSSF_rm.pdf
http://slidepdf.com/reader/full/7010-0944-sokkiassfrmpdf 530/623
COGO Calculations
Sokkia Spectrum Survey Field Reference Manual14-32
Figure 14-40. Hinge – Area Tab 1
The Area tab contains the initial data of the Hinge task.
• Point List – the Point List name: either enter manually or from the
Point List drop-down box.
• – closes the plot of the polygon. Only the list of points is
available.
• List of Points – the list of currently selected vertices of the
polygon.
• Up and down arrows move the highlighted point up and down to
change the order of the points.
• – switches the keyboard arrow keys on/off (duplicates the
arrows on the screen).
• Next – opens the second screen of the Area tab (Figure 14-41 on
page 14-33).

8/10/2019 7010-0944 - SokkiaSSF_rm.pdf
http://slidepdf.com/reader/full/7010-0944-sokkiassfrmpdf 531/623
Area
P/N 7010-0944 14-33
Figure 14-41. Known Area Hinge – Area Tab 2
• Total (Area) – the calculated area of a polygon formed with thecurrently selected points of the point list.
• Reqd. Area – the requested known area.
• Sq.m (Job Units) /Acres: press to set the area units.
• Rotation (Pt) – the point in the list that fixed for rotation of a rayto the new point to form a polygon of the requested area.
• Direction – the direction of rotation.
• COGO Point – the name of the new point calculated.
• Code – select the code from the drop-down list, or press the
attributes list icon to open the list of available attributes.
• Back – returns to the previous screen.
• Calc – calculates the coordinates of the new point and displays iton the Results tab.
The Help Icon in the upper-left corner of the screen displays a pop-up
menu containing two items: Edit Point Lists (see “Edit Point List” on
page 6-34) and Help to access the help files.The Results tab (Figure 14-42 on page 14-34) shows the results of the
calculation.

8/10/2019 7010-0944 - SokkiaSSF_rm.pdf
http://slidepdf.com/reader/full/7010-0944-sokkiassfrmpdf 532/623
COGO Calculations
Sokkia Spectrum Survey Field Reference Manual14-34
Figure 14-42. Hinge – Resul ts Tab
The Map tab (Figure 14-43) shows the view of the polygon.
Figure 14-43. Hinge – Map Tab
The Line Method
The Line method computes the coordinates of two points that, along
with two other known points, form a quadrilateral of the known area.
To start the Line task, select the Line icon. The Known Area - Line screen (Figure 14-44 on page 14-35) displays.

8/10/2019 7010-0944 - SokkiaSSF_rm.pdf
http://slidepdf.com/reader/full/7010-0944-sokkiassfrmpdf 533/623
Area
P/N 7010-0944 14-35
The Area tab (Figure 14-44) contains the initial data of the Line task.
Figure 14-44. Line – Area Tab 1
For details on description of this screen, see “The Hinge Method” on
page 14-31.
• Next – opens the second screen of the Area tab (Figure 14-45).
Figure 14-45. Line – Area Tab 2
• Total Area – the calculated area of a polygon formed with thecurrently selected points of the point list.
• Reqd. Area – the requested known area.
• Pt1 of Edge, Pt 2 of Edge – the known points of the quadrilateral.

8/10/2019 7010-0944 - SokkiaSSF_rm.pdf
http://slidepdf.com/reader/full/7010-0944-sokkiassfrmpdf 534/623
COGO Calculations
Sokkia Spectrum Survey Field Reference Manual14-36
• COGO Pt 1, COGO Pt 2 – the calculated points on the lines
emanating from the Pt1 of Edge and Pt 2 of Edge, respectively.
• Area – the known area.• Sq.m (Job Units) /Acres – press to set the area units.
• – press to enter a code, select a code from the drop-down list,
or press the icon to open the list of available attributes.
• Calc – calculates the coordinates of the line points and displays iton the Results tab.
The Help Icon in the upper-left corner of the screen displays a pop-upmenu containing two items: Edit Points (see “Points” on page 6-2)and Help to access the help files.
The Results tab (Figure 14-46) shows the results of the calculation.
Figure 14-46. Line – Resul ts Tab
The Map tab (Figure 14-47 on page 14-37) shows the view of thequadrilateral.
NOTICE
For the correct operation of the application, thesides of the polygon should not cross each other,that is, the polygon should be simple and convex.

8/10/2019 7010-0944 - SokkiaSSF_rm.pdf
http://slidepdf.com/reader/full/7010-0944-sokkiassfrmpdf 535/623
Corner Angle
P/N 7010-0944 14-37
Figure 14-47. Line – Map Tab
Corner Angle
To calculate a corner angle, tap the Corner Angle icon (Figure 14-48). The Corner Angle screen displays.
Figure 14-48. Corner Angle
The Angle tab contains initial data for the angle creation andcalculates the angle:
• Start Point – the point that defines the first side of the angle;either enter manually or select from the map or from the list.

8/10/2019 7010-0944 - SokkiaSSF_rm.pdf
http://slidepdf.com/reader/full/7010-0944-sokkiassfrmpdf 536/623
COGO Calculations
Sokkia Spectrum Survey Field Reference Manual14-38
• Mid Point – the point that defines the corner of the angle; either
enter manually or select from the map or from the list.
• End (Point) – the point that defines the second side of the angle;either enter manually or select from the map or from the list.
• Calc – calculates the corner angle.
The Help Icon in the upper-left corner of the screen displays a pop-upmenu containing three items:
• Edit Points – opens the Points screen (see “Points” on page 6-2).
• Calculator – accesses the calculator (see “Calculator” on
page 14-17).
• Help – accesses the Help files.
The Results tab shows the results of the calculation: calculation of
various angles, distances, and azimuths to the start and end points.
Figure 14-49. Corner Angle – Results Tab
The Map tab (Figure 14-50 on page 14-39) shows the view of theangle.

8/10/2019 7010-0944 - SokkiaSSF_rm.pdf
http://slidepdf.com/reader/full/7010-0944-sokkiassfrmpdf 537/623
Line Offset
P/N 7010-0944 14-39
Figure 14-50. Corner Angle – Map Tab
Line Offset
To calculate the coordinates of points along a line, tap the LineOffset icon (Figure 14-51). The Line & Offsets screen displays.
Figure 14-51. Line & Offset
• Start Point – the starting point of the line. The line is defined by
the End point of the line or the azimuth to another point: eitherenter manually or select from the map or from the list.

8/10/2019 7010-0944 - SokkiaSSF_rm.pdf
http://slidepdf.com/reader/full/7010-0944-sokkiassfrmpdf 538/623
COGO Calculations
Sokkia Spectrum Survey Field Reference Manual14-40
• End Point/Azimuth – the ending point of the line / the azimuth
to another point: either enter manually or select from the map orfrom the list.
• Ht Comp – select the type of height computations for thecalculated points from one of the following:
– Interpolate Ht : the height of the calculated point will becomputed through linear interpolation using the height of the
starting and ending points of the line.
– Ht of Start Pt (height of starting point): the calculated point
will have the same height as the starting point of the line.• Num Subs – check and enable to designate the number of
subdivisions you want to subdivide the line. For instance, a value
of 3 indicates a calculation of four points by subdividing the lineinto three equal segments.
• SS (Start Sta) – enter the starting station (chainage) of the line.
• Next – opens the Station (Chainage) & Offsets screen.
Station & Offset
The Sta&Ofst screen (Figure 14-52) contains the settings for thecalculated stations with offsets from the line.
Figure 14-52. Station & Offsets
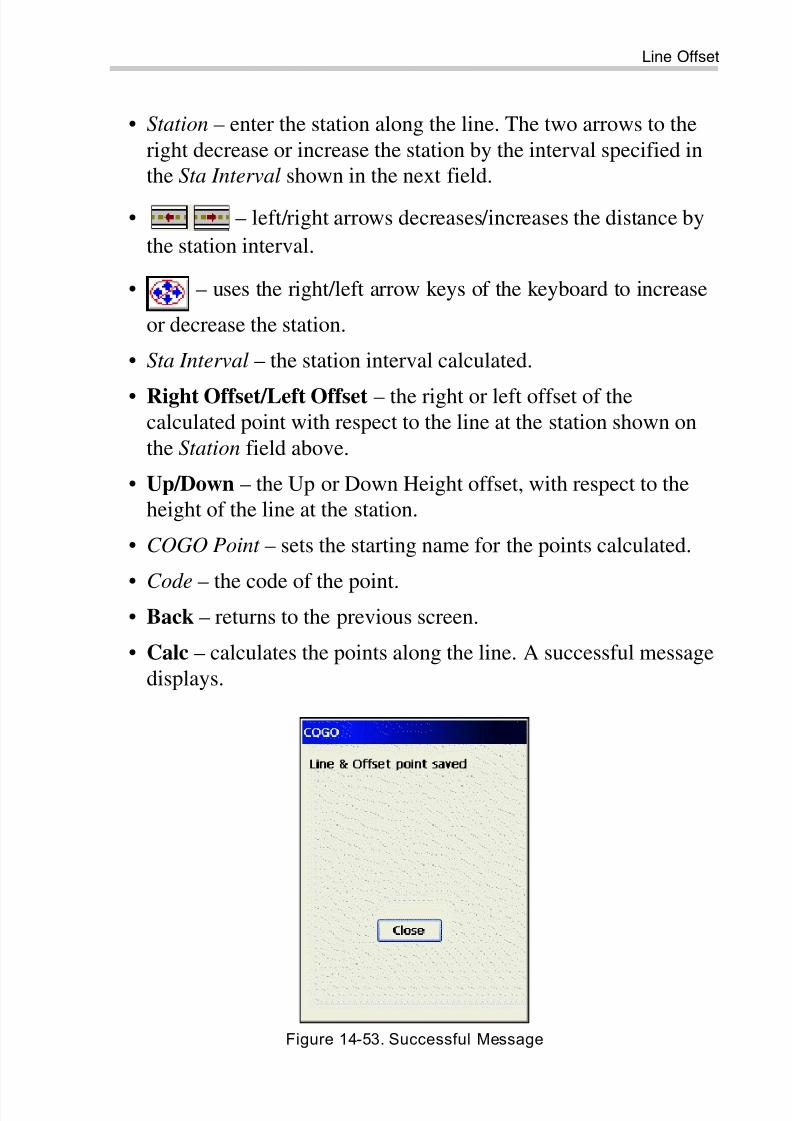
8/10/2019 7010-0944 - SokkiaSSF_rm.pdf
http://slidepdf.com/reader/full/7010-0944-sokkiassfrmpdf 539/623
Line Offset
P/N 7010-0944 14-41
• Station – enter the station along the line. The two arrows to the
right decrease or increase the station by the interval specified inthe Sta Interval shown in the next field.
• – left/right arrows decreases/increases the distance by
the station interval.
• – uses the right/left arrow keys of the keyboard to increase
or decrease the station.
• Sta Interval – the station interval calculated.
• Right Offset/Left Offset – the right or left offset of thecalculated point with respect to the line at the station shown on
the Station field above.
• Up/Down – the Up or Down Height offset, with respect to theheight of the line at the station.
• COGO Point – sets the starting name for the points calculated.
• Code – the code of the point.• Back – returns to the previous screen.
• Calc – calculates the points along the line. A successful messagedisplays.
Figure 14-53. Successful Message

8/10/2019 7010-0944 - SokkiaSSF_rm.pdf
http://slidepdf.com/reader/full/7010-0944-sokkiassfrmpdf 540/623
COGO Calculations
Sokkia Spectrum Survey Field Reference Manual14-42
Curve Offset
To calculate the coordinates of points along a curve, tap the Curve
Offset icon. The Curv & Offset screen (Figure 14-54) displays.
Figure 14-54. Curve & Offset
• PC Point – the Point of Curve, the starting point of the arc; eitherenter manually or select from the map or from the list of points.
• PT Point – the Point of Tangency; either enter manually or selectfrom the map or from the list of points.
• Radius/Deg Curve/Deg Chord – the radius parameters of thecurve.
• Num Subs – check and enable to designate the number ofsubdivisions you want to subdivide the curve. For instance, avalue of 3 indicates a calculation of four points by subdividingthe curve into three equal segments.
• Turn – the direction of turn, relative to the PC Point.
• SS – the starting station (chainage) of the curve.
• Next – opens the Station (Chainage) & Offsets screen.
• Close – saves the changes and closes the screen.
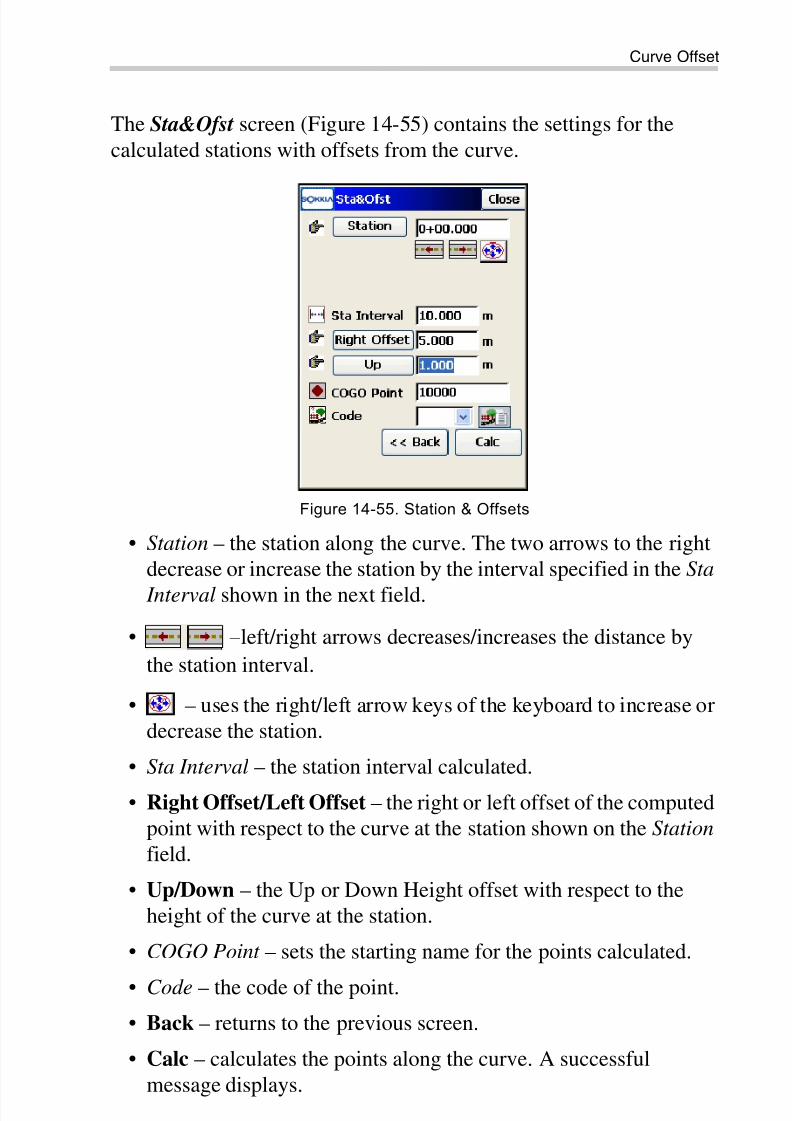
8/10/2019 7010-0944 - SokkiaSSF_rm.pdf
http://slidepdf.com/reader/full/7010-0944-sokkiassfrmpdf 541/623
Curve Offset
P/N 7010-0944 14-43
The Sta&Ofst screen (Figure 14-55) contains the settings for the
calculated stations with offsets from the curve.
Figure 14-55. Station & Offsets
• Station – the station along the curve. The two arrows to the rightdecrease or increase the station by the interval specified in the Sta
Interval shown in the next field.
• –left/right arrows decreases/increases the distance by
the station interval.
• – uses the right/left arrow keys of the keyboard to increase ordecrease the station.
• Sta Interval – the station interval calculated.
• Right Offset/Left Offset – the right or left offset of the computedpoint with respect to the curve at the station shown on the Station field.
• Up/Down – the Up or Down Height offset with respect to theheight of the curve at the station.
• COGO Point – sets the starting name for the points calculated.
• Code – the code of the point.
• Back – returns to the previous screen.
• Calc – calculates the points along the curve. A successful
message displays.

8/10/2019 7010-0944 - SokkiaSSF_rm.pdf
http://slidepdf.com/reader/full/7010-0944-sokkiassfrmpdf 542/623
COGO Calculations
Sokkia Spectrum Survey Field Reference Manual14-44
Calculating a Road Offset
To calculate the coordinates of points along a road, tap the Road
Offset icon (Figure 14-56). The Road Offset screen displays.
The Road Offset screen selects the road to calculate the offset pointsand displays the plan of the chosen road.
Figure 14-56. Road Offset
• Road / H Alnt / HV Alnt – the road/horizontal/horizontal andvertical alignments to calculate the offset points: either enter
manually or select from the map or from the list of points.
• SS (Start Stn) – the starting point of the calculated points, the
distance from the beginning of the road.• Next – opens the Station (Chainage) & Offsets screen
(Figure 14-57 on page 14-45).
The Sta&Ofst screen contains the settings for the calculated stationswith offsets from the road.

8/10/2019 7010-0944 - SokkiaSSF_rm.pdf
http://slidepdf.com/reader/full/7010-0944-sokkiassfrmpdf 543/623
Calculating a Road Offset
P/N 7010-0944 14-45
Figure 14-57. Station & Offsets
• Station – the station along the road. The two arrows to the right
decrease or increase the station by the interval specified in the Sta
Interval shown in the next field.
• – left/right arrows decreases/increases the distance bythe station interval.
• – uses the right/left arrow keys of the keyboard to increase or
decrease the station.
• Sta Interval – the station interval.
• Right Offset/Left Offset – the right or left offset of the stakeout
point with respect to the road at the station shown on the Station field.
• Up/Down – the Up or Down Height offset with respect to theheight of the road at the station.
• COGO Point – sets the starting name for the points calculated.
• Code – the code of the point.
• Back – returns to the previous screen.
• Calc – calculates the points along the road. A successful messagedisplays.

8/10/2019 7010-0944 - SokkiaSSF_rm.pdf
http://slidepdf.com/reader/full/7010-0944-sokkiassfrmpdf 544/623
COGO Calculations
Sokkia Spectrum Survey Field Reference Manual14-46
Adjusting Points
To transform points or perform traverse adjustment, tap the Adjust
icon (Figure 14-58). The Adjust menu opens to access the Rotate,Translate, Scale, 2D Transform, and Traverse options.
Figure 14-58. Adjust Menu
Rotate
To rotate points, tap the Rotate icon. The Rotate screen displays(Figure 14-59 on page 14-47).
To rotate the selected points around a specific point, select a rotationmethod: either Rotation Angle or Azimuth.
• Select points – select the point/points to be rotated by one of thefollowing methods:
– By Range: press to display the By Range screen. For a
description of the By Range screen, see “Select Points byRange” on page 14-47.
– Select points for rotation from the map or the list using the
icons to the right.– Tap the Layer icon to rotate all points on a layer selected in
the Layers screen.

8/10/2019 7010-0944 - SokkiaSSF_rm.pdf
http://slidepdf.com/reader/full/7010-0944-sokkiassfrmpdf 545/623
Adjusting Points
P/N 7010-0944 14-47
• Rotation Point – sets the center of rotation: either enter manually
or select from the map or the list.
• Rotation Method – select either Rot. Angle (if the rotation angle isinput directly) or Azimuth (as a difference between the new andold azimuths/bearings).
• Rotation Angle – enter the value of the rotation right angle.
• Old Azimuth – enter the value of the old azimuth.
• New Azimuth – enter the value of the new azimuth.
Figure 14-59. Rotate
• Calc – press to rotate the selected points. A successful messagedisplays.
The Help Icon in the upper-left corner of the screen displays a pop-up
menu containing two items:
• Edit Points – opens the Points screen (see “Points” on page 6-2).
• Help – accesses the Help files.
Select Points by Range
In the Range of Points field on the By Range screen (Figure 14-60 onpage 14-48), the range can be set by enumeration of the pointsseparated by commas, or by specifying the first and the lastpointincluded in the range. Press the OK button to save the specified

8/10/2019 7010-0944 - SokkiaSSF_rm.pdf
http://slidepdf.com/reader/full/7010-0944-sokkiassfrmpdf 546/623
COGO Calculations
Sokkia Spectrum Survey Field Reference Manual14-48
range. The number of points selected display on the corresponding
task screen in the Select Points field.
Figure 14-60. Select Points by Range
Translate
To translate a set of points, tap the Translate icon. The Translatescreen (Figure 14-61 on page 14-49) displays.
To move a group of points selected on the Translate screen, select a
translation method: select either Coords/Pts or Az/Brg, Dist, Ht .

8/10/2019 7010-0944 - SokkiaSSF_rm.pdf
http://slidepdf.com/reader/full/7010-0944-sokkiassfrmpdf 547/623
Adjusting Points
P/N 7010-0944 14-49
Figure 14-61. Translate
• Select points – select the points for translation from one of the
following methods:
– By Range: press to display the By Range screen. For adescription of the By Range screen, see “Select Points by
Range” on page 14-47.
– Select points for rotation from the map or the list using theicons to the right.
– Tap the Layer icon to rotate all points on a layer selected inthe Layers screen.
• Translate By – select either Coords/Pts or Az/Brg, Dist, Ht as thetranslating method.
– Coords/Pts: all the selected points are moved in the samedirection and distance as between the points (locations), setby the next two fields: From Pt (From Crd) and To Pt (To
Crd).In the first case, define only the point name; in the second
case, define the local coordinates and the height of thelocation.
– Az/Brg, Dist, Ht : all the selected points are moved in thespecified direction by a specified distance. These parameters

8/10/2019 7010-0944 - SokkiaSSF_rm.pdf
http://slidepdf.com/reader/full/7010-0944-sokkiassfrmpdf 548/623
COGO Calculations
Sokkia Spectrum Survey Field Reference Manual14-50
are set through the Azimuth(Bearing) field, Hz Dist and Vert
Dist fields.
• Calc – press to translate the selected points. A successfulmessage displays.
Scale
To scale a set of points, tap the Scale icon. The Scale screen displays.To scale the distance of a range of points relative to a Base Point on
the Scale screen, set the following parameters.
Figure 14-62. Scale
• Select points – select the points to scale using one of thefollowing methods:
– By Range: press to display the By Range screen. For a
description of the By Range screen, see “Select Points by
Range” on page 14-47.– Select points for rotation from the map or the list using the
icons to the right.
NOTICE The limit for translation of points is 20,000 meters.

8/10/2019 7010-0944 - SokkiaSSF_rm.pdf
http://slidepdf.com/reader/full/7010-0944-sokkiassfrmpdf 549/623
Adjusting Points
P/N 7010-0944 14-51
– Tap the Layer icon to rotate all points on a layer selected in
the Layers screen.
• Base Point – sets the reference point for the scale transformation:either enter manually or select from the map or from the list.
• Scale Factor – the scale factor for the coordinate transformation.
• Scale Heights – check mark and enable this box if the heightvalues should be scaled also.
• Calc – press to scale the selected points. A successful message
displays.
2D Transform
To perform a linear two dimensional transformation of a set of points,tap the 2D Transform icon. The 2D Transform screen(Figure 14-63) displays.
The 2D Transform screen contains a list of point pairs used for
getting the transformation parameters. Initially this screen is empty.
Figure 14-63. 2D Transform
• Add – press to enter pairs of points or coordinates in the Point Pair Info screen (Figure 14-65 on page 14-53).
• Edit – press to change the information about the point pair
highlighted.

8/10/2019 7010-0944 - SokkiaSSF_rm.pdf
http://slidepdf.com/reader/full/7010-0944-sokkiassfrmpdf 550/623
COGO Calculations
Sokkia Spectrum Survey Field Reference Manual14-52
• Delete – press to erase the point pair selected.
• Close – closes the screen.
• Next – opens another 2D Transform screen with thetransformation parameters calculated (Figure 14-64).
The second 2D Transform screen displays the transformationparameters which will be applied to the set of points needingtransformation.
Figure 14-64. 2D Transformation Parameters
• Select points – select the points to convert using one of thefollowing methods:
– From.. To: press to display the By Range screen. For a
description of the By Range screen, see “Select Points byRange” on page 14-47.
– Select points for transform from the map or the list using theicons to the right.
– Tap the Layer icon to transform all points on a layer selectedin the Layers screen.
Once the set of desired points is specified, the number of pointsselected will display on the 2D Transform screen.
• Back – returns to the previous screen.

8/10/2019 7010-0944 - SokkiaSSF_rm.pdf
http://slidepdf.com/reader/full/7010-0944-sokkiassfrmpdf 551/623
Adjusting Points
P/N 7010-0944 14-53
• Calc – performs the two dimensional transform and displays a
successful message.
• Close – returns to the 2D Transform screen.
Point Pair Info
The Point Pair Info screen (Figure 14-65) selects the pairs of points
or coordinates to obtain transformation parameters.
Figure 14-65. Point Pair Information
• From Pt/From Crd – changes the field to enter either the pointor coordinates from which the parameters will be calculated.
• To Pt/To Crd – changes the field to enter either the point or
coordinates to which the parameters will be calculated.• OK – returns to the 2D Transform screen with the pair added.
• Cancel – returns to the 2D Transform screen without changesmade.
Traverse Adjustment
Traverse adjustment is performed to provide a mathematically closedfigure and at the same time, to get the best estimates for positions of
all the traverse stations.

8/10/2019 7010-0944 - SokkiaSSF_rm.pdf
http://slidepdf.com/reader/full/7010-0944-sokkiassfrmpdf 552/623
COGO Calculations
Sokkia Spectrum Survey Field Reference Manual14-54
To perform an adjustment of a surveyed traverse, tap the Traverse
icon. The Adjustment screen displays (Figure 14-66).
Adjustment Parameters
The first Adjustment screen contains general settings for adjustment:
• Start Point – the station on which the traverse originates; either
enter manually or select from the map or from the list of points.
• End Point – the station on which the traverse closes; either entermanually or select from the map or from the list of points.
• Adjust Elevations – check mark and enable this box to includeadjusting elevations if elevations were determined in the traverse.
• Adjust Sideshots – check mark and enable this box to include
adjusting side shots.
• Curvature refraction – if needed select an Earth curvaturerefraction value from 0.14 and 0.2
• Job to store the results – the New button opens the New Job screen to create a new job to store the adjusted traverse stations.
• Next – opens the next Adjustment screen to perform adjustment.
Figure 14-66. Adjustment Settings

8/10/2019 7010-0944 - SokkiaSSF_rm.pdf
http://slidepdf.com/reader/full/7010-0944-sokkiassfrmpdf 553/623
Adjusting Points
P/N 7010-0944 14-55
Adjustment
The next Adjustment screen (Figure 14-67) selects the method of
traverse adjustment to use and a technique to close the traverse if it isunclosed.
Figure 14-67. Adjustment
• Apply Compass Rule – check mark and enable this box to adjustthe traverse by the compass rule.
• Apply Angle Balance – check mark and enable this box to adjustthe traverse by the angle balance.
• Closing Angle – shows the closing angle for the traverseadjustment.
• Adjust – press to adjust the traverse. The Adjustment Results screen opens to display results. The traverse points adjusted willbe saved in the new job as calculated points.

8/10/2019 7010-0944 - SokkiaSSF_rm.pdf
http://slidepdf.com/reader/full/7010-0944-sokkiassfrmpdf 554/623
COGO Calculations
Sokkia Spectrum Survey Field Reference Manual14-56
Traverse
This function is used to calculate Traverse and Sideshot points, based
on horizontal and vertical offsets along a direction, which is definedby an azimuth, or right, left, or deflection angles.
To start a Traverse task, tap the Traverse icon (Figure 14-68). TheTraverse Calc screen displays.
The Traverse Calc (Figure 14-68) tab displays the initial data for thetraverse task.
Figure 14-68. Traverse Calc
• From Point – indicates the occupation (the traverse point): either
enter manually or select from the map or list.• Azimuth/Angle Right/Angle Left/Deflection – determines the
azimuth from the known point to the calculated point (To Point).
The azimuth can be entered as is, or can be computed from theright or left angles, or deflection entered in this field and
Backsight information.
– Azimuth: sets the azimuth by value.
– Angle Right: angle to the right is the angle at the knownpoint from the backsight point to the calculated point in aclockwise direction.

8/10/2019 7010-0944 - SokkiaSSF_rm.pdf
http://slidepdf.com/reader/full/7010-0944-sokkiassfrmpdf 555/623
Traverse
P/N 7010-0944 14-57
– Angle Left: angle to the left is the angle at the known point
from the backsight point to the calculated point in an counterclockwise direction.
– Deflection: the angle at the known point between theprolongation of the line from the backsight point and the line
to the calculated point
• Hz Dist – the Horizontal Distance along the azimuth line.
• Vert Dist – the Vertical Distance along the azimuth line.
• To Point – the name of the calculated point. The photo note
icon opens the Add Photo Notes screen to enter a photo note forthe point.
• Code – the code associated with the calculated point.
• BS Point – displays the BS Point screen for entering theBacksight Point or Backsight Azimuth (Figure 14-70 onpage 14-58). If a BS point has not been entered, an Azimuth is
required. In this case, if an angle value is entered as Angle Right,
Angle Left , or Deflection, this value is considered to be azimuth.• SideShot – if pressed, the coordinates of the To Point are
calculated based on the entered values for Azimuth/Angle Right/
Angle Left/Deflection, Horizontal and Vertical distances. The
From Point parameter does not change and the To Point parameteris incremented to the next new Point in the database.
• Traverse: if pressed, the coordinates of the To Point are
calculated based on the entered values for (Azimuth/Angle Right/ Angle Left/Deflection), Horizontal and Vertical distances. TheFrom Point changes to the To Point , and the To Point changes tothe next new name in the database.
The Help Icon in the upper-left corner of the screen displays a pop-up
menu containing two items:
• Edit Points – opens the Points screen to edit the points (see
“Points” on page 6-2).• Help accesses the Help files.

8/10/2019 7010-0944 - SokkiaSSF_rm.pdf
http://slidepdf.com/reader/full/7010-0944-sokkiassfrmpdf 556/623
COGO Calculations
Sokkia Spectrum Survey Field Reference Manual14-58
The Results tab (Figure 14-69) shows the initial data and results of the
calculation. The Map tab shows the results graphically.
Figure 14-69. Traverse Calc – Resul ts Tab
BS Point
The BS Point screen (Figure 14-70) enters the parameters for the Backsight Point or Backsight Azimuth. Tap the BS Point/BS Azimuth
button to determine which parameters will display.
Figure 14-70. BS Point
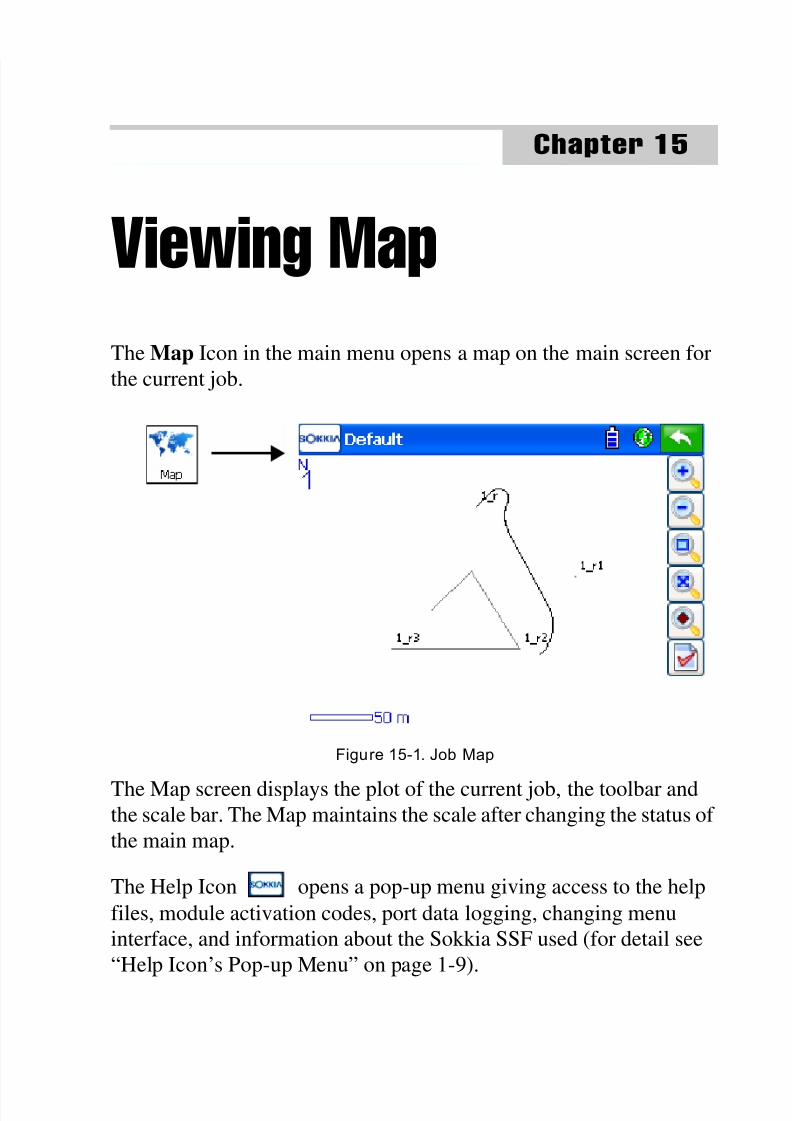
8/10/2019 7010-0944 - SokkiaSSF_rm.pdf
http://slidepdf.com/reader/full/7010-0944-sokkiassfrmpdf 557/623
P/N 7010-0944
Chapter 15
15-1
Viewing MapThe Map Icon in the main menu opens a map on the main screen forthe current job.
Figure 15-1. Job Map
The Map screen displays the plot of the current job, the toolbar andthe scale bar. The Map maintains the scale after changing the status of
the main map.
The Help Icon opens a pop-up menu giving access to the help
files, module activation codes, port data logging, changing menuinterface, and information about the Sokkia SSF used (for detail see“Help Icon’s Pop-up Menu” on page 1-9).

8/10/2019 7010-0944 - SokkiaSSF_rm.pdf
http://slidepdf.com/reader/full/7010-0944-sokkiassfrmpdf 558/623
Viewing Map
Sokkia Spectrum Survey Field Reference Manual15-2
Toolbar
The Toolbar of the Map screen contains icons of the viewing options.
Figure 15-2. Toolbar Viewing Options
Table 15-1 describes the toolbar icons.
Table 15-1. View Menu Toolbar Options
Toolbar Icon Icon Description
Zooms the plot inwards
Zooms the plot outwards
Selects a frame of objects for zoom-in display; draw from left to
right to get the object you want.
Displays all points in the job
Opens the Points screen to select a point to center the plot
Opens the Properties screen

8/10/2019 7010-0944 - SokkiaSSF_rm.pdf
http://slidepdf.com/reader/full/7010-0944-sokkiassfrmpdf 559/623
Toolbar
P/N 7010-0944 15-3
Select Point
The Select Point screen selects a point from the list to center the plot.
Figure 15-3. Select Point
PropertiesThe Properties screen (Figure 15-4) customizes the map view byadding properties to the points or setting the application to adjust thescale automatically.
Figure 15-4. Map Properties
Place the check mark in the corresponding boxes to:

8/10/2019 7010-0944 - SokkiaSSF_rm.pdf
http://slidepdf.com/reader/full/7010-0944-sokkiassfrmpdf 560/623
Viewing Map
Sokkia Spectrum Survey Field Reference Manual15-4
• Display, along with the points, their names, codes, icons and
heights.
• Show Auto topo and scanned points.• Display roads, turn on the linework on the map.
• Perform autoscaling (the Autoscale field). Autoscaling works todisplay the 30 most recent points of a survey on the map screen.
• Start each time from the current position. If the current positionmoves off the edge of the map, it will automatically snap back to
the center if you place a check mark in the Current Position box.
Actions on the Map
The main Map screen not only displays spatial job overview but alsoprovides access the job database by actions on the map view. It isrealized by pop-up menus which offer the relevant actions onparticular objects.
On the main Map screen, you can:
• Tap on the desired object (point, line, road) to select/deselectobjects on the map.
• Press the button and draw a frame from right to left to
highlight selected objects.
• Press Alt on the controller’s keyboard and tap the object, or press
and hold the stylus on the selected object to display map options.A pop-up menu displays the options available for the selectedobject (Figure 15-5 on page 15-5):
– Stakeout : performs stakeout of the selected point, point indirection, line vertices and road.
– Edit: changes properties of a single selected object (point,line, road).
– Delete: deletes selected objects.
– Add to Layer: places selected objects on a selected layer.
– Create a Road: creates a new road.

8/10/2019 7010-0944 - SokkiaSSF_rm.pdf
http://slidepdf.com/reader/full/7010-0944-sokkiassfrmpdf 561/623
Actions on the Map
P/N 7010-0944 15-5
Figure 15-5. Map Options
Most Sokkia SSF functions can be performed on the Map opened in a
Sokkia SSF task (for example, see Figure 15-6 for a Topo survey).Depending upon the task, the appearance of the view changes. Mostlythe controls located on the main task page are duplicated. There arealso some controls that are independent of the function beingperformed. These controls correspond to the viewing options andcustomized display options.
Figure 15-6. Topo – Map

8/10/2019 7010-0944 - SokkiaSSF_rm.pdf
http://slidepdf.com/reader/full/7010-0944-sokkiassfrmpdf 562/623
Viewing Map
Sokkia Spectrum Survey Field Reference Manual
Notes:
15-6

8/10/2019 7010-0944 - SokkiaSSF_rm.pdf
http://slidepdf.com/reader/full/7010-0944-sokkiassfrmpdf 563/623
P/N 7010-0944
Chapter 16
16-1
Switching InstrumentsThe Mode Icon sets the instrument mode for surveying. The
Observation Mode screen displays (Figure 16-1).
Observation ModeOn the Observation Mode screen, select the instrument type andwireless control options.
Figure 16-1. GPS+ Observation Mode
• Select Instrument Type – sets the operation mode for surveying;select either GPS+ or Total Station. If Total Station mode isselected, you can choose Contractor mode, a scaled down versionof the existing Total Station mode.
• Bluetooth – the option for remote (wireless) control on shortdistances. Only available if a Bluetooth device is available.
The Help Icon in the upper-left corner of the screen displays the Help option to access the help files.

8/10/2019 7010-0944 - SokkiaSSF_rm.pdf
http://slidepdf.com/reader/full/7010-0944-sokkiassfrmpdf 564/623
Switching Instruments
Sokkia Spectrum Survey Field Reference Manual
Notes:
16-2

8/10/2019 7010-0944 - SokkiaSSF_rm.pdf
http://slidepdf.com/reader/full/7010-0944-sokkiassfrmpdf 565/623
P/N 7010-0944
Appendix A
A-1
File FormatsThe following sections describe the formats used to import/exportdifferent file types.
Point Coordinate FormatsThe files used to import/export point data can be in different formats:text formats such as DXF, MOSS and many others, or binary formats
such as DWG and CR5.
Text (Custom Format)
This format contains a set of user-defined fields in the user-definedorder. This format can contain points and lines. Lines are defined bycontinuous list of the points with the same name.
The following fields are available:
Name
N(Lat)
E(Lon)
Elev
Ell ht
Notes
Codes
Codes&Strings
Codes&Attributes
FullCodes
Four variants of code fields are available to support all code featuresin TopSURV:
1. Codes - includes only codes: Code1, Code2,..., CodeN...

8/10/2019 7010-0944 - SokkiaSSF_rm.pdf
http://slidepdf.com/reader/full/7010-0944-sokkiassfrmpdf 566/623
File Formats
Sokkia Spectrum Survey Field Reference ManualA-2
2. Codes&Strings - includes only code names and strings:
Code1&"code string1",…, CodeN&"code stringM"...
3. Codes&Attributes - includes only code names andattributes:
Code1:[attribute name1].[type of the attribute]="value of the attribute"…
$Code1:[attribute nameN].[type of the attribute]="value of the attribute"...
4. FullCodes - includes code names, attributes, code strings
and control codes:
Code1:[attribute name1].[type of the attribute]="value of the
attribute"&"code string"@"control code"… $Code1:[attribute
nameN].[type of the attribute]="value of the attribute"&"code
stringM"@"control codeK"…
FC-4The FC-4 format is as follows:
Name, Northing, Easting, Elevation, Code
Example:
101
12.32000
45.10000
23.12000
a
102
34.20000
9.40000
3.22000
103
2.33400
8.45000
NOTICE
Select only one type of the code output to one file.Selection of several Codes fields for export is notsupported

8/10/2019 7010-0944 - SokkiaSSF_rm.pdf
http://slidepdf.com/reader/full/7010-0944-sokkiassfrmpdf 567/623
Point Coordinate Formats
P/N 7010-0944 A-3
45.00000
b
104
78.60000
45.00000
56.60000
FC-5
Example:
OutPut
_+BS_ f+012500000m_ g+011500000m_ h+000050000m_+PJ1_
f+012000000m_ g+011002106m_ h+000049970m_+PJ11_ f+012000000m_
g+011002106m_0063
h+000049970m_+PJ12_ f+011994478m_ g+011004703m_
h+000050025m_+PJ13_ f+011990588m_ g+011003698m_
h+000049863m_+PJ2_ f+011994476m1051
InPut_+BS_ x+012500000m_ y+011500000m_ z+000050000m_+PJ1_
f+012000000m_ g+011002106m_ h+000049970m_+PJ11_ f+012000000m_
g+011002106m_0063
h+000049970m_+PJ12_ f+011994478m_ g+011004703m_
h+000050025m_+PJ13_ f+011990588m_ g+011003698m_
h+000049863m_+PJ2_ f+011994476m1051
GTS-6
GTS-6 coordinate input and output is the same format. Refer to theGTS-6 interface manual to confirm details.
The format of GTS-6 is the same as FC-5 coordinate input.

8/10/2019 7010-0944 - SokkiaSSF_rm.pdf
http://slidepdf.com/reader/full/7010-0944-sokkiassfrmpdf 568/623
File Formats
Sokkia Spectrum Survey Field Reference ManualA-4
FC-6/GTS-7
The format of FC-6 is the same as GTS-7 coordinate format. The
GTS-7 format is as follows:
ptno, X(easting), Y(northing), Z(elevation)
Example:
1,1000.0000,1000.0000,100.0000
2,990.0000,1010.0000,100.0000
101,994.8159,1000.9684,100.1130
102,993.9304,1007.7991,100.8000103,998.5150,1009.6329,100.4026
104,1002.0648,1002.5682,100.3421
1001,1004.7210,997.6496,100.1153
1002,1003.7027,990.8382,100.7989
1003,998.7911,990.3286,100.4033
1004,997.3111,998.0951,100.3421
GTS-7 with strings
The GTS-7 with strings format is as follows:
ptno, X(easting), Y(northing), Z(elevation), pt code, string
Example:
1,1000.0000,1000.0000,100.0000,STN,001
2,990.0000,1010.0000,100.0000,STN,001
101,994.8159,1000.9684,100.1130,STN,002
102,993.9304,1007.7991,100.8000,STN,001
103,998.5150,1009.6329,100.4026,STN,002
104,1002.0648,1002.5682,100.3421,STN,001
1001,1004.7210,997.6496,100.1153,PT,09
1002,1003.7027,990.8382,100.7989,PT,051003,998.7911,990.3286,100.4033,PT,09
1004,997.3111,998.0951,100.3421,PT,05

8/10/2019 7010-0944 - SokkiaSSF_rm.pdf
http://slidepdf.com/reader/full/7010-0944-sokkiassfrmpdf 569/623
Point Coordinate Formats
P/N 7010-0944 A-5
GT
The GT Format is as follows:
0 Code Name North East Elev 0 0
Example:
0 a 101 12.320 45.100 23.120 0 0
0 102 34.200 9.400 3.220 0 0
0 b 103 2.334 8.450 45.000 0 0
0 104 78.600 45.000 56.600 0 0
GT-FIN
The File Extension for this format is *.GT
Format is 8,8,8,8,14,14,14:
1: Surface (Eight marks)
2: Line (Eight marks)
3: Code (Eight Marks)
4: Point (Eight marks)
5: X-coordinate (N) (fourteen marks)
6: Y-Coordinate (E) (fourteen marks)
7: Z-Coordinate (H) (fourteen marks)
Example:
9 1 0 1 44318.541 72090.844 0.000
where
9 = Surface Code (ctrl code)
1 = Line Code (String code)
0 = Code
1 = Point number
44318.541 = North72090.844 = East
0.000 = Height

8/10/2019 7010-0944 - SokkiaSSF_rm.pdf
http://slidepdf.com/reader/full/7010-0944-sokkiassfrmpdf 570/623
File Formats
Sokkia Spectrum Survey Field Reference ManualA-6
MMH360
The File Extension for this format is *.360
MMH360-format is as follows:
1: Empty (Four marks)
2: Control Code (three marks)
3: String (Four Marks)
4: Point (pointnumber: seven marks)
5: Empty (four marks)6: Code (Three marks)
7: Control Code 2 (two marks)
8: Empty mark (One mark)
9: X-coordinate (N) (11 marks, three after comma)
10: Empty mark (One mark)
11: Y-coordinate (E) (11 marks, three after comma)
12: Empty (Eight marks)
13: Z-coordinate (H)(8 marks, three after comma)
Example:
25 4 10 60101 7062800.100 3513639.300 17.800
where25 = Control code
4 = String
10 = Point Number
601 = Code
01 = Control Code 2
7062800.100 = North
3513639.300 = East
17.800 = Height

8/10/2019 7010-0944 - SokkiaSSF_rm.pdf
http://slidepdf.com/reader/full/7010-0944-sokkiassfrmpdf 571/623
Point Coordinate Formats
P/N 7010-0944 A-7
DXF
AutoCAD® DXF (Drawing eXchange Format) is the native vector
file format of Autodesk's AutoCAD application.
KOF
KOF is a Norwegian format that consists of a set of data blocks.
Example:
00 Starting off with total station:
02 P10 1.690 31
09 40
03 100 45 100.1230 100.1230 100.123 1.670
03 101 45 200.3210 100.3210 200.321 1.670
03 101 45 .3215 299.6786 200.322 1.670
03 100 45 300.1236 299.8770 100.134 1.670
09 40
03 100 45 200.1260 299.8770 100.126 1.670
03 101 45 300.3350 299.6791 200.345 1.670
03 101 45 100.3206 100.3215 200.256 1.670
03 100 45 .1247 100.1234 100.139 1.670
09 39
03 2 7002 110.0000 101.3955 50.002 1.350
03 3 7002 125.3600 100.2500 48.369 1.350
03 4 7002 136.2300 100.2500 48.369 1.350
09 91
03 5 7002 148.0000 100.2500 48.369 1.350
03 6 7002 150.0000 100.2500 48.369 1.350
03 7 7002 158.0000 100.2500 48.369 1.350
03 8 7002 168.0000 100.2500 48.369 1.350
03 9 7002 170.0000 100.2500 48.369 1.350
03 10 7002 180.0000 100.2500 48.369 1.350
09 99
00 Then a couple of coordinates:

8/10/2019 7010-0944 - SokkiaSSF_rm.pdf
http://slidepdf.com/reader/full/7010-0944-sokkiassfrmpdf 572/623
File Formats
Sokkia Spectrum Survey Field Reference ManualA-8
05 100 1000 134721.459 9867.343 21.633
05 101 1000 134741.349 9881.834 21.514
00 And some GNSS-vectors:
42 Bauta 2210658.5530 618726.6390 5930812.0680 1.341
43 D1 4.5619 230.4119 -47.0982 2.054
44 1.4314 0.6481 4.5640 1.0000 0.4382 0.8757 1.0000 0.4811 1.0000
42 Bauta 2210658.5530 618726.6390 5930812.0680 1.341
43 D2 -0.6466 176.7444 -33.8989 2.054
44 0.2134 0.1012 0.5657 1.0000 -0.0395 0.8015 1.0000 -0.1045 1.0000
The examples shown are not complete blocks, but show typical use ofthe blocks. Several of the blocks have a two-digit code that describesthe kind of measurement being done.
The relevant values are:
30 = TS, Traverse
31 = TS, Free station / eccentric station
32 = TS, Known station33 = TS,Other
91 = GPS, code differential (DGPS)
92 = GPS, autonomous
96 = GPS, RTK fixed
97 = GPS, RTK float
Block 00 - Header DB FreeText
^I2 ^ A64
Example:
00 This is just a comment!!
Block 02 - Station
DB Station Feat.Code NR Press Temp Ih Type Comm
^I2 ^A10 ^A8 ^ I8 ^ I8 ^ I8 ^ F6.3 ^ I2 ^ A7
Example:
02 P100 1000 1.723

8/10/2019 7010-0944 - SokkiaSSF_rm.pdf
http://slidepdf.com/reader/full/7010-0944-sokkiassfrmpdf 573/623
Point Coordinate Formats
P/N 7010-0944 A-9
DB is the data bloc-number (02), Station is name of station (point
where total station is situated), Feat. Code is feature code, NRcould be left blank. Pressure in mmHg and temperature in C.
Ih=instrument height, Type is type of measurement, and Comm iscomment.
Block 03 - Total Station observations 1
DB AimPoint Feat.Code Hor Vert Dist Ph Type Comm
^I2 ^ A10 ^ A8 ^ F8.4 ^F8.4 ^F8.3 ^ F6.3 ^ I2 ^A7
Example:
03 PP230 7002 100.1230 100.1230 100.123 1.670
DB is data block-number (03). Aim Point is point name of pointat which the total station is aimed. Feature code is feature code of
Aim Point. Hor is horizontal angle (gon). Vert is vertical angle(gon). Dist is slope distance. Ph is pole height / prism height.
Type is type of observation, and Comm is comment.
Block 04 - Total Station observations 2
DB AimPoint Feat.Code Hor Dh DistH Ph Type Comm
^I2 ^ A10 ^ A8 ^ F8.4 ^ F8.3 ^ F8.3 ^ F6.3 ^I2 ^ A7
Example:
04 PP231 7002 100.1230 2.113 144.341 1.670
DB is data block (04). Aim Point is the point at which the totalstation is aimed. Feat.Code is feature code for Aim.Point. Hor is
horizontal angle (gon). Dh is height difference. DistH ishorizontal distance. Ph is pole height / prism height. Type is type
of observation, and comm is comment.
Block 05 - Coordinates
DB Pointname Feat.Code North East Height Type Comment
^I2 ^ A10 ^ A8 ^ F12.3 ^ F11.3 ^ F8.3 ^ I2 ^ A7
Example:
05 P101 1000 134741.349 9881.834 21.514
DB is datablock (05). Pointname is occupation name (point
name). Feat.Code is feature code. North, East, Height iscoordinate in selected system. Type is type of calculation/ measurement, and comment is a free-text comment.
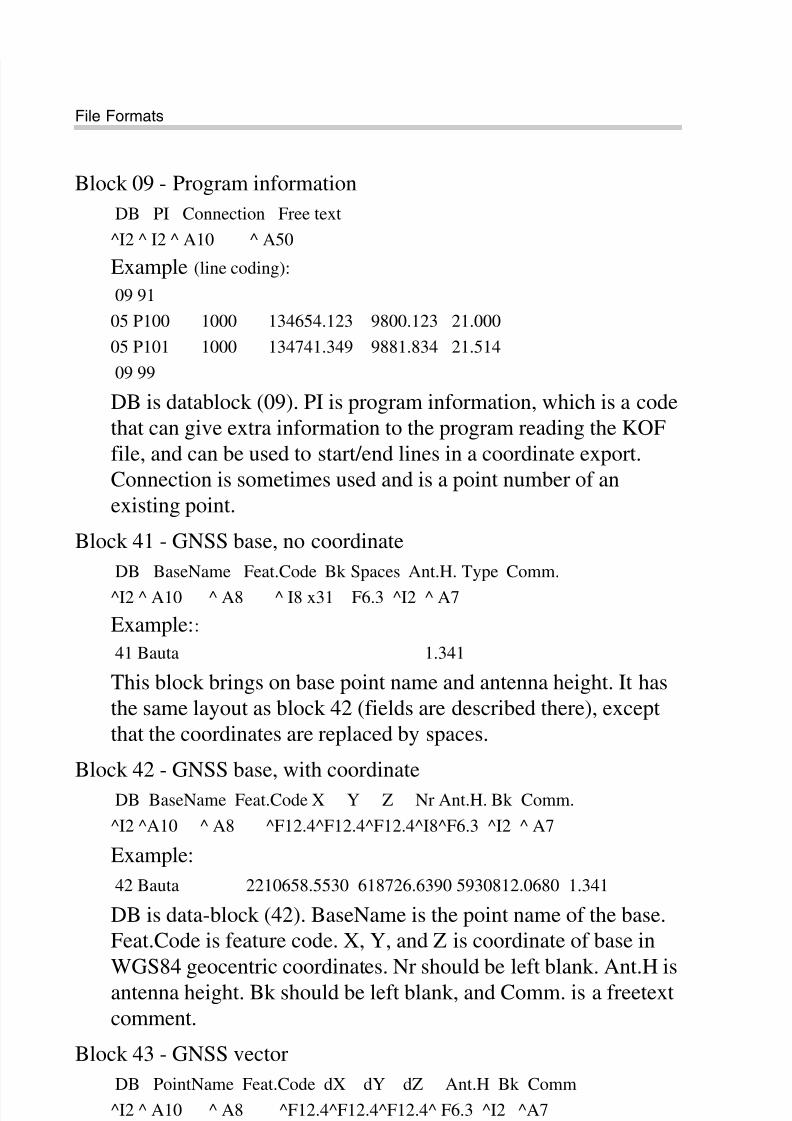
8/10/2019 7010-0944 - SokkiaSSF_rm.pdf
http://slidepdf.com/reader/full/7010-0944-sokkiassfrmpdf 574/623
File Formats
Sokkia Spectrum Survey Field Reference ManualA-10
Block 09 - Program information
DB PI Connection Free text
^I2 ^ I2 ^ A10 ^ A50
Example (line coding):
09 91
05 P100 1000 134654.123 9800.123 21.000
05 P101 1000 134741.349 9881.834 21.514
09 99
DB is datablock (09). PI is program information, which is a codethat can give extra information to the program reading the KOF
file, and can be used to start/end lines in a coordinate export.Connection is sometimes used and is a point number of anexisting point.
Block 41 - GNSS base, no coordinate
DB BaseName Feat.Code Bk Spaces Ant.H. Type Comm.
^I2 ^ A10 ^ A8 ^ I8 x31 F6.3 ^I2 ^ A7
Example::
41 Bauta 1.341
This block brings on base point name and antenna height. It hasthe same layout as block 42 (fields are described there), exceptthat the coordinates are replaced by spaces.
Block 42 - GNSS base, with coordinate
DB BaseName Feat.Code X Y Z Nr Ant.H. Bk Comm.
^I2 ^A10 ^ A8 ^F12.4^F12.4^F12.4^I8^F6.3 ^I2 ^ A7
Example:
42 Bauta 2210658.5530 618726.6390 5930812.0680 1.341
DB is data-block (42). BaseName is the point name of the base.Feat.Code is feature code. X, Y, and Z is coordinate of base in
WGS84 geocentric coordinates. Nr should be left blank. Ant.H isantenna height. Bk should be left blank, and Comm. is a freetextcomment.
Block 43 - GNSS vector
DB PointName Feat.Code dX dY dZ Ant.H Bk Comm
^I2 ^ A10 ^ A8 ^F12.4^F12.4^F12.4^ F6.3 ^I2 ^A7
Example:

8/10/2019 7010-0944 - SokkiaSSF_rm.pdf
http://slidepdf.com/reader/full/7010-0944-sokkiassfrmpdf 575/623

8/10/2019 7010-0944 - SokkiaSSF_rm.pdf
http://slidepdf.com/reader/full/7010-0944-sokkiassfrmpdf 576/623
File Formats
Sokkia Spectrum Survey Field Reference ManualA-12
number of satellites included in position calculation, PDOP is
PDOP, Ant height is antenna height. NB should be left blank ifcoordinate (or vector) is already adjusted for antenna height.
Epochs is number of epochs measured, and type is type ofsolution, from this list:
Block 50 - coordinate in selected system, with ellipsoidal height
DB Pointname Feat.Code North East Ell.H Type Comm.
^I2 ^ A10 ^ A8 ^ F12.3 ^ F11.3 ^ F8.3 ^ I2 ^ A7
Example:
50 Point2345 1000 134741.349 9881.834 62.643
DB is data-block (50), PointName is the name of the occupation(point), and Feat.Code is feature code. North, East is coordinatefrom the measurement in selected system. Ell.H is ellipsoidal
height in WGS84. Type is left blank. Comm. is a free textcomment.
Block 51 - GNSS RMS and correlation coefficients, NEU(North,East,Up)
DB sN sE sU rNN rNE rNU rEE rEU rUU Comm
^I2 ^ F8.4 ^F8.4^ F8.4^ F7.4^ F7.4^ F7.4^ F7.4^ F7.4^ F7.4^ A7
Example:
50 Point2345 1000 134741.349 9881.834 21.514 62.643 2.054
This block follows block 05 or 50 (coordinate) with additionaldata on the measurement. DB is data-block (51). sN, sE, sU is the
coordinate components’ standard deviation (RMS-values), andthe r-fields are correlation coefficients between the coordinatecomponents. rNN, rEE, rUU are all equal to 1.
SHP
SHP is an ArcView® GIS data format used to represent a set of
geographic features.
Refer to the following website for details:
http://dl1.maptools.org/dl/shapelib/shapefile.pdf

8/10/2019 7010-0944 - SokkiaSSF_rm.pdf
http://slidepdf.com/reader/full/7010-0944-sokkiassfrmpdf 577/623
Point Coordinate Formats
P/N 7010-0944 A-13
Cut Sheet Standard
Cut Sheet Standard format is as follows:
Header:
Date
Time
Job Name
Dist Units (Meter, US. Feet, Int. Feet, US. Inches, Int. Inches)
Design Point Record:Point Name
Code
North East Elev
Stakeout Station Record:
Station Name
North East Elev
deltaNorth deltaEast deltaElev Cut
Cut Sheet User Defined
This format contains a set of user-defined fields in the user-definedorder.
The following fields are available:
Design Point
Code
Staked Point
Cut
FillCut(Fill)
Time Stamp
Station

8/10/2019 7010-0944 - SokkiaSSF_rm.pdf
http://slidepdf.com/reader/full/7010-0944-sokkiassfrmpdf 578/623
File Formats
Sokkia Spectrum Survey Field Reference ManualA-14
Offset Direction
Offset Distance
Design North
Design East
Design Elevation
Station North
Station East
Station Elevation
Delta North
Delta East
Delta Elevation
Check Sheet
Check Sheet format is as follows:Header:
Date
Time
Job Name
Dist Units (Meter, US. Feet, Int. Feet, US. Inches, Int. Inches)
Observed Point Record:
Point Name
Code
North East Elev
Check Station Record:
Station NameNorth East Elev
deltaNorth deltaEast deltaElev
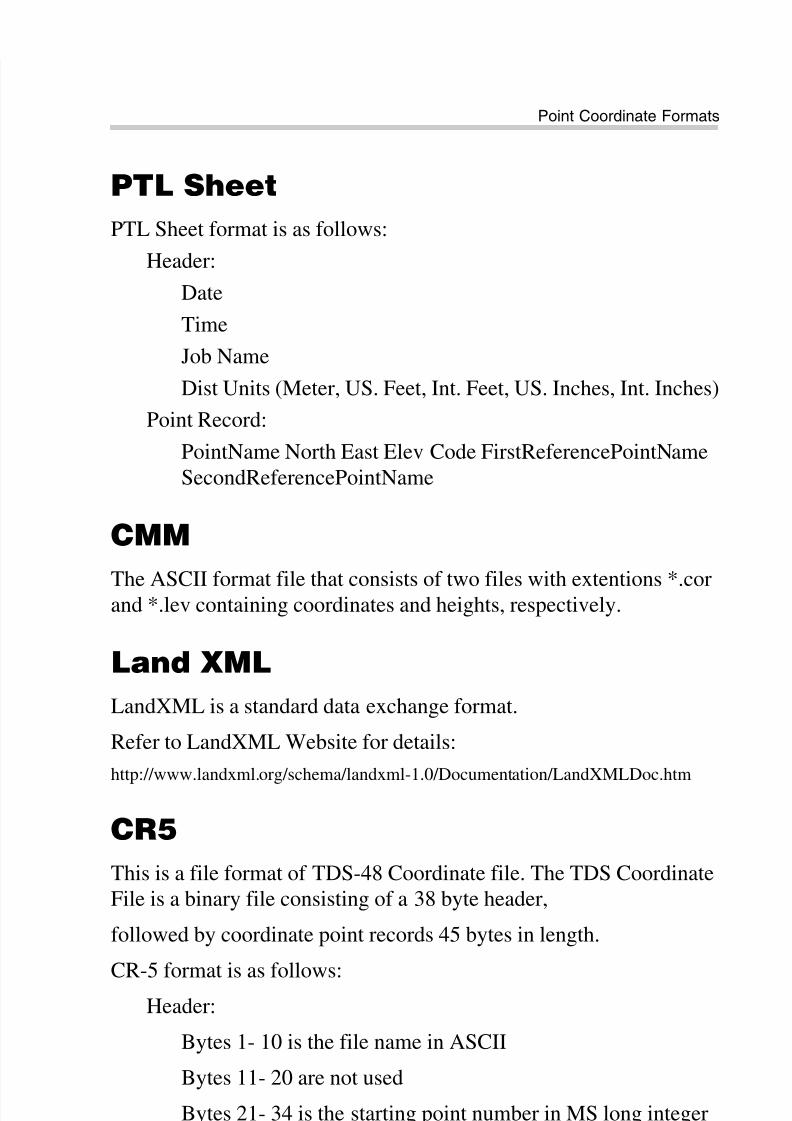
8/10/2019 7010-0944 - SokkiaSSF_rm.pdf
http://slidepdf.com/reader/full/7010-0944-sokkiassfrmpdf 579/623
Point Coordinate Formats
P/N 7010-0944 A-15
PTL Sheet
PTL Sheet format is as follows:
Header:
Date
Time
Job Name
Dist Units (Meter, US. Feet, Int. Feet, US. Inches, Int. Inches)
Point Record:
PointName North East Elev Code FirstReferencePointNameSecondReferencePointName
CMM
The ASCII format file that consists of two files with extentions *.corand *.lev containing coordinates and heights, respectively.
Land XML
LandXML is a standard data exchange format.
Refer to LandXML Website for details:
http://www.landxml.org/schema/landxml-1.0/Documentation/LandXMLDoc.htm
CR5
This is a file format of TDS-48 Coordinate file. The TDS CoordinateFile is a binary file consisting of a 38 byte header,
followed by coordinate point records 45 bytes in length.
CR-5 format is as follows:
Header:
Bytes 1- 10 is the file name in ASCII
Bytes 11- 20 are not used
Bytes 21- 34 is the starting point number in MS long integerformat. This record is -1 if the file is non-sequential

8/10/2019 7010-0944 - SokkiaSSF_rm.pdf
http://slidepdf.com/reader/full/7010-0944-sokkiassfrmpdf 580/623
File Formats
Sokkia Spectrum Survey Field Reference ManualA-16
Bytes 35- 38 is the last point number in MS long integer
format
Coordinate Point Records:Bytes 1- 4 is the point number in MS long integer format.This record is -1 if the point is unused (sequential files only)
Bytes 5- 12 is the northing of the point in MS doubleprecision real
Bytes 13- 20 is the easting of the point in MS double
precision real
Bytes 21- 28 is the elevation of the point in MS doubleprecision real
Bytes 29- 45 is the point descriptor in ASCII
MOSS GENIO
Example:
GENIO D:\J0119A
001,FORMAT(3F14.4)
003,ORDR,4=1,1,2,3
080,PT01,7=3
1002.6092 1013.9337 2.3165
1007.5266 992.8522 1.9564
0.0000 0.0000 0.0000080,PT02,7=3
991.2378 1002.7609 1.5545
993.2974 1014.3845 2.3475
0.0000 0.0000 0.0000
080,CD02,7=3
1002.6079 1013.9361 2.3148
0.0000 0.0000 0.0000
080,CD03,7=3
1007.5318 992.8488 1.9562
0.0000 0.0000 0.0000

8/10/2019 7010-0944 - SokkiaSSF_rm.pdf
http://slidepdf.com/reader/full/7010-0944-sokkiassfrmpdf 581/623
Point Coordinate Formats
P/N 7010-0944 A-17
080,OCC,7=3
1000.0000 1000.0000 0.0000
0.0000 0.0000 0.0000
080,PT01,7=3
1002.6079 1013.9361 2.3148
1007.5318 992.8488 1.9562
991.2376 1002.7602 1.5557
993.2994 1014.3841 2.3509
0.0000 0.0000 0.0000
999FINISH
NEZ
NEZ format is as follows:
Name, North, East, Elev, Code
Example:
101,12.3200,45.1000,23.1200,a
102,34.2000,9.4000,3.2200,
103,2.3340,8.4500,45.0000,b
104,78.6000,45.0000,56.6000,
This format is also used for PTL coordinate system. In this case theNEZ format is:
Name, North, East, Elev, Code, First Reference Point Name, SecondReference Point Name
NEZ with strings
The NEZ with strings coordinate format is as follows:
Name, North, East, Elev, Code, String
Example:
101,12.3200,45.1000,23.1200,a,123
102,34.2000,9.4000,3.2200,,
103,2.3340,8.4500,45.0000,b,

8/10/2019 7010-0944 - SokkiaSSF_rm.pdf
http://slidepdf.com/reader/full/7010-0944-sokkiassfrmpdf 582/623
File Formats
Sokkia Spectrum Survey Field Reference ManualA-18
104,78.6000,45.0000,56.6000,,
This format is also used for PTL coordinate system. In this case theformat is:
Name, North, East, Elev, Code, String, First Reference Point Name,Second Reference Point Name
Custom Format with Quality Control
information
This format contains a set of user-defined fields in the user-definedorder.
The following fields are available:
Name
E(Lon)
N(Lat)
Ell ht
Elevation
Notes
Codes
Codes&Strings
Codes&Attributes
FullCodes
Date
Solution Type
VRMS
HRMS
Time
PDOP
HDOP
VDOPNum. of GPS
Num. of GLONASS
Design Elevation
Station North

8/10/2019 7010-0944 - SokkiaSSF_rm.pdf
http://slidepdf.com/reader/full/7010-0944-sokkiassfrmpdf 583/623
Code Libraries
P/N 7010-0944 A-19
Station East
Station Elevation
Delta North
Delta East
Delta Elevation
Code Libraries
The following sections describe the code formats used in the import/
export code libraries.
Topcon Data Dictionary Format (TDD)
Topcon's Data Dictionary Format supports String, Integer, Float andList types as fields of the codes. The Draw properties is also
supported. All exported codes are stored in the one file. Each code isplaced on a new line.
The format is as follows:
CodeName#1<Point?R*G*B?MStyle|Line?R*G*B?DashStyle?Width> (field#1(FIELD_TYPE),… field#N(FIELD_TYPE))
CodeName#2<Point?R*G*B?MStyle|Line?R*G*B?DashStyle?Width> (field#1(FIELD_TYPE),… field#N(FIELD_TYPE))
Comments:
Point, Line – types of the supported objects
R,G,B – color of the objects with such code
MStyle – mark style of the points with such code:
0 = Dot
1 = Filled Rectangle
2 = Filled Diamond
3 = Filled Circle4 =Filled Triangle
5 = Rectangle
6 = Diamond

8/10/2019 7010-0944 - SokkiaSSF_rm.pdf
http://slidepdf.com/reader/full/7010-0944-sokkiassfrmpdf 584/623
File Formats
Sokkia Spectrum Survey Field Reference ManualA-20
7 = Circle
8 = Triangle
9 = Cross
DashStyle – dash style of the lines with such code:
0 = Solid
1 = Dash
2 = Dot
3 = Dash Dot
4 = Dash Dot Dot
Width – width of the lines with such codeFIELD_TYPE can be: String, Integer, Float, List.
For FIELD_TYPE List we use next format:List(item#1,…,item#N).
Example:
test_code(menu_item<Point?255*128*255?3|Line?255*255*128?3?1>(List(blue,
green,red)), text_item(String), int_item(Integer), real_item(Float))
XML File as Storage of the Code
Library (XML)
The XML Code Library format supports String, Integer, Float andList types as fields of the codes. The format also supports Layers
dictionary and draw information for each code. All exported codes
are stored in one file. The format uses the XML syntax and is asfollows:
Example:
<?xml version="1.0"?>
<CodeDictionary version="1.1">
<Layers>
<Layer name="lay1" active="1" plot="1" notes="first">
<Params type="Line">
<DrawParams colorRValue="87" colorGValue="65" colorBValue="189"
dashStyle="1" width="2"/>
</Params>

8/10/2019 7010-0944 - SokkiaSSF_rm.pdf
http://slidepdf.com/reader/full/7010-0944-sokkiassfrmpdf 585/623
Code Libraries
P/N 7010-0944 A-21
</Layer>
<Layer name="lay2" active="1" plot="1" notes="second">
<Params type="Line">
<DrawParams colorRValue="153" colorGValue="98" colorBValue="156"
dashStyle="2" width="3"/>
</Params>
</Layer>
<Layer name="0" active="1" plot="1">
<Params type="Line">
<DrawParams colorRValue="128" colorGValue="128"
colorBValue="128" dashStyle="0" width="1"/>
</Params>
</Layer>
</Layers>
<Code name="code1" layer="0">
<Params type="Point">
<DrawParams colorRValue="255" colorGValue="255"
colorBValue="255" markStyle="-1"/>
</Params>
<Params type="Line">
<DrawParams colorRValue="255" colorGValue="255"
colorBValue="255" dashStyle="-1" width="1"/>
</Params>
<Attributes/>
</Code>
<Code name="code2" layer="0">
<Params type="Point">
<DrawParams colorRValue="255" colorGValue="255"
colorBValue="255" markStyle="-1"/>
</Params>
<Params type="Line">
<DrawParams colorRValue="255" colorGValue="255"
colorBValue="255" dashStyle="-1" width="1"/>
</Params>
<Attributes/>

8/10/2019 7010-0944 - SokkiaSSF_rm.pdf
http://slidepdf.com/reader/full/7010-0944-sokkiassfrmpdf 586/623
File Formats
Sokkia Spectrum Survey Field Reference ManualA-22
</Code>
<Code name="code3" layer="0">
<Params type="Point">
<DrawParams colorRValue="255" colorGValue="255"
colorBValue="255" markStyle="-1"/>
</Params>
<Params type="Line">
<DrawParams colorRValue="255" colorGValue="255"
colorBValue="255" dashStyle="-1" width="1"/>
</Params>
<Attributes/>
</Code>
</CodeDictionary>
Data Base Format as Storage of the
Code Library (DBF)
This format supports String, Integer, Float types as fields of thecodes. The List type is unsupported. Each exported code is stored in a
separate file. The format uses DBF syntax. This is a binary format.
Roads Formats
The following sections describe the road formats used in the import/
export of road data.
SSS Road
Alignments are uploaded as elements, and begins with the STARTdefinition which includes the starting chainage and a coordinate. Theelements are: PT, STRAIGHT, ARC or TRANSITION.
The general format for each record is:
KEYWORD nnnn, nnnn [,nnnn]
where:

8/10/2019 7010-0944 - SokkiaSSF_rm.pdf
http://slidepdf.com/reader/full/7010-0944-sokkiassfrmpdf 587/623
Roads Formats
P/N 7010-0944 A-23
START chainage, easting, northing
STRAIGHT bearing, distance
ARC radius, length
SPIRAL radius, length
PT easting, northing[, radius[, A1, A2: clothoid length]]
Example 1:
START 1000.000, 8.8888, 199.1200
STRAIGHT 25.0000, 48.420
SPIRAL 20.000, 20.000
ARC 20.000, 23.141
SPIRAL 20.000, 20.000
STRAIGHT 148.3000, 54.678
Example 2:
START 1000, 1050, 1100
PT 1750, 1300, 100, 80, 80
PT 1400, 1750, 200
PT 1800, 2000
TDS Road
TDS road file has a file extension of “.RD5”. This format is divided
into eight sections. Each section is started with a line that has a two
letter code and is followed by exactly 50 '+' characters. These sectionheader lines have to be included in the file even if there is nodefinition under them. For example, super-elevation and widening arenot required, but their header lines must exist. Each header line maybe followed by component definitions of that section.
Section codes:
HR : Start Horizontal alignment
VR : Start Vertical alignment
XR : Start Right Template
XL : Start Left Template

8/10/2019 7010-0944 - SokkiaSSF_rm.pdf
http://slidepdf.com/reader/full/7010-0944-sokkiassfrmpdf 588/623
File Formats
Sokkia Spectrum Survey Field Reference ManualA-24
SR : Start Right Super Elevation
SL : Start Left Super Elevation
WR : Start Right Widening
WL : Start Left Widening
Example:
HR++++++++++++++++++++++++++++++++++++++++++++++++++
HL,25.49380,630.000
HS,-1.000000,1000.000,200.000,R,T
HC,-1.000000,1000.000,895.900,RHS,-1.000000,1000.000,200.000,R,C
HL,-1.00000,250.000
VR++++++++++++++++++++++++++++++++++++++++++++++++++
VG,271.840,-2.000
VC,500.000,-2.000,1.800
VG,1254.060,1.800
VG,150.000,1.800
XR++++++++++++++++++++++++++++++++++++++++++++++++++
RT,100,0.000,NORMAL
XL++++++++++++++++++++++++++++++++++++++++++++++++++
LT,100,0.000,NORMAL
SR++++++++++++++++++++++++++++++++++++++++++++++++++
RS,106,30.000,108,30.000,-2.000,-6.000,0,0,0.000,0.000RS,117,25.900,119,25.900,-6.000,-2.000,0,0,0.000,0.000
SL++++++++++++++++++++++++++++++++++++++++++++++++++
LS,104,30.000,108,30.000,-2.000,6.000,0,0,0.000,0.000
LS,117,25.900,121,25.900,6.000,-2.000,0,0,0.000,0.000
WR++++++++++++++++++++++++++++++++++++++++++++++++++
RW,104,35.000,105,35.000,22.000,14.000,0
RW,106,35.000,107,35.000,14.000,22.000,0
WL++++++++++++++++++++++++++++++++++++++++++++++++++
LW,104,35.000,105,35.000,22.000,14.000,0
LW,106,35.000,107,35.000,14.000,22.000,0

8/10/2019 7010-0944 - SokkiaSSF_rm.pdf
http://slidepdf.com/reader/full/7010-0944-sokkiassfrmpdf 589/623
Roads Formats
P/N 7010-0944 A-25
Component definitions:
Horizontal Alignments
HL,%.5lf,%.3f Horizontal Line
Azimuth of line (DMS) %.5lf
(-1 if tangent to previous segment)
Horiz distance of line (ft or meter) %.3f
HC,%lf,%.3f,%.3f,%c Horizontal Curve
Tangent azimuth %lf
(-1 if tangent to previous segment)
Radius %.3f
Arc length %.3f
Turn ( R-Right or L-Left ) %c
HS,%lf,%.3f,%.3f,%c,%c Horizontal Spiral
Tangent azimuth %lf
(-1 if tangent to previous segment)
Radius %.3f
Arc length %.3f
Turn %c ( R-Right or L-Left )
Direction %c (T-Tangent or C-Curve)
Vertical Alignments
VG,%.3f,%.3f Vertical Grade
Horiz distance %.3f
Grade %.3f
VC,%.3f,%.3f,%.3f Vertical Parabolic Curv
Horiz distance %.3f
Begin grade %.3f
End grade %.3f
Cross section Templates
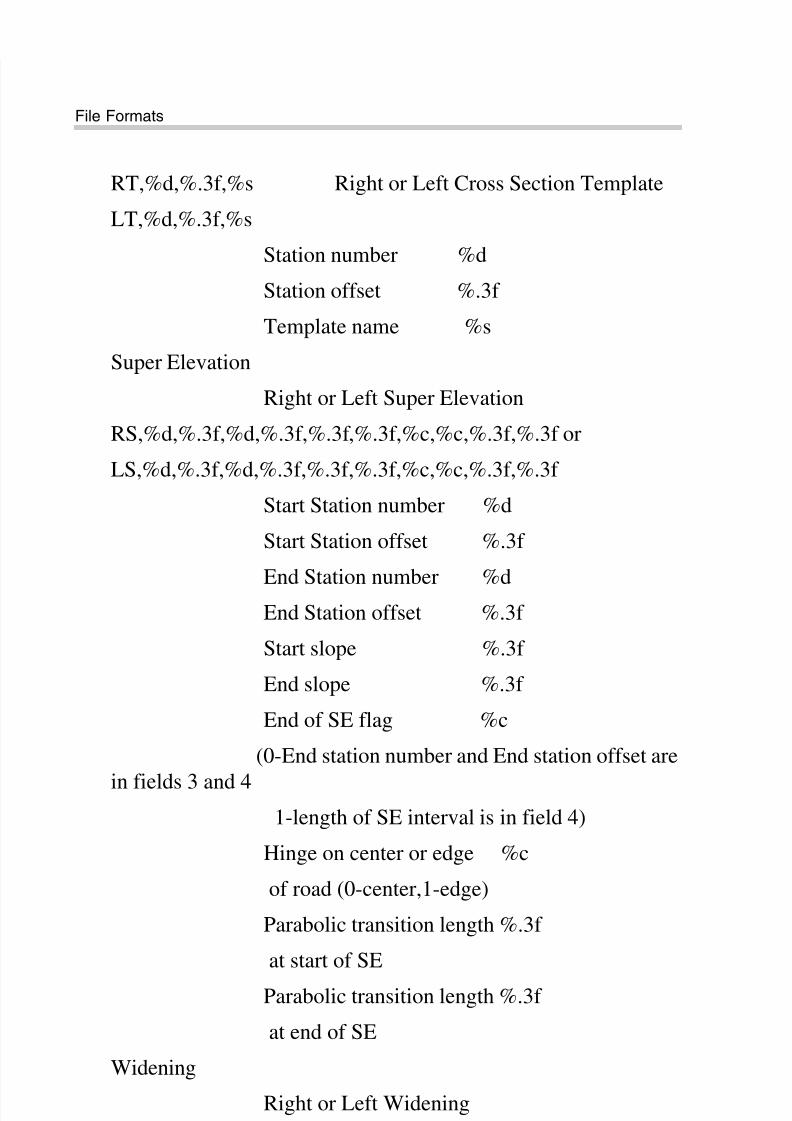
8/10/2019 7010-0944 - SokkiaSSF_rm.pdf
http://slidepdf.com/reader/full/7010-0944-sokkiassfrmpdf 590/623
File Formats
Sokkia Spectrum Survey Field Reference ManualA-26
RT,%d,%.3f,%s Right or Left Cross Section Template
LT,%d,%.3f,%s
Station number %d
Station offset %.3f
Template name %s
Super Elevation
Right or Left Super Elevation
RS,%d,%.3f,%d,%.3f,%.3f,%.3f,%c,%c,%.3f,%.3f or
LS,%d,%.3f,%d,%.3f,%.3f,%.3f,%c,%c,%.3f,%.3f
Start Station number %d
Start Station offset %.3f
End Station number %d
End Station offset %.3f
Start slope %.3f
End slope %.3f
End of SE flag %c
(0-End station number and End station offset arein fields 3 and 4
1-length of SE interval is in field 4)
Hinge on center or edge %c
of road (0-center,1-edge)
Parabolic transition length %.3f
at start of SE
Parabolic transition length %.3f
at end of SEWidening
Right or Left Widening
RW,%d,%.3f,%d,%.3f,%.3f,%.3f,%c or

8/10/2019 7010-0944 - SokkiaSSF_rm.pdf
http://slidepdf.com/reader/full/7010-0944-sokkiassfrmpdf 591/623
Roads Formats
P/N 7010-0944 A-27
LW,%d,%.3f,%d,%.3f,%.3f,%.3f,%c
Start Station number %d
Start Station offset %.3f
End Station number %d
End Station offset %.3f
Width at start of widening %.3f
Width at end of widening %.3f
End of widening flag %c
(0-End station number and End station offset arein fields 3 and 4 1-length of widening interval
is in field 4)
MC Road
MC road file has a file extension of “.RD3” and is a binary file.
LandXML Road
LandXML is a standard data exchange format.
Refer to LandXML website for details:
http://www.landxml.org/schema/landxml-1.0/Documentation/LandXMLDoc.htm
TopSURV Road format v.1.3Distance/angle units are stored in the header record. If the Road is nota straight line, the header contains the starting azimuth.
TopSURV road format consists of three files:
1. *.thl: contains a horizontal alignment and must start with theSTART definition which includes the starting chainage and
coordinates. The elements are: PT, STRAIGHT, ARC or SPIRAL.
The general format for each record is:
KEYWORD nnnn, nnnn [,nnnn]

8/10/2019 7010-0944 - SokkiaSSF_rm.pdf
http://slidepdf.com/reader/full/7010-0944-sokkiassfrmpdf 592/623
File Formats
Sokkia Spectrum Survey Field Reference ManualA-28
where:
START chainage, easting, northing
STRAIGHT bearing, distance
ARC radius, length [, bearing]
SPIRAL first radius, second radius, length [, bearing]
PT easting, northing[, radius[, A1, A2]]
(A1, A2 : clothoid length)
• If the horizontal alignment starts with ARC or SPIRAL, the
'direction' field is used to define the start bearing of the horizontalalignment.
• If the spiral isn't a avoid clothoid, the corresponding not usedradius equal zero.
Example1:
START 1000.000, 8.8888, 199.1200
STRAIGHT 25.0000, 48.420SPIRAL 20.000, 20.000
ARC 20.000, 23.141
SPIRAL 20.000, 20.000
STRAIGHT 148.3000, 54.678
Example 2:
START 1000, 1050, 1100
PT 1750, 1300, 100, 80, 80
PT 1400, 1750, 200
PT 1800, 2000
2. *.tvl: contains a vertical alignment with long sections (LS). EveryLS requires chainage, level and curve length.
Starting and ending curve lengths should be zero.
The format is:
chainage, level, length
Example:
1000.000, 100.000, 0.000

8/10/2019 7010-0944 - SokkiaSSF_rm.pdf
http://slidepdf.com/reader/full/7010-0944-sokkiassfrmpdf 593/623
Roads Formats
P/N 7010-0944 A-29
1100.000, 125.000, 50.000
1250.000, 100.000, 60.000
3. *.trd: contains cross sections set.The format is:
Chainage, Template name, Turn (Left or Right), Cut, Fill,Segment name, Horizontal Offset, Vertical Offset
CLIP
The CLIP file format is a europe road format.Example:
*ALZ1
Calzada Derecha Ajustada
16512.029, 699.021C, 0.000T
18374.058, 749.296C, 10000.000R
19101.891, 785.687C,-15000.000R
19693.957, 807.105C,-25000.000R
20010.319, 815.960C, 25000.000R
20322.145, 829.250C, 22500.000R
21305.065, 878.500C,-12750.000R
21629.230, 888.160C, 14500.000R
21770.000, 894.966C, 0.000R
22000.000, 906.790C, 0.000T 22100.000, 911.900C, 25000.000R
22230.000, 918.790C,-10000.000R
22380.000, 4.975P, 50000.000R
22500.000, 932.525C,-20000.000R
22800.000, 947.100C, 50000.000R
22970.000, 955.547C,-25000.000R
23100.000, 961.800C,-10000.000R
23200.000, 966.370C, 22500.000R
23320.000, 972.200C, 45000.000R
23600.000, 986.660C,-100000.000R

8/10/2019 7010-0944 - SokkiaSSF_rm.pdf
http://slidepdf.com/reader/full/7010-0944-sokkiassfrmpdf 594/623
File Formats
Sokkia Spectrum Survey Field Reference ManualA-30
23786.000, 5.000P,-10000.000R
23982.080, 1002.100C, -8250.000R
24258.306, 1005.121C, -9250.000R 24693.967, 991.888C, 15000.000R
25903.863, 985.839C, 9894.424R
27440.115, 997.484C, -0.968F
28690.632, 991.237C, -1.995F
ISPOL
The ISPOL file format is a europe road format. The ISPOL roadconsists of three files: *.ali (horizontal alignment), *.ras (vertical
alignment) and *.sc1 (x-section sets).
To import an Ispol road, place the files (*.ali, *.ras and *.sc1) in thesame folder of TopSURV. When importing, select only the firstoffered (*.ali) file and data from others will be considered byTopSURV.
Example for ALI:
#----------------------------------------------------
# FIchero : EJE6.ALI
# FOrmato : Istram 9.22 30/01/09 09:43:21 2332
# PRoyecto : AUTOPISTA SAN JOSE-CALDERA 181208 : dic'08_ene'09
# EJe : 6 : Sector II. Autopista San José- Caldera
# COmentario:
# COmentario:
#--------------------------------------------------
#PK.origen
#-----------------
14025.000
#(Tipos 1:recta 2:circ.dcha 3:circ.izqu 4,5,6,7:clotoides 4:1->3 5:3->1 6:2->1 7:1-
>2) 0:Ultimo Punto
# Tipo LONGITUD X tangencia Y tangencia X:tan/cen/inf Y:tan/cen/inf
AZIMUT RADIO/PARAMETRO *
#----- -------------- -------------- -------------- -------------- --------------- -------------- --
------------- --------------
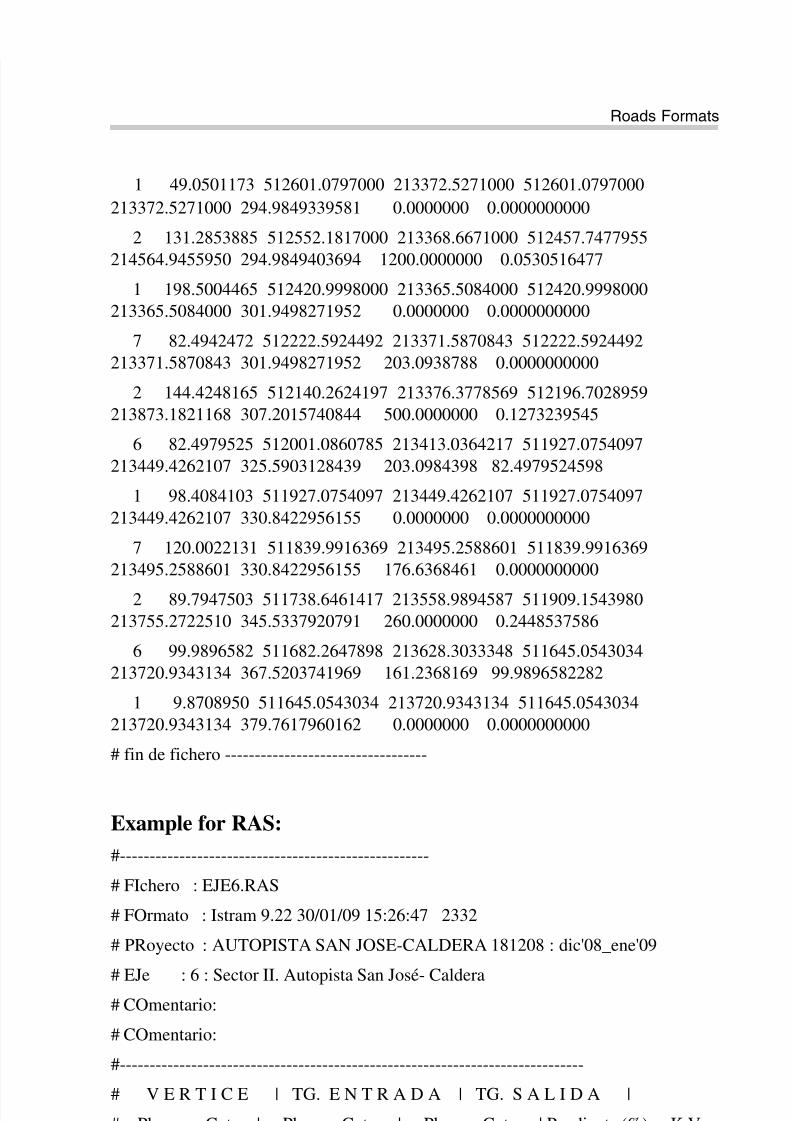
8/10/2019 7010-0944 - SokkiaSSF_rm.pdf
http://slidepdf.com/reader/full/7010-0944-sokkiassfrmpdf 595/623
Roads Formats
P/N 7010-0944 A-31
1 49.0501173 512601.0797000 213372.5271000 512601.0797000
213372.5271000 294.9849339581 0.0000000 0.0000000000
2 131.2853885 512552.1817000 213368.6671000 512457.7477955
214564.9455950 294.9849403694 1200.0000000 0.0530516477
1 198.5004465 512420.9998000 213365.5084000 512420.9998000
213365.5084000 301.9498271952 0.0000000 0.0000000000
7 82.4942472 512222.5924492 213371.5870843 512222.5924492
213371.5870843 301.9498271952 203.0938788 0.0000000000
2 144.4248165 512140.2624197 213376.3778569 512196.7028959
213873.1821168 307.2015740844 500.0000000 0.1273239545
6 82.4979525 512001.0860785 213413.0364217 511927.0754097213449.4262107 325.5903128439 203.0984398 82.4979524598
1 98.4084103 511927.0754097 213449.4262107 511927.0754097
213449.4262107 330.8422956155 0.0000000 0.0000000000
7 120.0022131 511839.9916369 213495.2588601 511839.9916369
213495.2588601 330.8422956155 176.6368461 0.0000000000
2 89.7947503 511738.6461417 213558.9894587 511909.1543980
213755.2722510 345.5337920791 260.0000000 0.2448537586
6 99.9896582 511682.2647898 213628.3033348 511645.0543034213720.9343134 367.5203741969 161.2368169 99.9896582282
1 9.8708950 511645.0543034 213720.9343134 511645.0543034
213720.9343134 379.7617960162 0.0000000 0.0000000000
# fin de fichero ----------------------------------
Example for RAS:
#----------------------------------------------------
# FIchero : EJE6.RAS
# FOrmato : Istram 9.22 30/01/09 15:26:47 2332
# PRoyecto : AUTOPISTA SAN JOSE-CALDERA 181208 : dic'08_ene'09
# EJe : 6 : Sector II. Autopista San José- Caldera
# COmentario:
# COmentario:#------------------------------------------------------------------------------
# V E R T I C E | TG. E N T R A D A | TG. S A L I D A |
# Pk Cota | Pk Cota | Pk Cota | Pendiente (%) K.V.

8/10/2019 7010-0944 - SokkiaSSF_rm.pdf
http://slidepdf.com/reader/full/7010-0944-sokkiassfrmpdf 596/623
File Formats
Sokkia Spectrum Survey Field Reference ManualA-32
#------------ ------------ ------------ ------------ ------------ ------------ --------------- --------
----
14025.0000 852.8730 0.0000 0.0000 0.0000 0.0000 0.000000
0.0000
14140.0600 855.2670 14025.0600 852.8742 14255.0600 849.8247
2.080654 3375.8639
14485.0000 838.9430 14425.0000 841.7825 14545.0000 837.1429 -
4.732417 6927.2901
14883.2150 826.9960 14808.2150 829.2461 14958.2150 822.5396 -
3.000138 5099.0115
15184.6850 809.0830 15064.6850 816.2133 15304.6850 810.4656 -
5.941885 3383.1133
15424.8400 811.8500 15304.8400 810.4674 15544.8400 806.3915
1.152173 4209.8485
16005.0000 785.4600 15885.0000 790.9185 16125.0000 785.3400 -
4.548745 5394.7797
16505.0000 784.9600 16385.0000 785.0800 16625.0000 789.6002 -
0.100000 6050.1627
16900.0000 800.2340 16750.0000 794.4337 17050.0000 803.89053.866835 20991.3659
17489.8650 814.6130 17314.8650 810.3471 17664.8650 809.5794
2.437676 6586.3544
18170.0000 795.0500 18080.0000 797.6387 18260.0000 795.0500 -
2.876341 6257.9512
18396.0000 795.0500 18301.0000 795.0500 18491.0000 796.1938
0.000000 15780.8962
# fin de fichero ----------------------------------
Example for SC1:
#----------------------------------------------------
# FIchero : EJE6.SC1
# FOrmato : Istram 9.22 30/01/09 15:58:32 2332
# PRoyecto : AUTOPISTA SAN JOSE-CALDERA 181208 : dic'08_ene'09# EJe : 6 : Sector II. Autopista San José- Caldera
# COmentario:
# COmentario:

8/10/2019 7010-0944 - SokkiaSSF_rm.pdf
http://slidepdf.com/reader/full/7010-0944-sokkiassfrmpdf 597/623
Roads Formats
P/N 7010-0944 A-33
#------------------------------------------------------------------------------
# Perfil por la Subrasante
#------------------------------------------------------------------------------
# | Puntos: DespHrz->Respecto eje en planta DespVet->Respecto a Rasante
# Pk | DespHrz DespVrt Codigo
#----------- -------------------------
14025.000 21.995 -0.941 100.00 21.985 -0.950 99.00 20.240 -0.915 11.00 18.410 -
0.878 2.00 4.100 -0.592 1.00 3.500 -0.580 -11.00 0.000 -0.513 -1000.00 0.000 -
0.513 -1000.00 -3.360 -0.580 -11.00 -4.000 -0.593 1.00 -14.950 -0.812 2.00 -
16.750 -0.848 11.00 -17.920 -0.871 99.00 -17.930 -0.748 100.00 -18.430 -0.248
1103.00 -18.930 -0.248 1104.00 -19.521 2.115 1221.00 -19.521 2.116 1231.00 -19.522 2.117 1241.00 -19.523 2.118 1251.00 -19.524 2.120 1399.00 -20.089 2.684
2399.00
14030.000 22.858 -0.934 100.00 22.848 -0.967 99.00 21.140 -0.933 11.00 19.310 -
0.896 2.00 4.100 -0.592 1.00 3.500 -0.580 -11.00 0.000 -0.514 -1000.00 0.000 -
0.514 -1000.00 -3.291 -0.580 -11.00 -3.941 -0.593 1.00 -14.891 -0.812 2.00 -
16.691 -0.848 11.00 -17.861 -0.871 99.00 -17.871 -0.748 100.00 -18.371 -0.248
1103.00 -18.871 -0.248 1104.00 -19.461 2.110 1221.00 -19.461 2.111 1231.00 -
19.462 2.112 1241.00 -19.463 2.114 1251.00 -19.464 2.115 1399.00 -20.030 2.681
2399.00
14040.000 24.920 -0.918 100.00 24.910 -1.008 99.00 23.290 -0.976 11.00 21.440 -
0.939 2.00 4.100 -0.592 1.00 3.500 -0.580 -11.00 0.000 -0.541 -1000.00 0.000 -
0.541 -1000.00 -3.128 -0.580 -11.00 -3.807 -0.588 1.00 -14.757 -0.724 2.00 -
16.558 -0.746 11.00 -17.728 -0.760 99.00 -17.737 -0.646 100.00 -18.237 -0.146
1103.00 -18.737 -0.146 1104.00 -19.301 2.110 1221.00 -19.302 2.111 1231.00 -
19.303 2.112 1241.00 -19.304 2.114 1251.00 -19.305 2.115 1399.00 -19.878 2.687
2399.00
14046.774 26.478 -0.851 100.00 26.468 -1.039 99.00 25.000 -1.010 11.00 23.140 -0.973 2.00 4.100 -0.592 1.00 3.500 -0.580 -11.00 0.000 -0.563 -1000.00 0.000 -
0.563 -1000.00 -2.980 -0.580 -11.00 -3.660 -0.584 1.00 -14.610 -0.648 2.00 -
16.410 -0.659 11.00 -17.580 -0.666 99.00 -17.590 -0.559 100.00 -18.090 -0.059
1103.00 -18.590 -0.059 1104.00 -19.103 1.992 1221.00 -19.104 1.994 1231.00 -
19.104 1.995 1241.00 -19.105 1.996 1251.00 -19.107 1.998 1399.00 -19.760 2.651
2399.00
14046.878 15.060 -0.592 100.00 15.050 -0.811 99.00 13.630 -0.782 11.00 11.410 -
0.738 2.00 4.100 -0.592 1.00 3.500 -0.580 -11.00 0.000 -0.563 -1000.00 0.000 -
0.563 -1000.00 -2.978 -0.580 -11.00 -3.668 -0.584 1.00 -14.618 -0.647 2.00 -
16.418 -0.657 11.00 -17.588 -0.664 99.00 -17.598 -0.557 100.00 -18.098 -0.057
1103.00 -18.598 -0.057 1104.00 -19.111 1.994 1221.00 -19.111 1.996 1231.00 -
19.112 1.997 1241.00 -19.113 1.999 1251.00 -19.115 2.000 1399.00 -19.769 2.654
2399.00

8/10/2019 7010-0944 - SokkiaSSF_rm.pdf
http://slidepdf.com/reader/full/7010-0944-sokkiassfrmpdf 598/623
File Formats
Sokkia Spectrum Survey Field Reference ManualA-34
14050.000 14.985 -0.568 100.00 14.975 -0.810 99.00 13.590 -0.782 11.00 11.400 -
0.738 2.00 4.100 -0.592 1.00 3.500 -0.580 -11.00 0.000 -0.572 -1000.00 0.000 -
0.572 -1000.00 -2.905 -0.580 -11.00 -3.615 -0.582 1.00 -14.565 -0.612 2.00 -
16.365 -0.617 11.00 -17.535 -0.621 99.00 -17.545 -0.517 100.00 -18.045 -0.0171103.00 -18.545 -0.017 1104.00 -19.034 1.940 1221.00 -19.035 1.942 1231.00 -
19.036 1.943 1241.00 -19.037 1.944 1251.00 -19.038 1.946 1399.00 -19.738 2.646
2399.00
14060.000 14.707 -0.473 100.00 14.697 -0.804 99.00 13.450 -0.779 11.00 11.400 -
0.738 2.00 4.100 -0.592 1.00 3.500 -0.580 -11.00 0.000 -0.598 -1000.00 0.000 -
0.598 -1000.00 -2.640 -0.580 -11.00 -3.360 -0.575 1.00 -14.310 -0.500 2.00 -
16.110 -0.488 11.00 -17.280 -0.480 99.00 -17.290 -0.400 100.00 -17.790 0.100
1103.00 -18.290 0.100 1104.00 -18.687 1.688 1221.00 -18.688 1.690 1231.00 -
18.688 1.691 1241.00 -18.690 1.693 1251.00 -18.692 1.695 1399.00 -19.591 2.5942399.00
# fin de fichero ----------------------------------
MX GENIO
MX GENIO format is a GENeralized Input/Output format that is usedto import and export model information to and from Infrasoft’s MX
Professional. MX is a roadway design CADD application that uses astring-based modeling concept rather than a template-based approachused by civil design applications developed by other vendors.
MX GENIO format can be used to import a wide variety of stringtypes into MX, including master alignment strings and geometrystrings created from horizontal and vertical alignment definitions.
This is an example of a GENIO file that will create a 3D feature stringin MX.
MOSS
GENIO,DESIGN
017,NORM
001FORMAT(3D23.17)
003,ORDR,4=1,1,2,3,
080,CECI,7=3
0.86278740486024506D+060.23557974062420847D+060.51777335135235114D+03
0.86278725732131349D+060.23558072925923113D+060.51778031070319832D+03
0.86278720921827410D+060.23558172768451227D+060.51778404785966120D+03
0.86278726103175664D+060.23558272592411647D+060.51778561243843410D+03

8/10/2019 7010-0944 - SokkiaSSF_rm.pdf
http://slidepdf.com/reader/full/7010-0944-sokkiassfrmpdf 599/623
Roads Formats
P/N 7010-0944 A-35
0.86278741224405798D+060.23558371400396363D+060.51778605405621181D+03
0.86278766134431469D+060.23558468205148648D+060.51778642232968866D+03
0.86279182182447857D+060.23559013383718926D+060.51787511440594790D+03
0.86281114482140180D+060.23559653051477592D+060.52051708265943284D+03
0.86281131684491527D+060.23559658416659472D+060.52054181820995780D+03
0.86281591805419116D+060.23559801922184543D+060.52113322369797083D+03
0.86281609007772699D+060.23559807287367119D+060.52115270941608628D+03
0.86281706168931420D+060.23559837590624942D+060.52126223300564516D+03
0.00000000000000000D+000.00000000000000000D+000.52126223300564516D+03
999
A detailed explanation of each of the lines in this file follow.
MOSS
MX files begin with this line to clear any previous errors
GENIO,DESIGN
Begin the GENIO option. Include the model name that the string(s) will be
created in.
017,NORM
This command changes the Angular Input format for the file. 017,NORM willuse the system default format for MX which is typically radians. Other
alternatives for this are:
DEGR - Decimal Degrees
DMS - Degrees - Minutes - Seconds (in the format D23.17)
RADI - Radians
GRAD - Grads
QUAD - Quads
To specify angles in one of these other formats, substitute the appropriateKeyword for “NORM”.
001FORMAT(3D23.17)
Formats The INPUT Information in the Data Block.
The format is described by a number of field descriptors separated by commas
and is contained within parentheses.
A field descriptor in a format specification has the form:
[r]Cw[.d]
where
r represents a repeat count which specifies the field descriptor is to be applied
for ‘r’ successive fields. The default is 1 if omitted.
C is a format code: I - Integer, A - Alpha character, X - Space, F - Real number,
D and E - Double precision.

8/10/2019 7010-0944 - SokkiaSSF_rm.pdf
http://slidepdf.com/reader/full/7010-0944-sokkiassfrmpdf 600/623
File Formats
Sokkia Spectrum Survey Field Reference ManualA-36
w specifies the width of the field.
d specifies the number of decimal places.
Example: 3D23.17 specifies that each data line will consist of 3 double-
precision records representing the X, Y, and Z coordinates of each point. Eachfield will be 23 columns wide, and each number will have 17 decimal places.
003,ORDR,4=1,1,2,3,
Change Order - This command changes the order of the items of information in
a string element. The first two dimensions of a point on a string are always
Cartesian Coordinates, but the other dimensions may describe different
properties of the point. In this example, the first part of the line “003,ORDR”
will always remain the same. The last part of the command line indicates how
the data block is organized.
4=1 indicates that 1 row of data in the data block is used to define each point.
(for 3D features this is pretty straight-forward, but MX had more complex string
types such as Geometry Strings that have 12-dimensional points that may be
described over a number of lines.)
,1,2,3, indicates the string point dimensions the data should be assigned to.
(X,Y,Z for a 3D string.)
080,CECI,7=3
String Input - This command indicates what type of string is being created. The
MX string label
being created in this example is CECI, and each point on this string will have 3
dimensions (7=3).
0.86278740486024506D+060.23557974062420847D+060.51777335135235114D+03
0.00000000000000000D+000.00000000000000000D+000.52126223300564516D+03
Data Block - These lines define the points for string CECI as defined in the 080
line above. Each is in the format specified in the 001Format line, 3D23.17,which is 3 fields of 23 columns in double-precision format, and 17 places to the
right of the decimal point.
To end the data block defining this string’s points, a final data line is added with
the X and Y coordinates set to 0.000. The data in the 3rd column of this row is
of no concern other than the fact an appropriate value of the specified type must
be provided. In most cases, it will suffice to provide the same Z coordinate as
the preceding line (the last actual point on the string.)
In the example above, a string was created that consisted of a continuous series
of points. In many cases, you may want to create strings that have gaps in them(i.e. discontinuities). To represent the point on the beginning of a discontinuity
(gap), set the X value of that point to a negative value. The point representing
the end of a discontinuity (gap) should have the Y value set to a negative value.
Add a new “080” command to specify the new string.

8/10/2019 7010-0944 - SokkiaSSF_rm.pdf
http://slidepdf.com/reader/full/7010-0944-sokkiassfrmpdf 601/623
Roads Formats
P/N 7010-0944 A-37
999
999 - Tell MX to end the GENIO command.
Tekla XRoad & XStreet (VGP)
This format has the extension *.vgp.
Horizontal Elements
Every line starts with feature information with element information
following. Line’s mark combines from three characters: Road's
badge, alternative's badge, line's badge. KEYWORD is on every lineand after that the parameters.
Parameters are: c = text, inf = integer, f = decimal number; withcoordinates 4 decimals. Parameters are separated with spaces.
ROAD
Road's badge
TIE badge
c10
ROAD ALTERNATIVE
Alternative's badge
TIEVE badge
c10
LINE
Line's badge, description code (survey line, road's side etc), start sta
LINJA badge description start sta
c10 int f
ELEMENT
Element's informations are: Element's number; description code (for drawing) if
different than line's description code (if not, then 0), geometry (1 = straight, 2 =
circle, 3 = circular arch, 13 = circular arch over half circle, 4 = clothoid), start radius,
end radius, clothoid's parameter (a)
ELEM number description geometry r1 r2 a
int int int f f f
ELEMENT P1

8/10/2019 7010-0944 - SokkiaSSF_rm.pdf
http://slidepdf.com/reader/full/7010-0944-sokkiassfrmpdf 602/623
File Formats
Sokkia Spectrum Survey Field Reference ManualA-38
Element's start sta information: Element's number, start sta, x1, y1
ELEMP1 number start sta x1 y1
int f f f
ELEMENT P2
Element's end sta information: Element's number, end sta, x1, y1
ELEMP2 number end sta x1 y1
int f f f
ELEMENT CP
Circle's centre point's information: Element's number, x, y
ELEMCP number x y
int f f
Vertical Elements
ROAD
Road's badge
TIE badge
c10
ROAD ALTERNATIVE
Alternative's badge
TIEVE badge
c10
LINEZ
CL's badge, horiz line badge (stations)
LINJAZ badge hl badge
c10 c10
ELEMENTZ
Tangents intersections informations: point number, sta, z and radius between
tangents. With first and last the radius = 0.
ELEMZ number sta z radius
int f f f

8/10/2019 7010-0944 - SokkiaSSF_rm.pdf
http://slidepdf.com/reader/full/7010-0944-sokkiassfrmpdf 603/623
X-sect Templates Formats
P/N 7010-0944 A-39
Example:
X-sect Templates Formats
Cross section is defined by templates. Each template is stored in afile. A template file consists of a series of segments and each segmenthas a horizontal and a vertical component. The following sections
describe the formats used in the import/export of X-section Templatedata.
SSS Template
SSS Template format is as follows:
Template Record:
Template Name, 0, Cut, Fill
Segment Record:
Template Name, 1, Offset, Height[, Code]
Example:
SIMP,0,6.000,6.000
SIMP,1,1.000,0.000,1
NAME,0,4.000,4.000
NAME,1,1.000,-0.250,EP

8/10/2019 7010-0944 - SokkiaSSF_rm.pdf
http://slidepdf.com/reader/full/7010-0944-sokkiassfrmpdf 604/623
File Formats
Sokkia Spectrum Survey Field Reference ManualA-40
NAME,1,0.000,0.150,1
NAME,1,0.500,0.000,2
NAME,1,0.200,-1.000,3
NAME,1,0.300,0.000,4
TDS X-section Template
The following sample template file describes a cross section in twosegments.
Number of segments: 2, Cut slope: 0.500 %, Fill slope: 1.000 %
First segment: hd: 22.000 ft slope: -2.000 %
Second segment: hd: 2.000 ft vd: -2.000 ft
Example:
TH,2,0.500,1.000
TS,22.000,-2.000,0,roadbed
TS,2.000,-2.000,1,ditch
Definition of components in template file:
TH : Template Header format: TH,%d,%.3f,%.3f
Number of segments %d
Slope cut %.3f
Slope fill %.3f
TS : Template Segment format: TS,%.3f,%.3f,%c,%s Segment length %.3f
Vertical dist or %.3f
Slope %
Vertical flag %c (0-Slope % is infield 2
1-Vertical dist is in field 2)
Segment name %s

8/10/2019 7010-0944 - SokkiaSSF_rm.pdf
http://slidepdf.com/reader/full/7010-0944-sokkiassfrmpdf 605/623
Localization Format
P/N 7010-0944 A-41
TopSurv Template
TopSURV Template format is as follows:
Template Name, Code, Offset, Height
Example:
SIMP, 1, 1.000, 0.000
NAME, EP, 1.000, -0.250
NAME, 1, 0.000, 0.150
NAME, 2, 0.500, 0.000
NAME, 3, 0.200, -1.000NAME, 4, 0.300, 0.000
Localization Format
GC3
This is a binary file containing localization data.
Roads Survey Formats
The following sections describe the data formats used in the export ofroad raw data.
X-Section Surveys
The format is as follows:
chainage, offset, level [,code]
Example:
0.000,-4.501,18.527
0.000,-3.500,18.553
0.000,0.000,18.658,CL01
0.000,3.500,18.553
0.000,5.501,18.493

8/10/2019 7010-0944 - SokkiaSSF_rm.pdf
http://slidepdf.com/reader/full/7010-0944-sokkiassfrmpdf 606/623
File Formats
Sokkia Spectrum Survey Field Reference ManualA-42
12.669,-4.501,18.029
12.669,-3.500,18.059
12.669,-0.000,18.164,CL01
12.669,3.500,18.059
12.669,5.501,17.999
Find Station Report
The format is as follows:
FindChainageReport:
Reference road
FindChainage:
PointName Chainage Offset North East Elev [Cut]
Raw Data Formats
The following sections describe the formats used in the export of rawdata.
FC-5
Refer to the FC-5 interface manual to confirm details on FC-5 dataformat.
Example:_!SAMPLE_"SOMEONE_#GX0021_$06/01/
95_%24C_&990HP_'X1000_(_)1.200_+A001_ a+2755858d_ b0881003d
c+00010942m_*NS001_,1.200_+A002_ a+0006
3265752d_ b0952330d c+00003366m_*NS001_,1.200_+A003_ a+0420820d_
b0894549d c+00006913m_*NS001_,1.200_
1002
GTS-6
The data is GTS-6 and FC-5 unformatted data.
Refer to the GTS-6 interface manual to confirm details.

8/10/2019 7010-0944 - SokkiaSSF_rm.pdf
http://slidepdf.com/reader/full/7010-0944-sokkiassfrmpdf 607/623
Raw Data Formats
P/N 7010-0944 A-43
Example:
_!SAMPLE_"SOMEONE_#GX0021_$06/01/
95_%24C_&990HP_'X1000_(_)1.200_+A001_
?+00010942m0881003+2755858d+00010936***+**+**054_*NS001_,0064
1.200_+A002_
?+00003366m0952330+3265752d+00003351***+**+**063_*NS001_,1.200_
+A003_ ?+00006913m0894549+0420820d+00006912***+**+**1039
055_*NS001_,1.200_
2037
FC-6/GTS-7The format of the GTS-7 data is the same as the FC-6 data format.
The general format of each record is as follows:
CONTROL WORD field1 . . . . ,fieldn
Where:
CONTROL WORD is terminated by a space.
Fields 1 to n-1 are terminated by commas.
Field n is terminated by the end-of-line.
Each field may be preceded by a number of space characterswhich should be ignored but may contain spaces after the first
non-space character.
GTS-600 v3.1
JOB job name, description
DATE date, time
NAME surveyors name
INST instrument id
UNITS Meter/Feet, Degree/Gon
SCALE grid factor, scale factor, elevation
ATMOS temp, press
STN ptno, ins ht, stn id
XYZ X(easting), Y(northing), Z(elevation)

8/10/2019 7010-0944 - SokkiaSSF_rm.pdf
http://slidepdf.com/reader/full/7010-0944-sokkiassfrmpdf 608/623
File Formats
Sokkia Spectrum Survey Field Reference ManualA-44
BKB ptno, backsight bearing, backsight angle
BS ptno[, target height]
FS ptno, target height, pt code[,string number]
SS ptno, target height, pt code[,string number]
CTL control code[,pt code 2[,string no 2]](optional)
HV HA, VA
SD HA, VA, SD
OFFSET radial offset, tangential offset, vertical offset
PTL_OFF offset along ref. line, offset perpendicular to line,vertical offset
NOTE comments
MLM from point, to point, delta HD, delta VD, delta SD
RES_OBS ptno, target height, observation count
XYZ if present follows the STN recordBKB if present follows the BKB record or STN recordif no BKB.
CTL if present follows the FS or SS header record.
HV, SD or HD must follow a BS, FS or SS header and followsthe CTL if present.
OFFSET may follow any SD or HD record.
Example:
GTS-600 v3.1
JOB TEST1,TOPO COLLECTION
NAME FRED
INST GTS-7
UNITS M,D
STN 1,1.500,STN
SS 1001,1.500,BLDG,01
SD 0.0000,84.4650,9.746
SS 1002,1.500,BLDG,01

8/10/2019 7010-0944 - SokkiaSSF_rm.pdf
http://slidepdf.com/reader/full/7010-0944-sokkiassfrmpdf 609/623
Raw Data Formats
P/N 7010-0944 A-45
SD 0.0000,84.4650,9.746
SS 1003,1.500,BLDG,01
SD 0.0000,84.4650,9.747
SS 1004,1.500,BLDG,01
CTL CL
SD 359.1740,84.4650,9.747
SS 1005,1.500,NS
SD 359.1740,84.4650,9.747
SS 1006,1.500,NS
SD 359.1740,84.4650,9.747FS 2,1.500,NS
SD 179.1740,84.4650,9.747
STN 2,1.500,STN
GTS-600 v3.1
JOB TEST2, SET COLLECTION
NAME FRED
INST GTS-7
UNITS M,D
STN 1,1.500,STN
XYZ 1000.000,1000.000,100.000
BKB 2,315.0000,0.0000
BS 2,1.500
HV 344.0620,86.3810
FS 101,1.500,STN
SD 325.3420,88.4750,5.275
FS 102,1.500,STN
SD 7.0610,85.2210,9.914
FS 103,1.500,STN
SD 36.1350,87.3800,9.755
FS 104,1.500,STN
SD 83.4730,84.0410,3.313
FS 104,1.500,STN

8/10/2019 7010-0944 - SokkiaSSF_rm.pdf
http://slidepdf.com/reader/full/7010-0944-sokkiassfrmpdf 610/623
File Formats
Sokkia Spectrum Survey Field Reference ManualA-46
SD 263.4820,275.5530,3.313
FS 103,1.500,STN
SD 216.1430,272.2150,9.755
FS 102,1.500,STN
SD 187.0650,274.3730,9.916
FS 101,1.500,STN
SD 145.3520,271.1510,5.27
BS 2,1.500
HV 164.0640,273.2340
Land XML
LandXML is a standard data exchange format.
Refer to LandXML Website for details:
http://www.landxml.org/schema/landxml-1.0/Documentation/LandXMLDoc.htm
SurvCE RW5 FormatThis Carlson format is a comma delimited ASCII file containingrecord types, headers, recorded data and comments. The format isbased on the TDS RW5 raw data specification, with the exception ofangle sets.
Backsight Record
Record type: BK
Field headers:
OP - Occupy Point
BP - Back Point
BS - Backsight
BC - Back Circle
Sample(s):
BK,OP1,BP2,BS315.0000,BC0.0044
Job Record
Record type: JB
Field headers:
NM - Job Name

8/10/2019 7010-0944 - SokkiaSSF_rm.pdf
http://slidepdf.com/reader/full/7010-0944-sokkiassfrmpdf 611/623
Raw Data Formats
P/N 7010-0944 A-47
DT - Date
TM - Time
Sample(s):
JB,NMSAMPLE,DT06-27-2003,TM14:21:53
Line of Sight Record
Record type: LS
Field headers:
HI - Height of Instrument
HR - Height of Rod*
*GPS heights may be recorded to phase center or ARP depending on GPS make.Sample(s):
LS,HI5.000000,HR6.000000
LS,HR4.000000
Mode Setup Record
The mode setup will be recorded at the beginning of the raw data file.
Record type: MO
Field headers:
AD - Azimuth direction ( 0 for North, 1 for South)
UN - Distance unit (0 for feet, 1 for meter)
SF - Scale factor
EC - Earth Curvature (0 for off, 1 for on)
EO - EDM offset (inch)
Sample(s):
MO,AD0,UN0,SF1.00000000,EC1,EO0.0,AU0
Occupy Record
Record type: OC
Field headers:
OP - Point Name
N - Northing (the header is N space)
E - Easting (the header is E space)
EL - Elevation-- - Note
Sample(s):
OC,OP1,N 5000.00000,E 5000.00000,EL100.000,--CP

8/10/2019 7010-0944 - SokkiaSSF_rm.pdf
http://slidepdf.com/reader/full/7010-0944-sokkiassfrmpdf 612/623

8/10/2019 7010-0944 - SokkiaSSF_rm.pdf
http://slidepdf.com/reader/full/7010-0944-sokkiassfrmpdf 613/623
Raw Data Formats
P/N 7010-0944 A-49
CE - Change Elevation
(one of the following)
SD - Slope Distance
HD - Horizontal Distance
-- - Note
Sample(s):
TR,OP1,FP4,AR90.3333,ZE90.3333,SD25.550000,--CP
SS,OP1,FP2,AR0.0044,ZE86.0133,SD10.313750,--CP
BD,OP1,FP2,AR0.0055,ZE86.0126,SD10.320000,--CP
BR,OP1,FP2,AR180.0037,ZE273.5826,SD10.315000,--CP
FD,OP1,FP3,AR57.1630,ZE89.4305,SD7.393000,--CP
FR,OP1,FP3,AR237.1612,ZE270.1548,SD7.395000,--CP
GPS
Record type: GPS
Field headers:
PN - Point Name
LA - Latitude (WGS84)LN - Longitude (WGS84, negative for West)
EL - Ellipsoid elevation in meters*
-- - Note
*GPS heights may be recorded to phase center or ARP depending on GPS make.
Sample(s):
GPS,PN701,LA42.214630920,LN-71.081409184,EL-21.8459,--C
P /Brass Disk
TDS RawData
Example:
JB,NMA_meas,DT03-15-02,TM15:17:53
MO,AD0,UN1,SF1.000000,EC0,EO0.0000
SP,PN1,N 90.0000,E 200.0000,EL 50.0000,--manOC,OP1,N 90.0000,E 200.0000,EL 50.0000,--man
LS,HI1.0100,HR0.0000
--user has entered the following Azimuth
BK,OP1,BP2,BS0.0000,BC65.4618

8/10/2019 7010-0944 - SokkiaSSF_rm.pdf
http://slidepdf.com/reader/full/7010-0944-sokkiassfrmpdf 614/623
File Formats
Sokkia Spectrum Survey Field Reference ManualA-50
--SS,OP1,FP2,AR65.4618,ZE102.0935,SD4.7720,--DOOR
LS,HI1.0100,HR2.5600
SS,OP1,FP3,AR61.1834,ZE84.2723,SD6.5740,--BEN
MOSS Survey
Both traverse and detail raw data formats can be exported.Example:
SURVEY D:\J0119A
017,DMS
190,,,DECR,0900000
180,,,9000,,1000.000,1000.000,0.000
200,9000,9001,SDVA,3595958,,,1.600,,1.000000
201,,,PT01,0103620,14.194,0870623,0.000,,,1001
201,,,PT01,1333115,10.386,0880200,0.000,,,1002
201,,,PT02,2872920,9.187,0901702,0.000,,,1003
201,,,PT02,3350057,15.887,0871812,0.000,,,1004
201,CD2,02,PP01,0103555,14.196,0870649,0.000,,,1005
201,CD2,03,PP01,1333053,10.392,0880209,0.000,,,1006
201,,,P101,2872902,9.187,0901634,0.000,,,1007201,,,P101,3350118,15.886,0871727,0.000,,,1008
999
FINISH
Field Book
Field Book files are text files that contain the observed point data.Data from a data collector can be exported to a Field Book file to
import into a drawing and project.
Example (for GPS data):
!NOTE Start Survey Date/Time DT07-30-2007,TM19:08:23
NOTICE
TopSURV can import/export localization datafrom/to this file and can only export GPS and TSobservations.

8/10/2019 7010-0944 - SokkiaSSF_rm.pdf
http://slidepdf.com/reader/full/7010-0944-sokkiassfrmpdf 615/623
Raw Data Formats
P/N 7010-0944 A-51
!NOTE End Survey Date/Time DT07-31-2007,TM18:35:21
UNIT FOOT DMS
HORIZ ANGLE RIGHT
PRISM CONSTANT 0
PRISM OFFSET 0
EDM OFFSET 0
CR OFF
TEMP 20 C
PRESSURE 1013.300 MM
COLLIMATION OFF
JOB gr3r
VERT ANGLE ZENITH
NEZ 999 9950.370 10012.484 1202.250 "BASE"
NEZ 1000 10000.000 10000.000 1200.000 "SSB"
NEZ 1001 10270.261 10001.970 1193.982 "SSB"
NEZ 1002 10330.897 10227.397 1193.548 "5/8"
NEZ 1003 10288.979 9594.926 1192.965 "SSB"
NEZ 1004 9998.380 9593.835 1193.349 "1/2"
NEZ 1005 7698.778 12840.197 1209.085 "5/8"NEZ 1 10029.789 10076.702 1199.442 "TP"
NEZ 2 9756.259 10244.498 1199.587 "TP"
Example (for TS data):
!NOTE Start Survey Date/Time DT08-23-2005,TM02:40:28
!NOTE End Survey Date/Time DT08-24-2005,TM20:11:01
UNIT FOOT DMS
HORIZ ANGLE RIGHTPRISM CONSTANT 0
PRISM OFFSET 0
EDM OFFSET 0
CR OFF
TEMP 68 F
PRESSURE 760.037 MM
COLLIMATION OFF
JOB OFFICE
VERT ANGLE ZENITH
NEZ 107 0.000 0.000 100.000
STN 107 0.000
NEZ 108 0.000 0.000 100.000

8/10/2019 7010-0944 - SokkiaSSF_rm.pdf
http://slidepdf.com/reader/full/7010-0944-sokkiassfrmpdf 616/623
File Formats
Sokkia Spectrum Survey Field Reference ManualA-52
AZ 107 108 0.000000
BS 108
PRISM 0.000000
END
AD VA 108 359.594000 00.000 51.580000 "AZMK"
END
F1 VA 102 61.310500 10.740 60.515000
F1 VA 103 35.332500 7.800 65.022000
F1 VA 104 359.583000 8.440 51.573500
AZ 107 102 61.312500
BS 102
PRISM 0.000000
END
AD VA 102 61.323500 00.000 51.582000 "AZMK"
END
AZ 107 104 359.585000
BS 104
PRISM 0.000000
END! BS Circle Check : angular err= 0.000
! BS Circle Check : angular err= 0.000
AD VA 104 61.323500 00.000 51.582000 "AZMK"
END
AZ 107 10001 359.585000
BS 10001
PRISM 0.000000
END
AD VA 103 93.430000 00.000 77.232500 "AZMK"
END
F1 VA 106 86.192000 12.240 86.512500
Berlin GNSS
This format is a German format that consists of two separate files ofquality report: GNSS-Messprotokoll and GNSS-Mittelwerte.

8/10/2019 7010-0944 - SokkiaSSF_rm.pdf
http://slidepdf.com/reader/full/7010-0944-sokkiassfrmpdf 617/623
Scanning Data Format
P/N 7010-0944 A-53
Scanning Data Format
Scanning data includes an orientation file, control points for
orientation and Camera calibration file for DI-3000.
DI-3000
Project:
Header(FIELD_SCAN_FSC_FILEVER1.0)
*Text Format
Orientation Information File:
Name of Image
Size of Image Width[pixel] Height[pixel]
Number of Image Coordinates of Orientation Points
Image coordinates of Orientation point:
: Point Name,X,Y
*Text Format
Control Point(Terrain) For Orientation File:
Point Name,X,Y,Z
*CSV Text Format
Results of Orientation Calculation(Single Orientation):
ERR MAX,X Maximum Error,Y Maximum Error, 0.000000
ERR RMS,X Standard Dev[Pixel],Y Standard Deviation[Pixel], 0.000000
Discrepancy of each orientation point[Pixel]
*Text Format
Camera Calibration For Digital Camera:
7.955772 // focal length [mm]
1.866217 // x of principal point [m]

8/10/2019 7010-0944 - SokkiaSSF_rm.pdf
http://slidepdf.com/reader/full/7010-0944-sokkiassfrmpdf 618/623
File Formats
Sokkia Spectrum Survey Field Reference ManualA-54
1.375943 // y of principal point [m]
2 // distortion model
4 // number of distortion parameters
3.596956e-003 // distortion parameter 1
-1.414950e-004 // distortion parameter 2
-1.786501e-004 // distortion parameter 3
4.303863e-004 // distortion parameter 4
0.005600 // x resolution [mm/pixel]
0.005600 // y resolution [mm/pixel]
0 // number of fiducial marks0 // number of radial distortion values
*Text Format
Setting Information:
Instrument Point,X,Y,Z
Backsight Point,X,Y,Z
mh 0.0000 0.0000 IH(Instrument Height)
*Text Format
Point Clouds(Scanning Data):
Header(SFILE_VER01)
point name,X,Y,Z,Wide Image name,Tele Image Name,,Layer Name,Point Attribute
*Binary Format(Fix)
Point Clouds(Scanning Data):
point name,X,Y,Z,Layer Name
*CSV Format
Job History
Job history can be exported to the CSV file or text report.

8/10/2019 7010-0944 - SokkiaSSF_rm.pdf
http://slidepdf.com/reader/full/7010-0944-sokkiassfrmpdf 619/623
Job History
P/N 7010-0944 A-55
CSV
All job history data are represented in text format with comma
separated values.
Report
In the current version only resection data are output.
The completed resection measurements prints out or writes to a file inthe order of measuring. Also, all changes made when editing raw data
are visible in the report file.Example:
+++ TopSURV Version 5.04 +++ Date, Time
====================
Resection
====================
Job : Job-Name
Occ-point name : PPPPPPPPPP (E: EEEEEEE.EEEE[m], N:NNNNNNN.NNNN[m], Z: ZZZZ.ZZZZ[m])
Instr. height : ii.iiii[m]
Surveyor : name
Temperature : TT.T[°C]
Pressure : xxx (mmHg)
Date/Time : JJJJ-MM-DD HH:MM:SS
Dim-Type : 2D or 3D
Orientation : ggg.gggg[gon] (Standarddev.: dg.gggg[mgon])
OCC.Std.deviation : dE: dE[mm] dN: dN[mm] dZ: dZ[mm]
Scale : fix/calculated 1.00000000
Backbearing-Name Hz [gon] V [gon] SD [m] dHz[mgon] dV[mgon] dS[m]
tH[m]
East [m] North [m] Height [m] dE[m] dN[m] dZ[m]
USE(HVSD)
------------------------------------------------------------------------------------------
BKB1pppppppppppp HHH.HHHH VVV.VVVV DDDD.DDDD dH.HHHH
dV.VVVV dS.SSS t.ttt

8/10/2019 7010-0944 - SokkiaSSF_rm.pdf
http://slidepdf.com/reader/full/7010-0944-sokkiassfrmpdf 620/623
8/10/2019 7010-0944 - SokkiaSSF_rm.pdf
http://slidepdf.com/reader/full/7010-0944-sokkiassfrmpdf 621/623
Index
P/N 7010-0944 Index
AAlarms 9
Alignment 2
Attribute 16
CCode 16
COGO
intersection 14
two point inverse 4
Configuration
GPS+ configuration 3survey configuration 3
TS configuration 51
Control code 7
Co-Op tracking 48
Coordinate system 5, 72, 18
Cross Section Templates 27
DDatum 5, 72
Degree of chord 12
Degree of curve 12
Distance averaging 64
EElevation mask 7, 21, 14
Exportto device 10
to job 2
FFeature 16
Find station 27
GGPS+
GPS+ status 12
start base 2
HHAL 7
circular arc 12
intersection point 2, 14line 11
spiral 13
IImport
from file 13, 14
from job 2
JJob
job list 10
new job 2
open job 10
select job 2
LLocalization 8
MMissing line 31
mmGPS 4, 39
Modem
GSM 13
Multipath reduction 48
OObservation mode 1
Offset
hidden point 16
Offsets
sideshots 9
topo survey 9
PPattern 60
Point guide 64

8/10/2019 7010-0944 - SokkiaSSF_rm.pdf
http://slidepdf.com/reader/full/7010-0944-sokkiassfrmpdf 622/623
Index
7010-0944Index
Points 2
Post processing
kinematic 5
static 5Prism constant 64
Projection 5, 72, 74
RRaw data 37
Receiver
base receiver 7, 21
Reference direction 45
Road 2
Rover known point 34
RTK 4
SScan range 61
Sensitivity 61
Sideshot 4
Signal-to-noise ratio 21Slope 27
Stakeout
angle sequence 63
line (GPS+) 14
meas method 62
point & direction 35
point (GPS+) 2
road 49
slope 46, 53Stakeout parameters
for GPS+ 44
for Total Station 66
Survey
auto topo 18
backsight survey 2
topo 2
Survey parameters
for GPS+ 41
for Total Station 62
TTape dimension 29
reference line 29
Tolerances 63
Total Station
models 54Track speed 61
UUnits
angle units 7
distance units 6
pressure 7
temperature 7
VVAL 24
elements 17
long section 17
vertical grade 22
XX-section 29, 25
cut and fill 27
template 26

8/10/2019 7010-0944 - SokkiaSSF_rm.pdf
http://slidepdf.com/reader/full/7010-0944-sokkiassfrmpdf 623/623