Embed Size (px)
Citation preview
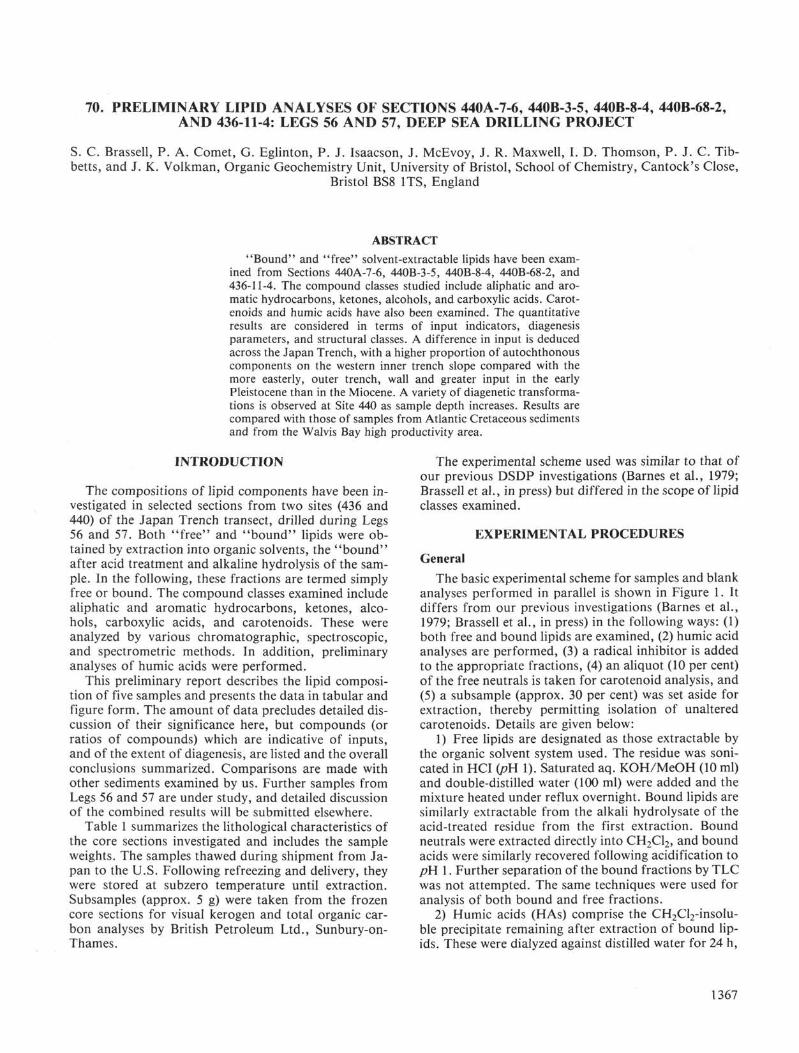
70. PRELIMINARY LIPID ANALYSES OF SECTIONS 440A-7-6, 440B-3-5, 440B-8-4, 440B-68-2,AND 436-11-4: LEGS 56 AND 57, DEEP SEA DRILLING PROJECT
S. C. Brassell, P. A. Comet, G. Eglinton, P. J. Isaacson, J. McEvoy, J. R. Maxwell, I. D. Thomson, P. J. C. Tib-betts, and J. K. Volkman, Organic Geochemistry Unit, University of Bristol, School of Chemistry, Cantock's Close,
Bristol BS8 ITS, England
ABSTRACT
"Bound" and "free" solvent-extractable lipids have been exam-ined from Sections 440A-7-6, 440B-3-5, 440B-8-4, 440B-68-2, and436-11-4. The compound classes studied include aliphatic and aro-matic hydrocarbons, ketones, alcohols, and carboxylic acids. Carot-enoids and humic acids have also been examined. The quantitativeresults are considered in terms of input indicators, diagenesisparameters, and structural classes. A difference in input is deducedacross the Japan Trench, with a higher proportion of autochthonouscomponents on the western inner trench slope compared with themore easterly, outer trench, wall and greater input in the earlyPleistocene than in the Miocene. A variety of diagenetic transforma-tions is observed at Site 440 as sample depth increases. Results arecompared with those of samples from Atlantic Cretaceous sedimentsand from the Walvis Bay high productivity area.
INTRODUCTION
The compositions of lipid components have been in-vestigated in selected sections from two sites (436 and440) of the Japan Trench transect, drilled during Legs56 and 57. Both "free" and "bound" lipids were ob-tained by extraction into organic solvents, the "bound"after acid treatment and alkaline hydrolysis of the sam-ple. In the following, these fractions are termed simplyfree or bound. The compound classes examined includealiphatic and aromatic hydrocarbons, ketones, alco-hols, carboxylic acids, and carotenoids. These wereanalyzed by various chromatographic, spectroscopic,and spectrometric methods. In addition, preliminaryanalyses of humic acids were performed.
This preliminary report describes the lipid composi-tion of five samples and presents the data in tabular andfigure form. The amount of data precludes detailed dis-cussion of their significance here, but compounds (orratios of compounds) which are indicative of inputs,and of the extent of diagenesis, are listed and the overallconclusions summarized. Comparisons are made withother sediments examined by us. Further samples fromLegs 56 and 57 are under study, and detailed discussionof the combined results will be submitted elsewhere.
Table 1 summarizes the lithological characteristics ofthe core sections investigated and includes the sampleweights. The samples thawed during shipment from Ja-pan to the U.S. Following refreezing and delivery, theywere stored at subzero temperature until extraction.Subsamples (approx. 5 g) were taken from the frozencore sections for visual kerogen and total organic car-bon analyses by British Petroleum Ltd., Sunbury-on-Thames.
The experimental scheme used was similar to that ofour previous DSDP investigations (Barnes et al., 1979;Brassell et al., in press) but differed in the scope of lipidclasses examined.
EXPERIMENTAL PROCEDURES
General
The basic experimental scheme for samples and blankanalyses performed in parallel is shown in Figure 1. Itdiffers from our previous investigations (Barnes et al.,1979; Brassell et al., in press) in the following ways: (1)both free and bound lipids are examined, (2) humic acidanalyses are performed, (3) a radical inhibitor is addedto the appropriate fractions, (4) an aliquot (10 per cent)of the free neutrals is taken for carotenoid analysis, and(5) a subsample (approx. 30 per cent) was set aside forextraction, thereby permitting isolation of unalteredcarotenoids. Details are given below:
1) Free lipids are designated as those extractable bythe organic solvent system used. The residue was soni-cated in HCI (/?H 1). Saturated aq. KOH/MeOH (10 ml)and double-distilled water (100 ml) were added and themixture heated under reflux overnight. Bound lipids aresimilarly extractable from the alkali hydrolysate of theacid-treated residue from the first extraction. Boundneutrals were extracted directly into CH2C12, and boundacids were similarly recovered following acidification topH 1. Further separation of the bound fractions by TLCwas not attempted. The same techniques were used foranalysis of both bound and free fractions.
2) Humic acids (HAs) comprise the CH2Cl2-insolu-ble precipitate remaining after extraction of bound lip-ids. These were dialyzed against distilled water for 24 h,
1367

S. C. BRASSELLETAL.
TABLE 1Samples from Holes 440A, 440B, and 436
Hole Core SectionInterval
(cm)
Sub-bottomDepth(m)a
Age(m.y.B.P.)a Lithologya
Dry Wt.(g)
OrganicCarbon
440A
440B
440B
440B
436
7
3
8
68
11
6
5
4
2
4
125-150
125-150
125-150
130-150
100-120
139
166
212
779
99
Lower Pleistocene(approx. 1)
Lower Pleistocene(approx. 1)
Lower Pleistocene(approx. 1)
Upper Miocene(approx. 6)
Pliocene(approx. 2)
Olive gray, firm, homogeneous, diatomaceous 50 1.05silty clay intercalated with patches of spongefragments
Olive gray, firm, homogeneous, diatomaceous 48 1.0clay, slightly calciticSlightly streaked and mottled grayish olive 97 0.5diatomaceous clay/grayish olive siltyclay stone
Dark, greenish gray silty clay stone 61 0.4
Dusky yellowish green, moderately deformed 65 0.35diatomaceous vitric clay
aFrom site reports including data for Holes 440A, 440B, and 436, this volume, Pt. 1."Data obtained from subsample analysis by British Petroleum Co., Ltd.
Sediment
CH2CI2/Me0H
Insoluble Soluble
Residue
(1) Acid treatment(2) Alkaline hydrolysis
FreeLipids
Hydrolysate(bound lipids)
Free FattyAcids
FreeNeutrals
CH2CI2 extraction
Insoluble Soluble
(1) Acidification(2) CH2CI2 extraction
Precipitate Bound FattyAcids
Humic Acids
Methy-lation
BoundFAME
Methylation TLC
BoundNeutrals
FreeFAME
Hydrocarbons
TLC
Alkanes/ Aromatics "Polars" Ketones Alcohols "Polars"Alkenes (some long-
chain ketones)
Figure 1. Experimental scheme.
then freeze-dried. Elemental analyses were performedfor C, H, N, S, and O (by difference) and the inorganicresidue weighed. Visible spectra were recorded for 0.01per cent w/v solutions in 0.1 M KOH solution, using anSP 1800 Unicam spectrophotometer and 10-mm cells.
Infrared spectra were recorded on a Perkin Elmer 580infrared spectrometer. HAs (2 mg) dispersed in predriedKBr (300 mg) were pressed to pellet form. A blank pelletwas run to check the absence of absorption due tomoisture.
3) The radical inhibitor 2,6-di-t-butyl-4-methyl-phenol was added to the hydrocarbon fractions tostabilize certain compounds, e.g. diasterenes.
4) An aliquot (10 per cent v/v) of the free neutralfraction was examined by ultraviolet/visible (uv/vis)spectrophotometry and by HPLC. Both continuous andstopped-flow scans were recorded.
5) The subsample of 440A-7-6 was extracted in theusual manner and esterified (CH2N2). HPLC and uv/visanalyses of the total and fractionated materials are be-
1368
LIPID ANALYSES
ing performed to determine unaltered carotenoid dis-tributions.
Precautions were taken at all stages to minimize con-tamination, as reported previously (Barnes et al., 1979)In particular, it was necessary to predevelop TLC platesexhaustively.
Gas chromatography (GC) was performed on a Car-lo Erba 2150 gas chromatograph, equipped with a 20-mSE-52 glass capillary column (0.25-mm inside diameter)and He as carrier gas. The instrument was temperatureprogrammed at 4°C min.~1 from 50-275°C, followedby up to 30 min. isothermal running. Further analysesof chosen fractions were carried out on a 12-m OV-1glass capillary column (100-280°C at 4°C min."1)-
Mass spectra were recorded using a Finnigan 4000 gaschromatograph-mass spectrometer (GC-MS) systemequipped with either 20-m or 12-m OV-1 WCOT glasscapillary columns. Data acquisition and processing wereperformed by a PDP 8e computer. Typical operatingconditions were ion source temperature 250°C, electronenergy 35 eV, and filament current 350 µA.
The HPLC equipment used has been previously de-scribed (Brassell et al., in press). For carotenoid analy-sis, eluant absorbance was monitored at 451 nm, withthe uv/vis spectra of individual peaks absorbing at thiswavelength recorded by stopped-flow scanning. An ace-tone:hexane gradient system was programmed tochange quadratically from 2:98 to 75:25 over 30 min.
RESULTS
General
All samples were free of visible pipe dope contamina-tion. The blank analyses performed in parallel with thesamples did not contain significant amounts of lipid ex-cept for squalene, which is presumed to come from theTLC plates.
Structural assignments were based on (1) GC reten-tion times, (2) comparison of mass spectra with those ofauthentic standards (where available), or literature spec-tra, (3) spectral interpretation, or (4) mass fragmentog-raphy (MF) of diagnostic ions for homologous or pseu-dohomologous series. GC coinjections were performedwhen possible, particularly for aromatic hydrocarbonsand the very long chain ketones. Quantitations weremade by measurement of GC or MF peak areas andcomparison with the response of components of knownquantity. A major difficulty hindering accurate quan-titation was the presence of some compounds (e.g., verylong chain ketones in Section 440B-8-4) in more thanone fraction after TLC separations.
Other errors inherent in the quantitation arise frommeasurements of peak areas and GC injection volumes,fluctuations in instrument sensitivity, and spectrumskewing in GC-MS analyses. The last phenomenon,which creates mass spectral distortion, occurs when themass spectrometer scan rate is of the same order ofmagnitude as the GC peak width. Quantitation fromMF will be particularly affected by spectrum skewing,introducing underestimations of perhaps 20 per centfor individual components. In general, quantitation of
an individual class of compound is internally consis-tent, but comparison of the concentrations of differentclasses may not give a true representation of their rel-ative amounts. Indeed, without the use of an internalstandard for each compound class, such accuracy is dif-ficult to achieve.
The results for each compound class are described in-dividually in the following.
Aliphatic Hydrocarbons
NormalThe major class of hydrocarbon in all five samples is
«-alkane, dominated by n-C29 (Figure 2). The amountof n-C1A in Section 436-11-4 is anomalously high, prob-ably because of contamination from the n-C24 used as astandard in the preliminary separation of free neutrallipids by TLC. The carbon preference indices (CPI) forselected carbon number ranges are given in Table 2.
The odd-numbered w-alkanes in the range C23 to C35dominate, with their dominance least marked in Section440B-68-2. The amounts of C15 to C2] /?-alkanes arelower relative to n-C29 in Section 436-11-4 than in thesamples from Site 440, particularly Section 440B-68-2.The total amounts of /7-alkanes in Sections 440A-7-6and 440B-3-5 are similar and higher than those of Sec-tions 440B-8-4, 440B-68-2, and 436-11-4. Sections440A-7-6, 440B-3-5, and 440B-8-4 closely resemble oneanother in their distributions.
The distributions showed no obvious signs of con-tamination from pipe dope or other shipboard sources.The presence of a "hump" in the alkane/alkene frac-tion of Sections 440B-8-4 and 440B-68-2 did, however,suggest that these particular samples might containminor contributions from shipboard oil-based contam-inants.
MF searches of m/e 83 showed that «-alkenes werenot present in any of the samples.
Branched/CyclicNo significant amounts of simple branched alkanes
or alkenes, such as 7-methylheptadecane, were detectedin any of the samples by MF searches (e.g., of m/e 85).
The concentrations of acyclic isoprenoid alkanes andalkenes are given in Table 3. The pristane-to-phytaneratio of each sample is also shown. Each componentwas recognized from its mass spectrum and GC reten-tion time.
The relative amounts of pristane and phytane aremarkedly lower in Section 436-11-4 than in the othersamples, whereas the content of 2,6,10,15,19-penta-methyleicosane (I) and squalane (II) are similar. Section440B-8-4 is the only sample that contains a higher pro-portion of the C25 isoprenoid alkane than squalane. Sec-tions 440A-7-6 and 440B-3-5 possess similar isoprenoidalkane distributions, and both contain greater propor-tions of pristane and phytane than of C25 and C30isoprenoids, unlike the other sections, in which one orboth of the latter components predominate.
The pristane to phytane ratio shows no definite trendwith depth at Site 440.
1369

S. C. BRASSELLETAL.
TABLE 2Normal Alkane Carbon Preference Indices
50
c
. 1 1 . 1
15
D
. . I | . I
10
LU
>
I . 1
15
15 25
Carbon Number
35
Figure 2. Abundance (ng/g dry sediment) of n-alkanesfrom C15 to C35. A. Section 440A-7-6; B. Section 440B-3-5; C. Section 440B-8-4; D. Section 440B-68-2; E.Section 436-11-4. (* =n-C24 contamination from TLCstandard.)
Section
440A-7-6440B-3-5440B-8-4440B-68-2436-11-4
Carbon
15-21
1.221.160.941.210.94
Number Range
22-35
3.403.743.541.963.66a
15-35
2.692.532.501.702.84a
aTrue H-C24 concentration assumedequal to n-C22> to minimize distortiondue to contamination (see text).
TABLE 3Abundance of Acyclic Isoprenoid Alkanes/Alkenes
(ng/g dry sediment)
Component
pristanephytanephytenea
phytenea
phytenea
2,6,10,15,19-pentamethyleicosanesqualanepristane/phytaneratiob
440A-7-6
4.23.50.76.59.7
1.5
2.8
1.2
440B-3-5
6.24.90.86.0
10.7
1.9
3.1
1.2
Section
440B-8-4
0.51.0Tr0.20.4
1.7
0.9
0.49
440B-68-2
0.80.9Tr0.10.3
1.4
1.7
0.85
436-11-4
0.30.4n.d.n.d.n.d.
0.3
0.6
0.77
Note: Tr = trace amounts of compound (<O.l ng/g dry wt. sedi-ment), n.d. = not detected.
aphytene isomers, double bond position not assigned,bpristane/phytane ratio calculated directly from GC response.
The quantity of phytenes is considerably greater inthe upper two sections of Site 440 than in the lower twosamples, with the major isomers more abundant thanpristane or phytane. The amounts of the individual phy-tene isomers in Sections 440B-8-4 and 440B-68-2 aretoo small to determine whether there is a trend in therelative proportions of each isomer with increasingdepth. No phytenes were detected in Section 436-11-4.
Steranes were identified in similar concentrations anddistributions in Sections 440B-8-4 and 440B-68-2 bymass spectral interpretation and from MF of m/e 217(Table 4). Steranes were present in only trace quantitiesin the shallower Site 440 samples and were not detectedin Section 436-11-4. The 5α configuration was assignedfor a series of C27 to C2g components on the basis of them/e 149-to-m/e 151 ratio and GC retention times. Asecond unknown series of C27 to C2g steranes, elut-ing before their 5α counterparts, was observed.
4-methyl steranes were not detected by MF (m/e 231)in any of the samples. Neither diasteranes nor 4-methyldiasteranes were detected in any of the sections by MFsearches of m/e 259 and m/e 273, respectively.
The major sterenes (mono-, di-, tri- and tetraun-saturated) were identified by mass spectral comparisonwith authentic standards or by spectral interpretation.In addition, MF of diagnostic ions (m/e 213, 215, 255,
1370

LIPID ANALYSES
TABLE 4Concentration of Steranes (ng/g sediment)
Compound
C27-sterane5α-cholestaneC28•sterane24-methyl-5α-cholestaneC29-sterane24-ethyl-5α-cholestane
R
III, HbIII, HIII.CHj
III, CH 3
III, C2H°
Π I , C 2 H 5
440B-S
0.20.40.3
0.3
0.2
0.4
Section
i-4 440B-68-2
0.2
0.20.2
0.2
0.2
0.4
General structures; individual peaks not assigned tothis or any other isomer.Unknown series.
and 257) was used for comparison and quantitation.Sterenes are relatively minor constituents of all Site 440sections (Table 5; Figure 3). Only trace quantities ofsterenes were detected in Section 436-11-4.
The sterene distributions in Sections 440A-7-6 and440B-3-5 are similar and possess markedly greater pro-portions of tetra- and triunsaturated sterenes relative toSections 440B-8-4 and 440B-68-2. The overall concen-trations of sterenes in the two deeper sections are con-siderably lower than in the two shallower samples(Figure 3). The major component in three of them is aΔ22-24-methylcholestatriene with two nuclear doublebonds. No 4-methyl sterenes were detected in any of thesamples by MF (especially m/e 229).
A series of diasterenes (rearranged sterenes) wasassigned in all Site 440 sections by MF of m/e 257 andcomparison with Leg 50 sample data (Brassell et al., inpress). The concentrations, calculated from MF (m/e257), are given in Table 6. No diasterenes were detectedin Section 436-11-4.
TABLE 5Concentration of Sterenes (ng/g dry sediment)a
Section
Compound*5
1. C 27 3 (mixed)
2. C 2 7 2 N, ΔSC
3. C 2 7 Δ 2
4. C 2 7 Δ3,5
5. C 2 8 2 N, 22
6. C 2 8 2 N, Δ24(28)
7. C 2 8 2
8. C 2 8 ΔN, 24(28)
9. C 2 8 4
10. C 2 8 2 N, Δ24(28)
11. C 2 8 3,5
1 2. C 2 9 2 N, Δ24(28)
1 3. C 2 9 2 N
14. C 2 9 Δ 2
15. C 2 9 3,5
Formula
C27H42
C27H42
C27H46
C 2 7H44
C 28 H 44
C 2 8 H 4 4
C 28 H 48
C28H46C 28 H 42C 28 H 44
C 28 H 46C 29 H 46C 29 H 48c 2 9 H 5 0
C 2 9 H 4 8
Structure0
R
IV, H
IV, H
IV, H
IV, H
IV, CH3
IV,CH3
IV, CH3
IV.CH3
IV,CH3
IV,CH3
IV,CH3
IV, C 2 H 5
IV,C 2 H 5
IV,C 2 H 5
IV,C 2 H 5
440A-7-6
0.4
0.4
0.8
0.7
1.7
1.2
0.6
1.2
0.9
1.5
0.2
0.2
0.3
0.7
0.6
440B-3-5
0.2
0.5
0.8
0.9
2.1
1.6
0.9
1.2
0.5
1.3
0.3
0.3
0.5
0.8
0.8
440B-8-4
Tr
0.2
0.1
0.3
0.4
0.8
0.2
Tr
n.d.
Tr
0.1
Tr
Tr
0.4
0.2
440B-68-2
n.d.
Ti
0.1
0 2
0.3
Tr
Tr
Tr
n.d.
Tr
Tr
Tr
Tr
Tr
0.2
Figure 3. Abundance (ng/g dry sediment) of sterenes. A.Section 440A-7-6; B. Section 440B-3-5; C. Section440B-8-4; D. Section 440B-68-2. (Bar numbers referto Table 5; * = presence in trace amount [< 0.1 ng/g]only.)
TABLE 6Concentration of Rearranged Sterenes (ng/g dry sediment)a
Section
Formula
C27H46C27H46C27H46C27H46C 28 H 48C 28 H 48C28H48c 29 H 50C 28 H 48C28H48C29H50C29H5Oc 29 H 50
Structure,bR
V, HV, HV, HV, HV, CH3V, CH3V, CH3V, C 2 H 5
V, CH3V, CH3V,C 2 H 5
V, C 2 H 5
V, C 2 H 5
MolecularWeight
370370370370384384384398
384384398398398
440A-7-6
n.d.Tr
n.d.0.10.1
n.d.Tr
0.1
n.d.0.20.2
Tr
440B-3-5
Tr
0.10.10.40.20.10.1
0.4
0.10.20.7Tr
440B-8-4
n.d.
TrTr0.1TrTrTr
0.1
Tr0.10.2Tr
440B-68-2
Tr0.]
Tr0.20.20.10.1
0.3
0.10.20.4
0.1
Note: For explanation of Tr and n.d., see Note to Table 3.
?Quantitated from MF of diagnostic ions.First number refers to histogram bar, Figure 3. Nomenclature: double bond posi-tions assigned where possible. Otherwise, Δ^ and SC indicate double bonds innucleus or side chain, respectively (see IV).
cSee Appendix, this chapter.
Note: For explanation of Tr and n.d. see Note to Table 3.ang/g dry wt. sediment, quantitated from MF of m/e 257.^General structure; C-20 stereochemistry not determined (see Appendix,
this chapter).
Section 440B-3-5 possesses the highest concentrationof diasterenes, whereas Section 440B-68-2 is the onlysample in which diasterenes are present in higher con-centrations than sterenes.
MF of m/e 271, diagnostic of 4-methyl diasterenes,suggested that trace quantities were present only in Sec-tion 440B-68-2. No full spectra of these componentswere obtained and their assignment remains tentative.
1371
S. C. BRASSELLETAL.
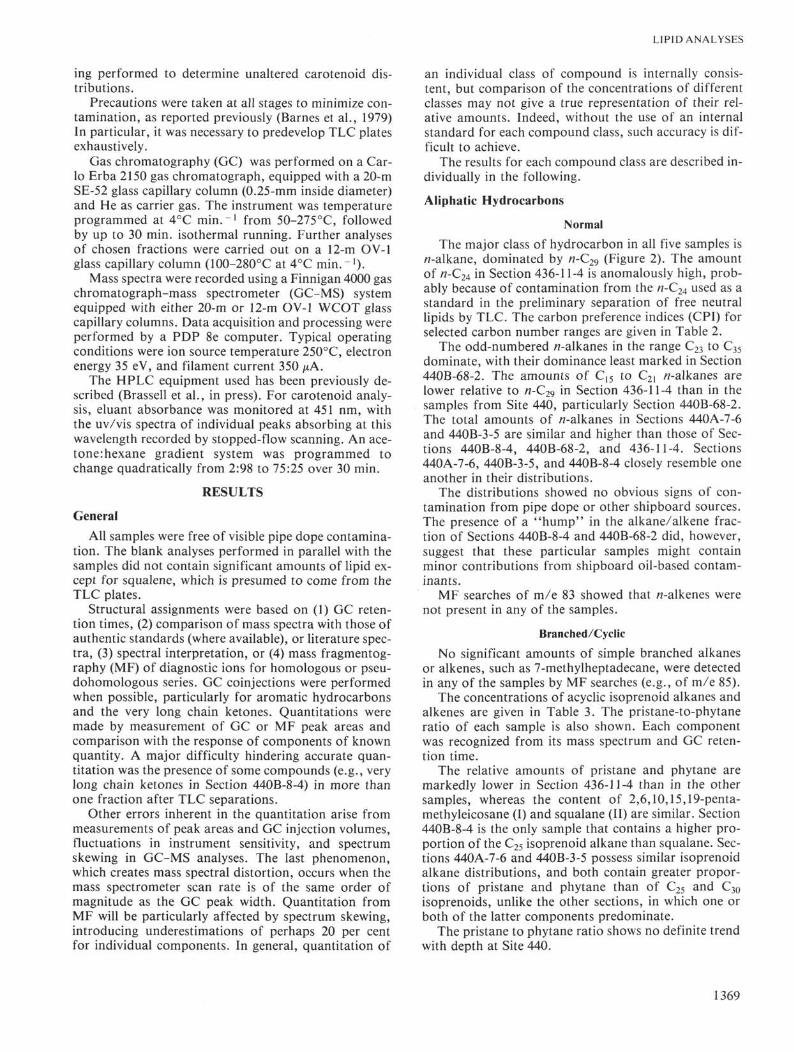
Figure 4 shows the distribution of the major hopanesand hopenes (VI, VII, and VIII) recognized from theirspectra, MF of key ions (m/e 191, m/e 189, m/e 177,m/e 205, m/e 231, and molecular ions), and GC reten-tion characteristics. In addition to these, several minorcomponents were observed by MF (particularly m/e191). These included other C30 triterpenes (M+ 410)which were not fernenes (see the following), adianenes,or filicenes.
The major differences between the samples are asfollows: (1) Section 436-11-4 contains a smaller propor-tion of hopenes (relative to hopanes) than Site 440; (2)the relative amounts of C30 and C31 17/3H, 21αH-hopanes (Figure 4, numbers 6 and 10, respectively) in-crease with increasing depth at Site 440; (3) there aresmaller proportions of both C30 Δ
21 and Δ22<29> hopenes(Figure 4, numbers 13 and 12, respectively) in the lowertwo sections of Site 440 compared to the upper two(440A-7-6 and 440B-3-5); and (4) the proportion of C27
components [17/3H-22,29,30-trisnorhopane and 22,29-30-trisnorhop-17(21)-ene; Figure 4, numbers 2 and 1, re-spectively] increases with increasing sediment depth.
Four fernene isomers were recognized from theircharacteristic m/e 243 fragmentation in individual massspectra and quantified by MF. Their distribution andKovafs indices are given in Table 7. The relativeamounts of the individual fernene isomers show a def-inite trend with increasing depth, possibly reflecting agradual diagenetic isomerization.
In addition to the recognized branched/cyclic com-ponents, three isomers of an unknown compound (M+326, C24H38) were detected in all samples. These com-pounds possessed some mass spectral characteristicscommon to those of the unknown C24H38 componentspresent in algal mats from Laguna Guerrero Negro,Mexico (Philp et al., 1978), but were not identical.
Aromatic Hydrocarbons
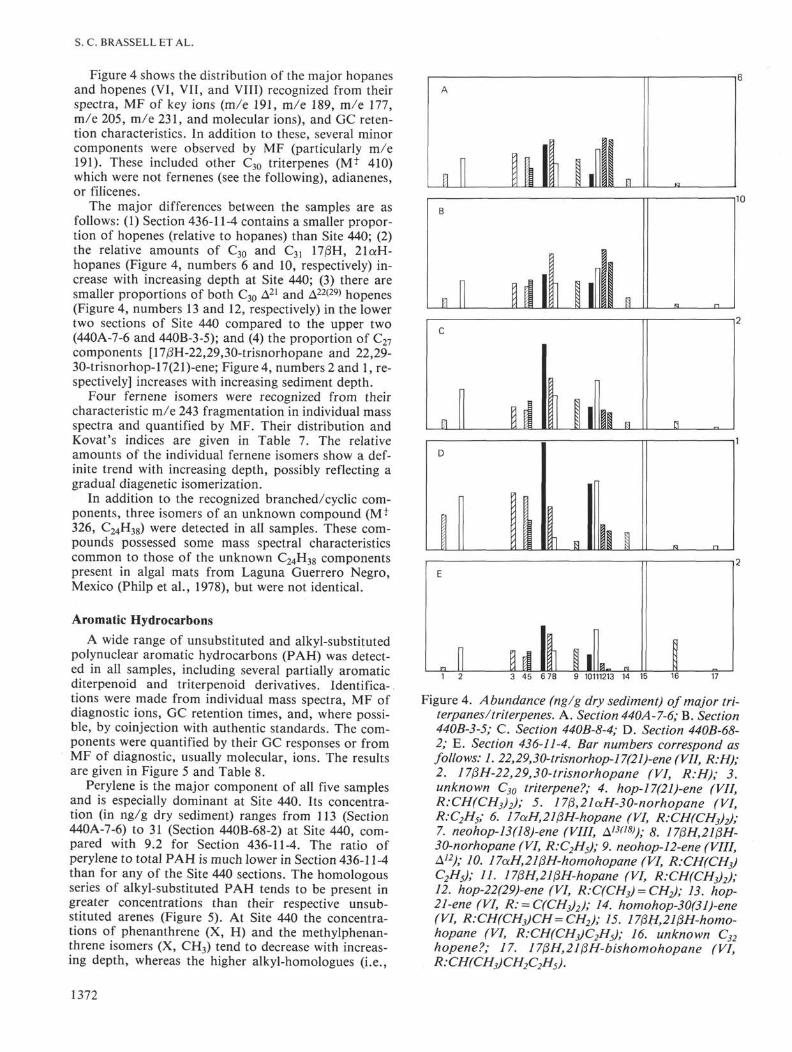
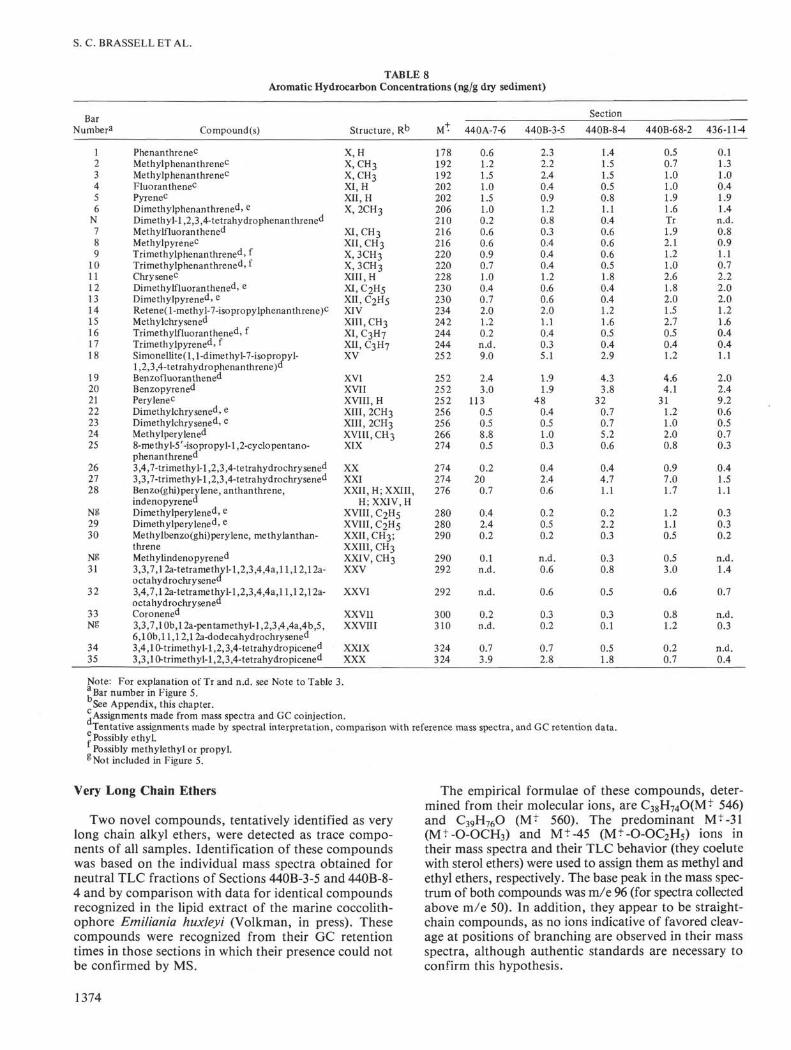
A wide range of unsubstituted and alkyl-substitutedpolynuclear aromatic hydrocarbons (PAH) was detect-ed in all samples, including several partially aromaticditerpenoid and triterpenoid derivatives. Identifica-tions were made from individual mass spectra, MF ofdiagnostic ions, GC retention times, and, where possi-ble, by coinjection with authentic standards. The com-ponents were quantified by their GC responses or fromMF of diagnostic, usually molecular, ions. The resultsare given in Figure 5 and Table 8.
Perylene is the major component of all five samplesand is especially dominant at Site 440. Its concentra-tion (in ng/g dry sediment) ranges from 113 (Section440A-7-6) to 31 (Section 440B-68-2) at Site 440, com-pared with 9.2 for Section 436-11-4. The ratio ofperylene to total PAH is much lower in Section 436-11-4than for any of the Site 440 sections. The homologousseries of alkyl-substituted PAH tends to be present ingreater concentrations than their respective unsub-stituted arenes (Figure 5). At Site 440 the concentra-tions of phenanthrene (X, H) and the methylphenan-threne isomers (X, CH3) tend to decrease with increas-ing depth, whereas the higher alkyl-homologues (i.e.,
A
πV\ 1 1
\ 1t s 1 1 ill
π H
1113 45 6 78 9 10111213 14 15
Figure 4. Abundance (ng/g dry sediment) of major tri~terpanes/triterpenes. A. Section 440A-7-6; B. Section440B-3-5; C. Section 440B-8-4; D. Section 440B-68-2; E. Section 436-11-4. Bar numbers correspond asfollows: 1. 22,29,30-trisnorhop-17(21)-ene(VII, R:H);2. 17ßH-22,29,30-trisnorhopane (VI, R:H); 3.unknown C30 triterpene?; 4. hop-17(21)-ene (VII,R:CH(CH3)2); 5. 17ß,21ocH-30-norhopane (VI,R:C2H5; 6. 17ocH,21ßH-hopane (VI, R.CHfCH^;7. neohop-13(18)-ene (VIII, à13*18*); 8. 17ßH,21ßH-30-norhopane (VI, R:C2H5); 9. neohop-12-ene (VIII,A12); 10. 17aH,21ßH-homohopane (VI, R:CH(CH3)C2H5); 11. 17ßH,21ßH-hopane (VI, R:CH(CH3)2);12. hop-22(29)-ene (VI, R:C(CH3) = CHJ; 13. hop-21-ene (VI, R: = C(CH3)2); 14. homohop-30(31)-ene(VI, R:CH(CH3)CH=CH2); 15. 17ßH,21ßH-homo-hopane (VI, R:CH(CH3)C2H5); 16. unknown C32hopene?; 17. 17ßH,21ßH-bishomohopane (VI,R:CH(CH3)CH2C2H5).
1372
LIPID ANALYSES
TABLE 7Fernene Concentrations (ng/g dry sediment)a
Component^
Fernene 1Fernene 2Fernene 3Fernene 4
Kovat'sIndex(OV-1)
2985304030683125
440A-7-6
0.70.30.92.7
440B-3-5
0.50.61.63.2
Section
440B-8-4
0.10.31.01.7
440B-68-2
Tr0.10.20.1
436-11-4
TrTr0.20.4
Note: For explanation of Tr see Note to Table 3.aQuantitated from MF of m/e 243.^Individual isomers not assigned.
A
1 1 i l l . 1 1 . 1 1 1 , I I . .1
a
1 | i i i i | | i i i i 1 1 . 1 1 . 1
1 I 1 1 1 1 1 i i i 1 I i I | I i I , 1 i • 1
D
I 1 1 1 1 i . , 1 | | 1 1 ll. 1 1 . 1
E
| | | | I | | | |1 2 3 4 5 6 7 8 91011121314151617181920212223242526272829303132333435
Molecular Weight increasing »-
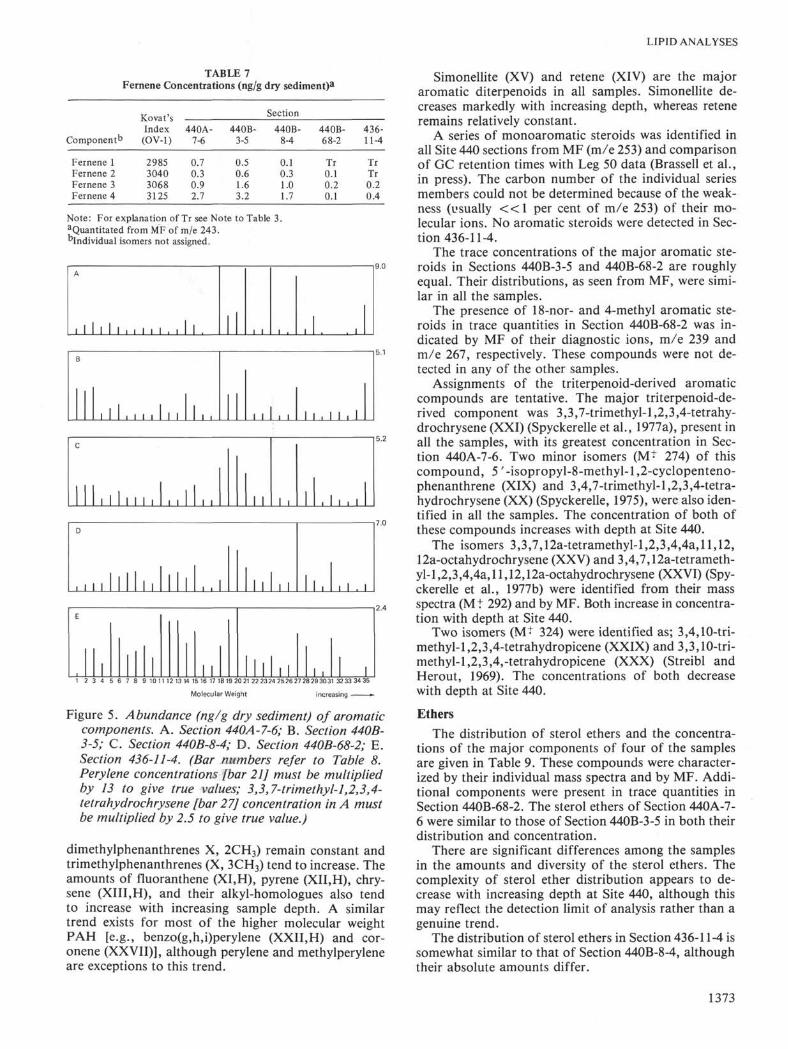
Figure 5. Abundance (ng/g dry sediment) of aromaticcomponents. A. Section 440A-7-6; B. Section 440B-3-5; C. Section 440B-8-4; D. Section 440B-68-2; E.Section 436-11-4. (Bar numbers refer to Table 8.Perylene concentrations [bar 21] must be multipliedby 13 to give true values; 3,3,7-trimethyl-l,2,3,4-tetrahydrochrysene [bar 27] concentration in A mustbe multiplied by 2.5 to give true value.)
dimethylphenanthrenes X, 2CH3) remain constant andtrimethylphenanthrenes (X, 3CH3) tend to increase. Theamounts of fluoranthene (XI,H), pyrene (XII,H), chry-sene (XIII,H), and their alkyl-homologues also tendto increase with increasing sample depth. A similartrend exists for most of the higher molecular weightPAH [e.g., benzo(g,h,i)perylene (XXII,H) and cor-onene (XXVII)], although perylene and methylperyleneare exceptions to this trend.
Simonellite (XV) and retene (XIV) are the majoraromatic diterpenoids in all samples. Simonellite de-creases markedly with increasing depth, whereas reteneremains relatively constant.
A series of monoaromatic steroids was identified inall Site 440 sections from MF (m/e 253) and comparisonof GC retention times with Leg 50 data (Brassell et al.,in press). The carbon number of the individual seriesmembers could not be determined because of the weak-ness (usually < < l per cent of m/e 253) of their mo-lecular ions. No aromatic steroids were detected in Sec-tion 436-11-4.
The trace concentrations of the major aromatic ste-roids in Sections 440B-3-5 and 440B-68-2 are roughlyequal. Their distributions, as seen from MF, were simi-lar in all the samples.
The presence of 18-nor- and 4-methyl aromatic ste-roids in trace quantities in Section 440B-68-2 was in-dicated by MF of their diagnostic ions, m/e 239 andm/e 267, respectively. These compounds were not de-tected in any of the other samples.
Assignments of the triterpenoid-derived aromaticcompounds are tentative. The major triterpenoid-de-rived component was 3,3,7-trimethyl-l,2,3,4-tetrahy-drochrysene (XXI) (Spyckerelle et al., 1977a), present inall the samples, with its greatest concentration in Sec-tion 440A-7-6. Two minor isomers (M÷ 274) of thiscompound, 5 ' -isopropyl-8-methyl-1,2-cyclopenteno-phenanthrene (XIX) and 3,4,7-trimethyl-l,2,3,4-tetra-hydrochrysene (XX) (Spyckerelle, 1975), were also iden-tified in all the samples. The concentration of both ofthese compounds increases with depth at Site 440.
The isomers 3,3,7,12a-tetramethyl-l,2,3,4,4a,ll,12,12a-octahydrochrysene (XXV) and 3,4,7,12a-tetrameth-yl-l,2,3,4,4a,ll,12,12a-octahydrochrysene (XXVI) (Spy-ckerelle et al., 1977b) were identified from their massspectra (Mt 292) and by MF. Both increase in concentra-tion with depth at Site 440.
Two isomers (M+ 324) were identified as; 3,4,10-tri-methyl-l,2,3,4-tetrahydropicene (XXIX) and 3,3,10-tri-methyl-l,2,3,4,-tetrahydropicene (XXX) (Streibl andHerout, 1969). The concentrations of both decreasewith depth at Site 440.
Ethers
The distribution of sterol ethers and the concentra-tions of the major components of four of the samplesare given in Table 9. These compounds were character-ized by their individual mass spectra and by MF. Addi-tional components were present in trace quantities inSection 440B-68-2. The sterol ethers of Section 440A-7-6 were similar to those of Section 440B-3-5 in both theirdistribution and concentration.
There are significant differences among the samplesin the amounts and diversity of the sterol ethers. Thecomplexity of sterol ether distribution appears to de-crease with increasing depth at Site 440, although thismay reflect the detection limit of analysis rather than agenuine trend.
The distribution of sterol ethers in Section 436-11-4 issomewhat similar to that of Section 440B-8-4, althoughtheir absolute amounts differ.
1373
S. C. BRASSELLETAL.
TABLE 8Aromatic Hydrocarbon Concentrations (ng/g dry sediment)
BarNumbera
123456
N789
101112131415161718
19202122232425
262728
Në2930
Në31
32
33Në
3435
Compound(s)
Phenanthrenec
Methylphenanthrenec
Methylρhenanthrenec
Fluoranthenec
Pyrenec
Dimethylphenanthrened> e
Dimethyl-l,2,3,4-tetrahydrophenanthrened
Methylfluoranthened
Methylpyrenec
Trimethylphenanthrened> fTrimethylphenanthrened> f
Chrysenec
Dimethylfluoranthened> e
Dimethylpyrened> eRetene(l-methyl-7-isopropylphenanthrene)c
Methylchrysened
Trimethylfluoranthened> fTrimethylpyrene^ fSimonellite( 1, l-dimethyl-7-isopropyl-l,2,3,4-tetrahydrophenanthrene)uBenzofluoranthened
Benzopyrened
Perylenec
Dimethylchrysened> e
Dimethylchrysened> e
Methylperylened
8-methyl-5'-isopropyl-l,2-cyclopentano-phenanthrened
3,4,7-trimethyl-l,2,3,4-tetrahydrochrysened
3,3,7-trimethyl-l,2,3,4-tetrahydrochrysened
Benzo(ghi)perylene, anthanthrene,indenopyrenedDimethylperylened> e
Dimethylperylened> e
Methylbenzo(ghi)perylene, methylanthan-threneMethylindenopyrened
3,3,7,12a-tetramethyl-l,2,3,4,4a,11,12,12a-octahydrochrysened
3,4,7,12a-tetramethyl-l,2,3,4,4a,11,12,12a-octahydrochrysened
Coronened
3,3,7,10b,12a-pentamethyl-l,2,3,4,4a,4b,5,6,1 Ob, 11,12,12a-dodecahydrochry sened
3,4,10-trimethyl-l,2,3,4-tetrahydropicened
3,3,10-trimethyl-1,2,3,4-tetrahydropicened
Structure, Rb
X,HX, CH 3
X,CH 3
XI, HXII, HX, 2CH3
XI,CH 3
XII, CH 3
X, 3CH3
X, 3CH3
XIII, HXI,C 2 H 5
XII,C 2 H 5
XIVXIII, CH 3
XI, C3H7XII,C 3 H 7
XV
XVIXVIIXVIII, HXIII, 2CH3
XIII, 2CH3
XVIII, CH 3
XIX
XXXXIXXII, H; XXIII,
H; XXIV, HXVIII, C 2 H 5
XVIII, C2H5XXII, CH 3 ;XXIII, CH3
XXIV, CH 3
XXV
XXVI
XXVIIXXVIII
XXIXXXX
M+•
178192192
202202206210216216220220228230230234242244244
25 2
25225225 2256256266274
274274276
280280290
290292
292
300310
324324
440A-7-6
0.61.21.51.01.51.00.20.60.60.90.71.00.40.7
2.01.20.2n.d.9.0
2.43.0
1130.50.58.80.5
0.220
0.7
0.42.40.2
0.1
n.d.
n.d.
0.2n.d.
0.7
3.9
440B-3-5
2.32.22.40.40.91.20.80.30,40.40.41.20.60.62.01.10.40.35.1
1.91.9
480.40.51.00.3
0.42.40.6
0.20.50.2
n.d.0.6
0.6
0.30.2
0.7
2.8
Section
440B-8-4
1.41.51.50.50.81.10.40.60.60.60.51.80.40.41.2
1.60.50.4
2.9
4.33.8
320.70.75.20.6
0.44.71.1
0.22.20.3
0.30.8
0.5
0.30.1
0.51.8
440B-68-2
0.50.7
1.01.01.91.6Tr1.92.11.21.0
2.61.82.0
1.52.70.50.41.2
4.64.1
311.21.02.00.8
0.97.01.7
1.2
1.10.5
0.5
3.0
0.6
0.81.2
0.20.7
436-11-4
0.11.31.0
0.41.91.4n.d.0.80.91.10.7
2.22.02.01.2
1.60.40.41.1
2.02.49.2
0.60.50.70.3
0.41.51.1
0.30.30.2
n.d.1.4
0.7
n.d.0.3
n.d.0.4
Note: For explanation of Tr and n.d. see Note to Table 3.I* Bar number in Figure 5.
See Appendix, this chapter.^Assignments made from mass spectra and GC coinjection.
Tentative assignments made by spectral interpretation, comparison with reference mass spectra, and GC retention data.^Possibly ethyl.
Possibly methylethyl or propyl.^Not included in Figure 5.
Very Long Chain Ethers
Two novel compounds, tentatively identified as verylong chain alkyl ethers, were detected as trace compo-nents of all samples. Identification of these compoundswas based on the individual mass spectra obtained forneutral TLC fractions of Sections 440B-3-5 and 440B-8-4 and by comparison with data for identical compoundsrecognized in the lipid extract of the marine coccolith-ophore Emiliania huxleyi (Volkman, in press). Thesecompounds were recognized from their GC retentiontimes in those sections in which their presence could notbe confirmed by MS.
The empirical formulae of these compounds, deter-mined from their molecular ions, are C38H74O(M+ 546)and C39H76O (M* 560). The predominant M+-31(Mt-O-OCH3) and Mi-45 (Mt-O-OC2H5) ions intheir mass spectra and their TLC behavior (they coelutewith sterol ethers) were used to assign them as methyl andethyl ethers, respectively. The base peak in the mass spec-trum of both compounds was m/e 96 (for spectra collectedabove m/e 50). In addition, they appear to be straight-chain compounds, as no ions indicative of favored cleav-age at positions of branching are observed in their massspectra, although authentic standards are necessary toconfirm this hypothesis.
1374

TABLE 9Sterol Ether Concentrations (ng/g dry sediment)
Sterol Moietya
C26:2
C26:l/C27:l/C27:2C27:2
C26:2C27:2
5"C27:15.C27:i5-C27:l/C27:2
C 27:l
5-C27:15"C28:1
C27-2/C28-2
C27-1C27:lC28:2C 28:lC 28:lC 28:lC28:l/C29:lC 29:lC 29:lC27:lC 29:lC 29:l
Chain Length ofAlkyl Moiety (R) b
ClO-
-
-
-C 9Cg
Clθ/ClO:l-
CioC 9
Cll/CioCll
ClO
ClO
-
Cll/Cio-
-
-
-
510-
-
-
-
512512
524-
526526
538540
5265 38540
-
540554
-
-
-
-
-
440B-3-5
+
+
++
+
204
+++
+
24
++
+
+
+
+++
++
+
+
+
++
Section
440B-8-4 440B-68-2
+ —
-
-
-+ -
1.5+ —
+ —
3 +++++
1+ —
+ _
0.5-+ —
+ —
-
-
-+ —+ _
-
436-114
_
-
-
-
---
++
-
2.5-
2.5-1
-
-+
+
-
-
-
-
-
Note: +, ++, and +++ are qualitative estimates of relative concentrations.a Δ-C m n where m is carbon number, n is degree of unsaturation and Δ shows location of double
bond.'bStructure XXXI, R - See Appendix, this chapter.
Although these ethers are present in only trace quan-tities in all the samples, it is possible to determine from acomparison of GC injection volumes that their concen-tration in Section 440B-68-2 is markedly lower than inthe other samples.
Aliphatic Ketones
Normal Methyl Ketones
The concentrations of the individual methyl ketones,calculated from their GC response or by MF (m/e 58),are shown in Figure 6.
The odd-numbered members of the homologous se-ries dominate in all samples, with C29 (nonacosan-2-one) as the major component, except in Section440B-68-2, in which C25 dominates.
The proportion of C ] 5 to C22 components is sig-nificantly lower in Section 436-11-4 than in the sam-ples from Site 440. The overall distributions of Sections440A-7-6, 440B-3-5, and 440B-8-4 are similar, whereasSection 440B-68-2 possesses a greater relative propor-tion of C20 to C25 components.
Branched/Cyclic
Monomethyl or other branched methyl ketones werenot detected in any of the samples by MF of m/e 58. Mi-nor quantities of ethyl ketones, either straight-chain orbranched-chain, were observed in all samples by MF(m/e 72).
The concentration of 6,10,14-trimethylpentadecan-2-one in the five sections is given in Table 10. Identifica-tion of this component was based on its mass spectralcharacteristics and GC retention time. The quantity of6,10,14-trimethylpentadecan-2-one decreases graduallywith increasing depth of burial at Site 440 and is alsosignificantly lower at Site 436 than the deepest Site 440sample.
A
.1 . I I I | | | . 1
LIPID ANALYSES
10
B
. . . . I I I I | |
30
c
. 111111 1 ,1
1.5
D
I i . i..
0.7
E
.11 I |15 20 25 30
Carbon Number
35
Figure 6. Abundance (ng/g dry sediment) ofn-methylketones. A. Section 440A-7-6; B. Section 440B-3-5;C. Section 440B-8-4; D Section 440B-68-2; E. Sec-tion 436-11-4.
1375

S. C. BRASSELLETAL.
TABLE 10Isoprenoid Ketone Concentrations (ng/g dry sediment)
440A-7-6
25
440B-3-5
25
Section
440B-8-4
5
440B-68-2
2
436-11-4
0.3
Various steroidal ketones were present in all the Site440 sections, but these components could not be con-firmed as constituents of Section 436-11-4. These com-pounds were recognized from MF of diagnostic ions forstenones (m/e 229), stanones (m/e 231), 4-methylsten-ones (m/e 285), and 4-methylstanones (m/e 245), butnone of the compounds was present in sufficient quanti-ty (> 1 ng/g dry sediment) to enable an unambiguousassignment from its mass spectrum. In particular, thedominance of the long-chain ketones in the steroidalketone fraction of Section 440B-7-6 precluded even thecomparison of key mass fragmentograms with those ofthe other Site 440 sections. The information that couldbe deduced from the various mass fragmentograms issummarized as follows:
1) m/e 229; stenones. A single major component ispresent in Sections 440B-3-5 and 440B-8-4. On theevidence of mass fragmentogram multiplication factors,this compound is the most abundant steroidal ketone inthese samples.
2) m/e 231; stanones. The distributions of thesecompounds in Sections 440B-3-5, 440B-8-4, and 440B-68-2 are markedly different. The complexity of thesemass fragmentograms decreases with increasing sampledepth.
3) m/e 285; mainly 4-methylstenones. Two majorcomponents are observed in Sections 440B-3-5 and440B-68-2. The earlier-eluting compound is dominant inSection 440B-3-5, whereas Section 440B-68-2 containsthe two components in equal abundance.
4) m/e 245; 4-methylstanones. Sections 440B-3-5,440B-8-4, and 440B-68-2 are similar in terms both ofdistribution and relative proportions of these com-pounds.
The major hopanoid ketones, recognized from theirfull mass spectra and GC retention times, are quantitat-ed in Table 11. A considerable number of minor com-pounds was also observed in the m/e 191 mass fragmen-tograms of the Site 440 Sections, showing that the rangeof hopanoid ketones is more diverse than Table 11 sug-gests. It seems probable that several of these addi-tional components are stereoisomers of the compoundsrecognized.
Sections 440A-7-6 and 440B-3-5 are generally similarin their hopanoid ketone distributions. Trisnorhop-21-one is the most abundant component in all the sections.Section 440B-68-2 is the only sample with a detectablequantity of homohop-29-one.
No hopenones were detected in any of the sections.In every section various non-hopanoid triterpenoid
ketones were tentatively identified from their mass spec-tra (by comparison with literature spectra) (Wardroper,
personal communication), GC retention times, and byMF of diagnostic ions. The compounds recognized,which are all 3-ones, are quantified in Table 12, al-though only traces (< 1 ng/g) were detected in Sections440B-8-4 and 436-11-4. In addition to the componentstabulated, a number of other unknown compounds werealso present whose structures could not be assignedfrom their mass spectra.
Friedelan-3-one is only present in significant amountsin Section 440B-3-5, whereas olean-12(12)-en-3-one andurs-12(12)-en-3-one were detected in all Site 440 sec-tions. No trend with depth in the distribution of non-hopanoid ketones is discernible at Site 440.
Very Long Chain Unsaturated Ketones
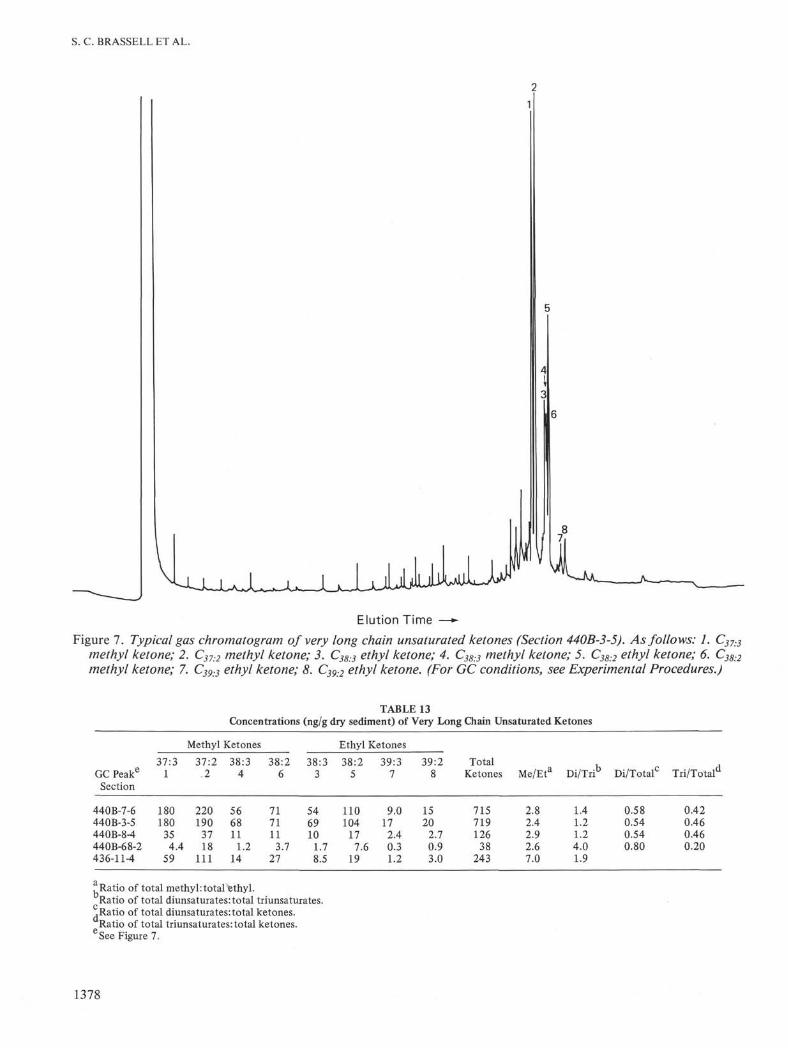
A number of very long straight-chain C37, C38, andC39 unsaturated ketones were present in all five samples.These novel compounds were identified by GC coinjec-tion and mass spectral comparison with identical com-pounds isolated from the unicellular coccolithophoreEmiliania huxleyi (Volkman, in press). The presence ofdouble bonds and the absence of ring structures in thealgal ketones were confirmed by hydrogenation and theexistence of the ketone group itself verified by forma-tion of the methoxime derivatives. A typical gas chro-matogram of the ketones after TLC fractionation is shownin Figure 7, and the concentrations of the eight majorcomponents in the five sections, calculated from GC re-sponses, are given in Table 13. Series of methyl and ethylketones were detected, and for Sections 436-11-4 and440B-68-2, these were separated by the second TLC frac-tionation of neutral components. Methyl ketones gavemass spectra with their base peak at m/e 43 (COCH3; orm/e 96 for spectra collected from m/e 50) and signifi-cant ions at Mt-18 (M÷-H2O), Mt-43 (Mt-COCH3),and Mt-58 (McLafferty rearrangement), typical of thiscompound class. Ethyl ketones gave a base peak of m/e57 and key ions at M÷-18 (M÷-H2O), Mt-29 (Mt-C2H5),and Mt-72 (McLafferty rearrangement). Molecular ionsfor all compounds were weak but discernible. In eachspectrum, an exponential-type decrease in ion intensitywith increasing m/e value was consistent with the pres-ence of a long, unsaturated aklyl chain. No favored massspectral fragmentations suggestive of cleavage at posi-tions of branching were present, although in the absenceof authentic standards, the existence of methyl branchescannot be unequivocably excluded. No evidence for pro-pyl or longer alkyl chain ketones was obtained, althoughin several samples, notably Section 440B-3-5, GC evi-dence suggested the presence of C40 and longer chain ke-tones (Figure 7). The low quantities of these compoundsprevented their characterization.
All of the major components contained either two orthree double bonds. No corresponding monounsatu-rated and saturated ketones were detected. The doublebond positions have not been determined, although thepresence of single symmetrical peaks for each compo-nent in capillary GC analysis suggests that each ketoneis a single compound, not a mixture of double bondpositional isomers.
1376

LIPID ANALYSES
TABLE 11Hopanoid Ketone Concentrations (ng/g dry sediment)
Trisnorhop-21 -oneTrisnorhop-21 -oneNorhop-22-oneHomohop-29-one
Trishomohop-3 2-one
StructureR
XXXIIXXXII
VI, R:C(CH3)OVI, R:CH(CH3)
COCH3
VI, R:CH(CH3)(CH2)2 COCH3
440A-7-6
Tr10
1.5n.d.a
2
440B-3-5
110
4Tr
n.d.a
Section440B-8-4
Tr1
Trn.d.a
Tr
440B-68-2
Tr1.5Tr
1
n.d.
436-11-4
n.d.Tr
n.d.n.d.
n.d.
Note: For explanation of Tr and n.d. see Note to Table 3.^Compound possibly present but experimental conditions precluded detection.
Stereochemistry not assigned - see Appendix, this chapter.
TABLE 12Triterpenoid Ketone Concentrations (ng/g dry sediment)
Taraxer-14-en-3-one
Olean-12(12)-en-3-one
Urs-12(12)-en-3-one
Glut-5-en-3-one
Friedelan-3-one
Structure8
XXXIII
XXXIV
XXXV
XXXVI
XXXVII
440A-7-6
n.d.
3
2
n.d.
Tr
440B-3-5
1
5
4
n.d.
5
Section
440B-8-4
n.d.
Tr
Tr
n.d.
Tr
440B-68-2
n.d.
2
2
Tr
n.d.
436-11-4
n.d.
Tr
n.d.
n.d.
n.d.
Note: For explanation of Tr and n.d., see Note to Table 3.aSee Appendix, this chapter.
The concentration of very long chain ketones ishighest in Sections 440A-7-6 and 440B-3-5. In com-parison with these samples, Sections 440B-8-4 and436-11-4 contain markedly lower concentrations, where-as the value for Section 440B-68-2 is an order of magni-tude lower. The ratios of the methyl to ethyl ketones ofall the Site 440 sections are similar, whereas the value forSection 436-11-4 is markedly higher. The ratios of the di-unsaturated to triunsaturated ketones of Sections 440A-7-6, 440B-3-5 and 440B-8-4 are similar, whereas the val-ue for Section 436-11-4 is slightly greater and that of Sec-tion 440B-68-2 higher still.
Very long mid-chain ketones (e.g., C3 J - C43) such asthose observed in Walvis Bay diatomaceous ooze (Boonand de Leeuw, 1979) were not detected.
Aliphatic Alcohols
Normal
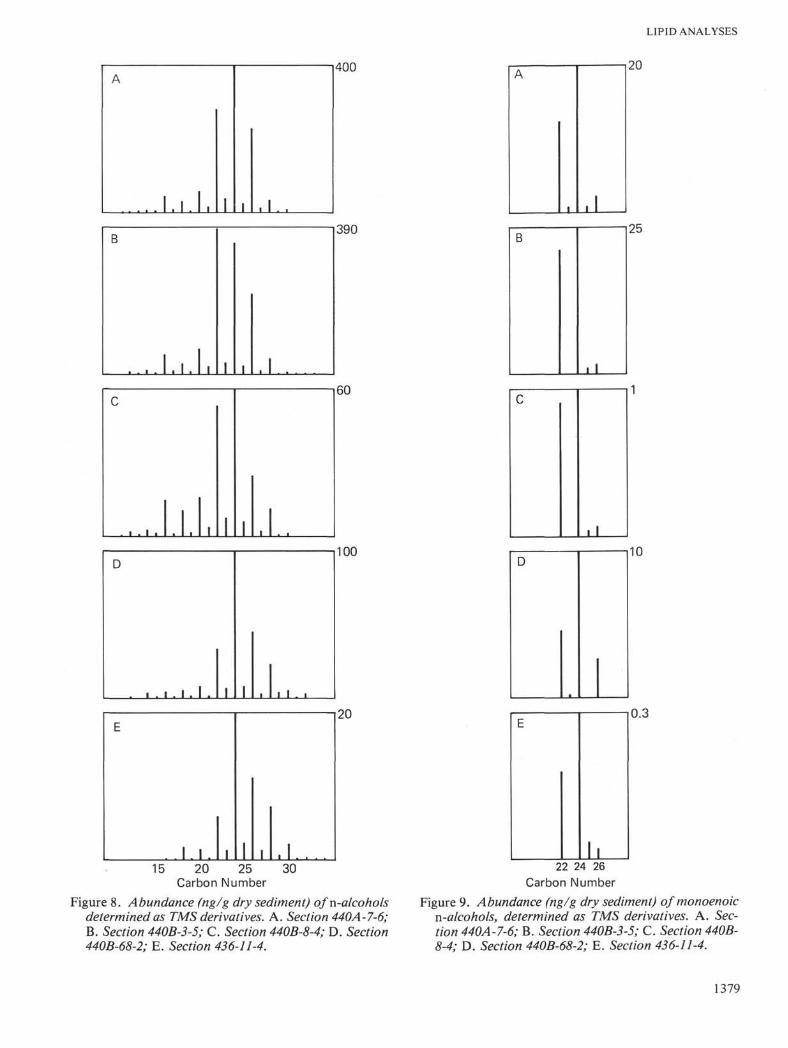
The concentrations of «-alkan-l-ols, calculated byGC or MF (m/e 75) of their trimethylsilyl ethers, areshown in Figure 8.
In all samples, the even-numbered members of thehomologous series are the dominant components, maxi-mizing at C 2 4 (C 2 2 for Section 440B-3-5). The propor-tions of C π to C22 alcohols (especially C ] 6 and C22) inSections 440A-7-6, 440B-3-5, and 440B-8-4 are marked-ly higher than in Sections 440B-68-2 and 436-11-4.
In all samples a series of monoenoic alcohols was de-tected (Figure 9). Each component was characterizedfrom the mass spectrum of its TMS ether (base peak M+
-15). The C 2 4 : 1 alcohol is the major monoenoic alcoholin every sample, and the even-numbered alkenols pre-dominate over the odd-numbered members. The amountsof alkenols in Section 436-11-4 are markedly lower thanthose in sections of Site 440.
Branched/Cyclic
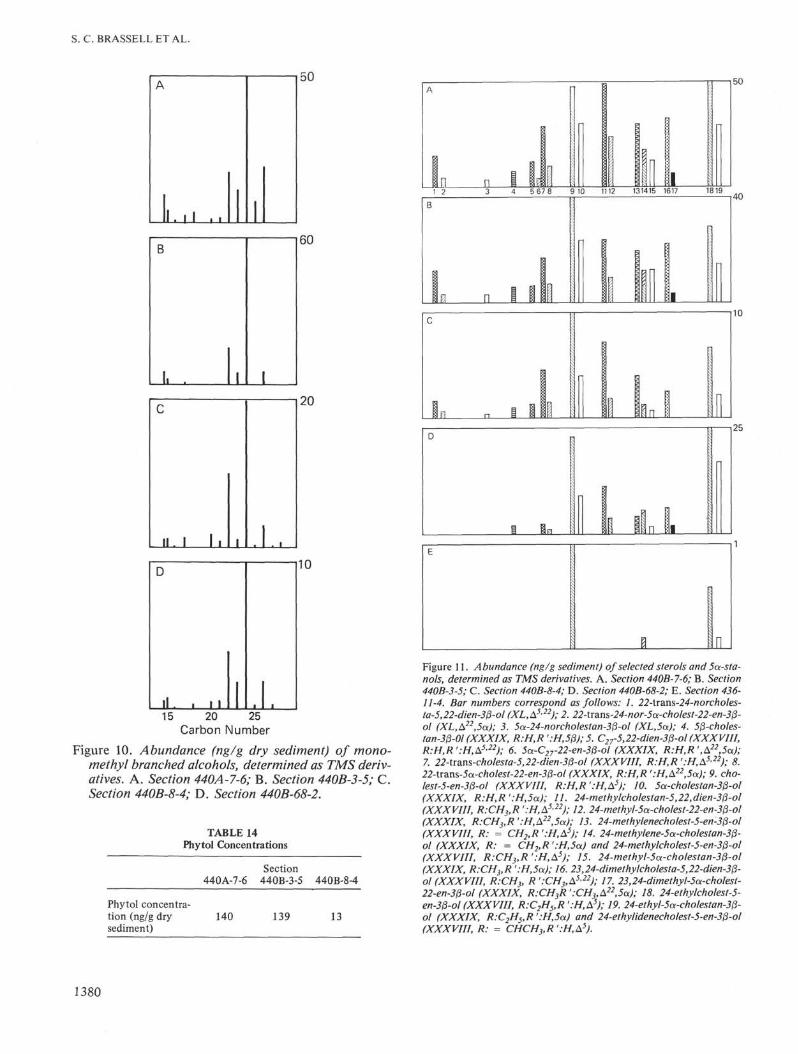
A series of monomethyl branched alcohols, char-acterized (as their TMS ethers) from their mass spectraand GC retention times, was detected in all Site 440samples (Figure 10). Section 436-11-4 contained C 2 2 toC 2 8 components in detectable, though trace ( < l ng/g),quantities.
The even-numbered branched alcohols appear to bepresent as single isomers (iso-alcohols), whereas theodd-numbered members of the series occur as at leasttwo isomers recognized as iso- and anteiso-isomers forthe Ci 5 component. In all samples, the C 2 4 iso-alcohol isthe major component, and in general the even-numberediso-alcohols dominate the odd-numbered isomers withthe exception of C 1 5. The proportion of iso- and anteiso-pentadecanol in Sections 440A-7-6 and 440B-3-5 is mark-edly higher than in Sections 440B-8-4 and 440B-68-2.
The concentration of phytol, characterized from itsmass spectrum and GC retention time, in Sections 440A-7-6, 440B-3-5, and 440B-8-4 is given in Table 14. Nophytol was detected in Sections 440B-68-2 or 436-11-4, and neither dihydrophytol nor lower isoprenoidalcohols were detected in any of the sections.
The concentrations of selected sterols (XXXVIII)and 5α-stanols (XXXIX) (in ng/g dry sediment wt.),calculated from GC or by MF of m/e 215 for Section436-11-4, are shown in Figure 11. In addition, a consid-erable number of minor sterols have been characterizedin Section 440B-3-5, in which TLC separation gave adiscrete sterol/5α-stanol fraction free of n-alcohols.The minor sterols recognized from their mass spectra in-cluded 24-ethylidenecholest-5-en-3ß-ol; 24-ethylidene-5α-cholestan-3ß-ol; 24-propylidenecholest-5-en-3ß-ol,24-propylidene-5α-cholestan-3ß-ol; 5α-gorgostanol;and C 2 1, C 2 2, C 2 3 , and C 2 4 5α-stanols, with C2 to C5 sidechains.
The sterol/5α-stanol composition of Sections 440A-7-6 and 440B-3-5 is similar, whereas the proportion ofC 2 7 sterols/5α-stanol is higher in Section 440B-8-4 and
1377
S. C. BRASSELLETAL.
Elution Time —**
Figure 7. Typical gas chromatogram of very long chain unsaturated ketones (Section 440B-3-5). As follows: 1. C37:3
methyl ketone; 2. C37:2 methyl ketone; 3. C38:3 ethyl ketone; 4. C38:3 methyl ketone; 5. C38:2 ethyl ketone; 6. C38:2
methyl ketone; 7. C39:3 ethyl ketone; 8. C39:2 ethyl ketone. (For GC conditions, see Experimental Procedures.)
TABLE 13Concentrations (ng/g dry sediment) of Very Long Chain Unsaturated Ketones
GC Peak6
Section
440B-7-6440B-3-5440B-8-4440B-68-2436-11-4
37:31
180180
354.4
59
Methyl Ketones
37:22
220190
3718
111
38:34
566811
1.214
38:26
717111
3.727
38:33
546910
1.78.5
Ethyl Ketones
38:25
110104
177.6
19
39:37
9.017
2.40.31.2
39:28
1520
2.70.93.0
TotalKetones
715719126
38243
Me/Eta
2.82.42.92.67.0
Di/Trib
1.41.21.24.01.9
Di/Totalc
0.580.540.540.80
Tri/Totalα
0.420.460.460.20
Ratio of total methyl: total ethyl.Ratio of total diunsaturates: total triunsaturates.
'Ratio of total diunsaturates:total ketones.Ratio of total triunsaturates: total ketones.
'See Figure 7.
1378
LIPID ANALYSES
A
. . . I . I . I I .1 .
400 A
I
20
B
. . l . i . | | .1 .
390B
i 1
25
c
. 1 . 1 1 1
60 c
• 1
D
. .i.l.l. | | i i 1 i
100D
10
E
. 1 . 1 . | I i . 1 . . . .
20E
h
0.3
15 20 25Carbon Number
30
Figure 8. Abundance (ng/g dry sediment) ofn-alcoholsdetermined as TMS derivatives. A. Section 440A-7-6;B. Section 440B-3-5; C. Section 440B-8-4; D. Section440B-68-2; E. Section 436-11-4.
22 24 26Carbon Number
Figure 9. Abundance (ng/g dry sediment) of monoenoicn-alcohols, determined as TMS derivatives. A. Sec-tion 440A-7-6; B. Section 440B-3-5; C. Section 440B-8-4; D. Section 440B-68-2; E. Section 436-11-4.
1379
S. C. BRASSELLETAL.
B
1. . 1
60
c
II 1 1 •
20
D
ll . ii
10
15 20 25Carbon Number
Figure 10. Abundance (ng/g dry sediment) of mono-methyl branched alcohols, determined as TMS deriv-atives. A. Section 440A-7-6; B. Section 440B-3-5; C.Section 440B-8-4; D. Section 440B-68-2.
TABLE 14Phytol Concentrations
440A-7-6Section
440B-3-5 440B-8-4
Phytol concentra-tion (ng/g drysediment)
140 139 13
5 67 8 9 10 1112 131415 1617
La DL
MR.
50
40
10
25
Figure 11. A bundance (ng/g sediment) of selected sterols and 5a-sta-nols, determined as TMS derivatives. A. Section 440B-7-6; B. Section440B-3-5; C. Section 440B-8-4; D. Section 440B-68-2; E. Section 436-11-4. Bar numbers correspond as follows: 1. 22-trans-24-norcholes-ta-5,22-dien-3ß-ol (XL, A5'22); 2. 22-trans-24-nor-5a-cholest-22-en-3ß-ol (XL, A22,5a); 3. 5a-24-norcholestan-3ß-ol (XL, 5a); 4. 5ß-choles-tan-3ß-0l (XXXIX, R:H,R ':H,5ß);5. C27-5,22-dien-3ß-ol (XXXVIII,R:H,R':H,A522); 6. 5a-C27-22-en-3ß-o! (XXXIX, R:H,R',A22,5a);7. 22-trans-cholesta-5,22-dien-3ß-ol (XXXVIII, R:H,R':H,A522); 8.22-lram-5a-cholest-22-en-3ß-ol (XXXIX, R:H,R ':H,A22,5a); 9. cho-lest-5-en-3ß-ol (XXXVIII, R:H,R':H,A5); 10. 5a-cholestan-3ß-ol(XXXIX, R:H,R':H,5a); 11. 24-methylcholestan-5,22,dien-3ß-ol(XXXVIII, R:CH3,R ':H,A5-22); 12. 24-methyl-5a-cholest-22-en-3ß-ol(XXXIX, R:CH3,R ':H,A22,5a); 13. 24-methylenechoIest-5-en-3ß-ol(XXXVIII, R: = CH2,R ':H,A5); 14. 24-methylene-5a-cholestan-3ß-ol (XXXIX, R: = CH2,R ':H,5a) and 24-methylcholest-5-en-3ß-ol(XXXVIII, R:CH3,R':H,A5); 15. 24-methyI-5a-cholestan-3ß-ol(XXXIX, R:CH3,R ':H,5a); 16. 23,24-dimethylcholesta-5,22-dien-3ß-ol (XXXVIII, R:CH3, R ':CH3,A
5 22); 17. 23,24-dimethyl-5a-cholest-22-en-3ß-ol (XXXIX, R:CH3R':CH3,A
22,5a); 18. 24-ethy/cholest-5-en-3ß-ol(XXXVIII, R:C2H5,R':H,A5); 19. 24-ethyl-5a-cholestan-3ß-ol (XXXIX, R:C2H5,R ':H,5a) and 24-ethylidenecholest-5-en-3ß-ol(XXXVIII, R: = CHCH3,R ':H,A5).
1380
LIPID ANALYSES
Section 440B-68-2 possesses noticeably lower quantitiesof the C2 8 components. These differences can be seen inFigure 11. The sterol/5α;-stanol content of Section436-11-4 is extremely low; because identification of eventhe major sterols is difficult, the reliability of the ten-tative assignments in Figure 11 is questionable.
5/3-stanols were identified in all the Site 440 samples.In each instance the dominant compound was 5/3-chol-estan-3ß-ol (Figure 11), whereas 24-methyl-5j8-choles-tan-3/3-ol and 24-ethyl-5ß-cholestan-3ß-ol, were presentin trace amounts. No 5ß-stanols were detected in Sec-tion 436-11-4.
The proportion of 5/3-stanols decreases with increas-ing sample depth at Site 440, although the distributionsof C27, C28, and C29 compounds, as seen in MF of m/e215, were similar.
4-methyl stenols and 4-methyl stanols were identifiedby MF and full mass spectra in the four samples fromSite 440, whereas Section 436-11-4 did not contain thesecomponents in detectable quantities.
Three extended hopanoid alcohols were detected, allwith the hydroxy group in their side chain. They werecharacterized by MF (m/e 191, 203, and 217) and fromtheir full mass spectra. The distribution of these hopa-noid alcohols in the Site 440 sections is given in Table15. No hopanoid alcohols were detected in Section 436-11-4.
The distribution of the three components in the foursections is similar, though their quantities in Section440B-8-4 are considerably lower than those of the otherSite 440 sections.
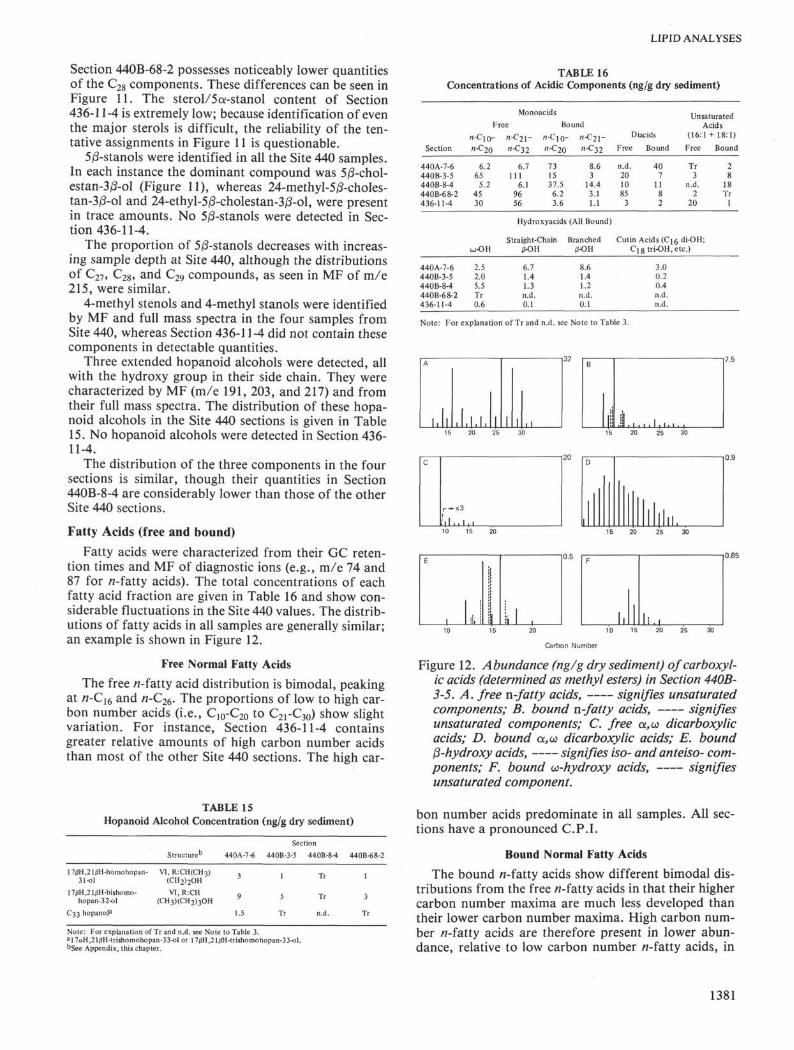
Fatty Acids (free and bound)
Fatty acids were characterized from their GC reten-tion times and MF of diagnostic ions (e.g., m/e 74 and87 for rt-fatty acids). The total concentrations of eachfatty acid fraction are given in Table 16 and show con-siderable fluctuations in the Site 440 values. The distrib-utions of fatty acids in all samples are generally similar;an example is shown in Figure 12.
Free Normal Fatty Acids
The free A?-fatty acid distribution is bimodal, peakingat n-Cl6 and n-C26 The proportions of low to high car-bon number acids (i.e., C10-C20 to C21-C3O) show slightvariation. For instance, Section 436-11-4 containsgreater relative amounts of high carbon number acidsthan most of the other Site 440 sections. The high car-
TABLE 15Hopanoid Alcohol Concentration (ng/g dry sediment)
TABLE 16Concentrations of Acidic Components (ng/g dry sediment)
17(3H ,2 l(3H-homohopan-31•ol
17/3H,21(5H-bishomo-hopan-32-ol
C33 hopanola
Structure*3
VI, R:CH(CH3)(CH2)2OH
VI,R:CH(CH3)(CH2)3OH
440A-7-6
3
9
1.5
Section
440B-3-5
1
5
Tr
440B-84
Tr
Tr
n.d.
440B-68-2
1
3
Tr
Section
440A-7-6440B-3-5440B-8-4440B-68-2436-11-4
440A-7-6440B-3-5440 B-8-4440B-68-2436-11-4
Monoacids
Free Boundn-ClO-
«-C 2 0
6.265
5.24530
CJ-OH
2.52.05.5Tr0.6
n-C2i - n -Cio -
n - C 3 2 «-C20
6.7 73111 15
6.1 37.596 6.256 3.6
" - C 2 1 -n - C 3 2
8.63
14.43.11.1
Hydroxyacids (All Bound)
Straight-Chain ]ß-OH
6.71.41.3n.d.0.1
SranchedJ3-OH
8.61.41.2
n.d.0.1
Diacids
Free
n.d.201085
3
Bound
407
1182
UnsaturatedAcids
(16:1
Free
Tr3
n.d.2
20
Cutin Acids (Cig di-OH;
C][8tri-OH.
3.00.20.4n.d.n.d.
etc.)
+ 18:1)
Bound
28
18Tr
1
Note: For explanation of Tr and n.d. see Note to Table 3.
A
1 .1.1. 1 | | i 1
B
jjj
D
E
1 \i
1
F
h..
Carbon Number
Note: For explanation of Tr and n.d. see Note to Table 3.a17αH,21(3H-trishomohopan-33-ol or 17(3H,21/3H-trishomohopan-33-ol.t>See Appendix, this chapter.
Figure 12. Abundance (ng/g dry sediment) ofcarboxyl-ic acids (determined as methyl esters) in Section 440B-3-5. A. free n-fatty acids, signifies unsaturatedcomponents; B. bound n-fatty acids, signifiesunsaturated components; C. free α,co dicarboxylicacids; D. bound α,co dicarboxylic acids; E. boundß-hydroxy acids, signifies iso- and anteiso- com-ponents; F. bound u-hydroxy acids, signifiesunsaturated component.
bon number acids predominate in all samples. All sec-tions have a pronounced C.P.I.
Bound Normal Fatty Acids
The bound /i-fatty acids show different bimodal dis-tributions from the free w-fatty acids in that their highercarbon number maxima are much less developed thantheir lower carbon number maxima. High carbon num-ber A?-fatty acids are therefore present in lower abun-dance, relative to low carbon number /2-fatty acids, in
1381
S. C. BRASSELLETAL.
the bound fractions than in the free fractions. Thebound «-fatty acids, like the free «-fatty acids, havepronounced C.P.I, values. There appears to be an in-verse correlation between the concentrations of free andbound «-fatty acids.
Unsaturated Fatty Acids
C 1 6 : 1 and C 1 8 : 1 monounsaturated fatty acids weredetected in both the free and the bound fractions ofall samples except Section 440B-8-4. In general, theamounts present varied with the saturated fatty acidcontent. The only polyunsaturated acid detected wastrace amounts of C 1 8 : 2 in Section 440B-3-5. No branchedunsaturated acids were detected in any of the samples.
α,co-Dicarboxylic Acids
α,co-dicarboxylic acids are present in the acid frac-tions of all samples except 440A-7-6. No unsaturateddiacids were detected.
Free Diacids
Free «-diacids were recognized in all samples exceptSection 440A-7-6 and are particularly abundant in Sec-tion 440B-68-2. In each case the dominant componentis the n-C9 diacid with smaller amounts of higherhomologues («-Ci0 - n-Cl6, showing a definite C.P.I.)also present. Branched C 9 and C π diacids were ten-tatively identified in Section 440B-68-2 from their massspectral similarities to the n-C9 and n-Cu diacids, re-spectively, and also from their GC retention times asthey eluted just prior to their normal isomers.
The major component of a small (0.5 g) DSDP sam-ple from Leg 63 (467-110-3) was identified as dibutylnonadioate and probably arises from either the plasticsampling bags or the core liner. The free diacid distribu-tion may therefore be rationalized mainly in terms ofsaponified plasticizer rather than natural oxidativebreakdown of acids with Δ9 unsaturation.
Bound Diacids
The bound α,α>-dicarboxylic acids show a differentand markedly more complex distribution comparedwith the free diacids. The «-C16 diacid is the major com-ponent, whereas the n-C9 diacid is only a minor compo-nent when present. Significant amounts of higher car-bon number homologues (n-C20 - n-C29) also occur inthe bound diacid fractions. Three of the samples (Sec-tions 440A-7-6, 440B-3-5, and 436-11-4) show unimod-al distributions, maximizing at n-Cl6. The other twosections possess bimodal distributions with Section440B-8-4 maximizing at «-C16 and n-C2 , whereas Sec-tion 440B-68-2 peaks at n-Cu and «-C16. The C.P.I,values for the bound diacid fractions are almost unity.No unsaturated or branched diacids were detectedamong the bound diacids.
Branched/Cyclic Acids
Iso- and anteiso-C15 acids are minor components ofall the samples. Isoprenoid acids derived from phytolare not present above trace quantities in any of the sec-tions. However, small amounts of pristanic and phytan-
ic acids were recognized in the bound acid fraction ofSection 440B-68-2. No unsaturated isoprenoid acids(e.g., phytenic acid) were detected in either free orbound fractions. No diterpenoid acids were found in thefree acid fractions, though MF (m/e 239) suggested thattrace amounts were present in the bound fraction ofSection 440A-7-6. Steroidal acids (e.g., 5α-cholanicacid) were not detected in any of the samples. Smallamounts of 17ßH,21αH-bishomohopanoic acid wererecognized in all the sections. No hopenoic acids weredetected.
Hydroxy Fatty Acids
Hydroxy fatty acids only occur in the bound acidfractions. They can be conveniently grouped into fourmajor categories: α-OH, /3-OH, α>-OH, and cutin acids.
α-OH Acids
α-hydroxy acids are minor components of thesamples, though Section 440A-7-6 contains «-C9α-OHacid as a major hydroxy acid. In Section 440B-68-2 asmall amount of «-Ci6α:-OH acid and traces of higherhomologues were detected. No unsaturated α-OH acidswere recognized in any of the samples.
/3-OH Acids
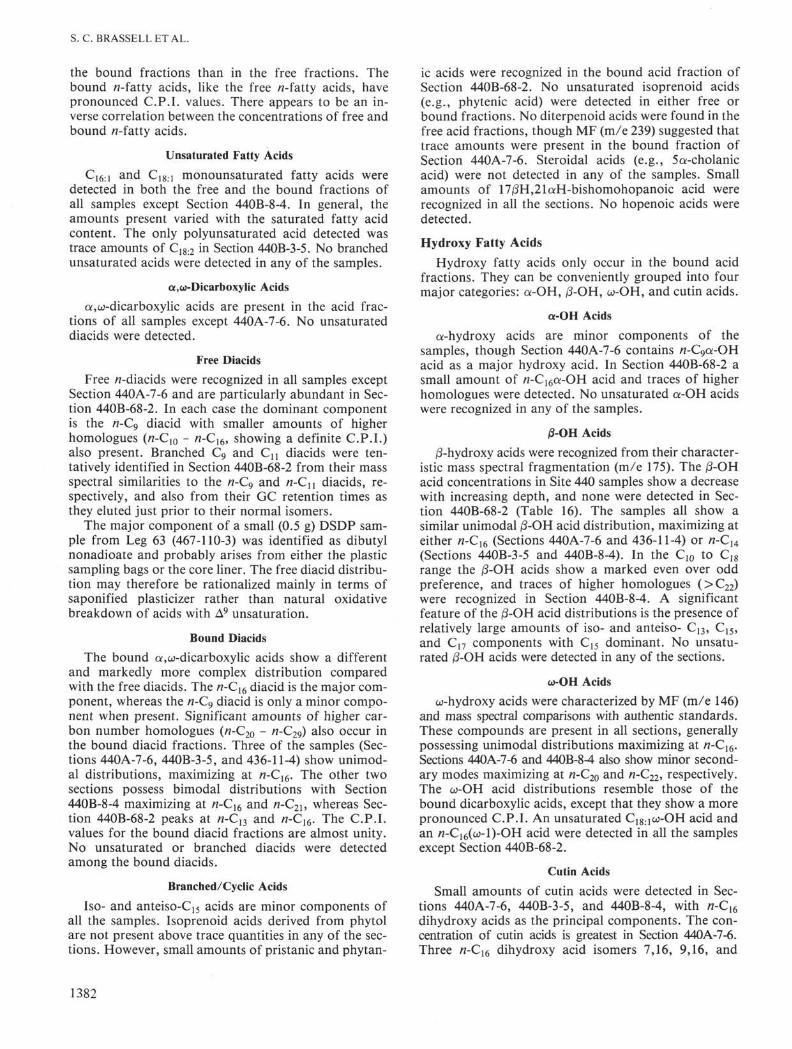
/3-hydroxy acids were recognized from their character-istic mass spectral fragmentation (m/e 175). The /3-OHacid concentrations in Site 440 samples show a decreasewith increasing depth, and none were detected in Sec-tion 440B-68-2 (Table 16). The samples all show asimilar unimodal /3-OH acid distribution, maximizing ateither Λ-C 1 6 (Sections 440A-7-6 and 436-11-4) or Λ-C 1 4
(Sections 440B-3-5 and 440B-8-4). In the C 1 0 to C 1 8
range the /3-OH acids show a marked even over oddpreference, and traces of higher homologues ( > C 2 2 )were recognized in Section 440B-8-4. A significantfeature of the ß-OH acid distributions is the presence ofrelatively large amounts of iso- and anteiso- C13, C15,and C17 components with C15 dominant. No unsatu-rated ß-OH acids were detected in any of the sections.
CÜ-OH Acids
co-hydroxy acids were characterized by MF (m/e 146)and mass spectral comparisons with authentic standards.These compounds are present in all sections, generallypossessing unimodal distributions maximizing at n-Cl6.Sections 440A-7-6 and 440B-8-4 also show minor second-ary modes maximizing at n-C2o and n-C22, respectively.The w-OH acid distributions resemble those of thebound dicarboxylic acids, except that they show a morepronounced C.P.I. An unsaturated C18;1u-OH acid andan /2-C16(co-l)-OH acid were detected in all the samplesexcept Section 440B-68-2.
Cutin Acids
Small amounts of cutin acids were detected in Sec-tions 440A-7-6, 440B-3-5, and 440B-8-4, with n-C16
dihydroxy acids as the principal components. The con-centration of cutin acids is greatest in Section 440A-7-6.Three n-Cl6 dihydroxy acid isomers 7,16, 9,16, and
1382

LIPID ANALYSES
10,16 were characterized in the samples, with the 9,16isomer dominant (Figure 12). Several isomeric mid-chain hydroxy Ci6α,αj-dicarboxylic acids and a singleC 1 8 trihydroxy acid were also found (Table 16).
Humic Acids
Humic acids (HAs) from Sections 440A-7-6,440B-68-2,and 436-11-4 were examined. Yields and elemental anal-yses are given in Table 17. The two high ash contents re-flect how their extraction procedure is susceptible tocontamination by clay minerals.
HA-carbon constitutes only a small amount of the to-tal organic carbon ( < 6 per cent) in each sample (nearestavailable section values of total organic carbon taken).The content is least in the oldest sediment (Section 440B-68-2).
Oxygen contents in the elemental analyses were cal-culated by difference. Some errors are likely in thosedata for the high ash content HAs (>IO per cent),where H and O can be contributed from clay minerals atthe temperature of analysis. The conditions of alkalinereflux in the extraction of bound components could alsohave caused partial degradation and/or oxidative poly-merization of the HA macromolecules. Since phenoliccomponents were not detected in the bound acid frac-tion, it is unlikely that extensive degradation occurred.
The simplest formulae and elementary cells of eachHA were computed from their elementary composi-tions. Assuming one sulphur atom per elementary cell,the formulae and molecular weights are as follows:
HA-440A-7-6HA-440B-68-2HA-436-11-4
C39H48
^48^80C34H49
O 1 4 N 3 SO32N3SO1 6N3S
8141242787
The visible spectra from 350 to 700 nm are typicalof HAs, being largely structureless and showing amonotonic increase in absorbance with decrease inwavelength. In each case, a 20-nm-wide shoulder is pres-ent at 410 nm (Figure 13), together with possible weakbands in the region 600 to 660 nm. Values for the ratioof absorbance at 400 nm to that at 600 nm (E400/600)were computed for each HA (Table 17).
The IR spectra of HAs from Sections 440B-68-2 and436-11-4 are complicated by strong absorptions due to
TABLE 17Humic Acid Data
Yield(mg/g)
Ash Content
ElementalComposition
E400/600
CHNS0
440A-7-6
0.98
1.3
56.45.95.73.9
28.1
5.86
Section440B-68-2
0.37
21.0
46.26.53.52.6
41.2
3.35
436-11-4
0.53
13.3
51.06.16.04.0
32.9
3.29
400 500 600Wavelength (nm)
700
100
3000 2000 1500
Wavenumber (cm )
1000 500
Figure 13. Visible and infrared spectra of humic acids.A. Section 440A-7-6; B. Section 440B-68-2; C. Sec-tion 436-11-4.
Si-O bonds (e.g., 1040, 800cm-1) (Figure 12). All spec-tra show major absorptions due to saturated C-Hbonds, C = C bonds, C = O bonds, and OH bonds intheir various environments. Other forms of C to O bondare also present (phenoxy C-O, methoxy, aromat-ic/aliphatic C-O-C). Broad, weak bands possibly cor-responding to aromatic substitution patterns are present(Flaig et al., 1975; Hue et al., 1978). Nitrogen contentsare high, but there is no evidence of high 1540cm"1
amide absorption, though absorptions due to aminesand heterocyclic-N would be contributing to the spectra.
The HAs from Sections 440A-7-6 and 436-11-4 arevery similar in their IR absorptions. Section 440B-68-2has a considerably different spectrum than the shal-lower sample (Section 440A-7-6), with the intensities ofboth aliphatic/aromatic C-H and C = C bond absorp-tions being reduced relative to that of C = O.
Carotenoids
Carotenoids were assigned from their uv/vis spectrarecorded by stopped-flow scanning in HPLC analysis.Assignments were confirmed by HPLC coinjection withauthentic standards. The series of samples from Site 440show a quantitative decrease (Table 18) of carotenoids
1383
S. C. BRASSELLETAL.
TABLE 18Carotenoid Concentrations (ng/g dry sediment; saponified samples)
0-carotene
Diatoxanthin
Other
Structure*1
XLI
XLII
440A-7-6
130
65
80
Section
440B-3-5
120
34
53
440B-8-4
2.8
n.d.
n.d.
436-11-4
2.2
n.d.
n.d.
Note: For explanation of n.d. see Note to Table 3.aSee Appendix, this chapter.
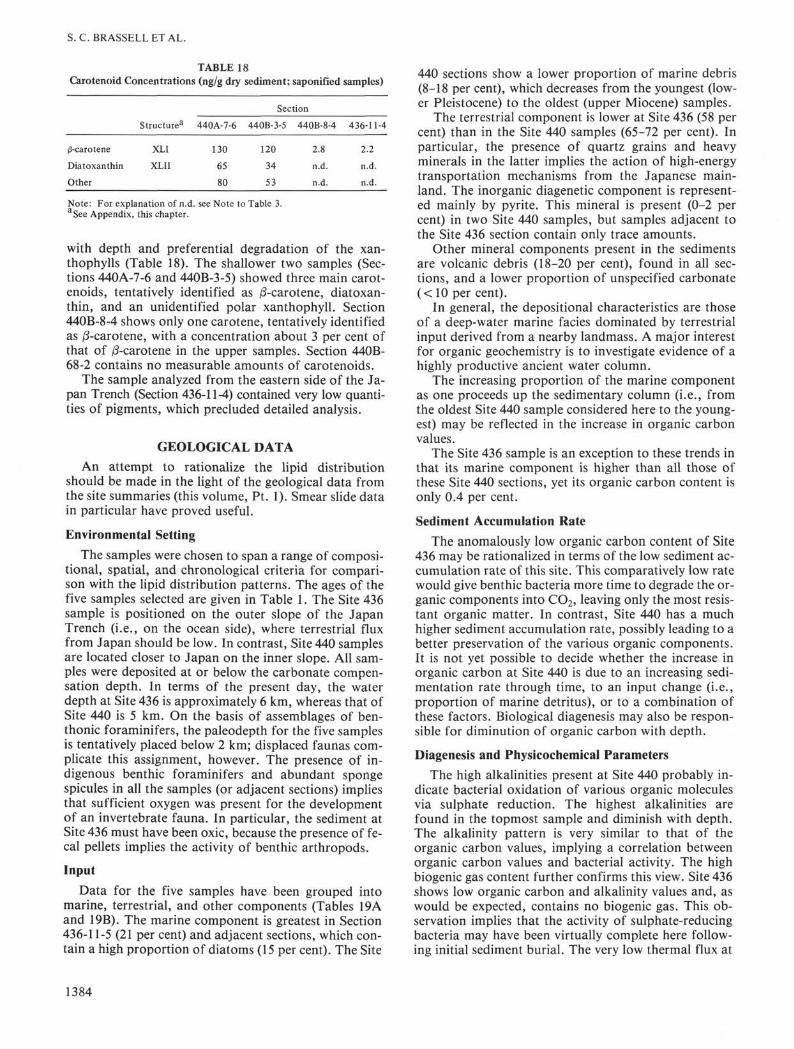
with depth and preferential degradation of the xan-thophylls (Table 18). The shallower two samples (Sec-tions 440A-7-6 and 440B-3-5) showed three main carot-enoids, tentatively identified as ß-carotene, diatoxan-thin, and an unidentified polar xanthophyll. Section440B-8-4 shows only one carotene, tentatively identifiedas ß-carotene, with a concentration about 3 per cent ofthat of ß-carotene in the upper samples. Section 440B-68-2 contains no measurable amounts of carotenoids.
The sample analyzed from the eastern side of the Ja-pan Trench (Section 436-11-4) contained very low quanti-ties of pigments, which precluded detailed analysis.
GEOLOGICAL DATAAn attempt to rationalize the lipid distribution
should be made in the light of the geological data fromthe site summaries (this volume, Pt. 1). Smear slide datain particular have proved useful.
Environmental SettingThe samples were chosen to span a range of composi-
tional, spatial, and chronological criteria for compari-son with the lipid distribution patterns. The ages of thefive samples selected are given in Table 1. The Site 436sample is positioned on the outer slope of the JapanTrench (i.e., on the ocean side), where terrestrial fluxfrom Japan should be low. In contrast, Site 440 samplesare located closer to Japan on the inner slope. All sam-ples were deposited at or below the carbonate compen-sation depth. In terms of the present day, the waterdepth at Site 436 is approximately 6 km, whereas that ofSite 440 is 5 km. On the basis of assemblages of ben-thonic foraminifers, the paleodepth for the five samplesis tentatively placed below 2 km; displaced faunas com-plicate this assignment, however. The presence of in-digenous benthic foraminifers and abundant spongespicules in all the samples (or adjacent sections) impliesthat sufficient oxygen was present for the developmentof an invertebrate fauna. In particular, the sediment atSite 436 must have been oxic, because the presence of fe-cal pellets implies the activity of benthic arthropods.
InputData for the five samples have been grouped into
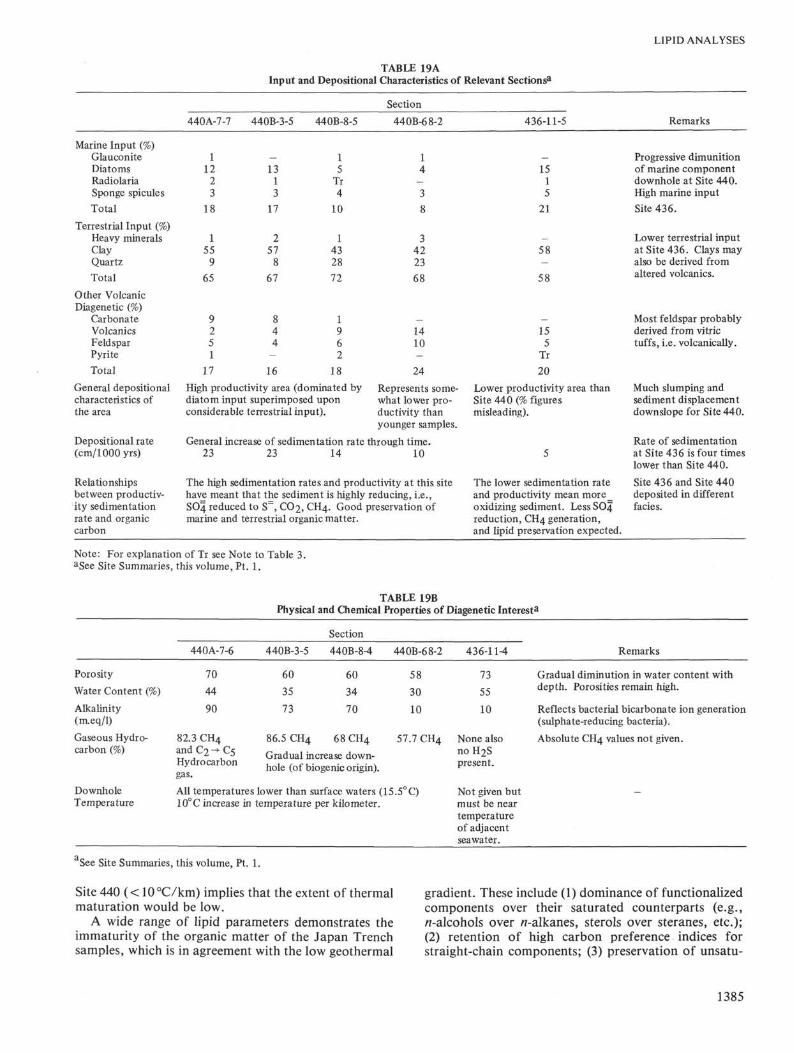
marine, terrestrial, and other components (Tables 19Aand 19B). The marine component is greatest in Section436-11-5 (21 per cent) and adjacent sections, which con-tain a high proportion of diatoms (15 per cent). The Site
440 sections show a lower proportion of marine debris(8-18 per cent), which decreases from the youngest (low-er Pleistocene) to the oldest (upper Miocene) samples.
The terrestrial component is lower at Site 436 (58 percent) than in the Site 440 samples (65-72 per cent). Inparticular, the presence of quartz grains and heavyminerals in the latter implies the action of high-energytransportation mechanisms from the Japanese main-land. The inorganic diagenetic component is represent-ed mainly by pyrite. This mineral is present (0-2 percent) in two Site 440 samples, but samples adjacent tothe Site 436 section contain only trace amounts.
Other mineral components present in the sedimentsare volcanic debris (18-20 per cent), found in all sec-tions, and a lower proportion of unspecified carbonate(< 10 per cent).
In general, the depositional characteristics are thoseof a deep-water marine facies dominated by terrestrialinput derived from a nearby landmass. A major interestfor organic geochemistry is to investigate evidence of ahighly productive ancient water column.
The increasing proportion of the marine componentas one proceeds up the sedimentary column (i.e., fromthe oldest Site 440 sample considered here to the young-est) may be reflected in the increase in organic carbonvalues.
The Site 436 sample is an exception to these trends inthat its marine component is higher than all those ofthese Site 440 sections, yet its organic carbon content isonly 0.4 per cent.
Sediment Accumulation RateThe anomalously low organic carbon content of Site
436 may be rationalized in terms of the low sediment ac-cumulation rate of this site. This comparatively low ratewould give benthic bacteria more time to degrade the or-ganic components into CO2, leaving only the most resis-tant organic matter. In contrast, Site 440 has a muchhigher sediment accumulation rate, possibly leading to abetter preservation of the various organic components.It is not yet possible to decide whether the increase inorganic carbon at Site 440 is due to an increasing sedi-mentation rate through time, to an input change (i.e.,proportion of marine detritus), or to a combination ofthese factors. Biological diagenesis may also be respon-sible for diminution of organic carbon with depth.
Diagenesis and Physicochemical ParametersThe high alkalinities present at Site 440 probably in-
dicate bacterial oxidation of various organic moleculesvia sulphate reduction. The highest alkalinities arefound in the topmost sample and diminish with depth.The alkalinity pattern is very similar to that of theorganic carbon values, implying a correlation betweenorganic carbon values and bacterial activity. The highbiogenic gas content further confirms this view. Site 436shows low organic carbon and alkalinity values and, aswould be expected, contains no biogenic gas. This ob-servation implies that the activity of sulphate-reducingbacteria may have been virtually complete here follow-ing initial sediment burial. The very low thermal flux at
1384
LIPID ANALYSES
TABLE 19AInput and Depositional Characteristics of Relevant Sections3
Marine Input (%)GlauconiteDiatomsRadiolariaSponge spicules
Total
Terrestrial Input (%)Heavy mineralsClayQuartz
Total
Other VolcanicDiagenetic (%)
CarbonateVolcanicsFeldsparPyrite
Total
General depositionalcharacteristics ofthe area
Depositional rate(cm/lOOOyrs)
Relationshipsbetween productiv-ity sedimentationrate and organiccarbon
440A-7-7 440B-3-5 440B-8-5
1 - 112 13 5
2 1 Tr3 3 4
18 17 10
1 2 155 57 43
9 8 28
65 67 72
9 8 12 4 95 4 61 - 2
17 16 18
High productivity area (dominated bydiatom input superimposed uponconsiderable terrestrial input).
Section
440B-68-2
14
-3
8
34223
68
_1410-
24
Represents some-what lower pro-ductivity thanyounger samples.
General increase of sedimentation rate through time.23 23 14 10
The high sedimentation rates and productivity at this sitehave meant that the sediment is highly reducing, i.e.,SO4 reduced to S=, CO2, CH4. Good preservation ofmarine and terrestrial organic matter.
436-11-5
—15
15
21
-58-
58
-155
Tr
20
Lower productivity area thanSite 440 (% figuresmisleading).
5
The lower sedimentation rateand productivity mean moreoxidizing sediment. LessSC 4reduction, CH4 generation,and lipid preservation expected.
Remarks
Progressive dimunitionof marine componentdownhole at Site 440.High marine input
Site 436.
Lower terrestrial inputat Site 436. Clays mayalso be derived fromaltered volcanics.
Most feldspar probablyderived from vitrictuffs, i.e. volcanically.
Much slumping andsediment displacementdownslope for Site 440.
Rate of sedimentationat Site 436 is four timeslower than Site 440.
Site 436 and Site 440deposited in differentfacie s.
Note: For explanation of Tr see Note to Table 3.aSee Site Summaries, this volume, Pt. 1.
TABLE 19BPhysical and Chemical Properties of Diagenetic Interesta
Section
440A-7-6 440B-3-5 440B-8-4 440B-68-2 436-11-4 Remarks
Porosity
Water Content (%)
Alkalinity(m.eq/1)
Gaseous Hydro-carbon (%)
DownholeTemperature
70
44
90
82.3 CH4
and C2 C5Hydrocarbongas.
60
35
73
60
34
70
86.5 CH4 68 CH4
Gradual increase down-hole (of biogenic origin).
All temperatures lower than surface waters (15.5°C)10°C increase in temperature per kilometer.
58
30
10
,7CH4
0
73
55
10
None also
present.
Not given butmust be neartemperatureof adjacentsea water.
Gradual diminution in water content withdepth. Porosities remain high.
Reflects bacterial bicarbonate ion generation(sulphate-reducing bacteria).
Absolute CH4 values not given.
See Site Summaries, this volume, Pt. 1.
Site 440 (< 10 °C/km) implies that the extent of thermalmaturation would be low.
A wide range of lipid parameters demonstrates theimmaturity of the organic matter of the Japan Trenchsamples, which is in agreement with the low geothermal
gradient. These include (1) dominance of functionalizedcomponents over their saturated counterparts (e.g.,^-alcohols over n-alkanes, sterols over steranes, etc.);(2) retention of high carbon preference indices forstraight-chain components; (3) preservation of unsatu-
1385

S. C. BRASSELLETAL.
rated components, even in the deepest sample (440B-68-2); and (4) dominance of 17/3H-hopanes over their 17α:Hcounterparts.
CONCLUSIONS AND SUMMARY
The lipids of the Japan Trench samples originatefrom three different sources: terrestrial, marine, andbacterial. The key components or distributions indica-tive of these inputs in this context are summarized asfollows:
Terrestrial Indicators
1) «-alkane, ^-methyl ketone, «-alkanol, and n-alkenol distributions;
2) the presence of 3-oxytriterpenoids and their aro-matic derivatives;
3) the recognition of fern-9(ll)-ene;4) the presence of relatively high quantities of 24-eth-
ylcholest-5-en-3/3-ol and 24-ethyl-5α-cholestan-3/3-ol inthe sterols (Site 440 samples only);
5) the presence of aromatic diterpenoids, retene, andsimonellite;
6) the dominance of 9,16 di-OH hexadecanoic acidover the 10,16 isomer.
Marine Indicators (nonbacterial)
1) marine sterols, i.e., C2 6 and C3 0 sterols, 23,24-di-methylsterols, Δ24(28> sterols, etc.;
2) very long chain ketones and ethers indicative ofcoccolithophore inputs (skeletal debris are absent belowcarbonate compensation depth);
3) sterol ethers;4) high amounts of phytol;5) the diatom carotenoid, diatoxanthin.
Bacterial Indicators
1) The similarity of «-alkane and /i-methylketonedistributions;
2) the presence of extended hopanoids, i.e., acids,alcohols, ketones, alkanes, etc.;
3) the presence of steroidal ketones;4) the presence of aromatic components derived from
3-oxytriterpenoids;5) the presence of squalane;6) the presence of ß-OH acids tentatively assigned to
Desulphovibrio genus.The four samples at Site 440 provide indications of dia-genetic transformations illustrating their increasing ma-turity with depth. Various parameters show this trend,and the principal ratios that increase with depth areas follows:
1) Diasterene/Δ2 sterene;2) sterane/sterene;3) hop-17(21 )-ene/hop-22(29)-ene;4) 17αH, 21/3H/17/3H, 210H for hopane and homo-
hopane;5) retene/simonellite;6) phytane/phytenes;7) phytane/phytol;8) pristane/phytol.
The top two samples (Sections 440A-7-6 and 440B-3-5),which are only 27 meters apart in depth, show greatsimilarities in the distributions and quantities of most oftheir lipid components. These likenesses illustrate thereproducibility of the organic geochemical results fromdifferent samples of similar lithologies and ages.
In addition to the diagenetic trend at Site 440, the lip-id distributions indicate that the level of productivitywas lower, and/or the water column more oxic, duringdeposition of Sections 440B-8-4 and 440B-68-2 than forthe shallower samples. Such indicators are the lower rel-ative amounts in the deeper samples of the following:
1) Sterols and their diagenetic products, stanols,sterenes, sterones, diasterenes, etc.;
2) acyclic diterpenoids, i.e., phytol and its diageneticproducts, phytenes, phytane, pristane, and 6,10,14-tri-methylpentadecan-2-one;
3) very long chain ketones;4) sterol ethers.
The lipid distributions of Section 436-11-4 differ fromthose of the Site 440 samples in the following respects:
1) The abundance of sterols, and hence their diage-netic products sterenes, diasterenes, steranes, etc., ismarkedly lower.
2) The amounts of phytol and its diagenetic productsare markedly lower.
3) The methyl/ethyl ratio of the very long chain ke-tones is greater, suggesting a different source of organ-ism.
4) Branched alkanols are absent.The main similarities are the following:
1) The sterol ethers present;2) the distributions of /7-alkanes, ^-methyl ketones,
rt-alkanols, and «-alkenols;3) the range of hopanes and hopenes present.
These results augment and are an extension of the geo-logical data, which show a greatly reduced proportionof marine input in Sections 440B-8-5 and 440B-68-2(Table 19A).
The differences between the Site 440 samples andSection 436-11-4 can be attributed largely to lower pro-ductivity in the water column. The terrestrial input toSection 436-11-4 is lower (absolutely) than for the Site440 samples but is more easily discerned because themarine input to Section 436-11-4 is also low and hencedoes not mask the terrestrial component so effectively.These deductions may again be used to complement thegeological data of Tables 19A and 19B. The measure-ments specific to organic geochemistry can provide in-formation unobtainable by other geologic disciplines —for instance, the assessment here of marine input fromcoccolith-derived long-chain ketones. On the otherhand, the lability of particular marine lipids, e.g., manycarotenoids, causes their sedimentary distributions to bepartially unrepresentative of the original lipid inputsand inevitably introduces some uncertainty into conclu-sions concerning the depositional environment.
Some description of the samples may also be obtainedby grouping the quantitated components according tostructural characteristics (Table 20). This procedure at-
1386
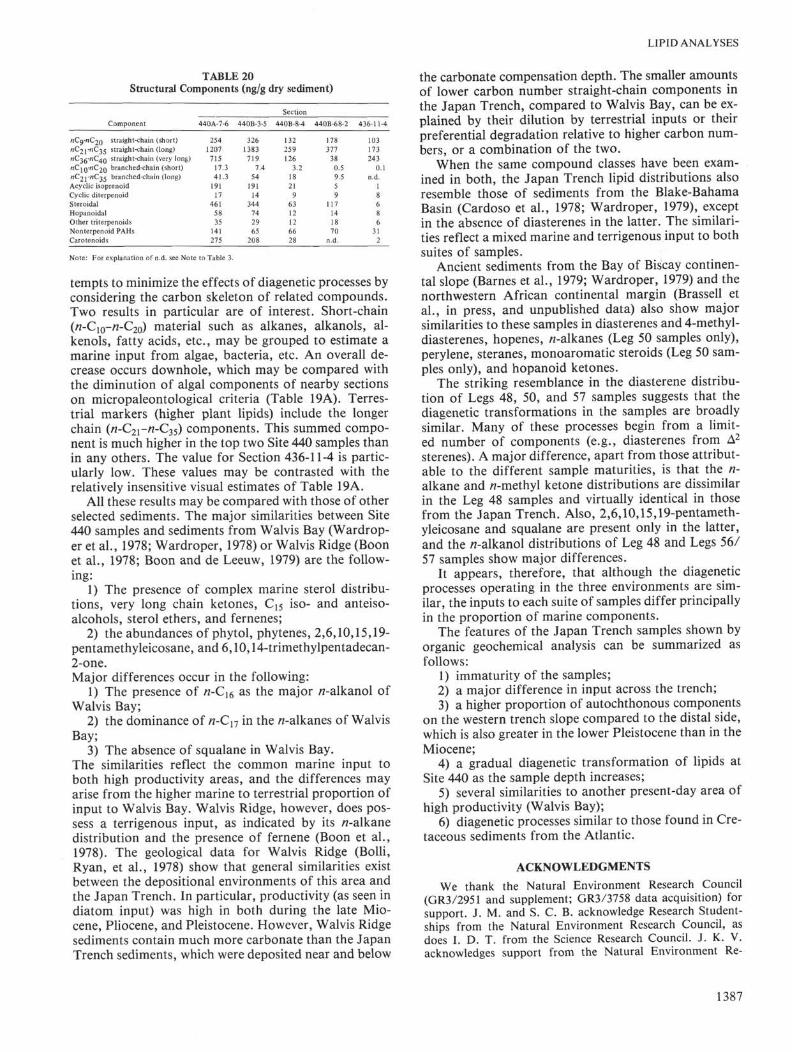
LIPID ANALYSES
TABLE 20Structural Components (ng/g dry sediment)
Component
nCy-nCjQ straight-chain (short)
" ^ 2 r " ^ 3 5 straight-chain (long)
nC•^fr-nC^Q straight-chain (very long)
«C1Q-nC2Q branched-chain (short)
J1C2J-/1C35 branched-chain (long)
Acyclic isoprenoid
Cyclic diterpenoid
Steroidal
Hopanoidal
Other triterpenoids
Nonterpenoid PAHs
Carotenoids
440A-7-6
254
1207
715
17.341.3
191
17461
58
35141
275
440B-3-5
326
1383
719
7.4
54
191
14
344
7429
65
208
Section
440B-8-4
132
259
126
3.2
18
21
9
63
12
12
66
28
440B-68-2
178
377
38
0.5
9.5
5
9
117
14
18
70
n.d.
436-11-4
103
173
24 3
0.1
n.d.
1
8
6
8
6
31
2
Note: For explanation of n.d. see Note to Table 3.
tempts to minimize the effects of diagenetic processes byconsidering the carbon skeleton of related compounds.Two results in particular are of interest. Short-chain(«-C1 O-Λ-C2O) material such as alkanes, alkanols, al-kenols, fatty acids, etc., may be grouped to estimate amarine input from algae, bacteria, etc. An overall de-crease occurs downhole, which may be compared withthe diminution of algal components of nearby sectionson micropaleontological criteria (Table 19A). Terres-trial markers (higher plant lipids) include the longerchain (n-C2i-n-C35) components. This summed compo-nent is much higher in the top two Site 440 samples thanin any others. The value for Section 436-11-4 is partic-ularly low. These values may be contrasted with therelatively insensitive visual estimates of Table 19A.
All these results may be compared with those of otherselected sediments. The major similarities between Site440 samples and sediments from Walvis Bay (Wardrop-er et al., 1978; Wardroper, 1978) or Walvis Ridge (Boonet al., 1978; Boon and de Leeuw, 1979) are the follow-ing:
1) The presence of complex marine sterol distribu-tions, very long chain ketones, Ci5 iso- and anteiso-alcohols, sterol ethers, and fernenes;
2) the abundances of phytol, phytenes, 2,6,10,15,19-pentamethyleicosane, and 6,10,14-trimethylpentadecan-2-one.Major differences occur in the following:
1) The presence of «-C16 as the major /7-alkanol ofWalvis Bay;
2) the dominance of n-Cxl in the «-alkanes of WalvisBay;
3) The absence of squalane in Walvis Bay.The similarities reflect the common marine input toboth high productivity areas, and the differences mayarise from the higher marine to terrestrial proportion ofinput to Walvis Bay. Walvis Ridge, however, does pos-sess a terrigenous input, as indicated by its «-alkanedistribution and the presence of fernene (Boon et al.,1978). The geological data for Walvis Ridge (Bolli,Ryan, et al., 1978) show that general similarities existbetween the depositional environments of this area andthe Japan Trench. In particular, productivity (as seen indiatom input) was high in both during the late Mio-cene, Pliocene, and Pleistocene. However, Walvis Ridgesediments contain much more carbonate than the JapanTrench sediments, which were deposited near and below
the carbonate compensation depth. The smaller amountsof lower carbon number straight-chain components inthe Japan Trench, compared to Walvis Bay, can be ex-plained by their dilution by terrestrial inputs or theirpreferential degradation relative to higher carbon num-bers, or a combination of the two.
When the same compound classes have been exam-ined in both, the Japan Trench lipid distributions alsoresemble those of sediments from the Blake-BahamaBasin (Cardoso et al., 1978; Wardroper, 1979), exceptin the absence of diasterenes in the latter. The similari-ties reflect a mixed marine and terrigenous input to bothsuites of samples.
Ancient sediments from the Bay of Biscay continen-tal slope (Barnes et al., 1979; Wardroper, 1979) and thenorthwestern African continental margin (Brassell etal., in press, and unpublished data) also show majorsimilarities to these samples in diasterenes and 4-methyl-diasterenes, hopenes, «-alkanes (Leg 50 samples only),perylene, steranes, monoaromatic steroids (Leg 50 sam-ples only), and hopanoid ketones.
The striking resemblance in the diasterene distribu-tion of Legs 48, 50, and 57 samples suggests that thediagenetic transformations in the samples are broadlysimilar. Many of these processes begin from a limit-ed number of components (e.g., diasterenes from Δ2
sterenes). A major difference, apart from those attribut-able to the different sample maturities, is that the n-alkane and «-methyl ketone distributions are dissimilarin the Leg 48 samples and virtually identical in thosefrom the Japan Trench. Also, 2,6,10,15,19-pentameth-yleicosane and squalane are present only in the latter,and the «-alkanol distributions of Leg 48 and Legs 56/57 samples show major differences.
It appears, therefore, that although the diageneticprocesses operating in the three environments are sim-ilar, the inputs to each suite of samples differ principallyin the proportion of marine components.
The features of the Japan Trench samples shown byorganic geochemical analysis can be summarized asfollows:
1) immaturity of the samples;2) a major difference in input across the trench;3) a higher proportion of autochthonous components
on the western trench slope compared to the distal side,which is also greater in the lower Pleistocene than in theMiocene;
4) a gradual diagenetic transformation of lipids atSite 440 as the sample depth increases;
5) several similarities to another present-day area ofhigh productivity (Walvis Bay);
6) diagenetic processes similar to those found in Cre-taceous sediments from the Atlantic.
ACKNOWLEDGMENTS
We thank the Natural Environment Research Council(GR3/2951 and supplement; GR3/3758 data acquisition) forsupport. J. M. and S. C. B. acknowledge Research Student-ships from the Natural Environment Research Council, asdoes I. D. T. from the Science Research Council. J. K. V.acknowledges support from the Natural Environment Re-
1387
S. C. BRASSELL ET AL.
search Council (GR3/3419). We thank Mrs. A. P. Gowar forassistance with GG-MS analyses. We also thank Mr. G.Cooles of British Petroleum Ltd., Research Division (Sun-bury-on-Thames) for subsample analyses and C. Cornfordand D. Leythaeuser for helpful criticism.
REFERENCESBarnes, P. J., Brassell, S. C , Comet, P. A., Eglinton, G.,
McEvoy, J., Maxwell, J. R., Wardroper, A. M. K., andVolkman, J. K., 1979. Preliminary lipid analyses of coresections 18, 24, and 30 from Hole 402A. In Montadert, L.,Roberts, D. G., et al., Init. Repts. DSDP, 48: Washington(U.S. Govt. Printing Office), 965-976.
Bolli, H. M., Ryan, W. B. F., et al., 1978. Walvis Ridge-Sites 362 and 363. In Bolli, H. M., Ryan, W. B. F., et al.,Init. Repts. DSDP, 40: Washington (U.S. Govt. PrintingOffice), 183-263.
Boon, J. J., and de Leeuw, J. W., 1979. The analysis of waxesters, very long mid-chain ketones and sterol ethersisolated from Walvis Bay diatomaceous ooze. Mar. Chem.,7, 117-132.
Boon, J. J., van der Meer, F. W., Schuyl, P. J. W., de LeeuwJ. W., Schenck, P. A., and Burlingame, A. L., 1978.Organic geochemical analyses of core samples from Site362, Walvis Ridge, DSDP Leg 40. In Bolli, H., Ryan,W. B. F., et al., Init. Repts. DSDP, Suppl. to Vols. 38, 39,40, and 41: Washington (U.S. Govt. Printing Office),627-637.
Brassell, S. C , Comet, P. A., Eglinton, G., McEvoy, J.,Maxwell, J. R., Quirke, J. M. E, and Volkman, J. K., inpress. Preliminary lipid analysis of core sections 14, 18, and28 from Hole 416A. In Lancelot, Y., Winterer, E. L., etal., Init. Repts. DSDP, 50: Washington (U.S. Govt. Print-ing Office).
Cardoso, J. N., Wardroper, A. M. K., Watts, C. D., Barnes,P. J., Maxwell, J. R., Eglinton, G., Mound, D. G., andSpeers, G. C , 1978. Preliminary organic geochemicalanalyses; Site 391, Leg 44 of the Deep Sea Drilling Project.In Benson, W. E., Sheridan, R. E., et al., Init. Repts.DSDP, 44: Washington (U.S. Govt. Printing Office),617-623.
Flaig, W., Beutelspacher, H., and Rietz, H., 1975. Chemicalcomposition and physical properties of humic substances.
In Gieseking, J. E. (Ed.), So/7 Components (Vol. 1): NewYork (Springer-Verlag), 1-187.
Hue, A. Y., Durand, B., and Monin, J. C , 1978. Humic com-pounds and kerogens in cores from Black Sea sediments,Leg 42B, Holes 379A, B and 380A. In Ross, D. A., Nep-rochnov, Y. P., et al., Init. Repts. DSDP, 42, Pt. 2:Washington (U.S. Govt. Printing Office), 737-748.
Philp, R. P., Brown, S., Calvin, M., Brassell, S., and EglintonG., 1978. Hydrocarbon and fatty acid distributions inrecently deposited algal mats at Laguna Guerrero, BajaCalifornia. In Krumbein, W. E. (Ed.), Environmental Bio-geochemistry and Geomicrobiology (Vol. 1: The AquaticEnvironment): Ann Arbor (Ann Arbor Science), 255-270.
Spyckerelle, C , 1975. Constituants aromatiques de sediments[Ph.D. dissert.] Université Louis Pasteur, Strasbourg,France.
Spyckerelle, C , Greiner, A. Ch., Albrecht, P., and Ourisson,G., 1977a. Aromatic hydrocarbons from geological sourcesIII. A tetrahydrochrysene derived from triterpenes in Re-cent and old sediments, 3,3,7-bismethyl-l,2,3,4,-tetrahy-drochrysene. J. Chem. Res. (M), 3746-3777 (S), 330-331.
, 1977b. Aromatic hydrocarbons from geologicalsources IV. An octahydrochrysene, derived from triterpenesin Recent and old sediments, 3,3,7,12a-tetramethyl-l,2,3,4,4a,ll,12,12a-octahydrochrysene. /. Chem. Res. (M), 3801-3828 (S), 332-333.
Streibl, M., and Herout, V., 1969. Terpenoids—especiallyoxygenated mono-, sesqui-, di- and triterpenes. In Eglin-ton, G., and Murphy, M. T. J. (Eds.), Organic Geochem-istry, Methods and Results: Heidelberg (Springer-Verlag),pp. 401-424.
Volkman, J. K., Eglinton, G., Corner, E. D. S., and Sargent,J. R., in press. Novel unsaturated straight chain C37-C39methyl and ethyl ketones in marine sediments and a coc-colithophore Emiliania huxleyi. In Douglas A. G., andMaxwell, J. R. (Eds.), Advances in Organic Geochemistry1979: Oxford (Pergamon Press).
Wardroper, A. M. K., 1979. Aspects of the geochemistry ofpolycyclic isoprenoids [Ph.D. dissert.]. University ofBristol, U. K.
Wardroper, A. M. K., Maxwell, J. R., and Morris, R. J.,1978. Sterols of a diatomaceous ooze from Walvis Bay.Steroids, 32,203-221.
1388
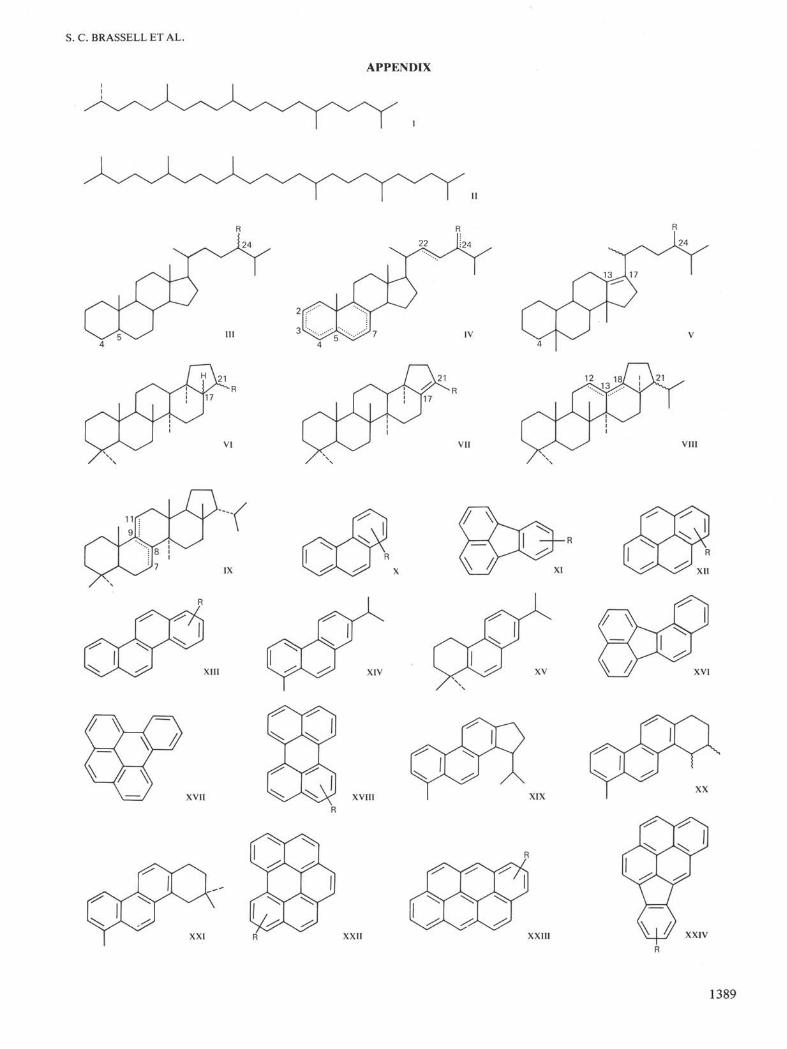
S. C. BRASSELL ET AL.
APPENDIX
24 22 M24
IV
VI VII VIII
XIV
XVIII
XV
XIX
XVI
XXI XXII XXIII XXIV
1389

APPENDIX - Continued
LIPID ANALYSES
HO 3 XL
xu
XLII
1390