Embed Size (px)
Citation preview
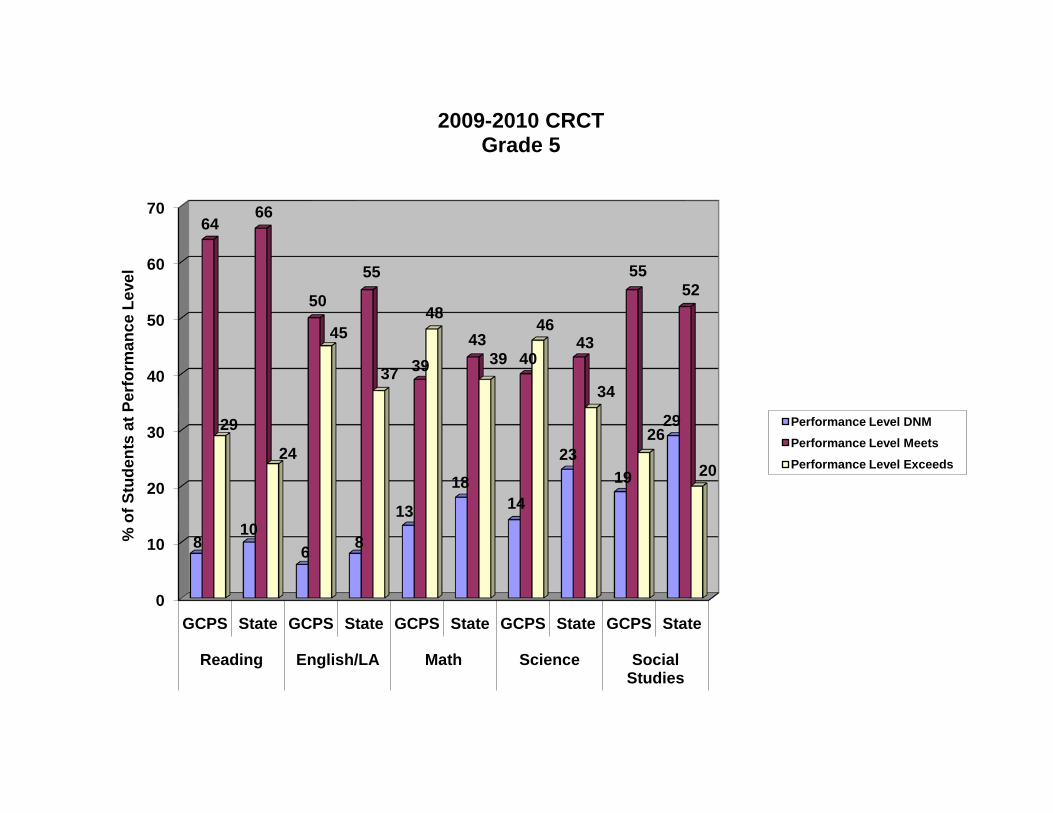
DNM Meets ExceedsGCPS 8 64 29 834State 10 66 24 830
GCPS 6 50 45 843State 8 55 37 837
GCPS 13 39 48 847State 18 43 39 837
GCPS 14 40 46 842State 23 43 34 829
GCPS 19 55 26 829State 29 52 20 820
Performance Level DNM - Does Not Meet The StandardPerformance Level Meets - Meets The StandardPerformance Level Exceeds - ExceedsThe Standard
Science
Social Studies
Math
2009-2010% at Performance Level
CRCTGrade 5
Reading
English/LA
Mean Score
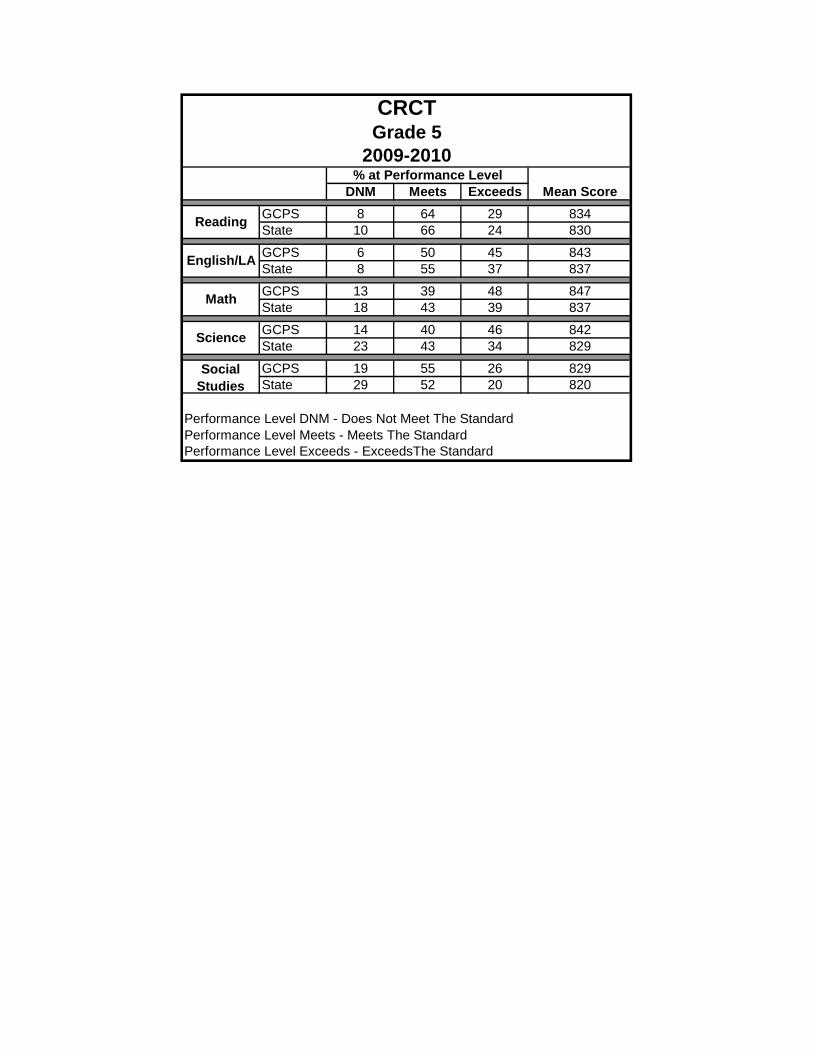
DNM Meets Exceeds DNM Meets ExceedsReading 953 26 71 3 1514 30 62 8English/Language Arts 952 20 73 8 1513 25 61 14Math 978 31 53 15 1515 44 39 16Science 978 45 47 8 1513 38 39 22Social Studies 950 56 42 2 1509 48 43 10
Performance Level Meets - Meets The StandardPerformance Level Exceeds - ExceedsThe Standard
CRCT 2009-2010Grade 5
DemographicsEnglish Language Learners Special Education Students
# Tested # Tested% at Performance Level% at Performance Level
Performance Level DNM - Does Not Meet The Standard
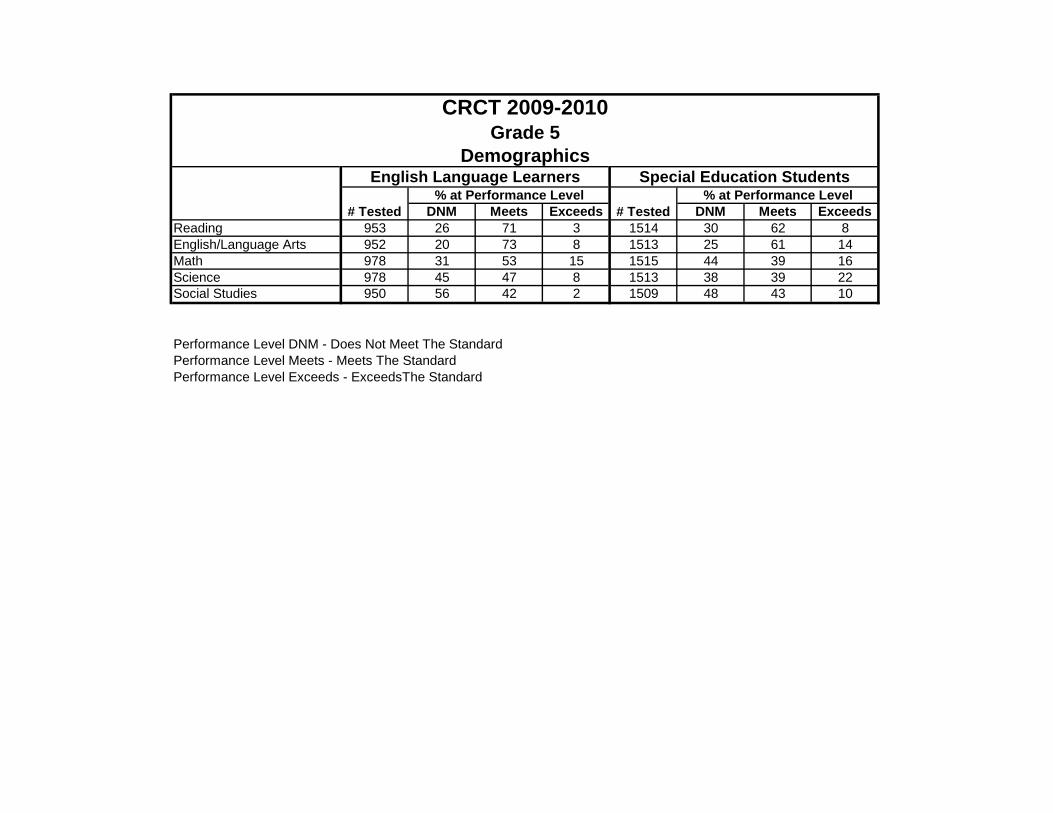
DNM Meets Exceeds DNM Meets Exceeds DNM Meets ExceedsAsian/Pacific Islander 1253 3 51 46 1253 3 31 66 1257 4 23 73Black/Non-Hispanic 3544 10 70 19 3540 7 59 35 3546 17 48 36Hispanic 3112 12 71 16 3109 9 59 31 3129 17 47 36American Indian/Alaskan Native 41 7 66 27 41 7 54 39 41 17 39 44White/Non-Hispanic 4037 4 56 40 4034 3 40 57 4039 8 31 61Multi-racial 465 5 60 35 465 3 47 51 466 11 37 53
DNM Meets Exceeds DNM Meets ExceedsAsian/Pacific Islander 1255 7 30 63 1255 7 30 63Black/Non-Hispanic 3541 18 49 32 3541 18 49 32Hispanic 3127 21 48 31 3127 21 48 31American Indian/Alaskan Native 41 15 49 37 41 15 49 37White/Non-Hispanic 4036 6 30 64 4036 6 30 64Multi-racial 466 10 36 53 466 10 36 30
Performance Level DNM - Does Not Meet The StandardPerformance Level Meets - Meets The StandardPerformance Level Exceeds - ExceedsThe Standard
Science Social Studies
# Tested% at Performance Level
# Tested
English/Language Arts Math
# Tested% at Performance Level
# Tested% at Performance Level
Reading
% at Performance Level
CRCT 2009-2010Grade 5Ethnicity
Ethnicity
# Tested% at Performance Level
CRCT 2002010Grade 5
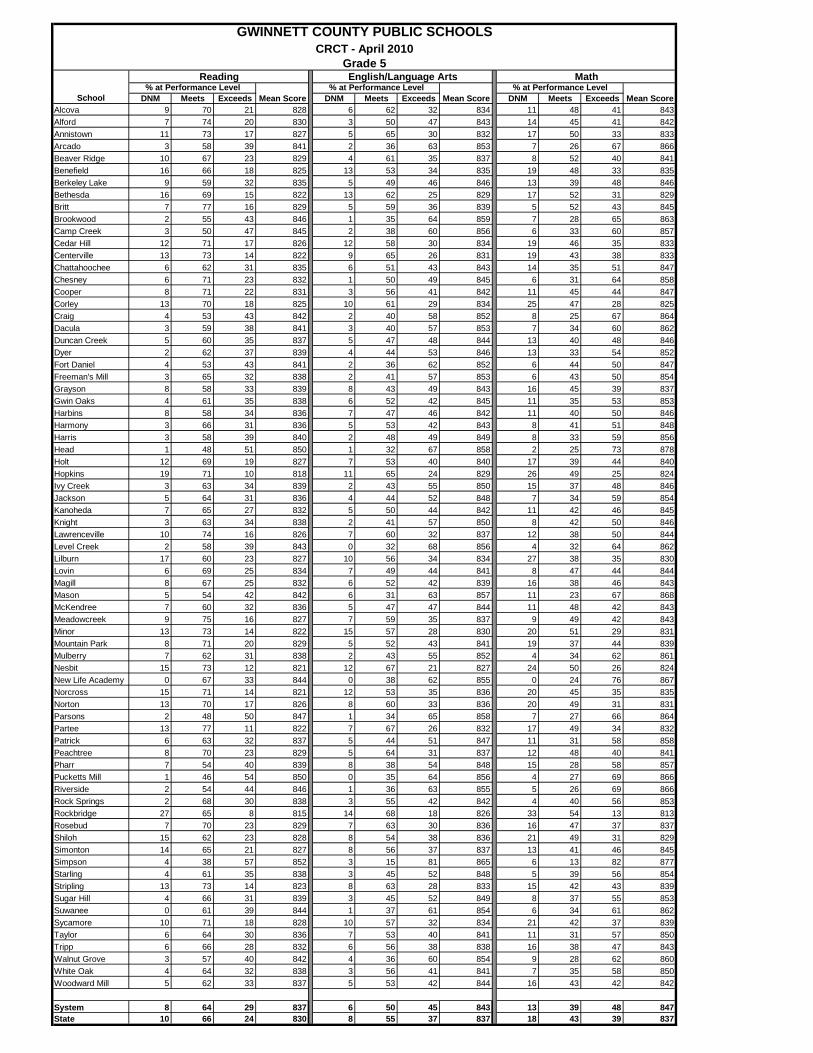
DNM Meets Exceeds DNM Meets Exceeds DNM Meets ExceedsAlcova 9 70 21 828 6 62 32 834 11 48 41 843Alford 7 74 20 830 3 50 47 843 14 45 41 842Annistown 11 73 17 827 5 65 30 832 17 50 33 833 Arcado 3 58 39 841 2 36 63 853 7 26 67 866Beaver Ridge 10 67 23 829 4 61 35 837 8 52 40 841Benefield 16 66 18 825 13 53 34 835 19 48 33 835Berkeley Lake 9 59 32 835 5 49 46 846 13 39 48 846Bethesda 16 69 15 822 13 62 25 829 17 52 31 829Britt 7 77 16 829 5 59 36 839 5 52 43 845Brookwood 2 55 43 846 1 35 64 859 7 28 65 863Camp Creek 3 50 47 845 2 38 60 856 6 33 60 857Cedar Hill 12 71 17 826 12 58 30 834 19 46 35 833Centerville 13 73 14 822 9 65 26 831 19 43 38 833Chattahoochee 6 62 31 835 6 51 43 843 14 35 51 847Chesney 6 71 23 832 1 50 49 845 6 31 64 858Cooper 8 71 22 831 3 56 41 842 11 45 44 847Corley 13 70 18 825 10 61 29 834 25 47 28 825Craig 4 53 43 842 2 40 58 852 8 25 67 864Dacula 3 59 38 841 3 40 57 853 7 34 60 862Duncan Creek 5 60 35 837 5 47 48 844 13 40 48 846Dyer 2 62 37 839 4 44 53 846 13 33 54 852Fort Daniel 4 53 43 841 2 36 62 852 6 44 50 847Freeman's Mill 3 65 32 838 2 41 57 853 6 43 50 854Grayson 8 58 33 839 8 43 49 843 16 45 39 837Gwin Oaks 4 61 35 838 6 52 42 845 11 35 53 853Harbins 8 58 34 836 7 47 46 842 11 40 50 846Harmony 3 66 31 836 5 53 42 843 8 41 51 848Harris 3 58 39 840 2 48 49 849 8 33 59 856Head 1 48 51 850 1 32 67 858 2 25 73 878Holt 12 69 19 827 7 53 40 840 17 39 44 840Hopkins 19 71 10 818 11 65 24 829 26 49 25 824Ivy Creek 3 63 34 839 2 43 55 850 15 37 48 846Jackson 5 64 31 836 4 44 52 848 7 34 59 854Kanoheda 7 65 27 832 5 50 44 842 11 42 46 845Knight 3 63 34 838 2 41 57 850 8 42 50 846Lawrenceville 10 74 16 826 7 60 32 837 12 38 50 844Level Creek 2 58 39 843 0 32 68 856 4 32 64 862Lilburn 17 60 23 827 10 56 34 834 27 38 35 830Lovin 6 69 25 834 7 49 44 841 8 47 44 844Magill 8 67 25 832 6 52 42 839 16 38 46 843Mason 5 54 42 842 6 31 63 857 11 23 67 868McKendree 7 60 32 836 5 47 47 844 11 48 42 843Meadowcreek 9 75 16 827 7 59 35 837 9 49 42 843Minor 13 73 14 822 15 57 28 830 20 51 29 831Mountain Park 8 71 20 829 5 52 43 841 19 37 44 839Mulberry 7 62 31 838 2 43 55 852 4 34 62 861Nesbit 15 73 12 821 12 67 21 827 24 50 26 824New Life Academy 0 67 33 844 0 38 62 855 0 24 76 867Norcross 15 71 14 821 12 53 35 836 20 45 35 835Norton 13 70 17 826 8 60 33 836 20 49 31 831Parsons 2 48 50 847 1 34 65 858 7 27 66 864Partee 13 77 11 822 7 67 26 832 17 49 34 832Patrick 6 63 32 837 5 44 51 847 11 31 58 858Peachtree 8 70 23 829 5 64 31 837 12 48 40 841Pharr 7 54 40 839 8 38 54 848 15 28 58 857Pucketts Mill 1 46 54 850 0 35 64 856 4 27 69 866Riverside 2 54 44 846 1 36 63 855 5 26 69 866Rock Springs 2 68 30 838 3 55 42 842 4 40 56 853Rockbridge 27 65 8 815 14 68 18 826 33 54 13 813Rosebud 7 70 23 829 7 63 30 836 16 47 37 837Shiloh 15 62 23 828 8 54 38 836 21 49 31 829Simonton 14 65 21 827 8 56 37 837 13 41 46 845Simpson 4 38 57 852 3 15 81 865 6 13 82 877Starling 4 61 35 838 3 45 52 848 5 39 56 854Stripling 13 73 14 823 8 63 28 833 15 42 43 839Sugar Hill 4 66 31 839 3 45 52 849 8 37 55 853Suwanee 0 61 39 844 1 37 61 854 6 34 61 862Sycamore 10 71 18 828 10 57 32 834 21 42 37 839Taylor 6 64 30 836 7 53 40 841 11 31 57 850Tripp 6 66 28 832 6 56 38 838 16 38 47 843Walnut Grove 3 57 40 842 4 36 60 854 9 28 62 860White Oak 4 64 32 838 3 56 41 841 7 35 58 850Woodward Mill 5 62 33 837 5 53 42 844 16 43 42 842
System 8 64 29 837 6 50 45 843 13 39 48 847State 10 66 24 830 8 55 37 837 18 43 39 837
CRCT - April 2010
School Mean ScoreMean ScoreMean Score
Math
GWINNETT COUNTY PUBLIC SCHOOLS
Grade 5
% at Performance LevelReading
% at Performance LevelEnglish/Language Arts
% at Performance Level
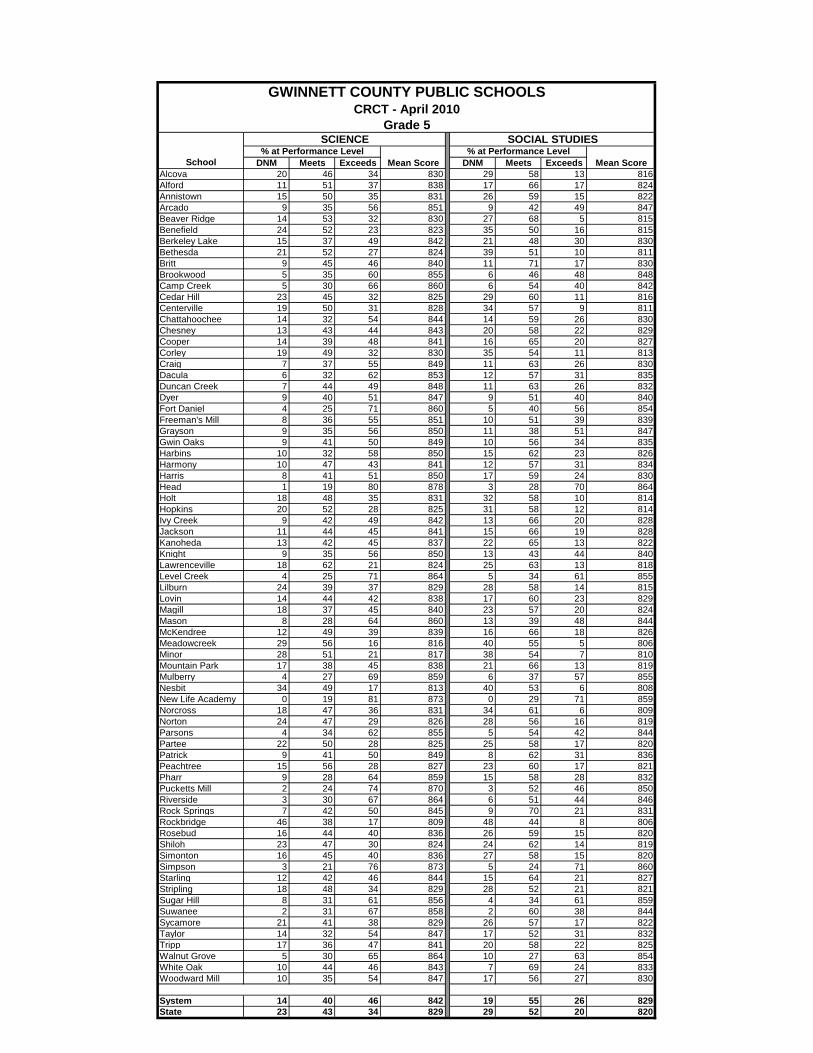
DNM Meets Exceeds DNM Meets ExceedsAlcova 20 46 34 830 29 58 13 816Alford 11 51 37 838 17 66 17 824Annistown 15 50 35 831 26 59 15 822Arcado 9 35 56 851 9 42 49 847Beaver Ridge 14 53 32 830 27 68 5 815Benefield 24 52 23 823 35 50 16 815Berkeley Lake 15 37 49 842 21 48 30 830Bethesda 21 52 27 824 39 51 10 811Britt 9 45 46 840 11 71 17 830Brookwood 5 35 60 855 6 46 48 848Camp Creek 5 30 66 860 6 54 40 842Cedar Hill 23 45 32 825 29 60 11 816Centerville 19 50 31 828 34 57 9 811Chattahoochee 14 32 54 844 14 59 26 830Chesney 13 43 44 843 20 58 22 829Cooper 14 39 48 841 16 65 20 827Corley 19 49 32 830 35 54 11 813Craig 7 37 55 849 11 63 26 830Dacula 6 32 62 853 12 57 31 835Duncan Creek 7 44 49 848 11 63 26 832Dyer 9 40 51 847 9 51 40 840Fort Daniel 4 25 71 860 5 40 56 854Freeman's Mill 8 36 55 851 10 51 39 839Grayson 9 35 56 850 11 38 51 847Gwin Oaks 9 41 50 849 10 56 34 835Harbins 10 32 58 850 15 62 23 826Harmony 10 47 43 841 12 57 31 834Harris 8 41 51 850 17 59 24 830Head 1 19 80 878 3 28 70 864Holt 18 48 35 831 32 58 10 814Hopkins 20 52 28 825 31 58 12 814Ivy Creek 9 42 49 842 13 66 20 828Jackson 11 44 45 841 15 66 19 828Kanoheda 13 42 45 837 22 65 13 822Knight 9 35 56 850 13 43 44 840Lawrenceville 18 62 21 824 25 63 13 818Level Creek 4 25 71 864 5 34 61 855Lilburn 24 39 37 829 28 58 14 815Lovin 14 44 42 838 17 60 23 829Magill 18 37 45 840 23 57 20 824Mason 8 28 64 860 13 39 48 844McKendree 12 49 39 839 16 66 18 826Meadowcreek 29 56 16 816 40 55 5 806Minor 28 51 21 817 38 54 7 810Mountain Park 17 38 45 838 21 66 13 819Mulberry 4 27 69 859 6 37 57 855Nesbit 34 49 17 813 40 53 6 808New Life Academy 0 19 81 873 0 29 71 859Norcross 18 47 36 831 34 61 6 809Norton 24 47 29 826 28 56 16 819Parsons 4 34 62 855 5 54 42 844Partee 22 50 28 825 25 58 17 820Patrick 9 41 50 849 8 62 31 836Peachtree 15 56 28 827 23 60 17 821Pharr 9 28 64 859 15 58 28 832Pucketts Mill 2 24 74 870 3 52 46 850Riverside 3 30 67 864 6 51 44 846Rock Springs 7 42 50 845 9 70 21 831Rockbridge 46 38 17 809 48 44 8 806Rosebud 16 44 40 836 26 59 15 820Shiloh 23 47 30 824 24 62 14 819Simonton 16 45 40 836 27 58 15 820Simpson 3 21 76 873 5 24 71 860Starling 12 42 46 844 15 64 21 827Stripling 18 48 34 829 28 52 21 821Sugar Hill 8 31 61 856 4 34 61 859Suwanee 2 31 67 858 2 60 38 844Sycamore 21 41 38 829 26 57 17 822Taylor 14 32 54 847 17 52 31 832Tripp 17 36 47 841 20 58 22 825Walnut Grove 5 30 65 864 10 27 63 854White Oak 10 44 46 843 7 69 24 833Woodward Mill 10 35 54 847 17 56 27 830
System 14 40 46 842 19 55 26 829State 23 43 34 829 29 52 20 820
SOCIAL STUDIES
School Mean ScoreMean Score
GWINNETT COUNTY PUBLIC SCHOOLSCRCT - April 2010
Grade 5
% at Performance Level% at Performance LevelSCIENCE
2005
-200
6
2006
-200
7
2007
-200
8
2008
-200
9
2009
-201
0
2005
-200
6
2006
-200
7
2007
-200
8
2008
-200
9
2009
-201
0
2005
-200
6
2006
-200
7
2007
-200
8
2008
-200
9
2009
-201
0
2005
-200
6
2005
-200
6
2007
-200
8
2008
-200
9
2009
-201
0
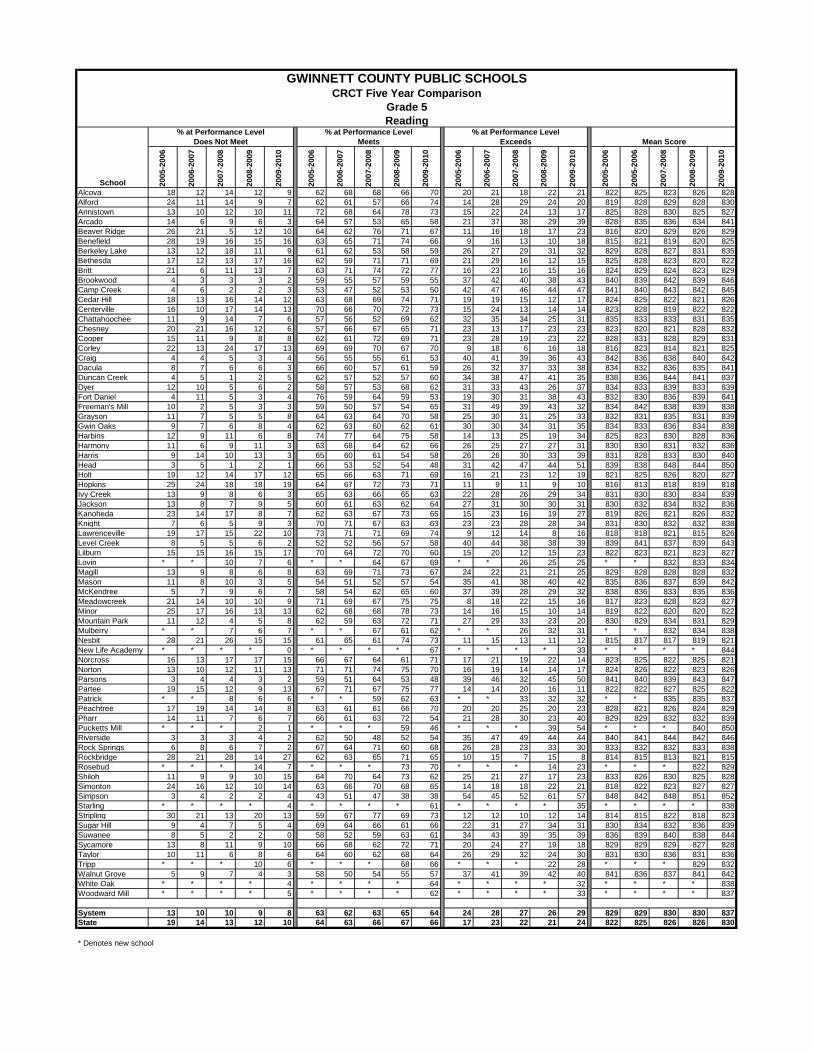
Alcova 18 12 14 12 9 62 68 68 66 70 20 21 18 22 21 822 825 823 826 828Alford 24 11 14 9 7 62 61 57 66 74 14 28 29 24 20 819 828 829 828 830Annistown 13 10 12 10 11 72 68 64 78 73 15 22 24 13 17 825 828 830 825 827Arcado 14 6 9 6 3 64 57 53 65 58 21 37 38 29 39 828 835 836 834 841Beaver Ridge 26 21 5 12 10 64 62 76 71 67 11 16 18 17 23 816 820 829 826 829Benefield 28 19 16 15 16 63 65 71 74 66 9 16 13 10 18 815 821 819 820 825Berkeley Lake 13 12 18 11 9 61 62 53 58 59 26 27 29 31 32 829 828 827 831 835Bethesda 17 12 13 17 16 62 59 71 71 69 21 29 16 12 15 825 828 823 820 822Britt 21 6 11 13 7 63 71 74 72 77 16 23 16 15 16 824 829 824 823 829Brookwood 4 3 3 3 2 59 55 57 59 55 37 42 40 38 43 840 839 842 839 846Camp Creek 4 6 2 2 3 53 47 52 53 50 42 47 46 44 47 841 840 843 842 845Cedar Hill 18 13 16 14 12 63 68 69 74 71 19 19 15 12 17 824 825 822 821 826Centerville 16 10 17 14 13 70 66 70 72 73 15 24 13 14 14 823 828 819 822 822Chattahoochee 11 9 14 7 6 57 56 52 69 62 32 35 34 25 31 835 833 833 831 835Chesney 20 21 16 12 6 57 66 67 65 71 23 13 17 23 23 823 820 821 828 832Cooper 15 11 9 8 8 62 61 72 69 71 23 28 19 23 22 828 831 828 829 831Corley 22 13 24 17 13 69 69 70 67 70 9 18 6 16 18 816 823 814 821 825Craig 4 4 5 3 4 56 55 55 61 53 40 41 39 36 43 842 836 838 840 842Dacula 8 7 6 6 3 66 60 57 61 59 26 32 37 33 38 834 832 836 835 841Duncan Creek 4 5 1 2 5 62 57 52 57 60 34 38 47 41 35 838 836 844 841 837Dyer 12 10 5 6 2 58 57 53 68 62 31 33 43 26 37 834 833 839 833 839Fort Daniel 4 11 5 3 4 76 59 64 59 53 19 30 31 38 43 832 830 836 839 841Freeman's Mill 10 2 5 3 3 59 50 57 54 65 31 49 39 43 32 834 842 838 839 838Grayson 11 7 5 5 8 64 63 64 70 58 25 30 31 25 33 832 831 835 831 839Gwin Oaks 9 7 6 8 4 62 63 60 62 61 30 30 34 31 35 834 833 836 834 838Harbins 12 9 11 6 8 74 77 64 75 58 14 13 25 19 34 825 823 830 828 836Harmony 11 6 9 11 3 63 68 64 62 66 26 25 27 27 31 830 830 831 832 836Harris 9 14 10 13 3 65 60 61 54 58 26 26 30 33 39 831 828 833 830 840Head 3 5 1 2 1 66 53 52 54 48 31 42 47 44 51 839 838 848 844 850Holt 19 12 14 17 12 65 66 63 71 69 16 21 23 12 19 821 825 826 820 827Hopkins 25 24 18 18 19 64 67 72 73 71 11 9 11 9 10 816 813 818 819 818Ivy Creek 13 9 8 6 3 65 63 66 65 63 22 28 26 29 34 831 830 830 834 839Jackson 13 8 7 9 5 60 61 63 62 64 27 31 30 30 31 830 832 834 832 836Kanoheda 23 14 17 8 7 62 63 67 73 65 15 23 16 19 27 819 826 821 826 832Knight 7 6 5 9 3 70 71 67 63 63 23 23 28 28 34 831 830 832 832 838Lawrenceville 19 17 15 22 10 73 71 71 69 74 9 12 14 8 16 818 818 821 815 826Level Creek 8 5 5 6 2 52 52 56 57 58 40 44 38 38 39 839 841 837 839 843Lilburn 15 15 16 15 17 70 64 72 70 60 15 20 12 15 23 822 823 821 823 827Lovin * * 10 7 6 * * 64 67 69 * * 26 25 25 * * 832 833 834Magill 13 9 8 6 8 63 69 71 73 67 24 22 21 21 25 829 828 828 828 832Mason 11 8 10 3 5 54 51 52 57 54 35 41 38 40 42 835 836 837 839 842McKendree 5 7 9 6 7 58 54 62 65 60 37 39 28 29 32 838 836 833 835 836Meadowcreek 21 14 10 10 9 71 69 67 75 75 8 18 22 15 16 817 823 828 823 827Minor 25 17 16 13 13 62 68 68 78 73 14 16 15 10 14 819 822 820 820 822Mountain Park 11 12 4 5 8 62 59 63 72 71 27 29 33 23 20 830 829 834 831 829Mulberry * * 7 6 7 * * 67 61 62 * * 26 32 31 * * 832 834 838Nesbit 28 21 26 15 15 61 65 61 74 73 11 15 13 11 12 815 817 817 819 821New Life Academy * * * * 0 * * * * 67 * * * * 33 * * * * 844Norcross 16 13 17 17 15 66 67 64 61 71 17 21 19 22 14 823 825 822 825 821Norton 13 10 12 11 13 71 71 74 75 70 16 19 14 14 17 824 826 822 823 826Parsons 3 4 4 3 2 59 51 64 53 48 39 46 32 45 50 841 840 839 843 847Partee 19 15 12 9 13 67 71 67 75 77 14 14 20 16 11 822 822 827 825 822Patrick * * 8 6 6 * * 59 62 63 * * 33 32 32 * * 835 835 837Peachtree 17 19 14 14 8 63 61 61 66 70 20 20 25 20 23 828 821 826 824 829Pharr 14 11 7 6 7 66 61 63 72 54 21 28 30 23 40 829 829 832 832 839Pucketts Mill * * * 2 1 * * * 59 46 * * * 39 54 * * * 840 850Riverside 3 3 3 4 2 62 50 48 52 54 35 47 49 44 44 840 841 844 842 846Rock Springs 6 8 6 7 2 67 64 71 60 68 26 28 23 33 30 833 832 832 833 838Rockbridge 28 21 28 14 27 62 63 65 71 65 10 15 7 15 8 814 815 813 821 815Rosebud * * * 14 7 * * * 73 70 * * * 14 23 * * * 822 829Shiloh 11 9 9 10 15 64 70 64 73 62 25 21 27 17 23 833 826 830 825 828Simonton 24 16 12 10 14 63 66 70 68 65 14 18 18 22 21 818 822 823 827 827Simpson 3 4 2 2 4 43 51 47 38 38 54 45 52 61 57 848 842 848 851 852Starling * * * * 4 * * * * 61 * * * * 35 * * * * 838Stripling 30 21 13 20 13 59 67 77 69 73 12 12 10 12 14 814 815 822 818 823Sugar Hill 9 4 7 5 4 69 64 66 61 66 22 31 27 34 31 830 834 832 836 839Suwanee 8 5 2 2 0 58 52 59 63 61 34 43 39 35 39 836 839 840 838 844Sycamore 13 8 11 9 10 66 68 62 72 71 20 24 27 19 18 829 829 829 827 828Taylor 10 11 6 8 6 64 60 62 68 64 26 29 32 24 30 831 830 836 831 836Tripp * * * 10 6 * * * 68 66 * * * 22 28 * * * 829 832Walnut Grove 5 9 7 4 3 58 50 54 55 57 37 41 39 42 40 841 836 837 841 842White Oak * * * * 4 * * * * 64 * * * * 32 * * * * 838Woodward Mill * * * * 5 * * * * 62 * * * * 33 * * * * 837
System 13 10 10 9 8 63 62 63 65 64 24 28 27 26 29 829 829 830 830 837State 19 14 13 12 10 64 63 66 67 66 17 23 22 21 24 822 825 826 826 830
Does Not Meet Meets Exceeds Mean Score
GWINNETT COUNTY PUBLIC SCHOOLSCRCT Five Year Comparison
Grade 5Reading
* Denotes new school
% at Performance Level % at Performance Level % at Performance Level
School
2005
-200
6
2006
-200
7
2007
-200
8
2008
-200
9
2009
-201
0
2005
-200
6
2006
-200
7
2007
-200
8
2008
-200
9
2009
-201
0
2005
-200
6
2006
-200
7
2007
-200
8
2008
-200
9
2009
-201
0
2005
-200
6
2006
-200
7
2007
-200
8
2008
-200
9
2009
-201
0
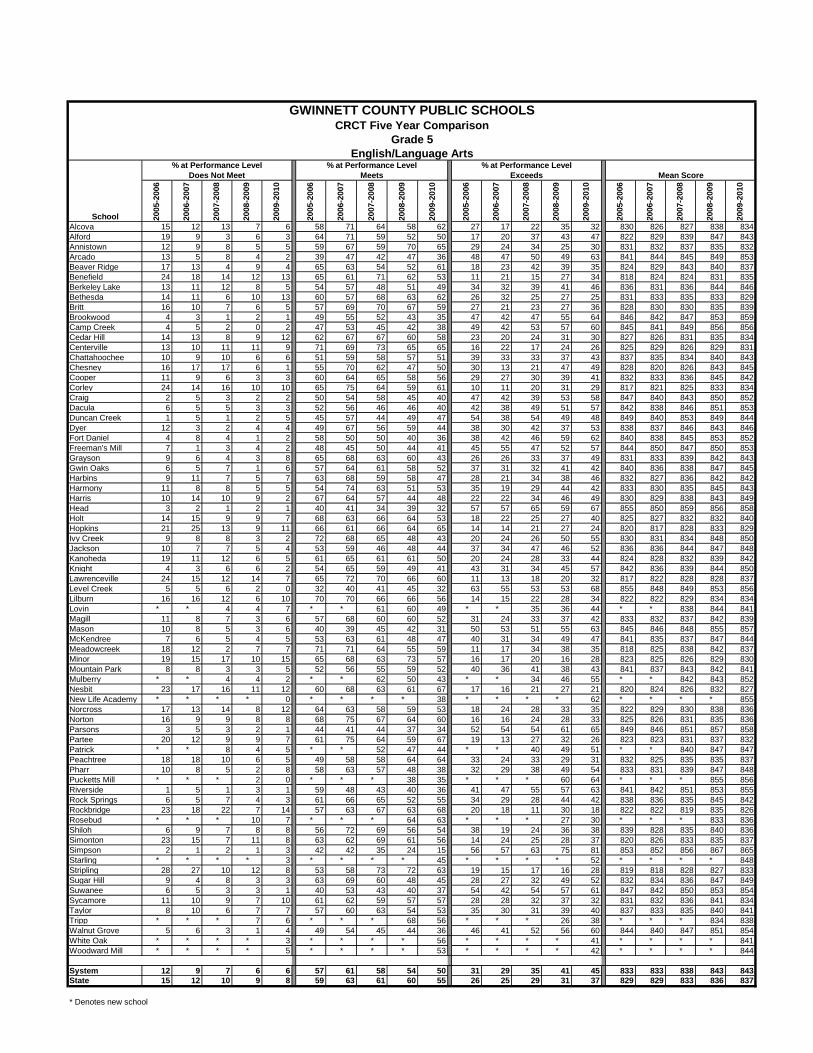
Alcova 15 12 13 7 6 58 71 64 58 62 27 17 22 35 32 830 826 827 838 834Alford 19 9 3 6 3 64 71 59 52 50 17 20 37 43 47 822 829 839 847 843Annistown 12 9 8 5 5 59 67 59 70 65 29 24 34 25 30 831 832 837 835 832Arcado 13 5 8 4 2 39 47 42 47 36 48 47 50 49 63 841 844 845 849 853Beaver Ridge 17 13 4 9 4 65 63 54 52 61 18 23 42 39 35 824 829 843 840 837Benefield 24 18 14 12 13 65 61 71 62 53 11 21 15 27 34 818 824 824 831 835Berkeley Lake 13 11 12 8 5 54 57 48 51 49 34 32 39 41 46 836 831 836 844 846Bethesda 14 11 6 10 13 60 57 68 63 62 26 32 25 27 25 831 833 835 833 829Britt 16 10 7 6 5 57 69 70 67 59 27 21 23 27 36 828 830 830 835 839Brookwood 4 3 1 2 1 49 55 52 43 35 47 42 47 55 64 846 842 847 853 859Camp Creek 4 5 2 0 2 47 53 45 42 38 49 42 53 57 60 845 841 849 856 856Cedar Hill 14 13 8 9 12 62 67 67 60 58 23 20 24 31 30 827 826 831 835 834Centerville 13 10 11 11 9 71 69 73 65 65 16 22 17 24 26 825 829 826 829 831Chattahoochee 10 9 10 6 6 51 59 58 57 51 39 33 33 37 43 837 835 834 840 843Chesney 16 17 17 6 1 55 70 62 47 50 30 13 21 47 49 828 820 826 843 845Cooper 11 9 6 3 3 60 64 65 58 56 29 27 30 39 41 832 833 836 845 842Corley 24 14 16 10 10 65 75 64 59 61 10 11 20 31 29 817 821 825 833 834Craig 2 5 3 2 2 50 54 58 45 40 47 42 39 53 58 847 840 843 850 852Dacula 6 5 5 3 3 52 56 46 46 40 42 38 49 51 57 842 838 846 851 853Duncan Creek 1 5 1 2 5 45 57 44 49 47 54 38 54 49 48 849 840 853 849 844Dyer 12 3 2 4 4 49 67 56 59 44 38 30 42 37 53 838 837 846 843 846Fort Daniel 4 8 4 1 2 58 50 50 40 36 38 42 46 59 62 840 838 845 853 852Freeman's Mill 7 1 3 4 2 48 45 50 44 41 45 55 47 52 57 844 850 847 850 853Grayson 9 6 4 3 8 65 68 63 60 43 26 26 33 37 49 831 833 839 842 843Gwin Oaks 6 5 7 1 6 57 64 61 58 52 37 31 32 41 42 840 836 838 847 845Harbins 9 11 7 5 7 63 68 59 58 47 28 21 34 38 46 832 827 836 842 842Harmony 11 8 8 5 5 54 74 63 51 53 35 19 29 44 42 833 830 835 845 843Harris 10 14 10 9 2 67 64 57 44 48 22 22 34 46 49 830 829 838 843 849Head 3 2 1 2 1 40 41 34 39 32 57 57 65 59 67 855 850 859 856 858Holt 14 15 9 9 7 68 63 66 64 53 18 22 25 27 40 825 827 832 832 840Hopkins 21 25 13 9 11 66 61 66 64 65 14 14 21 27 24 820 817 828 833 829Ivy Creek 9 8 8 3 2 72 68 65 48 43 20 24 26 50 55 830 831 834 848 850Jackson 10 7 7 5 4 53 59 46 48 44 37 34 47 46 52 836 836 844 847 848Kanoheda 19 11 12 6 5 61 65 61 61 50 20 24 28 33 44 824 828 832 839 842Knight 4 3 6 6 2 54 65 59 49 41 43 31 34 45 57 842 836 839 844 850Lawrenceville 24 15 12 14 7 65 72 70 66 60 11 13 18 20 32 817 822 828 828 837Level Creek 5 5 6 2 0 32 40 41 45 32 63 55 53 53 68 855 848 849 853 856Lilburn 16 16 12 6 10 70 70 66 66 56 14 15 22 28 34 822 822 829 834 834Lovin * * 4 4 7 * * 61 60 49 * * 35 36 44 * * 838 844 841Magill 11 8 7 3 6 57 68 60 60 52 31 24 33 37 42 833 832 837 842 839Mason 10 8 5 3 6 40 39 45 42 31 50 53 51 55 63 845 846 848 855 857McKendree 7 6 5 4 5 53 63 61 48 47 40 31 34 49 47 841 835 837 847 844Meadowcreek 18 12 2 7 7 71 71 64 55 59 11 17 34 38 35 818 825 838 842 837Minor 19 15 17 10 15 65 68 63 73 57 16 17 20 16 28 823 825 826 829 830Mountain Park 8 8 3 3 5 52 56 55 59 52 40 36 41 38 43 841 837 843 842 841Mulberry * * 4 4 2 * * 62 50 43 * * 34 46 55 * * 842 843 852Nesbit 23 17 16 11 12 60 68 63 61 67 17 16 21 27 21 820 824 826 832 827New Life Academy * * * * 0 * * * * 38 * * * * 62 * * * * 855Norcross 17 13 14 8 12 64 63 58 59 53 18 24 28 33 35 822 829 830 838 836Norton 16 9 9 8 8 68 75 67 64 60 16 16 24 28 33 825 826 831 835 836Parsons 3 5 3 2 1 44 41 44 37 34 52 54 54 61 65 849 846 851 857 858Partee 20 12 9 9 7 61 75 64 59 67 19 13 27 32 26 823 823 831 837 832Patrick * * 8 4 5 * * 52 47 44 * * 40 49 51 * * 840 847 847Peachtree 18 18 10 6 5 49 58 58 64 64 33 24 33 29 31 832 825 835 835 837Pharr 10 8 5 2 8 58 63 57 48 38 32 29 38 49 54 833 831 839 847 848Pucketts Mill * * * 2 0 * * * 38 35 * * * 60 64 * * * 855 856Riverside 1 5 1 3 1 59 48 43 40 36 41 47 55 57 63 841 842 851 853 855Rock Springs 6 5 7 4 3 61 66 65 52 55 34 29 28 44 42 838 836 835 845 842Rockbridge 23 18 22 7 14 57 63 67 63 68 20 18 11 30 18 822 822 819 835 826Rosebud * * * 10 7 * * * 64 63 * * * 27 30 * * * 833 836Shiloh 6 9 7 8 8 56 72 69 56 54 38 19 24 36 38 839 828 835 840 836Simonton 23 15 7 11 8 63 62 69 61 56 14 24 25 28 37 820 826 833 835 837Simpson 2 1 2 1 3 42 42 35 24 15 56 57 63 75 81 853 852 856 867 865Starling * * * * 3 * * * * 45 * * * * 52 * * * * 848Stripling 28 27 10 12 8 53 58 73 72 63 19 15 17 16 28 819 818 828 827 833Sugar Hill 9 4 8 3 3 63 69 60 48 45 28 27 32 49 52 832 834 836 847 849Suwanee 6 5 3 3 1 40 53 43 40 37 54 42 54 57 61 847 842 850 853 854Sycamore 11 10 9 7 10 61 62 59 57 57 28 28 32 37 32 831 832 836 841 834Taylor 8 10 6 7 7 57 60 63 54 53 35 30 31 39 40 837 833 835 840 841Tripp * * * 7 6 * * * 68 56 * * * 26 38 * * * 834 838Walnut Grove 5 6 3 1 4 49 54 45 44 36 46 41 52 56 60 844 840 847 851 854White Oak * * * * 3 * * * * 56 * * * * 41 * * * * 841Woodward Mill * * * * 5 * * * * 53 * * * * 42 * * * * 844
System 12 9 7 6 6 57 61 58 54 50 31 29 35 41 45 833 833 838 843 843State 15 12 10 9 8 59 63 61 60 55 26 25 29 31 37 829 829 833 836 837
Does Not Meet Meets Exceeds Mean Score
GWINNETT COUNTY PUBLIC SCHOOLSCRCT Five Year Comparison
Grade 5English/Language Arts
* Denotes new school
% at Performance Level % at Performance Level % at Performance Level
School
2007
-200
8
2008
-200
9
2009
-201
0
2007
-200
8
2008
-200
9
2009
-201
0
2007
-200
8
2008
-200
9
2009
-201
0
2007
-200
8
2008
-200
9
2009
-201
0
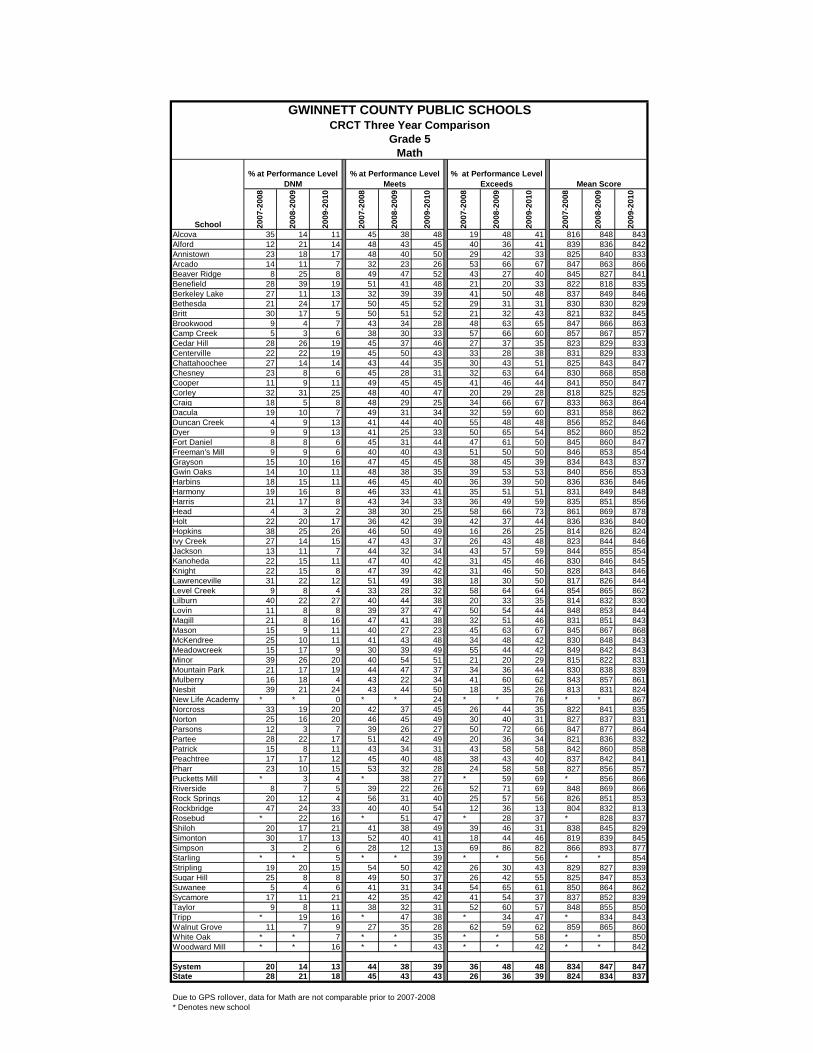
Alcova 35 14 11 45 38 48 19 48 41 816 848 843Alford 12 21 14 48 43 45 40 36 41 839 836 842Annistown 23 18 17 48 40 50 29 42 33 825 840 833Arcado 14 11 7 32 23 26 53 66 67 847 863 866Beaver Ridge 8 25 8 49 47 52 43 27 40 845 827 841Benefield 28 39 19 51 41 48 21 20 33 822 818 835Berkeley Lake 27 11 13 32 39 39 41 50 48 837 849 846Bethesda 21 24 17 50 45 52 29 31 31 830 830 829Britt 30 17 5 50 51 52 21 32 43 821 832 845Brookwood 9 4 7 43 34 28 48 63 65 847 866 863Camp Creek 5 3 6 38 30 33 57 66 60 857 867 857Cedar Hill 28 26 19 45 37 46 27 37 35 823 829 833Centerville 22 22 19 45 50 43 33 28 38 831 829 833Chattahoochee 27 14 14 43 44 35 30 43 51 825 843 847Chesney 23 8 6 45 28 31 32 63 64 830 868 858Cooper 11 9 11 49 45 45 41 46 44 841 850 847Corley 32 31 25 48 40 47 20 29 28 818 825 825Craig 18 5 8 48 29 25 34 66 67 833 863 864Dacula 19 10 7 49 31 34 32 59 60 831 858 862Duncan Creek 4 9 13 41 44 40 55 48 48 856 852 846Dyer 9 9 13 41 25 33 50 65 54 852 860 852Fort Daniel 8 8 6 45 31 44 47 61 50 845 860 847Freeman's Mill 9 9 6 40 40 43 51 50 50 846 853 854Grayson 15 10 16 47 45 45 38 45 39 834 843 837Gwin Oaks 14 10 11 48 38 35 39 53 53 840 856 853Harbins 18 15 11 46 45 40 36 39 50 836 836 846Harmony 19 16 8 46 33 41 35 51 51 831 849 848Harris 21 17 8 43 34 33 36 49 59 835 851 856Head 4 3 2 38 30 25 58 66 73 861 869 878Holt 22 20 17 36 42 39 42 37 44 836 836 840Hopkins 38 25 26 46 50 49 16 26 25 814 826 824Ivy Creek 27 14 15 47 43 37 26 43 48 823 844 846Jackson 13 11 7 44 32 34 43 57 59 844 855 854Kanoheda 22 15 11 47 40 42 31 45 46 830 846 845Knight 22 15 8 47 39 42 31 46 50 828 843 846Lawrenceville 31 22 12 51 49 38 18 30 50 817 826 844Level Creek 9 8 4 33 28 32 58 64 64 854 865 862Lilburn 40 22 27 40 44 38 20 33 35 814 832 830Lovin 11 8 8 39 37 47 50 54 44 848 853 844Magill 21 8 16 47 41 38 32 51 46 831 851 843Mason 15 9 11 40 27 23 45 63 67 845 867 868McKendree 25 10 11 41 43 48 34 48 42 830 848 843Meadowcreek 15 17 9 30 39 49 55 44 42 849 842 843Minor 39 26 20 40 54 51 21 20 29 815 822 831Mountain Park 21 17 19 44 47 37 34 36 44 830 838 839Mulberry 16 18 4 43 22 34 41 60 62 843 857 861Nesbit 39 21 24 43 44 50 18 35 26 813 831 824New Life Academy * * 0 * * 24 * * 76 * * 867Norcross 33 19 20 42 37 45 26 44 35 822 841 835Norton 25 16 20 46 45 49 30 40 31 827 837 831Parsons 12 3 7 39 26 27 50 72 66 847 877 864Partee 28 22 17 51 42 49 20 36 34 821 836 832Patrick 15 8 11 43 34 31 43 58 58 842 860 858Peachtree 17 17 12 45 40 48 38 43 40 837 842 841Pharr 23 10 15 53 32 28 24 58 58 827 856 857Pucketts Mill * 3 4 * 38 27 * 59 69 * 856 866Riverside 8 7 5 39 22 26 52 71 69 848 869 866Rock Springs 20 12 4 56 31 40 25 57 56 826 851 853Rockbridge 47 24 33 40 40 54 12 36 13 804 832 813Rosebud * 22 16 * 51 47 * 28 37 * 828 837Shiloh 20 17 21 41 38 49 39 46 31 838 845 829Simonton 30 17 13 52 40 41 18 44 46 819 839 845Simpson 3 2 6 28 12 13 69 86 82 866 893 877Starling * * 5 * * 39 * * 56 * * 854Stripling 19 20 15 54 50 42 26 30 43 829 827 839Sugar Hill 25 8 8 49 50 37 26 42 55 825 847 853Suwanee 5 4 6 41 31 34 54 65 61 850 864 862Sycamore 17 11 21 42 35 42 41 54 37 837 852 839Taylor 9 8 11 38 32 31 52 60 57 848 855 850Tripp * 19 16 * 47 38 * 34 47 * 834 843Walnut Grove 11 7 9 27 35 28 62 59 62 859 865 860White Oak * * 7 * * 35 * * 58 * * 850Woodward Mill * * 16 * * 43 * * 42 * * 842
System 20 14 13 44 38 39 36 48 48 834 847 847State 28 21 18 45 43 43 26 36 39 824 834 837
Due to GPS rollover, data for Math are not comparable prior to 2007-2008
GWINNETT COUNTY PUBLIC SCHOOLSCRCT Three Year Comparison
Grade 5Math
Mean Score
* Denotes new school
% at Performance Level DNM
% at Performance Level Meets
% at Performance Level Exceeds
School
2006
-200
7
2007
-200
8
2008
-200
9
2009
-210
2006
-200
7
2007
-200
8
2008
-200
9
2009
-201
0
2006
-200
7
2007
-200
8
2008
-200
9
2009
-201
0
2006
-200
7
2007
-200
8
2008
-200
9
2009
-201
0
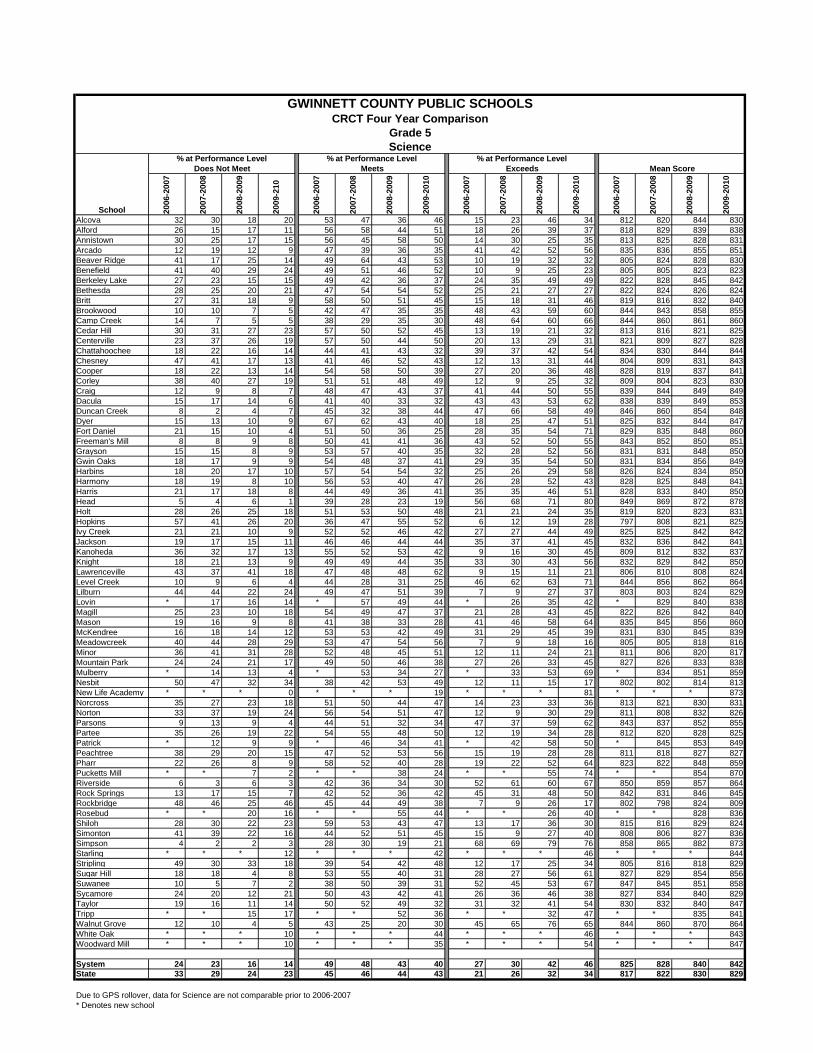
Alcova 32 30 18 20 53 47 36 46 15 23 46 34 812 820 844 830Alford 26 15 17 11 56 58 44 51 18 26 39 37 818 829 839 838Annistown 30 25 17 15 56 45 58 50 14 30 25 35 813 825 828 831Arcado 12 19 12 9 47 39 36 35 41 42 52 56 835 836 855 851Beaver Ridge 41 17 25 14 49 64 43 53 10 19 32 32 805 824 828 830Benefield 41 40 29 24 49 51 46 52 10 9 25 23 805 805 823 823Berkeley Lake 27 23 15 15 49 42 36 37 24 35 49 49 822 828 845 842Bethesda 28 25 20 21 47 54 54 52 25 21 27 27 822 824 826 824Britt 27 31 18 9 58 50 51 45 15 18 31 46 819 816 832 840Brookwood 10 10 7 5 42 47 35 35 48 43 59 60 844 843 858 855Camp Creek 14 7 5 5 38 29 35 30 48 64 60 66 844 860 861 860Cedar Hill 30 31 27 23 57 50 52 45 13 19 21 32 813 816 821 825Centerville 23 37 26 19 57 50 44 50 20 13 29 31 821 809 827 828Chattahoochee 18 22 16 14 44 41 43 32 39 37 42 54 834 830 844 844Chesney 47 41 17 13 41 46 52 43 12 13 31 44 804 809 831 843Cooper 18 22 13 14 54 58 50 39 27 20 36 48 828 819 837 841Corley 38 40 27 19 51 51 48 49 12 9 25 32 809 804 823 830Craig 12 9 8 7 48 47 43 37 41 44 50 55 839 844 849 849Dacula 15 17 14 6 41 40 33 32 43 43 53 62 838 839 849 853Duncan Creek 8 2 4 7 45 32 38 44 47 66 58 49 846 860 854 848Dyer 15 13 10 9 67 62 43 40 18 25 47 51 825 832 844 847Fort Daniel 21 15 10 4 51 50 36 25 28 35 54 71 829 835 848 860Freeman's Mill 8 8 9 8 50 41 41 36 43 52 50 55 843 852 850 851Grayson 15 15 8 9 53 57 40 35 32 28 52 56 831 831 848 850Gwin Oaks 18 17 9 9 54 48 37 41 29 35 54 50 831 834 856 849Harbins 18 20 17 10 57 54 54 32 25 26 29 58 826 824 834 850Harmony 18 19 8 10 56 53 40 47 26 28 52 43 828 825 848 841Harris 21 17 18 8 44 49 36 41 35 35 46 51 828 833 840 850Head 5 4 6 1 39 28 23 19 56 68 71 80 849 869 872 878Holt 28 26 25 18 51 53 50 48 21 21 24 35 819 820 823 831Hopkins 57 41 26 20 36 47 55 52 6 12 19 28 797 808 821 825Ivy Creek 21 21 10 9 52 52 46 42 27 27 44 49 825 825 842 842Jackson 19 17 15 11 46 46 44 44 35 37 41 45 832 836 842 841Kanoheda 36 32 17 13 55 52 53 42 9 16 30 45 809 812 832 837Knight 18 21 13 9 49 49 44 35 33 30 43 56 832 829 842 850Lawrenceville 43 37 41 18 47 48 48 62 9 15 11 21 806 810 808 824Level Creek 10 9 6 4 44 28 31 25 46 62 63 71 844 856 862 864Lilburn 44 44 22 24 49 47 51 39 7 9 27 37 803 803 824 829Lovin * 17 16 14 * 57 49 44 * 26 35 42 * 829 840 838Magill 25 23 10 18 54 49 47 37 21 28 43 45 822 826 842 840Mason 19 16 9 8 41 38 33 28 41 46 58 64 835 845 856 860McKendree 16 18 14 12 53 53 42 49 31 29 45 39 831 830 845 839Meadowcreek 40 44 28 29 53 47 54 56 7 9 18 16 805 805 818 816Minor 36 41 31 28 52 48 45 51 12 11 24 21 811 806 820 817Mountain Park 24 24 21 17 49 50 46 38 27 26 33 45 827 826 833 838Mulberry * 14 13 4 * 53 34 27 * 33 53 69 * 834 851 859Nesbit 50 47 32 34 38 42 53 49 12 11 15 17 802 802 814 813New Life Academy * * * 0 * * * 19 * * * 81 * * * 873Norcross 35 27 23 18 51 50 44 47 14 23 33 36 813 821 830 831Norton 33 37 19 24 56 54 51 47 12 9 30 29 811 808 832 826Parsons 9 13 9 4 44 51 32 34 47 37 59 62 843 837 852 855Partee 35 26 19 22 54 55 48 50 12 19 34 28 812 820 828 825Patrick * 12 9 9 * 46 34 41 * 42 58 50 * 845 853 849Peachtree 38 29 20 15 47 52 53 56 15 19 28 28 811 818 827 827Pharr 22 26 8 9 58 52 40 28 19 22 52 64 823 822 848 859Pucketts Mill * * 7 2 * * 38 24 * * 55 74 * * 854 870Riverside 6 3 6 3 42 36 34 30 52 61 60 67 850 859 857 864Rock Springs 13 17 15 7 42 52 36 42 45 31 48 50 842 831 846 845Rockbridge 48 46 25 46 45 44 49 38 7 9 26 17 802 798 824 809Rosebud * * 20 16 * * 55 44 * * 26 40 * * 828 836Shiloh 28 30 22 23 59 53 43 47 13 17 36 30 815 816 829 824Simonton 41 39 22 16 44 52 51 45 15 9 27 40 808 806 827 836Simpson 4 2 2 3 28 30 19 21 68 69 79 76 858 865 882 873Starling * * * 12 * * * 42 * * * 46 * * * 844Stripling 49 30 33 18 39 54 42 48 12 17 25 34 805 816 818 829Sugar Hill 18 18 4 8 53 55 40 31 28 27 56 61 827 829 854 856Suwanee 10 5 7 2 38 50 39 31 52 45 53 67 847 845 851 858Sycamore 24 20 12 21 50 43 42 41 26 36 46 38 827 834 840 829Taylor 19 16 11 14 50 52 49 32 31 32 41 54 830 832 840 847Tripp * * 15 17 * * 52 36 * * 32 47 * * 835 841Walnut Grove 12 10 4 5 43 25 20 30 45 65 76 65 844 860 870 864White Oak * * * 10 * * * 44 * * * 46 * * * 843Woodward Mill * * * 10 * * * 35 * * * 54 * * * 847
System 24 23 16 14 49 48 43 40 27 30 42 46 825 828 840 842State 33 29 24 23 45 46 44 43 21 26 32 34 817 822 830 829
GWINNETT COUNTY PUBLIC SCHOOLSCRCT Four Year Comparison
Grade 5Science
% at Performance Level % at Performance Level
* Denotes new schoolDue to GPS rollover, data for Science are not comparable prior to 2006-2007
School
% at Performance LevelDoes Not Meet Meets Exceeds Mean Score
2008
-200
9
2009
-201
0
2008
-200
9
2009
-201
0
2008
-200
9
2009
-201
0
2008
-200
9
2009
-201
0
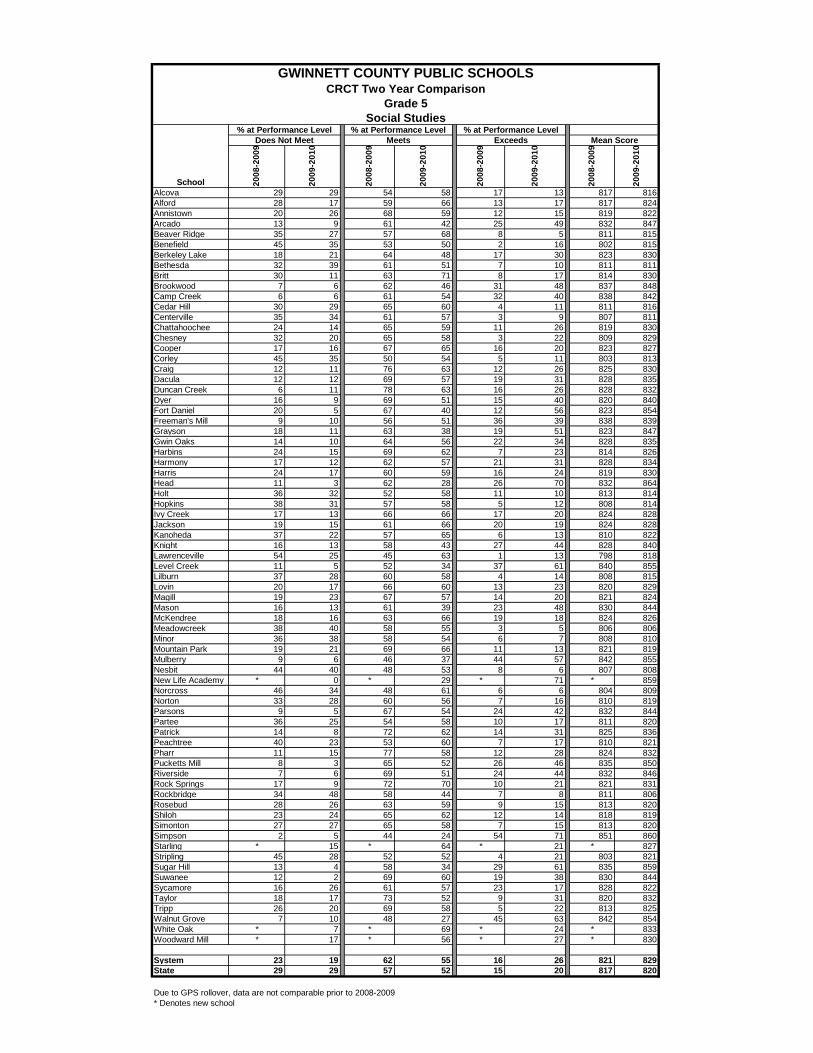
Alcova 29 29 54 58 17 13 817 816Alford 28 17 59 66 13 17 817 824Annistown 20 26 68 59 12 15 819 822Arcado 13 9 61 42 25 49 832 847Beaver Ridge 35 27 57 68 8 5 811 815Benefield 45 35 53 50 2 16 802 815Berkeley Lake 18 21 64 48 17 30 823 830Bethesda 32 39 61 51 7 10 811 811Britt 30 11 63 71 8 17 814 830Brookwood 7 6 62 46 31 48 837 848Camp Creek 6 6 61 54 32 40 838 842Cedar Hill 30 29 65 60 4 11 811 816Centerville 35 34 61 57 3 9 807 811Chattahoochee 24 14 65 59 11 26 819 830Chesney 32 20 65 58 3 22 809 829Cooper 17 16 67 65 16 20 823 827Corley 45 35 50 54 5 11 803 813Craig 12 11 76 63 12 26 825 830Dacula 12 12 69 57 19 31 828 835Duncan Creek 6 11 78 63 16 26 828 832Dyer 16 9 69 51 15 40 820 840Fort Daniel 20 5 67 40 12 56 823 854Freeman's Mill 9 10 56 51 36 39 838 839Grayson 18 11 63 38 19 51 823 847Gwin Oaks 14 10 64 56 22 34 828 835Harbins 24 15 69 62 7 23 814 826Harmony 17 12 62 57 21 31 828 834Harris 24 17 60 59 16 24 819 830Head 11 3 62 28 26 70 832 864Holt 36 32 52 58 11 10 813 814Hopkins 38 31 57 58 5 12 808 814Ivy Creek 17 13 66 66 17 20 824 828Jackson 19 15 61 66 20 19 824 828Kanoheda 37 22 57 65 6 13 810 822Knight 16 13 58 43 27 44 828 840Lawrenceville 54 25 45 63 1 13 798 818Level Creek 11 5 52 34 37 61 840 855Lilburn 37 28 60 58 4 14 808 815Lovin 20 17 66 60 13 23 820 829Magill 19 23 67 57 14 20 821 824Mason 16 13 61 39 23 48 830 844McKendree 18 16 63 66 19 18 824 826Meadowcreek 38 40 58 55 3 5 806 806Minor 36 38 58 54 6 7 808 810Mountain Park 19 21 69 66 11 13 821 819Mulberry 9 6 46 37 44 57 842 855Nesbit 44 40 48 53 8 6 807 808New Life Academy * 0 * 29 * 71 * 859Norcross 46 34 48 61 6 6 804 809Norton 33 28 60 56 7 16 810 819Parsons 9 5 67 54 24 42 832 844Partee 36 25 54 58 10 17 811 820Patrick 14 8 72 62 14 31 825 836Peachtree 40 23 53 60 7 17 810 821Pharr 11 15 77 58 12 28 824 832Pucketts Mill 8 3 65 52 26 46 835 850Riverside 7 6 69 51 24 44 832 846Rock Springs 17 9 72 70 10 21 821 831Rockbridge 34 48 58 44 7 8 811 806Rosebud 28 26 63 59 9 15 813 820Shiloh 23 24 65 62 12 14 818 819Simonton 27 27 65 58 7 15 813 820Simpson 2 5 44 24 54 71 851 860Starling * 15 * 64 * 21 * 827Stripling 45 28 52 52 4 21 803 821Sugar Hill 13 4 58 34 29 61 835 859Suwanee 12 2 69 60 19 38 830 844Sycamore 16 26 61 57 23 17 828 822Taylor 18 17 73 52 9 31 820 832Tripp 26 20 69 58 5 22 813 825Walnut Grove 7 10 48 27 45 63 842 854White Oak * 7 * 69 * 24 * 833Woodward Mill * 17 * 56 * 27 * 830
System 23 19 62 55 16 26 821 829State 29 29 57 52 15 20 817 820
% at Performance Level % at Performance Level % at Performance Level Does Not Meet Meets Exceeds Mean Score
* Denotes new schoolDue to GPS rollover, data are not comparable prior to 2008-2009
GWINNETT COUNTY PUBLIC SCHOOLSCRCT Two Year Comparison
Grade 5Social Studies
School
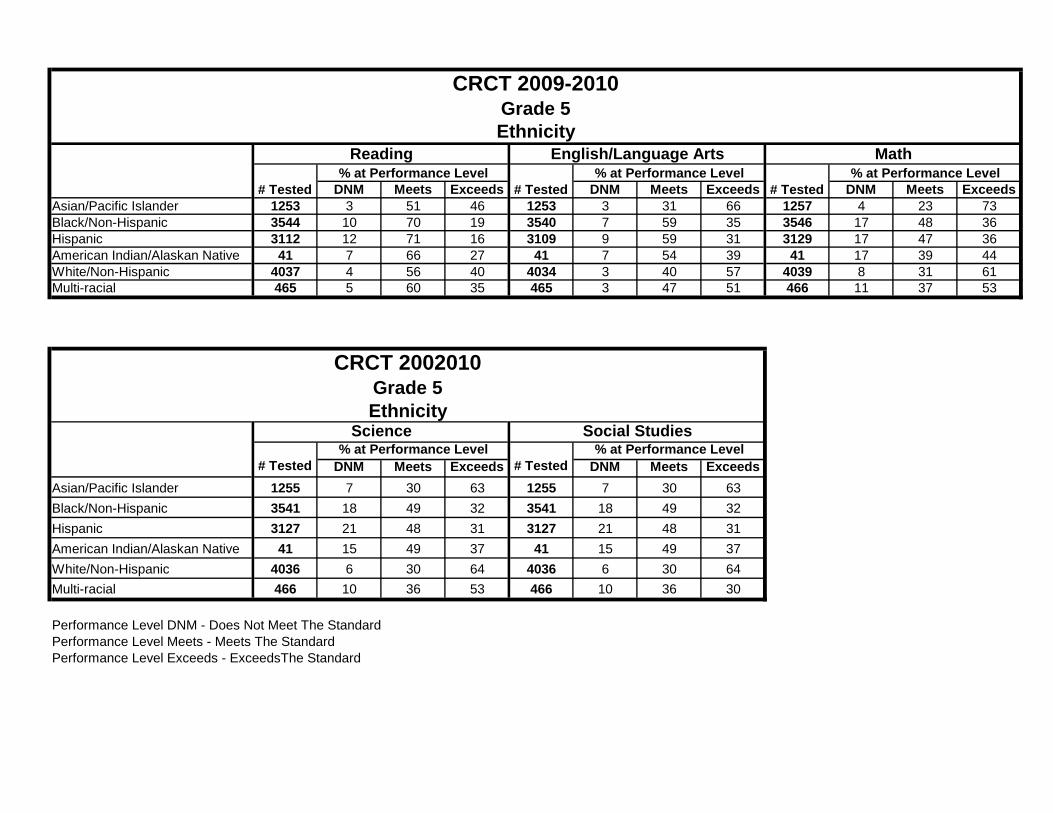
0
10
20
30
40
50
60
70
GCPS State GCPS State GCPS State GCPS State GCPS State
Reading English/LA Math Science Social Studies
810
6 8
13
1814
2319
29
6466
50
55
3943
4043
5552
29
24
45
37
48
39
46
34
26
20
% o
f Stu
dent
s at
Per
form
ance
Lev
el2009-2010 CRCT
Grade 5
Performance Level DNMPerformance Level MeetsPerformance Level Exceeds
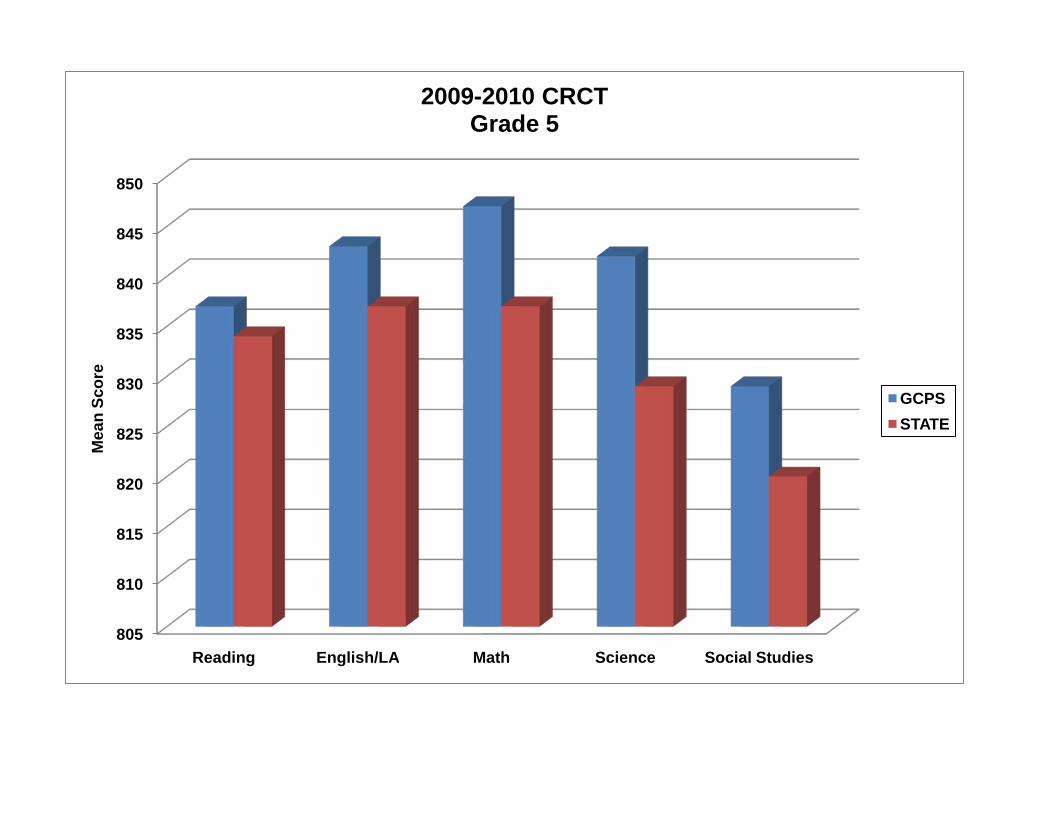
805
810
815
820
825
830
835
840
845
850
Reading English/LA Math Science Social Studies
Mea
n Sc
ore
2009-2010 CRCTGrade 5
GCPSSTATE
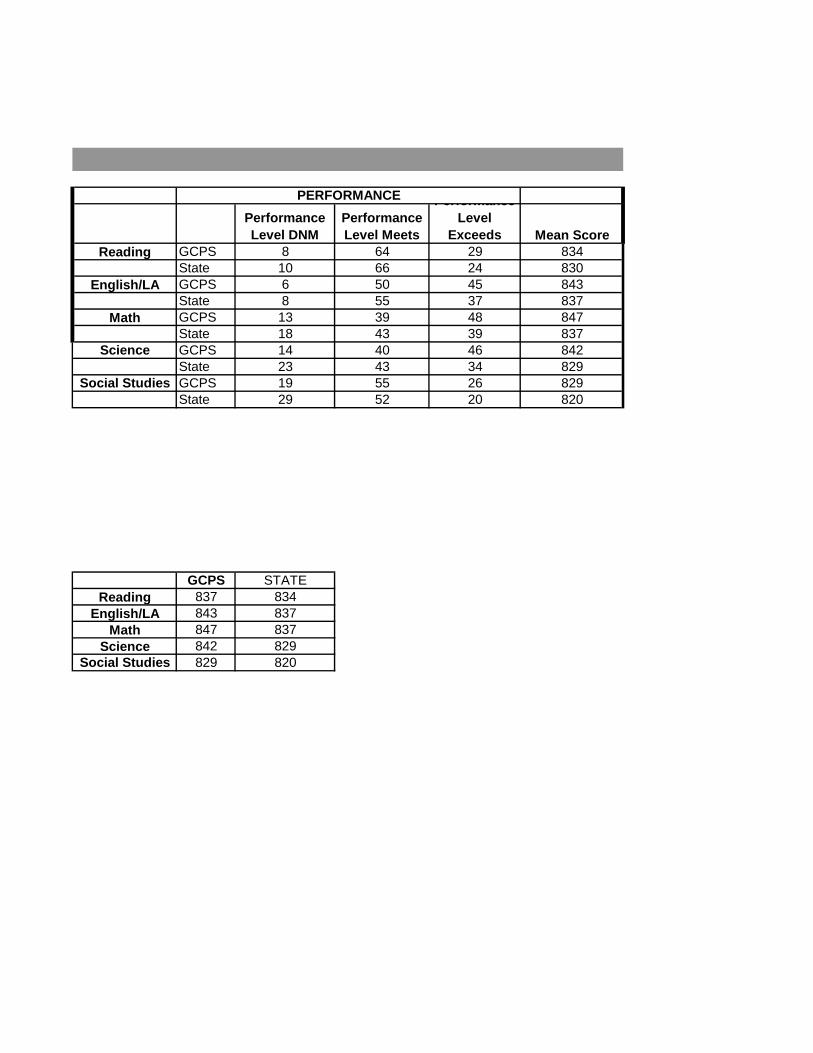
Performance Level DNM
Performance Level Meets
Performance Level
Exceeds Mean ScoreReading GCPS 8 64 29 834
State 10 66 24 830English/LA GCPS 6 50 45 843
State 8 55 37 837Math GCPS 13 39 48 847
State 18 43 39 837Science GCPS 14 40 46 842
State 23 43 34 829Social Studies GCPS 19 55 26 829
State 29 52 20 820
GCPS STATEReading 837 834
English/LA 843 837Math 847 837
Science 842 829Social Studies 829 820
PERFORMANCE