Embed Size (px)
Citation preview
UNECE/FAO Forest Products Annual Market Review, 2011-2012 __________________________________________________________ 67
7 Wood-based panel markets, 2011-2012
Lead author, Ivan Eastin Contributing authors, Isabelle Brose and Igor Novoselov
Highlights North American production of wood-based panels in 2011 was little changed from 2010, as the
US housing market remained weak with few signs of improvement.
North American panel exports fell by 6.4% in 2011; an increase in US exports of 4.0% was offset by Canadian exports, which were 7.0% lower than in 2010.
The California Air Resources Board (CARB) legislation, designed to reduce formaldehyde emissions in wood-based panels, moved into Phase II for both particle board and medium-density fibreboard (MDF) as of 1 January 2011 and now forms the basis for new federal regulations limiting formaldehyde emissions from wood-based panels in all States of the US.
The Lacey Act had a mixed impact on US imports of wood-based panels, with overall imports from tropical countries down in 2011.
Expansion of the Russian wood-based panel sector continued in 2011 due to increased demand in residential construction (up 5.1%) and furniture manufacturing (up 6.2%), with plywood and fibreboard production volumes increasing by more than 10% over 2010 levels and particle board production by more than 20%.
Following the severe economic downturn, the European wood-based panels industry is slowly returning to better market conditions. The construction sector, one of the main drivers of panel production, showed some signs of recovery. However, in 2011 the furniture industry did not perform as expected.
European panel production started well in the first quarter of 2011, and slowed significantly during the second and third before recovering at the end of the year.
For the year as a whole, European particle board production contracted by 1.9%, while MDF production increased by 3.7% and oriented strand board (OSB) production decreased by 5.2%
Europe’s wood-based panels sector continued to face significant increases in production costs, especially resins and energy.
68 _________________________________________________________________________________ Chapter 7, Wood-based panel markets
7.1 Introduction The weak recovery of the global economy continued
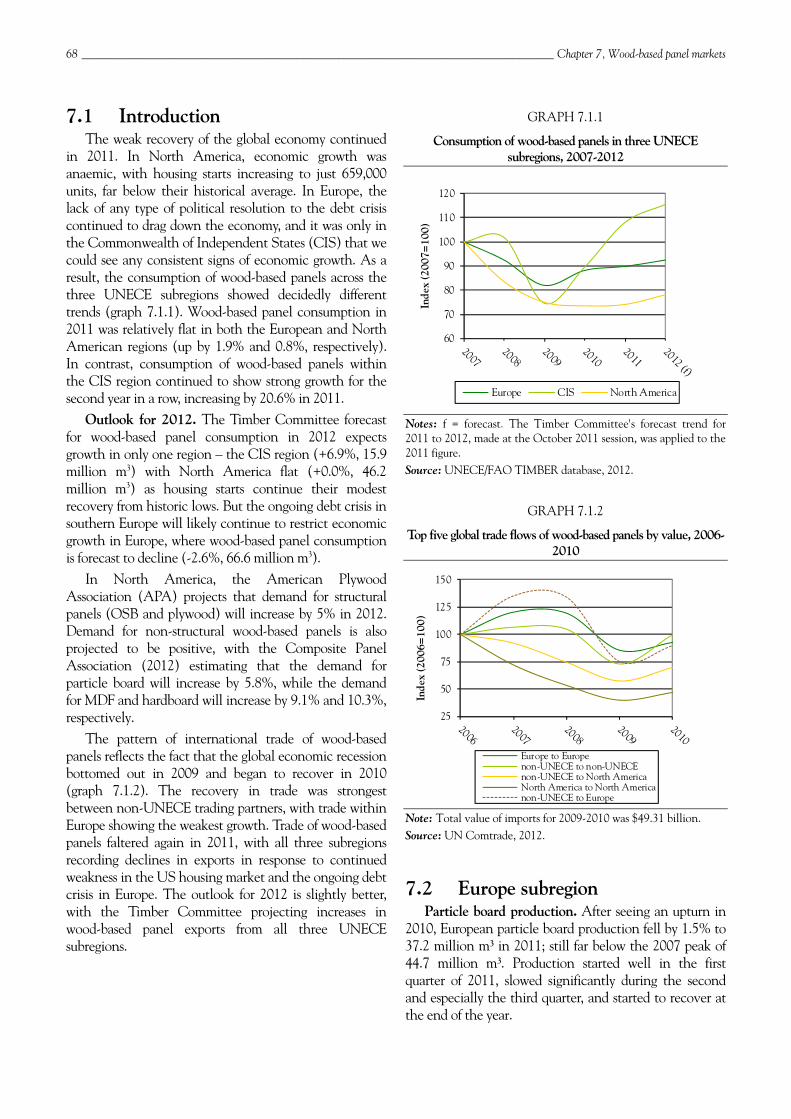
in 2011. In North America, economic growth was anaemic, with housing starts increasing to just 659,000 units, far below their historical average. In Europe, the lack of any type of political resolution to the debt crisis continued to drag down the economy, and it was only in the Commonwealth of Independent States (CIS) that we could see any consistent signs of economic growth. As a result, the consumption of wood-based panels across the three UNECE subregions showed decidedly different trends (graph 7.1.1). Wood-based panel consumption in 2011 was relatively flat in both the European and North American regions (up by 1.9% and 0.8%, respectively). In contrast, consumption of wood-based panels within the CIS region continued to show strong growth for the second year in a row, increasing by 20.6% in 2011.
Outlook for 2012. The Timber Committee forecast for wood-based panel consumption in 2012 expects growth in only one region – the CIS region (+6.9%, 15.9 million m3) with North America flat (+0.0%, 46.2 million m3) as housing starts continue their modest recovery from historic lows. But the ongoing debt crisis in southern Europe will likely continue to restrict economic growth in Europe, where wood-based panel consumption is forecast to decline (-2.6%, 66.6 million m3).
In North America, the American Plywood Association (APA) projects that demand for structural panels (OSB and plywood) will increase by 5% in 2012. Demand for non-structural wood-based panels is also projected to be positive, with the Composite Panel Association (2012) estimating that the demand for particle board will increase by 5.8%, while the demand for MDF and hardboard will increase by 9.1% and 10.3%, respectively.
The pattern of international trade of wood-based panels reflects the fact that the global economic recession bottomed out in 2009 and began to recover in 2010 (graph 7.1.2). The recovery in trade was strongest between non-UNECE trading partners, with trade within Europe showing the weakest growth. Trade of wood-based panels faltered again in 2011, with all three subregions recording declines in exports in response to continued weakness in the US housing market and the ongoing debt crisis in Europe. The outlook for 2012 is slightly better, with the Timber Committee projecting increases in wood-based panel exports from all three UNECE subregions.
GRAPH 7.1.1
Consumption of wood-based panels in three UNECE subregions, 2007-2012
Notes: f = forecast. The Timber Committee's forecast trend for 2011 to 2012, made at the October 2011 session, was applied to the 2011 figure. Source: UNECE/FAO TIMBER database, 2012.
GRAPH 7.1.2
Top five global trade flows of wood-based panels by value, 2006-2010
Note: Total value of imports for 2009-2010 was $49.31 billion. Source: UN Comtrade, 2012.
7.2 Europe subregion Particle board production. After seeing an upturn in
2010, European particle board production fell by 1.5% to 37.2 million m3 in 2011; still far below the 2007 peak of 44.7 million m3. Production started well in the first quarter of 2011, slowed significantly during the second and especially the third quarter, and started to recover at the end of the year.
60
70
80
90
100
110
120
Inde
x (2
007=
100)
Europe CIS North America
25
50
75
100
125
150
Inde
x (2
006=
100)
Europe to Europenon-UNECE to non-UNECEnon-UNECE to North AmericaNorth America to North Americanon-UNECE to Europe
UNECE/FAO Forest Products Annual Market Review, 2011-2012 __________________________________________________________ 69
The two main drivers of particle board production are the furniture industry and the construction sector. The furniture industry performed well during the first half of 2011 – though it continues to face intense competition from imports – and performed less well than expected for the year as a whole. The construction sector, on the contrary, is showing some signs of recovery, such as increased confidence and business activity at the end of 2011.
The picture across Europe is far from uniform. Finland, Germany, Hungary and Ireland suffered large falls in demand and production, whereas Estonia and Romania saw increased production – the result of a rapid economic recovery in Estonia and rising production capacity in Romania.
Germany remained the largest particle board producer in Europe in 2011, despite a 10.8% fall in production. Poland and France continued to complete the particle board producers’ leadership podium with increases in production of 4.8% and 5.2%, respectively. Turkey, Italy and the United Kingdom were the only other European countries to produce more than 2.6 million m3 of particle board in 2011.
The expectations for 2012 are fairly flat. Three countries have forecast a decrease in particle board production: Finland, Ireland and Sweden. On the contrary, Estonia, Latvia and Norway are expecting improvements of particle board production of 10% or more. The remaining countries have projected slight increases in production while the change in production in Europe as a whole is estimated at -0.4% for 2012. This should result in a particle board production volume that barely exceeds 37.0 million m3 in 2012.
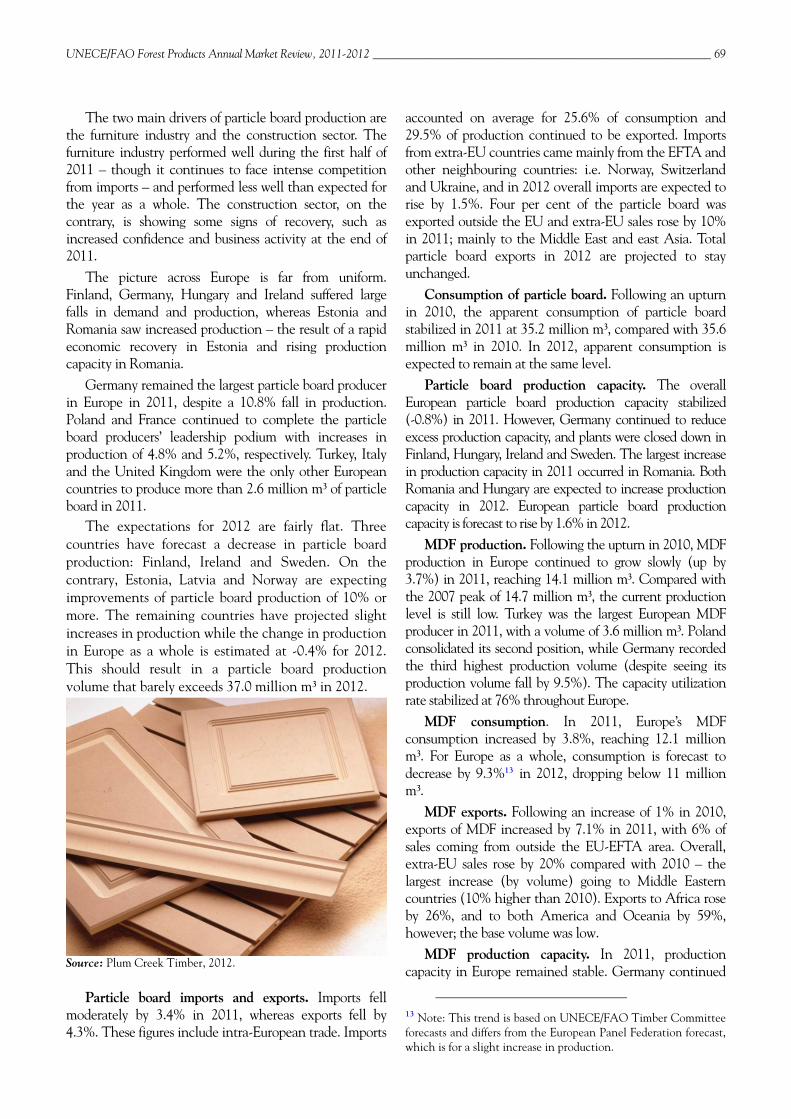
Source: Plum Creek Timber, 2012.
Particle board imports and exports. Imports fell moderately by 3.4% in 2011, whereas exports fell by 4.3%. These figures include intra-European trade. Imports
accounted on average for 25.6% of consumption and 29.5% of production continued to be exported. Imports from extra-EU countries came mainly from the EFTA and other neighbouring countries: i.e. Norway, Switzerland and Ukraine, and in 2012 overall imports are expected to rise by 1.5%. Four per cent of the particle board was exported outside the EU and extra-EU sales rose by 10% in 2011; mainly to the Middle East and east Asia. Total particle board exports in 2012 are projected to stay unchanged.
Consumption of particle board. Following an upturn in 2010, the apparent consumption of particle board stabilized in 2011 at 35.2 million m3, compared with 35.6 million m3 in 2010. In 2012, apparent consumption is expected to remain at the same level.
Particle board production capacity. The overall European particle board production capacity stabilized (-0.8%) in 2011. However, Germany continued to reduce excess production capacity, and plants were closed down in Finland, Hungary, Ireland and Sweden. The largest increase in production capacity in 2011 occurred in Romania. Both Romania and Hungary are expected to increase production capacity in 2012. European particle board production capacity is forecast to rise by 1.6% in 2012.
MDF production. Following the upturn in 2010, MDF production in Europe continued to grow slowly (up by 3.7%) in 2011, reaching 14.1 million m3. Compared with the 2007 peak of 14.7 million m3, the current production level is still low. Turkey was the largest European MDF producer in 2011, with a volume of 3.6 million m3. Poland consolidated its second position, while Germany recorded the third highest production volume (despite seeing its production volume fall by 9.5%). The capacity utilization rate stabilized at 76% throughout Europe.
MDF consumption. In 2011, Europe’s MDF consumption increased by 3.8%, reaching 12.1 million m3. For Europe as a whole, consumption is forecast to decrease by 9.3%13 in 2012, dropping below 11 million m3.
MDF exports. Following an increase of 1% in 2010, exports of MDF increased by 7.1% in 2011, with 6% of sales coming from outside the EU-EFTA area. Overall, extra-EU sales rose by 20% compared with 2010 – the largest increase (by volume) going to Middle Eastern countries (10% higher than 2010). Exports to Africa rose by 26%, and to both America and Oceania by 59%, however; the base volume was low.
MDF production capacity. In 2011, production capacity in Europe remained stable. Germany continued
13 Note: This trend is based on UNECE/FAO Timber Committee forecasts and differs from the European Panel Federation forecast, which is for a slight increase in production.
70 _________________________________________________________________________________ Chapter 7, Wood-based panel markets
to reduce its excess capacity, while Spain experienced temporary halts of production but no permanent closures. Poland opened a new plant in 2011, although for the time being there are no new projects planned for 2012 or 2013 in Europe.
OSB production. Production of OSB in Europe in 2011 fell by 5.2% to 4.5 million m3. Germany remained the largest European producer, followed by the Czech Republic and Poland, although Romania is expanding its production capacity. Building activity in 2011 remained subdued, and with approximately 50% of OSB sales going to this sector, European demand for OSB decreased by 14%. Nevertheless, the construction sector in Europe is now showing signs of recovery and this will support the increased production and consumption of OSB in 2012.
OSB trade. In 2011, most European OSB was traded within Europe in the EU and EFTA countries, although extra-European trade towards east Asia increased by 50%. Exports to the Middle East and Africa also rose, but the volumes were small.
OSB production capacity. European production capacity remained stable in 2011, although an expansion has been taking place in southeast Europe. A large plant in Romania (300,000 m3) will become operational in 2012 and a major investment is planned for Bulgaria in 2013 (420,000 m3).
TABLE 7.2.1
Wood-based panel balance in Europe and EU 27, 2010-2011 (1,000 m3)
2010 2011 Change %
Europe
Production 67 554 67 750 0.9
Imports 31 121 31 217 0.3
Exports 31 537 30 997 -1.7
Net trade 416 -220
Apparent consumption 67 138 68 404 1.9 of which: EU27 Production 58 787 59 677 -0.2
Imports 27 748 27 862 0.4
Exports 29 398 28 767 -2.1
Net trade 1 651 905 Apparent consumption 57 137 57 772 1.1 Source: UNECE/FAO TIMBER database, 2012.
Plywood. Despite the long-term decline of its overall share of panel consumption (from 15% in 1994 to below 12%), production increased over 10% in 2011 (to 4.2 million m3). In this heavily traded product the share of imports in consumption was 88% while the export share
of production was 78% (FEIC, 2012). The forecast for 2012 is essentially flat with consumption increasing 1%.
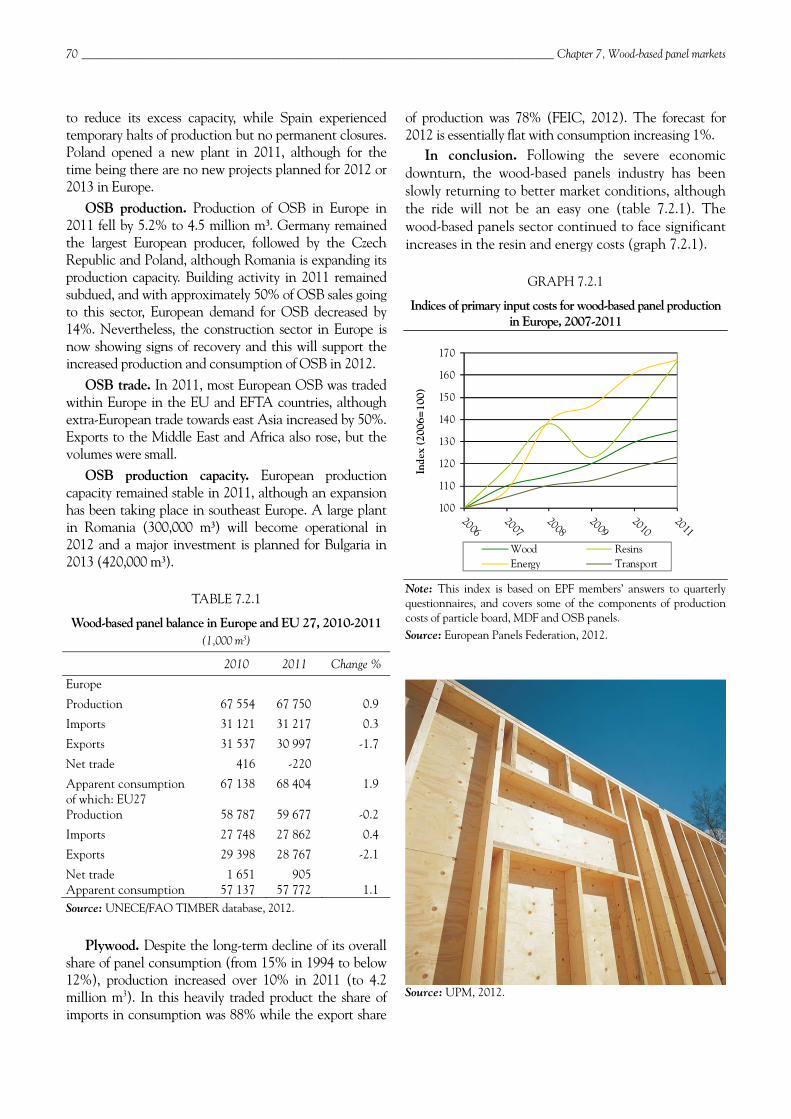
In conclusion. Following the severe economic downturn, the wood-based panels industry has been slowly returning to better market conditions, although the ride will not be an easy one (table 7.2.1). The wood-based panels sector continued to face significant increases in the resin and energy costs (graph 7.2.1).
GRAPH 7.2.1
Indices of primary input costs for wood-based panel production in Europe, 2007-2011
Note: This index is based on EPF members’ answers to quarterly questionnaires, and covers some of the components of production costs of particle board, MDF and OSB panels. Source: European Panels Federation, 2012.
Source: UPM, 2012.
100
110
120
130
140
150
160
170
Inde
x (2
006=
100)
Wood ResinsEnergy Transport
UNECE/FAO Forest Products Annual Market Review, 2011-2012 __________________________________________________________ 71
7.3 CIS subregion, with a focus on the Russian Federation
In 2011, production of wood-based panels in the Russian Federation expanded significantly and returned to the pre-crisis levels of 2007 (tables 7.3.1 and 7.3.2). Plywood and particle board production exceeded the 2007 levels. Growth in particle board production exceeded both plywood and fibreboard, with particle board’s share of the overall panels market increasing from 55.5% in 2010 to 57.5% in 2011. In contrast, both plywood (dropping from 27.1% to 26%) and fibreboard (from 17.3% to 16.5%) lost market share to particle board, despite substantial production increases.
TABLE 7.3.1
Wood-based panel balance in the CIS subregion, 2010-2011 (1,000 m3)
2010 2011 Change %
Production 12 586 14 559 15.7 Imports 3 548 3 967 11.8 Exports 3 476 3 264 -6.1 Net trade -73 -702 Apparent consumption 12 659 15 261 20.6 Source: UNECE/FAO TIMBER database, 2012.
TABLE 7.3.2
Wood-based panel production in the Russian Federation, 2007-2011 (1,000 m3)
2007 2008 2009 2010 2011
Plywood 2 777 2 592 2 107 2 689 3 003 Particle board 5 501 5 751 4 562 5 429 6 634 Fibreboard 1 930 2 023 1 626 1 710 1 900
Source: UNECE/FAO TIMBER database, 2012.
Fibreboard production. Production totalled 1.9 million m3 in 2011, an 11.1% increase over 2010. At the end of 2010, LPK Partner-Tomsk (located in the Tomsk region) opened an MDF manufacturing plant with an annual production capacity of 264,000 m3. This is the most technologically advanced MDF manufacturing plant in the Russian Federation.
The Malaysian multinational company, Rimbunan Hijau, opened the first phase of a new MDF manufacturing plant in 2011, in the Khabarovsk region, with production from this first phase destined to be exported to China, the Republic of Korea and Japan. Production from this facility is expected to be about 150,000 m3 at the end of 2014.
Markets for fibreboard. Uzbekistan remained the largest importer of Russian fibreboard in 2011, despite a 4.2% drop,
importing 49% of Russian fibreboard exports. While most markets for Russian fibreboard declined in 2011, four major markets saw increases: France, Latvia, Mongolia and Tajikistan. Tajikistan increased imports of Russian fibreboard by 12.9% in 2011 and ranked second among all countries, accounting for 11% of Russian exports.
Particle board production. Russian particle board production totalled 6,634,000 m3 in 2011, an increase of 22% over 2010. There were a number of significant developments in the particle board sector in 2011 (table 7.3.3). The hot pressing section of the Tomlesdrev particle board plant (located in the Tomsk region) was completed, increasing output by 5%. As a result, the annual production capacity of the plant increased from 250,000 m3 to 260,000 m3. Rollout hoppers were installed in the lamination lines to decrease equipment downtime, and these are expected to help increase the plant’s production of laminated particle board by at least 7%.
TABLE 7.3.3
Particle board balance in the Russian Federation, 2010-2011 (1,000 m3)
2010 2011 Change %
Production 5 429 6 634 22
Imports 529 619 17
Exports 490 344 -30
Net trade -39 -275 Apparent consumption 5 468 6 909 26 Note: Particle board figures include OSB. Sources: Russian Federation Federal State Statistics Service, 2012, Lesprom Network, 2012.
The owners of the Tomlesdrev wood-processing complex announced plans to invest 4 billion roubles (table 7.3.4) in a new particle board plant located close to the existing particle board plant on the northern outskirts of Tomsk. The company estimates that this new particle board plant will reduce production costs by 30% and allow the timber harvest in the region to be increased by 540,000 to 1 million m3 per year. It is expected that annual sales will increase from 3 billion roubles in 2011 to 5.6 billion roubles when the new plant is up and running in 2014.
In July 2011, the Austrian company Egger successfully purchased the Gagarinsky Plywood Plant (located in Gagarin, Smolensky region). The Russian Federation is an important strategic market for Egger and this acquisition reflects the company’s commitment to the Russian market. The plant has a production capacity of 500,000 m3 of particle board per year and includes a lamination line capable of producing 20 million m2 annually. In addition, the company acquired the logging rights for 80,000 hectares of forest.
72 _________________________________________________________________________________ Chapter 7, Wood-based panel markets
Particle board exports. Russian particle board exports fell from 490,000 m3 in 2010 to 344,000m3 in 2011, an apparent 30% drop (table 7.3.3). This can be attributed to the creation of a Customs Union between the Russian Federation, Kazakhstan and Belarus on 1 July 2011. As a result, products shipped between the countries in the Customs Union are no longer reported as exports or imports within the official international trade statistics (Rossiyskaya Gazeta, 2012).
Uzbekistan is the largest export market for Russian particle board, increasing its imports by 7.5% in 2011 to 256,000 m3. Russian exports of particle board to Kyrgyzstan increased by 31.9% (to 43,864 m3) in 2011. Kyrgyzstan is now the second largest market for Russian particle board, with an 11% market share. The Republic
of Korea, which increased imports by over 19 times (to 40,295 m3), is now the third largest export market for Russian particle board.
OSB imports. In 2011, Russian imports of OSB increased by 30.9% to reach 390,000 m3, and Latvia remains the country’s leading supplier. While Latvian OSB exports to the Russian Federation increased by 15.6% (to reach 158,200 m3), its market share actually declined by 5.3%. Canada is the second largest OSB supplier, with a market share of 29.2% (up from 28% in 2010) and the US is the third largest supplier to the Russian Federation, with a 10.1% share of imports (up from 3% in 2010).
TABLE 7.3.4
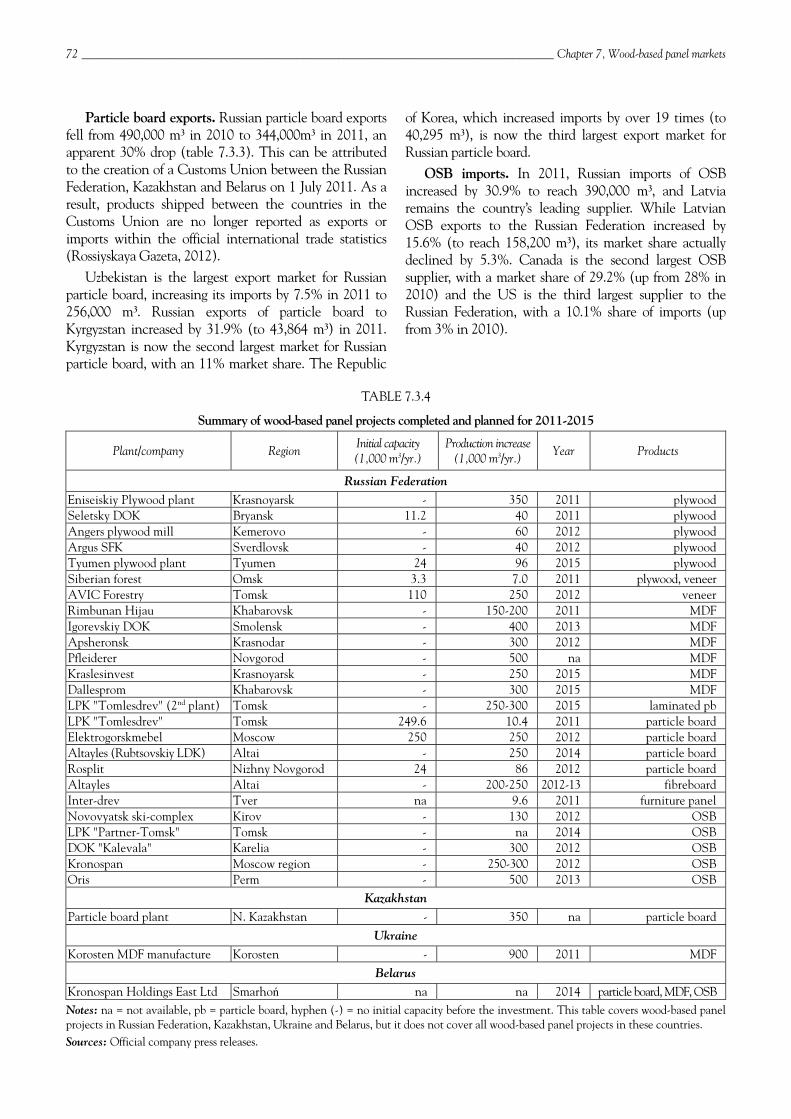
Summary of wood-based panel projects completed and planned for 2011-2015
Plant/company Region Initial capacity (1,000 m3/yr.)
Production increase (1,000 m3/yr.)
Year Products
Russian Federation
Eniseiskiy Plywood plant Krasnoyarsk - 350 2011 plywoodSeletsky DOK Bryansk 11.2 40 2011 plywoodAngers plywood mill Kemerovo - 60 2012 plywoodArgus SFK Sverdlovsk - 40 2012 plywoodTyumen plywood plant Tyumen 24 96 2015 plywoodSiberian forest Omsk 3.3 7.0 2011 plywood, veneerAVIC Forestry Tomsk 110 250 2012 veneerRimbunan Hijau Khabarovsk - 150-200 2011 MDFIgorevskiy DOK Smolensk - 400 2013 MDFApsheronsk Krasnodar - 300 2012 MDFPfleiderer Novgorod - 500 na MDFKraslesinvest Krasnoyarsk - 250 2015 MDFDallesprom Khabarovsk - 300 2015 MDFLPK "Tomlesdrev" (2nd plant) Tomsk - 250-300 2015 laminated pbLPK "Tomlesdrev" Tomsk 249.6 10.4 2011 particle boardElektrogorskmebel Moscow 250 250 2012 particle boardAltayles (Rubtsovskiy LDK) Altai - 250 2014 particle boardRosplit Nizhny Novgorod 24 86 2012 particle boardAltayles Altai - 200-250 2012-13 fibreboardInter-drev Tver na 9.6 2011 furniture panelNovovyatsk ski-complex Kirov - 130 2012 OSBLPK "Partner-Tomsk" Tomsk - na 2014 OSBDOK "Kalevala" Karelia - 300 2012 OSBKronospan Moscow region - 250-300 2012 OSBOris Perm - 500 2013 OSB
Kazakhstan Particle board plant N. Kazakhstan - 350 na particle board
Ukraine Korosten MDF manufacture Korosten - 900 2011 MDF
Belarus Kronospan Holdings East Ltd Smarhoń na na 2014 particle board, MDF, OSB Notes: na = not available, pb = particle board, hyphen (-) = no initial capacity before the investment. This table covers wood-based panel projects in Russian Federation, Kazakhstan, Ukraine and Belarus, but it does not cover all wood-based panel projects in these countries. Sources: Official company press releases.
UNECE/FAO Forest Products Annual Market Review, 2011-2012 __________________________________________________________ 73
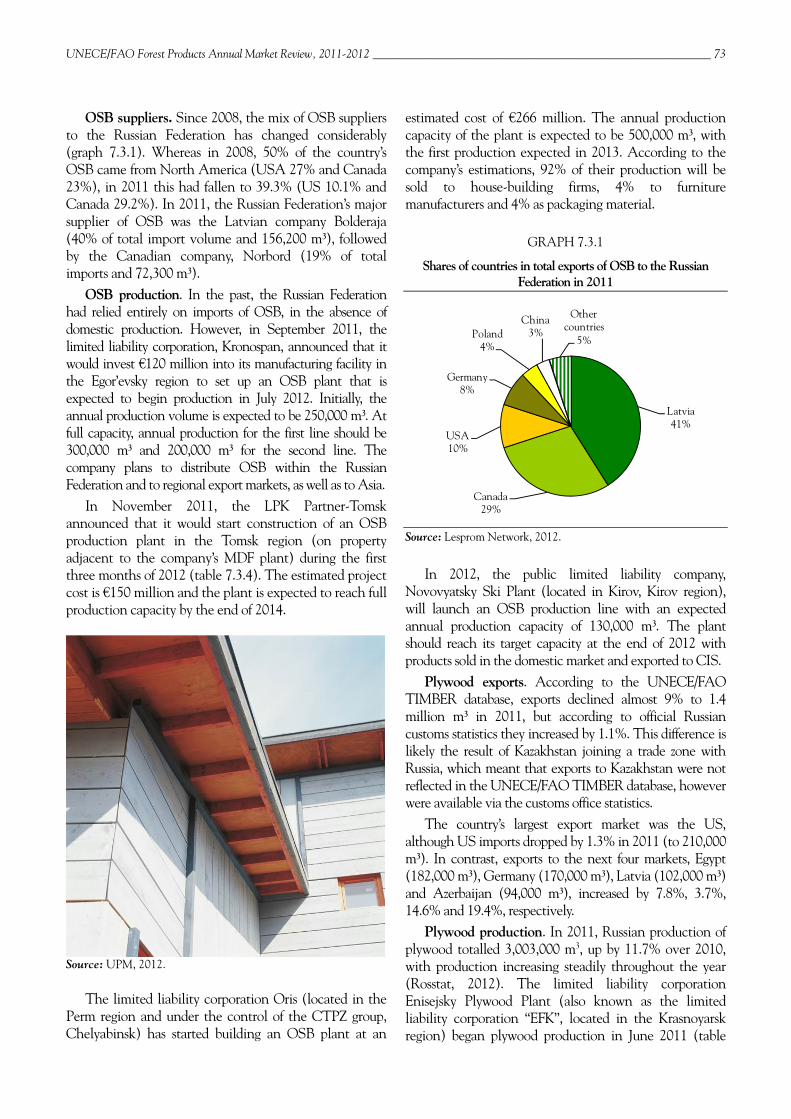
OSB suppliers. Since 2008, the mix of OSB suppliers to the Russian Federation has changed considerably (graph 7.3.1). Whereas in 2008, 50% of the country’s OSB came from North America (USA 27% and Canada 23%), in 2011 this had fallen to 39.3% (US 10.1% and Canada 29.2%). In 2011, the Russian Federation’s major supplier of OSB was the Latvian company Bolderaja (40% of total import volume and 156,200 m3), followed by the Canadian company, Norbord (19% of total imports and 72,300 m3).
OSB production. In the past, the Russian Federation had relied entirely on imports of OSB, in the absence of domestic production. However, in September 2011, the limited liability corporation, Kronospan, announced that it would invest €120 million into its manufacturing facility in the Egor’evsky region to set up an OSB plant that is expected to begin production in July 2012. Initially, the annual production volume is expected to be 250,000 m3. At full capacity, annual production for the first line should be 300,000 m3 and 200,000 m3 for the second line. The company plans to distribute OSB within the Russian Federation and to regional export markets, as well as to Asia.
In November 2011, the LPK Partner-Tomsk announced that it would start construction of an OSB production plant in the Tomsk region (on property adjacent to the company’s MDF plant) during the first three months of 2012 (table 7.3.4). The estimated project cost is €150 million and the plant is expected to reach full production capacity by the end of 2014.
Source: UPM, 2012.
The limited liability corporation Oris (located in the Perm region and under the control of the CTPZ group, Chelyabinsk) has started building an OSB plant at an
estimated cost of €266 million. The annual production capacity of the plant is expected to be 500,000 m3, with the first production expected in 2013. According to the company’s estimations, 92% of their production will be sold to house-building firms, 4% to furniture manufacturers and 4% as packaging material.
GRAPH 7.3.1
Shares of countries in total exports of OSB to the Russian Federation in 2011
Source: Lesprom Network, 2012.
In 2012, the public limited liability company, Novovyatsky Ski Plant (located in Kirov, Kirov region), will launch an OSB production line with an expected annual production capacity of 130,000 m3. The plant should reach its target capacity at the end of 2012 with products sold in the domestic market and exported to CIS.
Plywood exports. According to the UNECE/FAO TIMBER database, exports declined almost 9% to 1.4 million m3 in 2011, but according to official Russian customs statistics they increased by 1.1%. This difference is likely the result of Kazakhstan joining a trade zone with Russia, which meant that exports to Kazakhstan were not reflected in the UNECE/FAO TIMBER database, however were available via the customs office statistics.
The country’s largest export market was the US, although US imports dropped by 1.3% in 2011 (to 210,000 m3). In contrast, exports to the next four markets, Egypt (182,000 m3), Germany (170,000 m3), Latvia (102,000 m3) and Azerbaijan (94,000 m3), increased by 7.8%, 3.7%, 14.6% and 19.4%, respectively.
Plywood production. In 2011, Russian production of plywood totalled 3,003,000 m3, up by 11.7% over 2010, with production increasing steadily throughout the year (Rosstat, 2012). The limited liability corporation Enisejsky Plywood Plant (also known as the limited liability corporation “EFK”, located in the Krasnoyarsk region) began plywood production in June 2011 (table
Latvia41%
Canada29%
USA10%
Germany8%
Poland4%
China3%
Other countries
5%
74 _________________________________________________________________________________ Chapter 7, Wood-based panel markets
7.3.4). The plywood plant project in Sosnovoborsk, begun in 2008 and completed in 2011, was recognized by the Ministry of Industry and Trade as a priority project. The planned production capacity of the plant is expected to be 350,000 m3 of plywood and 100,000 m3 of veneer. Currently, the plant produces about 110,000 m3 – 120,000 m3 of plywood per year. However, as a result of this recent major upgrade, when running at full capacity the plant will be the biggest and the most technologically advanced Russian plywood producer.
7.4 North America subregion The housing market in North America remained
weak throughout 2011, although housing starts in both the US and Canada increased slightly. US housing starts rose by 3.5% in 2011, a smaller increase than the 5.5% year-on-year increase recorded in 2010. Similarly, Canadian housing starts rose just 2.1%, compared with the 27.4% year-on-year increase in 2010. Total production of wood-based panels fell slightly in 2011, although a slight increase in imports, coupled with a substantial decline in exports, resulted in a modest overall increase in wood-based panel consumption (table 7.4.1).
The relatively weak housing market in North America meant that consumption of structural panels remained flat across all sectors of the wood-based panels industry (graph 7.4.1). With repair and remodelling activity also muted, the demand for non-structural panels was also flat. The outlook for 2012 is for a slight improvement, with consumption of structural panels expected to increase by about 5%, while demand for non-structural panels is expected to rise by 9% (APA, 2012; CPA, 2012).
TABLE 7.4.1
Wood-based panel balance in North America, 2010-2011 (1,000 m3)
2010 2011 Change %
Production 41 081 41 018 -0.2 Imports 10 697 10 742 0.4 Exports 5 955 5 575 -6.7 Net trade -4 743 -5 167
Apparent consumption 45 824 46 186 0.8 Source: UNECE/FAO TIMBER database, 2012.
Plywood production. Overall, plywood production in
North America was down by 1.1% in 2011 (to 11.3 million m3), with US production falling by 1.4% (to 9.3 million m3). In contrast, the Canadian plywood industry saw production increase slightly by 0.6%, to just over 2 million m3. Seven North American plywood mills closed in 2011, six in the US and one in Canada.
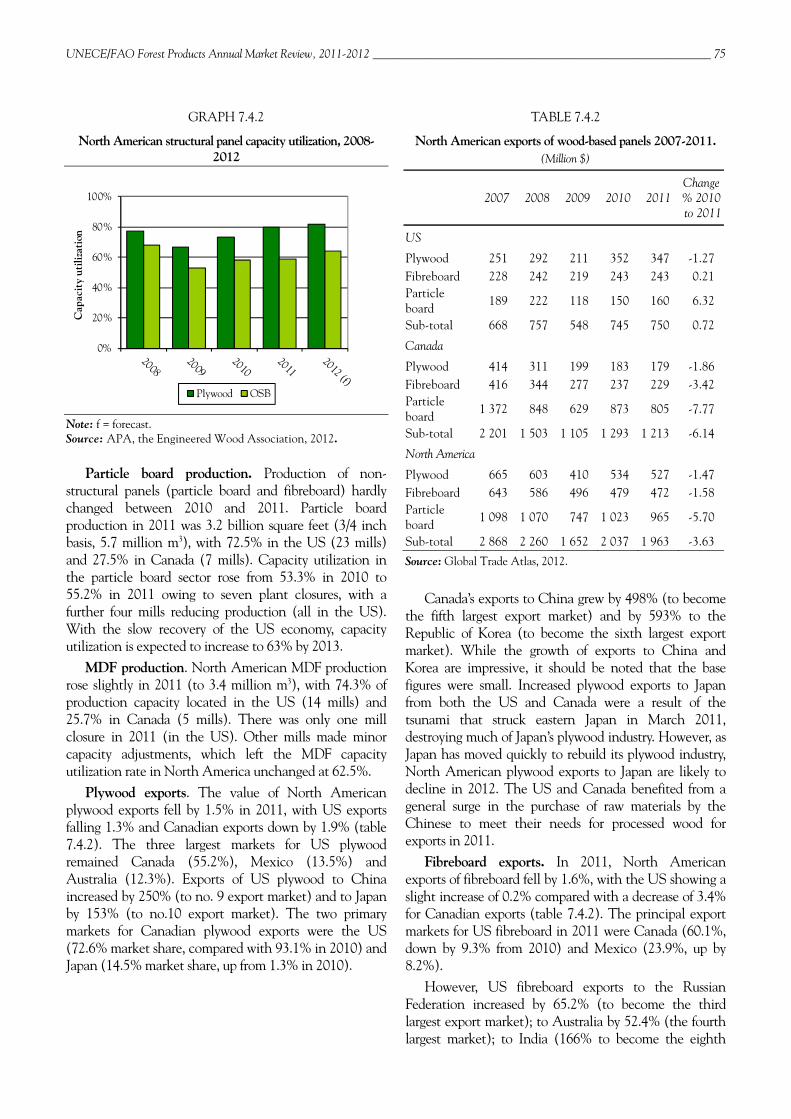
One plywood mill reopened in Canada. Mill closures resulted in an increase in the capacity utilization rate for the plywood industry, from 73% in 2010 to 80% in 2011 (despite a 1.4% drop in total plywood production) (graph 7.4.2). The APA estimates that structural plywood production will increase by 2.9% in 2012, with most of the increase in the US (APA, 2012).
OSB production. North American OSB production in 2011 at 13.5 million m3 was unchanged from 2010. In the US it fell by 2.5% (to 8.9 million m3), but in Canada jumped by 5.4% to reach a three-year high of 4.7 million m3. Only one OSB mill closed in Canada and, as a result, the capacity utilization rate remained virtually unchanged at 59% (compared to 58% in 2010) (graph 7.4.2). APA estimates that in 2012 OSB production in North America will increase by 9.1%, with the bulk of this increase occurring in the US (APA, 2012), pushing the capacity utilization rate up to 64%.
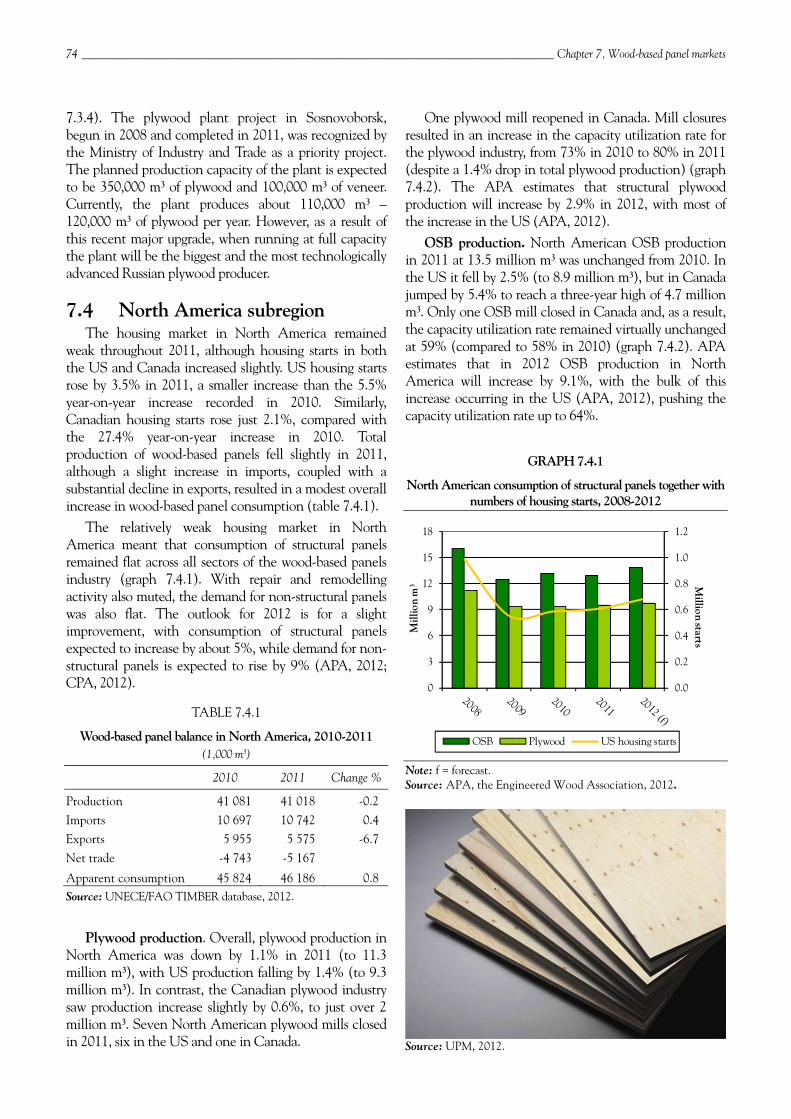
GRAPH 7.4.1
North American consumption of structural panels together with numbers of housing starts, 2008-2012
Note: f = forecast. Source: APA, the Engineered Wood Association, 2012.
Source: UPM, 2012.
0.0
0.2
0.4
0.6
0.8
1.0
1.2
0
3
6
9
12
15
18
Million starts
Mill
ion
m3
OSB Plywood US housing starts
UNECE/FAO Forest Products Annual Market Review, 2011-2012 __________________________________________________________ 75
GRAPH 7.4.2
North American structural panel capacity utilization, 2008-2012
Note: f = forecast. Source: APA, the Engineered Wood Association, 2012.
Particle board production. Production of non-structural panels (particle board and fibreboard) hardly changed between 2010 and 2011. Particle board production in 2011 was 3.2 billion square feet (3/4 inch basis, 5.7 million m3), with 72.5% in the US (23 mills) and 27.5% in Canada (7 mills). Capacity utilization in the particle board sector rose from 53.3% in 2010 to 55.2% in 2011 owing to seven plant closures, with a further four mills reducing production (all in the US). With the slow recovery of the US economy, capacity utilization is expected to increase to 63% by 2013.
MDF production. North American MDF production rose slightly in 2011 (to 3.4 million m3), with 74.3% of production capacity located in the US (14 mills) and 25.7% in Canada (5 mills). There was only one mill closure in 2011 (in the US). Other mills made minor capacity adjustments, which left the MDF capacity utilization rate in North America unchanged at 62.5%.
Plywood exports. The value of North American plywood exports fell by 1.5% in 2011, with US exports falling 1.3% and Canadian exports down by 1.9% (table 7.4.2). The three largest markets for US plywood remained Canada (55.2%), Mexico (13.5%) and Australia (12.3%). Exports of US plywood to China increased by 250% (to no. 9 export market) and to Japan by 153% (to no.10 export market). The two primary markets for Canadian plywood exports were the US (72.6% market share, compared with 93.1% in 2010) and Japan (14.5% market share, up from 1.3% in 2010).
TABLE 7.4.2
North American exports of wood-based panels 2007-2011. (Million $)
2007 2008 2009 2010 2011 Change % 2010 to 2011
US
Plywood 251 292 211 352 347 -1.27 Fibreboard 228 242 219 243 243 0.21 Particle board 189 222 118 150 160 6.32
Sub-total 668 757 548 745 750 0.72
Canada
Plywood 414 311 199 183 179 -1.86 Fibreboard 416 344 277 237 229 -3.42 Particle board 1 372 848 629 873 805 -7.77
Sub-total 2 201 1 503 1 105 1 293 1 213 -6.14
North America
Plywood 665 603 410 534 527 -1.47 Fibreboard 643 586 496 479 472 -1.58 Particle board
1 098 1 070 747 1 023 965 -5.70
Sub-total 2 868 2 260 1 652 2 037 1 963 -3.63
Source: Global Trade Atlas, 2012.
Canada’s exports to China grew by 498% (to become the fifth largest export market) and by 593% to the Republic of Korea (to become the sixth largest export market). While the growth of exports to China and Korea are impressive, it should be noted that the base figures were small. Increased plywood exports to Japan from both the US and Canada were a result of the tsunami that struck eastern Japan in March 2011, destroying much of Japan’s plywood industry. However, as Japan has moved quickly to rebuild its plywood industry, North American plywood exports to Japan are likely to decline in 2012. The US and Canada benefited from a general surge in the purchase of raw materials by the Chinese to meet their needs for processed wood for exports in 2011.
Fibreboard exports. In 2011, North American exports of fibreboard fell by 1.6%, with the US showing a slight increase of 0.2% compared with a decrease of 3.4% for Canadian exports (table 7.4.2). The principal export markets for US fibreboard in 2011 were Canada (60.1%, down by 9.3% from 2010) and Mexico (23.9%, up by 8.2%).
However, US fibreboard exports to the Russian Federation increased by 65.2% (to become the third largest export market); to Australia by 52.4% (the fourth largest market); to India (166% to become the eighth
0%
20%
40%
60%
80%
100%
Cap
acit
y ut
iliza
tion
Plywood OSB
76 _________________________________________________________________________________ Chapter 7, Wood-based panel markets
largest market), and to the Republic of Korea by 299% (becoming the tenth largest export market). Canadian fibreboard exports went primarily to the US (90.7% market share; a fall of 3.4% from 2010).
Particle board exports. In 2011, North American particle board exports fell by 5.7%, mainly due to a 7.8% drop in Canadian exports; whereas US exports were up by 6.3% (table 7.4.2). The primary export markets for US particle board were Canada (49.7% market share; up by 1.6%) and Mexico (22.7% market share; down by 7%). The largest increases in US particle board exports in 2011 were to the Russian Federation (443% to become the third largest market) and to Ukraine (164% to become the sixth largest market). The US remained the primary market for Canadian particle board (88.5% market share; down by 11.3%).
US and Canadian trade in wood-based panels is largely confined to the North American region. While the recent trade data seem to suggest that US panel manufacturers are beginning to expand into new markets, Canadian panel manufacturers appear to remain focused on the US market.
Imports and the Lacey Act. In 2010, the US amended the Lacey Act to prevent imports of wood products manufactured from illegally harvested timber. At the time, many analysts suggested that this might cause a reduction in US imports of wood products from countries where illegal logging was thought to be a concern. However, the trade data are somewhat ambiguous on this point. While overall imports of wood-based panels from tropical countries into the US declined in 2011, imports from a few countries increased.
Formaldehyde emission levels: California. The California Air Resource Board (CARB) legislation, designed to reduce formaldehyde emissions in wood-based panels, moved into Phase II for both particle board and MDF as of 1 January 2011. Under CARB Phase II, formaldehyde emission levels for particle board cannot exceed 0.09 parts per million (down from 0.18 ppm under Phase I); while for MDF the allowable formaldehyde emission level cannot exceed 0.11 ppm (down from 0.21 ppm under Phase I).
Formaldehyde emission levels: new federal legislation. While the reduced formaldehyde emission levels have only been applicable in California to date, new federal legislation (signed into law on 7 July 2010) will become effective as of 1 June 2013. Entitled “Formaldehyde Standards for Composite Wood Products Act”, this legislation will expand the California law to the entire US. However, it applies only to hardwood plywood, particle board and MDF, not to OSB or softwood plywood. Demand for reduced formaldehyde panels is expected to increase with the increasing
adoption of green building programmes in the US. The cost of complying with the legislation could raise the price of wood-based panels by between 3% and 15%, although the price of finished furniture (where the majority of these panels are used) would increase only slightly since wood-based panels are a small component of the total cost of wooden furniture.
7.5 Panel price trends By early 2011, panel prices had largely recovered their
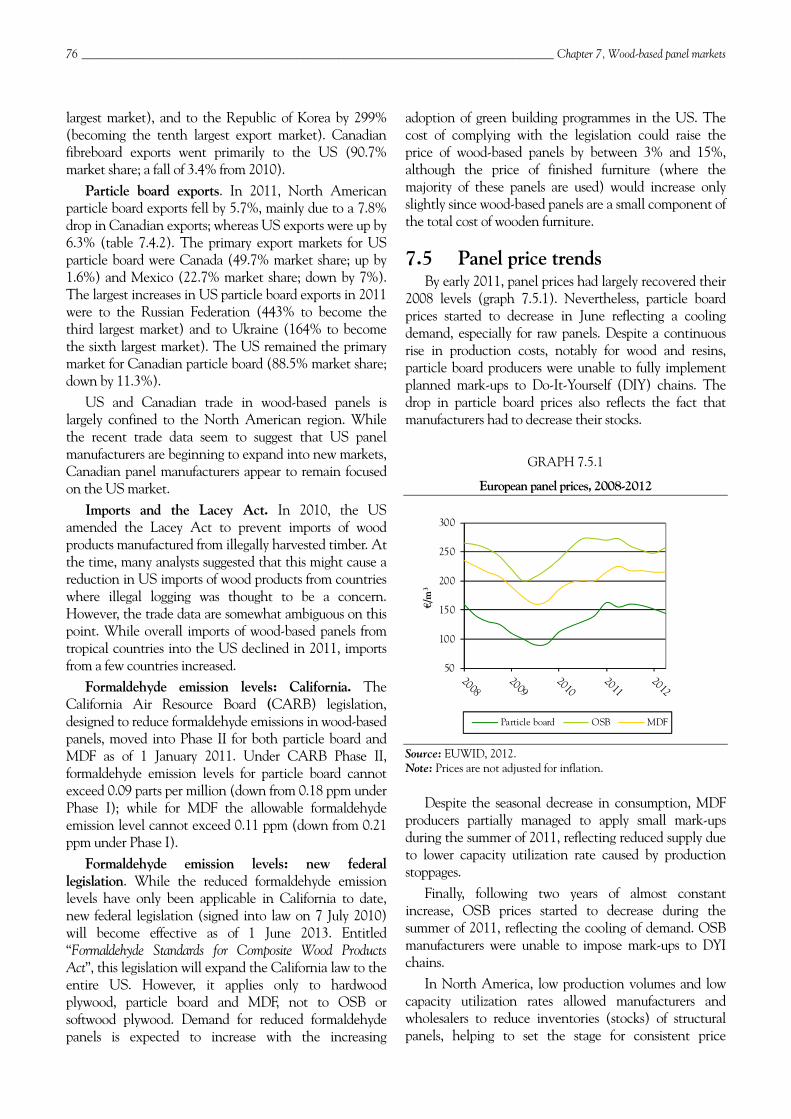
2008 levels (graph 7.5.1). Nevertheless, particle board prices started to decrease in June reflecting a cooling demand, especially for raw panels. Despite a continuous rise in production costs, notably for wood and resins, particle board producers were unable to fully implement planned mark-ups to Do-It-Yourself (DIY) chains. The drop in particle board prices also reflects the fact that manufacturers had to decrease their stocks.
GRAPH 7.5.1
European panel prices, 2008-2012
Source: EUWID, 2012. Note: Prices are not adjusted for inflation.
Despite the seasonal decrease in consumption, MDF producers partially managed to apply small mark-ups during the summer of 2011, reflecting reduced supply due to lower capacity utilization rate caused by production stoppages.
Finally, following two years of almost constant increase, OSB prices started to decrease during the summer of 2011, reflecting the cooling of demand. OSB manufacturers were unable to impose mark-ups to DYI chains.
In North America, low production volumes and low capacity utilization rates allowed manufacturers and wholesalers to reduce inventories (stocks) of structural panels, helping to set the stage for consistent price
50
100
150
200
250
300
€/m
3
Particle board OSB MDF
UNECE/FAO Forest Products Annual Market Review, 2011-2012 __________________________________________________________ 77
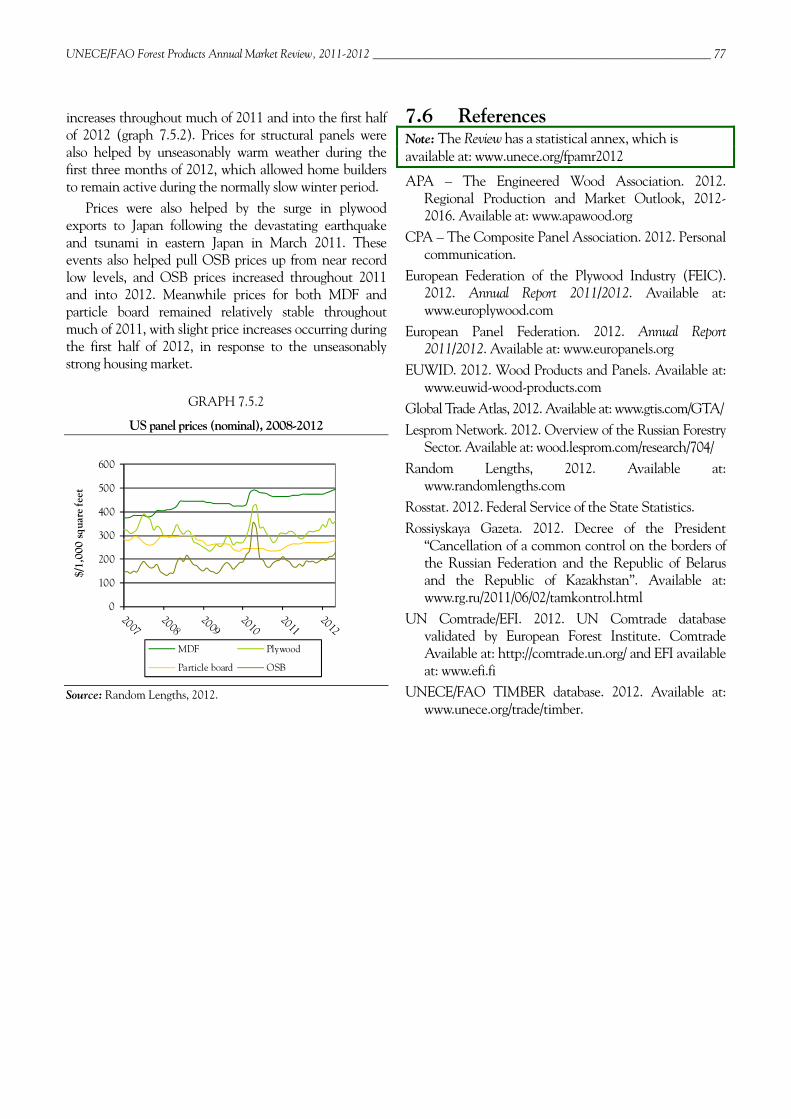
increases throughout much of 2011 and into the first half of 2012 (graph 7.5.2). Prices for structural panels were also helped by unseasonably warm weather during the first three months of 2012, which allowed home builders to remain active during the normally slow winter period.
Prices were also helped by the surge in plywood exports to Japan following the devastating earthquake and tsunami in eastern Japan in March 2011. These events also helped pull OSB prices up from near record low levels, and OSB prices increased throughout 2011 and into 2012. Meanwhile prices for both MDF and particle board remained relatively stable throughout much of 2011, with slight price increases occurring during the first half of 2012, in response to the unseasonably strong housing market.
GRAPH 7.5.2
US panel prices (nominal), 2008-2012
Source: Random Lengths, 2012.
7.6 References Note: The Review has a statistical annex, which is available at: www.unece.org/fpamr2012
APA – The Engineered Wood Association. 2012. Regional Production and Market Outlook, 2012-2016. Available at: www.apawood.org
CPA – The Composite Panel Association. 2012. Personal communication.
European Federation of the Plywood Industry (FEIC). 2012. Annual Report 2011/2012. Available at: www.europlywood.com
European Panel Federation. 2012. Annual Report 2011/2012. Available at: www.europanels.org
EUWID. 2012. Wood Products and Panels. Available at: www.euwid-wood-products.com
Global Trade Atlas, 2012. Available at: www.gtis.com/GTA/ Lesprom Network. 2012. Overview of the Russian Forestry
Sector. Available at: wood.lesprom.com/research/704/ Random Lengths, 2012. Available at:
www.randomlengths.com Rosstat. 2012. Federal Service of the State Statistics. Rossiyskaya Gazeta. 2012. Decree of the President
“Cancellation of a common control on the borders of the Russian Federation and the Republic of Belarus and the Republic of Kazakhstan”. Available at: www.rg.ru/2011/06/02/tamkontrol.html
UN Comtrade/EFI. 2012. UN Comtrade database validated by European Forest Institute. Comtrade Available at: http://comtrade.un.org/ and EFI available at: www.efi.fi
UNECE/FAO TIMBER database. 2012. Available at: www.unece.org/trade/timber.
0
100
200
300
400
500
600
$/1,
000
squa
re fe
et
MDF Plywood
Particle board OSB