Embed Size (px)
Citation preview
©"OECD/IEA"2018
7. Toolkit: Policy instruments available to improve the fuel economy of carsJacob Teter - IEA17 May, IEA Energy Efficiency Training Week
IEA
©"OECD/IEA"2018
What is fuel economy?
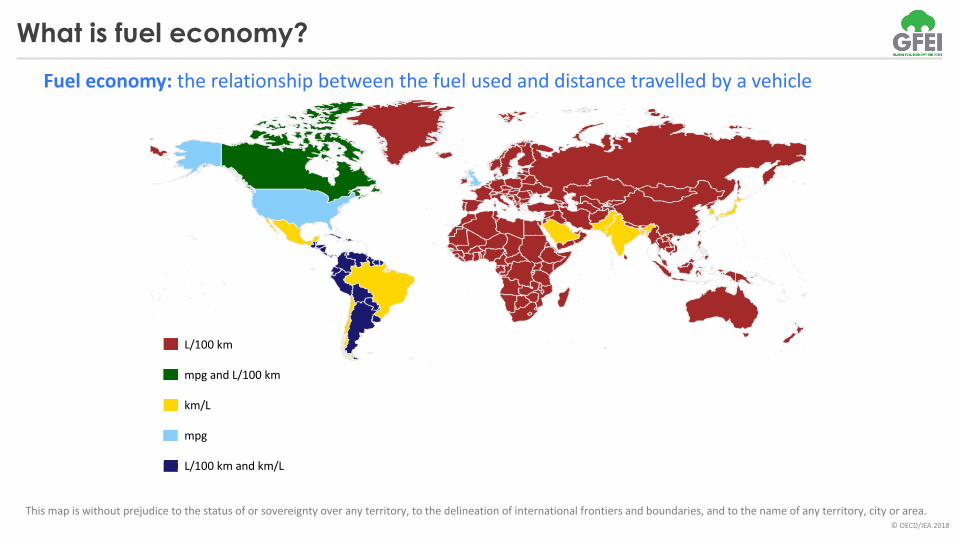
Fuel%economy: the"relationship"between"the"fuel"used"and"distance"travelled"by"a"vehicle
This"map"is"without"prejudice"to"the"status"of"or"sovereignty"over"any"territory,"to"the"delineation"of"international"frontiers"and"boundaries,"and"to"the"name"of"any"territory,"city"or"area.
L/100"km
mpg"and"L/100"km
km/L
mpg
L/100"km"and"km/L
©"OECD/IEA"2018
What is fuel economy?
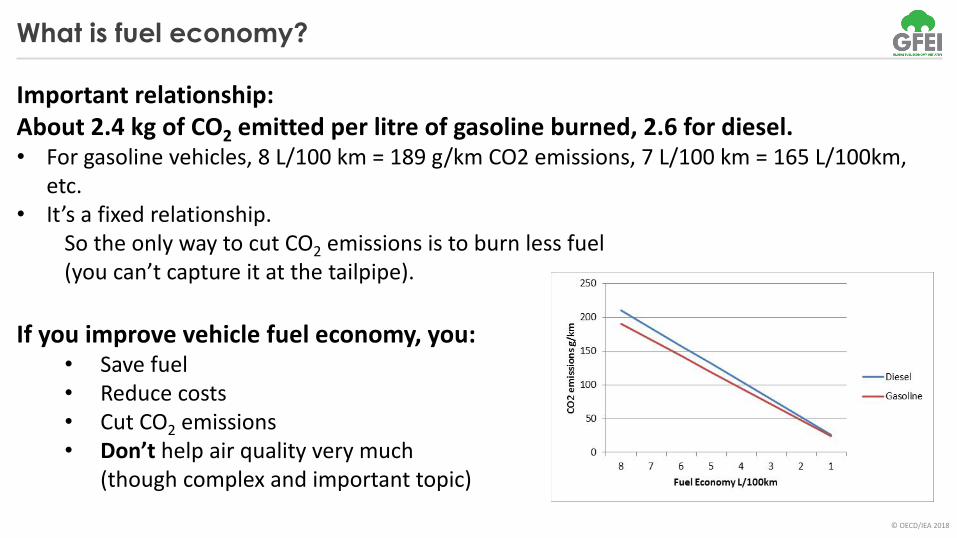
Important)relationship:)About)2.4)kg)of)CO2 emitted)per)litre of)gasoline)burned,)2.6)for)diesel.)• For"gasoline"vehicles,"8"L/100"km"="189"g/km"CO2"emissions,"7"L/100"km"="165"L/100km,"
etc."• It’s"a"fixed"relationship.
So"the"only"way"to"cut"CO2 emissions"is"to"burn"less"fuel"(you"can’t"capture"it"at"the"tailpipe).
If)you)improve)vehicle)fuel)economy,)you:• Save"fuel• Reduce"costs• Cut"CO2 emissions• Don’t help"air"quality"very"much"
(though"complex"and"important"topic)
©"OECD/IEA"2018
What is fuel economy?
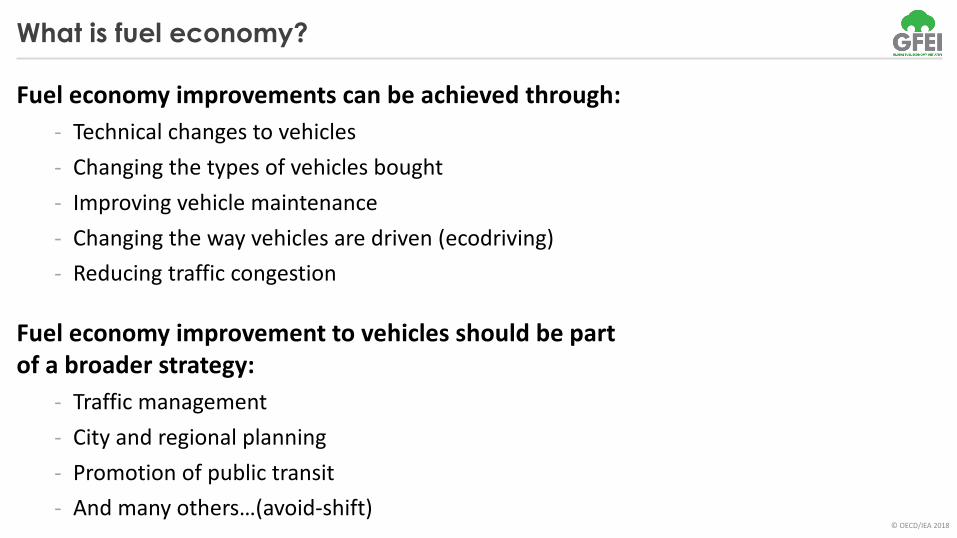
Fuel%economy%improvements%can%be%achieved%through:%. Technical"changes"to"vehicles. Changing"the"types"of"vehicles"bought. Improving"vehicle"maintenance. Changing"the"way"vehicles"are"driven"(ecodriving). Reducing"traffic"congestion
Fuel%economy%improvement%to%vehicles%should%be%partof%a%broader%strategy:
. Traffic"management
. City"and"regional"planning
. Promotion"of"public"transit
. And"many"others…(avoid.shift)
©"OECD/IEA"2018
How to improve vehicle fuel economy
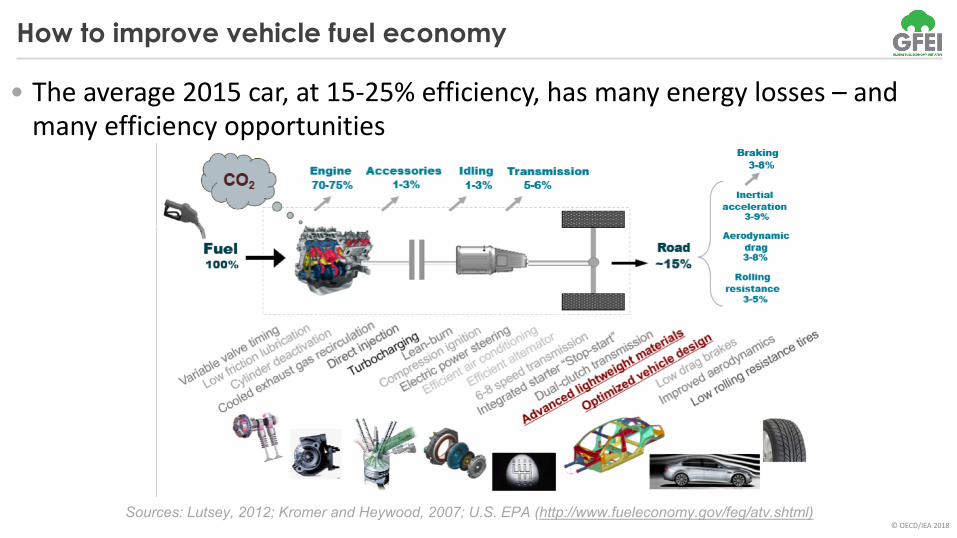
• The"average"2015"car,"at"15:25%"efficiency,"has"many"energy"losses"– and"many"efficiency"opportunities
Sources:)Lutsey,)20121)Kromer)and)Heywood,)20071)U.S.)EPA)(http://www.fueleconomy.gov/feg/atv.shtml)
©"OECD/IEA"2018
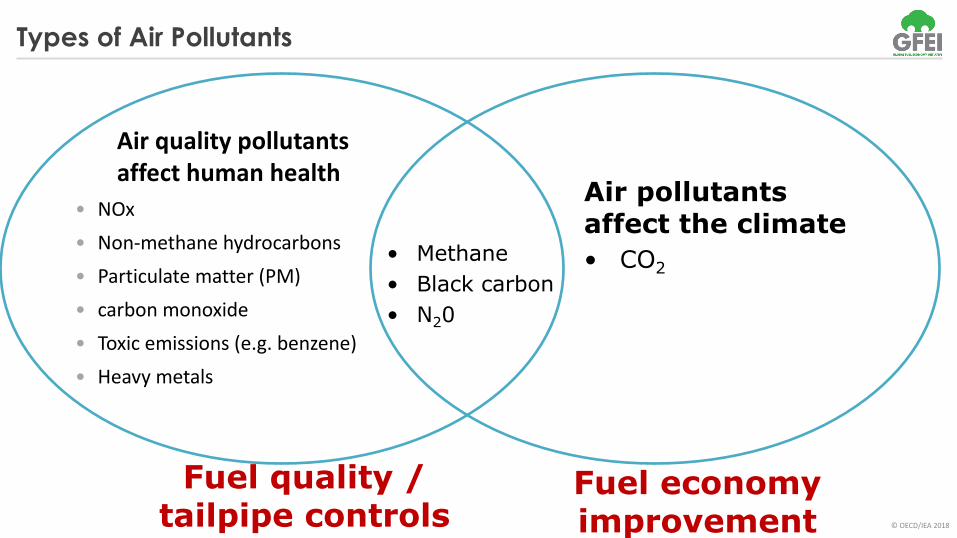
Air$quality$pollutants$affect$human$health
• NOx• Non3methane"hydrocarbons• Particulate"matter"(PM)• carbon"monoxide• Toxic"emissions"(e.g."benzene)• Heavy"metals
Air pollutants affect the climate• CO2
• Methane• Black carbon• N20
Fuel quality / tailpipe controls
Fuel economy improvement
Types of Air Pollutants
©"OECD/IEA"2018
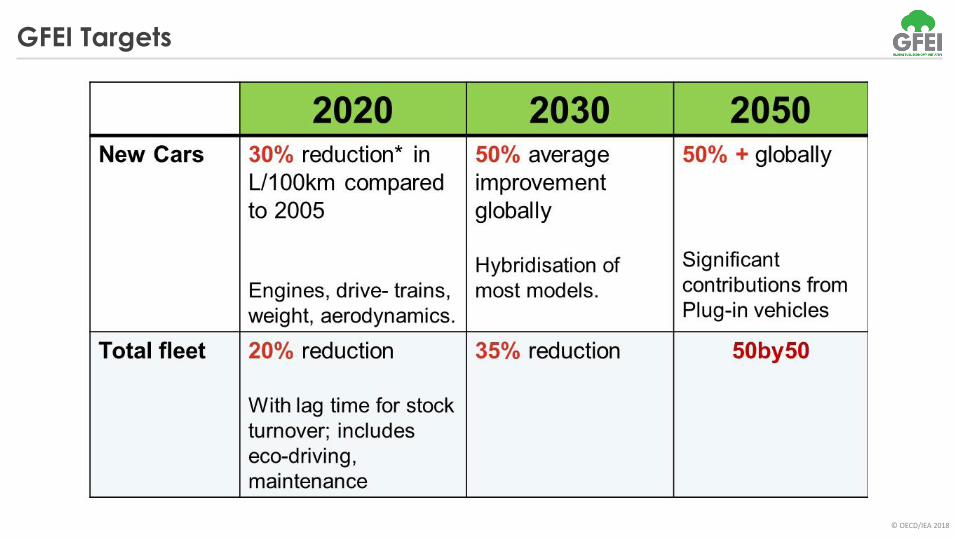
GFEI Targets
©"OECD/IEA"2018
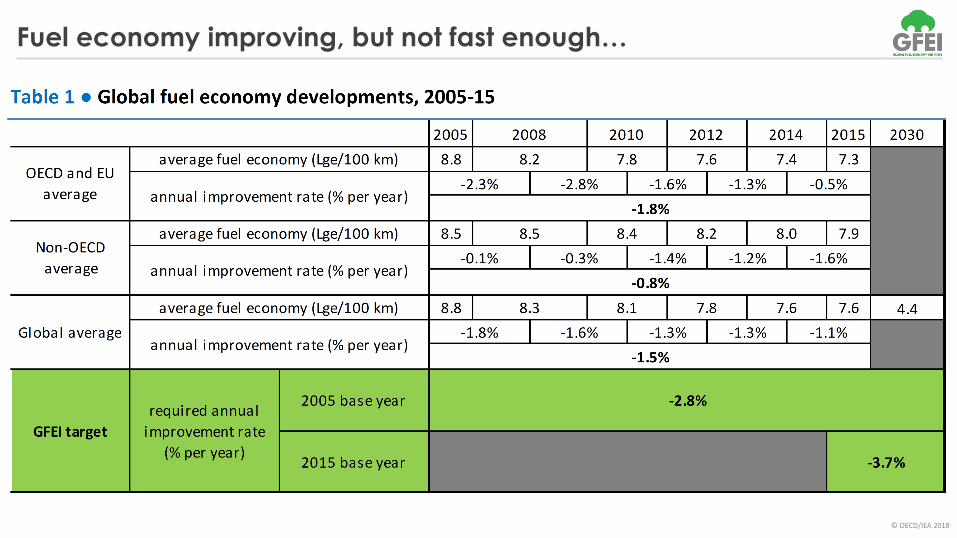
Fuel economy improving, but not fast enough…
©"OECD/IEA"2018
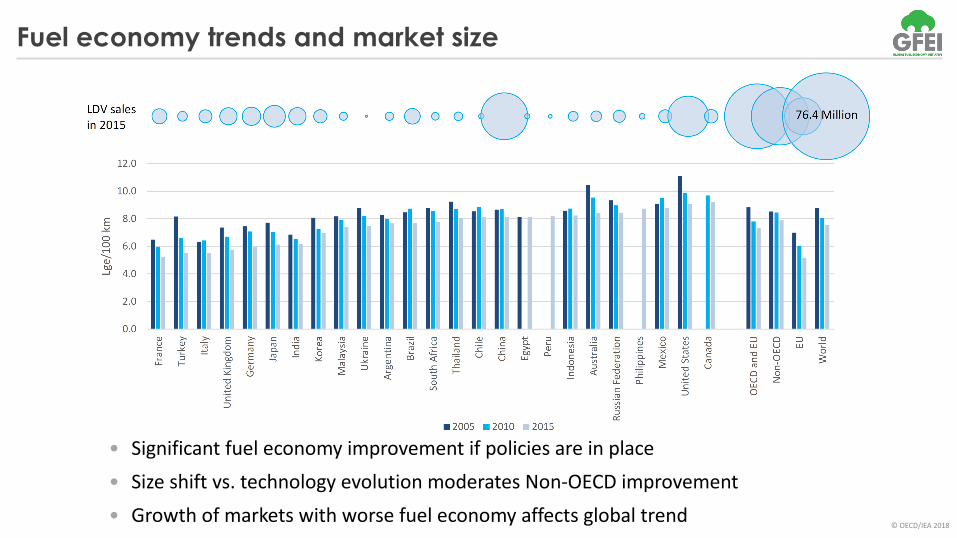
Fuel economy trends and market size
• Significant"fuel"economy"improvement"if"policies"are"in"place• Size"shift"vs."technology"evolution"moderates"NonFOECD"improvement• Growth"of"markets"with"worse"fuel"economy"affects"global"trend
©"OECD/IEA"2018
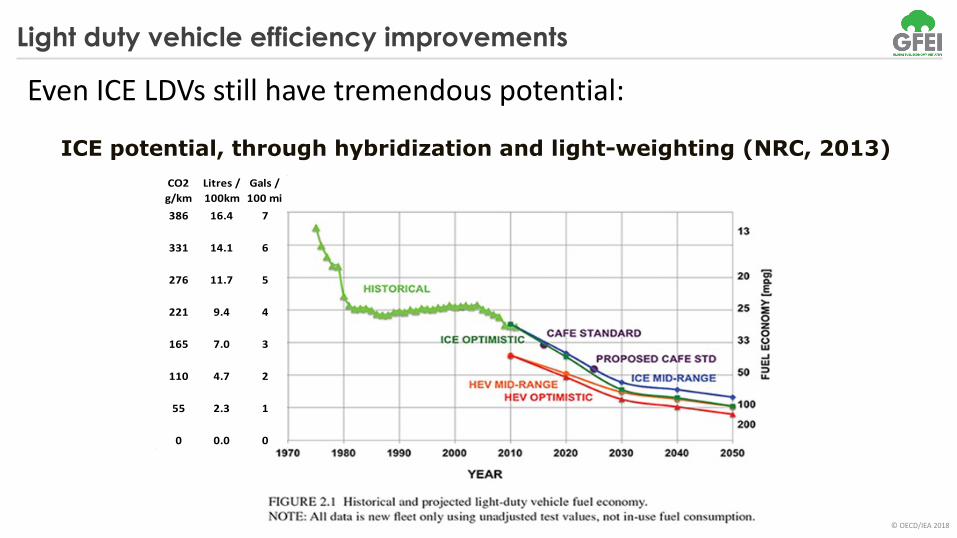
Light duty vehicle efficiency improvements
Even"ICE"LDVs"still"have"tremendous"potential:
ICE potential, through hybridization and light-weighting (NRC, 2013)CO2$g/km
Litres$/$100km
Gals$/$100$mi
386 16.4 7
331 14.1 6
276 11.7 5
221 9.4 4
165 7.0 3
110 4.7 2
55 2.3 1
0 0.0 0
©"OECD/IEA"2018
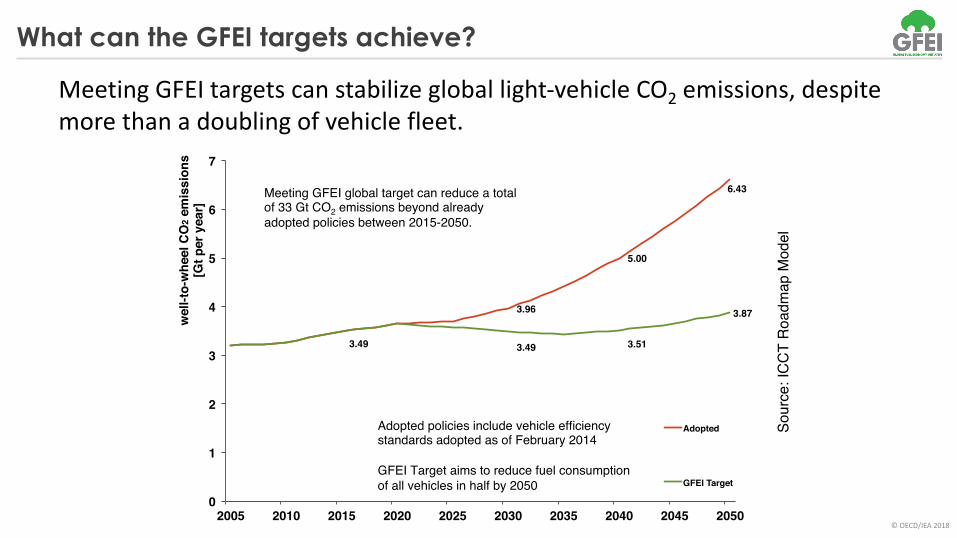
What can the GFEI targets achieve?
Meeting"GFEI"targets"can"stabilize"global"light?vehicle"CO2 emissions,"despite"more"than"a"doubling"of"vehicle"fleet.
3.96!
5.00!
6.43!
3.49! 3.49! 3.51!
3.87!
0!
1!
2!
3!
4!
5!
6!
7!
2005! 2010! 2015! 2020! 2025! 2030! 2035! 2040! 2045! 2050!
wel
l-to-
whe
el C
O2 e
mis
sion
s![G
t per
yea
r]!
Adopted!
GFEI Target!
Adopted policies include vehicle efficiency standards adopted as of February 2014!!GFEI Target aims to reduce fuel consumption of all vehicles in half by 2050!
Meeting GFEI global target can reduce a total of 33 Gt CO2 emissions beyond already adopted policies between 2015-2050.!
Source: ICCT Roadmap Model!
3.96!
5.00!
6.43!
3.49!
3.49!
3.51!
3.87!
0!1!2!3!4!5!6!7! 2005!
2010!
2015!
2020!
2025!
2030!
2035!
2040!
2045!
2050!
well-to-wheel CO2 emissions![Gt per year]!
Adop
ted!
GFE
I Tar
get!
Adop
ted
polic
ies
inclu
de v
ehicl
e ef
ficie
ncy
stan
dard
s ad
opte
d as
of F
ebru
ary
2014!
! GFE
I Tar
get a
ims
to re
duce
fuel
con
sum
ptio
n of
all v
ehicl
es in
hal
f by
2050!
Mee
ting
GFE
I glo
bal t
arge
t can
redu
ce a
tota
l of
33
Gt C
O2 e
miss
ions
bey
ond
alre
ady
adop
ted
polic
ies
betw
een
2015
-205
0.!
Sour
ce: I
CCT
Road
map
Mod
el!
©"OECD/IEA"2018
Four key fuel economy policies
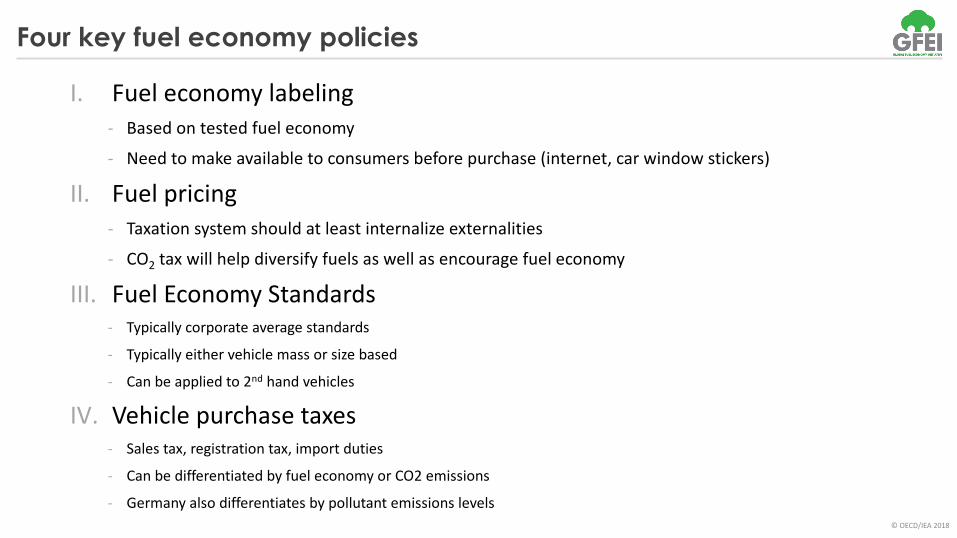
I. Fuel"economy"labeling< Based"on"tested"fuel"economy< Need"to"make"available"to"consumers"before"purchase"(internet,"car"window"stickers)
II. Fuel"pricing< Taxation"system"should"at"least"internalize"externalities< CO2 tax"will"help"diversify"fuels"as"well"as"encourage"fuel"economy
III. Fuel"Economy"Standards< Typically"corporate"average"standards
< Typically"either"vehicle"mass"or"size"based
< Can"be"applied"to"2nd hand"vehicles
IV. Vehicle"purchase"taxes< Sales"tax,"registration"tax,"import"duties
< Can"be"differentiated"by"fuel"economy"or"CO2"emissions
< Germany"also"differentiates"by"pollutant"emissions"levels

©"OECD/IEA"2018
Four key fuel economy policies
I. Fuel"economy"labeling< Based"on"tested"fuel"economy< Need"to"make"available"to"consumers"before"purchase"(internet,"car"window"stickers)
II. Fuel"pricing< Taxation"system"should"at"least"internalize"externalities< CO2 tax"will"help"diversify"fuels"as"well"as"encourage"fuel"economy
III. Fuel"Economy"Standards< Typically"corporate"average"standards
< Typically"either"vehicle"mass"or"size"based
< Can"be"applied"to"2nd hand"vehicles
IV. Vehicle"purchase"taxes< Sales"tax,"registration"tax,"import"duties
< Can"be"differentiated"by"fuel"economy"or"CO2"emissions
< Germany"also"differentiates"by"pollutant"emissions"levels
©"OECD/IEA"2018
Fuel Economy Standards
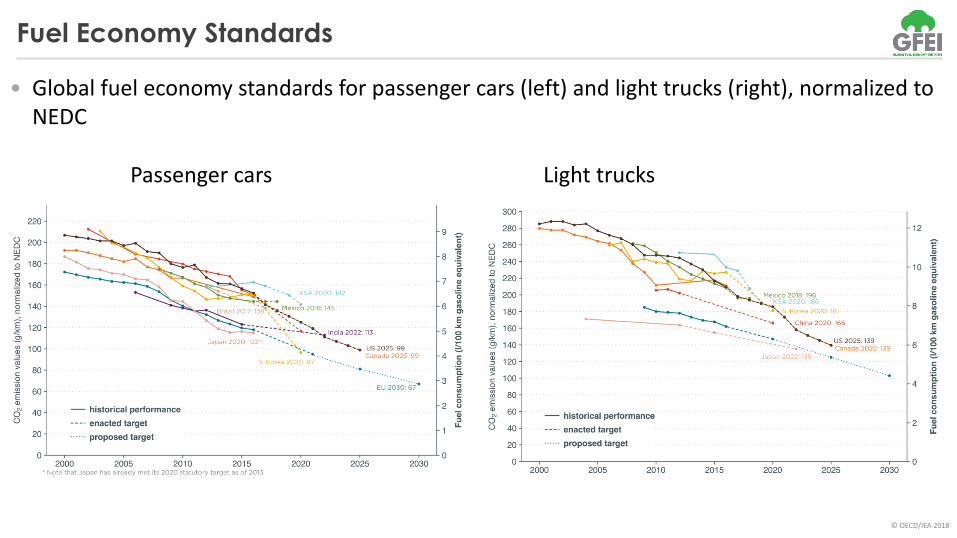
• Global"fuel"economy"standards"for"passenger"cars"(left)"and"light"trucks"(right),"normalized"to"NEDC
Passenger"cars Light"trucks
©"OECD/IEA"2018
Fuel Economy Standards
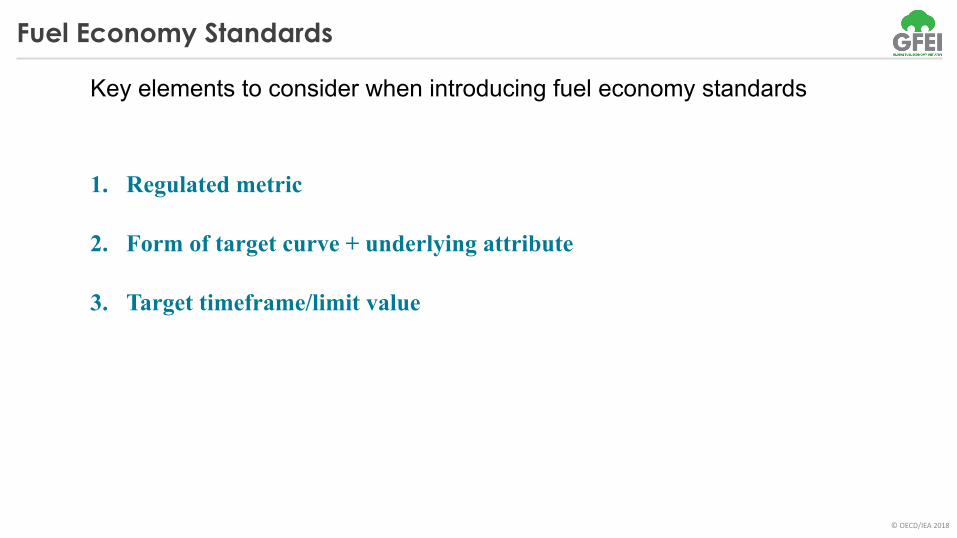
Key$elements$to$consider$when$introducing$fuel$economy$standards
1. Regulated metric (fuel consumption, GHG,
2. Form of target curve + underlying attribute
3. Target timeframe/limit value
©"OECD/IEA"2018
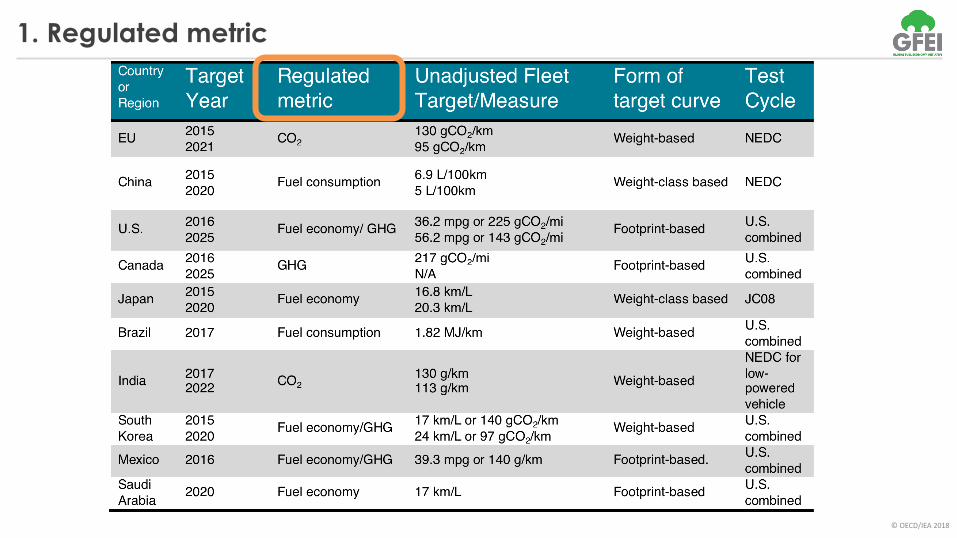
1. Regulated metric
©"OECD/IEA"2018
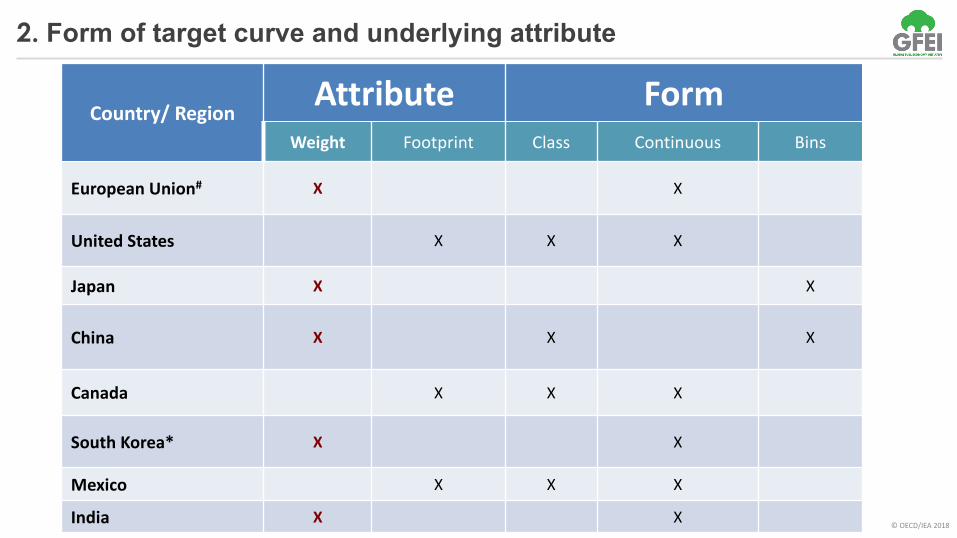
2. Form%of%target%curve%and%underlying%attribute
Country/)Region Attribute FormWeight Footprint Class Continuous Bins
European)Union# X X
United)States X X X
Japan X X
China X X X
Canada X X X
South)Korea* X X
Mexico X X X
India X X
©"OECD/IEA"2018
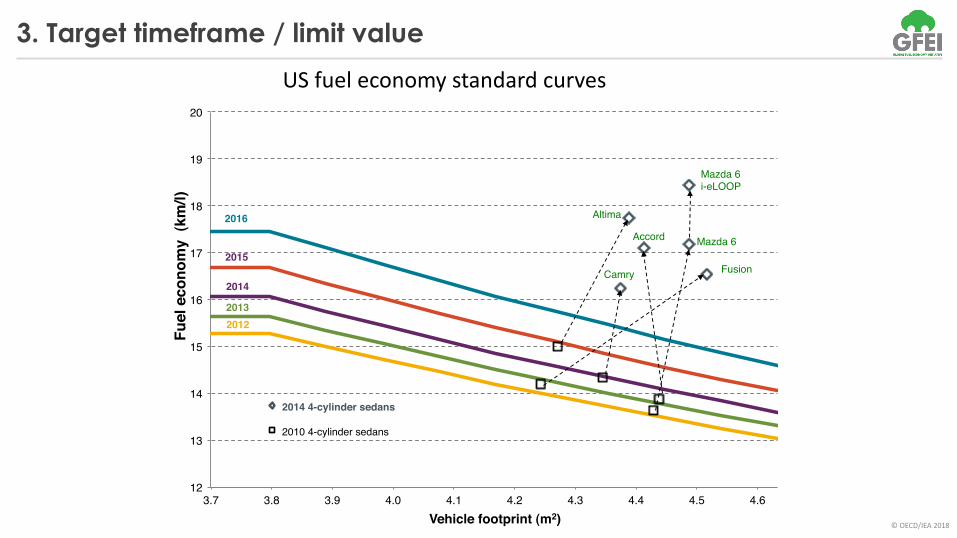
3. Target timeframe / limit valueUS"fuel"economy"standard"curves
12!
13!
14!
15!
16!
17!
18!
19!
20!
3.7! 3.8! 3.9! 4.0! 4.1! 4.2! 4.3! 4.4! 4.5! 4.6!
Fuel
eco
nom
y (k
m/l)!
Vehicle footprint (m2)!
2014 4-cylinder sedans!
2010 4-cylinder sedans!
Fusion!
2012!2013!
2014!
2015!
2016!Accord!
Camry !
Mazda 6!
Mazda 6!i-eLOOP!
Altima!
©"OECD/IEA"2018
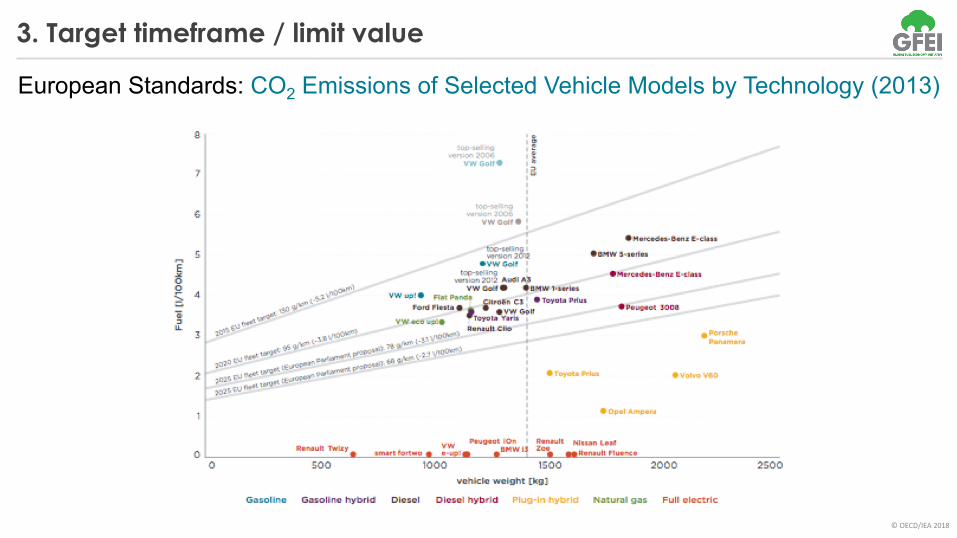
3. Target timeframe / limit value
European)Standards:)CO2 Emissions)of)Selected)Vehicle)Models)by)Technology)(2013)
©"OECD/IEA"2018
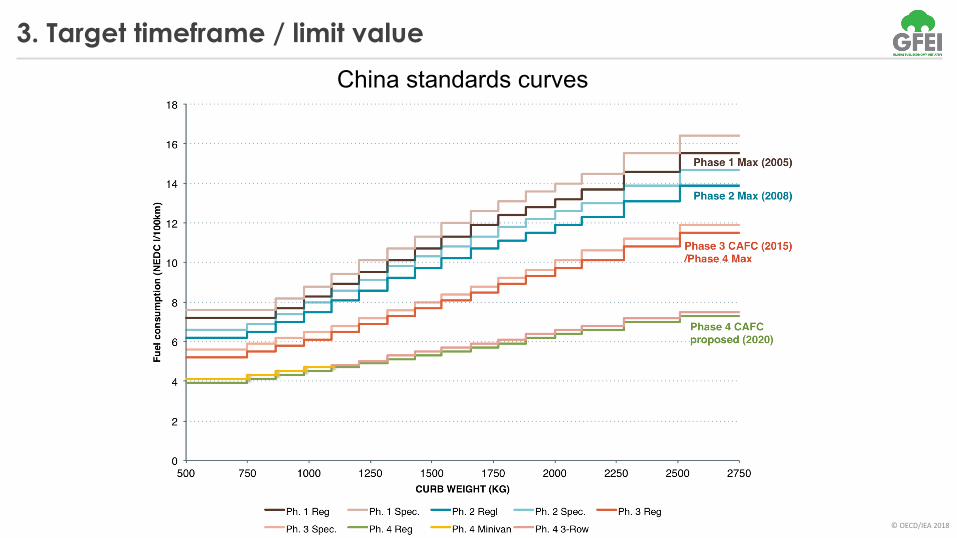
3. Target timeframe / limit valueChina&standards&curves
©"OECD/IEA"2018
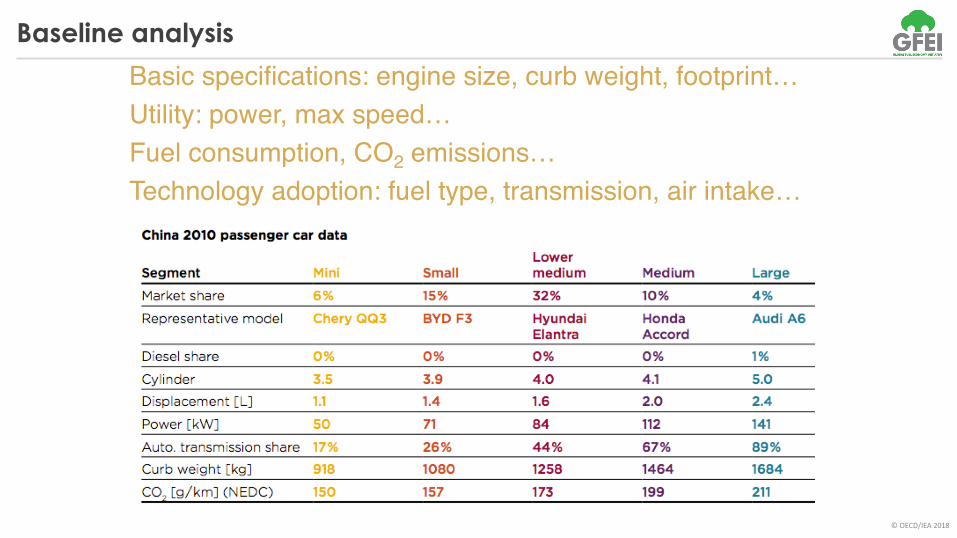
Baseline analysis! Basic specifications: engine size, curb weight, footprint…! Utility: power, max speed…! Fuel consumption, CO2 emissions…! Technology adoption: fuel type, transmission, air intake…
©"OECD/IEA"2018
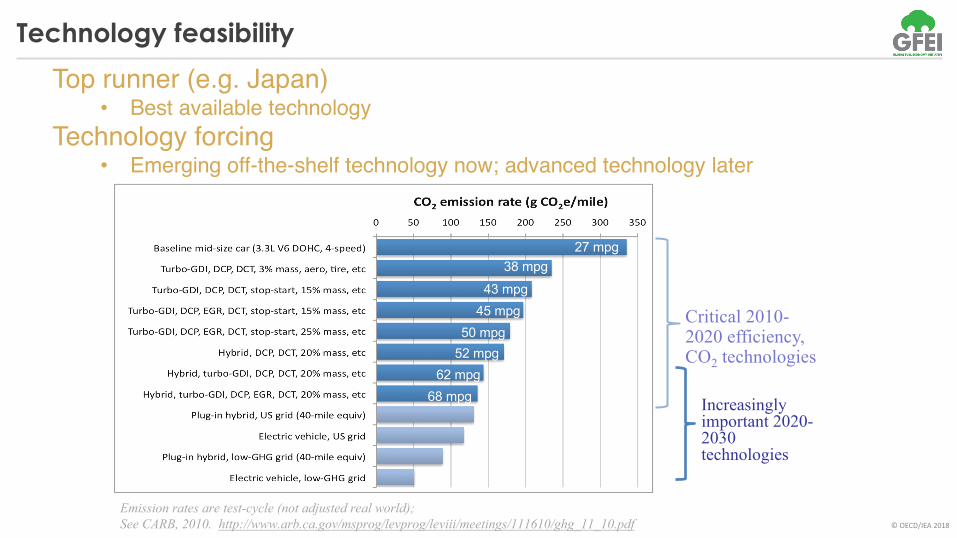
Technology feasibility
Top runner (e.g. Japan)• Best available technology
Technology forcing • Emerging off-the-shelf technology now; advanced technology later
Emission rates are test-cycle (not adjusted real world); See CARB, 2010. http://www.arb.ca.gov/msprog/levprog/leviii/meetings/111610/ghg_11_10.pdf
27$mpg38$mpg
43$mpg45$mpg
50$mpg52$mpg
62$mpg68$mpg
Critical 2010-2020 efficiency, CO2 technologies
Increasingly important 2020-2030 technologies
US mid-size vehicle
©"OECD/IEA"2018
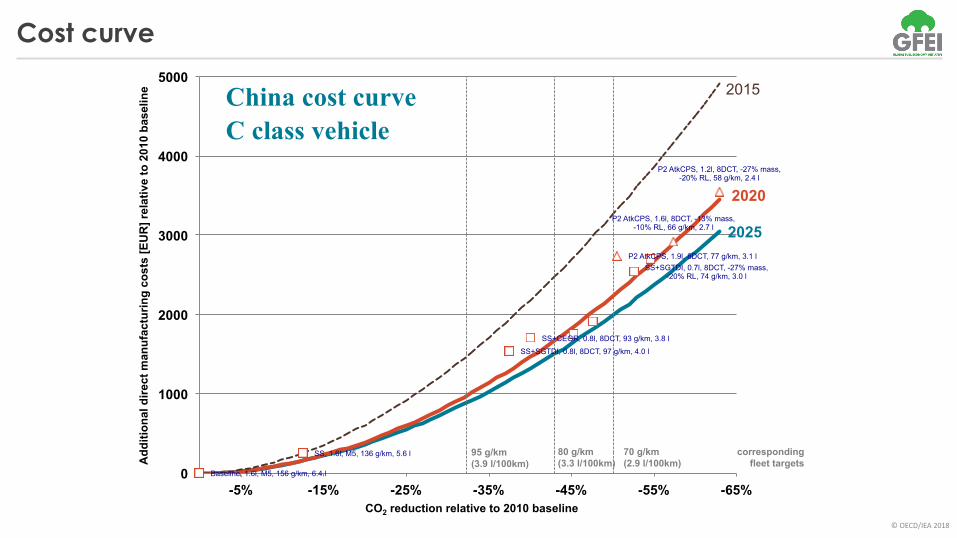
Cost curve
Baseline, 1.6l, M5, 156 g/km, 6.4 l
SS, 1.6l, M5, 136 g/km, 5.6 l
SS+SGTDI, 0.8l, 8DCT, 97 g/km, 4.0 l
SS+CEGR, 0.8l, 8DCT, 93 g/km, 3.8 l
P2 AtkCPS, 1.9l, 8DCT, 77 g/km, 3.1 l
P2 AtkCPS, 1.6l, 8DCT, -13% mass, -10% RL, 66 g/km, 2.7 l
SS+SGTDI, 0.7l, 8DCT, -27% mass, -20% RL, 74 g/km, 3.0 l
P2 AtkCPS, 1.2l, 8DCT, -27% mass, -20% RL, 58 g/km, 2.4 l
0
1000
2000
3000
4000
5000
-65% -55% -45% -35% -25% -15% -5%
Ad
dit
ion
al
dir
ec
t m
an
ufa
ctu
rin
g c
os
ts [
EU
R]
rela
tiv
e t
o 2
01
0 b
as
eli
ne
CO2 reduction relative to 2010 baseline
95 g/km
(3.9 l/100km)
80 g/km
(3.3 l/100km)
70 g/km
(2.9 l/100km)
corresponding
fleet targets
2015
2020
2025
China cost curveC class vehicle
©"OECD/IEA"2018
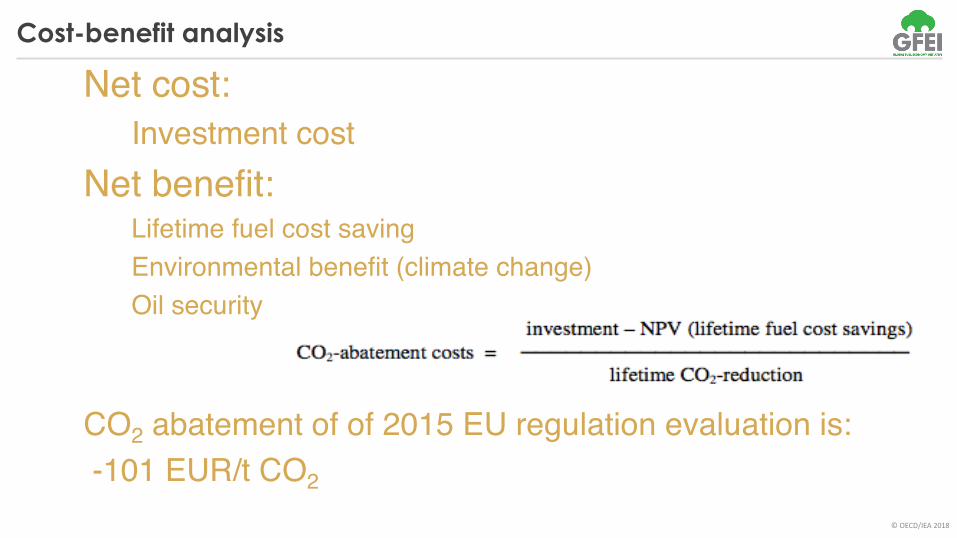
Cost-benefit analysis
! Net cost: ! Investment cost
! Net benefit: ! Lifetime fuel cost saving! Environmental benefit (climate change)! Oil security
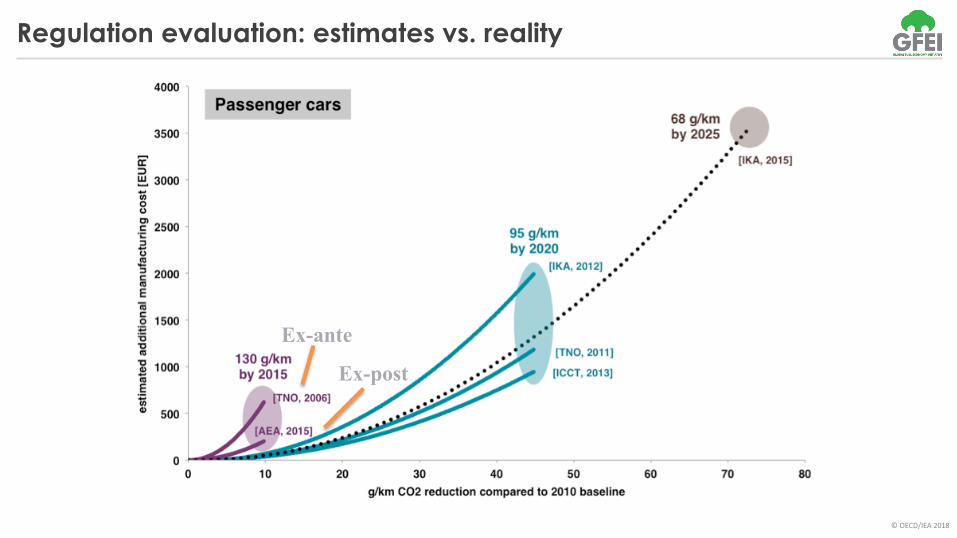
! CO2 abatement of of 2015 EU regulation evaluation is:! -101 EUR/t CO2
©"OECD/IEA"2018
Regulation evaluation: estimates vs. reality
25
Ex-ante
Ex-post
©"OECD/IEA"2018
Conclusions
• Fuel"economy"improvement"is"very"cost"effective;"using"social"discount"rates"the"GFEI"targets"are"cost"effective
• Strong"fuel"economy"improvements"will"save"enormous"amounts"of"energy,"CO2 and"fuel"costs"over"the"next"35"years
• Fuel"economy"could"get"us"half"way"to"a"low"carbon"LDV"system,"but"we"will"likely"need"PEVs"and"other"solutions"to"get"the"rest"of"the"way,"especially"after"2030.""
• Enacting"and"progressively"strengthening"strong"policies"around"the"world"will"be"the"key
©"OECD/IEA"2018
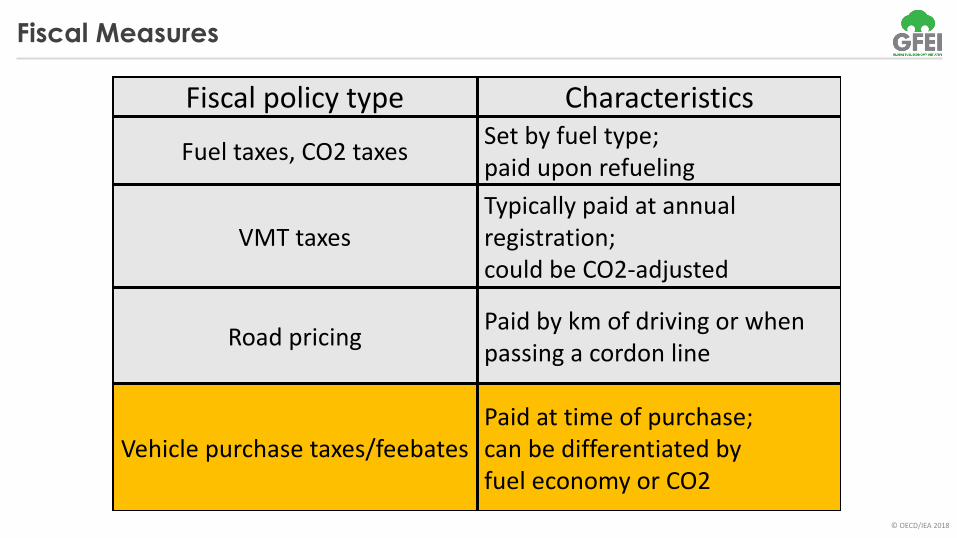
Fiscal Measures
Fiscal"policy"type Characteristics
Fuel"taxes,"CO2"taxesSet"by"fuel"type;"
paid"upon"refueling
VMT"taxes
Typically"paid"at"annual"
registration;"
could"be"CO2Hadjusted
Road"pricingPaid"by"km"of"driving"or"when
passing"a"cordon"line
Vehicle"purchase"taxes/feebates
Paid"at"time"of"purchase;"
can"be"differentiated"by"
fuel"economy"or"CO2

©"OECD/IEA"2018
Role of fiscal policies in promoting fuel efficiency
• Encourage manufacturers to adopt technologies to improve fuel efficiency and reduce emissions
• Send consumers appropriate price signals to purchase fuel-efficient and low carbon vehicles
• Support fuel efficiency and emission regulatory targets/ Regulatory standards set the minimum requirement and need to be
strengthened overtime/ Fiscal policies provide continuous incentive to improve
/ Easy to establish, does not require detailed knowledge of vehicles and technology costs, only needs to establish “rate, or value of fuel or GHG savings”, “revenue target”, and “test method and enforcement”
©"OECD/IEA"2018
Feebates – what are they?
Feebate ='Fee'+'Rebate'• Market5based"policy"that"shifts"consumer"purchases"(and"potentially"manufacturer"production)"by"encouraging"GHG"reductions"by"placing"a"fee"on"higher5emitting"vehicles"and"providing"a"rebate"to"lower5emitting"vehicles
• Based"on"fuel"economy"or"CO2"differential"between"vehicles
• Could"also"take"into"account"vehicle"attributes"like"size"or"weight
©"OECD/IEA"2018
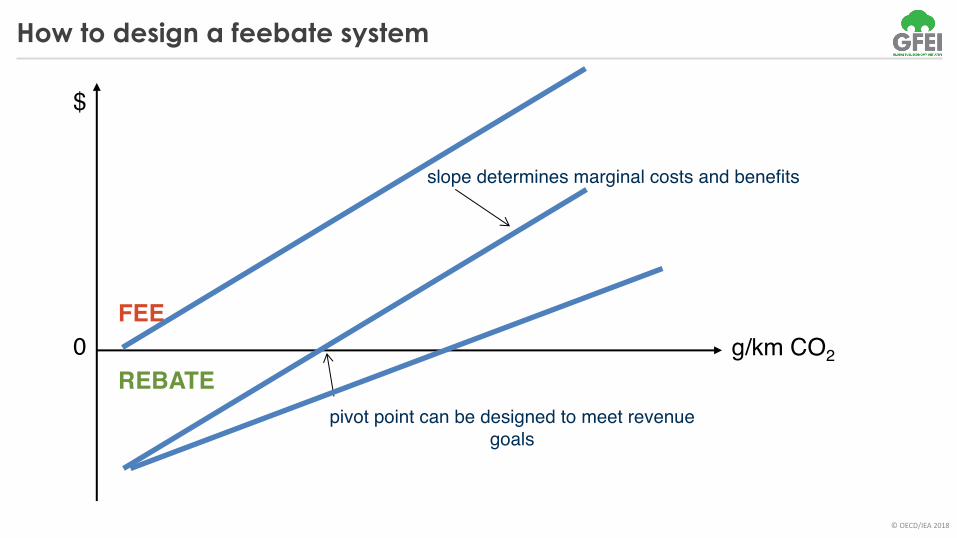
How to design a feebate system
$
g/km CO20FEE
REBATE
slope determines marginal costs and benefits
pivot point can be designed to meet revenue goals
©"OECD/IEA"2018
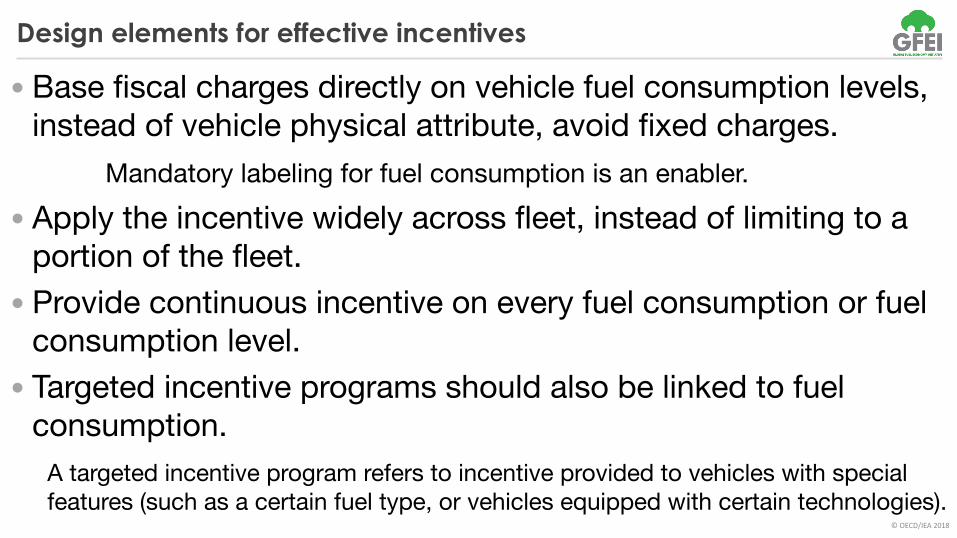
Design elements for effective incentives
• Base fiscal charges directly on vehicle fuel consumption levels, instead of vehicle physical attribute, avoid fixed charges.
Mandatory labeling for fuel consumption is an enabler.• Apply the incentive widely across fleet, instead of limiting to a
portion of the fleet.• Provide continuous incentive on every fuel consumption or fuel
consumption level.• Targeted incentive programs should also be linked to fuel
consumption.A targeted incentive program refers to incentive provided to vehicles with special features (such as a certain fuel type, or vehicles equipped with certain technologies).
©"OECD/IEA"2018
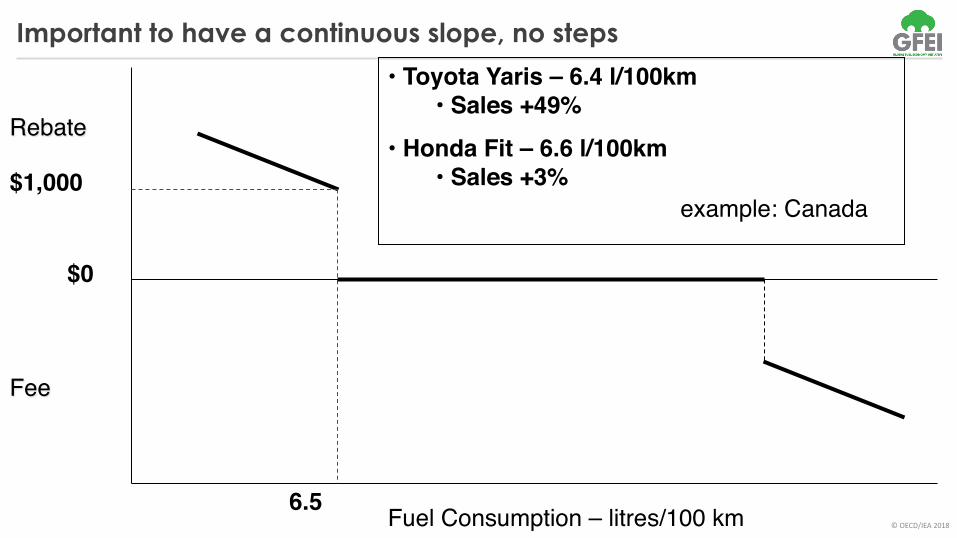
Important to have a continuous slope, no steps
$0
Fuel Consumption – litres/100 km
Rebate
Fee
$1,000
6.5
• Toyota Yaris – 6.4 l/100km• Sales +49%
• Honda Fit – 6.6 l/100km• Sales +3%
example: Canada

©"OECD/IEA"2018
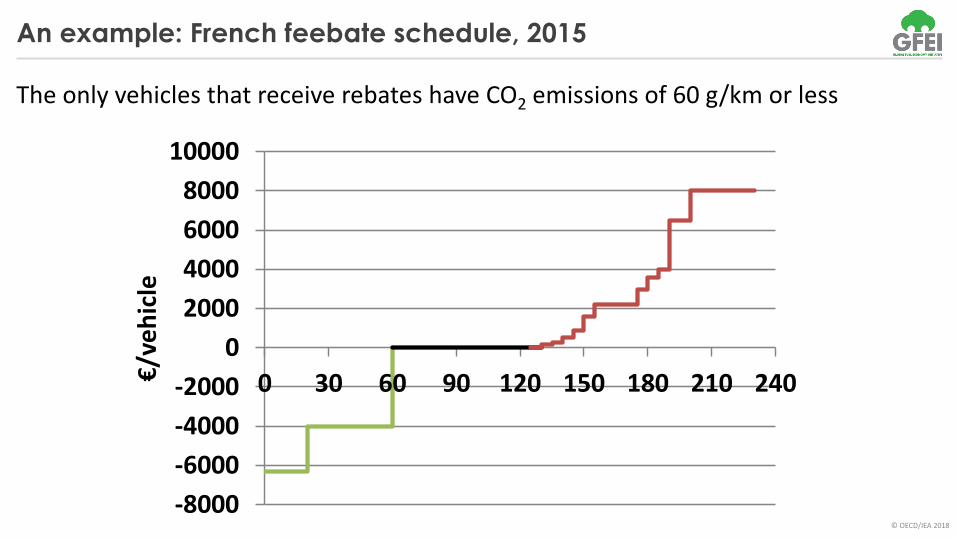
An example: French feebate schedule, 2015
The"only"vehicles"that"receive"rebates"have"CO2 emissions"of"60"g/km"or"less
!8000!6000!4000!2000
0200040006000800010000
0 30 60 90 120 150 180 210 240€/vehicle
©"OECD/IEA"2018
An example: French feebate schedule, 2015
The"only"vehicles"that"receive"rebates"have"CO2 emissions"of"60"g/km"or"less
!8000!6000!4000!2000
0200040006000800010000
0 30 60 90 120 150 180 210 240€/vehicle
©"OECD/IEA"2018
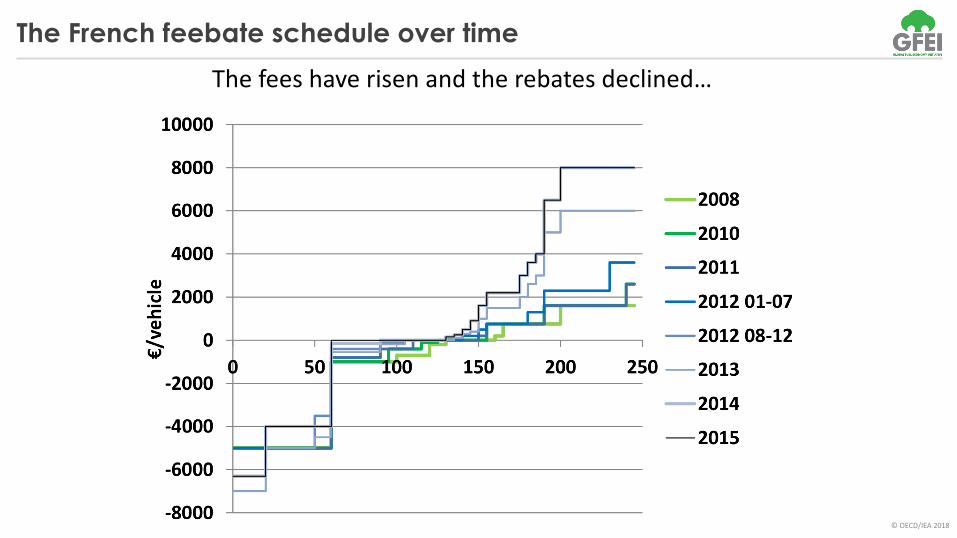
The French feebate schedule over time
The"fees"have"risen"and"the"rebates"declined…
©"OECD/IEA"2018
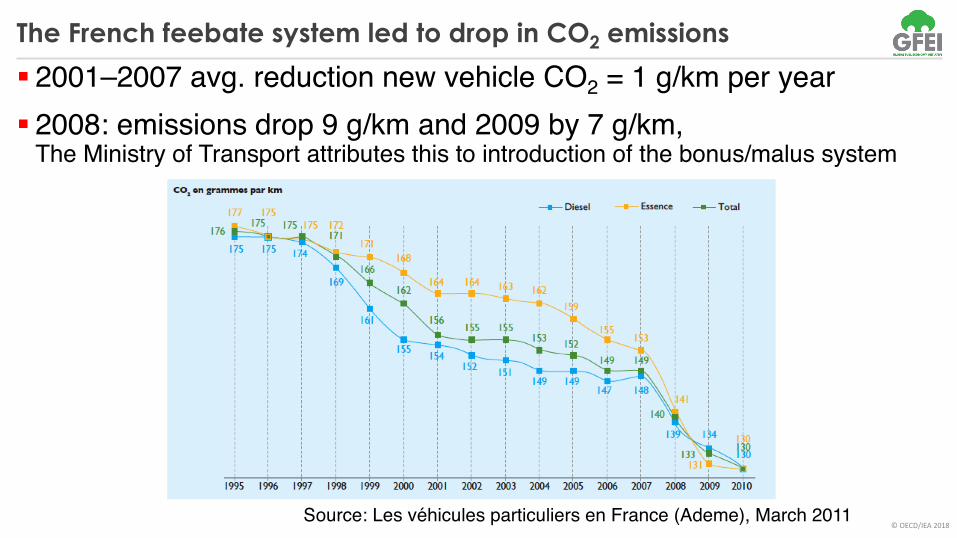
The French feebate system led to drop in CO2 emissions
Source: Les véhicules particuliers en France (Ademe), March 2011
! 2001–2007 avg. reduction new vehicle CO2 = 1 g/km per year! 2008: emissions drop 9 g/km and 2009 by 7 g/km,
The Ministry of Transport attributes this to introduction of the bonus/malus system
©"OECD/IEA"2018
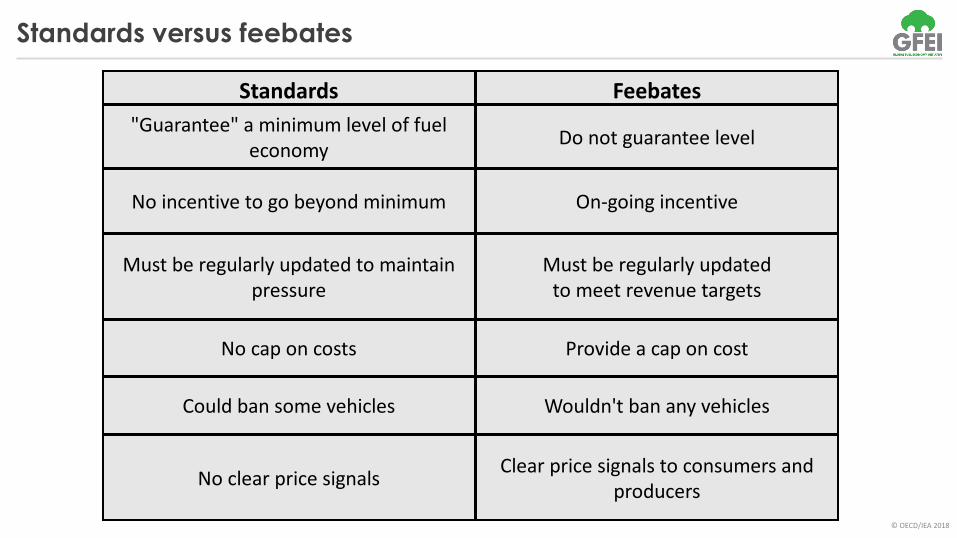
Standards versus feebates
Standards Feebates"Guarantee""a"minimum"level"of"fuel"
economy Do"not"guarantee"level
No"incentive"to"go"beyond"minimum OnBgoing"incentive
Must"be"regularly"updated"to"maintain"pressure
Must"be"regularly"updated"to"meet"revenue"targets
No"cap"on"costs Provide"a"cap"on"cost
Could"ban"some"vehicles Wouldn't"ban"any"vehicles
No"clear"price"signals Clear"price"signals"to"consumers"and"producers
©"OECD/IEA"2018
www.iea.orgIEA