Embed Size (px)
Citation preview

7 Process Engineering

17th International Mining Congress and Exhibition of Turkey- IMCET2001, © 2001, ISBN 975-395-417-4
Study of the Flotation Process by Simulation
S.Arad, L.Samoila & M.Marcu Petrosani University. Petrosani, Romania
ABSTRACT: This paper presents some results of flotation modelling and simulation. The modernisation of technology is very slow in this field and the only way of contributing to the increment of extraction performances is to know the technological parameters and capacity reserves as precisely as possible. Some of the representative dependencies characterising the flotation process were simulated using MATLAB SIMULINK programs. Analysis and comparison of the results of simulations carried out enabled the determination and formulation of some of the flotation process characteristics.
1 THE STUDY OF A FLOTATION TWO-PHASE MODEL
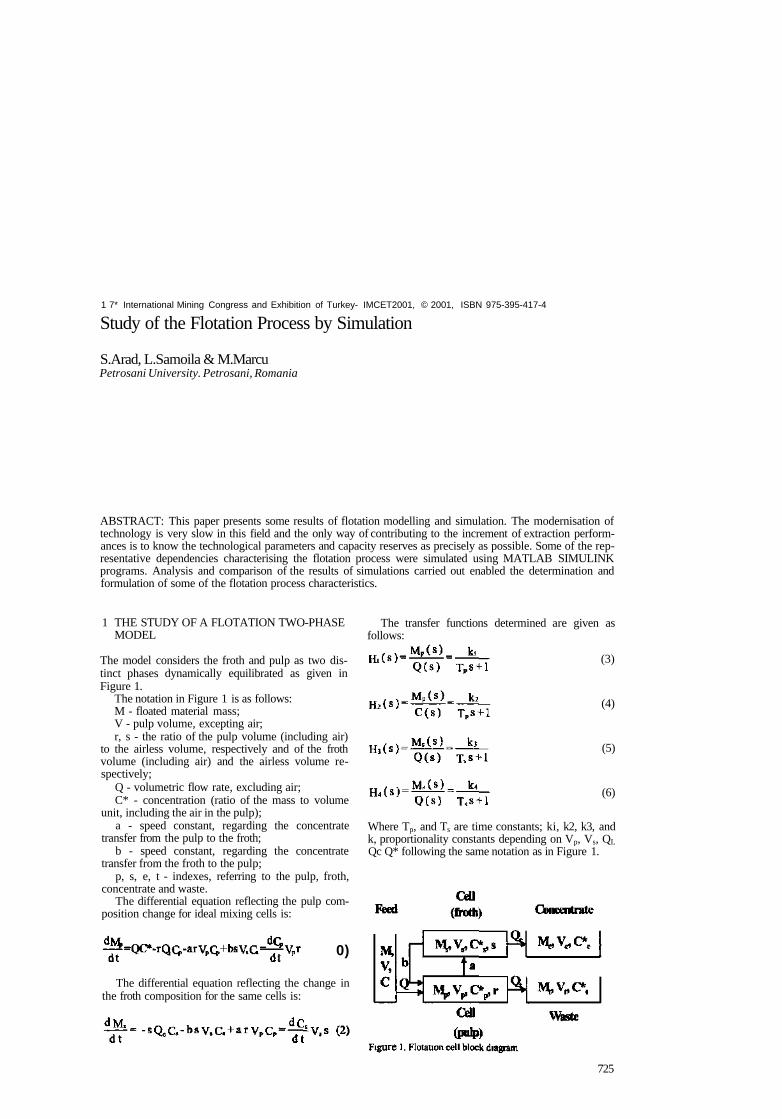
The model considers the froth and pulp as two distinct phases dynamically equilibrated as given in Figure 1.
The notation in Figure 1 is as follows: M - floated material mass; V - pulp volume, excepting air; r, s - the ratio of the pulp volume (including air)
to the airless volume, respectively and of the froth volume (including air) and the airless volume respectively;
Q - volumetric flow rate, excluding air; C* - concentration (ratio of the mass to volume
unit, including the air in the pulp); a - speed constant, regarding the concentrate
transfer from the pulp to the froth; b - speed constant, regarding the concentrate
transfer from the froth to the pulp; p, s, e, t - indexes, referring to the pulp, froth,
concentrate and waste. The differential equation reflecting the pulp com
position change for ideal mixing cells is:
The transfer functions determined are given as follows:
0)
The differential equation reflecting the change in the froth composition for the same cells is:
(3)
(4)
(5)
(6)
Where Tp, and Ts are time constants; ki, k2, k3, and k, proportionality constants depending on Vp, Vs, QL Qc Q* following the same notation as in Figure 1.
725
2 FLOTATION SIMULATION USING MATLAB
Mineral flotation of the raw material exploited in the Baia-Mare area, processed in the mineral processing plant from this town was studied. A primary flotation cell was considered, for which we evaluated the characteristic values of die constants m the transfer functions were evaluated (Table 1).
Table 1. Values for time and proportionality constants in the transfer functions.
Constant Relation Value
0,004808
0.025749
0,003468
1,153920
0,013572
6,179760
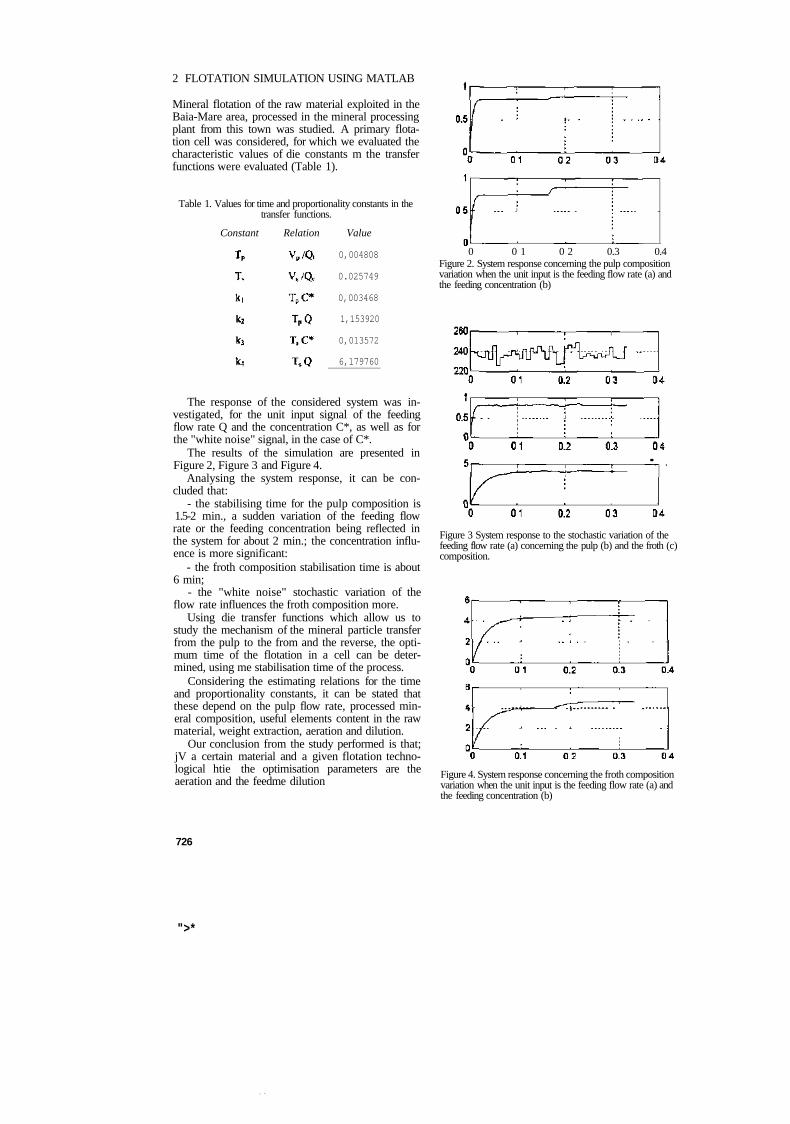
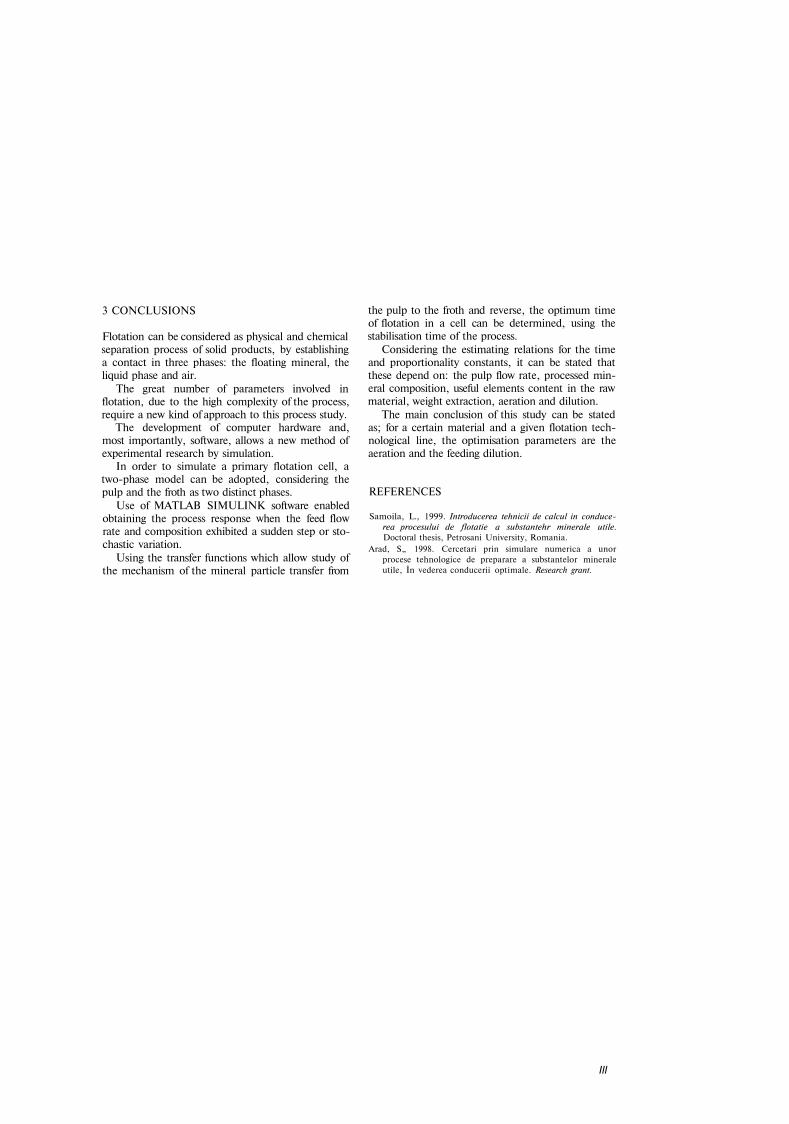
The response of the considered system was investigated, for the unit input signal of the feeding flow rate Q and the concentration C*, as well as for the "white noise" signal, in the case of C*.
The results of the simulation are presented in Figure 2, Figure 3 and Figure 4.
Analysing the system response, it can be concluded that:
- the stabilising time for the pulp composition is 1.5-2 min., a sudden variation of the feeding flow rate or the feeding concentration being reflected in the system for about 2 min.; the concentration influence is more significant:
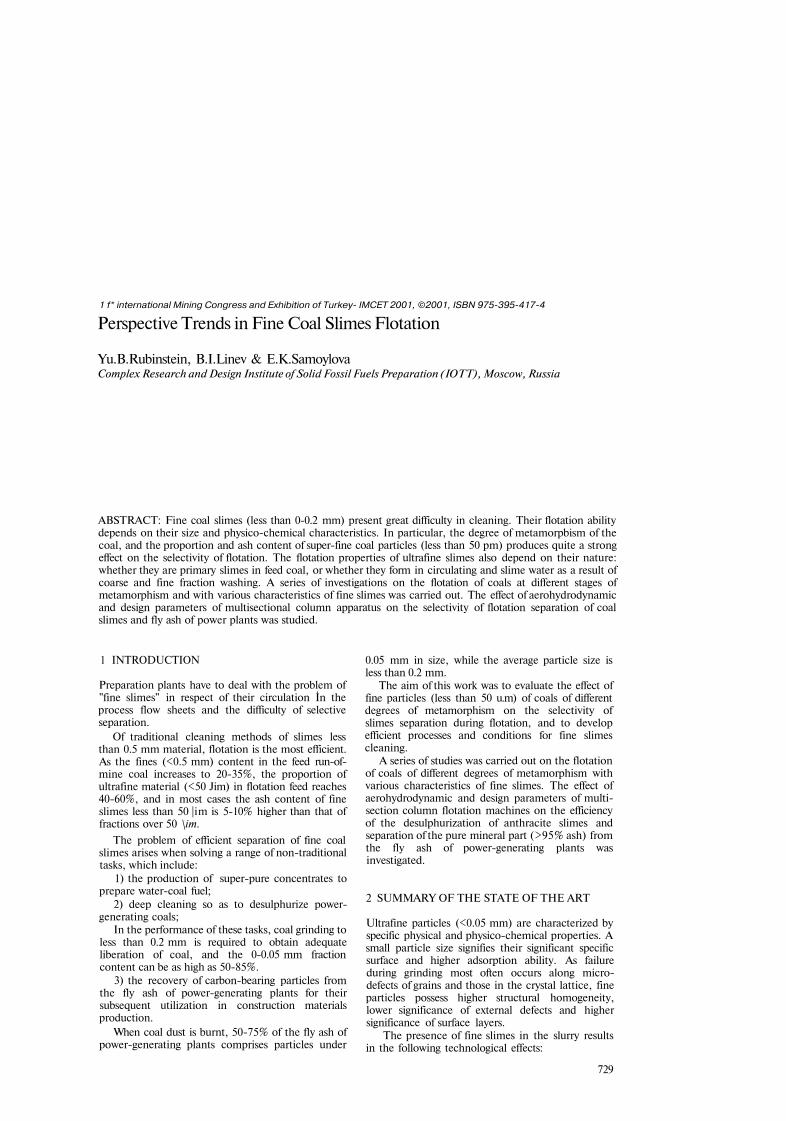
- the froth composition stabilisation time is about 6 min;
- the "white noise" stochastic variation of the flow rate influences the froth composition more.
Using die transfer functions which allow us to study the mechanism of the mineral particle transfer from the pulp to the from and the reverse, the optimum time of the flotation in a cell can be determined, using me stabilisation time of the process.
Considering the estimating relations for the time and proportionality constants, it can be stated that these depend on the pulp flow rate, processed mineral composition, useful elements content in the raw material, weight extraction, aeration and dilution.
Our conclusion from the study performed is that; jV a certain material and a given flotation technological htie the optimisation parameters are the aeration and the feedme dilution
0 0 1 0 2 0.3 0.4 Figure 2. System response concerning the pulp composition variation when the unit input is the feeding flow rate (a) and the feeding concentration (b)
Figure 3 System response to the stochastic variation of the feeding flow rate (a) concerning the pulp (b) and the froth (c) composition.
Figure 4. System response concerning the froth composition variation when the unit input is the feeding flow rate (a) and the feeding concentration (b)
726
">*
• ^
3 CONCLUSIONS
Flotation can be considered as physical and chemical separation process of solid products, by establishing a contact in three phases: the floating mineral, the liquid phase and air.
The great number of parameters involved in flotation, due to the high complexity of the process, require a new kind of approach to this process study.
The development of computer hardware and, most importantly, software, allows a new method of experimental research by simulation.
In order to simulate a primary flotation cell, a two-phase model can be adopted, considering the pulp and the froth as two distinct phases.
Use of MATLAB SIMULINK software enabled obtaining the process response when the feed flow rate and composition exhibited a sudden step or stochastic variation.
Using the transfer functions which allow study of the mechanism of the mineral particle transfer from
the pulp to the froth and reverse, the optimum time of flotation in a cell can be determined, using the stabilisation time of the process.
Considering the estimating relations for the time and proportionality constants, it can be stated that these depend on: the pulp flow rate, processed mineral composition, useful elements content in the raw material, weight extraction, aeration and dilution.
The main conclusion of this study can be stated as; for a certain material and a given flotation technological line, the optimisation parameters are the aeration and the feeding dilution.
REFERENCES
Samoila, L., 1999. Introducerea tehnicii de calcul in conduce-rea procesului de flotatie a substantehr minerale utile. Doctoral thesis, Petrosani University, Romania.
Arad, S„ 1998. Cercetari prin simulare numerica a unor procese tehnologice de preparare a substantelor minerale utile, İn vederea conducerii optimale. Research grant.
Ill

17th international Mining Congress and Exhibition of Turkey- IMCET 2001, ©2001, ISBN 975-395-417-4
Perspective Trends in Fine Coal Slimes Flotation
Yu.B.Rubinstein, B.I.Linev & E.K.Samoylova Complex Research and Design Institute of Solid Fossil Fuels Preparation (IOTT), Moscow, Russia
ABSTRACT: Fine coal slimes (less than 0-0.2 mm) present great difficulty in cleaning. Their flotation ability depends on their size and physico-chemical characteristics. In particular, the degree of metamorpbism of the coal, and the proportion and ash content of super-fine coal particles (less than 50 pm) produces quite a strong effect on the selectivity of flotation. The flotation properties of ultrafine slimes also depend on their nature: whether they are primary slimes in feed coal, or whether they form in circulating and slime water as a result of coarse and fine fraction washing. A series of investigations on the flotation of coals at different stages of metamorphism and with various characteristics of fine slimes was carried out. The effect of aerohydrodynamic and design parameters of multisectional column apparatus on the selectivity of flotation separation of coal slimes and fly ash of power plants was studied.
1 INTRODUCTION
Preparation plants have to deal with the problem of "fine slimes" in respect of their circulation İn the process flow sheets and the difficulty of selective separation.
Of traditional cleaning methods of slimes less than 0.5 mm material, flotation is the most efficient. As the fines (<0.5 mm) content in the feed run-of-mine coal increases to 20-35%, the proportion of ultrafine material (<50 Jim) in flotation feed reaches 40-60%, and in most cases the ash content of fine slimes less than 50 |im is 5-10% higher than that of fractions over 50 \im.
The problem of efficient separation of fine coal slimes arises when solving a range of non-traditional tasks, which include:
1) the production of super-pure concentrates to prepare water-coal fuel;
2) deep cleaning so as to desulphurize power-generating coals;
In the performance of these tasks, coal grinding to less than 0.2 mm is required to obtain adequate liberation of coal, and the 0-0.05 mm fraction content can be as high as 50-85%.
3) the recovery of carbon-bearing particles from the fly ash of power-generating plants for their subsequent utilization in construction materials production.
When coal dust is burnt, 50-75% of the fly ash of power-generating plants comprises particles under
0.05 mm in size, while the average particle size is less than 0.2 mm.
The aim of this work was to evaluate the effect of fine particles (less than 50 u.m) of coals of different degrees of metamorphism on the selectivity of slimes separation during flotation, and to develop efficient processes and conditions for fine slimes cleaning.
A series of studies was carried out on the flotation of coals of different degrees of metamorphism with various characteristics of fine slimes. The effect of aerohydrodynamic and design parameters of multisection column flotation machines on the efficiency of the desulphurization of anthracite slimes and separation of the pure mineral part (>95% ash) from the fly ash of power-generating plants was investigated.
2 SUMMARY OF THE STATE OF THE ART
Ultrafine particles (<0.05 mm) are characterized by specific physical and physico-chemical properties. A small particle size signifies their significant specific surface and higher adsorption ability. As failure during grinding most often occurs along micro-defects of grains and those in the crystal lattice, fine particles possess higher structural homogeneity, lower significance of external defects and higher significance of surface layers.
The presence of fine slimes in the slurry results in the following technological effects:
729
• contamination of froth product with fine fractions of waste rock;
• worsening of coarse grain flotation and deterioration of waste grade;
• higher reagent consumption; • decrease of flotation rate.
In order to enhance the efficiency of the separation of coals containing fine slimes, the following methods are used: • regulating reagents; • fractional reagent feeding; • special conditioning regimes (time and rate of
mixing, density of slurry during its treatment with reagents);
• corresponding flotation machines allowing to variation in aerohydrodynamic conditions;
• special technologies (for example, flocculation-flotation method, etc.) The applicability of a given method can be
established by investigating the behaviour of fine slimes during flotation. Applicability also depends on requirements to separation indices, i.e., to concentrate and waste quality. The content of slimes (including so-called secondary slimes) in coal coming for cleaning varies from 10 to 35 % with an ash content of about 20-40%. These slimes contain proportions of 20 to 70% fine particles of less than 50 (im in size, with ash contents of 25-51%.
3 RESULTS OF INVESTIGATIONS
In order to have the opportunity to compare the flotation ability of different coals, the concept of "maximum flotation ability" is used. This is derived from the release-analysis curve based on the maximum recovery of combustible mass into froth product, and the separation of froth products into fractions with different ash contents by means of many cleaning stages. In this case, the flotation ability of coal slime is virtually determined by slime properties.
Screenings of differently metamorphosed coals with different proportions and ash contents of finely dispersed fraction (under 50 Jim) were considered, and the indices of the studied coal separation were compared with the release-analysis. As a criterion of flotation ability, it was assumed that the coefficient of relative efficiency of maximum separation can be found from the formula:
(1)
where ECCM - recovery of combustible mass to concentrate, %; and EWIM - recovery of incombustible mass to wastes, %.
(2)
EWIC = Yw* Aw/AF (3)
where Yc - maximum yield of concentrate, %; Ac -ash content of concentrate, %; A? - ash content of feed slime, %; Yw - yield of wastes, %; and Aw -ash content of wastes, %.
The maximum concentrate yield was found using the curves of maximum flotation ability, including the middlings fractions yield.
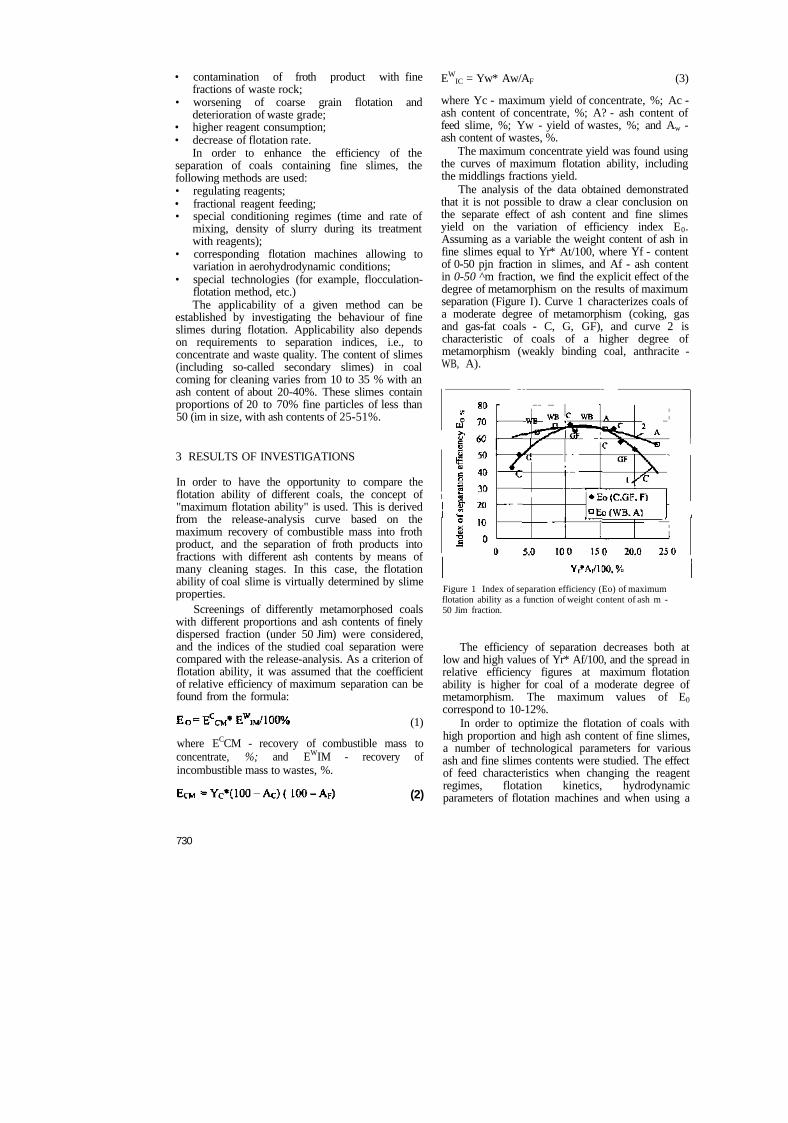
The analysis of the data obtained demonstrated that it is not possible to draw a clear conclusion on the separate effect of ash content and fine slimes yield on the variation of efficiency index E0. Assuming as a variable the weight content of ash in fine slimes equal to Yr* At/100, where Yf - content of 0-50 pjn fraction in slimes, and Af - ash content in 0-50 ^m fraction, we find the explicit effect of the degree of metamorphism on the results of maximum separation (Figure I). Curve 1 characterizes coals of a moderate degree of metamorphism (coking, gas and gas-fat coals - C, G, GF), and curve 2 is characteristic of coals of a higher degree of metamorphism (weakly binding coal, anthracite -WB, A).
Figure 1 Index of separation efficiency (Eo) of maximum flotation ability as a function of weight content of ash m -50 Jim fraction.
The efficiency of separation decreases both at low and high values of Yr* Af/100, and the spread in relative efficiency figures at maximum flotation ability is higher for coal of a moderate degree of metamorphism. The maximum values of E0 correspond to 10-12%.
In order to optimize the flotation of coals with high proportion and high ash content of fine slimes, a number of technological parameters for various ash and fine slimes contents were studied. The effect of feed characteristics when changing the reagent regimes, flotation kinetics, hydrodynamic parameters of flotation machines and when using a
730
flocculation-ftotation method was investigated, taking into account the combined effect of these factors on flotation figures.
A series of flocculation-flotation method investigations performed using latex ftocculant BS-30F with coals of different degrees of metamorphism and particle size under 200 um revealed positive results with this method application for coking, fat and weakly binding coals.
These factors were investigated in more detail in the context of the solution of a series of practical tasks in order to enhance the efficiency of fine coal slimes flotation.
3.1 Flotation of coking coal sûmes First of all, consider a specific example of the effect of primary and secondary slimes on the flotation of difficult-to-clean coking coals at the preparation plant of Nerungrinsky open cast mine (Yakutsky coal basin).
As these coals are difficult to clean it is necessary to use a flow sheet including coarse fractions grinding to -30 mm, dense-media separation with recovery of middlings and fine slimes flotation also with recovery of middlings. The feed coal has a content of about 21% -0.5 mm slime, with an ash content of 17%. During cleaning using water recycling, the slimes proportion reaches 35%, and the finely dispersed slimes proportion is as high as 30-40% with a 30-39% ash content.
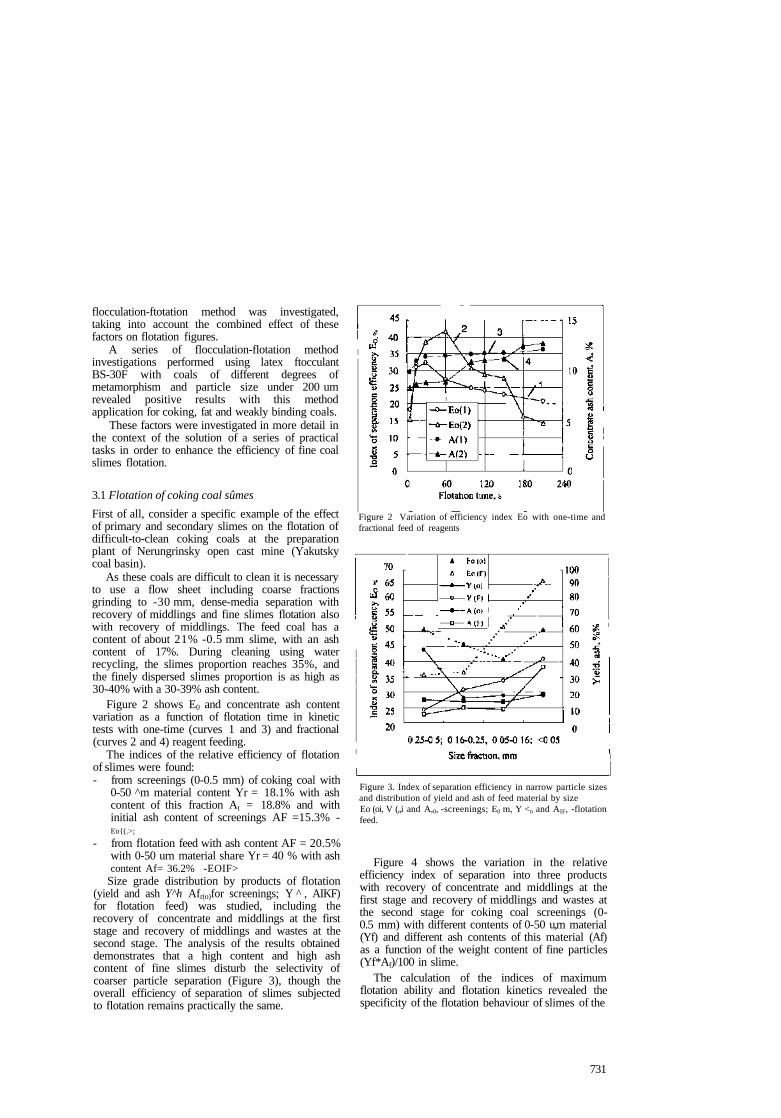
Figure 2 shows E0 and concentrate ash content variation as a function of flotation time in kinetic tests with one-time (curves 1 and 3) and fractional (curves 2 and 4) reagent feeding.
The indices of the relative efficiency of flotation of slimes were found: - from screenings (0-0.5 mm) of coking coal with
0-50 ^m material content Yr = 18.1% with ash content of this fraction At = 18.8% and with initial ash content of screenings AF =15.3% -Eo{(.>;
- from flotation feed with ash content AF = 20.5% with 0-50 urn material share Yr = 40 % with ash content Af= 36.2% -EOIF>
Size grade distribution by products of flotation (yield and ash Y^h Afr(o)for screenings; Y ^ , AIKF) for flotation feed) was studied, including the recovery of concentrate and middlings at the first stage and recovery of middlings and wastes at the second stage. The analysis of the results obtained demonstrates that a high content and high ash content of fine slimes disturb the selectivity of coarser particle separation (Figure 3), though the overall efficiency of separation of slimes subjected to flotation remains practically the same.
Figure 3. Index of separation efficiency in narrow particle sizes and distribution of yield and ash of feed material by size Eo (oi, V („i and A,0, -screenings; E0 m, Y <n and AIF, -flotation feed.
Figure 4 shows the variation in the relative efficiency index of separation into three products with recovery of concentrate and middlings at the first stage and recovery of middlings and wastes at the second stage for coking coal screenings (0-0.5 mm) with different contents of 0-50 u,m material (Yf) and different ash contents of this material (Af) as a function of the weight content of fine particles (Yf*Af)/100 in slime.
The calculation of the indices of maximum flotation ability and flotation kinetics revealed the specificity of the flotation behaviour of slimes of the
731
Figure 2 Variation of efficiency index Eo with one-time and fractional feed of reagents
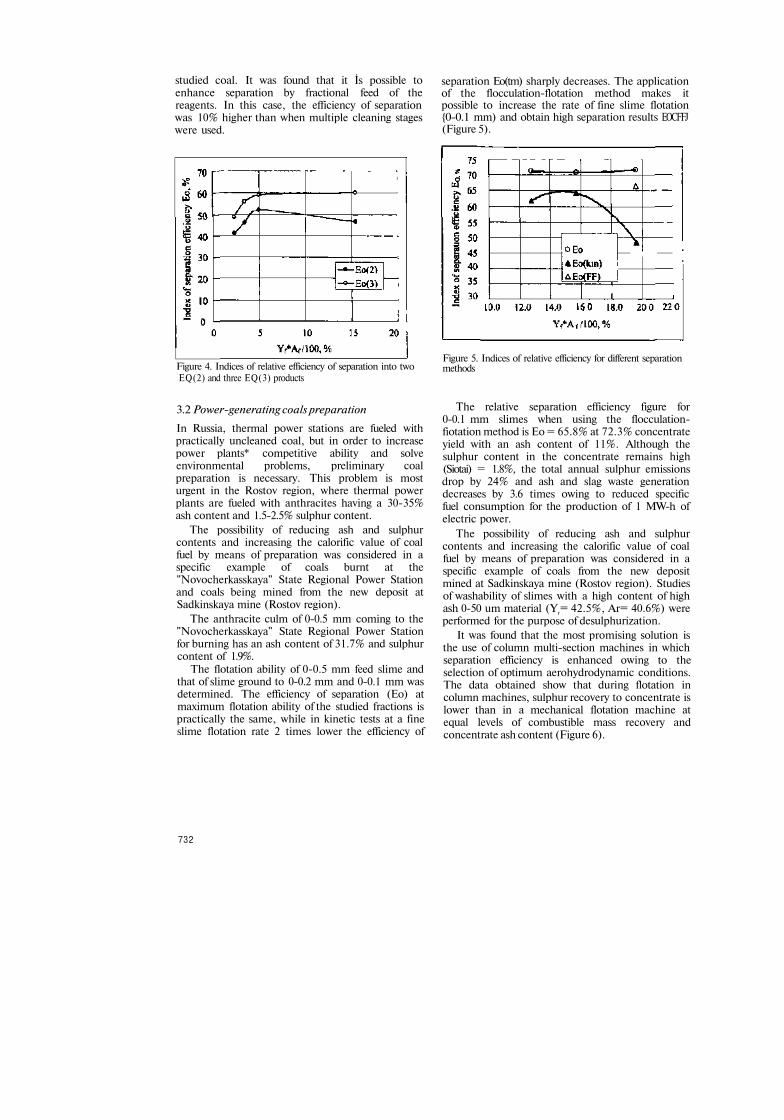
studied coal. It was found that it İs possible to enhance separation by fractional feed of the reagents. In this case, the efficiency of separation was 10% higher than when multiple cleaning stages were used.
Figure 4. Indices of relative efficiency of separation into two EQ(2) and three EQ(3) products
separation Eo(tm) sharply decreases. The application of the flocculation-flotation method makes it possible to increase the rate of fine slime flotation {0-0.1 mm) and obtain high separation results EOCFFJ (Figure 5).
Figure 5. Indices of relative efficiency for different separation methods
3.2 Power-generating coals preparation
In Russia, thermal power stations are fueled with practically uncleaned coal, but in order to increase power plants* competitive ability and solve environmental problems, preliminary coal preparation is necessary. This problem is most urgent in the Rostov region, where thermal power plants are fueled with anthracites having a 30-35% ash content and 1.5-2.5% sulphur content.
The possibility of reducing ash and sulphur contents and increasing the calorific value of coal fuel by means of preparation was considered in a specific example of coals burnt at the "Novocherkasskaya" State Regional Power Station and coals being mined from the new deposit at Sadkinskaya mine (Rostov region).
The anthracite culm of 0-0.5 mm coming to the "Novocherkasskaya" State Regional Power Station for burning has an ash content of 31.7% and sulphur content of 1.9%.
The flotation ability of 0-0.5 mm feed slime and that of slime ground to 0-0.2 mm and 0-0.1 mm was determined. The efficiency of separation (Eo) at maximum flotation ability of the studied fractions is practically the same, while in kinetic tests at a fine slime flotation rate 2 times lower the efficiency of
The relative separation efficiency figure for 0-0.1 mm slimes when using the flocculation-fiotation method is Eo = 65.8% at 72.3% concentrate yield with an ash content of 11%. Although the sulphur content in the concentrate remains high (Siotai) = 1.8%, the total annual sulphur emissions drop by 24% and ash and slag waste generation decreases by 3.6 times owing to reduced specific fuel consumption for the production of 1 MW-h of electric power.
The possibility of reducing ash and sulphur contents and increasing the calorific value of coal fuel by means of preparation was considered in a specific example of coals from the new deposit mined at Sadkinskaya mine (Rostov region). Studies of washability of slimes with a high content of high ash 0-50 um material (Yr= 42.5%, Ar= 40.6%) were performed for the purpose of desulphurization.
It was found that the most promising solution is the use of column multi-section machines in which separation efficiency is enhanced owing to the selection of optimum aerohydrodynamic conditions. The data obtained show that during flotation in column machines, sulphur recovery to concentrate is lower than in a mechanical flotation machine at equal levels of combustible mass recovery and concentrate ash content (Figure 6).
732
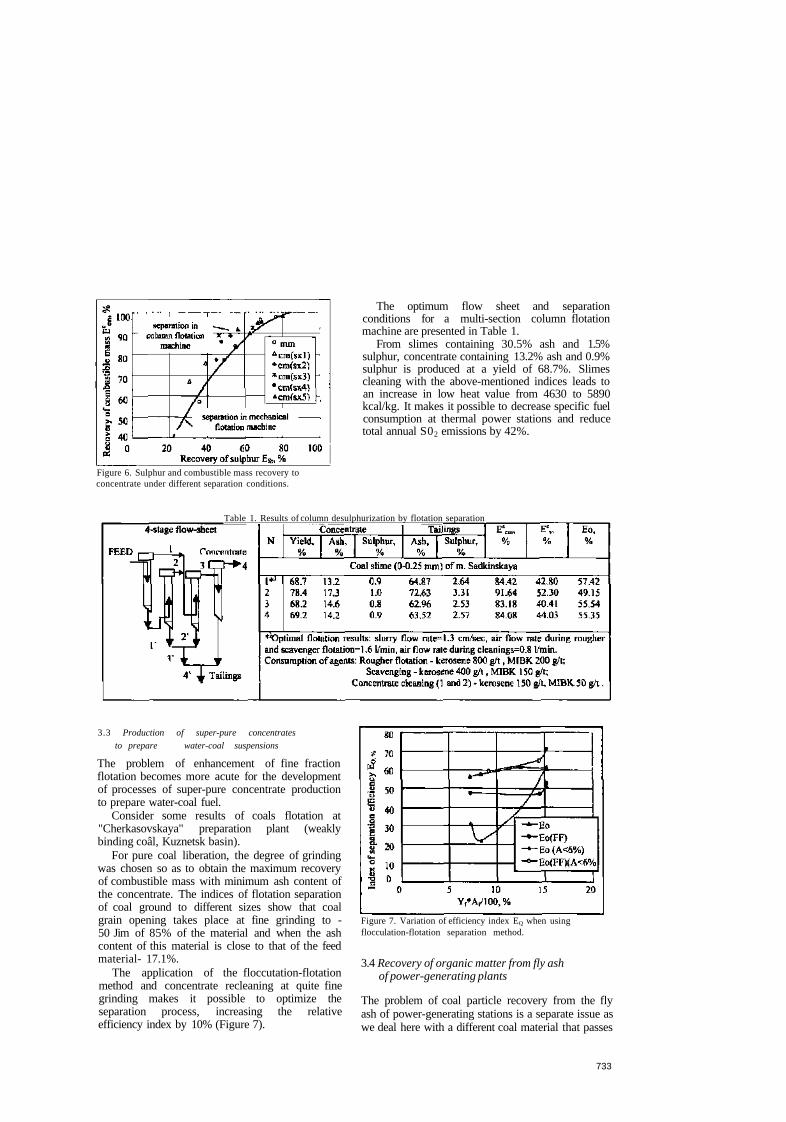
Figure 6. Sulphur and combustible mass recovery to concentrate under different separation conditions.
The optimum flow sheet and separation conditions for a multi-section column flotation machine are presented in Table 1.
From slimes containing 30.5% ash and 1.5% sulphur, concentrate containing 13.2% ash and 0.9% sulphur is produced at a yield of 68.7%. Slimes cleaning with the above-mentioned indices leads to an increase in low heat value from 4630 to 5890 kcal/kg. It makes it possible to decrease specific fuel consumption at thermal power stations and reduce total annual S02 emissions by 42%.
Table 1. Results of column desulphurization by flotation separation
3.3 Production of super-pure concentrates to prepare water-coal suspensions
The problem of enhancement of fine fraction flotation becomes more acute for the development of processes of super-pure concentrate production to prepare water-coal fuel.
Consider some results of coals flotation at "Cherkasovskaya" preparation plant (weakly binding coâl, Kuznetsk basin).
For pure coal liberation, the degree of grinding was chosen so as to obtain the maximum recovery of combustible mass with minimum ash content of the concentrate. The indices of flotation separation of coal ground to different sizes show that coal grain opening takes place at fine grinding to -50 Jim of 85% of the material and when the ash content of this material is close to that of the feed material- 17.1%.
The application of the floccutation-flotation method and concentrate recleaning at quite fine grinding makes it possible to optimize the separation process, increasing the relative efficiency index by 10% (Figure 7).
Figure 7. Variation of efficiency index EQ when using flocculation-flotation separation method.
3.4 Recovery of organic matter from fly ash of power-generating plants
The problem of coal particle recovery from the fly ash of power-generating stations is a separate issue as we deal here with a different coal material that passes
733
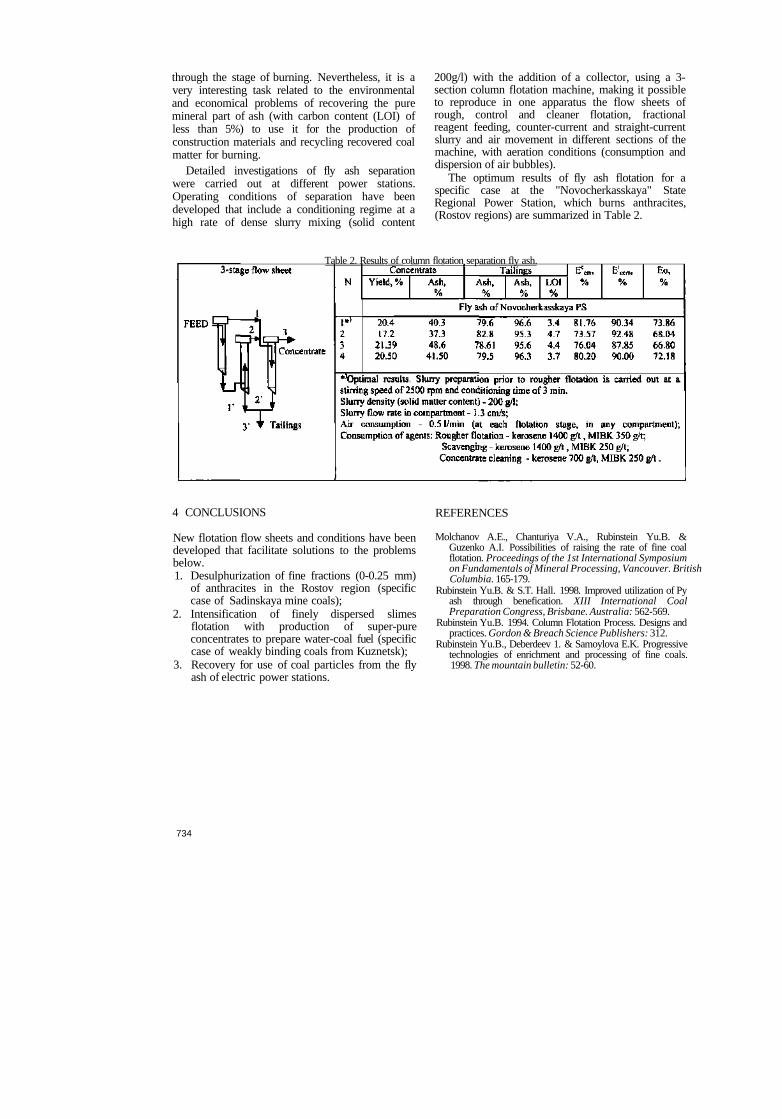
through the stage of burning. Nevertheless, it is a very interesting task related to the environmental and economical problems of recovering the pure mineral part of ash (with carbon content (LOI) of less than 5%) to use it for the production of construction materials and recycling recovered coal matter for burning.
Detailed investigations of fly ash separation were carried out at different power stations. Operating conditions of separation have been developed that include a conditioning regime at a high rate of dense slurry mixing (solid content
4 CONCLUSIONS
New flotation flow sheets and conditions have been developed that facilitate solutions to the problems below. 1. Desulphurization of fine fractions (0-0.25 mm)
of anthracites in the Rostov region (specific case of Sadinskaya mine coals);
2. Intensification of finely dispersed slimes flotation with production of super-pure concentrates to prepare water-coal fuel (specific case of weakly binding coals from Kuznetsk);
3. Recovery for use of coal particles from the fly ash of electric power stations.
200g/l) with the addition of a collector, using a 3-section column flotation machine, making it possible to reproduce in one apparatus the flow sheets of rough, control and cleaner flotation, fractional reagent feeding, counter-current and straight-current slurry and air movement in different sections of the machine, with aeration conditions (consumption and dispersion of air bubbles).
The optimum results of fly ash flotation for a specific case at the "Novocherkasskaya" State Regional Power Station, which burns anthracites, (Rostov regions) are summarized in Table 2.
REFERENCES
Molchanov A.E., Chanturiya V.A., Rubinstein Yu.B. & Guzenko A.I. Possibilities of raising the rate of fine coal flotation. Proceedings of the 1st International Symposium on Fundamentals of Mineral Processing, Vancouver. British Columbia. 165-179.
Rubinstein Yu.B. & S.T. Hall. 1998. Improved utilization of Py ash through benefication. XIII International Coal Preparation Congress, Brisbane. Australia: 562-569.
Rubinstein Yu.B. 1994. Column Flotation Process. Designs and practices. Gordon & Breach Science Publishers: 312.
Rubinstein Yu.B., Deberdeev 1. & Samoylova E.K. Progressive technologies of enrichment and processing of fine coals. 1998. The mountain bulletin: 52-60.
Table 2. Results of column flotation separation fly ash.
734
17th International Mining Congress and Exhibition of Turkey- IMCET2001, ©2001, ISBN 975-395-417-4
Complex Coal Processing of Kazakstan Deposits
N.Zhalgassuly, M.T.Toktamysov, V.I.Gatits, B.M.Mukushev & Z.U.Ergusaev DA. Kunoyev Institute of Mining, Ministry of Power, Industry and Trade, Almaty, Republic of Kazakhstan
ABSTRACT: This report reviews the uses of complex coal processing İn Kazakhstan. Complex coal processing is necessitated by the deficiency of oil and gas, and methods of complex coal processing are reviewed - by the presence of various grades of coal with different organic parts, such as bitumen, resin, humus-wax, and chemical elements, including non-ferrous metals and rare earth elements.
1 INTRODUCTION
As it İs known, about 30 groups and 44 subgroups of coal can be distinguished under the international classification of 1957 and the classification accepted in CIS countries. All these coals differ in their physical properties and elemental composition. Naturally, therefore, the meüıods of both use and processing vary: technological, energy, chemical, metallurgical, construction and other.
In conditions of deficiency of known oil and gas reserves (a projected 40-50 years of consumption) in comparison with coal (200-250 years), there is an especially urgent need to replace oil and gas with coal for power, in the chemical industry and in other areas. In particular, the world, including Kazakhstan, İs passing to the use of substitutes of natural gas and synthetic liquid combustibles obtained by processing coal by gasification and hydrogénation (liquation). The production of petrol, fuel, jet and boiler combustibles from coal, by both direct liquation and synthesis, and gas obtained from coal by plasma-chemical methods, is most urgent.
Coal, like other mineral resources, in geome-chanical terms consists of a set or complex of minerals of other complex connections of chemical elements. In total, coal contains about 50 chemical elements, which form its organic and inorganic parts, water and volatile substances. The organic part contains bitumens and humic acids. Coal has also more than 30 microelements, equal to 5600 g/t of coal, costing about 230 dollars according to the prices of 1988 (Mironov, 1991; Yudovitch, 1989; Drozhzhin, 1952).
Now coal is processed and is applied İn the following ways.
1. Coal was first used only as a combustible for municipal-household needs, then coal was used for burning in boiler installations, in die fire chambers of ships and trains, in reflective furnaces, etc.
2. The next stage of coal use was the production of electric power, and to the present day the main consumer of coal in Kazakhstan is the electrical power industry.
3. Now coal is widely used in metallurgy in the form of coke, half-coke and ferrous coke.
4. For almost one century, coal has been brick-eted from chaff or coal dust in various countries of Europe, America and Asia. Dressing of coal by hardening, carbonization, pelletizing (granulation, bricketing) and thermal processing is one of die methods of processing and using complex coal (Taits & Antonova, 1985).
5. Coal, after processing, is used as an agglomeration (caking) combustible for obtaining iron-ore concentrates, carbonate filler, electrode items and foundry coke, and for the production of carbide, calcium and electric corundum.
6. Coal ashes in waste-free production are used for die production of construction materials, including lime, cement and brick.
7. Hard coal and anthracite are mainly used for the production of coal adsorbents and active coal.
8. In various branches of the chemical industry, coal is processed by gasification, extraction, supercritical dissolution of coal, etc. Thus, it enables the production of more that 50 basic chemical products (synthesis - gas, montan wax, paraffin, motor and jet combustible, mineral fertilizers, plastic, etc.) in addition to numerous derivative substances.
9. Out of the total known reserves of power sources, 80-90 % - is coal and only 10-20 % is pe-
735
troleum and gas (Zhukov et al., 1990). Therefore, the problem of replacing oil and gas with coal and products obtained from processing coal is urgent. So, for example, the gas obtained by coal gasification İn ground and underground gas generators is used for production of (Zhukov et al., 1990):
• Substitute of natural gas (SNG). • Synthesis - gas (S-G) for production of motor
fuel and other products in the chemical industry.
• Fuel gases for technology and power generation.
• Restoring gas for metallurgical purposes. • Carbonization of brown coal. 10. Use of coal instead of oil and gas is possible
in the following ways: • Burning coal instead of oil {black oil), for ex
ample, in boiler installations. • Combination of energy of coal with other
types of energy, for example, nuclear energy. • Development of gaseous and thermal net
works. • Production of motor fuel from coal. • Use of natural gas substitute to conserve natu
ral gas and supplement its use. • Use of synthesis - gas from coal instead of
products of oils for the chemical industry. • Production of motor fuel and chemical prod
ucts from coal after petroleum resources are exhausted.
11. The following microelements are now extracted from coal: uranium, germanium, gallium, and vanadium. It is also possible to extract molybdenum, rhenium, silver, scandium and other rare earth elements (Mironov, 1991).
12. Water alkaline solutions from brown and stone oxide coal extract also contain humic acids and humâtes. Humus coals are used in agriculture in two ways (Soprykin, 1984): first, in the production of physiologically active preparations (PAP) for stimulation of growth of plants, increasing the productivity and efficiency of animal industries; second, in the production and application of organic materials.
In Kazakhstan, coal is used for the production of briquettes, absorbers, restoring agents, humus preparations for stimulation of plant growth and increasing the productivity of animal industries, and rare earth elements, non-ferrous and precious metals are extracted from coal and its ash. Coal ash is used for
the production of construction materials - cement, lime and bricks. Projects of coal gasification and hydrogénation have also been developed.
The benefits of complex coal processing are numerous. Coal gasification and hydrogénation produce cheaper and top-quality synthetic liquid combustible, which can replace oil in power, chemistry and in other areas. The production and use of coal bricks reduces losses of coal caused by the un-derburning of small coal pieces, and it also prevents self-burning.
2 CONCLUSIONS
The application of physiologically active preparations made of coal humus and microelements contained in coal now produces increased productivity in agricultural cultures of up to 30 %. The use of other products from coal results in low-waste and waste-free production and increases die level of environment protection.
The rational area of application for coal gasification and hydrogénation is the processing of brown coal, and also long-flame gaseous hard coals to synthesis - gas and synthetic liquid combustible with application in areas of production from local coals. Hard coal and anthracite are economically more expedient for use in traditional areas such as energy production, metallurgy, construction and in the chemical industry.
REFERENCES
Drozhzhin I.V, 1952. Laboratory manual of coal chemical laboratory. - M. - L.: Ugletechizdat, 136 p.
Mironov K.V, 1991. Directory of geologist-coal specialist. 2nd edition, revised -M.: Nedra, 363 p.
Soprykin F.Y., 1984. Geochemisny of grounds and nature protection. Geochemislry, increase of fertility and protection of grounds. -L.: Nedra, 231 p
Taits EM and Antonova LI., 1985. Coked combustible and adsorbents on the basis of brown coal, (economies of combustible and power). M.: Nedra, 160 p.
Yudovitch Y.E., 1989. Gramme is more expensive than ton: Rare elements in coals. - M : Nauka, 160 p.
Zhukov M F, Kalınenko R A, Levyatskiy A A, Polok L.S, 1990. Plasma-chemical processing of coal. M. Nauka, 200p.
736
17th International Mining Congress and Exhibition of Turkey- IMCET2001 © 2001, ISBN 975-395-417-4
Application of Aeration to Complex Sulphide Ore and its Effects on Circuit Performance
B.Aksani & M.N.Mian Çayeli Bakır isletmeleri, Çayeli, Rize, Turkey
ABSTRACT: Clastic ore is one of the complex sulphide ores found in the Çayeli deposit. It is the most difficult ore to treat and is processed in separate campaigns. The copper concentrates produced contain 19-20% copper and 9-10% zinc. In order to improve copper concentrate quality, a decision was made to try aeration. Laboratory-scale aeration and flotation tests were carried out in order to optimise aeration conditions. Based on the laboratory tests, aeration was put into practice with existing aeration cells in the plant. In this study, the laboratory and plant results are presented, and the effect of aeration on the plant metallurgy is discussed.
1 INTRODUCTION
The Çayeli ore deposit is volcanogenic massive sulphide. Clastic ore is one of the ore types found in the Çayeli deposit and is characterized by an abundance of fine-grained (less than 50 u:m), generally anhedral, sulphide debris. The ore consists of rounded pyrite, chalcopyrite and sphalerite clasts İn a matrix of fine-grained sphalerite, pyrite, chalcopyrite and barite. The clast size varies from 5 mm to greater than 50 mm, but the sphalerite clasts are generally larger than the pyrite and chalcopyrite clasts. Fine complex intergrowths are common. Most of the pyrite is framboidal to colloform, and sometimes occurs in aggregates, but may also occur as fine (20-50 pm) subhedral/euhedral crystals. Typical grades of the clastic ore are 3% copper and 13% zinc. The ore is not only fine-grained, but also contains abundant fine mineral intergrowths and inclusions, and requires fine grinding.
Flotation collectors, modifiers and grinding medium can substantially lower the oxygen content of the pulp (Jones and Woodcock, 1984). A lack of oxygen in the pulp sometimes adversely affects the floatability of the minerals. Sometimes aeration of the pulp restores the oxygen concentration. Air acts as a flotation reagent when it is used before the conditioning step with reagents either improving or reducing mineral floatability. For example, flotation tests on chalcopyrite and galena from Black Mountain ore indicated that aeration of the pulp resulted İn improvement of copper metallurgy (Graham and Heathcote, 1982; Ross and Van
Deventer, 1985). Pyrite depression is a typical example of the depressive effect of aeration (Konigsman, 1973; Kristall et al., 1994; Houot & Duhamel, 1990). Some successful plant applications of aeration have been reported for pyrite depression (Konigsman, 1973; Carlson & Muir, 1976; Spira & Rosenblum, 1978).
The clastic ore contained a significant amount of pyrite (>50%). Therefore, it was decided to apply aeration to the clastic ore in order to improve concentrate quality by enhancing pyrite depression. In order to test this hypothesis, laboratory flotation tests were carried out. In Üıis study, the laboratory tests and plant trial results are presented and the impact of the aeration on metallurgy is discussed.
2 METHOD
2.1. Laboratory lests
The clastic ore samples used in the experimental study were taken from primary ball mill feed in September 1999. The grade of the ore was 4.8% copper and 10.4% zinc. According to previous plant experience, processing such ores caused selectivity problems in the copper circuit.
The ore samples were ground in a laboratory rod mill and a Humbold Wedag-type laboratory flotation machine was used in the aeration and flotation stages.
Sodium metabisulphite (Na2S20s) was used in the laboratory tests as a sphalerite and pyrite depressant instead of the SO2 applied m the plant due to
737
handling difficulties. Aerophine {Cytec 3418A) was used as a collector.
2.2. Plant application
Aeration was first applied in the December 1999 clastic campaign and continued in the year 2000 campaigns with the existing aeration unit in the plant. This unit consists of three 45-m3 cells equipped with an original Dorr Oliver rotor stator mechanism. The maximum air rate to the aeration unit is 6000 m3/h.
The plant data were evaluated so as to determine statistically significant differences in the metallurgy with aeration. Results for the copper rougher, zinc rougher, and overall circuit metallurgy were used İn these evaluations.
3 RESULTS
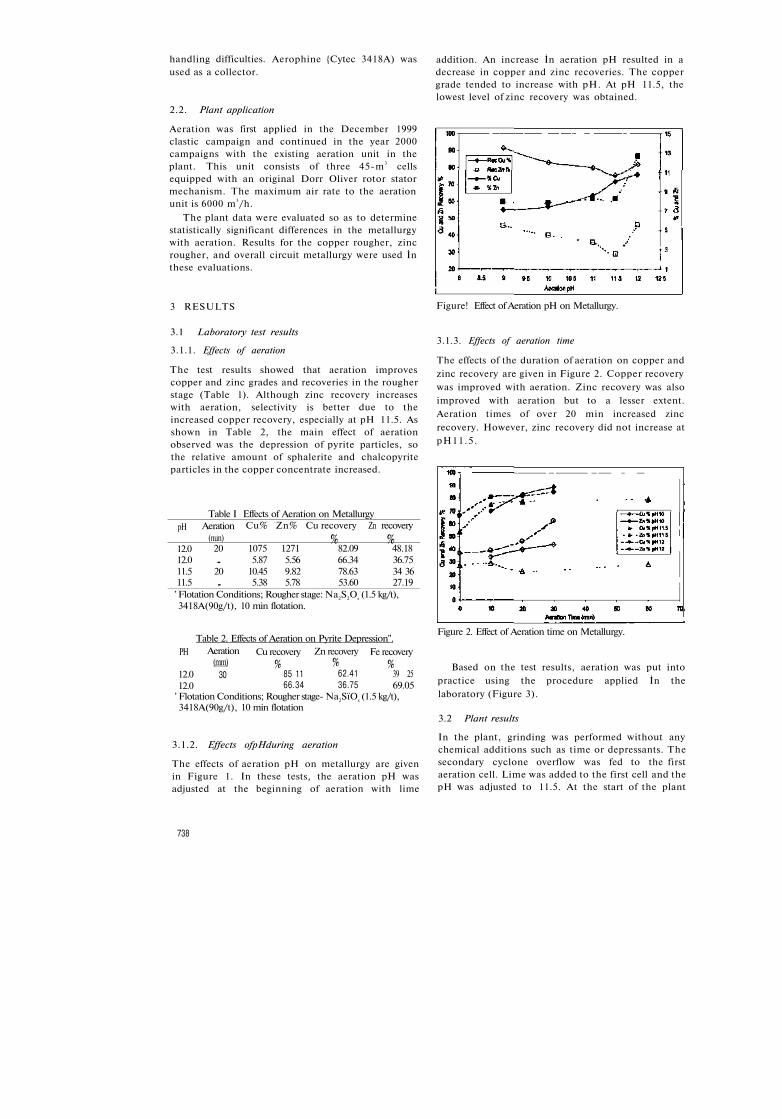
addition. An increase İn aeration pH resulted in a decrease in copper and zinc recoveries. The copper grade tended to increase with pH. At pH 11.5, the lowest level of zinc recovery was obtained.
Figure! Effect of Aeration pH on Metallurgy.
3.1 Laboratory test results
3.1.1. Effects of aeration
The test results showed that aeration improves copper and zinc grades and recoveries in the rougher stage (Table 1). Although zinc recovery increases with aeration, selectivity is better due to the increased copper recovery, especially at pH 11.5. As shown in Table 2, the main effect of aeration observed was the depression of pyrite particles, so the relative amount of sphalerite and chalcopyrite particles in the copper concentrate increased.
pH
12.0 12.0 11.5 11.5
Table I Aeration
(nun) 20
-20 -
Effects of Aeration on Metallurgy Cu% Zn% Cu recovery
% 1075 1271 82.09 5.87 5.56 66.34
10.45 9.82 78.63 5.38 5.78 53.60
Zn recovery
% 48.18 36.75 34 36 27.19
' Flotation Conditions; Rougher stage: Na2S2Os (1.5 kg/t), 3418A(90g/t), 10 min flotation.
Table 2. Effects of Aeration on Pyrite Depression". PH Aeration
(mm) Cu recovery
% Zn recovery
% Fe recovery
% 12.0 12.0
30 85 11 66.34
62.41 36.75
39 25 69.05
' Flotation Conditions; Rougher stage- Na2SïOs (1.5 kg/t), 3418A(90g/t), 10 min flotation
3.1.2. Effects ofpHduring aeration
The effects of aeration pH on metallurgy are given in Figure 1. In these tests, the aeration pH was adjusted at the beginning of aeration with lime
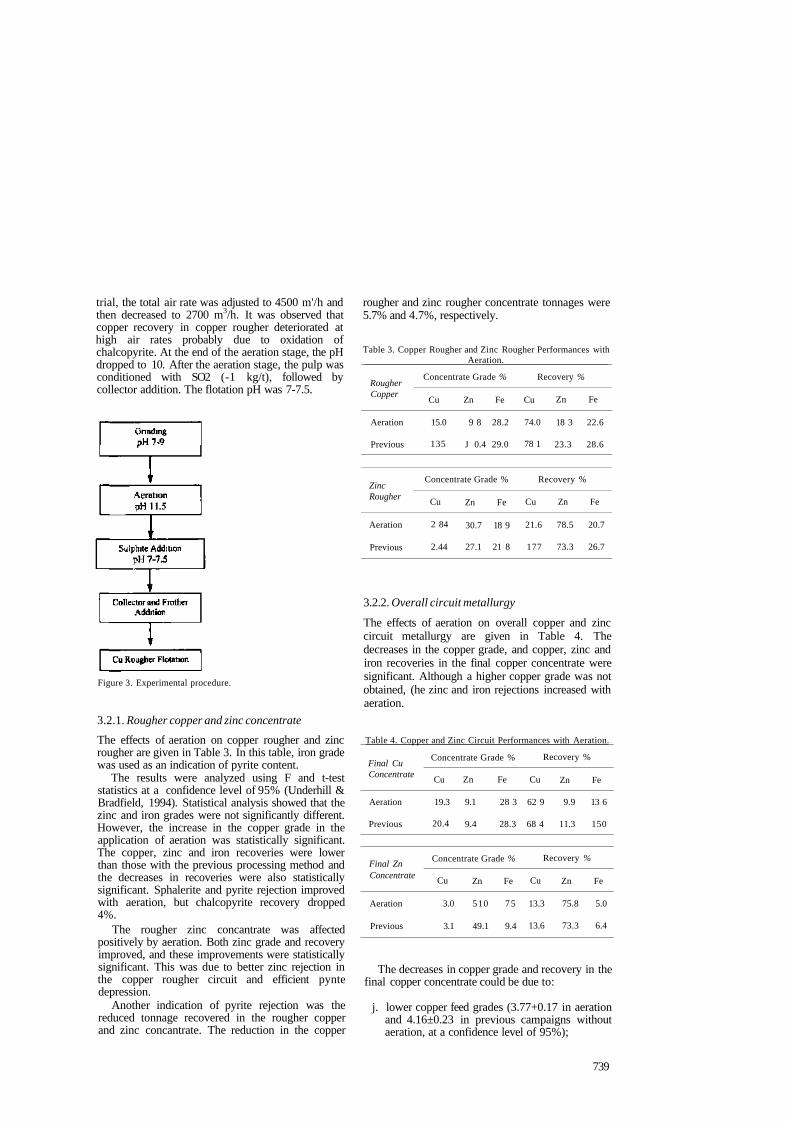
3.1.3. Effects of aeration time
The effects of the duration of aeration on copper and zinc recovery are given in Figure 2. Copper recovery was improved with aeration. Zinc recovery was also improved with aeration but to a lesser extent. Aeration times of over 20 min increased zinc recovery. However, zinc recovery did not increase at pH11.5.
Figure 2. Effect of Aeration time on Metallurgy.
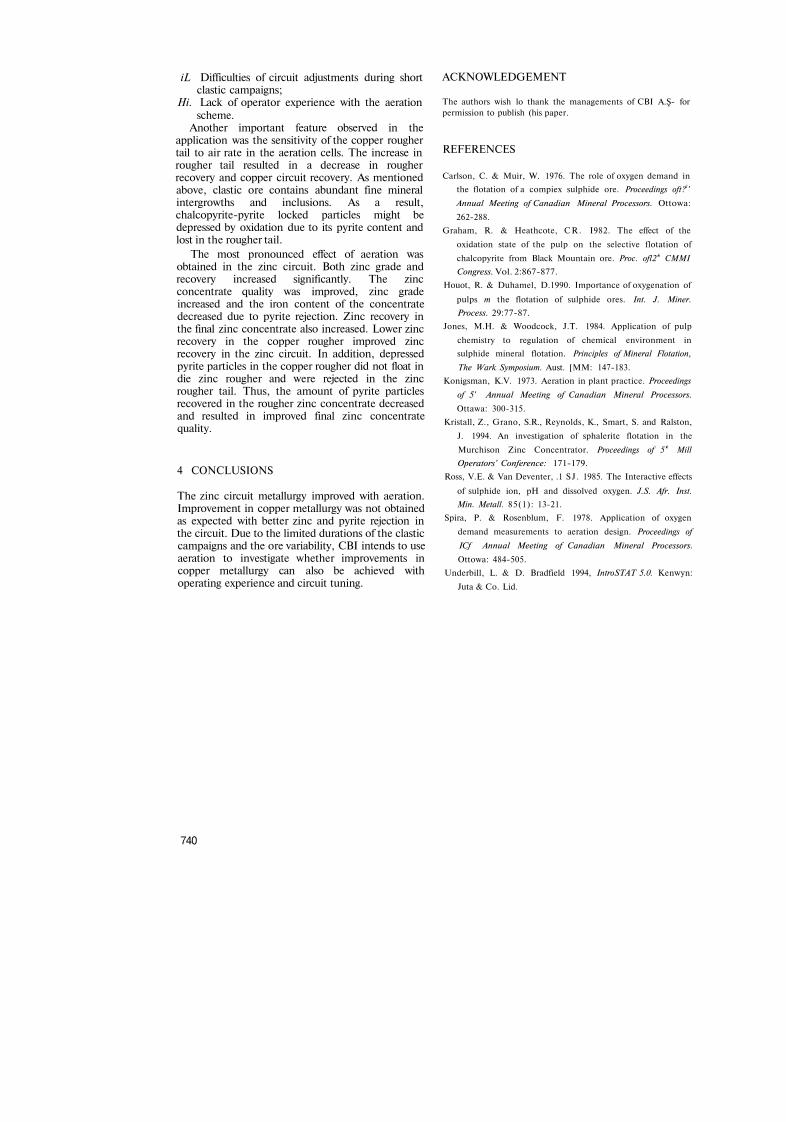
Based on the test results, aeration was put into practice using the procedure applied İn the laboratory (Figure 3).
3.2 Plant results
In the plant, grinding was performed without any chemical additions such as time or depressants. The secondary cyclone overflow was fed to the first aeration cell. Lime was added to the first cell and the pH was adjusted to 11.5. At the start of the plant
738
trial, the total air rate was adjusted to 4500 m'/h and then decreased to 2700 m3/h. It was observed that copper recovery in copper rougher deteriorated at high air rates probably due to oxidation of chalcopyrite. At the end of the aeration stage, the pH dropped to 10. After the aeration stage, the pulp was conditioned with SO2 (-1 kg/t), followed by collector addition. The flotation pH was 7-7.5.
Figure 3. Experimental procedure.
3.2.1. Rougher copper and zinc concentrate The effects of aeration on copper rougher and zinc rougher are given in Table 3. In this table, iron grade was used as an indication of pyrite content.
The results were analyzed using F and t-test statistics at a confidence level of 95% (Underhill & Bradfield, 1994). Statistical analysis showed that the zinc and iron grades were not significantly different. However, the increase in the copper grade in the application of aeration was statistically significant. The copper, zinc and iron recoveries were lower than those with the previous processing method and the decreases in recoveries were also statistically significant. Sphalerite and pyrite rejection improved with aeration, but chalcopyrite recovery dropped 4%.
The rougher zinc concantrate was affected positively by aeration. Both zinc grade and recovery improved, and these improvements were statistically significant. This was due to better zinc rejection in the copper rougher circuit and efficient pynte depression.
Another indication of pyrite rejection was the reduced tonnage recovered in the rougher copper and zinc concantrate. The reduction in the copper
rougher and zinc rougher concentrate tonnages were 5.7% and 4.7%, respectively.
Table 3. Copper Rougher and Zinc Rougher Performances with Aeration.
Rougher Copper
Aeration
Previous
Zinc Rougher
Aeration
Previous
Concentrate Grade %
Cu
15.0
135
Zn Fe
9 8 28.2
J 0.4 29.0
Concentrate Grade %
Cu
2 84
2.44
Zn Fe
30.7 18 9
27.1 21 8
Recovery %
Cu
74.0
78 1
Zn Fe
18 3 22.6
23.3 28.6
Recovery %
Cu
21.6
177
Zn Fe
78.5 20.7
73.3 26.7
3.2.2. Overall circuit metallurgy
The effects of aeration on overall copper and zinc circuit metallurgy are given in Table 4. The decreases in the copper grade, and copper, zinc and iron recoveries in the final copper concentrate were significant. Although a higher copper grade was not obtained, (he zinc and iron rejections increased with aeration.
Table 4. Copper and Zinc Circuit Performances with Aeration.
Final Cu Concentrate
Aeration
Previous
Final Zn Concentrate
Aeration
Previous
Concentrate Grade %
Cu
19.3
20.4
Zn
9.1
9.4
Fe
28 3
28.3
Concentrate Grade %
Cu
3.0
3.1
Zn
510
49.1
Fe
75
9.4
Recovery %
Cu
62 9
68 4
Zn Fe
9.9 13 6
11.3 150
Recovery %
Cu
13.3
13.6
Zn Fe
75.8 5.0
73.3 6.4
The decreases in copper grade and recovery in the final copper concentrate could be due to:
j. lower copper feed grades (3.77+0.17 in aeration and 4.16±0.23 in previous campaigns without aeration, at a confidence level of 95%);
739
iL Difficulties of circuit adjustments during short clastic campaigns;
Hi. Lack of operator experience with the aeration scheme.
Another important feature observed in the application was the sensitivity of the copper rougher tail to air rate in the aeration cells. The increase in rougher tail resulted in a decrease in rougher recovery and copper circuit recovery. As mentioned above, clastic ore contains abundant fine mineral intergrowths and inclusions. As a result, chalcopyrite-pyrite locked particles might be depressed by oxidation due to its pyrite content and lost in the rougher tail.
The most pronounced effect of aeration was obtained in the zinc circuit. Both zinc grade and recovery increased significantly. The zinc concentrate quality was improved, zinc grade increased and the iron content of the concentrate decreased due to pyrite rejection. Zinc recovery in the final zinc concentrate also increased. Lower zinc recovery in the copper rougher improved zinc recovery in the zinc circuit. In addition, depressed pyrite particles in the copper rougher did not float in die zinc rougher and were rejected in the zinc rougher tail. Thus, the amount of pyrite particles recovered in the rougher zinc concentrate decreased and resulted in improved final zinc concentrate quality.
4 CONCLUSIONS
The zinc circuit metallurgy improved with aeration. Improvement in copper metallurgy was not obtained as expected with better zinc and pyrite rejection in the circuit. Due to the limited durations of the clastic campaigns and the ore variability, CBI intends to use aeration to investigate whether improvements in copper metallurgy can also be achieved with operating experience and circuit tuning.
ACKNOWLEDGEMENT
The authors wish lo thank the managements of CBI A.Ş- for permission to publish (his paper.
REFERENCES
Carlson, C. & Muir, W. 1976. The role of oxygen demand in the flotation of a compiex sulphide ore. Proceedings oft?1'
Annual Meeting of Canadian Mineral Processors. Ottowa:
262-288. Graham, R. & Heathcote, C R . I982. The effect of the
oxidation state of the pulp on the selective flotation of
chalcopyrite from Black Mountain ore. Proc. ofl2'h CMMI Congress. Vol. 2:867-877.
Houot, R. & Duhamel, D.1990. Importance of oxygenation of
pulps m the flotation of sulphide ores. Int. J. Miner. Process. 29:77-87.
Jones, M.H. & Woodcock, J.T. 1984. Application of pulp
chemistry to regulation of chemical environment in sulphide mineral flotation. Principles of Mineral Flotation,
The Wark Symposium. Aust. [MM: 147-183. Konigsman, K.V. 1973. Aeration in plant practice. Proceedings
of 5' Annual Meeting of Canadian Mineral Processors.
Ottawa: 300-315. Kristall, Z., Grano, S.R., Reynolds, K., Smart, S. and Ralston,
J. 1994. An investigation of sphalerite flotation in the
Murchison Zinc Concentrator. Proceedings of 5'h Mill Operators' Conference: 171-179.
Ross, V.E. & Van Deventer, .1 SJ . 1985. The Interactive effects
of sulphide ion, pH and dissolved oxygen. J.S. Afr. Inst. Min. Metall. 85(1): 13-21.
Spira, P. & Rosenblum, F. 1978. Application of oxygen
demand measurements to aeration design. Proceedings of
ICf Annual Meeting of Canadian Mineral Processors.
Ottowa: 484-505. Underbill, L. & D. Bradfield 1994, IntroSTAT 5.0. Kenwyn:
Juta & Co. Lid.
740
17th International Mining Congress and Exhibition of Turkey- IMCET 2001, © 2001, ISBN 975-395-417-4
New Filter Selection, Installation, Commissioning and Operation at CBI Concentrator
V.Gökdere & M.Naseem Mian Çayeli Bakir isletmeleri, Çayeli, Turkey
ABSTRACT: The Çayeli concentrator designed nameplate capacity was 600,000 tonnes per year. Originally, three Rittershaus & Blecher pressure filters were installed: one for copper concentrate, one for zinc concentrate, and one standby for both copper and zinc concentrates. Mill throughput gradually increased after commissioning and was 896,700 tonnes in 1999. At these production levels, the filtration capacity created a bottleneck. In 1999, CBI decided to increase the mill capacity to one million tonnes per year and a fourth filter was installed İn the year 2000 as part of the expansion plan. A LASTA M.C. automatic filter press was selected. This paper describes the selection, installation, commissioning, and operation of the new filter; and compares its performance with that of the old filters.
1 INTRODUCTION
Çayeli Bakir isletmeleri is a copper zinc mine at Çayeli on the eastern Black Sea coast in the province of Rize. The mine is located 7km from the coast. It is an underground operation of one million tonnes per year, producing copper and zinc concentrates. The concentrates are trucked 25 km to a port facility at Rize for shipment to customers.
2 SELECTION PROCEDURE
Originally, the ÇBI mill was equipped with 3 Rittershaus & Blecher (R&B) pressure filters. These filters are high-maintenance items and required dedicated mechanics to look after them as production increased. Initially, one operator was budgeted for the dewatering section, but due to the operational difficulties of these filters, this was increased to two operators per shift. In choosing a filter, the main selection criteria were low maintenance and operation costs, and the filter had to be simple to operate and robust m design. The capacity requirement was 400 dmt/day.
Quotations were requested from the Larox, Outokumpu, Bethlehem, and MC LASTA pressure filter manufacturers.
After preliminary evaluation of the quotations, a trip to North America was arranged so that these filters could be seen in operation and first hand information about their performance could be obtained.
Larox filters were observed in the Louvicourt and New Brunswick mines in Canada. The filters in Louvicourt were being used for filtering copper and zinc concentrates and the one in New Brunswick was being used for copper concentrate.
A Bethlehem filter was examined at Mason Metals, Chicago, USA. This filter is similar to the Larox. The material filtered was tin hydroxide slurry.
The MC LASTA filter was inspected at Kennecott Utah Copper, Salt Lake City, USA.
The Outokumpu Ceramec filter was rejected in the preliminary evaluation due to the high capital cost.
After the trip, a spreadsheet was prepared to compare the three selected bids for final evaluation based on our selection criteria.
The MC LASTA AUTOMATIC FILTER PRESS was selected. Industrial Process Machinery (IPM) offered a model MCFHC 1500 X 40/34 for 400 dmt/day operation. The number of plates offered was 34, while the frame capacity was 40 plates,
During discussions with the supplier, 6 more plates were added in order to utilise the maximum capacity of the machine. The nominal capacity with 40 plates is 470 dmt/day.
3 ENGINEERING AND INSTALLATION
The engineering contract was awarded to Foster Wheeler Bimas (FWB). The filter was a retrofit in place of two pilot-scale disc filters, which presented
741
an engineering challenge FWB completed the detailed engineering for the installation, including filter auxiliaries, İn two months. The auxiliaries were:
• one high pressure water pump for filter cloth washing, feed core clean-up, channel cleans, etc.,
• one slurry feed pump, which was also retrofit to the existing copper concentrate holding tank,
• one compressor, dedicated for use with the Lasta filter,
• one transfer pump, to pump filtrate and filter cloth washings.
FWB also prepared bid packages and helped in the selection of the contractor. EPRO Construction was awarded the project based on the CBI competitive bidding process.
The scope of the contract included all civil, steel, electrical and instrumentation works. A site project superintendent was appointed from FWB to supervise the contractor and to ensure that the construction was done according to their design. The construction contract was awarded in mid-April and commissioning of the filter started in mid-August 2000. The filter was fully commissioned by the end of September 2000. The cooperation from 1PM during all phases of engineering and construction was excellent. One person from IPM was on site during erection and two persons were on site for commissioning. They programmed the PLC and checked that the filter operation was satisfactory. They trained the ÇBI operation and maintenance staff. The training sessions were well conducted and covered m detail all the finer points of operation and maintenance of MC LASTA filters. These points were found to be very beneficial, ensuring smooth commissioning and trouble-free operation of the filter.
4 COMMISSIONING
After the usual pre-commissioning checks and dry runs, hot commissioning of the filter started on 19 August 2000. The filter exceeded its rated capacity after one month of operation. The current operational parameters are as follows: Average Cycle Time: 11 minutes. Average Number of Cycles: 120 per day. Average Capacity: 518 dmt/day. The filter is consistently exceeding its rated capacity of 470 dmt and we are very satisfied with its performance.
5 OPERATION
The filter press has a fully automated cycle and does not have to be restarted after each cycle.
The press has three operational modes. 1. Manual Mode (Maintenance Mode). 2. Semi Auto Mode. 3. Auto Mode (Operation Mode).
5.1 Manual Mode
All functions are manually controlled. This mode is also called the maintenance mode and is required during maintenance.
5.2 Semi Auto Mode
The press operates and stops at the end of each phase of operation and requires restarting after each phase. This mode is used to optimise the operating conditions, especially during commissioning.
5.3 Auto Mode
The filter is started by simply pressing the start button and it completes a full cycle automatically. It does not need restarting at the end of each cycle. It stops only when the "feed tank empty" alarm is activated.
6 COMPARISON OF THE MC LASTA WITH R&B PRESSES ACCORDING TO OUR EXPERIENCE
6.1 Performance Comparison
6.1.1. Capacity (Number of Cycles)
R&B filters: The rated capacities are 390 dmt/day for copper and 330 dmt/day for the zinc filters. The average cycle time is 20-25 minutes This is highly dependent on cake discharge. The filling, membrane squeezing and cake blow cycies take 12-15 minutes. Cake discharging takes about half of die time required for the rest of tie steps. The plate-shifting mechanism is a problem and the operator is required to complete the cake discharge and clean the plates.
The plate-shifting mechanism chain and connection pieces, shifting hook, and locking hook (pawl) stick and plates often do not move. Sometimes, due to these difficulties, it is only possible to average 40-50 cycles per day.
In actual operation, only about 280 dmt/day is obtained, based on availability due to operational problems which are explained below.
MC LASTA filter: The Lasta filter average cycle time including the cake discharge, is about 11 minutes. This goes down to as low as 10.5 minutes when the filter cloths are new and goes up to 12.5 mmutes as the cloths get older. There is no operator assistance required for discharging the cake, The average number of cycles per shift is 38-40. Forty
742
cycles per shift can be achieved without difficulty. This figure has been as high as 45 per shift. The average capacity is over 500 dmt/day.
6.1.2 Labour Requirements
R&B filters: ÇBI employs 2 operators per shift to operate these filters due to frequent cloth changes (average 2200 cycles for one set of cloth) and plate-moving problems. The seal surfaces on the sides of the plates and around the feed opening require continuous cleaning after each cycle due to the lack of an auto cloth wash provision. An auto cloth wash after each cycle is not possible with the existing design. This is explained in more detail İn the maintenance comparison section.
MC LASTA filter: The press requires no operator assistance during normal operation. Operator assistance is required only during alarm status or to change filter cloths. Cloth life is about 5000 cycles. Two sets of cloth have been changed to date. The first set was changed at 4500 cycles and the second at 5000 cycles.
6.1.3 Difficulties in Plate Shifting
R&B filters: The plates are hung on a rail with carriages. The carriages are equipped with hooks. There is a continuous running chain mechanism with shifter hooks attached. These shifter hooks catch the locking hooks (pawls) on the plate carriages and move the plates. This complex system causes frequent plate-shifting problems. This reduces the performance of the press. When plate-shifting problems start, the operator needs to climb on top of the filter to release the plates and maintenance assistance is required to change the damaged connection pieces.
MC LASTA filter: The Lasta filter plate-moving mechanism is very simple. The plates are located on two rails. There is a replaceable polyethylene wear pad attached to the plates and this acts as a cushion, making movement easier. The top parts of the rails are also replaceable. The top surface of the rails needs regular greasing and the shift operators on each shift do this. The rail surfaces are easily accessible.
The plates are connected to each other at 4 comers by a piece of chain. The head plate on the side of the cylinder acts as a drive head. When the cylinder opens, the plates pull each other, leaving space between plates which is the same as the length of the chain connecting the plates. This helps the discharge of the concentrates and ensures equal space between plates for effective washing of the cloth after cake discharge.
When the filter closes, the cylinder pushes the head plate in the opposite direction and the head
plate pushes the rest of the plates, which sit freely on rails. The gap between the plates starts to close, first from the cylinder side, and it is progressively closed as the cylinder moves to the feed side.
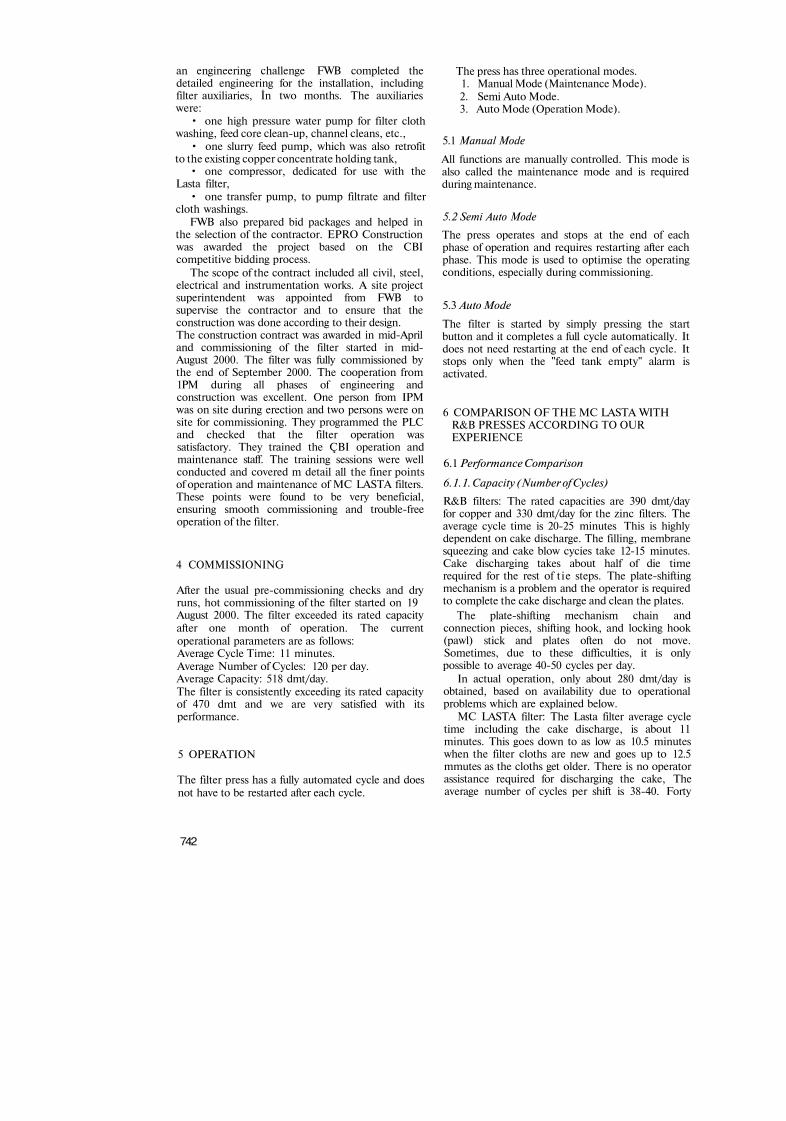
6.1.4 Vibration Bars for Cake Removal
R&B filters: No vibration bars İn design. MC LASTA filter: When cake sticks to the cloth, the cloth support bar İs depressed due to the weight of the sticky material and blocks the photo beam. This activates a vibration cycle and shakes all the plates from both sides. The vibration cycle is also an indication of possible cloth problems, i.e., holes, blinding, etc.
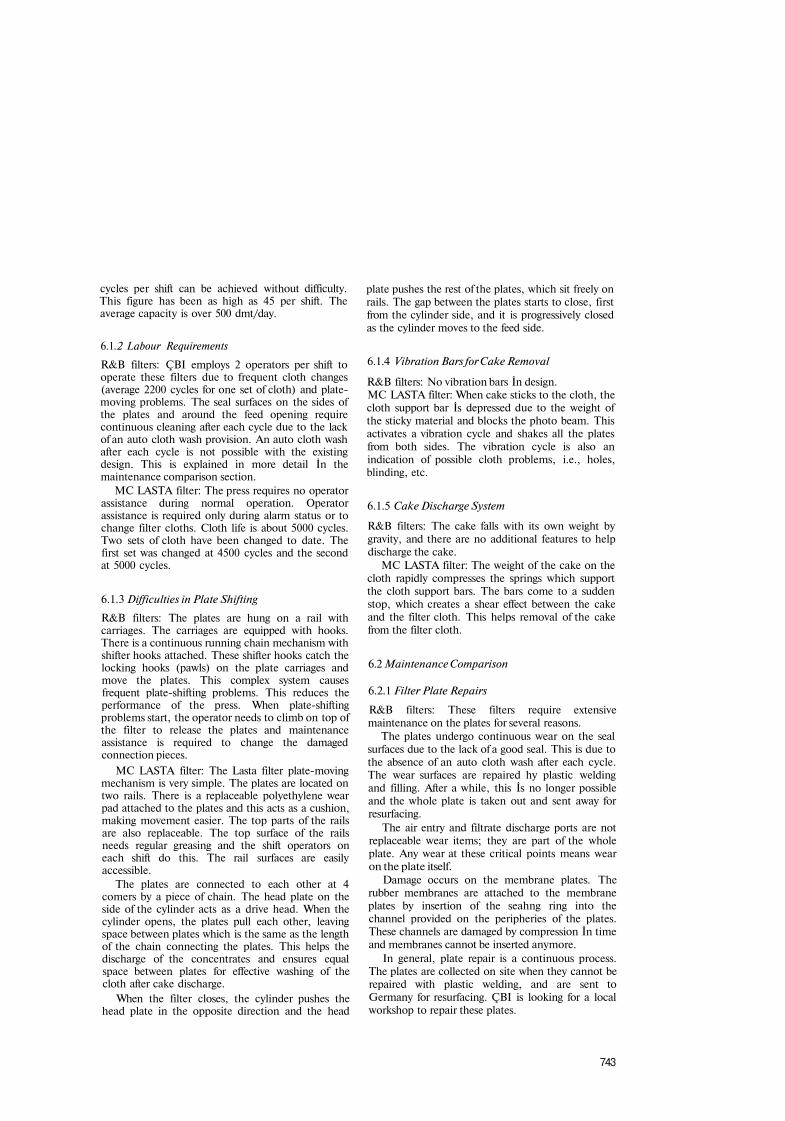
6.1.5 Cake Discharge System
R&B filters: The cake falls with its own weight by gravity, and there are no additional features to help discharge the cake.
MC LASTA filter: The weight of the cake on the cloth rapidly compresses the springs which support the cloth support bars. The bars come to a sudden stop, which creates a shear effect between the cake and the filter cloth. This helps removal of the cake from the filter cloth.
6.2 Maintenance Comparison
6.2.1 Filter Plate Repairs
R&B filters: These filters require extensive maintenance on the plates for several reasons.
The plates undergo continuous wear on the seal surfaces due to the lack of a good seal. This is due to the absence of an auto cloth wash after each cycle. The wear surfaces are repaired hy plastic welding and filling. After a while, this İs no longer possible and the whole plate is taken out and sent away for resurfacing.
The air entry and filtrate discharge ports are not replaceable wear items; they are part of the whole plate. Any wear at these critical points means wear on the plate itself.
Damage occurs on the membrane plates. The rubber membranes are attached to the membrane plates by insertion of the seahng ring into the channel provided on the peripheries of the plates. These channels are damaged by compression İn time and membranes cannot be inserted anymore.
In general, plate repair is a continuous process. The plates are collected on site when they cannot be repaired with plastic welding, and are sent to Germany for resurfacing. ÇBI is looking for a local workshop to repair these plates.
743
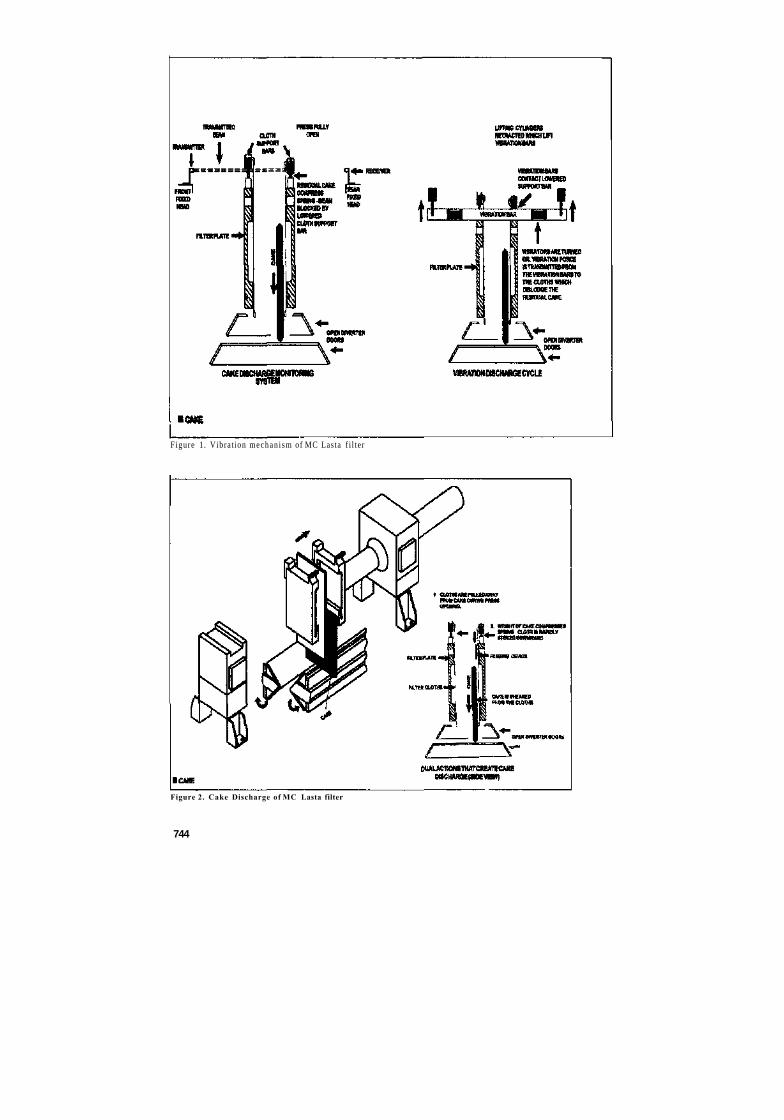
Figure 1. Vibrat ion mechan ism of MC Lasta f i l ter
Figure 2. Cake Discharge of MC Lasta filter
744
MC LASTA filter: There are no membrane plates. Only chamber plates are provided. The air entry and filtrate discharge ports are replaceable units called filtrate rejecters. When worn, they are replaced. Their wear is also an indication of holes in the filter cloth.
To date, no plates have been damaged due to any other factors.
6.2.2 Cloth Change Comparison
R&B filters: The cloth is a single piece. Changing it is a time-consuming and fairly laborious job. One part of the cloth has to be rolled, squeezed and passed through the feed opening of the plate so that it can be put on the other side of the plate. Similarly, removing the old cloth is not easy as the cloth becomes harder and very difficult to roll back through the feed opening. It İs common practice to cut the cloth when removing it from the plates.
MC LASTA filter: The cloth change is very easy. There are two pieces, which are hung on each side of a plate by hanging bars. The filter cloth assembly can be prepared in advance of cloth change. The odd-numbered plate cloth is equipped with a feeding device which is attached to the cloth before it is hung on the bars.
6.2.3 Plate-Moving and Shifting Mechanism
R&B filters: The chains located inside the traverse are equipped with shifter hooks, which glide over the carriages of the plate pack when the press is closed. When the press is opened, one of the shifter hooks engages, due to its own weight, on the last plate and unlocks this plate. The shifter hook now
moves the plate suspended from the carriage fitted with offset rollers. This action is repeated until the last plate is opened. The offset roller movement is hindered by dirt accumulating inside the traverse rails, which are difficult to reach and clean. If the locking hooks of the carriages are not caught by the shifter hook of the chain in the proper order, men a group of plates shift together. This overloads the locking hook and the drive motor of the chain mechanism. The locking hook bends or the chain drive motor trips due to overloading. In short, the plate-shifting mechanism is complex.
MC LASTA filter: The plate-moving mechanism is rather simple. The plates are connected to each other by chains at four corners. When the cylinder retracts, it moves the head plate backwards and the head plate pulls the rest of the plates one by one. The plates move freely on top of two side rails. The greasing of the rails makes it easy.
6.2.4 Washing System Maintenance
RifeB filters: The washing mechanism is a separate unit. It has a trolley with a moving chain and washing device. A geared motor is provided for the longitudinal and the wash travel drives. Both the washing device and the plates have to move to wash the cloth. The problems with plate moving continue during cloth washing. Each washing takes about 45 minutes if there are no problems with plate movements or washing device movements. The cloth wash is a manual process. The filter has to be stopped and the control unit is changed to cloth wash mode. It is not practical to wash cloth after each cycle since one wash takes 45 minutes.
Figure 3. Filter cloth of MC Lasta
745
In addition to these problems, the washing device catches the filter cloth and sometime damages it while the sprays are in upward motion.
MC LASTA filter: The cloth wash is part of the auto cycle; it takes 40 seconds to wash all 41 plates and 40 chambers. Each plate is equipped with three cloth wash sprays as an integrated part of the cloth support bar. Water from the spray water header is connected to the cloth support bars on the even-numbered plates by hoses. Wash nozzles direct wash water over the cake side of the filter cloth.
6.3 Safety and Environment
6.3.1 Leaks and Noise from Filter Plates
R&B filters: Sealing surfaces deteriorate due to poor cloth washing, especially at the bottom of the plates. Cake remnants deteriorate the sealing surfaces. When the filter comes to the cake blow cycle, the compressed air leaks through these surfaces, creating dust and a shrill whistling noise. The cloth is also damaged by these surfaces.
MC LASTA filter: There is no sealing problem. The effective cloth-washing system after each cycle cleans all the surfaces of the plate. There are no leaks and there is no whistling.
6.3.2 Position and Access to Plates
R&B filters: The working platform is level with the bottom of the plates. This is necessary due to the operator assistance required in cake discharge. In order that the top of the plates can be reached, a ladder is provided. The operator or maintenance personnel have to put on a safety belt while working on top of the filter.
MC LASTA filter: The working platform İs located on top of the plates. The support rails, spray nozzles and cloth change bars are all accessible without the need for any safety equipment. One operator can change a filter cloth.
7 CONCLUSIONS
The selection of the MC LASTA filter was the right decision for Çayeli. The filter has exceeded our expectations. We recommend this filter for base metal concentrates where simplicity of operation and maintenance are key factors.
REFERENCES
Rittershaus & Blecher Filter Operation Manual MC Lasta Filter Operation and Maintenance Manuals.
746
17th International Mining Congress and Exhibition of Turkey- IMCET2001, ©2001, ISBN 975-395-417-4
Interaction of Original and Heat-Treated Sepiolites with Quaternary Amines
E.Sabah Mineral Processing Program, Afyon Kocatepe University, Afyon, Turkey
MS.Çelik Department of Mining Engineering, Istanbul Technical University, Istanbul, Turkey
ABSTRACT: In this study, the adsorption of quaternary amines onto original and heat-treated sepiolite was investigated as a Junction of several variables. Adsorption of dodecyltrimethylamrnonium bromide (Ci2H25N(CH3)3 Br) and hexadecyltrimethylammonium bromide {Ci6H2sN(CH3)3 Br) onto sepiolite at a constant temperature of 25°C exhibits typical isotherms with plateaus. The adsorption densities, as represented by mole per m2 of the adsorbate, reveal that although heat activation results in a several-fold increase in the specific surface area, practically, it produces no appreciable difference in the adsorption values.
1 INTRODUCTION
Abatement of mining and mineral processing wastes without harming the environment is an important technical problem in the development of the mining industry. The use of flotation reagents such as cationic-amine-rype reagents in the flotation of silicates, oxides and salt-type minerals results in the contamination of process water. These aliphatic and aromatic compounds are also used in the production of pigments, rubber and pesticides, leading to substantial organic wastes. The adsorption process is usually applied to those wastes that cannot be removed by biological techniques. Activated carbon is the most common adsorbent used in such processes. Sepiolite, which was used in this investigation, is cheaper and is considered an alternative to activated carbon. It is not only used in the abatement of organic compounds, but İs used for inorganic metal cations as well.
Sepiolite exhibits a variety of attractive properties, such as high specific surface area, high porosity and surface activity, and the ability to form high and stable viscosities at low solids concentrations. Sepiolite is therefore used in a range of areas where sorptive, catalytic and rheological properties are exploited. The sorption ability of sepiolite is mainly ascribed to its high surface area. Thus, it is commonly used in oil refining, wastewater treatment, İn the removal of odor, drug and pesticide carriers, paper, detergent, etc.
Similar to other chain-type silicate minerals, İt contains a continuous two-dimensional tetrahedral sheet but without continuous octahedral sheets. This
unique fibrous structure with interior channels of 3.6x10.6 A in size permits adsorption of organic and inorganic ions (Gonzalez-Pradas et al. 1990, Singer and Huang 1989). Sepiolite has a total specific surface area of 800-900 m2/g, of which meroretically 400 m /g is external and 500 m2/g is internal (Alvarez 1984, Sema and Van Scoyoc 1978). The penetration of organic molecules into the channels depends upon the polarity, ability to make hydrogen bonds, and the match of the size and shape of the molecule (Çetişli 1989, Hoyoetal. 1993).
It was therefore the objective of this study to investigate the ability of the uptake of typical quaternary amine surfactants, dodecyltrimethylamrnonium bromide (DTAB) and hexadecyltrimethylammonium bromide (HTAB), onto original and heat-treated sepiolites and elucidate the adsorption mechanism.
2 EXPERIMENTAL
2.1 Materials
The sepiolite sample used in this study was obtained from the Mayas Mining Company in Sivrihisar, Turkey. The cation ratios of sepiolite calculated using oxygen as the basis of 33 {Jones and Galan 1984) yielded the data presented in Table I.
This brown sepiolite, ground to minus 65 um, produced an average particle size (dsu) of 1.99 |jm as determined by Zetasizer. The XRD together with the chemical analysis results given elsewhere indicate that calcite and dolomite are the major impurities
747
accompanying sepiolite (Sabah et al. 1997). The specific surface areas of the original and heat-treated sepiolite at 300°C as determined by BET technique are 68 m2/g and 253.3 m2/g respectively.
Table 1. Cation ratios of sepiolite. Cation Ratios
Tetrahedral Laver Si 11.84 Ti 0.01 AI 0.41
Octahedral Laver Mg 8.23 Fe*3 0.12
Cations Between Sheets Ca 0.I9 Na 0.05 K _ 0.10
Dodecyltrimethylammonium bromide (DTAB), Cl2H25N(CH3)3Br and hexadecyl trimethylammonium bromide (HTAB), C i eH33N(CH3)3Br were used as the cationic surfactants. Both were specified to be of high purity. Distilled and deionized water with a conductivity value of 2xl0"6 mhos/cm was used in all experiments. The experiments were conducted at 25°C. pH was adjusted using either HCl or NaOH solutions.
2.2 Methods Adsorption tests were conducted in 20- or 40-ml glass vials. 500 mg of sepiolite sample was mixed in 10 cc or multiples of this with a solid-to-liquid ratio of 0.05. The vials were shaken for 2 h on a shaker and centrifuged for 15 min. The supernatant was analyzed for the cationic surfactant by a two-phase titration technique originally applied to anionic surfactants using dimidium bromide and disulfme blue as indicators. This technique is based on the formation of a complex between an anionic surfactant (sodium dodecylsulfate) and cationic reagent (DAH). This complex is soluble in chloroform and changes from blue to pink in the presence of indicators (Powers 1970, Reid et al. 1967).
The adsorption density was calculated by the following formula (1).
(I)
where C, and Cr = the initial and residual concentrations (moles/1); m = the amount of solid (grams); V = the volume of the solution (ml); S = the specific surface area of sepiolite (m /g); and F =
the adsorption density (M/m2). In order to increase the surface area and induce
physico-chemical changes in the structure of the sepiolite, heat activation was performed. In the heat activation, 20 g of sepiolite was placed in a muffle furnace for a period of 10 hours.
3 RESULTS AND DISCUSSION
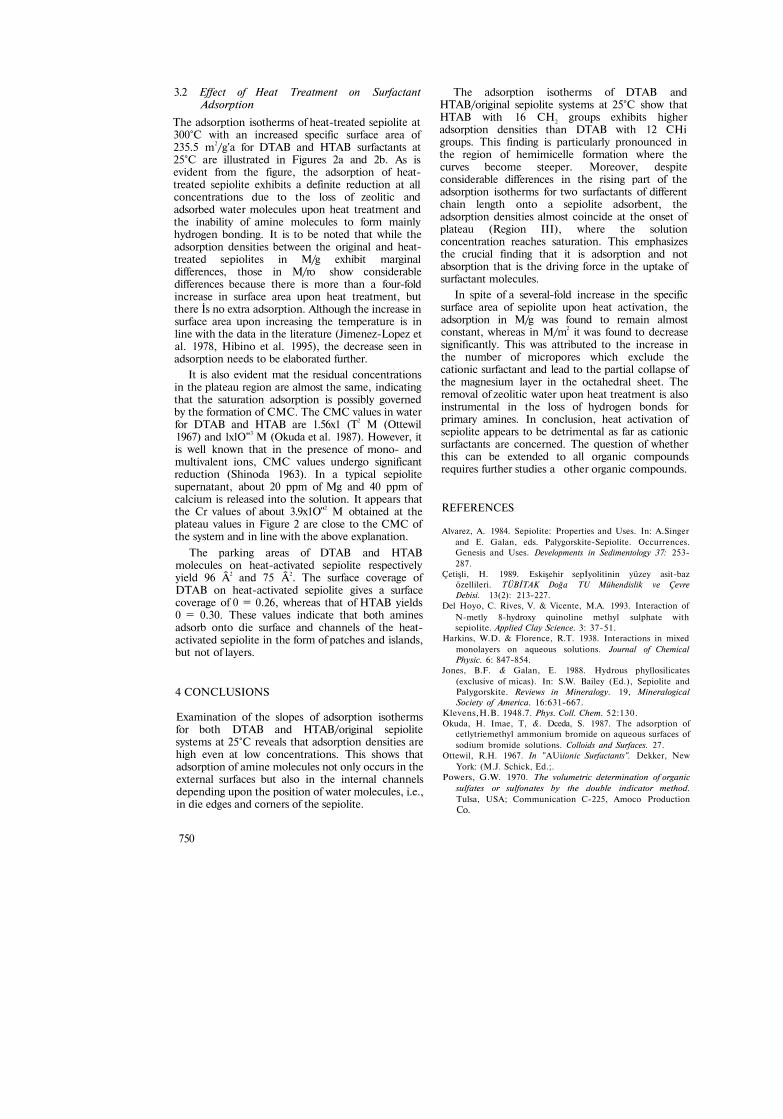
3.1 Adsorption of Surfactants on Original Sepiolite Figure 1 shows the adsorption isotherms of DTAB (C12) and HTAB (C!6) at 25±2°C onto sepiolite. Plateau adsorption values for the quaternary amines in the initial concentration range of 10" -10" M/l are rmE:i=6.18x10"* M/m2 for DTAB and rma,=6.68xl0"6
M/m2 for HTAB. The residual concentration values for these surfactants at the onset of the plateau in the adsorption isotherms for DTAB and HTAB respectively were found to be CD= 3.9xl0"2 M/l, and CD= 1.22X10~3 M/l. By plugging these values in Equation 2 the cross-sectional areasfor each reagent can be calculated, as 27 Â2 and 25 Â2 for DTAB and HTAB, respectively. If the cross-sectional area of the polar part of DTAB and HTAB is 25 Â2, as reported by Harkins and Florence (1938), the degree of coverage for DTAB and HTAB on the original sepiolite is 0=1. This reveals that DTAB and HTAB adsorbs onto original sepiolite in the form of a monolayer. This has been verified by the following equation:
Ä2/molecule (2)
where T„ denotes adsorption in the plateau region (M/m2); and A represents the Avagadro number (6.02xl023).
The adsorption isotherms of the original sepiolite/quaternary amines system given in Figure 1 are characterized by three distinct regions with different slopes. While the adsorption of amines shows a gradual increase in the first region, the increase in the second region is rather sharp. Despite significant differences in the rising part of the adsorption isotherms for two surfactants of different chain length onto sepiolite adsorbent with 68 m"/g of specific surface area, the adsorption densities overlap at the onset of the plateau (Region III). The solution concentration in Region III reaches saturation, which indicates that both quaternary amines concomitantly attain a region of micellar interactions and in turn point out the differences in the adsorption mechanisms of DTAB and HTAB molecules in each region.
748
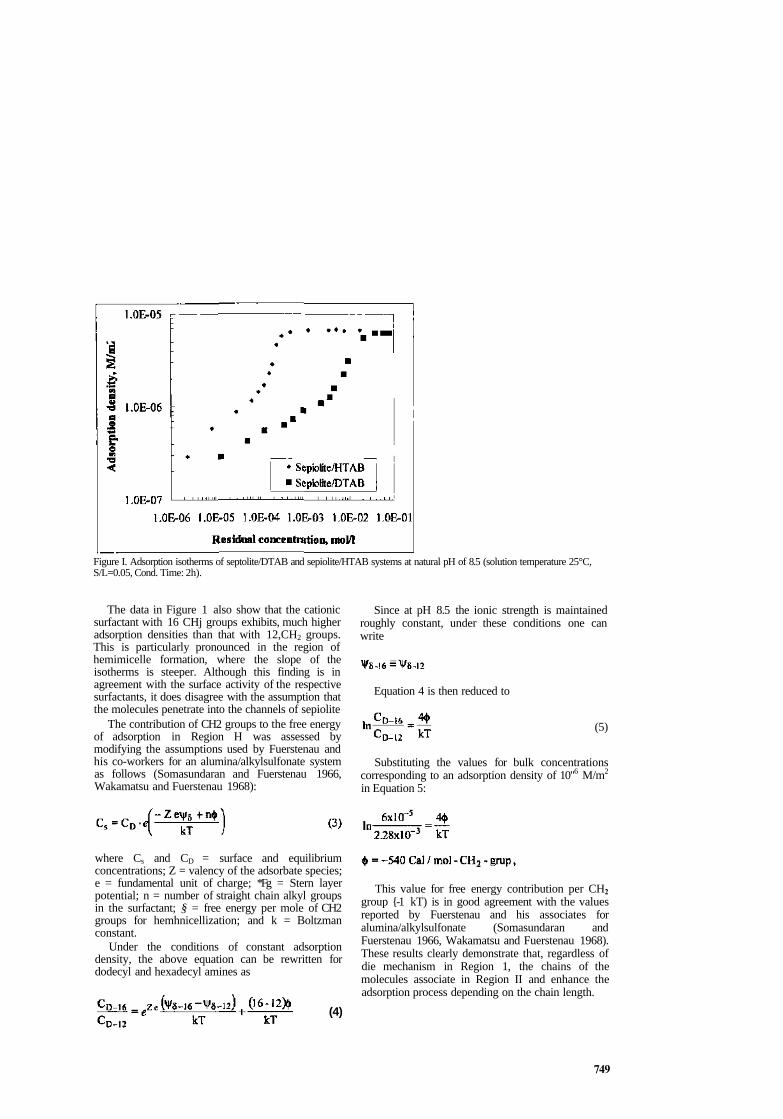
Figure I. Adsorption isotherms of septolite/DTAB and sepiolite/HTAB systems at natural pH of 8.5 (solution temperature 25°C, S/L=0.05, Cond. Time: 2h).
The data in Figure 1 also show that the cationic surfactant with 16 CHj groups exhibits, much higher adsorption densities than that with 12,CH2 groups. This is particularly pronounced in the region of hemimicelle formation, where the slope of the isotherms is steeper. Although this finding is in agreement with the surface activity of the respective surfactants, it does disagree with the assumption that the molecules penetrate into the channels of sepiolite
The contribution of CH2 groups to the free energy of adsorption in Region H was assessed by modifying the assumptions used by Fuerstenau and his co-workers for an alumina/alkylsulfonate system as follows (Somasundaran and Fuerstenau 1966, Wakamatsu and Fuerstenau 1968):
where Cs and CD = surface and equilibrium concentrations; Z = valency of the adsorbate species; e = fundamental unit of charge; *Fg = Stern layer potential; n = number of straight chain alkyl groups in the surfactant; § = free energy per mole of CH2 groups for hemhnicellization; and k = Boltzman constant.
Under the conditions of constant adsorption density, the above equation can be rewritten for dodecyl and hexadecyl amines as
(4)
Since at pH 8.5 the ionic strength is maintained roughly constant, under these conditions one can write
Equation 4 is then reduced to
(5)
Substituting the values for bulk concentrations corresponding to an adsorption density of 10"6 M/m2
in Equation 5:
This value for free energy contribution per CH2 group {-1 kT) is in good agreement with the values reported by Fuerstenau and his associates for alumina/alkylsulfonate (Somasundaran and Fuerstenau 1966, Wakamatsu and Fuerstenau 1968). These results clearly demonstrate that, regardless of die mechanism in Region 1, the chains of the molecules associate in Region II and enhance the adsorption process depending on the chain length.
749
3.2 Effect of Heat Treatment on Surfactant Adsorption
The adsorption isotherms of heat-treated sepiolite at 300°C with an increased specific surface area of 235.5 m2/g'a for DTAB and HTAB surfactants at 25°C are illustrated in Figures 2a and 2b. As is evident from the figure, the adsorption of heat-treated sepiolite exhibits a definite reduction at all concentrations due to the loss of zeolitic and adsorbed water molecules upon heat treatment and the inability of amine molecules to form mainly hydrogen bonding. It is to be noted that while the adsorption densities between the original and heat-treated sepiolites in M/g exhibit marginal differences, those in M/ro show considerable differences because there is more than a four-fold increase in surface area upon heat treatment, but there İs no extra adsorption. Although the increase in surface area upon increasing the temperature is in line with the data in the literature (Jimenez-Lopez et al. 1978, Hibino et al. 1995), the decrease seen in adsorption needs to be elaborated further.
It is also evident mat the residual concentrations in the plateau region are almost the same, indicating that the saturation adsorption is possibly governed by the formation of CMC. The CMC values in water for DTAB and HTAB are 1.56x1 (T2 M (Ottewil 1967) and lxlO"3 M (Okuda et al. 1987). However, it is well known that in the presence of mono- and multivalent ions, CMC values undergo significant reduction (Shinoda 1963). In a typical sepiolite supernatant, about 20 ppm of Mg and 40 ppm of calcium is released into the solution. It appears that the Cr values of about 3.9x1O"2 M obtained at the plateau values in Figure 2 are close to the CMC of the system and in line with the above explanation.
The parking areas of DTAB and HTAB molecules on heat-activated sepiolite respectively yield 96 Â2 and 75 Â2. The surface coverage of DTAB on heat-activated sepiolite gives a surface coverage of 0 = 0.26, whereas that of HTAB yields 0 = 0.30. These values indicate that both amines adsorb onto die surface and channels of the heat-activated sepiolite in the form of patches and islands, but not of layers.
4 CONCLUSIONS
Examination of the slopes of adsorption isotherms for both DTAB and HTAB/original sepiolite systems at 25°C reveals that adsorption densities are high even at low concentrations. This shows that adsorption of amine molecules not only occurs in the external surfaces but also in the internal channels depending upon the position of water molecules, i.e., in die edges and corners of the sepiolite.
750
The adsorption isotherms of DTAB and HTAB/original sepiolite systems at 25°C show that HTAB with 16 CH2 groups exhibits higher adsorption densities than DTAB with 12 CHi groups. This finding is particularly pronounced in the region of hemimicelle formation where the curves become steeper. Moreover, despite considerable differences in the rising part of the adsorption isotherms for two surfactants of different chain length onto a sepiolite adsorbent, the adsorption densities almost coincide at the onset of plateau (Region III), where the solution concentration reaches saturation. This emphasizes the crucial finding that it is adsorption and not absorption that is the driving force in the uptake of surfactant molecules.
In spite of a several-fold increase in the specific surface area of sepiolite upon heat activation, the adsorption in M/g was found to remain almost constant, whereas in M/m2 it was found to decrease significantly. This was attributed to the increase in the number of micropores which exclude the cationic surfactant and lead to the partial collapse of the magnesium layer in the octahedral sheet. The removal of zeolitic water upon heat treatment is also instrumental in the loss of hydrogen bonds for primary amines. In conclusion, heat activation of sepiolite appears to be detrimental as far as cationic surfactants are concerned. The question of whether this can be extended to all organic compounds requires further studies a other organic compounds.
REFERENCES
Alvarez, A. 1984. Sepiolite: Properties and Uses. In: A.Singer and E. Galan, eds. Palygorskite-Sepiolite. Occurrences. Genesis and Uses. Developments in Sedimentology 37: 253-287.
Çetişli, H. 1989. Eskişehir sepİyolitinin yüzey asit-baz özellileri. TÜBİTAK Doğa TU Mühendislik ve Çevre Debisi. 13(2): 213-227.
Del Hoyo, C. Rives, V. & Vicente, M.A. 1993. Interaction of N-metly 8-hydroxy quinoline methyl sulphate with sepiolite. Applied Clay Science. 3: 37-51.
Harkins, W.D. & Florence, R.T. 1938. Interactions in mixed monolayers on aqueous solutions. Journal of Chemical Physic. 6: 847-854.
Jones, B.F. & Galan, E. 1988. Hydrous phyllosilicates (exclusive of micas). In: S.W. Bailey (Ed.), Sepiolite and Palygorskite. Reviews in Mineralogy. 19, Mineralogical Society of America. 16:631-667.
Klevens,H.B. 1948.7. Phys. Coll. Chem. 52:130. Okuda, H. Imae, T, &. Dceda, S. 1987. The adsorption of
cetlytriemethyl ammonium bromide on aqueous surfaces of sodium bromide solutions. Colloids and Surfaces. 27.
Ottewil, R.H. 1967. In "AUiionic Surfactants". Dekker, New York: (M.J. Schick, Ed.;.
Powers, G.W. 1970. The volumetric determination of organic sulfates or sulfonates by the double indicator method. Tulsa, USA; Communication C-225, Amoco Production Co.
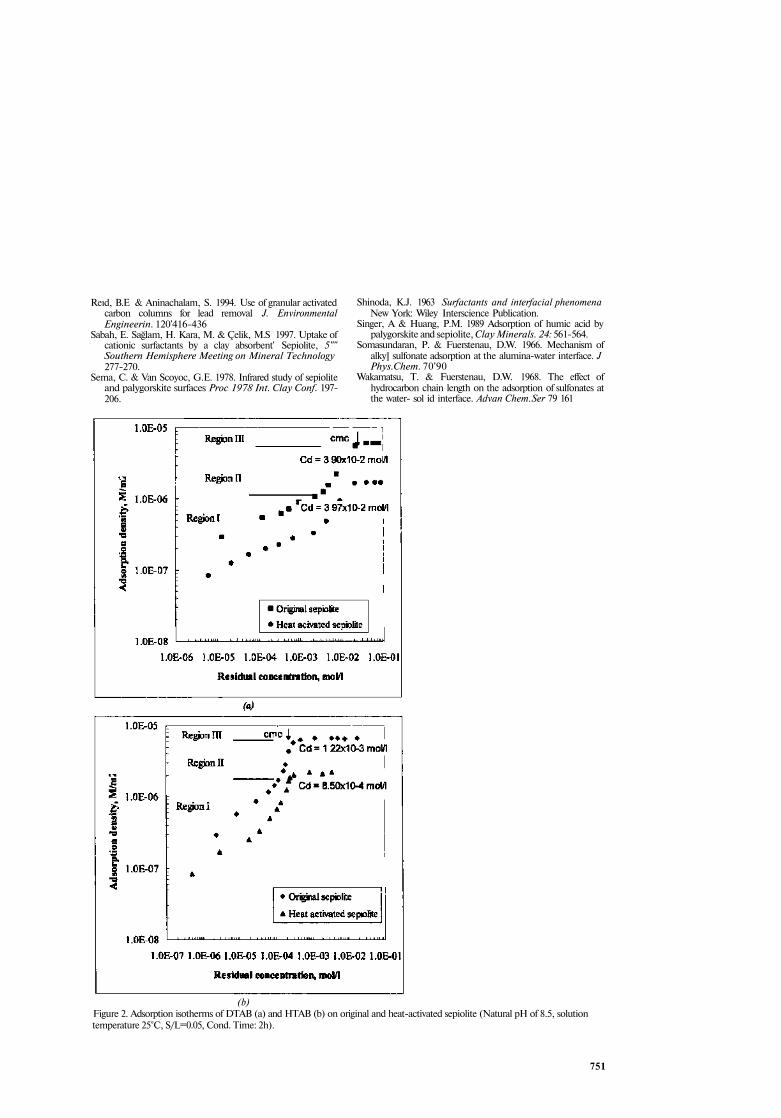
Reıd, B.E & Aninachalam, S. 1994. Use of granular activated carbon columns for lead removal J. Environmental Engineerin. 120'416-436
Sabah, E. Sağlam, H. Kara, M. & Çelik, M.S 1997. Uptake of cationic surfactants by a clay absorbent' Sepiolite, 5"" Southern Hemisphere Meeting on Mineral Technology 277-270.
Sema, C. & Van Scoyoc, G.E. 1978. Infrared study of sepiolite and palygorskite surfaces Proc 1978 Int. Clay Conf. 197-206.
Shinoda, K.J. 1963 Surfactants and interfacial phenomena New York: Wiley Interscience Publication.
Singer, A & Huang, P.M. 1989 Adsorption of humic acid by palygorskite and sepiolite, Clay Minerals. 24: 561-564.
Somasundaran, P. & Fuerstenau, D.W. 1966. Mechanism of alky] sulfonate adsorption at the alumina-water interface. J Phys.Chem. 70'90
Wakamatsu, T. & Fuerstenau, D.W. 1968. The effect of hydrocarbon chain length on the adsorption of sulfonates at the water- sol id interface. Advan Chem.Ser 79 161
(b) Figure 2. Adsorption isotherms of DTAB (a) and HTAB (b) on original and heat-activated sepiolite (Natural pH of 8.5, solution temperature 25°C, S/L=0.05, Cond. Time: 2h).
751

17th Intemaîionaf Mining Congress and Exhibrtion of Turkey- MCET2001, ©2001, fSBN 975-395-4Î7-4
The Application of Colemanite Addition to Floor Tile Glazes
A.Yamık, İ.Bentli, C.Karagüzel, M.Çınar & B.Cengiz University of Dumlupinar, Department of Mining Engineering, Kütahya, Turkey
ABSTRACT: Colemanite ore, a borate mineral, has been used in ceramic glaze recipes due to its low melting point, low solubility and its smoothness on unleaded glazes. In this study, colemanite was added at 2%-10% to a standard glaze recipe and six different recipe samples, including the standard recipe, were preoared. These recipes were applied to industrial-grade ceramic floor tiles. Various physical tests were done on ceramic floor tiles fired at 1180 "C in intensity ovens. The results indicate that the physical properties of the floor tiles did not change considerably and that die surface quality and smoothness of the floor tiles improved with 6%-8% colemanite addition.
1 INTRODUCTION
Ceramic products can be defined as substances produced from inorganic industrial minerals mixed in appropriate proportions, formed into desired shapes and fired in an oven with or without glazes. Ceramic floor tiles, which have a wide variety of applications, consist of a base body overlaid with a hygienic and decorative thin layer of glaze (Arcasoy, 1983). The durability of the surface for its application can be obtained by means of a suitable glaze recipe (Kartal, 1998).
One of the main reasons for the use of glaze recipes in floor tiles İs to make the porous and uneven surface much smoother. In this way, it is much easier to clean die floor tile surfaces. Another reason is to give an aesthetic and decorative appearance to the ceramic floor tiles. In addition, resistance to chemical reactions is provided by increasing the strength and surface hardness of the ceramic floor tiles (Yamik et al. 1999, Özaslan 1993).
The objective of applying the engobe process to ceramic floor tiles is to fill cavities, and obtain a smooth surface and conformity between the ceramic body and its glaze. Engobe is the undercoat material, which covers unwanted stains on the ceramic body, provides conformity between the ceramic body and its glaze by forming a thin layer between them, and improves the appearance of motif applications.
The objective of this study was to investigate the physical properties of floor tiles produced by me addition of colemanite to glaze recipes. The test results are compared with the TS-EN 176 standard for ceramic industrial-grade floor tiles.
Borate mineral affects the melting point of other
oxide minerals such as lead oxide, which has a very low melting point. Both borate (B2O3) and lead oxide (PbO) are contai.ied in glazes which have low melting points. The main advantages of having B2O3 in ceramic glazes are the following (Kartal, 1998):
• It has a very low melting point; • Gives better flux properties; • Decreases thermal expansion; • Provides resistance to acids; • Provides better glazing properties by
decreasing viscosity; • Gives more surface brightness.
2 EXPERIMENTAL STUDY
2.1 Samples and procedures
The glaze recipe samples prepared for the tests contained sodium and potassium feldspars, zircon, clay, zinc oxide, talc, corundum, wollastonite and colemanite minerals. The composition of the engobe, which is spread underneath the glaze, included clay minerals, frit, quartz and zircon (Ünaydin, 1993). For the test, six different glaze recipes were prepared: one standard sample and five samples with colemanite contents of 2%-10%. The chemical compositions of the recipe samples are given in table 1. The seger fonnula parameter of the standard glaze recipe was determined from chemical analysis: 0.082Na2O, 0.037K2O, 0.27CaO, 0.417ZnO, 0.614AI2O3, 0.007Fe2O3) 2.493Si02, 0.004TiO2, 0.125ZrO2 mole. The glaze recipes were prepared from this seger formula by the addition of vanous amounts of colemanite. The effects of colemanite addition on glaze quality were investigated.
753
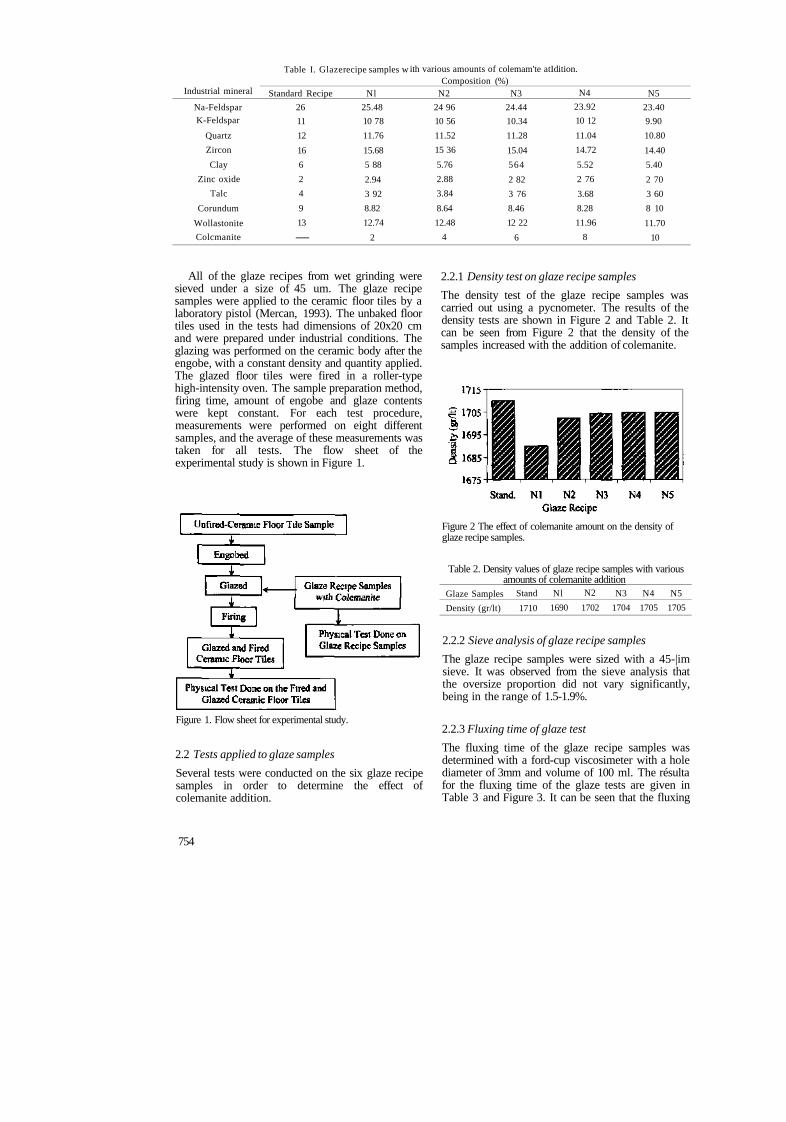
Industrial mineral
Na-Feldspar K-Feldspar
Quartz Zircon Clay
Zinc oxide Talc
Corundum Wollastonite Colcmanite
Table I. Glazer
Standard Recipe 26 11 12 16 6 2 4 9 13
—
ecipe samples w
Nl 25.48 10 78 11.76 15.68 5 88 2.94 3 92 8.82 12.74
2
ith various amounts of colemam'te at Composition (%)
N2 24 96 10 56 11.52 15 36 5.76 2.88 3.84 8.64 12.48
4
N3 24.44 10.34 11.28 15.04 564 2 82 3 76 8.46 12 22
6
Idition.
N4 23.92 10 12 11.04 14.72 5.52 2 76 3.68 8.28 11.96
8
N5 23.40 9.90 10.80 14.40 5.40 2 70 3 60 8 10 11.70
10
All of the glaze recipes from wet grinding were sieved under a size of 45 um. The glaze recipe samples were applied to the ceramic floor tiles by a laboratory pistol (Mercan, 1993). The unbaked floor tiles used in the tests had dimensions of 20x20 cm and were prepared under industrial conditions. The glazing was performed on the ceramic body after the engobe, with a constant density and quantity applied. The glazed floor tiles were fired in a roller-type high-intensity oven. The sample preparation method, firing time, amount of engobe and glaze contents were kept constant. For each test procedure, measurements were performed on eight different samples, and the average of these measurements was taken for all tests. The flow sheet of the experimental study is shown in Figure 1.
Figure 1. Flow sheet for experimental study.
2.2 Tests applied to glaze samples Several tests were conducted on the six glaze recipe samples in order to determine the effect of colemanite addition.
2.2.1 Density test on glaze recipe samples The density test of the glaze recipe samples was carried out using a pycnometer. The results of the density tests are shown in Figure 2 and Table 2. It can be seen from Figure 2 that the density of the samples increased with the addition of colemanite.
Figure 2 The effect of colemanite amount on the density of glaze recipe samples.
Table 2. Density values of glaze recipe samples with various amounts of colemanite addition
Glaze Samples Density (gr/lt)
Stand 1710
Nl 1690
N2 1702
N3 1704
N4 1705
N5 1705
2.2.2 Sieve analysis of glaze recipe samples The glaze recipe samples were sized with a 45-|im sieve. It was observed from the sieve analysis that the oversize proportion did not vary significantly, being in the range of 1.5-1.9%.
2.2.3 Fluxing time of glaze test The fluxing time of the glaze recipe samples was determined with a ford-cup viscosimeter with a hole diameter of 3mm and volume of 100 ml. The résulta for the fluxing time of the glaze tests are given in Table 3 and Figure 3. It can be seen that the fluxing
754
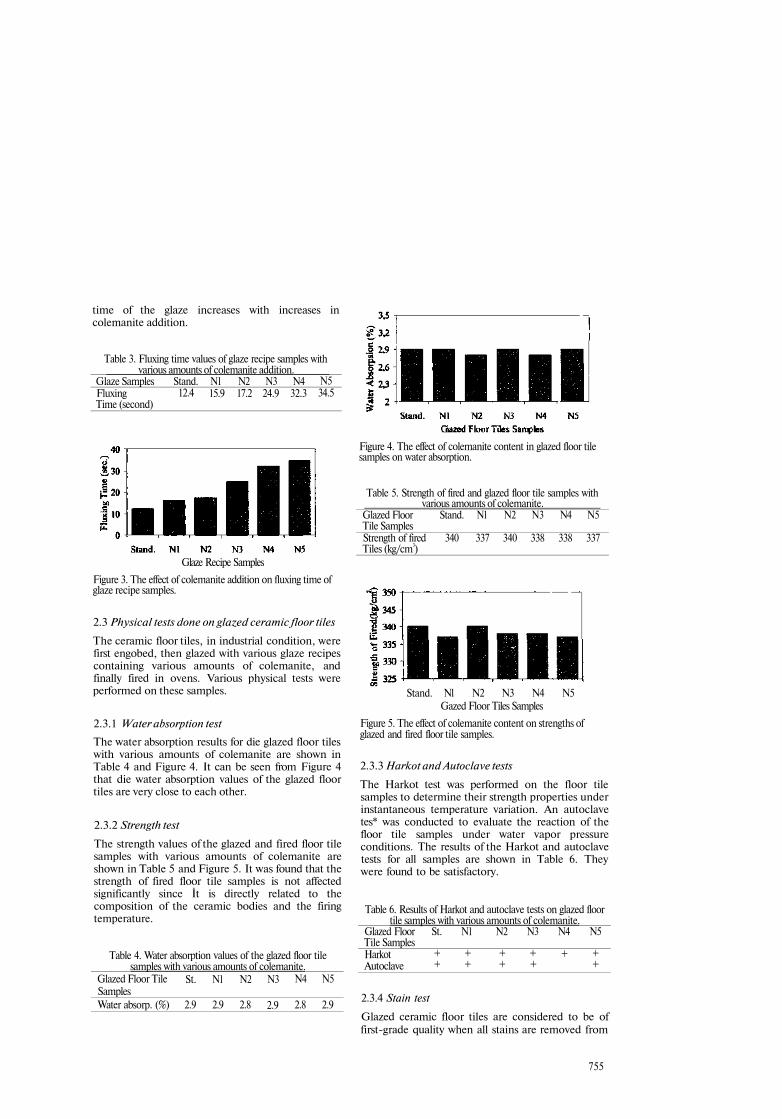
time of the glaze increases with increases in colemanite addition.
Table 3. Fluxing time values of glaze recipe samples with various amounts of colemanite addition.
Glaze Samples Fluxing Time (second)
Stand. 12.4
Nl 15.9
N2 17.2
N3 24.9
N4 32.3
N5 34.5
Glaze Recipe Samples
Figure 3. The effect of colemanite addition on fluxing time of glaze recipe samples.
2.3 Physical tests done on glazed ceramic floor tiles
The ceramic floor tiles, in industrial condition, were first engobed, then glazed with various glaze recipes containing various amounts of colemanite, and finally fired in ovens. Various physical tests were performed on these samples.
2.3.1 Water absorption test
The water absorption results for die glazed floor tiles with various amounts of colemanite are shown in Table 4 and Figure 4. It can be seen from Figure 4 that die water absorption values of the glazed floor tiles are very close to each other.
2.3.2 Strength test
The strength values of the glazed and fired floor tile samples with various amounts of colemanite are shown in Table 5 and Figure 5. It was found that the strength of fired floor tile samples is not affected significantly since İt is directly related to the composition of the ceramic bodies and the firing temperature.
Table 4. Water absorption values of the glazed floor tile samples with various amounts of colemanite.
Glazed Floor Tile Samples Water absorp. (%)
St.
2.9
Nl
2.9
N2
2.8
N3
2.9
N4
2.8
N5
2.9
Figure 4. The effect of colemanite content in glazed floor tile samples on water absorption.
Table 5. Strength of fired and glazed floor tile samples with various amounts of colemanite.
Glazed Floor Tile Samples Strength of fired Tiles (kg/cm3)
Stand.
340
Nl
337
N2
340
N3
338
N4
338
N5
337
Stand. Nl N2 N3 N4 N5 Gazed Floor Tiles Samples
Figure 5. The effect of colemanite content on strengths of glazed and fired floor tile samples.
2.3.3 Harkot and Autoclave tests
The Harkot test was performed on the floor tile samples to determine their strength properties under instantaneous temperature variation. An autoclave tes* was conducted to evaluate the reaction of the floor tile samples under water vapor pressure conditions. The results of the Harkot and autoclave tests for all samples are shown in Table 6. They were found to be satisfactory.
Table 6. Results of Harkot and autoclave tests on glazed floor tile samples with various amounts of colemanite.
Glazed Floor Tile Samples Harkot Autoclave
St.
+ +
Nl
+ +
N2
+ +
N3
+ +
N4
+
N5
+ +
2.3.4 Stain test
Glazed ceramic floor tiles are considered to be of first-grade quality when all stains are removed from
755
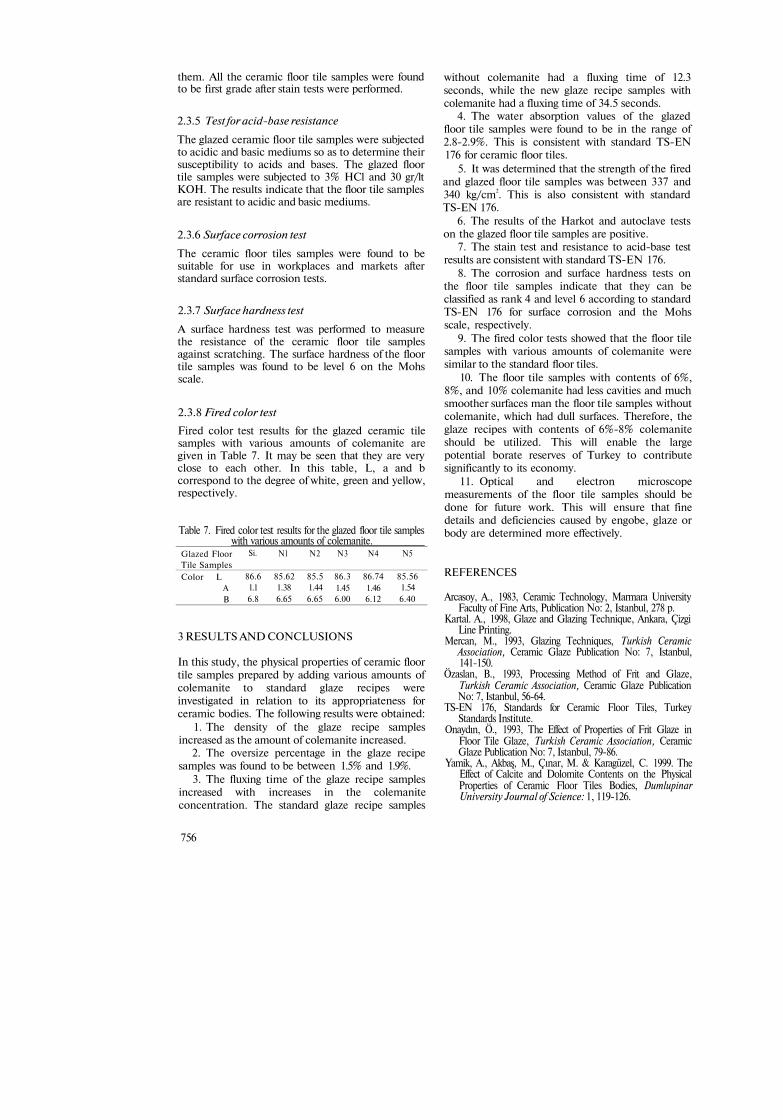
them. All the ceramic floor tile samples were found to be first grade after stain tests were performed.
2.3.5 Test for acid-base resistance
The glazed ceramic floor tile samples were subjected to acidic and basic mediums so as to determine their susceptibility to acids and bases. The glazed floor tile samples were subjected to 3% HCl and 30 gr/lt KOH. The results indicate that the floor tile samples are resistant to acidic and basic mediums.
2.3.6 Surface corrosion test
The ceramic floor tiles samples were found to be suitable for use in workplaces and markets after standard surface corrosion tests.
2.3.7 Surface hardness test
A surface hardness test was performed to measure the resistance of the ceramic floor tile samples against scratching. The surface hardness of the floor tile samples was found to be level 6 on the Mohs scale.
2.3.8 Fired color test
Fired color test results for the glazed ceramic tile samples with various amounts of colemanite are given in Table 7. It may be seen that they are very close to each other. In this table, L, a and b correspond to the degree of white, green and yellow, respectively.
Table 7. Fired color test results for the glazed floor tile samples with various amounts of colemanite.
Glazed Floor Tile Samples Color L
A B
Si.
86.6 1.1 6.8
Nl
85.62 1.38 6.65
N2
85.5 1.44 6.65
N3
86.3 1.45 6.00
N4
86.74 1.46 6.12
N5
85.56 1.54 6.40
3 RESULTS AND CONCLUSIONS
In this study, the physical properties of ceramic floor tile samples prepared by adding various amounts of colemanite to standard glaze recipes were investigated in relation to its appropriateness for ceramic bodies. The following results were obtained:
1. The density of the glaze recipe samples increased as the amount of colemanite increased.
2. The oversize percentage in the glaze recipe samples was found to be between 1.5% and 1.9%.
3. The fluxing time of the glaze recipe samples increased with increases in the colemanite concentration. The standard glaze recipe samples
without colemanite had a fluxing time of 12.3 seconds, while the new glaze recipe samples with colemanite had a fluxing time of 34.5 seconds.
4. The water absorption values of the glazed floor tile samples were found to be in the range of 2.8-2.9%. This is consistent with standard TS-EN 176 for ceramic floor tiles.
5. It was determined that the strength of the fired and glazed floor tile samples was between 337 and 340 kg/cm2. This is also consistent with standard TS-EN 176.
6. The results of the Harkot and autoclave tests on the glazed floor tile samples are positive.
7. The stain test and resistance to acid-base test results are consistent with standard TS-EN 176.
8. The corrosion and surface hardness tests on the floor tile samples indicate that they can be classified as rank 4 and level 6 according to standard TS-EN 176 for surface corrosion and the Mohs scale, respectively.
9. The fired color tests showed that the floor tile samples with various amounts of colemanite were similar to the standard floor tiles.
10. The floor tile samples with contents of 6%, 8%, and 10% colemanite had less cavities and much smoother surfaces man the floor tile samples without colemanite, which had dull surfaces. Therefore, the glaze recipes with contents of 6%-8% colemanite should be utilized. This will enable the large potential borate reserves of Turkey to contribute significantly to its economy.
11. Optical and electron microscope measurements of the floor tile samples should be done for future work. This will ensure that fine details and deficiencies caused by engobe, glaze or body are determined more effectively.
REFERENCES
Arcasoy, A., 1983, Ceramic Technology, Marmara University Faculty of Fine Arts, Publication No: 2, Istanbul, 278 p.
Kartal. A., 1998, Glaze and Glazing Technique, Ankara, Çizgi Line Printing.
Mercan, M., 1993, Glazing Techniques, Turkish Ceramic Association, Ceramic Glaze Publication No: 7, Istanbul, 141-150.
Özaslan, B., 1993, Processing Method of Frit and Glaze, Turkish Ceramic Association, Ceramic Glaze Publication No: 7, Istanbul, 56-64.
TS-EN 176, Standards for Ceramic Floor Tiles, Turkey Standards Institute.
Onaydın, Ö., 1993, The Effect of Properties of Frit Glaze in Floor Tile Glaze, Turkish Ceramic Association, Ceramic Glaze Publication No: 7, Istanbul, 79-86.
Yamik, A., Akbaş, M., Çınar, M. & Karagüzel, C. 1999. The Effect of Calcite and Dolomite Contents on the Physical Properties of Ceramic Floor Tiles Bodies, Dumlupinar University Journal of Science: 1, 119-126.
756
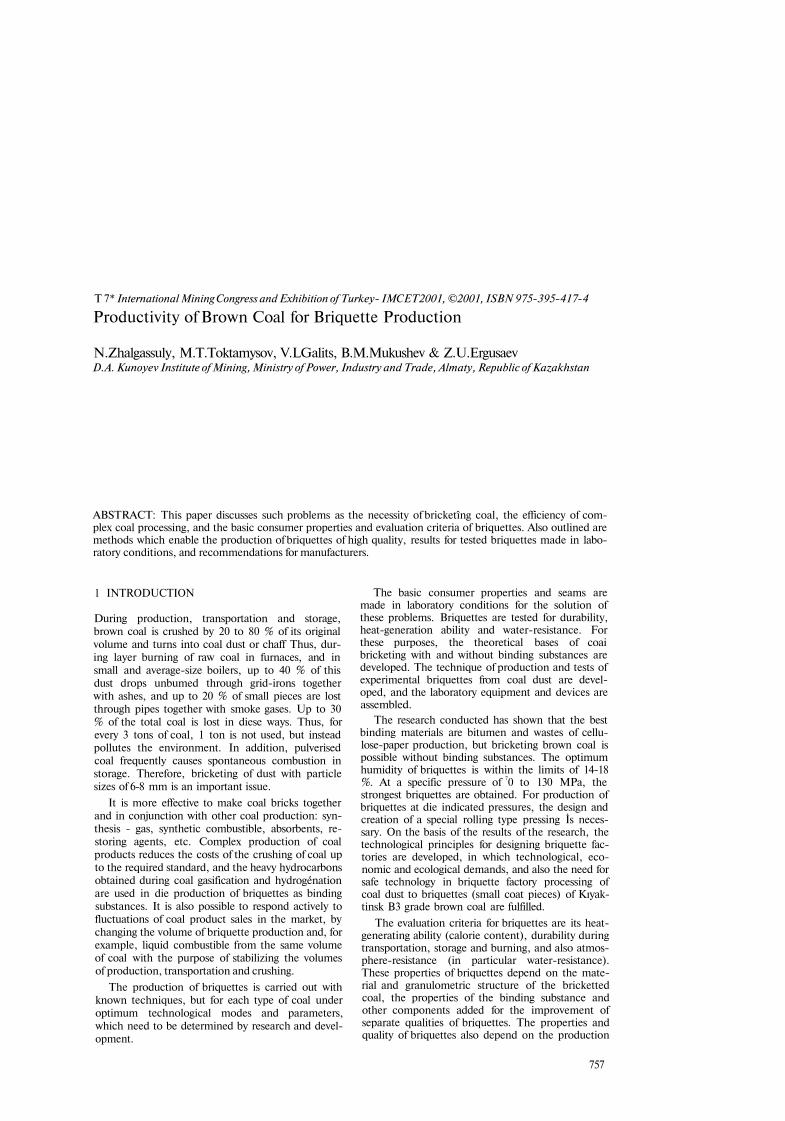
17th International Mining Congress and Exhibition of Turkey- IMCET2001, ©2001, ISBN 975-395-417-4
Productivity of Brown Coal for Briquette Production
N.Zhalgassuly, M.T.Toktamysov, V.LGalits, B.M.Mukushev & Z.U.Ergusaev D.A. Kunoyev Institute of Mining, Ministry of Power, Industry and Trade, Almaty, Republic of Kazakhstan
ABSTRACT: This paper discusses such problems as the necessity of bricketîng coal, the efficiency of complex coal processing, and the basic consumer properties and evaluation criteria of briquettes. Also outlined are methods which enable the production of briquettes of high quality, results for tested briquettes made in laboratory conditions, and recommendations for manufacturers.
1 INTRODUCTION
During production, transportation and storage, brown coal is crushed by 20 to 80 % of its original volume and turns into coal dust or chaff Thus, during layer burning of raw coal in furnaces, and in small and average-size boilers, up to 40 % of this dust drops unbumed through grid-irons together with ashes, and up to 20 % of small pieces are lost through pipes together with smoke gases. Up to 30 % of the total coal is lost in diese ways. Thus, for every 3 tons of coal, 1 ton is not used, but instead pollutes the environment. In addition, pulverised coal frequently causes spontaneous combustion in storage. Therefore, bricketing of dust with particle sizes of 6-8 mm is an important issue.
It is more effective to make coal bricks together and in conjunction with other coal production: synthesis - gas, synthetic combustible, absorbents, restoring agents, etc. Complex production of coal products reduces the costs of the crushing of coal up to the required standard, and the heavy hydrocarbons obtained during coal gasification and hydrogénation are used in die production of briquettes as binding substances. It is also possible to respond actively to fluctuations of coal product sales in the market, by changing the volume of briquette production and, for example, liquid combustible from the same volume of coal with the purpose of stabilizing the volumes of production, transportation and crushing.
The production of briquettes is carried out with known techniques, but for each type of coal under optimum technological modes and parameters, which need to be determined by research and development.
The basic consumer properties and seams are made in laboratory conditions for the solution of these problems. Briquettes are tested for durability, heat-generation ability and water-resistance. For these purposes, the theoretical bases of coai bricketing with and without binding substances are developed. The technique of production and tests of experimental briquettes from coal dust are developed, and the laboratory equipment and devices are assembled.
The research conducted has shown that the best binding materials are bitumen and wastes of cellulose-paper production, but bricketing brown coal is possible without binding substances. The optimum humidity of briquettes is within the limits of 14-18 %. At a specific pressure of 70 to 130 MPa, the strongest briquettes are obtained. For production of briquettes at die indicated pressures, the design and creation of a special rolling type pressing İs necessary. On the basis of the results of the research, the technological principles for designing briquette factories are developed, in which technological, economic and ecological demands, and also the need for safe technology in briquette factory processing of coal dust to briquettes (small coat pieces) of Kıyak-tinsk B3 grade brown coal are fulfilled.
The evaluation criteria for briquettes are its heat-generating ability (calorie content), durability during transportation, storage and burning, and also atmosphere-resistance (in particular water-resistance). These properties of briquettes depend on the material and granulometric structure of the bricketted coal, the properties of the binding substance and other components added for the improvement of separate qualities of briquettes. The properties and quality of briquettes also depend on the production
757
conditions and, in particular, the pressing of briquettes, i.e., on the "know-how" of briquettes.
Therefore the basic purpose of the research carried out in the D. A. Kunayev Institute of Mining is the development of the optimum "know-how" for briquettes for various grades of coal extracted in the Republic of Kazakhstan. For this purpose, the following problems are being tackled:
1) Determination of optimum granulometrics of coal structure for bricketing.
2) Establishment of optimum binding substance and other necessary components.
3) Establishment of optimum amount of water added for bricketing.
4) Determination of optimum pressure and temperature of pressing.
5) Determination of optimum size of the briquettes for their various applications.
6) Determination of optimum methods of coal drying and cooling of briquettes.
7) Development of technology for packing briquettes for loading, transportation and storage.
The experimental briquettes are made from
various grades of coal from different deposits.
2 CONCLUSIONS
The suggested principles and the "know-how" of coal brick production İn conjunction with production of other coal products results in increased quality of briquettes, reduction in cost, increased profitability of production and combustible consumption, increased competitiveness of briquettes in consumers markets, and reduced anthropogenous load on the environment by prevention of self-burning and contamination of the bio-sphere with small coal pieces.
The technique of bricketing in conjunction with the production of other coal products is more effective in brown coal processing, as it is richer in organic materials, in humuses and pitch, and İs crushed more than other types of coal. The coal bricks are intended mainly for municipal-household use and for consumption in trains, schools, hospitals and military houses.
758
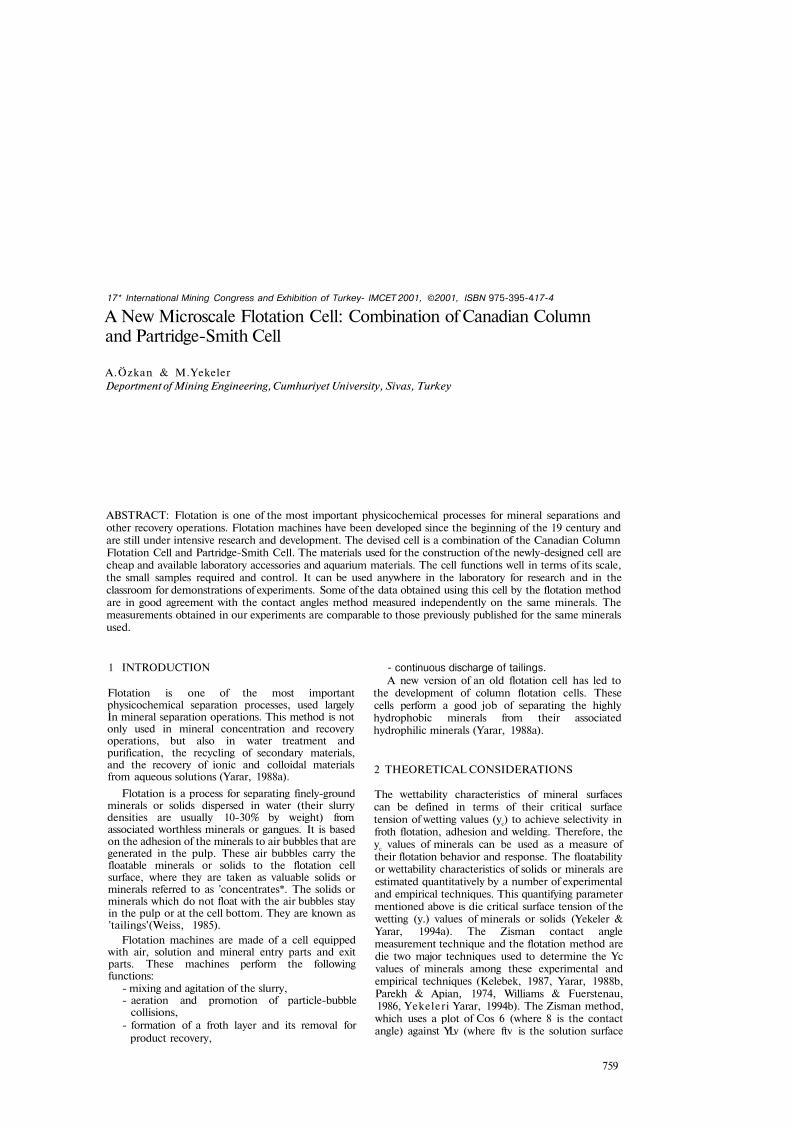
17th International Mining Congress and Exhibition of Turkey- IMCET 2001, ©2001, ISBN 975-395-417-4
A New Microscale Flotation Cell: Combination of Canadian Column and Partridge-Smith Cell
A.Özkan & M.Yekeler Deportment of Mining Engineering, Cumhuriyet University, Sivas, Turkey
ABSTRACT: Flotation is one of the most important physicochemical processes for mineral separations and other recovery operations. Flotation machines have been developed since the beginning of the 19 century and are still under intensive research and development. The devised cell is a combination of the Canadian Column Flotation Cell and Partridge-Smith Cell. The materials used for the construction of the newly-designed cell are cheap and available laboratory accessories and aquarium materials. The cell functions well in terms of its scale, the small samples required and control. It can be used anywhere in the laboratory for research and in the classroom for demonstrations of experiments. Some of the data obtained using this cell by the flotation method are in good agreement with the contact angles method measured independently on the same minerals. The measurements obtained in our experiments are comparable to those previously published for the same minerals used.
1 INTRODUCTION
Flotation is one of the most important physicochemical separation processes, used largely İn mineral separation operations. This method is not only used in mineral concentration and recovery operations, but also in water treatment and purification, the recycling of secondary materials, and the recovery of ionic and colloidal materials from aqueous solutions (Yarar, 1988a).
Flotation is a process for separating finely-ground minerals or solids dispersed in water (their slurry densities are usually 10-30% by weight) from associated worthless minerals or gangues. It is based on the adhesion of the minerals to air bubbles that are generated in the pulp. These air bubbles carry the floatable minerals or solids to the flotation cell surface, where they are taken as valuable solids or minerals referred to as 'concentrates*. The solids or minerals which do not float with the air bubbles stay in the pulp or at the cell bottom. They are known as 'tailings'(Weiss, 1985).
Flotation machines are made of a cell equipped with air, solution and mineral entry parts and exit parts. These machines perform the following functions:
- mixing and agitation of the slurry, - aeration and promotion of particle-bubble
collisions, - formation of a froth layer and its removal for
product recovery,
- continuous discharge of tailings. A new version of an old flotation cell has led to
the development of column flotation cells. These cells perform a good job of separating the highly hydrophobic minerals from their associated hydrophilic minerals (Yarar, 1988a).
2 THEORETICAL CONSIDERATIONS
The wettability characteristics of mineral surfaces can be defined in terms of their critical surface tension of wetting values (yc) to achieve selectivity in froth flotation, adhesion and welding. Therefore, the yc values of minerals can be used as a measure of their flotation behavior and response. The floatability or wettability characteristics of solids or minerals are estimated quantitatively by a number of experimental and empirical techniques. This quantifying parameter mentioned above is die critical surface tension of the wetting (y.) values of minerals or solids (Yekeler & Yarar, 1994a). The Zisman contact angle measurement technique and the flotation method are die two major techniques used to determine the Yc values of minerals among these experimental and empirical techniques (Kelebek, 1987, Yarar, 1988b, Parekh & Apian, 1974, Williams & Fuerstenau, 1986, Yekeleri Yarar, 1994b). The Zisman method, which uses a plot of Cos 6 (where 8 is the contact angle) against YLv (where ftv is the solution surface
759
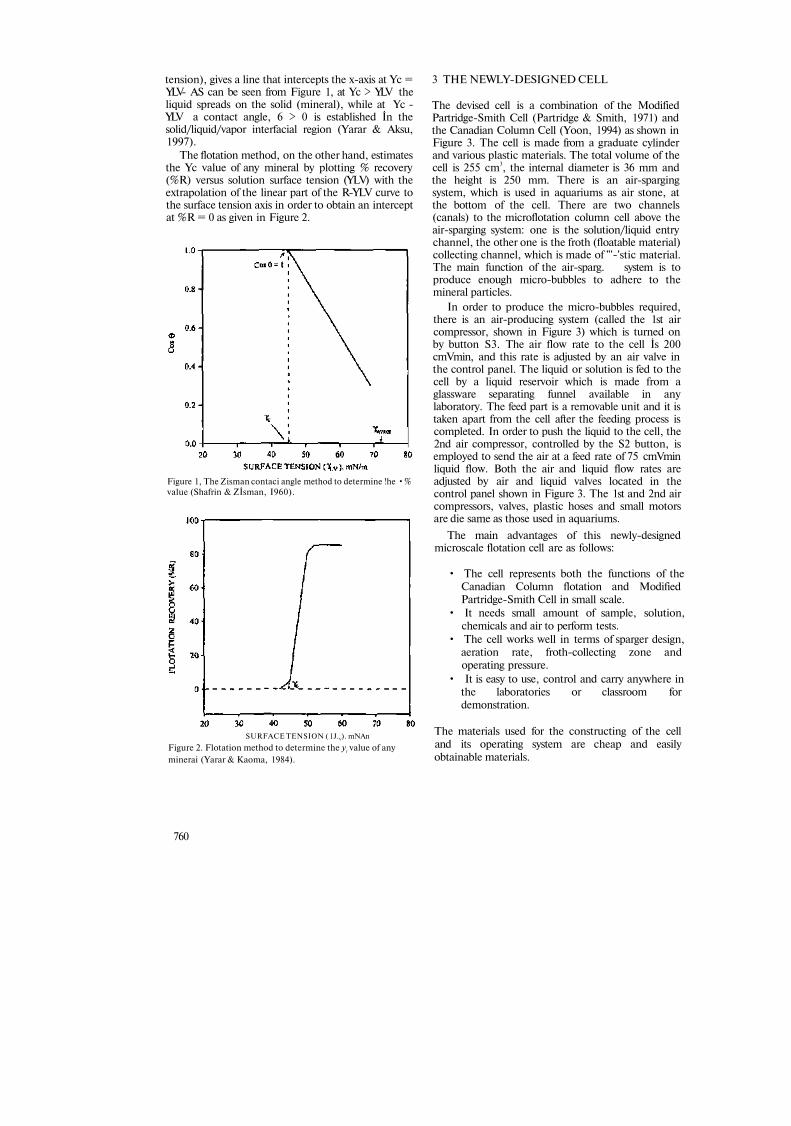
tension), gives a line that intercepts the x-axis at Yc = YLV- AS can be seen from Figure 1, at Yc > YLV the liquid spreads on the solid (mineral), while at Yc -YLV a contact angle, 6 > 0 is established İn the solid/liquid/vapor interfacial region (Yarar & Aksu, 1997).
The flotation method, on the other hand, estimates the Yc value of any mineral by plotting % recovery (%R) versus solution surface tension (YLV) with the extrapolation of the linear part of the R-YLV curve to the surface tension axis in order to obtain an intercept at %R = 0 as given in Figure 2.
3 THE NEWLY-DESIGNED CELL
Figure 1, The Zisman contaci angle method to determine !he •% value (Shafrin & Zİsman, I960).
SURFACE TENSION ( 1J.V). mNAn
Figure 2. Flotation method to determine the yt value of any minerai (Yarar & Kaoma, 1984).
The devised cell is a combination of the Modified Partridge-Smith Cell (Partridge & Smith, 1971) and the Canadian Column Cell (Yoon, 1994) as shown in Figure 3. The cell is made from a graduate cylinder and various plastic materials. The total volume of the cell is 255 cm3, the internal diameter is 36 mm and the height is 250 mm. There is an air-sparging system, which is used in aquariums as air stone, at the bottom of the cell. There are two channels (canals) to the microflotation column cell above the air-sparging system: one is the solution/liquid entry channel, the other one is the froth (floatable material) collecting channel, which is made of "'-'stic material. The main function of the air-sparg. system is to produce enough micro-bubbles to adhere to the mineral particles.
In order to produce the micro-bubbles required, there is an air-producing system (called the 1st air compressor, shown in Figure 3) which is turned on by button S3. The air flow rate to the cell İs 200 cmVmin, and this rate is adjusted by an air valve in the control panel. The liquid or solution is fed to the cell by a liquid reservoir which is made from a glassware separating funnel available in any laboratory. The feed part is a removable unit and it is taken apart from the cell after the feeding process is completed. In order to push the liquid to the cell, the 2nd air compressor, controlled by the S2 button, is employed to send the air at a feed rate of 75 cmVmin liquid flow. Both the air and liquid flow rates are adjusted by air and liquid valves located in the control panel shown in Figure 3. The 1st and 2nd air compressors, valves, plastic hoses and small motors are die same as those used in aquariums.
The main advantages of this newly-designed microscale flotation cell are as follows:
• The cell represents both the functions of the Canadian Column flotation and Modified Partridge-Smith Cell in small scale.
• It needs small amount of sample, solution, chemicals and air to perform tests.
• The cell works well in terms of sparger design, aeration rate, froth-collecting zone and operating pressure.
• It is easy to use, control and carry anywhere in the laboratories or classroom for demonstration.
The materials used for the constructing of the cell and its operating system are cheap and easily obtainable materials.
760
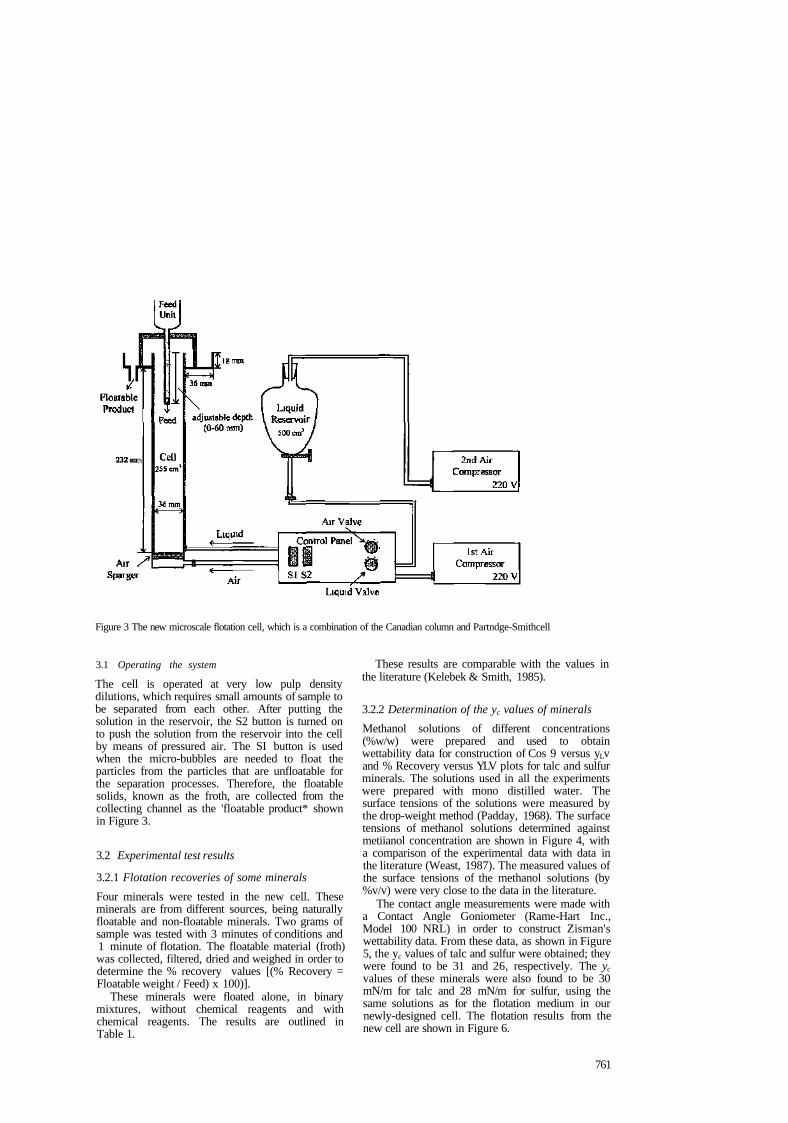
Figure 3 The new microscale flotation cell, which is a combination of the Canadian column and Partndge-Smithcell
3.1 Operating the system
The cell is operated at very low pulp density dilutions, which requires small amounts of sample to be separated from each other. After putting the solution in the reservoir, the S2 button is turned on to push the solution from the reservoir into the cell by means of pressured air. The SI button is used when the micro-bubbles are needed to float the particles from the particles that are unfloatable for the separation processes. Therefore, the floatable solids, known as the froth, are collected from the collecting channel as the 'floatable product* shown in Figure 3.
3.2 Experimental test results
3.2.1 Flotation recoveries of some minerals Four minerals were tested in the new cell. These minerals are from different sources, being naturally floatable and non-floatable minerals. Two grams of sample was tested with 3 minutes of conditions and 1 minute of flotation. The floatable material (froth) was collected, filtered, dried and weighed in order to determine the % recovery values [(% Recovery = Floatable weight / Feed) x 100)].
These minerals were floated alone, in binary mixtures, without chemical reagents and with chemical reagents. The results are outlined in Table 1.
These results are comparable with the values in the literature (Kelebek & Smith, 1985).
3.2.2 Determination of the yc values of minerals Methanol solutions of different concentrations (%w/w) were prepared and used to obtain wettability data for construction of Cos 9 versus yLv and % Recovery versus YLV plots for talc and sulfur minerals. The solutions used in all the experiments were prepared with mono distilled water. The surface tensions of the solutions were measured by the drop-weight method (Padday, 1968). The surface tensions of methanol solutions determined against metiianol concentration are shown in Figure 4, with a comparison of the experimental data with data in the literature (Weast, 1987). The measured values of the surface tensions of the methanol solutions (by %v/v) were very close to the data in the literature.
The contact angle measurements were made with a Contact Angle Goniometer (Rame-Hart Inc., Model 100 NRL) in order to construct Zisman's wettability data. From these data, as shown in Figure 5, the yc values of talc and sulfur were obtained; they were found to be 31 and 26, respectively. The yc values of these minerals were also found to be 30 mN/m for talc and 28 mN/m for sulfur, using the same solutions as for the flotation medium in our newly-designed cell. The flotation results from the new cell are shown in Figure 6.
761
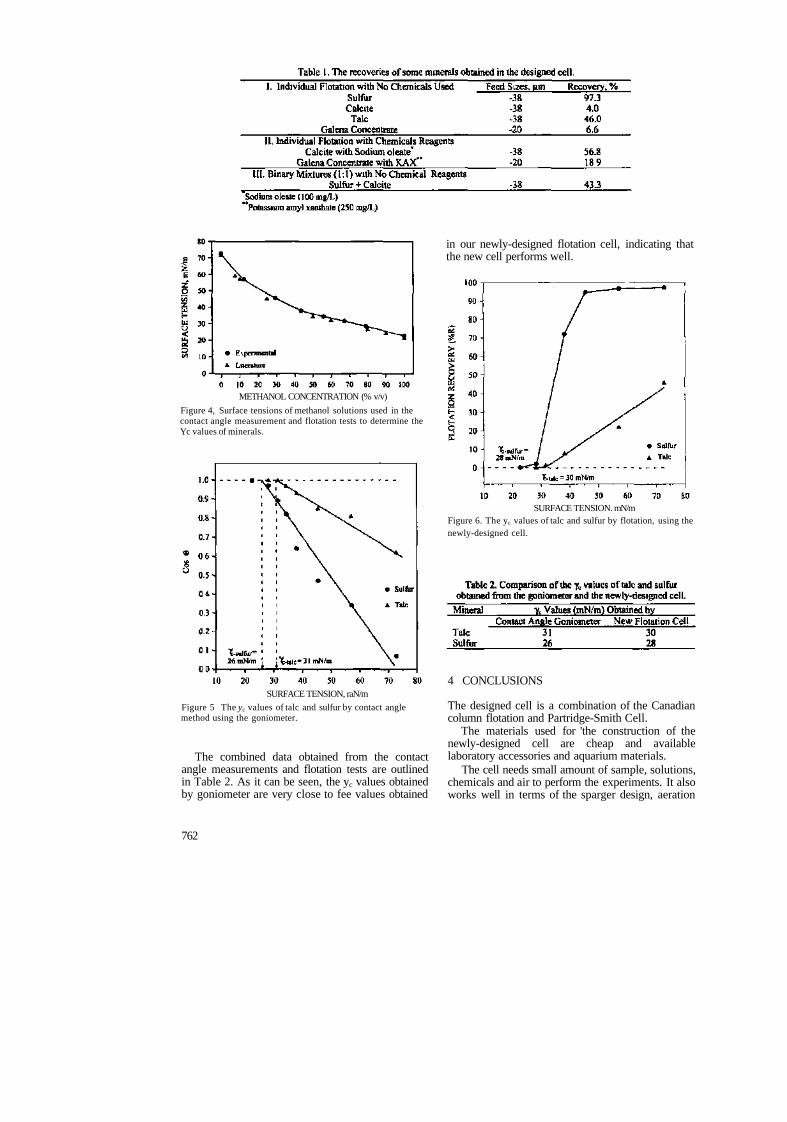
METHANOL CONCENTRATION (% v/v) Figure 4, Surface tensions of methanol solutions used in the contact angle measurement and flotation tests to determine the Yc values of minerals.
SURFACE TENSION, raN/m Figure 5 The yc values of talc and sulfur by contact angle method using the goniometer.
The combined data obtained from the contact angle measurements and flotation tests are outlined in Table 2. As it can be seen, the yc values obtained by goniometer are very close to fee values obtained
in our newly-designed flotation cell, indicating that the new cell performs well.
SURFACE TENSION. mN/m Figure 6. The yc values of talc and sulfur by flotation, using the newly-designed cell.
4 CONCLUSIONS
The designed cell is a combination of the Canadian column flotation and Partridge-Smith Cell.
The materials used for 'the construction of the newly-designed cell are cheap and available laboratory accessories and aquarium materials.
The cell needs small amount of sample, solutions, chemicals and air to perform the experiments. It also works well in terms of the sparger design, aeration
762
rate, froth-collecting zone and operating pressure. Therefore, it is easy to use, control and carry this cell anywhere in the laboratory or classroom for demonstrations.
The quantitative test results obtained from this cell are in good agreement with those obtained with other techniques and equipment.
REFERENCES
Kelebek, S. & Smith, G.W. 1985. Selective flotation of inherently hydrophobic minerals by controlling the air/solution interfacial tensions. Inl. Journal of Mineral Processing. 14:275-278.
Kelebek, S. 1987. Critical surface tension of wetting and of floatability of molybdenite and sulfur. J. of Coll. and Int. Science. 124:504-514.
Padday, J.F. 1969. Surface tension. Part II. The measurement of surface tension. Surface and Colloidal Science. 1: 101-149, New York.
Parekh, B.K. & Apian, F.F. 1974. Wetting properties of minerals coated with surfactants. Proc. of Chetn. Inst. Canada. Flocculation+Dispersion Symposium: 21-35, Toronto.
Partridge, A.C. & Smith, G.W. 197I. Small-sample flotation testing: A new cell. Trans. Inst. Min. Metall. 80: Cl 99-C200.
Shafrin, E.G. & Zisman, W.A. 1960. Constitutive relations in the wetting of low energy surfaces and the theory of the
retraction method of preparing monolayers. J. of Pky. Chem. 64: 519-524.
Weast, R.C. 1987. Handbook of Chemistry and Physics. 68th ed. New York: CRS Press.
Weiss, N.L. 1985. Flotation Mineral Processing Handbook. Vol. 1, New York: SME.
Williams, M.C. & Fuerstenau, D.W. 1987. A simple flotation method for rapidly assessing the hydrophobicity of coal particles. Int. J. of Min. Proc. 20: 153-157.
Yarar, B. & Kaoma, J. 1984. Estimation of the critical surface tension of wetting of hydrophobic solids by flotation. Colloids & Surfaces. 11: 426-429.
Yarar, B. 1988a. Flotation. Ullmanns's Encyclopedia of Ind. Chemistry, VCH VerlagsgesellschaftmbH, D-6940, Weinheim.
Yarar, B. 1988b. Gamma flotation: a new approach to flotation, using liquid-vapor surface tension control. Developments in Min. Proc.: 41-64.
Yarar, B. & Aksu, S. 1997. Quantification of the roles of surface heterogeneity and roughness in the establishment of the critical surface tension of wetting of hydrophobic solids. Proceedings of the XX. IMPC: 41-51, Aechen, Germany.
Yekeler, M. & Yarar, B. 1994a. Critical surface tensions of wetting of low surface energy minerals and their separations by Gamma flotation: realgar, talc, stibnite and sulfur. SME Annual Meeting.: Preprint number: 94-17, Albuquerque, New Mexico, USA.
Yekeler, M. & Yarar, B. 1994b. Techniques for assessing the floatability characteristics of minerals. Çukurova Univ. Müh.-Mim. Fak. 15. Yyl Sempozyumu: 473-480.
Yoon, RH. 1994. Column Flotation Seminar Notes, ITU Mining Engineering Dept., Istanbul.
763

17th International Mining Congress and Exhibition of Turkey- IMCET2001, ©2001, ISBN 975-395-417-4
Concentration Studies on Chromite Tailings by Multi Gravity Separator
Ş.G.Özkan & B.İpekoğlu Istanbul University, Engineering Faculty, Mining Eng. Dept., 34850, Avcilar, Istanbul, Türkiye
ABSTRACT: In this study, a representative sample was obtained from Uckopru mine in Türkiye in order to beneficiate fine-sized chromite tailings. Physical and chemical analyses showed that while the whole tailings contained l2.80%Cr2O3 (100% by weight), the particle size fraction of minus 38 microns contained 25.20%Cr2O3 (33.20% by weight) and the particle size fraction of plus 38 microns contained 6.64%Cr203
(66.80% by weight). The mineralogical investigations revealed that the sample contained chromite and serpentine group minerals as its main components. For concentration purposes, a Multi Gravity Separator was used for chromite fines in the experiments. The best results using the MGS device for the sample of minus 38 microns were obtained under the following conditions: angle, 2°; frequency, 5.7 cpm; amplitude, 15 mm; and drum speed, 230 rpm. These conditions gave a chromite grade of 47 %Cr203 with fairly high recovery of 72%.
1 INTRODUCTION
It is a well-known fact that Türkiye is one of the major chromite producers in the world. Approximately a million tons of chromite ore are mined and processed for further metallurgical treatment and use in the country. Large amounts of fine-sized chromite tailings naturally occur during production and processing, and this causes severe environmental hazards as well as source losses due to the high chromite content.
There have been numerous research studies, Guney (1990), Guney et al. (1991), (1992), (1993), Ozdag et al. (1993), (1994), Ucbas and Ozdag (1994), Guney et al. (1994), Gui et al. (1995), Cicek et al. (1998), Sönmez and Turgut (1998), Gence (1999), on the beneficiation of these tailings in recent years. The Uckopru Mine of Eti Holding in particular was thoroughly investigated with regard to roughly a million tons of fine-sized chromite tailings that have been stored there for about a 100 years, and several treatment techniques have been developed for fine tailings, such as column flotation and gravity concentration devices.
For the reasons given above, beneficiation experiments were carried out on samples of fine-sized chromite tailings from Eti Holding's Uckopru Mine by the Mining Engineering Department of Istanbul University.
2 MATERIAL AND METHODS
In this study, about 120 kg of representative sample was obtained from Eti Holding in order to evaluate fine-sized chromite tailings. It was determined by physical and chemical analyses that while the whole tailings sample contained 12.80% Cr 20 3 (100% by weight), the particle size fraction of minus 38 microns contained 25.20% Cr 20 3 (33.20 % by weight) and the particle size fraction of plus 38 microns contained 6.64% Cr 20 3 (66.80 % by weight). The sample preparation flowsheet İs given İn Figure 1 in detail. The complete mineralogical investigations showed that the sample contained chromite and serpentine group minerals (crizotile, antigorite, olivine, pyroxene and tremolite) as its main components. The results of the complete chemical analyses according to particle size classification in a 38-micron sieve are also given in Table 1. Moisture analysis showed that the sample contained roughly 8 % moisture in the form it was obtained and that it could be dried and lose its moisture in a 24-hour period. In order to determine the particle size distribution of the sample prior to concentration, a screening analysis was performed and the results are shown in Table 2.
765
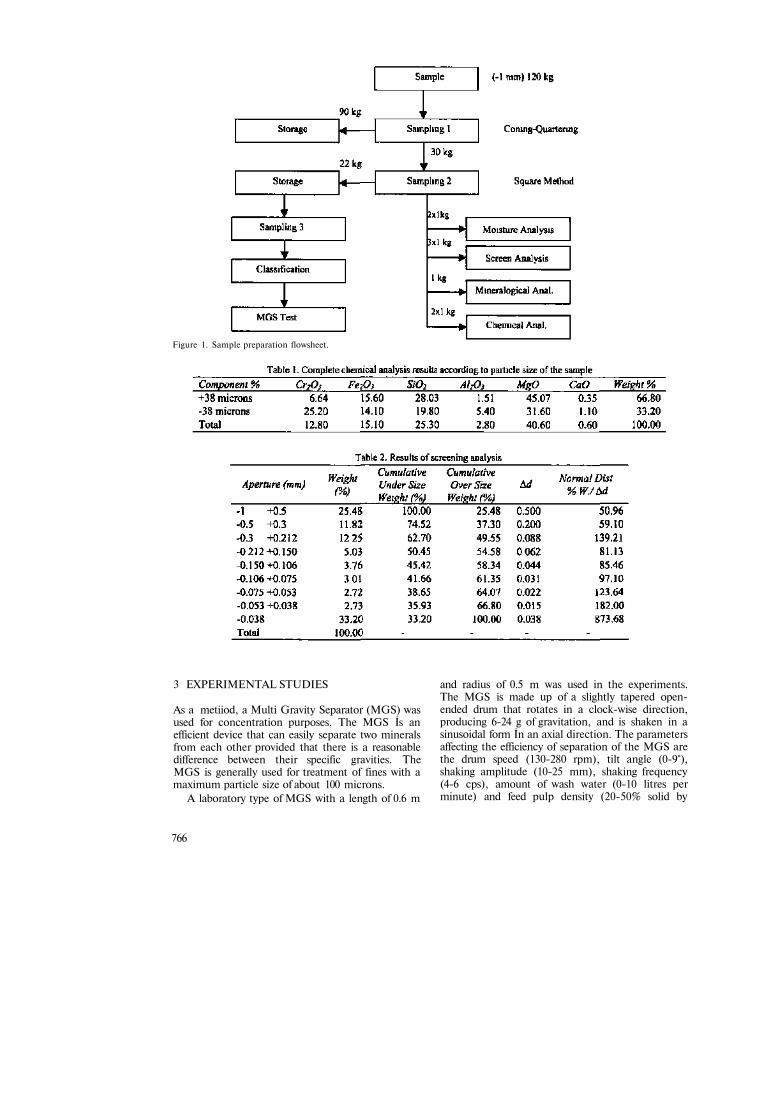
Figure 1. Sample preparation flowsheet.
3 EXPERIMENTAL STUDIES
As a metiiod, a Multi Gravity Separator (MGS) was used for concentration purposes. The MGS İs an efficient device that can easily separate two minerals from each other provided that there is a reasonable difference between their specific gravities. The MGS is generally used for treatment of fines with a maximum particle size of about 100 microns.
A laboratory type of MGS with a length of 0.6 m
and radius of 0.5 m was used in the experiments. The MGS is made up of a slightly tapered open-ended drum that rotates in a clock-wise direction, producing 6-24 g of gravitation, and is shaken in a sinusoidal form İn an axial direction. The parameters affecting the efficiency of separation of the MGS are the drum speed (130-280 rpm), tilt angle (0-9°), shaking amplitude (10-25 mm), shaking frequency (4-6 cps), amount of wash water (0-10 litres per minute) and feed pulp density (20-50% solid by
766
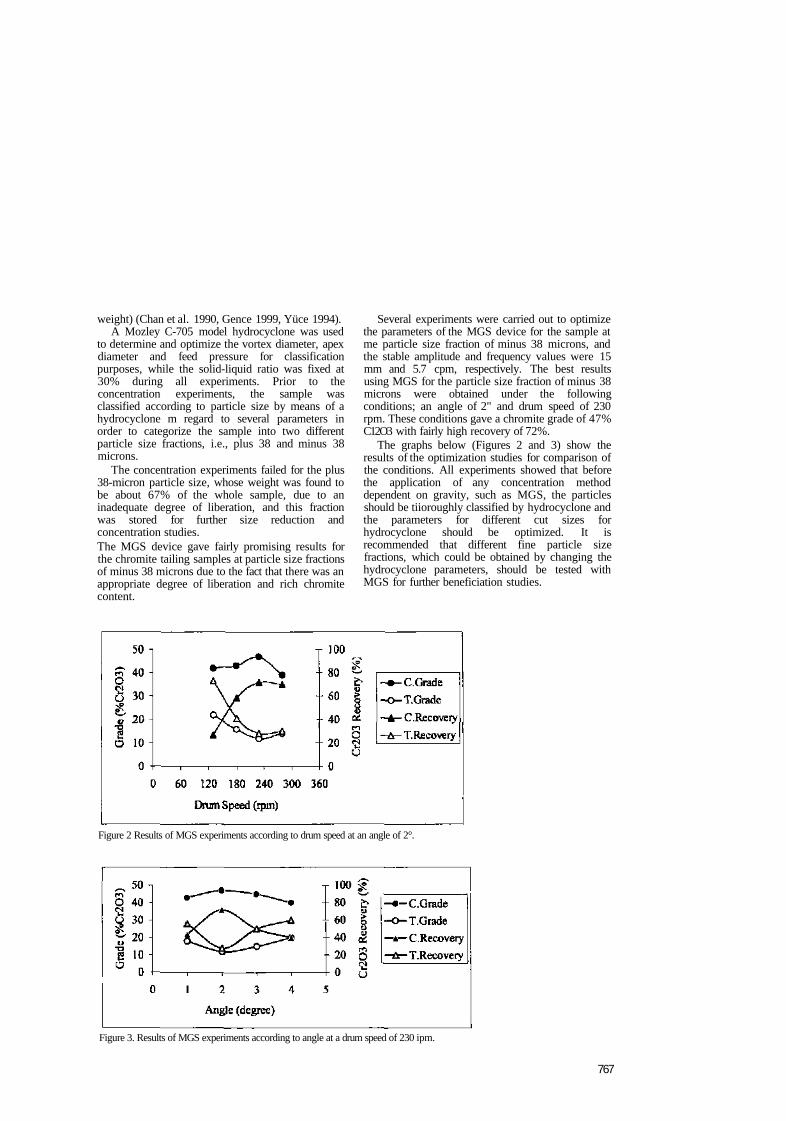
weight) (Chan et al. 1990, Gence 1999, Yüce 1994). A Mozley C-705 model hydrocyclone was used
to determine and optimize the vortex diameter, apex diameter and feed pressure for classification purposes, while the solid-liquid ratio was fixed at 30% during all experiments. Prior to the concentration experiments, the sample was classified according to particle size by means of a hydrocyclone m regard to several parameters in order to categorize the sample into two different particle size fractions, i.e., plus 38 and minus 38 microns.
The concentration experiments failed for the plus 38-micron particle size, whose weight was found to be about 67% of the whole sample, due to an inadequate degree of liberation, and this fraction was stored for further size reduction and concentration studies. The MGS device gave fairly promising results for the chromite tailing samples at particle size fractions of minus 38 microns due to the fact that there was an appropriate degree of liberation and rich chromite content.
Several experiments were carried out to optimize the parameters of the MGS device for the sample at me particle size fraction of minus 38 microns, and the stable amplitude and frequency values were 15 mm and 5.7 cpm, respectively. The best results using MGS for the particle size fraction of minus 38 microns were obtained under the following conditions; an angle of 2" and drum speed of 230 rpm. These conditions gave a chromite grade of 47% C12O3 with fairly high recovery of 72%.
The graphs below (Figures 2 and 3) show the results of the optimization studies for comparison of the conditions. All experiments showed that before the application of any concentration method dependent on gravity, such as MGS, the particles should be tiioroughly classified by hydrocyclone and the parameters for different cut sizes for hydrocyclone should be optimized. It is recommended that different fine particle size fractions, which could be obtained by changing the hydrocyclone parameters, should be tested with MGS for further beneficiation studies.
Figure 2 Results of MGS experiments according to drum speed at an angle of 2°.
Figure 3. Results of MGS experiments according to angle at a drum speed of 230 ipm.
767
4 DISCUSSION AND CONCLUSION
Beneficiation experiments were carried out on samples of chromite tailings from Eti Holding's Uckopru Mine. It was determined by chemical analyses that while the whole tailings sample contained 12.80 % CrjOî, the particle size fraction of minus 38 microns contained 25.20 % C ^ O Î and the particle size fraction of plus 38 microns contained 6.64 % CrıOî. The complete mineralogical investigations showed that the sample contained chromite and serpentine group minerals (crizotile, antigorite, olivine, pyroxene and tremolite) as its main components.
For classification purposes, a Mozley C-705 model hydrocyclone was used in the present study. The cycloning tests were used to optimize the vortex diameter, apex diameter and feed pressure, while the solid-liquid ratio was fixed at 30 % during all experiments.
For concentration purposes a MGS device was utilised, and this separator gave fairly promising results for the chromite tailing samples at particle size fractions of minus 38 microns due to the presence of an appropriate degree of liberation and rich chromite grade.
The best results using MGS for the particle size fraction of minus 38 microns were obtained under the conditions: angle, 2°; frequency, 5.7 cpm; amplitude, 15 mm; and drum speed, 230 rpm. These conditions gave a chromite grade of 47 % C^Oji with fairly high recovery of 72 %.
When the tests were performed for plus 38-micron fractions, the results were considerably lower than the test results for the minus 38 microns; therefore, the coarse fractions were stored for future evaluations after size reduction.
Finally, all experiments showed that before the application of any concentration method dependent on gravity, such as MGS, the particles should be thoroughly classified by hydrocyclone and the parameters for different cut sizes for hydrocyclone should be optimized. It is recommended that different fine particle size fractions, which could be obtained by changing the hydrocyclone parameters, should be tested using MGS for further beneficiation studies.
ACKNOWLEDGMENTS
"This work was supported by the Research Fund of Istanbul University. Project number: 1207/070998"
The authors would like 10 thank Mr. Hasan CEB). Mr. Tahsin TUFAN, Mr. Faruk ESKIBALCI, Mr. Kenan CINKU and Miss Tansel DOGAN for their great help during the concentration and chemical analysis tesis of the current study.
REFERENCES
Chan, S.S.K. et al. 1990. The Multi-gravity separator (MGS), A mine scala machine, 20 p., Richard Mozley Ltd, Redruth, Cornwall, England
Cicek, T. et al. 1998. Gravimetric concentration of fine chromite tailings. Innovation in mineral and coal processing, pp 751-736, Atak, Onaî and Celik (eds), Balkema, Rotterdam, The Netherlands
Gence, N. 1999. Beneficiation of Elazig-Kefdag chromite by multi-gravity separator, Tr. J. of Engineering and Environmental Sciences, 23(1999)473-475
Gui, A. et al. 1995. Evaluation of low grade chromite ores from Adana-Karsanti region, The 14'11 Turkish Mining Congress, Chamber of Mining Engineers of Turkey, (Turkish text)
Guney, A. et al. 1994. Flotation of fine chromite tailings using novel techniques, Progress in mineral processing technology, pp 473-477, Demirel and Ersayin (eds), Balkema. Rotterdam, The Netherlands
Guney, A. el al. 1993. The mechanism of anionic collector adsorption in chromite flotation. The 18th International Mineral Processing Congress, Sydney, Australia
Guney. A. et al. 1992. Concentration of chromite gravity tailings by free jet type and column flotation system. Proceedings of the first international conference on modem process mineralogy and mineral processing, Beijing, China
Guney, A. et al. 1991. Beneficiation of Etibank Uckopru chromite tailings by column flotation, Column 91, Proceedings of International Conference on Column Flotation, Vol. I, pp 211 -219, Sudbury, Ontario, Canada
Guney, A. 1990. Concentration of fine sized chromite from the wastes of Etibank Uckopru chromite concentration plant, Ph.D. Thesis, Istanbul Technical University, Istanbul, Turkey, (Turkish text)
Ozdag, H. etal. 1993. Enrichment of chromite ore by means of multi-gravity separator, Yerbilimleri Dergisi (Geosound), No: 23, Çukurova University, Adana, Turkey
Ozdag, H. et al. 1994. Enrichment of chromite from slimes and tailings of shaking tables by multi gravity separator, Innovation of Mineral Processing, pp 267, Sudbury, Canada
Sönmez, E. and Turgut, B. 1998. Enrichment of low-grade Karaburhan chromite ores by gravitational methods, Innovation in mineral and coal processing, pp 723-726, Atak, Onal and Celik (eds), Balkema, Rotterdam, The Netherlands
Ucbas, V. and Ozdag, H. 1994. Relationships between shake frequency and amplitude in the concentration of chromite fines by multi-gravity separator. Progress in mineral processing technology, pp 71-76, Demirel and Ersayin (eds), Balkema, Rotterdam, The Netherlands
Yüce, A.E. 1994. The Mulli Gravity Separator, Madencilik (Mining) Dergisi, March issue, Ankara, Turkey, (Turkish text)
768
17th International Mining Congress and Exhibition of Turkey- IMCET 2001, ©2001, ISBN 975-395-417-4
Influence of Coal Face Mechanization on the Properties of Çayirhan Lignite
A.Özder General Directorate of Turkish Coal Enterprises, Ankara, Turkey
G.Özbayoğlu Department of Mining Engineering, Middle East Technical University, Ankara, Turkey
ABSTRACT; The influence of coal face mechanization on the properties of r.o.m. coal - size, ash, sulfur, and moisture contents, volatile matter and calorific values - were investigated at Çayirhan (Ankara). Representative samples were obtained from r.o.m. coal and channel samples from two seams of panel A03 of Çayirhan Underground Coal Mine and chemically and physically analyzed. In addition, samples from roof and floor rock layers, which were unavoidably mixed with r.o.m. coal during mining operations, were taken and analyzed. The results show that the amount of fines and the ash, sulfur, and moisture contents of r.o.m coal in mechanized panels of Çayirhan Underground Coal Mine have increased, while the calorific value has decreased.
I INTRODUCTION
In order to improve working conditions and safety, increase production levels and decrease unit cost of production, it is essential to make use of up-to-date coal mining techniques, machinery and equipment in underground coal mines.
In current conditions, Turkey is not able to meet the demand for energy using only domestic sources. In the current situation, only around 33% of Turkey's energy needs are fulfilled by domestic sources. Turkey, with an annual population growth rate of 1.5% and an average annual growth rate in electricity required of 8.5%, is likely to be more and more dependent upon imported energy sources in the next few years (Özder et al, 1999). In addition, Turkish Coal Enterprises foresee that most of the open pit reserves in the country will have been mined within the next 10 years. In order to attain planned levels of coal production, underground coal reserves gain special attention. According to TKI, in the next 10 years and beyond, more coal is to be mined from underground mines. In addition to all this, due to the growing pressure resulting from environmental concerns, all products must be cleaner and more environmentally friendly than the ones produced in the past.
Therefore, to meet the demand of 2x150 MW power plants, the first fully mechanized panel went into operation İn Çayirhan Underground Coal Mine in 1986.
Despite the fact that the study presented here was carried out in 1990, due to the rapid depletion of open-pit reserves and the necessity of designing more underground mines in the next coming years, the subject is still important and valid All of the results of the analyses show that coal samples from mechanized faces are inferior to channel coal samples. Therefore, the results are significant for mines faced with transition from open-pit coal mining to underground coal mining.
2 GENERAL INFORMATION ABOUT THE MINE
2.1 Location of the mine
The area under consideration lies within the boundaries of the Ankara and Bolu provinces. Çayirhan is 125 km away from Ankara. The altitude of the region is approximately 1000 m.
2.2 Coal seam
Çayirhan Underground Coal Mine consists of two overlying lignite seams separated by an innerburden (interbedded siltstone layer) of 80 cm in average thickness. The upper seam is around 1.70 m thick and the lower seam is 1.80 m thick. A simplified section, showing the seams and the innerburden strata is shown in Figure I.
769
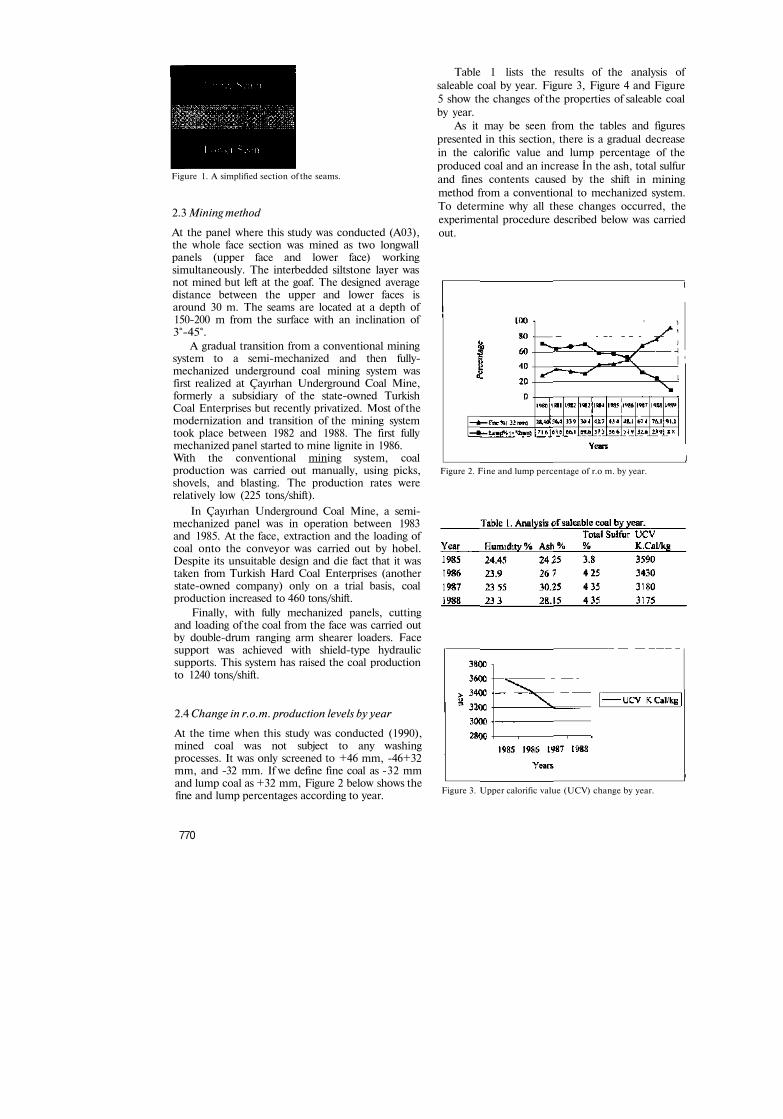
Figure 1. A simplified section of the seams.
2.3 Mining method
At the panel where this study was conducted (A03), the whole face section was mined as two longwall panels (upper face and lower face) working simultaneously. The interbedded siltstone layer was not mined but left at the goaf. The designed average distance between the upper and lower faces is around 30 m. The seams are located at a depth of 150-200 m from the surface with an inclination of 3°-45°.
A gradual transition from a conventional mining system to a semi-mechanized and then fully-mechanized underground coal mining system was first realized at Çayırhan Underground Coal Mine, formerly a subsidiary of the state-owned Turkish Coal Enterprises but recently privatized. Most of the modernization and transition of the mining system took place between 1982 and 1988. The first fully mechanized panel started to mine lignite in 1986. With the conventional mining system, coal production was carried out manually, using picks, shovels, and blasting. The production rates were relatively low (225 tons/shift).
In Çayırhan Underground Coal Mine, a semi-mechanized panel was in operation between 1983 and 1985. At the face, extraction and the loading of coal onto the conveyor was carried out by hobel. Despite its unsuitable design and die fact that it was taken from Turkish Hard Coal Enterprises (another state-owned company) only on a trial basis, coal production increased to 460 tons/shift.
Finally, with fully mechanized panels, cutting and loading of the coal from the face was carried out by double-drum ranging arm shearer loaders. Face support was achieved with shield-type hydraulic supports. This system has raised the coal production to 1240 tons/shift.
2.4 Change in r.o.m. production levels by year
At the time when this study was conducted (1990), mined coal was not subject to any washing processes. It was only screened to +46 mm, -46+32 mm, and -32 mm. If we define fine coal as -32 mm and lump coal as +32 mm, Figure 2 below shows the fine and lump percentages according to year.
Table 1 lists the results of the analysis of saleable coal by year. Figure 3, Figure 4 and Figure 5 show the changes of the properties of saleable coal by year.
As it may be seen from the tables and figures presented in this section, there is a gradual decrease in the calorific value and lump percentage of the produced coal and an increase İn the ash, total sulfur and fines contents caused by the shift in mining method from a conventional to mechanized system. To determine why all these changes occurred, the experimental procedure described below was carried out.
Figure 2. Fine and lump percentage of r.o m. by year.
Figure 3. Upper calorific value (UCV) change by year.
770
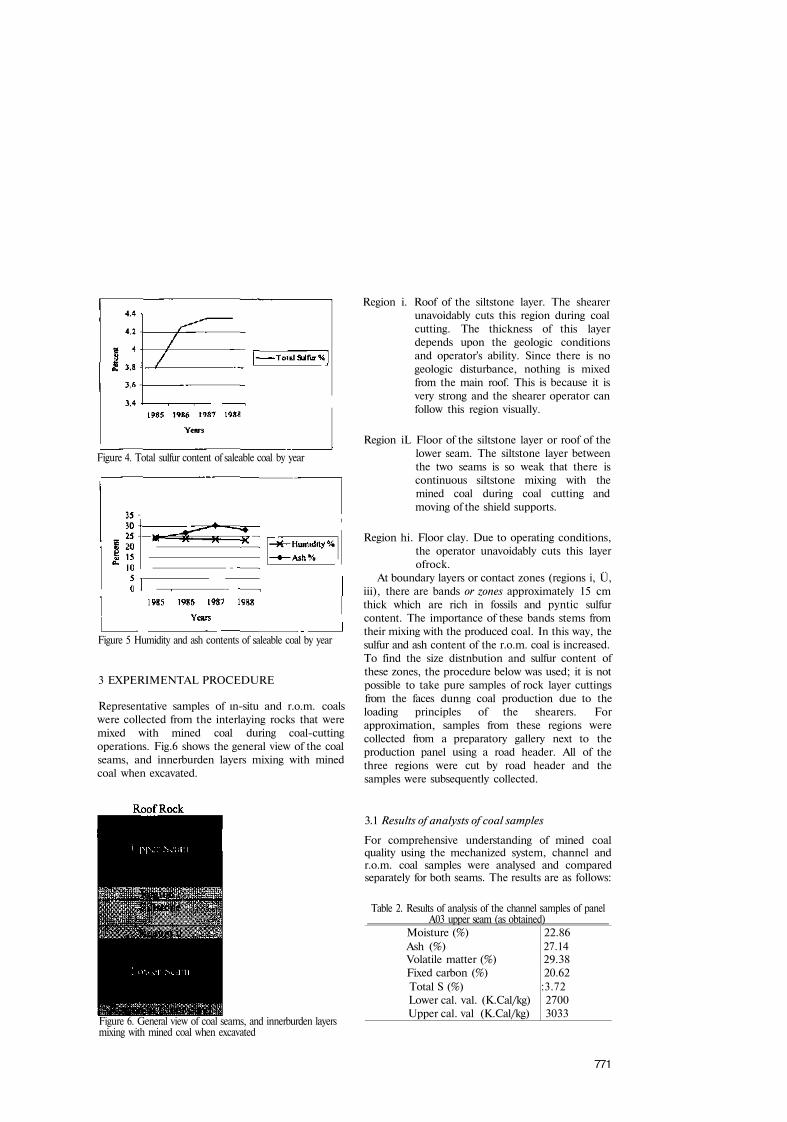
Figure 4. Total sulfur content of saleable coal by year
Figure 5 Humidity and ash contents of saleable coal by year
3 EXPERIMENTAL PROCEDURE
Representative samples of ın-situ and r.o.m. coals were collected from the interlaying rocks that were mixed with mined coal during coal-cutting operations. Fig.6 shows the general view of the coal seams, and innerburden layers mixing with mined coal when excavated.
Region i. Roof of the siltstone layer. The shearer unavoidably cuts this region during coal cutting. The thickness of this layer depends upon the geologic conditions and operator's ability. Since there is no geologic disturbance, nothing is mixed from the main roof. This is because it is very strong and the shearer operator can follow this region visually.
Region iL Floor of the siltstone layer or roof of the lower seam. The siltstone layer between the two seams is so weak that there is continuous siltstone mixing with the mined coal during coal cutting and moving of the shield supports.
Region hi. Floor clay. Due to operating conditions, the operator unavoidably cuts this layer ofrock.
At boundary layers or contact zones (regions i, Ü, iii), there are bands or zones approximately 15 cm thick which are rich in fossils and pyntic sulfur content. The importance of these bands stems from their mixing with the produced coal. In this way, the sulfur and ash content of the r.o.m. coal is increased. To find the size distnbution and sulfur content of these zones, the procedure below was used; it is not possible to take pure samples of rock layer cuttings from the faces dunng coal production due to the loading principles of the shearers. For approximation, samples from these regions were collected from a preparatory gallery next to the production panel using a road header. All of the three regions were cut by road header and the samples were subsequently collected.
Figure 6. General view of coal seams, and innerburden layers mixing with mined coal when excavated
3.1 Results of analysts of coal samples
For comprehensive understanding of mined coal quality using the mechanized system, channel and r.o.m. coal samples were analysed and compared separately for both seams. The results are as follows:
Table 2. Results of analysis of the channel samples of panel A03 upper seam (as obtained)
Moisture (%) Ash (%) Volatile matter (%) Fixed carbon (%) Total S (%) Lower cal. val. (K.Cal/kg) Upper cal. val (K.Cal/kg)
22.86 27.14 29.38 20.62
:3.72 2700 3033
771
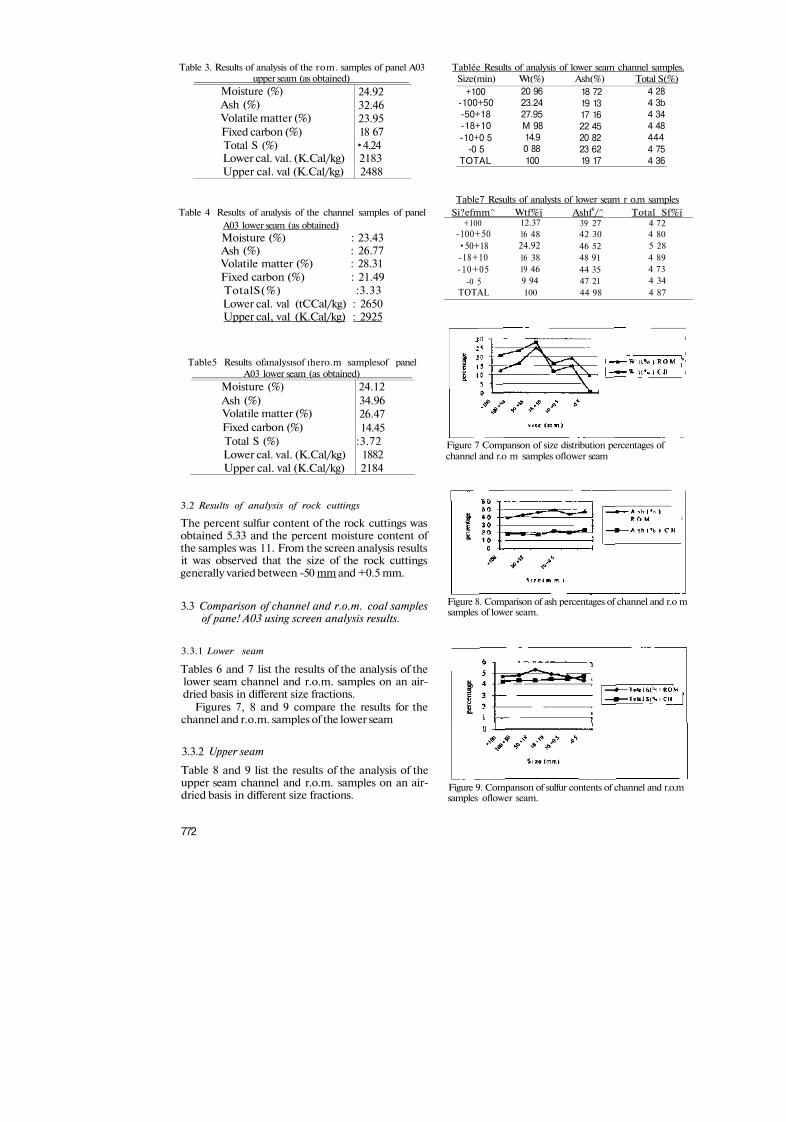
Table 3. Results of analysis of the rom. samples of panel A03 upper seam (as obtained)
Moisture (%) Ash (%) Volatile matter (%) Fixed carbon (%) Total S (%) Lower cal. val. (K.Cal/kg) Upper cal. val (K.Cal/kg)
24.92 32.46 23.95 18 67
•4.24 2183 2488
Tablée Results of analysis of lower seam channel samples. Size(min) Wt(%) Ash(%) Total S(%)
+100 -100+50 -50+18 -18+10 -10+0 5
-0 5 TOTAL
20 96 23.24 27.95 M 98 14.9 0 88 100
18 72 19 13 17 16 22 45 20 82 23 62 19 17
4 28 4 3b 4 34 4 48 444 4 75 4 36
Table7 Results of analysts of lower seam r o.m samples Table 4 Results of analysis of the channel samples of panel Si?efmm^ Wtf%ï Ashf0/^ Total Sf%ï
A03 lower seam (as obtained) Moisture (%) : 23.43 Ash (%) : 26.77 Volatile matter (%) : 28.31 Fixed carbon (%) : 21.49 TotalS(%) :3.33 Lower cal. val (tCCal/kg) : 2650 Upper cal, val (K.Cal/kg) : 2925
Table5 Results ofanalysısof ıhero.m samplesof panel A03 lower seam (as obtained)
Moisture (%) Ash (%) Volatile matter (%) Fixed carbon (%) Total S (%) Lower cal. val. (K.Cal/kg) Upper cal. val (K.Cal/kg)
24.12 34.96 26.47 14.45
:3.72 1882 2184
+100 -100+50 •50+18 -18+10 -10+05
-0 5 TOTAL
12.37 16 48 24.92 16 38 19 46 9 94 100
39 27 42 30 46 52 48 91 44 35 47 21 44 98
4 72 4 80 5 28 4 89 4 73 4 34 4 87
Figure 7 Companson of size distribution percentages of channel and r.o m samples oflower seam
3.2 Results of analysis of rock cuttings
The percent sulfur content of the rock cuttings was obtained 5.33 and the percent moisture content of the samples was 11. From the screen analysis results it was observed that the size of the rock cuttings generally varied between -50 mm and +0.5 mm.
3.3 Comparison of channel and r.o.m. coal samples of pane! A03 using screen analysis results.
Figure 8. Comparison of ash percentages of channel and r.o m samples of lower seam.
3.3.1 Lower seam
Tables 6 and 7 list the results of the analysis of the lower seam channel and r.o.m. samples on an air-dried basis in different size fractions.
Figures 7, 8 and 9 compare the results for the channel and r.o.m. samples of the lower seam
3.3.2 Upper seam
Table 8 and 9 list the results of the analysis of the upper seam channel and r.o.m. samples on an air-dried basis in different size fractions.
Figure 9. Companson of sulfur contents of channel and r.o.m samples oflower seam.
772
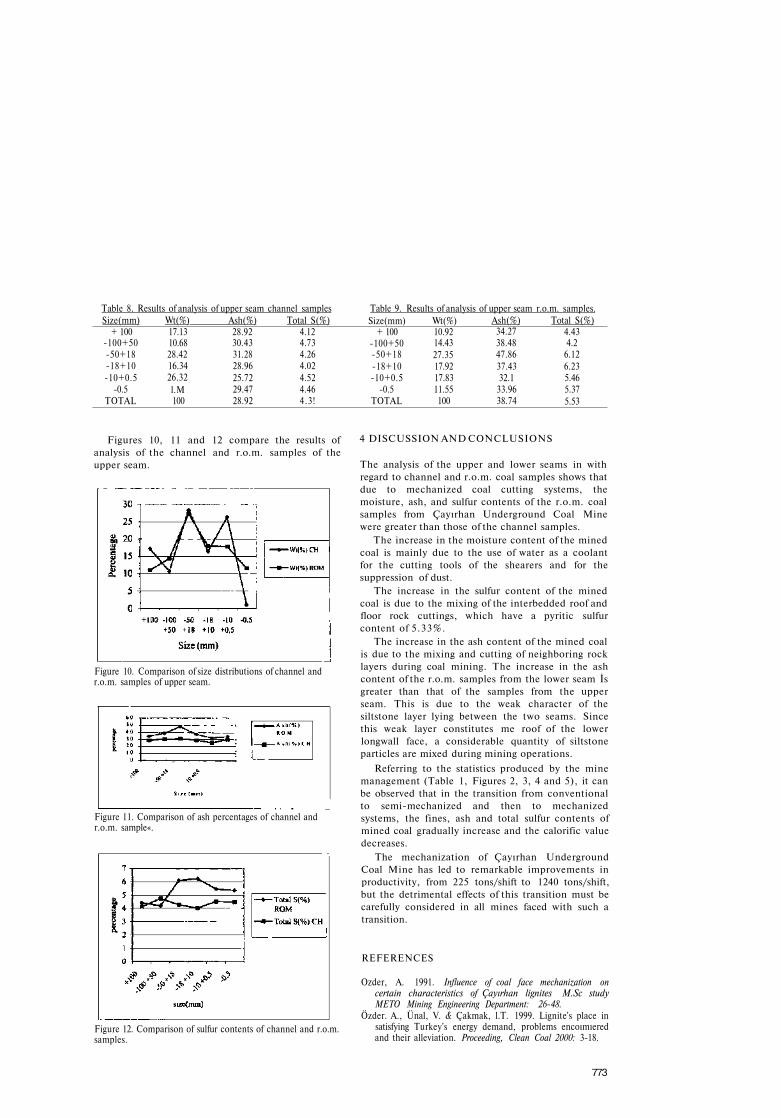
Table 8. Results of analysis of upper seam channel samples Size(mm) Wt(%) Ash(%) Total S(%)
Table 9. Results of analysis of upper seam r.o.m. samples. Size(mm) Wt(%) Ash(%) Total S(%)
+ 100 -100+50 -50+18 -18+10 -10+0.5
-0.5 TOTAL
17.13 10.68 28.42 16.34 26.32 l.M 100
28.92 30.43 31.28 28.96 25.72 29.47 28.92
4.12 4.73 4.26 4.02 4.52 4.46 4.3!
+ 100 -100+50 -50+18 -18+10 -10+0.5
-0.5 TOTAL
10.92 14.43 27.35 17.92 17.83 11.55 100
34.27 38.48 47.86 37.43 32.1
33.96 38.74
4.43 4.2
6.12 6.23 5.46 5.37 5.53
Figures 10, 11 and 12 compare the results of analysis of the channel and r.o.m. samples of the upper seam.
Figure 10. Comparison of size distributions of channel and r.o.m. samples of upper seam.
Figure 11. Comparison of ash percentages of channel and r.o.m. sample«.
Figure 12. Comparison of sulfur contents of channel and r.o.m. samples.
4 DISCUSSION AND CONCLUSIONS
The analysis of the upper and lower seams in with regard to channel and r.o.m. coal samples shows that due to mechanized coal cutting systems, the moisture, ash, and sulfur contents of the r.o.m. coal samples from Çayırhan Underground Coal Mine were greater than those of the channel samples.
The increase in the moisture content of the mined coal is mainly due to the use of water as a coolant for the cutting tools of the shearers and for the suppression of dust.
The increase in the sulfur content of the mined coal is due to the mixing of the interbedded roof and floor rock cuttings, which have a pyritic sulfur content of 5.33%.
The increase in the ash content of the mined coal is due to the mixing and cutting of neighboring rock layers during coal mining. The increase in the ash content of the r.o.m. samples from the lower seam İs greater than that of the samples from the upper seam. This is due to the weak character of the siltstone layer lying between the two seams. Since this weak layer constitutes me roof of the lower longwall face, a considerable quantity of siltstone particles are mixed during mining operations.
Referring to the statistics produced by the mine management (Table 1, Figures 2, 3, 4 and 5), it can be observed that in the transition from conventional to semi-mechanized and then to mechanized systems, the fines, ash and total sulfur contents of mined coal gradually increase and the calorific value decreases.
The mechanization of Çayırhan Underground Coal Mine has led to remarkable improvements in productivity, from 225 tons/shift to 1240 tons/shift, but the detrimental effects of this transition must be carefully considered in all mines faced with such a transition.
REFERENCES
Ozder, A. 1991. Influence of coal face mechanization on certain characteristics of Çayırhan lignites M.Sc study METO Mining Engineering Department: 26-48.
Özder. A., Ünal, V. & Çakmak, l.T. 1999. Lignite's place in satisfying Turkey's energy demand, problems encoımıered and their alleviation. Proceeding, Clean Coal 2000: 3-18.
773

17th International Mining Congress and Exhibition ofTurkey- İMCET2001, ©2001, ISBN 975-395-417-4
Application of the Dry Process on Concentration of Boron Ores
A-Akçıl Süleyman Demire! Univ., Mining Eng. Dept, Mineral Processing Division, İsparta, Turkey
A.Akar Dokuz Eylül Univ., Mining Eng. Dept., Mineral Processing Division, Izmir, Turkey
ABSTRACT: The subject of this study is a novel process: the Dry Process (DP) for the concentration of boron ores. The conditions of the concentration of boron ores by the dry process were determined in laboratory and pilot-scale tests. In addition to this, the necessary requirements to apply this process in the plant were investigated. In this process, three types of boron ore were used and they were compared at each step. Before the start of the tests, for determination properties of representative samples of feeds taken from the concentrators (tincal, colemanite and ulexite), particle sizes and the B2O3 % distributions of feeds were investigated, and the B2O3 grade of the samples was 23-32 % as the grades in the plants. In tests conducted in optimum conditions, concentrates with 43-60 % B2O3, tailings with 3-22 % 6263 and 70-96 % recoveries were obtained. In the currently operated plant, the concentrate grade is 32-38 % B2O3, recovery is 80 %, and the tailing grade is 14-16 % B2O3. The investigations showed that boron ores might be calcined. It was understood that higher quality and dry, cleaner products might be obtained.
1 INTRODUCTION
The following ores are exploited by Eti Holding: colemanite and ulexite in Bigadiç, Balıkesir; colemanite in Emet, Kütahya and Kestelek, Bursa; and tincal ore in Kirka, Eskişehir.
Although the evaluation of boron production technology in Turkey is limited in quantity, it is a very valuable mine for countries' economic resources, especially for export. Currently, in boron concentration plants in Turkey, concentrates are produced that fiiifil the minimum requirements of the world market in terms of concentration processes. In these plants, only a concentrate ore with content from colemanite-ulexite ore of 32 % B2O3 grade and tincal concentrate with a maximum 32 % B2O3 content from tincal ore with a B2O3 grade of 26 % have so far been produced.
2 PRELIMINARY RESEARCH
At the beginning of this research, all the boron ores had different ratios of crystal water. The occurrence of calcination events and the results of the heating process were investigated in a perlite mine operated in Cumaovasi, Izmir (Eti Holding). For this purpose, interesting results of calcination were first produced by simple tests conducted on tincal ore (Aytekin et al., 1992). Calcination was
previously performed by preparing samples for the calcination and dry grinding processes rather than just obtaining concentrates for boron ores. However, it was found that there was no need for these processes when adopting wet grinding.
To date, research on the heating process done by different researchers (Aytekin et al., 1992a, b, c; Aytekin et al., 1993; Eric et al., 1982; Gundiler et al., 1972; Kaytaz et al., 1986; Sener et al., 1992) has been conducted on a pilot scale rather than as a laboratory test for the purpose of concentration. There have been several studies of the application of the calcination process instead of the wet process, which is used in ore production at present. These studies have mainly dealt with the beneficiation of rich tailings and concentrate beneficiation of low-grade ores produced at Kirka, Bigadiç and Emet. There is not a low market demand for these ores. Ores containing inherent crystal water lose it by heating, and as a result, calcination occurs. Due to this characteristic behaviour, the calcination process is applied to tincal, colemanite and ulexite ores (Akcil, 1994).
3 MATERIAL
Boron samples (tincal, colemanite and ulexite) were taken from Eti Holding's Kırka and Bigadiç concentrator plant fine ore stocks with a weight of
775
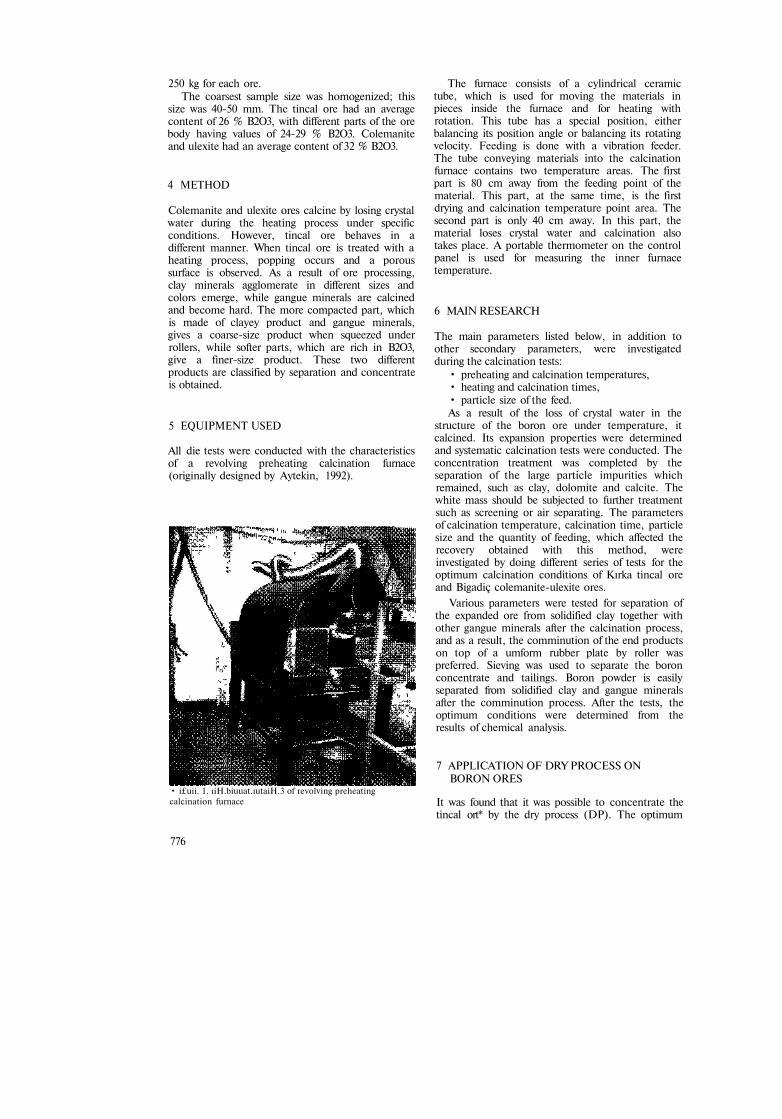
250 kg for each ore. The coarsest sample size was homogenized; this
size was 40-50 mm. The tincal ore had an average content of 26 % B2O3, with different parts of the ore body having values of 24-29 % B2O3. Colemanite and ulexite had an average content of 32 % B2O3.
4 METHOD
Colemanite and ulexite ores calcine by losing crystal water during the heating process under specific conditions. However, tincal ore behaves in a different manner. When tincal ore is treated with a heating process, popping occurs and a porous surface is observed. As a result of ore processing, clay minerals agglomerate in different sizes and colors emerge, while gangue minerals are calcined and become hard. The more compacted part, which is made of clayey product and gangue minerals, gives a coarse-size product when squeezed under rollers, while softer parts, which are rich in B2O3, give a finer-size product. These two different products are classified by separation and concentrate is obtained.
5 EQUIPMENT USED
All die tests were conducted with the characteristics of a revolving preheating calcination furnace (originally designed by Aytekin, 1992).
• i£uii. 1. ıiH.biuuat.ıutaiH.3 of revolving preheating calcination furnace
776
The furnace consists of a cylindrical ceramic tube, which is used for moving the materials in pieces inside the furnace and for heating with rotation. This tube has a special position, either balancing its position angle or balancing its rotating velocity. Feeding is done with a vibration feeder. The tube conveying materials into the calcination furnace contains two temperature areas. The first part is 80 cm away from the feeding point of the material. This part, at the same time, is the first drying and calcination temperature point area. The second part is only 40 cm away. In this part, the material loses crystal water and calcination also takes place. A portable thermometer on the control panel is used for measuring the inner furnace temperature.
6 MAIN RESEARCH
The main parameters listed below, in addition to other secondary parameters, were investigated during the calcination tests:
• preheating and calcination temperatures, • heating and calcination times, • particle size of the feed. As a result of the loss of crystal water in the
structure of the boron ore under temperature, it calcined. Its expansion properties were determined and systematic calcination tests were conducted. The concentration treatment was completed by the separation of the large particle impurities which remained, such as clay, dolomite and calcite. The white mass should be subjected to further treatment such as screening or air separating. The parameters of calcination temperature, calcination time, particle size and the quantity of feeding, which affected the recovery obtained with this method, were investigated by doing different series of tests for the optimum calcination conditions of Kırka tincal ore and Bigadiç colemanite-ulexite ores.
Various parameters were tested for separation of the expanded ore from solidified clay together with other gangue minerals after the calcination process, and as a result, the comminution of the end products on top of a umform rubber plate by roller was preferred. Sieving was used to separate the boron concentrate and tailings. Boron powder is easily separated from solidified clay and gangue minerals after the comminution process. After the tests, the optimum conditions were determined from the results of chemical analysis.
7 APPLICATION OF DRY PROCESS ON BORON ORES
It was found that it was possible to concentrate the tincal ort* by the dry process (DP). The optimum
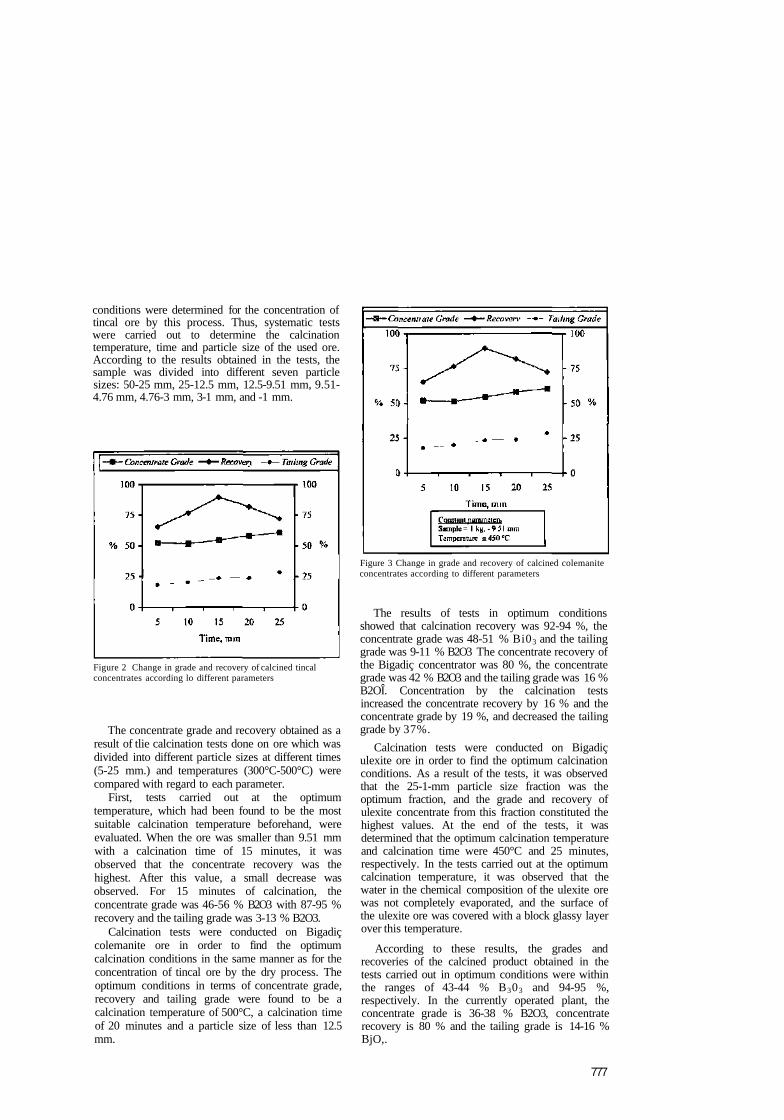
conditions were determined for the concentration of tincal ore by this process. Thus, systematic tests were carried out to determine the calcination temperature, time and particle size of the used ore. According to the results obtained in the tests, the sample was divided into different seven particle sizes: 50-25 mm, 25-12.5 mm, 12.5-9.51 mm, 9.51-4.76 mm, 4.76-3 mm, 3-1 mm, and -1 mm.
Figure 2 Change in grade and recovery of calcined tincal concentrates according lo different parameters
The concentrate grade and recovery obtained as a result of tlie calcination tests done on ore which was divided into different particle sizes at different times (5-25 mm.) and temperatures (300°C-500°C) were compared with regard to each parameter.
First, tests carried out at the optimum temperature, which had been found to be the most suitable calcination temperature beforehand, were evaluated. When the ore was smaller than 9.51 mm with a calcination time of 15 minutes, it was observed that the concentrate recovery was the highest. After this value, a small decrease was observed. For 15 minutes of calcination, the concentrate grade was 46-56 % B2O3 with 87-95 % recovery and the tailing grade was 3-13 % B2O3.
Calcination tests were conducted on Bigadiç colemanite ore in order to find the optimum calcination conditions in the same manner as for the concentration of tincal ore by the dry process. The optimum conditions in terms of concentrate grade, recovery and tailing grade were found to be a calcination temperature of 500°C, a calcination time of 20 minutes and a particle size of less than 12.5 mm.
Figure 3 Change in grade and recovery of calcined colemanite concentrates according to different parameters
The results of tests in optimum conditions showed that calcination recovery was 92-94 %, the concentrate grade was 48-51 % Bi03 and the tailing grade was 9-11 % B2O3 The concentrate recovery of the Bigadiç concentrator was 80 %, the concentrate grade was 42 % B2O3 and the tailing grade was 16 % B2OÎ. Concentration by the calcination tests increased the concentrate recovery by 16 % and the concentrate grade by 19 %, and decreased the tailing grade by 37%.
Calcination tests were conducted on Bigadiç ulexite ore in order to find the optimum calcination conditions. As a result of the tests, it was observed that the 25-1-mm particle size fraction was the optimum fraction, and the grade and recovery of ulexite concentrate from this fraction constituted the highest values. At the end of the tests, it was determined that the optimum calcination temperature and calcination time were 450°C and 25 minutes, respectively. In the tests carried out at the optimum calcination temperature, it was observed that the water in the chemical composition of the ulexite ore was not completely evaporated, and the surface of the ulexite ore was covered with a block glassy layer over this temperature.
According to these results, the grades and recoveries of the calcined product obtained in the tests carried out in optimum conditions were within the ranges of 43-44 % B303 and 94-95 %, respectively. In the currently operated plant, the concentrate grade is 36-38 % B2O3, concentrate recovery is 80 % and the tailing grade is 14-16 % BjO,.
777
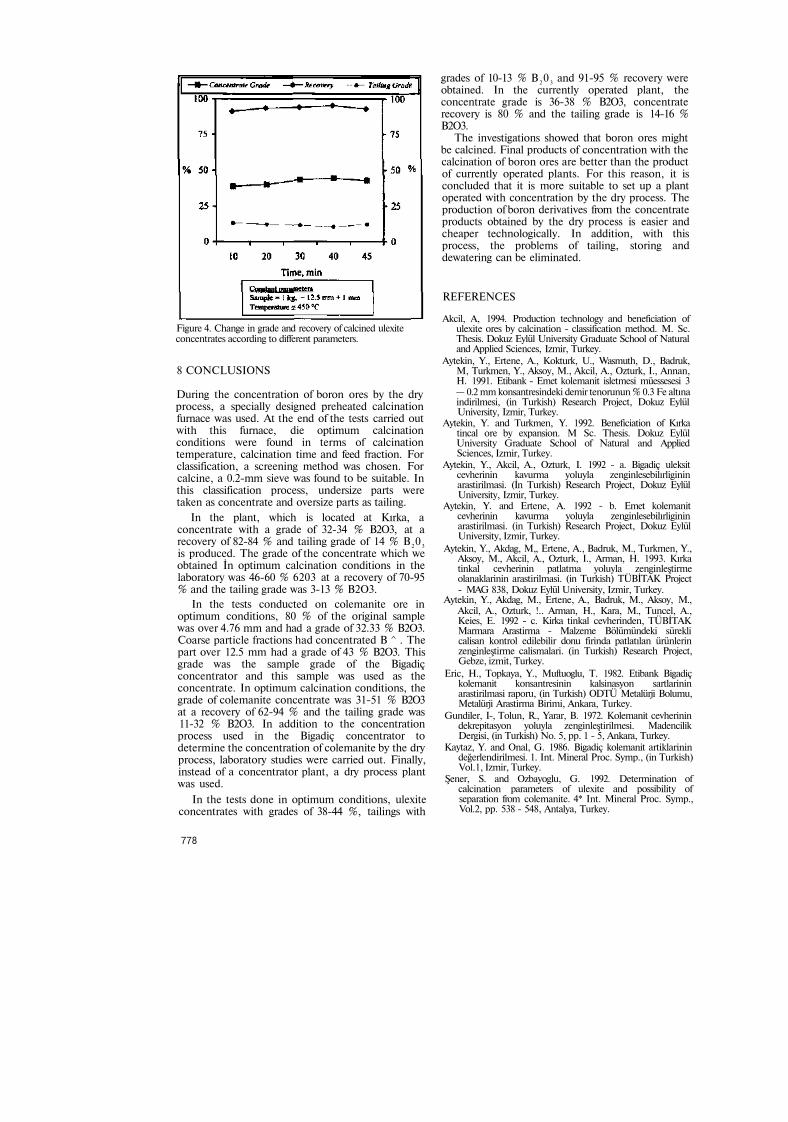
Figure 4. Change in grade and recovery of calcined ulexite concentrates according to different parameters.
8 CONCLUSIONS
During the concentration of boron ores by the dry process, a specially designed preheated calcination furnace was used. At the end of the tests carried out with this furnace, die optimum calcination conditions were found in terms of calcination temperature, calcination time and feed fraction. For classification, a screening method was chosen. For calcine, a 0.2-mm sieve was found to be suitable. In this classification process, undersize parts were taken as concentrate and oversize parts as tailing.
In the plant, which is located at Kırka, a concentrate with a grade of 32-34 % B2O3, at a recovery of 82-84 % and tailing grade of 14 % B 20 3
is produced. The grade of the concentrate which we obtained İn optimum calcination conditions in the laboratory was 46-60 % 6203 at a recovery of 70-95 % and the tailing grade was 3-13 % B2O3.
In the tests conducted on colemanite ore in optimum conditions, 80 % of the original sample was over 4.76 mm and had a grade of 32.33 % B2O3. Coarse particle fractions had concentrated B ^ . The part over 12.5 mm had a grade of 43 % B2O3. This grade was the sample grade of the Bigadiç concentrator and this sample was used as the concentrate. In optimum calcination conditions, the grade of colemanite concentrate was 31-51 % B2O3 at a recovery of 62-94 % and the tailing grade was 11-32 % B2O3. In addition to the concentration process used in the Bigadiç concentrator to determine the concentration of colemanite by the dry process, laboratory studies were carried out. Finally, instead of a concentrator plant, a dry process plant was used.
In the tests done in optimum conditions, ulexite concentrates with grades of 38-44 %, tailings with
grades of 10-13 % B 2 0 3 and 91-95 % recovery were obtained. In the currently operated plant, the concentrate grade is 36-38 % B2O3, concentrate recovery is 80 % and the tailing grade is 14-16 % B2O3.
The investigations showed that boron ores might be calcined. Final products of concentration with the calcination of boron ores are better than the product of currently operated plants. For this reason, it is concluded that it is more suitable to set up a plant operated with concentration by the dry process. The production of boron derivatives from the concentrate products obtained by the dry process is easier and cheaper technologically. In addition, with this process, the problems of tailing, storing and dewatering can be eliminated.
REFERENCES
Akcil, A, 1994. Production technology and beneficiation of ulexite ores by calcination - classification method. M. Sc. Thesis. Dokuz Eylül University Graduate School of Natural and Applied Sciences, Izmir, Turkey.
Aytekin, Y., Ertene, A., Kokturk, U., Wasmuth, D., Badruk, M, Turkmen, Y., Aksoy, M., Akcil, A., Ozturk, I., Annan, H. 1991. Etibank - Emet kolemanit isletmesi müessesesi 3 — 0.2 mm konsantresindeki demir tenorunun % 0.3 Fe altına indirilmesi, (in Turkish) Research Project, Dokuz Eylül University, Izmir, Turkey.
Aytekin, Y. and Turkmen, Y. 1992. Beneficiation of Kırka tincal ore by expansion. M Sc. Thesis. Dokuz Eylül University Graduate School of Natural and Applied Sciences, Izmir, Turkey.
Aytekin, Y., Akcil, A., Ozturk, I. 1992 - a. Bigadiç uleksit cevherinin kavurma yoluyla zenginlesebilırliginin arastirilmasi. (İn Turkish) Research Project, Dokuz Eylül University, Izmir, Turkey.
Aytekin, Y. and Ertene, A. 1992 - b. Emet kolemanit cevherinin kavurma yoluyla zenginlesebilırliginin arastirilmasi. (in Turkish) Research Project, Dokuz Eylül University, Izmir, Turkey.
Aytekin, Y., Akdag, M„ Ertene, A., Badruk, M., Turkmen, Y., Aksoy, M., Akcil, A., Ozturk, I., Arman, H. 1993. Kırka tinkal cevherinin patlatma yoluyla zenginleştirme olanaklarinin arastirilmasi. (in Turkish) TÜBİTAK Project - MAG 838, Dokuz Eylül University, Izmir, Turkey.
Aytekin, Y., Akdag, M., Ertene, A., Badruk, M., Aksoy, M., Akcil, A., Ozturk, !.. Arman, H., Kara, M., Tuncel, A., Keies, E. 1992 - c. Kirka tinkal cevherinden, TÜBİTAK Marmara Arastirma - Malzeme Bölümündeki sürekli calisan kontrol edilebilir donu firinda patlatılan ürünlerin zenginleştirme calismalari. (in Turkish) Research Project, Gebze, izmit, Turkey.
Eric, H., Topkaya, Y., Muftuoglu, T. 1982. Etibank Bigadiç kolemanit konsantresinin kalsinasyon sartlarinin arastirilmasi raporu, (in Turkish) ODTÜ Metalürji Bolumu, Metalürji Arastirma Birimi, Ankara, Turkey.
Gundiler, I-, Tolun, R., Yarar, B. 1972. Kolemanit cevherinin dekrepitasyon yoluyla zenginleştirilmesi. Madencilik Dergisi, (in Turkish) No. 5, pp. 1 - 5, Ankara, Turkey.
Kaytaz, Y. and Onal, G. 1986. Bigadiç kolemanit artiklarinin değerlendirilmesi. 1. Int. Mineral Proc. Symp., (in Turkish) Vol.1, Izmir, Turkey.
Şener, S. and Ozbayoglu, G. 1992. Determination of calcination parameters of ulexite and possibility of separation from colemanite. 4* Int. Mineral Proc. Symp., Vol.2, pp. 538 - 548, Antalya, Turkey.
778