Embed Size (px)
Citation preview

7. PETROLEUM-GENERATING POTENTIAL OF SEDIMENTS FROM LEG 40,DEEP SEA DRILLING PROJECT
J. W. Kendrick, A. Hood, and J. R. Castano, Shell Development Company,Bellaire Research Center, Houston, Texas
INTRODUCTION AND SUMMARY
Leg 40 of the Deep Sea Drilling Project (DSDP),along the southwestern margin of Africa, recoverednumerous cores of sediment containing greater than 1%organic carbon. We have studied several samples fromthese cores in order to evaluate their petroleum-generating potential. In addition, data on the levels oforganic metamorphism of these sediments were used todetermine whether any of the sediments ha,ve beenheated sufficiently to generate petroleum.
The results of this study indicate that many Leg 40sediments contain sufficient amounts of effectiveorganic carbon (Ceff) to be considered potentialpetroleum source rocks. Probably none of the samples,however, have been buried deeply enough to reach thezone of significant petroleum generation (seeForesman, this volume).
Comparison of effective organic carbon with thetotal organic carbon indicates that a large fraction ofthe organic matter in many samples is not thermallyconvertible to hydrocarbons. Visual observationsfurther indicate that some sediments contain significantamounts of reworked organic matter.
ANALYTICAL METHODSOrganic richness and temperature history are major
parameters for identifying petroleum source rocks. Theorganic richness is an indicator of the petroleum-generating potential of a rock, and therefore organic-rich rocks may be referred to as "potential sourcerocks." The thermal history determines whether thepotential source rock has reached the stage at whichpetroleum has been generated and expelled, and thuswhether it has become an actual source rock.
Probably the most commonly used measure oforganic richness is total organic carbon (%Corg) which isthe acid-insoluble carbon in the sample. In addition, itis important to have a measure of a sample's effectiveorganic carbon content (C^), i.e., that portion of theorganic matter which can be converted to petroleumduring burial at greater depths and temperatures. Asmeasures of the effective carbon content, we have usedtwo laboratory pyrolysis methods. The first pyrolysismethod—pyrolysis fluorescence (PF)—is usedprimarily as a rapid screening tool which measures theamount of fluorescing bitumen (in arbitrary PF units)formed by pyrolysis. PF values in rocks can range fromzero to several thousand units. The second pyrolysismethod—pyrolysis-FID (P-FID)—measures the
amount of volatile hydrocarbon-like compoundsgenerated in the laboratory temperature range of 300-650°C, and it approximates the amount ofhydrocarbons generated at lower temperatures in thesubsurface. The effective carbon content of a sample iscalculated as 85% of the pyrolysis hydrocarbon content.
To determine whether the sediments had beensubjected to temperatures sufficient for the thermalconversion of kerogen to petroleum, we measured thereflectance (in oil) of vitrinite, a coal maceral which isdisseminated in many sediments. Vitrinite reflectanceprovides a measure of the level of organicmetamorphism (LOM) (Hood et al., 1975) and isapplicable over a wide range of coal rank andconditions during which oil and gas are formed (Figure1).
A more complete description of the analyticaltechniques has been given by Hood et al. (1976).
RESULTS AND DISCUSSION
Level of Organic MetamorphismThe results of the vitrinite reflectance measurements
are summarized in Table 1. In converting vitrinitereflectance (Ro) to LOM, all Ro values less than ~0.4%were assigned the LOM value <7 because of thedifficulty in resolving the LOM 0-7 range by means ofvitrinite reflectance. In addition, the effect of lithologyon vitrinite reflectance (Bostick and Foster, 1973) raisessome questions about the relationship of reflectance toLOM in deep-sea sediments with Ro less than 0.8%-1.0%.
Several of the samples from Leg 40 exhibit a broaddistribution of vitrinite reflectance values. Thereflectance values for vitrinite in a humic coalcommonly fall into a narrow range. The occurrence ofbroader reflectance distributions in several Leg 40samples (see comparison in Figure 2) implies that somevitrinite has either been partially oxidized or recycledfrom older sedimentary units with a prior thermalhistory. Consequently, the mean value of Ro for coresamples with reworked, or secondary, vitrinite will begreater than that for the primary vitrinite. For thisreason Table 1 includes two values of Ro and LOM foreach sample which appears to contain secondaryvitrinite. The "X" value is the mean of all Ro observa-tions for the sample, and it represents a maximumestimate of LOM. The "A" value is an estimate of themean Ro of primary vitrinite, obtained by omittingsample observations which appear to be attributable to
671
J. W. KENDRICK, A. HOOD, J. R. CASTANO
LOM
n
2 —
4 —
6 —
8 —
10 —
14 —
16 —
18 —
20 —
COALRANK
PEATAND
LIGNITE
CSUB-
B
C
HIGHVOL. BBIT.
A
M V BIT.
LV BIT.
SEMI-ANTH.
ANTH.
VITRINITEREFLECTANCE(CASTANO, IN
HOOD andCASTANO,
1974)
— 0.5
— 1.0
— 2.0
— 2.5
— 3.0
— 3.5
— 4.0
PRINCIPAL STAGESOF PETROLEUM
GENERATION(VASSOYEVICH et al., 1970)
EARLYDIAGENETIC
METHANE
OIL
CONDENSATEAND
WET GAS
THERMALCATAGENETIC
METHANE
Figure 1. Scale relating coal rank, vitrinite reflectance, andpetroleum generation to the level of organic meta-morphism (LOM), after Hood and Castano (1974) andHoodetal (1975).
secondary vitrinite. The vitrinite reflectances of sampleswith large proportions of secondary vitrinite areconsidered less-reliable estimates of LOM than arethose of samples with only primary vitrinite.
The majority of LOM values in Table 1 lie in therange of <7 corresponding to coal ranks no higher than
subbituminous B. Such samples probably have notbeen buried sufficiently to reach the LOM (~8) atwhich significant oil generation begins (Figure 1; Hoodet al., 1975; Vassoyevich et al., 1970). Although severalsamples from Site 361 exhibit LOM values greater than8, these samples contain large amounts of secondaryvitrinite. The interpreted, or "A," values of LOM forSite 361 are in good agreement with the low LOMvalues from comparable depths in Site 364, implyingthat the Site 361 sediments have indeed not yet reachedthe oil-generation stage.
Organic Richness
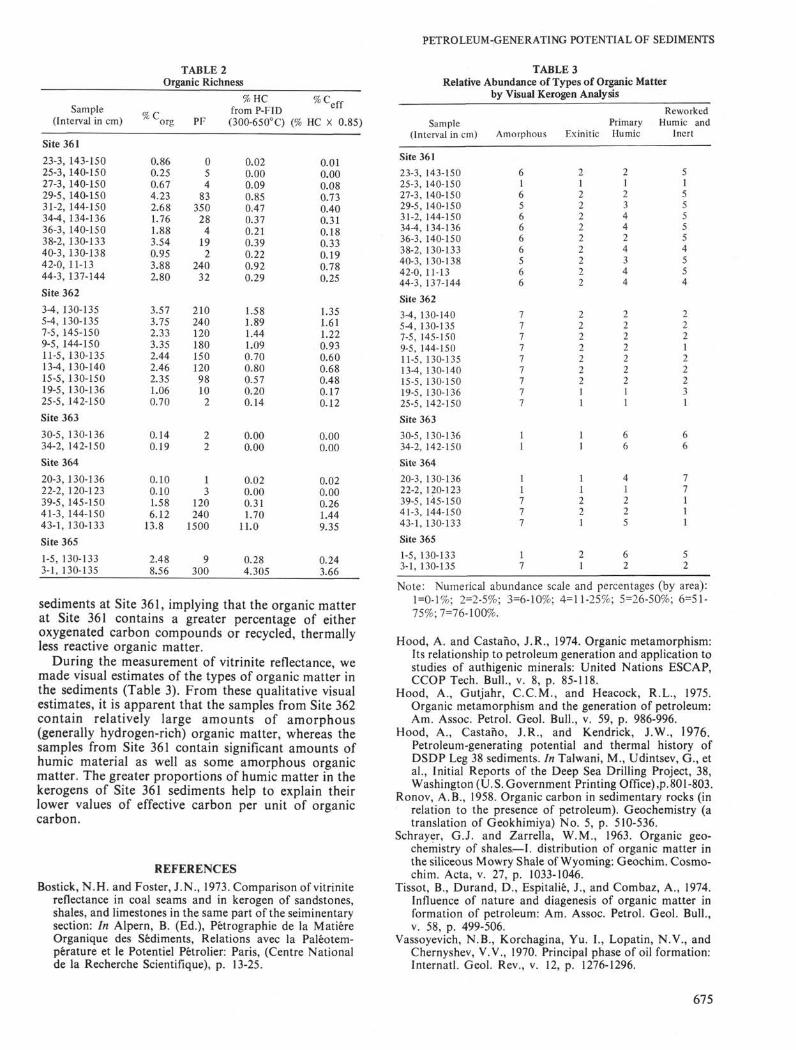
Numerous values of organic carbon content havebeen suggested as minimum requirements for potentialpetroleum source rocks. Ronov (1958) concluded thatthe critical CorK value for source rocks of economicpetroleum accumulations lies somewhere between theaverage values for clays of petroliferous (1.4%) andnonpetroliferous (0.4%) areas of the Russian Plat-form—and probably closer to the former. This suggestsa minimum value of about 1.0% CW(,. Schrayer andZarrella (1963) reported a value of about 1.5% C ^ as aminimum requirement for oil source rocks based onstudies of the Mowry Shales of Wyoming. The organiccarbon contents of the Leg 40 sediments (Table 2) rangefrom 0.1% to 13.8%. The above criteria indicate thatseveral of these samples are good potential sourcerocks.
The results of the pyrolysis-FID and pyrolysisfluorescence measurements (Table 2) place anadditional constraint on determining which samplesshould be considered potential source rocks. As ageneral rule, we do not consider samples with less than0.3% hydrocarbons (by P-FID) or less than 10 PF unitsto be potential source rock for economic oilaccumulations. Similarly, samples with less than 0.8%hydrocarbons or less than 30 PF units are considered tobe marginal source rocks at best. While generally thereis good agreement between organic carbon andpyrolysis-FID in the evaluation of source rockpotential, there are some exceptions. For example,Samples 361-36-3, 140-150 cm and 365-1-5, 130-133 cmcontain about 2% Corg, but less than 0.3% hydro-carbons, implying that a large fraction of the organicmaterial in these samples is not thermally convertible topetroleum. Consequently, some samples with moderateamounts of organic carbon may not contain sufficientamounts of reactive organic matter to be consideredpotential petroleum source rocks.
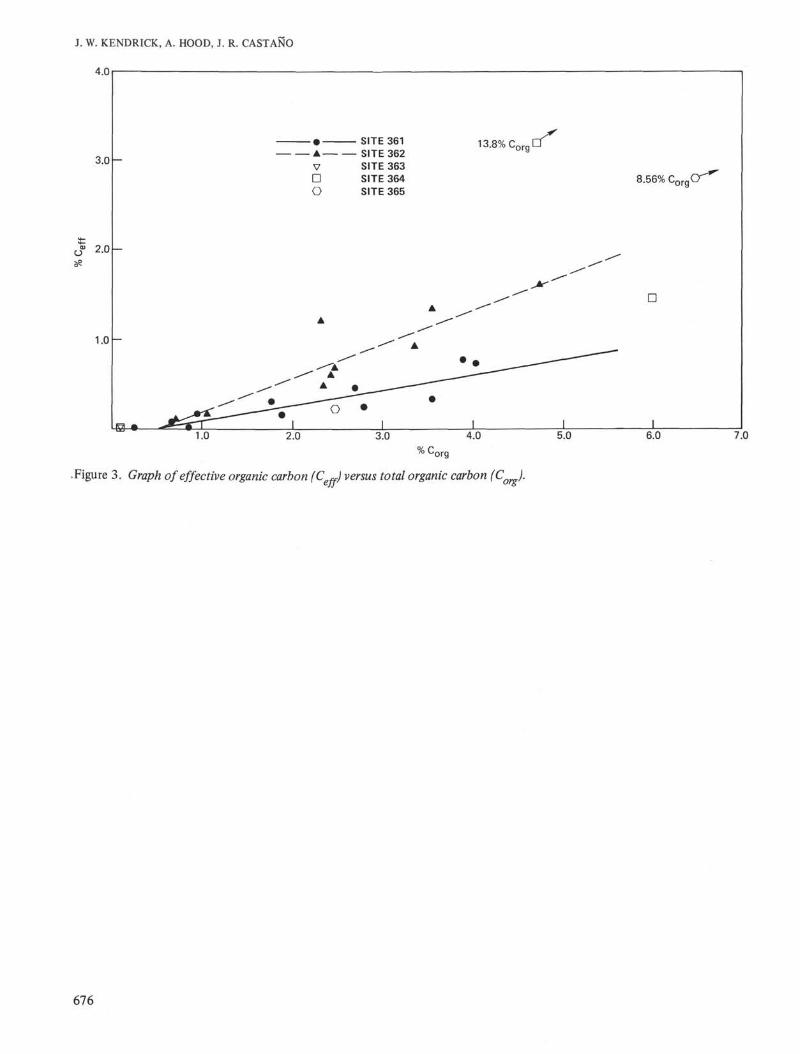
A comparison of effective carbon with organiccarbon provides information about the compositionand nature of the organic matter. Tissot et al. (1974)have demonstrated that differences in the elementalcomposition (especially hydrogen and oxygencontents) of the kerogen strongly influence the amountsof petroleum produced during heating. The graph ofeffective carbon versus organic carbon (Figure 3)suggests that consistent compositional differences existbetween sediments from different sites. In particular,the sediments at Site 362 contain greater amounts ofeffective carbon per unit of organic carbon than do the
672

PETROLEUM-GENERATING POTENTIAL OF SEDIMENTS
TABLE 1Vitrinite Reflectance and Level of Organic Metamorphism
Sample(Interval in cm)
Site 361
23-3, 143-150
25-3, 140-15027-3, 140-150
29-5, 140-150
31-2, 144-150
34-4, 134-136
36-3, 140-150
38-2, 130-133
40-3, 130-138
42-0, 11-13
44-3, 137-144
Site 362
3-4, 130-1405-4, 130-1357-5, 145-1509-5, 144-15011-5, 130-135
13-4, 130-14015-5, 130-150
19-5, 130-136
25-5, 142-150
Site 363
30-5, 130-136
34-2, 142-150Site 364
20-3, 130-136
22-2, 120-12339-5, 145-150
41-3, 144-150
43-1, 130-133Site 365
1-5, 130-133
3-1, 130-135
Depth BelowSea Floor
(m)
768
863958
1037
1051
1082
1099
1117
1147
1181
1223
618091
120138
156186
262
376
523
595
582
618975
1010
1035
233
397
Age
Cretaceous?
CretaceousAlbian-Aptian
Aptian?
L. Aptian?
L. Aptian
L. Cretaceous
L. Aptian?
_
-
_
PleistocenePleistocenePleistocenePleistoceneL. Pliocene
L. PlioceneU. Miocene
U. Miocene
U. Miocene
U. Albian
Albian-Aptian
Coniacian
TuronianAlbian-Aptian
Albian-Aptian
-
Miocene w/reworked Cret.Miocene w/reworked Cret.
.a
AX
AXAXAXAXAXAXAXAXAX
AX
AXAXAX
AX
AX
AXAX
Vitrinite Reflectance (in Oil)
No. ofObservations
2366
0125433554850266017542654376227594160
131721191718
656
19261014
730
9
733
920241819
3
24
17
Range of %RO
0.29-0.520.29-0.91Barren0.29-0.530.29-1.000.27-0.600.27-0.870.21-0.580.21-0.680.33-0.550.33-1.040.16-0.520.26-0.930.24-0.520.24-0.950.31-0.600.25-1.020.30-0.570.25-0.950.32-0.640.26-0.89
0.20-0.350.15-0.360.17-0.340.18-0.400.19-0.450.19-0.530.23-0.470.23-0.470.23-0.620.23-0.510.23-0.700.22-0.530.22-0.85
0.40-0.450.40-0.990.66-1.18
0.27-0.450.27-1.010.68-1.250.23-0.360.23-0.700.23-0.480.23-0.690.20-0.26
0.22-0.53
0.19-0.53
Mean %RO °
0.44 +0.030.61 ±0.04
0.44 ±0.050.66 ±0.050.47 ±0.040.57 ±0.040.40 ±0.030.41 ±0.040.47 ±0.030.62 ±0.050.42 ±0.040.64 ±0.050.40 ±0.040.53 ±0.050.46 ±0.040.57 ±0.050.46 ±0.040.59 ±0.050.47 ±0.040.55 ±0.05
0.26 ±0.030.24 ±0.030.23 ±0.020.27 ±0.040.31 ±0.050.32 ±0.050.33 ±0.110.36 ±0.130.41 ±0.150.40 ±0.040.46 ±0.050.35 ±0.080.45 ±0.11
0.42 ±0.020.65 ±0.070.98 ±0.13
0.33 ±0.060.66 ±0.080.89 ±0.150.28 ±0.020.34 ±0.060.32 ±0.040.34 ±0.060.24 ±0.08
0.32 ±0.04
0.35 ±0.06
LOMC
79
797.58.5
<777.5979
<787.58.57.58.57.58.5
<7<7<7<7<7< 7 A
N.D.d
N.D.N.D.
<7
<7N.D.
79N.D.
<79N.D.
<7<7<7<7<7
<7
<7
"X" represents the entire range of vitrinite observations; "A" represents the interpreted range of primary vitrinite observa-tions. Where "A" and "X" are not noted, they are the same.
b %RQ ± 95% confidence limit,c All Ro values less than 0.4% are assigned LOM<l because of the difficulty of resolving the LOM 0-7 range by means of
vitrinite reflectance. Ro values <0.4% are converted to LOM on the basis of Castaho's /?o-L0M relationship (Hood andCastano, 1974).
N.D. - Not determined, because variance of data was too great.
673

J. W. KENDRICK, A. HOOD, J. R. CASTANO
0.0 0.1
19
18
17
16
15
14
13
12
11
10
9
8
7
6
5
4
3
2
1
0.7 0.8
PERCENT
(B)
X XX X X
361-40-3, 130-138 cm
X XX
1 L.0.0 0.1 0.2 0.3 0.7 0.8
PERCENT
0.9 1.0 1.1 1.2 1.3 1.4 1.5
" " A " ~ H VITRINITE REFLECTANCE HISTOGRAM
Figure 2. Histograms of vitrinite reflectance for samples with (A) primary vitrinite (362-5-4, 130-132 cm); (B) pri-mary and secondary vitrinite (361-40-3,130-138 cm). "A "denotes the range of interpreted primary reflectancevalues.
674
PETROLEUM-GENERATING POTENTIAL OF SEDIMENTS
TABLE 2Organic Richness
Sample(Interval in cm)
eff%C
org PF
% HC % Cfrom P-FID(300-650°C) (% HC × 0.85)
Site 361
23-3, 143-15025-3, 140-15027-3, 140-15029-5, 140-15031-2, 144-15034-4, 134-13636-3, 140-15038-2, 130-13340-3, 130-13842-0, 11-1344-3, 137-144
Site 362
3-4, 130-1355-4, 130-1357-5, 145-1509-5, 144-15011-5, 130-13513-4, 130-14015-5, 130-15019-5, 130-13625-5, 142-150
Site 363
30-5, 130-13634-2, 142-150
Site 364
20-3, 130-13622-2, 120-12339-5, 145-15041-3, 144-15043-1, 130-133
Site 365
1-5, 130-1333-1, 130-135
0.860.250.674.232.681.761.883.540.953.882.80
3.573.752.333.352.442.462.351.060.70
0.140.19
0.100.101.586.1213.8
2.488.56
05483350284192
24032
21024012018015012098102
22
13
1202401500
9300
0.020.000.090.850.470.370.210.390.220.920.29
1.581.891.441.090.700.800.570.200.14
0.000.00
0.020.000.311.70
11.0
0.284.305
0.010.000.080.730.400.310.180.330.190.780.25
1.351.611.220.930.600.680.480.170.12
0.000.00
0.020.000.261.449.35
0.243.66
sediments at Site 361, implying that the organic matterat Site 361 contains a greater percentage of eitheroxygenated carbon compounds or recycled, thermallyless reactive organic matter.
During the measurement of vitrinite reflectance, wemade visual estimates of the types of organic matter inthe sediments (Table 3). From these qualitative visualestimates, it is apparent that the samples from Site 362contain relatively large amounts of amorphous(generally hydrogen-rich) organic matter, whereas thesamples from Site 361 contain significant amounts ofhumic material as well as some amorphous organicmatter. The greater proportions of humic matter in thekerogens of Site 361 sediments help to explain theirlower values of effective carbon per unit of organiccarbon.
REFERENCESBostick, N.H. and Foster, J.N., 1973. Comparison of vitrinite
reflectance in coal seams and in kerogen of sandstones,shales, and limestones in the same part of the seiminentarysection: In Alpern, B. (Ed.), Pétrographie de la MatiéreOrgaπique des Sediments, Relations avec la Paléotem-pérature et le Potentiel Pétrolier: Paris, (Centre Nationalde la Recherche Scientifique), p. 13-25.
TABLE 3Relative Abundance of Types of Organic Matter
by Visual Kerogen AnalysisReworked
Primary Humic andHumic Inert
Sample(Interval in cm) Amorphous Exinitic
Site 361
23-3, 143-15025-3, 140-15027-3, 140-15029-5, 140-15031-2, 144-15034-4, 134-13636-3, 140-15038-2, 130-13340-3, 130-13842-0, 11-1344-3, 137-144
Site 362
3-4, 130-1405-4, 130-1357-5, 145-1509-5, 144-15011-5, 130-13513-4, 130-14015-5, 130-15019-5, 130-13625-5, 142-150
Site 363
30-5, 130-13634-2, 142-150
Site 364
20-3, 130-13622-2, 120-12339-5, 145-15041-3, 144-15043-1, 130-133
Site 365
1-5, 130-1333-1, 130-135
2J22
222222
22
222211
11
11
21
21
21234424344
222222211
66
41225
62
Note: Numerical abundance scale and percentages (by area):1=0-1%; 2=2-5%; 3=6-10%; 4=11-25%; 5=26-50%; 6=51-75%; 7=76-100%.
Hood, A. and Castafio, J.R., 1974. Organic metamorphism:Its relationship to petroleum generation and application tostudies of authigenic minerals: United Nations ESCAP,CCOP Tech. Bull., v. 8, p. 85-118.
Hood, A., Gutjahr, C.C.M., and Heacock, R.L., 1975.Organic metamorphism and the generation of petroleum:Am. Assoc. Petrol. Geol. Bull., v. 59, p. 986-996.
Hood, A., Castario, J.R., and Kendrick, J.W., 1976.Petroleum-generating potential and thermal history ofDSDP Leg 38 sediments. In Talwani, M., Udintsev, G., etal., Initial Reports of the Deep Sea Drilling Project, 38,Washington (U.S. Government Printing Office),p.801-803.
Ronov, A.B., 1958. Organic carbon in sedimentary rocks (inrelation to the presence of petroleum). Geochemistry (atranslation of Geokhimiya) No. 5, p. 510-536.
Schrayer, G.J. and Zarrella, W.M., 1963. Organic geo-chemistry of shales—I. distribution of organic matter inthe siliceous Mowry Shale of Wyoming: Geochim. Cosmo-chim. Acta, v. 27, p. 1033-1046.
Tissot, B., Durand, D., Espitalié, J., and Combaz, A., 1974.Influence of nature and diagenesis of organic matter information of petroleum: Am. Assoc. Petrol. Geol. Bull.,v. 58, p. 499-506.
Vassoyevich, N.B., Korchagina, Yu. I., Lopatin, N.V., andChernyshev, V.V., 1970. Principal phase of oil formation:Internatl. Geol. Rev., v. 12, p. 1276-1296.
675
J. W. KENDRICK, A. HOOD, J. R. CASTANO
4.0
3.0
o 2.0
1.0
w^
VDO
— SITE 361— SITE 362
SITE 363SITE 364SITE 365
13.8% Corg
8.56% Co
D
5.0 6.0 7.0
.Figure 3. Graph of effective organic carbon (Coff) versus total organic carbon (C' ) .
676