Embed Size (px)
Citation preview
7 People Results – HR Perception
http://www.flickr.com/photos/blyzz/2530816698/sizes/l/
and Performance Indicators
The EFQM Model –The EFQM Model 7 People Results
International Human Resources Management, Dr. Jörg Klukas 2

SUMMARY OF THE LAST SUMMARY OF THE LAST LECTURES – WHAT DID YOU LEARN? YOU LEARN?
International Human Resources Management, Dr. Jörg Klukas 3

What we have learnt.• Overview of the EFQM Model
to be applied for HR- • Criteria 5Departments
• Criteria 3• HR Planning• HR Marketing Recruiting
• Process Oriented Management System, Roles
• HR Processes, Sub-Processes, ProceduresHR Marketing, Recruiting,
Integration• Succession Planning• Employee Survey• Strategic Competency
• Indicators and Improvement of Processes
• Maturity Levels of Process Peformance
Strategic CompetencyManagement and Blended LearningSystem
• Annual Employee Feedback
• Criteria 4e• Learning Organization• People, Places and Objects
Interviews and Target Appraisals• Empowerment and Internal
Communication• Feedback (360°) and Motivation,
p , jApproach
• Intercultural Management by Li iTotal Reward Lixiu
International Human Resources Management, Dr. Jörg Klukas 4

The EFQM Model –The EFQM Model 7 People Results
International Human Resources Management, Dr. Jörg Klukas 5

The EFQM excellence modelQ
Enablers Results
People
Leadership
People
Policy andStrategy Processes
People Results
CustomerResults
KeyPerformancep Strategy
Partnerships& Resources
Processes Results
SocietyResults
Results
Innovation and Learning
International Human Resources Management, Dr. Jörg Klukas 6

The EFQM excellence modelQ
Leadership
People
Strateg Processes
People Results
Customer Key Performance 7 P l R ltLeadership Strategy
Partnership& Resources
Processes Results
Society Results
PerformanceResults 7. People Results
a. PerceptionsThese are the people’s perceptions of the organization.
b. Performance IndicatorsThese are the internal measures used by the organization in order to monitor, understand, predict and improve the to monitor, understand, predict and improve the organizations people.
International Human Resources Management, Dr. Jörg Klukas 7

The EFQM excellence model –People Resultsp
In practice, excellent organizationsD l d f f i di d l d
Topics• Develop and agree a set of performance indicators and related outcomes to
determine the successful deployment of their strategy and supporting policies, based on the needs and expectations of their people.
• Set clear targets for Key Results based on the needs and expectations of their people, in line with their chosen strategy.
op cs
• Performance Indicator Theory
• Strategic alig e t (BSC)their people, in line with their chosen strategy.
• Demonstrate positive or sustained good People Results over at least 3 years.
• Clearly understand the underlying reasons for and drivers for observed trends and the impact these results will have on other performance indicators
alignment (BSC)• Leading/lagging
indicators• Target Setting• Approach
and the impact these results will have on other performance indicators and related outcomes.
• Anticipate future performance and results.
• Understand how the Key Results they achieve compare to similar organizations,
Linkage with Cause analysis
• Driver analysis (correlation analysis)and use this data, where relevant ,for target setting.
• Segment results to understand the needs and expectations of specific groups within their organization.
analysis)
International Human Resources Management, Dr. Jörg Klukas 8

Why are People Results important?y p p• People are the
resource that makes the makes the difference between organizations motivation and motivation and satisfaction are essential to successP l id • People provide the organization’s inspiration,
ti it i i creativity, vision and motivation
International Human Resources Management, Dr. Jörg Klukas 9

Why are People Results important?y p p• People
provide the organization’organizations skills and competencies
• People need t b to be satisfied with their job, motivated to d th i b t do their best and to be convinced that the
i ti organization acts in their best interest
International Human Resources Management, Dr. Jörg Klukas 10

INDICATORSINDICATORS
International Human Resources Management, Dr. Jörg Klukas 11

Indicators…• …a numerical measure of the degree to which the
objective is being achievedobjective is being achieved.• …item of information collected at regular intervals
to track the performance of a system.• …defines the measurement of a piece of important
and useful information about the performance of a program expressed as a percentage index rate or program expressed as a percentage, index, rate or other comparison which is monitored at regular intervals and is compared to one or more criterion.
How do you know what you are achieving?
International Human Resources Management, Dr. Jörg Klukas 12

Aspects for Performance Indicators.p
…monitor areas of risks/success
…analyze based on relevant segmentations
for interest groups
Performance Indicators…
…check whether operational process
objectives are achieved
…predict whether strategic targets can be
achieved(Balanced Scorecard)(Balanced Scorecard)
International Human Resources Management, Dr. Jörg Klukas 13

Example Performance Indicators.p
…monitor long term commitment
…analyze for all business units and hierarchy levels
and employees,freelancers, trainees
Fluctuation (employee turnover)
…check we have the right people, at the
right time at the right place
…predict achievement of End of Year
Headcount (acc to HR Plan)place (acc. to HR Plan)
International Human Resources Management, Dr. Jörg Klukas 14

Quality of Performance Indicators.Q y• Guess? Systematically retrieved?• Sometimes necessary to make educated guesses • Sometimes necessary to make educated guesses,
because of pure data availability• But an educated guess is better then no indicatorg
• Example: Estimation Methods• Number of Applicants per Year• Count applicants in January, March, August divide by
3 and multiply by 12
International Human Resources Management, Dr. Jörg Klukas 15

Leading Indicators vs. Lagging Indicators.g gg g
• Lagging Indicators: Retrospective monitoring and evaluation of a process or an activity and evaluation of a process or an activity. Target: Allow indications for improvement and learning.
• Leading Indicators: Indicators that predict the change of lagging indicators. T t All t k l i d Target: Allow to make conclusions and presumptions about performance and quality of future processes.
Leading Indicator (time t)
Lagging Indicator(time t+x)
International Human Resources Management, Dr. Jörg Klukas 16

Lagging gets sometimes Leading.gg g g g
Leading Indicator (time t)
Lagging Indicator(time t+x)( ) ( )
Fluctuation(measured monthly)
Commitment(measured annually in
employee survey)
Customer Satisfaction(measured after
each j t/ i )
Leading Indicator
Lagging Indicator
project/service)
(time t) (time t+x)
International Human Resources Management, Dr. Jörg Klukas 17

Leading & Lagging Indicatorsg gg gMarket / Customer (outside)
Profitability
Growth
C t
NewProducts &Innovation
Organization (inside)
Q ti
ServiceQuality
CustomerSatisfaction
Loyalty
Leadership
Strategy InternalProcesses
Questions of
employee survey
Attitude ofemployees
Behaviorof employees
Customer Relation
Careeropportunity
Growth driver employees
Performance/Feedback
Teamwork
Re at o
Empowerment
directleadership
Culturep
International Human Resources Management, Dr. Jörg Klukas 18

Leading/Lagging Indicatorsg gg g
Increase/growth
F db k
Clear Expectation,
Responsi-bilities Values
Commitment
learn
FeedbackConsequences
Requirementsof Motivation
Targets and Tasks Confidence
encourage
CommitmentEngagement
TrustStrategy
fPerformance
Tech-orga. work
environment
Skills
Recognition, Promotion
Material Conse-quences
Performance(Results)
See and understand
resultsfair?
Satisfaction with Results and System
Skills, Knowledge
improve
learn
International Human Resources Management, Dr. Jörg Klukas 19

Correlation Analysis.y• single number that describes the degree of
relationship between two variablesrelationship between two variables• Common used method: Pearson Product Moment
Correlation (Pearson's correlation)• Correlation coefficient:R2
measures the degree of relationship (and di ti ) b t t i bldirection) between two variables
• -1 < R² < 1R² = 0 no relationshipR 0 no relationshipR² = 1 perfect correlationR² = -1 as one variable increases, the
other decreasesInternational Human Resources Management, Dr. Jörg
Klukas 20

Spurious Correlation.p
• false presumption that two variables are that two variables are correlated when in reality they are not• result of a third factor that is not apparent at the time ppof examination• example: correlation between stork between stork population and birth rates (Matthews,
)2000) Source: flickr.comInternational Human Resources Management, Dr. Jörg
Klukas 21

Example of strong correlationp g
Employee motivation
index 86 pointsn Sa
les
Ret
urn
on
Employee i i
R
motivation index 46 points
Source:KundenstudieHandelsfilialen;Mitarbeitemotivationsindex auf einer Skale vom 0-keine Motivation bis 100- maximaleMotivation
Emotional customers connectionInternational Human Resources Management, Dr. Jörg
Klukas 22

Strategic Focus Indicators of a BSCg• Many 100 Performance Indicators for
• Processes• Approaches• Risks/success areas• Special segmentations (e.g. employees, freelancers, trainees)p g ( g p y , , )• …
• Strategic indicators embedded in a BSC are those few that Strategic indicators embedded in a BSC are those few that have a strategic focus in the current year by means of:• These indicators must change strongly (hire 100 people,
decrease sickness level by 50%) indicators of changey ) g• There are particular risks or success areas predicted that must
be monitored carefully (new competitor in the same region looking for 100 new hires keep commitment high) i di t f t i bilitindicator of sustainability
International Human Resources Management, Dr. Jörg Klukas 23

Target Settingg g• Targets for indicators are based on the needs and
expectations of interest groupsexpectations of interest groups• Hence, there a the following sources for target
setting:• The trend is your friend• Benchmark by Best-in-Class Organizations• Interest-Group Surveying about their expectationsInterest Group Surveying about their expectations• Strategic Possibilities in long-term
International Human Resources Management, Dr. Jörg Klukas 24

Cause Analysis –Identify the right improvement measuresy g p
Enablers Results
People
Leadership
People
Policy andStrategy Processes
People Results
CustomerResults
KeyPerformancep Strategy
Partnerships& Resources
Processes Results
SocietyResults
Results
Innovation and Learning
International Human Resources Management, Dr. Jörg Klukas 25

Analysis Possibilities.y• Root-Cause Analysis to identify improvement
measurements (question 7 times why to find the real cause)measurements (question 7 times why to find the real cause)• Tools: Fishbone Diagram
main problem causes main problem (indicated by indicator)
Sub problem
causesto be improved
• Impact Analysis to prioritize improvement measurements (you can’t do all improvements at once)
Cause B
rt to
chan
ge
Cause ACause C
Impact to improve main problem
Effo
International Human Resources Management, Dr. Jörg Klukas 26

Root-Cause Analysis.y• Identifying systematically the “root causes” of
problems or incidentsproblems or incidents• Root Cause: fundamental breakdown or failure of
a process prevents a recurrence of the problem when resolved
International Human Resources Management, Dr. Jörg Klukas 27

Fishbone Diagram.g• Displays potential causes for a certain problem or effect• Created by Kaoru IshikawaCreated by Kaoru Ishikawa• First used in the 1960s• Steps:
1 Problem identification1. Problem identification2. Identification of major factors involved3. Identification of possible causes4 Analysis4. Analysis
main problem (indicated by indicator)
causesto be improved
Sub problemInternational Human Resources Management, Dr. Jörg
Klukas 28

Fishbone Diagram.g• Fishbone Diagram - Example
International Human Resources Management, Dr. Jörg Klukas 29

Other Tools Used in Root Cause Analysis.y
BrainstormingBrainstorming5 Why’sPareto ChartPareto ChartGap Analysisetc ….
International Human Resources Management, Dr. Jörg Klukas 30

Impact-Analysis.p y• Assessment of the pros and cons of pursuing a
course of action in light of its possible course of action in light of its possible consequences, or the extent and nature of change it may cause
nge
Cause A
Cause B
Cause CEffo
rt to
chan
Cause C
Impact to improve main problem
International Human Resources Management, Dr. Jörg Klukas 31

7A PERCEPTION 7A PERCEPTION MEASURES
International Human Resources Management, Dr. Jörg Klukas 32

The EFQM excellence modelQ
Leadership
People
Strateg Processes
People Results
Customer Key Performance 7 P l R ltLeadership Strategy
Partnership& Resources
Processes Results
Society Results
PerformanceResults 7. People Results
a. PerceptionsThese are the people’s perceptions of the organization.
b. Performance IndicatorsThese are the internal measures used by the organization in order to monitor, understand, predict and improve the order to monitor, understand, predict and improve the organizations people.
International Human Resources Management, Dr. Jörg Klukas 33

The EFQM excellence model –People Results.p
P l ’ P ti f th O i ti
In practice, excellent organizationsD l d f f i di d l d d i h f l
People’s Perceptions of the Organization.
• Develop and agree a set of performance indicators and related outcomes to determine the successful deployment of their strategy and supporting policies, based on the needs and expectations of their people.
• Set clear targets for Key Results based on the needs and expectations of their people, in line with their chosen strategy.their chosen strategy.
• Demonstrate positive or sustained good People Results over at least 3 years.
• Clearly understand the underlying reasons for and drivers for observed trends and the impact these results will have on other performance indicators and related outcomes.
• Anticipate future performance and results.
• Understand how the Key Results they achieve compare to similar organizations, and use this data, where relevant ,for target setting.
S t lt t d t d th d d t ti f ifi ithi th i • Segment results to understand the needs and expectations of specific groups within their organization.
International Human Resources Management, Dr. Jörg Klukas 34

The EFQM excellence model –People Resultsp
P ti• These are the People’s perceptions of the organization. They may be obtained
from a number of sources, including surveys, focus groups, interviews and structured appraisals
Perceptions.
Topicsstructured appraisals.
• These perception should give a clear understanding of the effectiveness , from the people’s perspective, of the deployment and execution of the organization’s people strategy and supporting policies and processes.
D di h f h i i f
op cs
• Employee Survey• Applicant Survey• Image as
tt ti l • Depending on the purpose of the organization, measures may focus on:
• Satisfaction, involvement and engagement
• Pride and fulfillment
attractive employer (media resonance analysis) (8a)
• Internal Customer Survey of HR
• Leadership and management
• Target setting, competency and performance management
• Competency, training and career development
Department (6a)• Aggregated View
of EmployeeFeedback Talks or 360°
• Effective communications
• Working conditions
or 360Feedbacks
International Human Resources Management, Dr. Jörg Klukas 35

HOW TO MEASURE HOW TO MEASURE PEOPLE RESULTS?
International Human Resources Management, Dr. Jörg Klukas 36

Examples.p• Employee Survey (internal evaluation)• Employee Survey (external visibility of results) à Employee Survey (external visibility of results) à
kununu.de; GreatPlaceToWork;…• Employee Survey in sense of an internal customer
survey of HRsurvey of HR• Surveys about Cooperation with partners (Employees
Council, Labor Union, Buying Department,…)• Surveys of candidates about expectations of an attractive Surveys of candidates about expectations of an attractive
employer versus survey of employees about delivery of expectations
International Human Resources Management, Dr. Jörg Klukas 37

EMPLOYEE SURVEYEMPLOYEE SURVEY
International Human Resources Management, Dr. Jörg Klukas 38

Excellent Organizations use people surveys and other forms of employee feedback to improve people strategies, policies and plans
Aims of employee feedbacks:
plans
• alignment of views between staff and managers to conduct performance, goals and potentials
• Optimal exploitation and expansion of the potential of employeesOptimal exploitation and expansion of the potential of employees• Feedback for the leader
• promotion of job satisfaction and motivation
International Human Resources Management, Dr. Jörg Klukas 39

Excellent Organizations use people surveys and other forms of employee feedback to improve people strategies, policies and plans
Aims of employee feedbacks:
plans
• early recognition and overcoming of possible conflicts and difficulties
• professional development opportunities for the employee• no call for caution or warning the employeeno call for caution or warning the employee• no call to action coordination on specific individual projects
International Human Resources Management, Dr. Jörg Klukas 40

Employee Survey – a process• After retrieving the
questionnaires they have to be
p y y p
evaluated regarding, last targets, strengths and weaknesses.
• These results have to be communicated to all employees, prioritized and cross – functional focus groups analyze reasons,
i d suggests actions and target values for the next survey
International Human Resources Management, Dr. Jörg Klukas 41

Participation Rate.p
International Human Resources Management, Dr. Jörg Klukas 42

360 DEGREE FEEDBACK360 DEGREE FEEDBACK
International Human Resources Management, Dr. Jörg Klukas 43

360 Degree Feedback.g• Systematic collection and
feedback of performance data on an individual or group derived from a number of their stakeholders in their
fTeam
Boss
performance• Measures the behaviors and
competencies shown by the i di id l i
Peers Members
individual or group in achieving goals
• Assessment by the boss, staff, b
SelfCusto-mers
S ffteam members, internal/external customers, suppliers, family, friends and self assessment
Staff
self assessmentInternational Human Resources Management, Dr. Jörg
Klukas 44

360 Degree Feedback - What does it measure?
• Not only the results achieved by people, but also how the results were achieved
• The increasing emphasis by organizations on measuring employee opinions on a number of issues, such as communication or morale, achievement of corporate standards of behavior or values
• Assessment of teams and departments and their group-communication, decision-making-processes
Peers
Team Members
Boss
SelfCusto-mers
Staff
International Human Resources Management, Dr. Jörg Klukas 45

The IT Survey Group Worldwide.
I like my work
gg
80
My team looks for possibilitiesto optimize processes
I am participatedin decisions of my work
Easy to get informationneeded for my work
& L
earn
ing
& L
earn
ing
74
60
69
My team recognizes different viewsof people
I am encouraged to suggestsinnovations and improvements
to optimize processes
Inno
vatio
n In
nova
tion
69
70
74
Could develop in the last12 th
Know, what kind of competenciesare needed in the future
My team cooperates with other teams
rodu
ctiv
ity,
rodu
ctiv
ity,
62
66
79
0% 10% 20% 30% 40% 50% 60% 70% 80% 90% 100%
Problems are discussed openlyin my team
12 month Pr
Pr
73
62
Yes% ITSG 2004Yes% ITSG 2004
46International Human Resources Management, Dr. Jörg
Klukas

The IT Survey Group Worldwide.
My leader recognizes good performance pp
60
Clarity how my performance is evaluated
Leader gives feedback to improve performance
Lead
ersh
ipLe
ader
ship
65
56
Our processes are designed to fulfill customer’s
My team knows customer needs exactly
Leader is available and supports mear
ket
arke
t
51
72
80
See clear connection between my work and strategy
Know strategy and could explainto someone else
Our processes are designed to fulfill customer s needs M
aM
aat
egy
ateg
y
68
46
51
0% 10% 20% 30% 40% 50% 60% 70% 80% 90% 100%
My leaders explain strategy Stra
Stra
51
Yes% ITSG 2004
International Human Resources Management, Dr. Jörg Klukas 47

The IT Survey Group Worldwide.y p
International Human Resources Management, Dr. Jörg Klukas 48

Perception Measures for Interest Groups.p
HR Customers (leaders, employees, departments)
E l
( , p y , p )
Applicants Employee council
Employees PartnersEmployees Partners
SocietyInternational Human Resources Management, Dr. Jörg
Klukas 49

Perception Indicators - Examples.p pSatisfaction with their development opportunities (Surveying)• How satisfied are the employees with their development
opportunities?
Ø Deviation from Personnel Planning in %• Degree of deviation of the number of actual employments from
planned employments
Placement in the BestPersAward• How good is the organization’s HR in comparison to other
companies?
Evaluation of People-Competencies (Customer Surveys)• How do the customers (Employees) evaluate the competencies of
the HR Department?the HR Department?
International Human Resources Management, Dr. Jörg Klukas 50

COMMITMENTPeople’s Perceptions of the Organization
COMMITMENT
International Human Resources Management, Dr. Jörg Klukas 51

Commitment.•People with high commitment are people:
– who are prepared to go the extra mile for their employer,– who care about the future of their company and
h d illi d bl t– who are ready, willing and able to:• exert the maximum effort,• deploy maximum intelligence, • and apply the maximum creativity
in their work for the benefit of the organization as a whole. e wo o e e e o e o ga a o as a w o e.
International Human Resources Management, Dr. Jörg Klukas 52

Key drivers to high commitment.y g•Leadership 31%•Ethical organization
E it bl d•Equitable reward•Viable and creditable strategy
•Development 29%•Provide opportunities to develop•Regard people as assets to be invested in not cost to be cut•Investment in people = investment in company’s future•Support diversification (individuals)pp ( )
•Empowerment 27%•=Responsibility + Authority•Employees are respected for their talents•Employees are respected for their talents•Vest authority in their front-line staff•Employees are reluctant to express their views, or exercise their initiative
Hi h it t D ’t t ll l h t t thi k b t li t h t High commitment = Don’t tell employees what to think, but listen what employees say.
International Human Resources Management, Dr. Jörg Klukas 53

Commitment – Model (1).( )Commitment = 2 Conditions:
1. Necessary Condition = Retention– For whatever reason, employees intend to remain with
th i t ltheir current employer.
2. Sufficient Condition = Recommendation– Employees are not only motivated to stay, but also think
highly enough of it to recommend to others t join
International Human Resources Management, Dr. Jörg Klukas 54

Commitment – Model (1).( )
Recommendation
•4 Clusters (conditions = dimensions)
The engagedThe cohabiting
Recommendation
Europe: 54% of workforceGermany: 72% of workforce
Europe: 14% of workforceGermany: 6% of workforce
RetentionThe separated
Europe: 16% of workforce
The separated
Europe: 16% of workforce
Hi h i ti f t t t
pGermany: 13% of workforce
pGermany: 9% of workforce
High variation from country to country.International Human Resources Management, Dr. Jörg
Klukas 55

Commitment – Model (2).( )
ResidentsEngaged
Performers
fact
ion
(job security)Performers
(drivers)
Satis
f
(bad influencer)
The unreached
(improver)
Distant Performers
Motivating EnvironmentInternational Human Resources Management, Dr. Jörg
Klukas 56
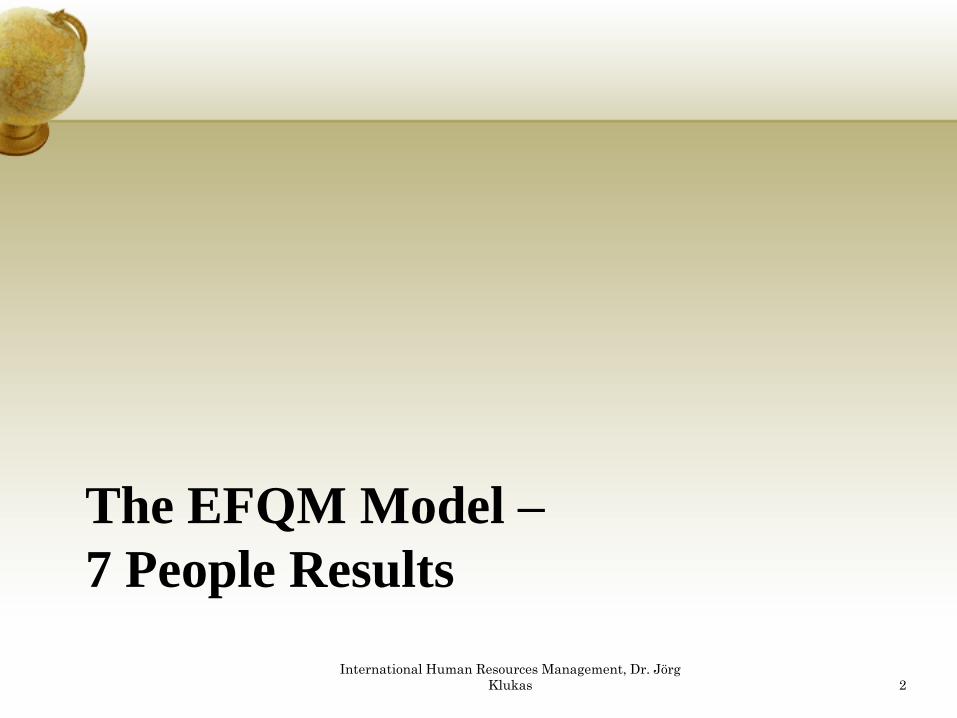
Commitment and EFQM.Q“Top management does a good job of providing leadership.”
•EFQM Members 40%•NON-EFQM Members 33%
“I am satisfied with my involvement in issues that affect I am satisfied with my involvement in issues that affect my work.”
•EFQM Members 62%•NON-EFQM Members 57%
“I feel my performance is evaluated fairly.”•EFQM Members 50%
NON EFQM M b 53%•NON-EFQM Members 53%
“My supervisor develops people’s abilities.”•EFQM Members 49%EFQM Members 49%•NON-EFQM Members 50%
International Human Resources Management, Dr. Jörg Klukas 57

Commitment and Business Performance.•Period watched from 1999 to 2001
•Change in operating margin•High commitment companies +3,74%•Low commitment companies -2,01%
•Change in net profit margin•High commitment companies +2,06%
L i i 1 38%•Low commitment companies -1,38%
International Human Resources Management, Dr. Jörg Klukas 58

Commitment in the Cycle of Success.yValue added
KPIs
Number 1 in Germany
Customer People
Greater Loyalty Stronger Involvement
Customer Loyalty Index: 87
New Media Service Ranking
Participation Rate in Empl. Survey: 92 %Satisfaction Work Conditions: 99
Revenue65 m€
ROIHR
1,19per head revenue158T€
y yRecommendation Rate: 90%Willingness to Reorder: 90%Willingness to be announced as reference: 89%
Satisfaction Work Conditions: 99Satisfaction Job: 98Satisfaction Compensation: 79
Average Customer S ti f ti I d 90
Top100 Ranking as one of the most innovative German companies
Employee Commitment : 8,1Employee Commitment Benchmark:
Stronger CommitmentGreater Benefit
Satisfaction Index: 90
100 = fully satisfied 0 = unsatisfied
•Professional and innovative solutions based on internet and multimedia p y
7,2Top10% TRI*M: 7,8 Number of Certificates: 255
• thereof Technology: 126• thereof Quality: 50• thereof PMI/ITIL/Test: 75
More Experiences
technologies
•Customer s win awards and rankings for there internet sites:E-Oscar, iF, Goldene Biene, E-Result
More Experiences, Increased Productivity
Project/Service ExpertiseInternational Human Resources Management, Dr. Jörg Klukas 59

Commitment.•International Comparison:
•Europe 70%
•Norway, Denmark, Austria, Spain 76%•Germany, Finland, Switzerland, Greece 74%•Belgium 73%•Netherlands, Portugal 72%
T k 71%•Turkey 71%•Italy, Sweden 70%•Czech Republic 69%•France 67%France 67%•Poland 66%•Hungary 61%•UK 59%•Ireland 55%
International Human Resources Management, Dr. Jörg Klukas 60

Example TRI*M Commitments (2000)p ( )
10 0ITI
10,0
7,97,9 8,08,07,87,8 7,87,8 7 77 7
7,37,3
7,07,0 7,17,1
7,47,4
6 96 9
,,
6 96 97,17,1
,,
7,07,0
7,77,7
6 96 97,17,1
7,67,6
6 96 97,17,1
6,76,7
7,07,0
6,36,3
6,96,9
6,46,46 26 2
6,96,9 6,86,8
6 26 2
7,07,0 6,96,9
6,66,6
6 26 2
6,96,96,76,7
Top 10%
Top 30%
Medium
Bottom 30%Europe
6,16,1
CentralEurope
NorthEurope
6,26,2
SouthEurope
6,26,26,06,0
West-Europe
6,16,1
Germany
6,26,2
Bottom 10%EuropeEurope Europe Europe
(incl. D)
International Human Resources Management, Dr. Jörg Klukas 61

MOTIVATIONPeople’s Perceptions of the Organization
MOTIVATION
International Human Resources Management, Dr. Jörg Klukas 62

Motivation – Customer Retention and Employees Involvement.p y• Business Units with moderate involvement of employees and
moderate customer retention are in average financial better than b i i i h hi h l l f f
Partly optimized Optimized
business units with a high level of one factor.
HighPartly optimized
units which are working 1,7 times
more effectivethan not optimized units
Optimized units which are working
3,4 times more effective
than not optimized unitsp p
Not optimized Partly optimized
units which are working 1 7 ti
CustomerRetention
pBusiness units 1,7 times
more effectivethan not optimized units
Low
Low Involvement/MotivationHigh
International Human Resources Management, Dr. Jörg Klukas 63

SATISFACTION7a People’s Perceptions of the Organization
SATISFACTION
International Human Resources Management, Dr. Jörg Klukas 64

Satisfaction.Employees are:•happy contented and fulfill their desires and needs at workhappy, contented and fulfill their desires and needs at work•Satisfaction is a factor in:
• employee motivation• employee goal achievementemployee goal achievement• positive employee morale in the workplace
•Factors, which improve employees satisfaction:• benefitsbenefits• company activities• positive management within a success framework of goals, measurement and expectations measurement and expectations
•Measured by:• employee satisfaction surveys• in areas such as : management understanding of mission and in areas such as : management, understanding of mission and vision, empowerment, teamwork, communication, and coworker interaction. International Human Resources Management, Dr. Jörg
Klukas 65

What employee want? A typical example of Survey Studiesyp p y1. New professional challenges2 Development opportunities2. Development opportunities3. Pleasant working environment4. Salary4. Salary
Source: Drake Beam Morin, Internationale Befragung 2002
Information & Communication
Work environment
High correlation with overall satisfaction:• Leadership• Information / Communication
OverallUnderstandingStrategy &
Link to Job
Leadership
e o e
Development
Information / Communication• Understanding and Linking Strategy to Job
The closer two areas, the stronger the correlationthe stronger the correlation.
International Human Resources Management, Dr. Jörg Klukas 66

Satisfaction.
Source: Strategies for survival in the war of talent (2002) in: Career Source: Strategies for survival in the war of talent (2002), in: Career Development International
International Human Resources Management, Dr. Jörg Klukas 67

Satisfaction.
• Satisfaction of employees in the United KingdomSatisfaction of employees in the United Kingdom
Strongly disagree 1
Disagree 2
Agree 3
Strongly agree 4
Data from the ETS Employee Survey benchmark Database, UK, 2009 International Human Resources Management, Dr. Jörg
Klukas 68

Satisfaction – Absence.
Source: flickr.com
International Human Resources Management, Dr. Jörg Klukas 69

Satisfaction – Absence-Tendencies.CCH's Law, Explanation and Analysis of the Patient Protection and Affordable Care Act
• The rate of absence is on the rise and U.S. employers are losing ground in their battle against it
• employers are struggling to find effective programs that keep healthy p y gg g p g p yworkers on the job because unscheduled absence can cost large companies an estimated $850,000 per year
• The 2006 survey revealed an absence rate of 2.5 percent—that’s up from 2.3 percent in 2005 2 4 percent in 2004 and 1 9 percent in 2003percent in 2005, 2.4 percent in 2004 and 1.9 percent in 2003
• In fact, the 2006 rate is the highest rate we have seen since 1999, when it was 2.7 percent
• Similar to the 2005 survey results, this year's survey found that 65 percent f h d l d b t t f th b t l of unscheduled absences—two out of every three absent employees—were
for reasons other than personal illness.
Absenteeism Satisfaction
International Human Resources Management, Dr. Jörg Klukas 70

Satisfaction – Monetary Satisfaction.y• Source: payScale
International Human Resources Management, Dr. Jörg Klukas 71

Satisfaction – Monetary Satisfaction.y• Source: http://www.itjoblog.co.uk
International Human Resources Management, Dr. Jörg Klukas 72

7B PERFORMANCE INDICATORS
International Human Resources Management, Dr. Jörg Klukas 73

The EFQM excellence modelQ
Leadership
People
Strateg Processes
People Results
Customer Key Performance 7 P l R ltLeadership Strategy
Partnership& Resources
Processes Results
Society Results
PerformanceResults 7. People Results
a. PerceptionsThese are the people’s perceptions of the organization.
b. Performance IndicatorsThese are the internal measures used by the organization in order to monitor, understand, predict and improve the order to monitor, understand, predict and improve the organizations people.
International Human Resources Management, Dr. Jörg Klukas 74

The EFQM excellence model –People Results.p
P f I di t• These are the internal measures used by the organization in order to monitor, understand, predict
and improve the performance of the organization’s people and to predict their impact on perceptions
Performance Indicators.
perceptions.
• These indicators should give a clear understanding of the efficiency and the effectiveness of deployment and execution of the organization’s people strategy and supporting policies and processes.
D di h f h i i f • Depending on the purpose of the organization, measures may focus on:
• Involvement and engagement
• Target setting, competency and performance management
• Leadership performance
• Training and career development
• Internal communications
International Human Resources Management, Dr. Jörg Klukas 75

7b Performance Indicator for HR Sub Processes, e.g. Plan&Find, g
Procedures
Qualitative HR Planning and Budgeting Quarterly Review as part of Business Unit ReviewsHR Planning and HR Planning and
Review; Mgmt. of Review; Mgmt. of l ditil diti
Measures
Deviations of plans
Main Steps
Updating communications planes, marketing activities and job posts
Allocation of internal and external channels; Organizing communication
and marketing campaigns
Commission of marketing measures and deployment of
communication plan
general conditionsgeneral conditions
HR marketing and HR marketing and communication communication managementmanagement
p
#applicants per open
position; cost of recruiting
Management of general conditions (policies and quota of hiring, training with prioritizing by means of cost-benefit analysis,…)
and marketing campaigns communication planmanagementmanagement
Applicant Applicant
Receipt of application, registration and request of
missing information
Pre-selection by HR and forward to Leaders
Manage leaders responses and follow up
1. Decision:decline, recommend, invite
per open position
time to hire, t pppp
ManagementManagement Management of interviews or assessments
2. Decision:decline, recommend/save, offer
Prepare offer and negotiation
Creation,
success rates of interviews
time to ContractContractManagementManagement
verification, authorization of
contract
Mailing and administration, Information of leaders
Response Controlling, Follow ups Creation of personal files
IntegrationIntegrationM tM t
Preparation of infrastructur, f ilit d i i t ti
1 First Work D Welcome Day
Target Interviews, P b ti
Monitoring integration steps (e.g. initiation
time to contract,
rejection rate
fluctuation (labor
turnover) within ManagementManagement facility, administration,… Day y Probation
Talks
p ( gplan)employment
probation period
76International Human Resources Management, Dr. Jörg
Klukas

Performance Indicators - Examples.pTalents-quota in %• Share of Apprentices/BA-Students/Bachelors/Diploma-
Students/MBA-Students• Definition: Number of Apprentices/Number of Employees• How good is the organization’s prevention for being independent of
the market and framework (e.g. stop of employment)?
Rate of labor turnover rate during the trial period of new l (l th h lf )employees (less than a half year)
• Did the organization made the right choice? • Definition: Number of terminations during the trial
period/Number of Employmentsperiod/Number of Employments• Are the right People employed and trained on the right way?
ø Organization’s expert knowledge in yearsø Organization s expert knowledge in years• Is the organization able to commit employees in the long run?
International Human Resources Management, Dr. Jörg Klukas 77

Degree of certification (Human Capital Readiness Index)Human capital category/objective such as
• Strategy - Strategic competencies
( p )
• Leadership• Talent - Strategic awareness/culture• Culture - Strategic alignment/motivation
Measure of strategic readiness• Leadership Gap Employee Survey of leadership effectiveness • Cultural Alignment Index% Employees understanding strategy Cultural Alignment Index% Employees understanding strategy • Goal Alignment (%)• Incentive Alignment (%)
Source: IPRC, 2010
International Human Resources Management, Dr. Jörg Klukas 78

Consequences of a high turnover rate.q g• High tangible and intangible costs
• Between 50% - 200% of an employee’s annual salary• Severance costs • Unemployment insurance premiums • Outplacement fees• Advertising costs• Training costsetc…
• High turnover rate is often cited as a key barrier to high quality service.
• Reduction of productivity of an entire work unit/team, particularly as a result of uncompensated extra workloads, the stress and tension caused by turnover and, as a result, a decline in corporate morale.
International Human Resources Management, Dr. Jörg Klukas 79
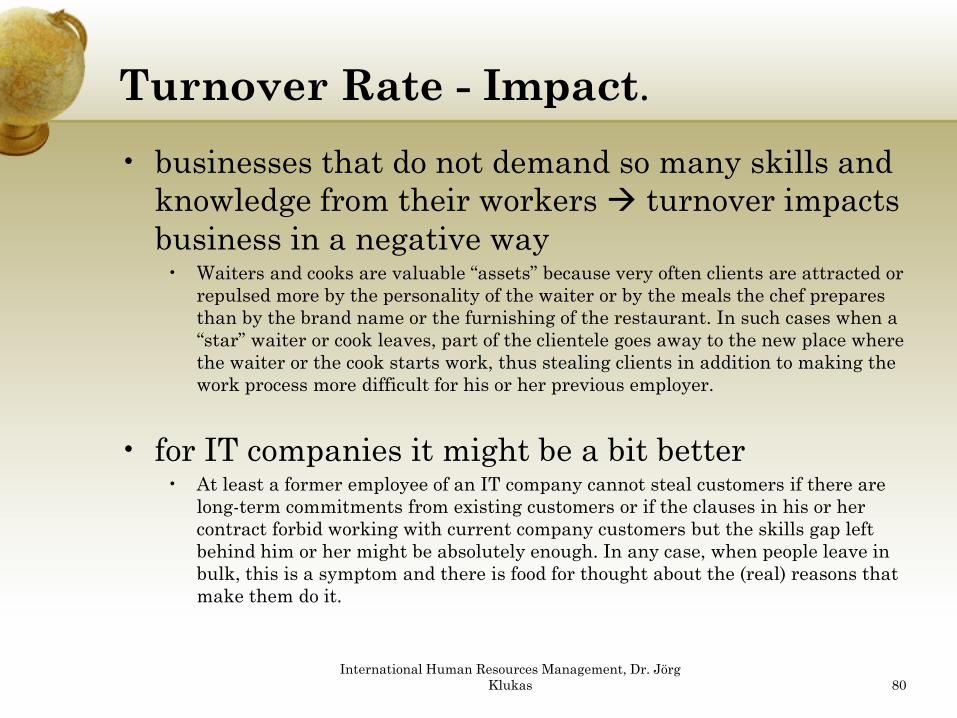
Turnover Rate - Impact.p• businesses that do not demand so many skills and
knowledge from their workers turnover impacts knowledge from their workers turnover impacts business in a negative way
• Waiters and cooks are valuable “assets” because very often clients are attracted or repulsed more by the personality of the waiter or by the meals the chef prepares than by the brand name or the furnishing of the restaurant. In such cases when a “star” waiter or cook leaves, part of the clientele goes away to the new place where the waiter or the cook starts work, thus stealing clients in addition to making the work process more difficult for his or her previous employer.
• for IT companies it might be a bit better • At least a former employee of an IT company cannot steal customers if there are
long-term commitments from existing customers or if the clauses in his or her long term commitments from existing customers or if the clauses in his or her contract forbid working with current company customers but the skills gap left behind him or her might be absolutely enough. In any case, when people leave in bulk, this is a symptom and there is food for thought about the (real) reasons that make them do it.
International Human Resources Management, Dr. Jörg Klukas 80

Turnover Rate – Industry Average.y g
International Human Resources Management, Dr. Jörg Klukas 81

Reasons for Termination.Types of termination
Termination agreement Termination by
End of fixed-termcontract
20%
10%Termination by
Employer32%
Initiative for termination of employment
b
Termination by Employee
38%
… byemployer
44%… by
employee49%
Both7%
International Human Resources Management, Dr. Jörg Klukas 82
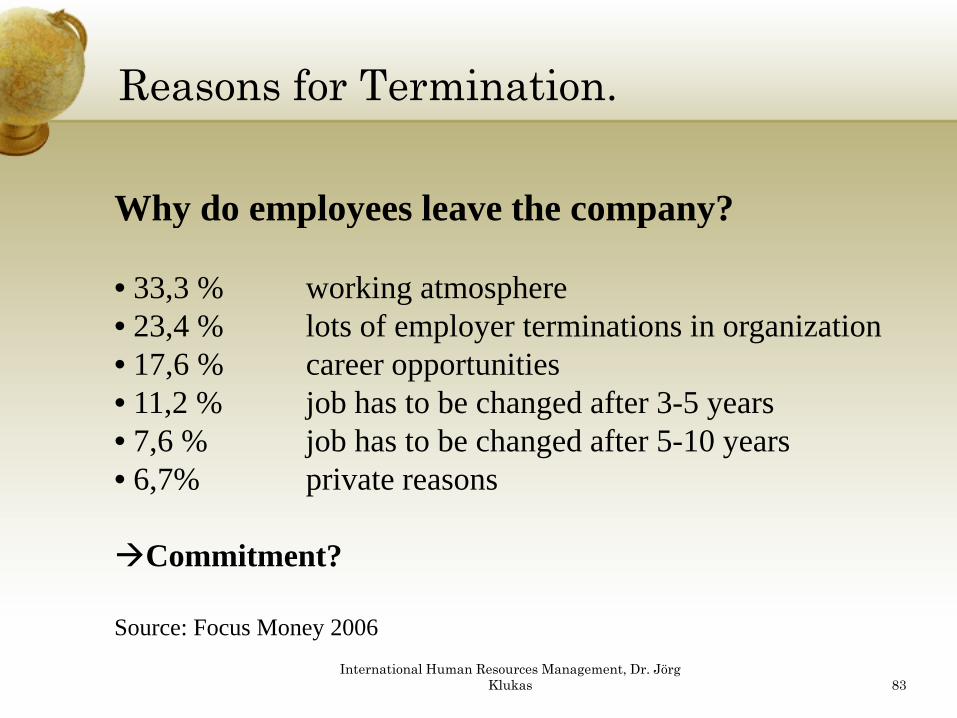
Reasons for Termination.
Why do employees leave the company?Why do employees leave the company?
• 33,3 % working atmosphere • 23,4 % lots of employer terminations in organization • 17,6 % career opportunities • 11,2 % job has to be changed after 3-5 years11,2 % job has to be changed after 3 5 years • 7,6 % job has to be changed after 5-10 years• 6,7% private reasons
Commitment?
Source: Focus Money 2006International Human Resources Management, Dr. Jörg
Klukas 83

The role of employee satisfaction and the costs of turnover.
Satisfaction Turnover Rate Commitment
Career opportunities, including: Availability of training, including:• Perceived opportunity for advancement • Presence and/or clarity of development plan.Enjoyment of the work, including:• How well work utilizes skills
• Opportunity to learn new skills/develop new talents • Corporate commitment to training and development • Keeping up with latest technology.Compensation/rewards, including:How well work utilizes skills
• “Fit” with job • Work/life balance.Corporate leadership, including:
Compensation/rewards, including:• Base/variable pay • Benefits • Recognition of contributions • Communication regarding performance• Clarity and strength of vision and mission
• Management style • Overall perception of leadership • Level of respect and support received.
• Communication regarding performance.
International Human Resources Management, Dr. Jörg Klukas 84

Number of applications for each vacancy.pp y
• poll of employers by Association of Graduate Recruiters in 2010 (over 200 firms including Recruiters in 2010 (over 200 firms including Cadbury, Marks & Spencer, JP Morgan and Vodafone):
f f • Highly increasing number of applications for each vacancy (today: 68,8)
• In hotly contested sectors (makers of fast-moving d ) l f h j bconsumer goods): 205 applications for each job
• number of available positions: predicted to fall by nearly 7%
International Human Resources Management, Dr. Jörg Klukas 85

Work related illness.• higher prevalence in a body of workers (e.g.
department) than in the general populationdepartment) than in the general population• Different types
• Stress• Climatic conditions (e.g. offices with air conditions,
geographical region with high humity etc.)• Radiation (for workers in nuclear industry)
L di ( i k )• Lung disease (mine workers)• Skin disease (hairdressing, printing)
International Human Resources Management, Dr. Jörg Klukas 86

Work related illness.
Costs? Commitment?
International Human Resources Management, Dr. Jörg Klukas 87

Work related illness.• Since 2000: working days lost per
worker with a statistically significant fall of nearly 30% significant fall of nearly 30%
• Statistically significant falls over the period for both injury absence and days lost resulting from work-y grelated illness
• Average working days lost per worker as a result of work-related ill h lth f ll b 28% th ill health fell by 28% over the decade
Source: HSE: The Health and SafetyExecutive Statistics 2009/10, GreatBritain
International Human Resources Management, Dr. Jörg Klukas 88

Time-To-Fill.
Need for employeesSign up of the labour contract
Start HR marketing End of onboarding
Permission for position
Selection of candidates
First working day
End of trial period
Permission for position g y
Time to fillTime to fillInternational Human Resources Management, Dr. Jörg
Klukas 89

Media Resonance Analysis.y• Shows the media presence of a company, e.g.
• number of contributions number of contributions • contact coverage • distribution across media types and regions
f f • level of awareness of the corporate messages (mentions per article, presence in headlines and on pictures etc.)
Source: flickr.com
International Human Resources Management, Dr. Jörg Klukas 90

Employment Costs. p yThe Employment Cost Index•quarterly report of compensation costs in USAquarterly report of compensation costs in USA•presents the relative changes in wages, bonuses and benefits•provided by the U.S. Bureau of Labor Statistics
Employment cost Index, 3-month percent change, seasonally adjusted, civilian j ,workers, compensation, Sep. 2008-Sep. 2010, source: BLS News Release 10/2010
International Human Resources Management, Dr. Jörg Klukas 91

market leader in Germany
1. 1.1. 1. 1.Driver for SuccessExample T-Systems MMS
10.
5.
M€ turnover46
5665
a p e Syste s S
employee commitment (TRI*M )
customer satisfaction index
86
88 8932
17
24
34
91
(TRI*M )
7 7
7.98.18.3
82
8686
80
17
LEP AwardWinner+
EEAPrize Winner
EEAPrize Winner
+
8.1
7.67.7
7 1EEA
Recognized for
EEAFinalist
+ 2. Platz
BestPersAward
+LEP
PriceWinner+
3. Platz BestPersAward
7.1
International Best Service Award
EEARecognized for
Excellence
gExcellence
1995 1996 1997 1998 1999 2000 2001 2002 2003 2004 2005 2006International Human Resources Management, Dr. Jörg
Klukas 92

Contact me!Dr. Jörg Klukas• XING: https://www xing com/profile/Joerg KlukasXING: https://www.xing.com/profile/Joerg_Klukas• Facebook: http://www.facebook.com/home.php?#!/joerg.klukas• Slideshare: http://www.slideshare.net/pludoni• Twitter: http://twitter com/pludoniTwitter: http://twitter.com/pludoni• Email: [email protected]
International Human Resources Management, Dr. Jörg Klukas 93