Embed Size (px)
Citation preview

Monitoring Effects of a Potential Increased Tidal Range in the Cape Fear River Ecosystem Due to Deepening
Wilmington Harbor, North Carolina Year 7: June 1, 2006 – May 31, 2007
Prepared for the U.S. Army Corps of Engineers, Wilmington District
Contract No DACW 54-02-0009
Project Manager
Courtney T. Hackney Department of Biology and Marine Biology University of North Carolina Wilmington
601 S. College Road Wilmington, NC 28403
Principal Investigators
Courtney T. Hackney, Ph.D., Department of Biology and Marine Biology Martin Posey, Ph.D., Department of Biology and Marine Biology Lynn A. Leonard, Ph.D., Department of Geography and Geology Troy Alphin, M.S., Department of Biology and Marine Biology
G. Brooks Avery, Jr., Ph.D., Department of Chemistry and Biochemistry David M. DuMond, M.S. Adjunct Faculty, Department of Biology and Marine Biology
Research Associates
Jason L. Hall, B.A., Field Crew Chief and Senior Technician
Robert Lomax, B.S., Field Technician Alex Croft, M.S., Research Specialist
Russ Barbour, M.S., Benthic Crew Chief
Student Field and Laboratory Assistants
David Moose, Devon Olivola, Steven Artabane, Sara Colosimo, Jennifer Kelly, Jeremy LaRosa, Ann Markwith, Antario McDonald, Mebane Sherard, Michael Tuttweiler,
Nicole Lancaster, Jesse Baldwin, and Ben Kearns
JANUARY 2008

Acronyms Used in this Report
ANOSIM Analysis of Similarity ANOVA Analysis of Variance DCP Data Collection Platform M Methanogenic MPSR Methanogenic with evidence of past sulfate reduction MSL Mean Sea Level PPT Parts Per Thousand SR Sulfate Reducing SRNS Sulfate reducing with non-seawater source of sulfate UNCW University of North Carolina Wilmington USACE United States Army Corps of Engineers USGS United States Geological Survey
ii
Monitoring Effects of a Potential Increased Tidal Range in the Cape Fear River Ecosystem Due to Deepening
Wilmington Harbor, North Carolina Year 7: June 1, 2006 – May 31, 2007
ABSTRACT
Despite a few mechanical problems that resulted in data loss at some stations, data loss this year was lower than most previous years because the base station, upon which all comparative data is based, lost only 4% of tides from all causes. The station that had the greatest loss of tidal range data was P14 (Prince George Creek), which lost 10.1% of tides due to mechanical errors. Similar to P9 (Black River), this site is prone to water level equipment failures during major flooding events that significantly raise water levels in the river. The remote nature of these two sites coupled with the conversion of phone towers to a digital only format has made problems more difficult to detect. Even with the typical data loss described, there were still more than 1400 tide ranges measured between 1 June 2006 and 31 May 2007 that were available for analyses.
A good correlation between measured tidal range from the base station at Ft Caswell (P1), and the predicted tidal range for this station continued to exist. Tidal range upstream diminished with distance upstream and water levels at the most upstream sites and the inner Town Creek station continued to be more affected by discharge rates in their respective drainages than stations lower in the river. Comparisons of the regression slopes, when tidal range at each site was regressed against P1 tidal range, yielded significant differences between this reporting period and the previous reporting period for almost one-half of the stations (P6, P7, P8, P9, and P11). When the slopes from this reporting period were compared to slopes calculated for Year 1 (2000-2001), only sites P2, P4, P6, and P11 yielded a significant difference in slope between years. There were also some significant differences in yearly mean tidal ranges between this reporting period and 2005-2006. These occurred primarily in the upstream stations. Mean tidal range at seven out of eleven of the river monitoring stations were significantly different from the mean tidal range reported in Year 1 of monitoring. This year (2006-2007) flow conditions were more similar to those reported during 2003-2004 and in excess of both Year 1 the 30 year average. The similarity in discharge rates between this project year and 2003-2004 reporting period, may explain the greater similarity in mean tidal ranges between these two reporting periods than between this reporting period and the previous 2 reporting periods. At present, our observations indicate that upstream discharge plays a significant role in determining mean tidal range.
In general, salinities at P8 (Eagle Island) were low (0.1-0.5 parts per thousand (ppt)) and reflected the range of salinities expected for normal to above average flow. However, in late summer to early fall 2006, river discharge was relatively low compared to the remainder of the year, and a maximum salinity (5.4 ppt) more indicative of drought conditions was recorded. September was the only month when site P8 exhibited salinity greater than 0.5 ppt. At P13, measured salinities were consistent with those expected
iii

during average to above average flow conditions. The maximum salinity of 8.4 ppt occurred in May 2007 at this site.
For the first time this year, cruises upstream from P7 to Lock and Dam 1 were made to determine the degree that ocean-derived saline water extended upstream. During the nine cruises, flow over Lock & Dam 1 ranged from 963 cfs to 3,640 cfs. Collection in September 2006 found no saline water in the water column at any site. Data collected in May 2006, during the lowest flow period, also did not detect saline water at any site. No saline water was measured during any of the nine cruises upstream of P7.
There were some marked differences in flooding frequency within swamps and marshes at a number of upstream stations. Significant differences in tidal ranges, as noted earlier, occurred in 2006-2007 compared to both the previous reporting year and the initial year (2000-2001). Most occurred for upstream stations and likely result from inter-annual difference in upstream discharge. Thus, flooding at these stations is limited when mean water levels are lower and the mean tidal range is lower. Salinity largely reflected conditions in the river, i.e. generally lower.
The biogeochemistry of sediments in the current year was characterized by the fact that each month at P8 was independent of the previous month’s condition indicating the lack of carryover from one month to the next. This suggests that sediments at P8 were well flushed. Consumption of sulfate in sediments was more rapid this year when present, resulting in conditions unable to support active sulfate reduction. This resulted in a combination of sulfate reducing, methane producing with evidence of past sulfate reduction, and even some methane reducing conditions where conditions were generally more sulfate reducing in past years. Patterns observed at P8, where analyses occur monthly, generally reflect lower, but highly variable, salinities resulting from higher flow rates from upstream drainage interacting with the strong tidal signal that occurs at this station. There were no discernible seasonal trends or patterns at Eagle Island during the current year similar to previous years where one season was more or less saline for an extended period. Pulses in salinity were observed during June, September, October, and May at individual subsites within P8. More freshwater led to more stations upstream of P8 becoming methanogenic and where there was sulfate reduction, it was highly variable.
Richness and diversity for 2006 infauna was intermediate and not significantly different from 2005. Analysis of Similarity and Multidimensional Scaling Analysis indicated that 1999-2001 samples did not have significantly dissimilar faunal assemblages from 2006. However, subsequent years after 1999-2001 did have distinct infaunal assemblages relative to the initial data as well as from each other. Note that benthic samples were collected in June and may reflect the hydrologic conditions described in the previous report more than those discussed here. There is often a notable lag in the response of the benthic community to changes in salinity.
Conversely, epibenthos (fish, crabs, shrimp, etc.) are mobile, collected in spring and fall and tend to reflect more recent hydrologic conditions than the benthos. Breder traps (a passive sampling device) deployed at multiple tidal positions within the marsh
iv
and Drop traps (an active density based sampling method) deployed along the shallow subtidal marsh edge habitat, record both presence and movement of this important component of the estuary. Previous findings indicated changes in species patterns consistent with developing drought conditions in 2001 and 2002, though this period was also coincident with initial construction activity. The current 2006-2007 (spring 2007) sampling period also represents the initial stages of potential drought conditions (rainfall records <12 inches below annual average), but few indications of a response in the epibenthic fish community were noted. Normal seasonal differences include shifts in species compositions, richness, and diversity. Seasonal shifts in species composition and shifts in abundance were expected based on life history strategies of common taxa. Overall, fall 2006 and spring 2007 represented seasons with intermediate abundances, diversity, and species richness.
Monitoring of sensitive herbaceous vegetation at seven stations in the Cape Fear River estuary was completed for the seventh year in August 2006. Sensitive vegetation responds relatively quickly to hydrologic conditions covered in this year’s report (June and July). Changes this year have been largely those anticipated based upon salinity. The dominant sensitive herbaceous species at P3 (Town Creek), Zizaniopsis miliacea, has expanded toward Town Creek where it is currently mixing with Spartina cynosuroides, a species more regularly associated with margins of more saline creeks. The stand of Zizaniopsis miliacea has largely ceased expansion in one direction, but appears to be expanding north toward the northern boundary of the belt transect. This year the polygon has increased in size by about 2,000 ft2. Zizania aquatica appeared last year for the first time in the center of the older portion of the sensitive herbaceous vegetation polygon. This species, more of an indicator of oligohaline conditions, is continuing to survive. No new species were noted within the polygon this year.
At P7, no new sensitive herbaceous species were observed in the plot this year, but Lycopus virginicus once again became visible. Overall cover within the plot has diminished considerably due to loss of substrate from erosion. Relocation of this sampling station must be considered since the tidal swamp forest habitat along the Cape Fear River just south of Indian Creek is being cleared. Dollisons Landing (P8) contains two new species, Hydrocotyle verticillata, and Lycopus virginicus. Both species are characteristic of wooded freshwater wetlands, but the former is usually in non-tidal habitats and the latter is often associated with low hummocks or rotten stumps. Saururus cernuus contributed less cover this year. Black River (P9) has experienced no salinity events and has remained much the same as last year with the exception of the loss of Ludwigia palustris.
In the Northeast Cape Fear River stations, boundaries of Rat Island’s (P12) sensitive herbaceous vegetation plot have remained fixed since last year and dominance is still largely shared between Schoenoplectus americanus, the sensitive herbaceous species, and Spartina cynosuroides, the non-sensitive herbaceous species. Cover by live stems of Schoenoplectus americanus is down from 90 percent last year to 50 percent this year. This year many of the stems of this species have fallen or show signs of stress, perhaps from salinity events that occurred late last year. There are no new sensitive
v

herbaceous plant species this year, but Peltandra virginica was again present, likely from rhizomes. At Fishing Creek (P13), the sensitive herbaceous polygon has shown a loss of cover by the long dominant Pontederia cordata and for the first time, Peltandra virginica, more tolerant of low salinity habitats, became the overall dominant plant in the plot. This shift, along with a slow increase in diversity at the site may indicate a slight shift toward more brackish conditions. No significant salinity event was detected at the Prince George Creek (P14) monitoring station and the sensitive herbaceous polygon remains much as it was last year.
vi

Monitoring Effects of a Potential Increased Tidal Range in the Cape Fear River Ecosystem Due to Deepening
Wilmington Harbor, North Carolina Year 7: June 1, 2006 – May 31, 2007
TABLE OF CONTENTS PageCOVER SHEET................................................................................................................... i ABSTRACT........................................................................................................................ ii TABLE OF CONTENTS................................................................................................... vi LIST OF TABLES........................................................................................................... viii LIST OF FIGURES .......................................................................................................... xii LIST OF APPENDICES.................................................................................................. xiv 1.0 STATION OPERATION.........................................................................................1
1.1 Summary ......................................................................................................1 1.2 Methodology................................................................................................1 1.3 Ft Caswell (P1) ............................................................................................2 1.4 Town Creek Mouth (P2) ..............................................................................4 1.5 Inner Town Creek (P3) ................................................................................4 1.6 Corps Yard (P4) ...........................................................................................4 1.7 Eagle Island (P6)..........................................................................................4 1.8 Indian Creek (P7).........................................................................................4 1.9 Dollisons Landing (P8) ................................................................................5 1.10 Black River (P9) ..........................................................................................5 1.11 Smith Creek (P11)........................................................................................5 1.12 Rat Island (P12) ...........................................................................................5 1.13 Fishing Creek (P13) .....................................................................................5 1.14 Prince George Creek (P 14) .........................................................................5
2.0 MONUMENT AND STATION SURVEY VERIFICATION ................................6
2.1 Summary ......................................................................................................6
3.0 PART A - RIVER WATER LEVEL/SALINITY MONITORING.........................6 3.1A Summary ......................................................................................................6 3.2A Database.......................................................................................................8 3.3A Data Analyses Methods ...............................................................................8 3.4A Tidal Effects...............................................................................................15 3.41A Ft. Caswell (P1) and Outer Town Creek (P2)............................................15 3.42A Inner Town Creek (P3) ..............................................................................18
vii

3.43A Corps Yard (P4) .........................................................................................19 3.44A Cape Fear River: Eagle Island (P6), Indian Creek (P7), Dollisons
Landing (P8) and Black River (P9) ...........................................................20 3.45A Northeast Cape Fear River: Smith Creek (P11), Rat Island (P12),
Fishing Creek (P13), and Prince George Creek (P14)...............................24 3.5A Influence of Upstream Flow ......................................................................27 3.6A Tidal Harmonics.........................................................................................29
3.0 PART B – SALINITY PROFILES IN THE CAPE FEAR RIVER TO LOCK AND DAM 1..............................................................................................34 3.1B Summary ....................................................................................................34 3.2B Background................................................................................................34 3.3B Methods......................................................................................................36 3.4B Results........................................................................................................36
4.0 MARSH/SWAMP FLOOD AND SALINITY LEVELS ......................................37
4.1 Summary ..........................................................................................................37 4.2 Data Base .........................................................................................................37 4.3 Marsh/Swamp Flooding...................................................................................43 4.4 Water Salinity in Marshes and Swamps ..........................................................44
5.0 MARSH/SWAMP BIOGEOCHEMISTRY ..........................................................45
5.1 Summary ..........................................................................................................45 5.2 Geochemical Theory and Classification ..........................................................45 5.3 Geochemical Methodology..............................................................................46 5.4 Eagle Island (P6) Annual Cycles of Sulfate, Chloride & Methane .................47 5.5 Marsh/Swamp Transect Stations, Geochemistry, Annual Variability .............55 5.51 Town Creek (P3)........................................................................................55 5.52 Indian Creek (P7).......................................................................................89 5.53 Dollisons Landing (P8) ..............................................................................97 5.54 Black River (P9) ........................................................................................98 5.55 Smith Creek (P11)......................................................................................98 5.56 Rat Island (P12) .........................................................................................98 5.57 Fishing Creek (P13) ...................................................................................99 5.58 Prince George Creek (P14) ......................................................................100 5.6 Long Term Trends and Change ...............................................................110
6.0 BENTHIC INFAUNAL COMMUNITIES..........................................................113
6.1 Summary ........................................................................................................113 6.2 Background....................................................................................................113 6.3 Methodology..................................................................................................115 6.4 Faunal Patterns ..............................................................................................116
7.0 EPIBENTHIC STUDIES: DECAPODS AND EPIBENTHIC FISH..................144
7.1 Summary ........................................................................................................144 7.2 Background....................................................................................................144
viii

7.3 Methodology..................................................................................................147 7.4 Community Evaluation ............................................................................148
8.0 SENSITIVE HERBACEOUS VEGETATION SAMPLING..............................192
8.1 Summary ........................................................................................................192 8.2 Introduction and Background ........................................................................193 8.3 Methodology..................................................................................................194 8.4 Hydrologic Events and Sensitive Vegetation ................................................195 8.41 Inner Town Creek ....................................................................................195 8.42 Indian Creek.............................................................................................199 8.43 Dollisons Landing....................................................................................203 8.44 Black River ..............................................................................................206 8.45 Rat Island .................................................................................................208 8.46 Fishing Creek ...........................................................................................211 8.47 Prince George Creek ................................................................................214 8.5 Discussion................................................................................................217
9.0 LITERATURE CITED ........................................................................................219
LIST OF TABLES
Table Page1.1-1 Percentages of tides unavailable for analysis and reasons for loss....................2 3.3A-1 Monthly maximum, minimum, and range of salinity values for each
station...............................................................................................................10 3.3A-2 Summary of statistical analyses of mean annual water level
comparisons for each of the 11 data collection platforms (DCP)....................13 3.3A-3 Summary of statistical tests for yearly data collected at the 11 DCP
stations .............................................................................................................13 3.3A-4 Summary of tidal data generated from the 11 DCP stations along the
Cape Fear River and tributaries .......................................................................14 3.3A-5 Yearly comparisons of mean monthly maximum and minimum water
levels collected at the 11 DCP stations ............................................................15 3.5A-1 Mean tidal ranges for upriver stations in both the Cape Fear River and
Northeast Cape Fear River...............................................................................29 3.6A-1 Summary of tidal harmonics for reporting period 2006-2007 .........................30 3.6A.2 Summary of yearly tidal harmonics for station P4 from 1994 to 2006 ...........32 4.2-1 Flooding frequency, duration and depth, and actual water level of
marsh/swamp substations during fall 2006......................................................37 4.2-2 Flooding frequency, duration and depth, and actual water level of
marsh/ swamp substations during spring 2007 ................................................39 4.2-3 Summary of salinity data from nine substations collected along the
Cape Fear River and its tributaries in fall 2006 ...............................................41 4.2-4 Summary of salinity data from nine substations collected along the
Cape Fear River and its tributaries in spring 2007 ..........................................42
ix

5.4-1 Eagle Island (P6) Geochemical Classifications by month...............................54 5.51-1 Salinity of Sites ................................................................................................56 5.51-2 Classification of Sites in Summer....................................................................64 5.51-3 Classification of Sites in Winter ......................................................................72 5.51-4 Methane Concentrations of Sites .....................................................................80 5.52-1 Sulfate Concentrations of Sites........................................................................89 5.58-1 Chloride Concentrations of Sites ...................................................................101 6.4-1a Mean (no. per 0.01 m2) and (standard error) for all taxa collected on
the Town Creek mouth site (P2) during June 1999, 2000, 2001, 2002, 2003, 2004, 2005, and 2006...........................................................................117
6.4-1b Mean (no. per 0.01 m2) and (standard error) for all taxa collected on the Town Creek mouth site (P2) during June 1999, 2000, 2001, 2002, 2003, 2004, 2005, and 2006...........................................................................118
6.4-2a Mean (no. per 0.01 m2) and (standard error) for all taxa collected at P3A upper Town Creek sites during June 1999, 2000, 2001, 2002, 2003, 2004, 2005, and 2006...........................................................................119
6.4-2b Mean (no. per 0.01 m2) and (standard error) for all taxa collected at P3A upper Town Creek sites during June 1999, 2000, 2001, 2002, 2003, 2004, 2005, and 2006...........................................................................120
6.4-3a Mean (no. per 0.01 m2) and (standard error) for all taxa collected at P3B upper Town Creek sites during June 1999, 2000, 2001, 2002, 2003, 2004, 2005, and 2006...........................................................................121
6.4-3b Mean (no. per 0.01 m2) and (standard error) for all taxa collected at P3B upper Town Creek sites during June 1999, 2000, 2001, 2002, 2003, 2004, 2005, and 2006...........................................................................122
6.4-4a Mean (no. per 0.01 m2) and (standard error) for all taxa collected at the lowest main-stem Cape Fear site P6 during June 1999, 2000, 2001, 2002, 2003, 2004, 2005, and 2006.................................................................123
6.4-4b Mean (no. per 0.01 m2) and (standard error) for all taxa collected at the lowest main-stem Cape Fear site P6 during June 1999, 2000, 2001, 2002, 2003, 2004, 2005, and 2006.................................................................124
6.4-5a Mean (no. per 0.01 m2) and (standard error) for all taxa collected at P7 on the main-stem Cape Fear during June 1999, 2000, 2001, 2002, 2003, 2004, 2005, and 2006...........................................................................125
6.4-5b Mean (no. per 0.01 m2) and (standard error) for all taxa collected at P7 on the main-stem Cape Fear during June 1999, 2000, 2001, 2002, 2003, 2004, 2005, and 2006...........................................................................127
6.4-6a Mean (no. per 0.01 m2) and (standard error) for all taxa collected at P8 on the main-stem Cape Fear during June 1999, 2000, 2001, 2002, 2003, 2004, 2005, and 2006...........................................................................128
6.4-6b Mean (no. per 0.01 m2) and (standard error) for all taxa collected at P8 on the main-stem Cape Fear during June 1999, 2000, 2001, 2002, 2003, 2004, 2005, and 2006...........................................................................129
6.4-7a Mean (no. per 0.01 m2) and (standard error) for all taxa collected at P11 on the NE Cape Fear River during June 1999, 2000, 2001, 2002, 2003, 2004, 2005, and 2006...........................................................................130
x

6.4-7b Mean (no. per 0.01 m2) and (standard deviation) for all taxa collected at P11 on the NE Cape Fear River during June 1999, 2000, 2001, 2002, 2003, 2004, 2005, and 2006.................................................................131
6.4-8a Mean (no. per 0.01 m2) and (standard error) for all taxa collected at P12 on the NE Cape Fear River during June 1999, 2000, 2001, 2002, 2003, 2004, 2005, and 2006...........................................................................132
6.4-8b Mean (no. per 0.01 m2) and (standard deviation) for all taxa collected at P12 on the NE Cape Fear River during June 1999, 2000, 2001, 2002, 2003, 2004, 2005, and 2006.................................................................133
6.4-9a Mean (no. per 0.01 m2) and (standard deviation) for all taxa collected at P13 on the NE Cape Fear River during June 1999, 2000, 2001, 2002, 2003, 2004, 2005, and 2006.................................................................134
6.4-9b Mean (no. per 0.01 m2) and (standard deviation) for all taxa collected at P13 on the NE Cape Fear River during June 1999, 2000, 2001, 2002, 2003, 2004, 2005, and 2006.................................................................135
6.4-10 Among year comparison of species richness for the infaunal community .....................................................................................................137
6.4-11 Among year comparison of species diversity for the infaunal community .....................................................................................................139
6.4-12 Among-year comparison of diversity and species richness for each site ......141 7.4-1a Mean abundance (SE) for epibenthic fauna collected during fall (1999-
2006) Breder trap samples at station P2 (Mouth of Town Creek).................152 7.4-1b Mean abundance (SE) for epibenthic fauna collected during spring
(2000-2007) Breder trap samples at station P2 (Mouth of Town Creek) ......153 7.4-2a Mean abundance (SE) for epibenthic fauna collected during fall (1999-
2006) Breder trap samples at station P3A (Town Creek) ..............................154 7.4-2b Mean abundance (SE) for epibenthic fauna collected during spring
(2000-2007) Breder trap samples at station P3A (Town Creek) ...................155 7.4-3a Mean abundance (SE) for epibenthic fauna collected during fall (1999-
2006) Breder trap samples at station P3B (Town Creek) ..............................156 7.4-3b Mean abundance (SE) for epibenthic fauna collected during spring
(2000-2007) Breder trap samples at station P3B (Town Creek)....................157 7.4-4a Mean abundance (SE) for epibenthic fauna collected during fall (1999-
2006) Breder trap samples at station P6 (Eagle Island).................................158 7.4-4b Mean abundance (SE) for epibenthic fauna collected during spring
(2000-2007) Breder trap samples at station P6 (Eagle Island) ......................159 7.4-5a Mean abundance (SE) for epibenthic fauna collected during fall (1999-
2006) Breder trap samples at station P7 (Indian Creek) ................................160 7.4-5b Mean abundance (SE) for epibenthic fauna collected during spring
(2000-2007) Breder trap samples at station P7 (Indian Creek) .....................161 7.4-6a Mean abundance (SE) for epibenthic fauna collected during fall (1999-
2006) Breder trap samples at station P8 (Dollisons Landing) .......................162 7.4-6b Mean abundance (SE) for epibenthic fauna collected during spring
(2000-2007) Breder trap samples at station P8 (Dollisons Landing) ............163 7.4-7a Mean abundance (SE) for epibenthic fauna collected during fall (1999-
2006) Breder trap samples at station P11 (Smith Creek)...............................164
xi

7.4-7b Mean abundance (SE) for epibenthic fauna collected during spring (2000-2007) Breder trap samples at station P11 (Smith Creek) ....................165
7.4-8a Mean abundance (SE) for epibenthic fauna collected during fall (1999-2006) Breder trap samples at station P12 (Rat Island) ..................................166
7.4-8b Mean abundance (SE) for epibenthic fauna collected during spring (2000-2007) Breder trap samples at station P12 (Rat Island)........................167
7.4-9a Mean abundance (SE) for epibenthic fauna collected during fall (1999-2006) Breder trap samples at station P13 (Fishing Creek) ............................168
7.4-9b Mean abundance (SE) for epibenthic fauna collected during spring (2000-2007) Breder trap samples at station P13 (Fishing Creek)..................169
7.4.10a Mean abundance (SE) for epibenthic fauna collected in fall drop trap sampling at station P2 (Mouth of Town Creek).............................................170
7.4.10b Mean abundance (SE) for epibenthic fauna collected in spring drop trap sampling at station P2 (Mouth of Town Creek) .....................................171
7.4.11a Mean abundance (SE) for epibenthic fauna collected in fall drop trap sampling at station P3 (Town Creek).............................................................172
7.4.11b Mean abundance (SE) for epibenthic fauna collected in spring drop trap sampling at station P3 (Town Creek) .....................................................173
7.4-12a Mean abundance (SE) for epibenthic fauna collected in fall drop trap sampling at station P6 (Eagle Island).............................................................174
7.4-12b Mean abundance (SE) for epibenthic fauna collected in spring drop trap sampling at station P6 (Eagle Island) .....................................................175
7.4.13a Mean abundance (SE) for epibenthic fauna collected in fall drop trap sampling at station P7 (Indian Creek)............................................................176
7.4.13b Mean abundance (SE) for epibenthic fauna collected in spring drop trap sampling at station P7 (Indian Creek) ....................................................177
7.8-14a Mean abundance (SE) for epibenthic fauna collected in fall drop trap sampling at station P8 (Dollisons Landing)...................................................178
7.8-14b Mean abundance (SE) for epibenthic fauna collected in spring drop trap sampling at station P8 (Dollisons Landing)............................................179
7.4-15a Mean abundance (SE) for epibenthic fauna collected in fall drop trap sampling at station P11 (Smith Creek) ..........................................................180
7.4-15b Mean abundance (SE) for epibenthic fauna collected in spring drop trap sampling at station P11 (Smith Creek) ...................................................181
7.4-16a Mean abundance (SE) for epibenthic fauna collected in fall drop trap sampling at station P12 (Rat Island) ..............................................................182
7.4-16b Mean abundance (SE) for epibenthic fauna collected in spring drop trap sampling at station P12 (Rat Island).......................................................183
7.4-17a Mean abundance (SE) for epibenthic fauna collected in fall drop trap sampling at station P13 (Fishing Creek)........................................................184
7.4-17b Mean abundance (SE) for epibenthic fauna collected in spring drop trap sampling at station P13 (Fishing Creek).................................................185
7.4-18 Comparison of species richness by year for fall Breder trap samples ...........186 7.4-19 Comparison of species richness by year for spring Breder trap samples ......186 7.4-20 Comparison of species diversity by year for fall Breder trap samples ..........187 7.4-21 Comparison of species diversity by year for spring Breder trap samples......187
xii

7.4-22 Comparison of total abundance by year for fall Breder trap samples............188 7.4-23 Comparison of total abundance by year for spring Breder trap samples.......188 7.4-24 Comparison of species richness by year for fall drop trap samples...............189 7.4-25 Comparison of species richness by year for spring drop trap samples ..........189 7.4-26 Comparison of species diversity by year for fall drop trap samples..............190 7.4-27 Comparison of species diversity by year for spring drop trap samples .........190 7.4-28 Comparison of total abundance by year for fall drop trap samples ...............191 7.4-29 Comparison of total abundance by year for spring drop trap samples ..........191 8.2-1 Locations, streams and numbers of sensitive herbaceous vegetation
monitoring stations in the Wilmington Harbor monitoring project, Cape Fear River Estuary, North Carolina ......................................................193
8.41-1 Comparisons of areas (ft2) of sensitive herbaceous vegetation polygons for years 2000-2006 at sensitive herbaceous vegetation monitoring stations, Wilmington Harbor monitoring project, Town Creek, North Carolina..........................................................................................................196
8.41-2 Comparisons of percent cover contributions by sensitive herbaceous species in major (and outlier) polygons at the Inner Town Creek Station (P3) for years 2000-2006, Wilmington Harbor monitoring project, Town Creek, North Carolina ............................................................197
8.42-1 Comparisons of percent cover contributions by sensitive herbaceous species in the sampling polygon at the Indian Creek Station (P7) for years 2000-2006, Wilmington Harbor monitoring project, Cape Fear River, North Carolina.....................................................................................200
8.43-1 Comparisons of percent cover contributions by sensitive herbaceous species in the sampling polygon at the Dollisons Landing Station (P8) for years 2000-2006, Wilmington Harbor monitoring project, Cape Fear River, North Carolina ............................................................................204
8.44-1 Comparisons of percent cover contributions by sensitive herbaceous species in old polygons from years 2000-2004 and new sensitive herbaceous polygon for 2005 and 2006 at the Black River (P9), Wilmington Harbor monitoring project, Cape Fear River, North Carolina..........................................................................................................206
8.45-1 Comparisons of percent cover contributions by sensitive herbaceous species in the polygon for years 2000-2006 at the Rat Island (P12), Wilmington Harbor monitoring project, Northeast Cape Fear River, North Carolina ...............................................................................................209
8.46-1 Comparisons of percent cover contributions by sensitive herbaceous species in polygons from years 2000-2006 at the Fishing Creek Station (P13), Wilmington Harbor monitoring project, Northeast Cape Fear River, North Carolina.....................................................................................211
8.47-1 Comparisons of percent cover contributions by sensitive herbaceous species in polygons from years 2000-2006 at the Prince George Creek Station (P14), Wilmington Harbor monitoring project, Northeast Cape Fear River, North Carolina ............................................................................215
xiii
LIST OF FIGURES
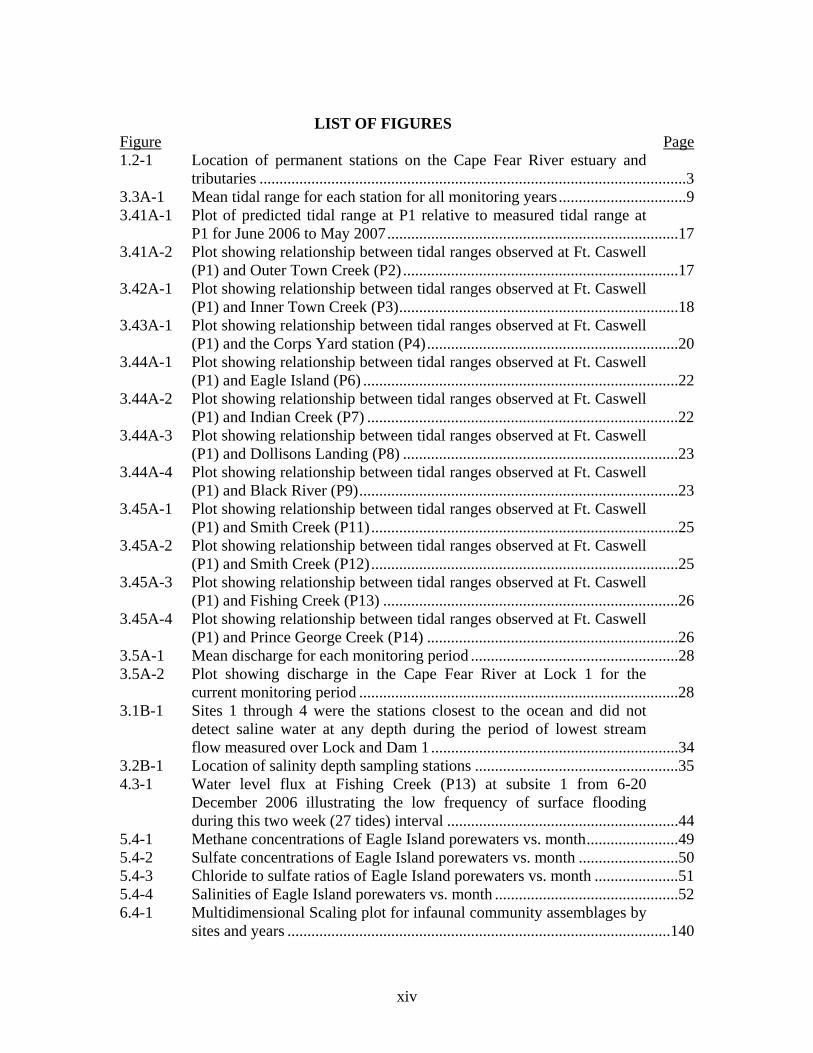
Figure Page 1.2-1 Location of permanent stations on the Cape Fear River estuary and
tributaries ...........................................................................................................3 3.3A-1 Mean tidal range for each station for all monitoring years................................9 3.41A-1 Plot of predicted tidal range at P1 relative to measured tidal range at
P1 for June 2006 to May 2007.........................................................................17 3.41A-2 Plot showing relationship between tidal ranges observed at Ft. Caswell
(P1) and Outer Town Creek (P2) .....................................................................17 3.42A-1 Plot showing relationship between tidal ranges observed at Ft. Caswell
(P1) and Inner Town Creek (P3)......................................................................18 3.43A-1 Plot showing relationship between tidal ranges observed at Ft. Caswell
(P1) and the Corps Yard station (P4)...............................................................20 3.44A-1 Plot showing relationship between tidal ranges observed at Ft. Caswell
(P1) and Eagle Island (P6) ...............................................................................22 3.44A-2 Plot showing relationship between tidal ranges observed at Ft. Caswell
(P1) and Indian Creek (P7) ..............................................................................22 3.44A-3 Plot showing relationship between tidal ranges observed at Ft. Caswell
(P1) and Dollisons Landing (P8) .....................................................................23 3.44A-4 Plot showing relationship between tidal ranges observed at Ft. Caswell
(P1) and Black River (P9)................................................................................23 3.45A-1 Plot showing relationship between tidal ranges observed at Ft. Caswell
(P1) and Smith Creek (P11).............................................................................25 3.45A-2 Plot showing relationship between tidal ranges observed at Ft. Caswell
(P1) and Smith Creek (P12).............................................................................25 3.45A-3 Plot showing relationship between tidal ranges observed at Ft. Caswell
(P1) and Fishing Creek (P13) ..........................................................................26 3.45A-4 Plot showing relationship between tidal ranges observed at Ft. Caswell
(P1) and Prince George Creek (P14) ...............................................................26 3.5A-1 Mean discharge for each monitoring period ....................................................28 3.5A-2 Plot showing discharge in the Cape Fear River at Lock 1 for the
current monitoring period ................................................................................28 3.1B-1 Sites 1 through 4 were the stations closest to the ocean and did not
detect saline water at any depth during the period of lowest stream flow measured over Lock and Dam 1 ..............................................................34
3.2B-1 Location of salinity depth sampling stations ...................................................35 4.3-1 Water level flux at Fishing Creek (P13) at subsite 1 from 6-20
December 2006 illustrating the low frequency of surface flooding during this two week (27 tides) interval ..........................................................44
5.4-1 Methane concentrations of Eagle Island porewaters vs. month.......................49 5.4-2 Sulfate concentrations of Eagle Island porewaters vs. month .........................50 5.4-3 Chloride to sulfate ratios of Eagle Island porewaters vs. month .....................51 5.4-4 Salinities of Eagle Island porewaters vs. month ..............................................52 6.4-1 Multidimensional Scaling plot for infaunal community assemblages by
sites and years ................................................................................................140
xiv

6.4-2 Mean diversity for all sites sampled in 2006 .................................................142 6.4-3 Mean species richness for all sites sampled in 2006......................................143 7.4-1 Analysis of similarity (PRIMER 6.0) based on spring drop trap
samples from 2000 to 2007............................................................................150 7.4-2 Analysis of similarity (PRIMER 6.0) for fall drop trap samples from
1999 to 2006 ..................................................................................................150 8.41-1 Comparison of sensitive herbaceous vegetation polygons from years
2000, 2004, 2005, and 2006 at station P3 (Inner Town Creek), Wilmington Harbor Monitoring Project, Town Creek, North Carolina ........198
8.42-1 Sensitive herbaceous vegetation polygon from year 2003 at station P7 (Indian Creek), Wilmington Harbor Monitoring Project, Cape Fear River, North Carolina.....................................................................................202
8.43-1 Sensitive herbaceous vegetation polygon from year 2003 at station P8 (Dollisons Landing), Wilmington Harbor Monitoring Project, Cape Fear River, North Carolina ............................................................................205
8.44-1 Comparison of sensitive herbaceous vegetation polygons from years 2000, 2004, and 2005 at station P9 (Black River), Wilmington Harbor Monitoring Project, Cape Fear River, North Carolina...................................207
8.45-1 Sensitive herbaceous vegetation polygon from year 2000 at station P12 (Rat Island), Wilmington Harbor Monitoring Project, Northeast Cape Fear River, North Carolina ............................................................................210
8.46-1 Comparison of sensitive herbaceous vegetation polygons from years 2000, 2005, and 2006 at station P13 (Fishing Creek), Wilmington Harbor Monitoring Project, Northeast Cape Fear River, North Carolina......212
8.46-2 River flow along the Northeast Cape Fear River at the NC 53 Bridge near Burgaw, NC ...........................................................................................214
8.47-1 Comparison of sensitive herbaceous vegetation polygons from years 2000, 2005, and 2006 at station P14 (Prince George Crook), Wilmington Harbor Monitoring Project, Northeast Cape Fear River, North Carolina ...............................................................................................216
LIST OF APPENDICES APPENDIX A LIST OF TIDAL RANGE DATA FOR ALL 14 STATIONS USED TO
GENERATE FIGURES AND TABLES IN SECTION 3.0 (1 June 2006 – 31 May 2007)
B CRUISE DATABASE BY DATE AND SITE SHOWING ALL
PARAMETERS COLLECTED BY DEPTH. C SALINITY PROFILES FOR ALL SITES FOR ALL COLLECTION
DATES
xv

D LIST OF SPECIES, COMMON NAMES, AND AUTHORITIES FOR PLANTS SEEN IN OR NEAR POLYGONS AT SAMPLING STATIONS IN THE CAPE FEAR ESTUARY, WILMINGTON HARBOR MONITORING PROJECT, NORTH CAROLINA
E METADATA COVERING GIS/GPS FILES USED IN TEXT FIGURES
IN SENSITIVE HERBACEOUS VEGETATION POLYGONS: 2006 ASSESSMENTS AT SEVEN STATIONS ESTABLISHED FOR THE WILMINGTON HARBOR MONITORING PROJECT IN THE CAPE FEAR RIVER ESTUARY, NORTH CAROLINA
F AREAS AND LOCATIONS OF NEW YEAR 2006 SENSITIVE
HERBACEOUS SPECIES POLYGONS AT SAMPLING STATIONS IN THE CAPE FEAR RIVER ESTUARY, WILMINGTON HARBOR MONITORING PROJECT, NORTH CAROLINA
xvi

1.0 STATION OPERATION
1.1 Summary
Measurement of water levels in the main channel of the Cape Fear River, the Northeast Cape Fear River, and Town Creek continue to provide data necessary to determine the impact associated with the widening and deepening the Cape Fear River. Differences between the high and low points of each tide, referred to as ranges in this report, can be followed upstream from the base station at Ft Caswell (P1) to any individual station. Differences between stations with respect to tidal range, time to high or low tide, length of low and high tides were also determined. Comparisons of these variables before and after channel modifications will provide the statistical testing mechanism to examine whether the project has impacted adjacent wetlands. In addition, the absolute elevation of floodwater when related to measurements of water levels at marsh/swamp substations allows the determination of both flood duration and flood depth for any tide. This report includes data collected from June 2006 through May 2007. During this period, problems of communication with instruments or minor instrument malfunction were solved as they occurred. Mechanical errors were slightly higher at some sites this year than during previous reporting periods, and this may reflect the age of some of the equipment. As was the case in previous monitoring years, each tide has been examined for each station and a determination made as to whether the data collected are reliable. Table 1.1-1 provides a general summary of all data loss for present and future comparisons.
1.2 Methodology
Water level at each station was sampled by a UNIDATA shaft-encoded water level recorder housed in an aluminum stilling well at 1-second intervals. A UNIDATA Starlogger logged the average, maximum, and minimum values every 3 minutes. Conductivity and temperature were also sampled by a UNIDATA conductivity instrument and recorded by the Starlogger every 3 minutes. Data were downloaded to a PC housed in the laboratory every 2 weeks via modem. In instances when the modem did not function properly, technicians on site downloaded data loggers using a laptop. Preliminary data quality review consisted of visually reviewing data for major problems (e.g. float hang-ups in the stilling well, data transmission errors, large jumps/shifts in water level, loss of data) within 2-3 days of download. This process was done so that any major problems identified could be rectified immediately. Data were then compiled into files each of which contained one month of data for each station. Data files were then sorted at 6 minutes intervals and the resulting data set stored for subsequent data analysis. As in previous reporting periods, the terms used to describe general mechanisms through which data are lost or compromised are defined below:
Loss at Station P1: Because the response of each variable upstream (Figure 1.2-1) is related to the base station at Ft Caswell (P1), the loss of a variable from P1 during a particular tide means that there is no means of comparison with other stations. Reasons for data loss at P1 as well as other stations are: 1) QA/QC Procedure, which refers to tides that were removed from the data set when measurements coincided with QA/QC and equipment maintenance procedures. In these instances, recorded water levels were
1

2
inaccurate due to cleaning the water level float, removing/replacing the water level recorder, replacing the beaded cable, or performing a field reset when in-situ observations of water level were inconsistent with water levels reported by the data logger. 2) Under ranging events refers to tides that were removed from the data set when the actual water level fell below the elevation of the stilling well cap. In these instances, the instruments were unable to detect the minimum water level. 3) Absence of Data refers to tides that were lost when data were not recorded by the data logger or were not transmitted properly via the modem or PC download process. 4) Freezing of surface water in the stilling well prohibited the float from following the rise and fall of the tides and these tides were removed. 5) Mechanical Errors refer to tides removed from the data set during the data review process because of likely mechanical malfunction. Mechanical malfunctions were suspected when the plotted data exhibited misshapen curves, large jumps, and flat lines (i.e. hang-ups).
Table 1.1-1. Percentages of tides removed from analysis and reasons for loss. Detailed descriptions of "loss" categories are listed in Section 1.2 above. Station % Loss At
Station P1 %
QA/QC % Under-
ranging Events % Absence of
Data %
Freezing % Mechanical
Errors Total % Lost
Tides P1 N/A 0 0 0 0 4.0 4.0 P2 4.0 0.2 0.4 0 0 0.3 4.9 P3 4.0 0 0 0.9 0 3.1 8.0 P4 4.0 0 0 0 0 0.1 4.1 P6 4.0 0 0.2 4.7 0 0.1 8.8 P7 4.0 0.1 1.4 1.6 0.1 1.0 8.2 P8 4.0 0.8 0 2.3 0 3.9 11.0 P9 4.0 0.5 0 1.8 0 4.7 11.0
P11 4.0 0.4 0 0 0 0.9 5.3 P12 4.0 0.3 0 1.3 0 0.6 6.2 P13 4.0 0.1 0 0 0 0.4 4.5 P14 4.0 0.8 0 0.4 0 10.1 15.3
1.3 Ft Caswell (P1)
Ft Caswell is the most important station because this station experiences amplitude changes that are essentially oceanic tides. All upstream water levels are related to this station. This station functioned well during the reporting period. The total percentage of lost tides at this station from June 2006 to May 2007 (4.0%) was lower than during the previous three reporting periods (6.9%, 10.2%, and 8.0%). Data collected at this station still show occasional irregularities in the shape of the water level curves but these variations do not affect the reported minimum and maximum water level values (i.e. reported tidal range). The station was mostly affected by passing weather systems that caused erroneous data collection during high wind and wave action. Monthly QA/QC checks and cleaning of probes, at this very saline station, and the well interior seem to prevent most minor problems before they occur. Corrosion of the beaded cable also affects data quality; therefore, cable integrity is assessed each month and the cable replaced when necessary.

3
North Carolina
Cape Fear River
Northeast Cape Fear
River Black River
P9
P8
P7
P6
P1
P2 P3
P11
P12
P13
P14
P4
Figure 1.2-1. Location of permanent stations on the Cape Fear River estuary and tributaries.

1.4 Town Creek Mouth (P2)
Water level curves at this station can be noisy due to periods of what appear to be high frequency variations in water level. These episodes do not occur with any regular periodicity and are believed to be associated with nearby ship traffic. Nonetheless, these data are of sufficient quality to regularly identify maximum and minimum water levels and these data correspond well with data from P1. The total percentage of lost tides at this station (4.9%) was less than during 2005-2006 reporting period (11.7%). P2 experienced just a few mechanical errors this reporting period. Minor data loss also occurred during QA/QC resets. Under-ranging, which was non-existent during the last reporting period, was a minor problem during this reporting period. Water relatively high in salinity at this site continues to affect the beaded cables, necessitating their replacement on occasion.
1.5 Inner Town Creek (P3)
This station generally experiences few problems and continues to generate smooth tidal curves. Data loss during this reporting period was slightly less than last year (12.0%). Mechanical problems continued to be the primary cause of data loss at P3 comprising 3.1% of total tides. In July, a power issue caused the batteries and water level equipment to fail. This event resulted in a loss of just less than 1% of total tides.
1.6 Corps Yard (P4)
NOAA operates the tidal gauge at this site and data are available at their website after curve-smoothing procedures are applied. The UNCW conductivity/salinity gauges located at this site have operated with only a few problems over the reporting period.
1.7 Eagle Island (P6)
During this reporting period, data loss at this station was considerably less (8.8%) than during the 2005 to 2006 project year (33.3%). The primary cause of failure during this reporting period was tides lost to absence of data. Data were lost when the water level instrument was removed, serviced, and replaced during August 2006. QA/QC water level resets and minor mechanical issues also resulted in some tide loss, although this loss was minor (less than 1%).
1.8 Indian Creek (P7)
Under-ranging continued to be problematic during the 2006-2007 sampling period (1.4% of total tides). However, this was less than the percentage of under ranging events reported during the 2005-2006 sampling period (4.5% of total tides). This site continued to experience infrequent mechanical errors resulting in a loss of 1% of total tides.
4

1.9 Dollisons Landing (P8)
As was the case in previous reporting periods, this station experienced a high percentage of total tides lost (11%) due to various mechanical errors and absence of data; although this percentage was dramatically less then the 2005-2006 reporting period (31.2%). As in previous years, the mechanical errors were usually associated with the water level cable getting snagged in the stilling well. On a positive note, the problem with the cell tower at P8 has been fixed this reporting year, and the station is now able to be remotely downloaded.
1.10 Black River (P9)
Site P9 experienced a loss of 11% of total tides for the 2006-2007 reporting period. Data loss at the station was primarily associated with mechanical errors (4.7%) resulting from periodic river flooding that interrupted operation of the water level recorder. Data absences also occurred following some flooding events. During this reporting period, this station required many water level resets due to a gradual drift in the water level recorder.
1.11 Smith Creek (P11)
Similar to the previous reporting period, P11 has operated with very few problems during the 2006-2007 period. The percentage of total tides lost was only 5.3%. Approximately 1% of the total tides were lost due to QA/QC and minor mechanical problems combined.
1.12 Rat Island (P12)
The percentage of total tides lost from this site was comparable to the 2005-2006 reporting period. Similar to the previous reporting period, tide loss resulted from water level jumps and subsequent QA/QC visits required to correct the problem. Further, some mechanical problems resulted in loss of water level data. The total tide loss for this site was approximately 2% of total tides.
1.13 Fishing Creek (P13)
The percentage of lost tides at this site was comparable to the previous reporting period. As was the case during the 2005-2006 reporting period, this site operated exceedingly well with a 0.5% loss of tides due to mechanical or other problems.
1.14 Prince George Creek (P14)
As with the other stations on the Northeast Cape Fear River, the performance of P14 was similar to the previous reporting period. The percentage of total tides lost due to mechanical errors was (10.1%). Similar to P9, this site is prone to water level equipment failures during major flooding events.
5

2.0 MONUMENT AND STATION SURVEY VERIFICATION
2.1 Summary
Elevation monuments remain stable. There have been extensive alteration of the vegetation at P7, which damaged subsite elevation monuments, but the primary monument does not appear to have been altered. This tidal swamp is undergoing development of some sort. If and when the development stops, subsites distant from the river edge must be resurveyed by professional surveyors to reestablish accurate NAVD88 elevations.
3.0 PART A - RIVER WATER LEVEL/SALINITY MONITORING
3.1A Summary
More than 1,400 tide ranges measured between 1 June 2006 and 31 May 2007 (Appendix A) were used to conduct analyses of changes in tidal amplitude as well as changes of ebb and flood duration. A good correlation between measured tidal range from the base station at Ft Caswell and the predicted tidal range for this station continues to exist. When observed tidal ranges were regressed against predicted tidal ranges at P1, there was no difference in the slope of the regression between this reporting period and the previous reporting period. The mean tidal range at P1 was not significantly different from the mean reported in the previous monitoring period, but was significantly lower than the range reported in Year 1. Tidal ranges within the estuary were fairly constant, including the lowermost of the upstream stations, and were higher than tidal ranges measured at most upstream stations. Water levels in the most upstream sites and the inner Town Creek station continued to be affected by discharge rates in their respective drainages, however, some sites also may have been affected by local processes including ship traffic, siltation, and potentially by land clearing activities. Some significant differences in yearly mean tidal ranges between this reporting period and 2005-2006 were observed and these occurred primarily in the upstream stations. Mean tidal range at seven out of eleven of the river monitoring stations were significantly different from the mean tidal range reported in Year 1 of monitoring. This finding contrasts with the previous reporting period where only two stations (P1 and P7) showed significant differences in tidal range between this reporting period and the first year of monitoring. The observation that mean tidal range observed at P1 (Ft. Caswell) is again significantly less than in Year 1 continues to complicate interpretation of the results as this station was initially expected to be unimpacted by river widening activities. Similar to the pattern reported last year, mean monthly maximum water levels for this reporting period were not significantly different from the values reported for the previous monitoring period with the exception of sites P2 and P9. There also was no significant difference in mean monthly minimum water level between this reporting period and last year with the exception of sites P2 and P6. Comparisons of the regression slopes when tidal range at each site was regressed against P1 tidal range yielded significant differences between this reporting period and the previous reporting period for almost one-half of the stations (P6, P7, P8, P9, and P11). When the slopes from this reporting period were compared to
6

slopes calculated for Year 1 (2000-2001), only sites P2, P4, P6, and P11 yielded a significant difference in slope between years.
Both the high tide and low tide lag values were comparable to those reported last year. In the mainstem, where changes were noted, the mean high tide lag from P1 decreased minimally relative to the lag times reported in 2005-2006, while mean low tide lag increased slightly at most stations. This trend contrasts with the previous reporting period where slight increases were observed. In the Northeast Cape Fear River, changes in tidal lag also were minor and consisted of slight increases in mean high tide lag and slight decrease in low tide lag at most stations. During this reporting period, mean flood duration changed by less than 1% at all stations. Mean ebb duration also varied little from those values reported in the last monitoring period (<1%). For the minor flood and ebb durations that were observed, the flood duration slightly decreased, while the ebb duration slightly increased at most stations. This pattern contrasts with the previous two reporting periods where flooding duration increased and ebb tide durations decreased at most monitoring stations.
Periods of lower, drought-induced water levels and extreme flooding in the system over the last five years have contributed to differing tidal conditions in the Cape Fear and Northeast Cape Fear Rivers between monitoring years. These effects are confounded by the shortened data set for Year 1, which included data collected from October to June, only, and covered a period when monthly river discharge was below the long-term average (~5,531 ft3/s) reported by the USGS at Lock and Dam 1 on the Cape Fear mainstem. This reporting period, the mean discharge is comparable to the mean discharge that existed during Year 4 (2003-2004). The similarity in discharge rates between this project year and 2003-2004, may explain the greater similarity in mean tidal ranges between these two reporting periods than between this reporting period and the previous two reporting periods. At present, our observations indicate that upstream discharge plays a significant role in determining mean tidal range; however, they remain somewhat inconsistent with the expected effects of dredging. Additional types of data analyses will be necessary to elucidate the relative effects of channel modification and upstream discharge on tidal attributes.
Harmonic analysis of tidal constituents has continued during this reporting period. For all of the stations, the M2 component is the dominant constituent as expected. A longer water level time series exists at station P4, allowing for examination of tidal harmonics for several years prior to the initiation of dredging. Over the 12 year period between 1994 and 2006, however, neither the amplitude nor the phase of the M2 constituent has changed appreciably. For the most part, the amplitude of the M2 constituent at P4 has varied between 2.03 and 2.09. As expected, the M2 amplitude at sites just upstream and downstream of P4 (e.g. P2, P6, and P11) are more similar to P4 than to other sites in the river. As with mean water level, changes in harmonic amplitude appear to be linked to variations in discharge. This relationship will be examined in greater detail following completion of dredging activities.
7

In 2000-2001, salinity did not exceed 1 ppt at stations upstream of Eagle Island on the Cape Fear River because of the continuous release of freshwater upstream. In 2001-2002 and 2002-2003 drought conditions existing in the region reduced upstream releases in the Cape Fear River. During these years, salinities as high as 5.8 ppt were measured at P8 while salinities exceeding 14 ppt were measured at P13, 8 miles north of Point Peter in the Northeast Cape Fear River. Project years 2003-2004 and 2004-2005 were periods of more typical flow conditions in the river, and maximum salinities for P8 and P13 were much lower (0.2 ppt and 8.6 ppt, respectively). During this reporting period, flow conditions were more similar to those reported during 2003-2004 and in excess of the 30 year average. In general, salinities at P8 were low (0.1-0.5 ppt) and reflected the range of salinities expected for normal to above average flow. However, in late summer early fall 2006, river discharge was relatively low compared to the remainder of the year, and a maximum salinity (5.4 ppt) more indicative of drought conditions was recorded. September was the only month when site P8 exhibited a salinity greater than 0.5 ppt. At P13, measured salinities were consistent with those expected during average to above average flow conditions. The maximum salinity of 8.4 ppt occurred in May 2007 at this site. Discharge data are not available for the Northeast Cape Fear to enable a direct comparison of salinity to discharge, although discharge measured in the Cape Fear mainstem indicates increased flow in April and early May.
3.2A Database
Water level, conductivity, and temperature data collected at DCP stations from June 2006 through May 2007 are incorporated in this report. This year’s database includes approximately 1,400 tides of sufficient quality to be used in the analyses of each of the 11 DCP stations. Specific problems associated with each station have been described in Section 1.0 of this report. Table 1.1-1 summarizes the percentage of tides unavailable for analysis due to the various reasons cited above.
3.3A Data Analyses Methods
Maximum, minimum, and mean water level and conductivity/ temperature were recorded every 3 minutes. The final data set used for analyses consists of 3-minute averages of water level and conductivity collected every 6 minutes. The 6-minute means were plotted after each two-week interval and the resulting curves visually inspected by a senior analyst for quality control purposes. Suspect data, such as outliers or data points that deviate from a smooth curve, were discarded. Unreliable data, such as those collected during periods of mechanical malfunction, equipment maintenance, under-ranging events, and freezing events, were also removed. The remaining data were then filtered to extract the maximum and minimum water levels associated with each tidal event. For this report, a tidal event consists of one high water/low water pair.
The high and low water values contained in the final data set were used to determine the mean tidal range and to compute tidal lags between sites. The mean tidal range was computed from the difference in water level between each high and low tide event for each station (Figure 3.3A-1). Unlike the previous reporting period, the mean
8

tidal ranges measured during this reporting period were significantly different (p<0.05) than the means reported during the first year of monitoring (2000-2001), or pre-dredging, at about one-half of the stations (Table 3.3A-1). In the previous reporting period, mean tidal ranges measured at P1 and P7 were the only means that significantly differed from the means reported during the first year of monitoring. At five out of the twelve stations, the mean tidal range measured during this reporting period also was significantly different (p<0.05) than the means reported during the previous reporting period. Those stations included the three most upstream stations in the mainstem Cape Fear and the two most upstream stations in the Northeast Cape Fear River.
0123
456
P1 P2 P3 P4 P6 P7 P8 P9 P11 P12 P13 P14
Station
Mea
n Ti
dal R
ange
(ft) '00-'01
'01-'02'02-'03'03-'04'04-'05'05-'06'06-'07
Figure 3.3A-1. Mean tidal range for each station for all monitoring years. All water levels are relative to NAVD88 with the exception of P4 (USACE yard), which is relative to MSL. Error bars show one standard deviation. Significant differences between yearly means (p<0.05) for one or more monitoring periods are shown in Table 3.3A-2. Table 3.3A-3 shows a summary of statistical tests for yearly data collected at the 11 DCP stations.
9

Table 3.3A-1. Monthly maximum, minimum, and range of salinity values for each station. Monthly maximum, minimum, and range of water level for each station are also given. All water levels are relative to NAVD88 with the exception of P4 (USACE yard), which is relative to MSL. “XXX” indicates periods of extended data loss due to mechanical failure of water level instrument.
Salinity (ppt) Water Level (ft) Site Month Maximum Minimum Range Maximum Minimum Range P1 Jun-05 30.4 10.1 20.3 2.21 -4.21 6.42 Jul-05 33.5 16.5 17.0 1.95 -4.16 6.11 Aug-05 33.9 18.0 15.9 2.90 -3.92 6.82 Sep-05 29.9 12.9 17.0 3.11 -3.16 6.27 Oct-05 38.6 12.3 26.3 3.01 -3.43 6.44 Nov-05 37.2 9.7 27.5 2.73 -3.83 6.56 Dec-05 33.3 5.8 27.5 2.50 -3.85 6.35 Jan-06 24.8 6.1 18.7 2.50 -3.94 6.44 Feb-06 36.1 4.6 31.5 2.53 -4.62 7.15 Mar-06 41.0 6.3 34.7 1.88 -4.91 6.79 Apr-06 37.5 7.7 29.8 3.04 -3.70 6.74 May-06 33.4 16.0 17.4 2.67 -4.25 6.92 Site Month Maximum Minimum Range Maximum Minimum Range P2 Jun-05 14.4 0.8 13.6 5.79 0.05 5.74 Jul-05 22.0 0.9 21.1 5.57 -0.32 5.89 Aug-05 22.3 1.4 20.9 6.00 -0.22 6.22 Sep-05 8.7 0.1 8.6 6.71 0.38 6.33 Oct-05 17.2 0.4 16.8 6.73 0.10 6.63 Nov-05 11.6 0.3 11.3 4.07 -2.12 6.19 Dec-05 4.1 0.1 4.0 4.70 -2.61 7.31 Jan-06 3.9 0.7 3.2 4.21 -2.62 6.83 Feb-06 8.0 0.0 8.0 3.87 -2.64 6.51 Mar-06 10.4 0.0 10.4 3.04 -2.73 5.77 Apr-06 15.6 0.4 15.2 4.27 -2.74 7.01 May-06 13.7 7.3 6.4 3.75 -2.67 6.42 Site Month Maximum Minimum Range Maximum Minimum Range P3 Jun-05 12.8 0.1 12.7 1.78 -1.96 3.74 Jul-05 9.1 0.1 9.0 1.65 -2.31 3.96 Aug-05 13.4 0.1 13.3 2.18 -1.94 4.12 Sep-05 2.8 0.0 2.8 3.32 -1.45 4.77 Oct-05 15.8 0.1 15.7 2.61 -1.71 4.32 Nov-05 10.1 0.0 10.1 2.80 -1.50 4.30 Dec-05 8.0 0.0 8.0 2.83 -1.90 4.73 Jan-06 2.7 0.0 2.7 2.61 -2.02 4.63 Feb-06 3.1 0.0 3.1 2.33 -2.37 4.70 Mar-06 6.4 0.1 6.3 2.28 -2.22 4.50 Apr-06 13.5 0.1 13.4 2.37 -2.09 4.46 May-06 18.7 0.2 18.5 2.10 -2.00 4.10 Site Month Maximum Minimum Range Maximum Minimum Range P4 Jun-05 13.8 0.1 13.7 2.87 -2.94 5.81 Jul-05 14.2 0.5 13.7 2.68 -3.33 6.01 Aug-05 15.2 0.0 15.2 3.01 -3.15 6.16 Sep-05 5.8 0.0 5.8 3.79 -2.52 6.31 Oct-05 15.8 1.4 14.4 3.71 -2.86 6.57 Nov-05 11.3 0.0 11.3 3.42 -3.06 6.48 Dec-05 8.9 0.0 8.9 3.28 -3.83 7.11 Jan-06 5.8 0.0 5.8 3.50 -3.52 7.02 Feb-06 8.1 0.0 8.1 3.09 -4.22 7.31 Mar-06 8.0 0.0 8.0 3.20 -3.90 7.10 Apr-06 13.5 0.1 13.4 3.67 -4.05 7.72 May-06 21.2 0.8 20.4 3.09 -3.46 6.55
10

Table 3.3A-1. (continued)
Salinity (ppt) Water Level (ft) Site Month Maximum Minimum Range Maximum Minimum Range P6 Jun-05 17.4 0.1 17.3 3.25 -2.32 5.57 Jul-05 11.6 0.0 11.6 2.92 -2.89 5.81 Aug-05 13.9 0.1 13.8 2.76 -2.45 5.21 Sep-05 9.9 0.0 9.9 3.98 -2.20 6.18 Oct-05 14.3 0.1 14.2 3.79 -2.56 6.35 Nov-05 10.1 0.1 10.0 3.73 -2.66 6.39 Dec-05 7.7 0.0 7.7 4.14 -3.34 7.48 Jan-06 4.7 0.0 4.7 3.80 -3.56 7.36 Feb-06 6.1 0.0 6.1 2.81 -4.24 7.05 Mar-06 7.8 0.0 7.8 2.98 -3.84 6.82 Apr-06 11.7 0.0 11.7 3.33 -4.02 7.35 May-06 12.8 6.5 6.3 2.76 -3.51 6.27 Site Month Maximum Minimum Range Maximum Minimum Range P7 Jun-05 0.2 0.1 0.1 3.02 -2.07 5.09 Jul-05 0.1 0.0 0.1 2.82 -2.25 5.07 Aug-05 0.1 0.0 0.1 3.06 -2.25 5.31 Sep-05 6.0 0.0 6.0 3.87 -1.91 5.78 Oct-05 0.2 0.0 0.2 3.53 -2.27 5.80 Nov-05 0.7 0.0 0.7 4.01 -2.15 6.16 Dec-05 0.1 0.1 0.0 4.06 -2.27 6.33 Jan-06 0.1 0.0 0.1 3.34 -2.28 5.62 Feb-06 0.1 0.0 0.1 3.24 -2.29 5.53 Mar-06 0.1 0.0 0.1 3.39 -2.26 5.65 Apr-06 0.2 0.1 0.1 3.78 -2.28 6.06 May-06 0.1 0.0 0.1 3.05 -2.36 5.41 Site Month Maximum Minimum Range Maximum Minimum Range P8 Jun-05 0.1 0.0 0.1 2.79 -2.06 4.85 Jul-05 0.1 0.1 0.0 2.58 -2.60 5.18 Aug-05 0.1 0.0 0.1 3.02 -1.95 4.97 Sep-05 5.4 0.0 5.4 3.81 -1.66 5.47 Oct-05 0.2 0.0 0.2 3.26 -1.66 4.92 Nov-05 0.2 0.1 0.1 3.06 -3.38 6.44 Dec-05 0.1 0.0 0.1 3.92 -2.04 5.96 Jan-06 0.1 0.0 0.1 3.38 -2.00 5.38 Feb-06 0.1 0.0 0.1 2.76 -2.65 5.41 Mar-06 0.1 0.0 0.1 3.27 -1.76 5.03 Apr-06 0.1 0.0 0.1 3.83 -1.47 5.30 May-06 0.5 0.1 0.4 3.14 -2.62 5.76 Site Month Maximum Minimum Range Maximum Minimum Range P9 Jun-05 0.1 0.0 0.1 3.42 -1.57 4.99 Jul-05 0.1 0.0 0.1 3.19 -1.78 4.97 Aug-05 0.1 0.0 0.1 3.87 -1.20 5.07 Sep-05 0.1 0.0 0.1 3.81 -1.48 5.29 Oct-05 0.1 0.1 0.0 3.21 -1.57 4.78 Nov-05 0.1 0.0 0.1 4.04 -1.12 5.16 Dec-05 0.1 0.0 0.1 4.23 -1.49 5.72 Jan-06 0.0 0.0 0.0 3.76 -1.21 4.97 Feb-06 0.0 0.0 0.0 3.46 -1.75 5.21 Mar-06 0.1 0.0 0.1 3.64 -1.42 5.06 Apr-06 0.1 0.0 0.1 4.35 -1.51 5.86 May-06 0.3 0.1 0.2 3.51 -2.11 5.62 Site Month Maximum Minimum Range Maximum Minimum Range P11 Jun-05 13.8 0.1 13.7 2.67 -2.80 5.47 Jul-05 10.6 0.1 10.5 2.53 -3.36 5.89 Aug-05 11.7 0.1 11.6 2.98 -2.62 5.60 Sep-05 8.5 0.0 8.5 3.92 -2.26 6.18 Oct-05 13.7 0.1 13.6 3.67 -2.52 6.19 Nov-05 7.9 0.0 7.9 4.11 -2.63 6.74 Dec-05 13.9 5.2 8.7 3.91 -3.63 7.54 Jan-06 5.5 0.0 5.5 3.50 -3.22 6.72 Feb-06 8.0 0.0 8.0 3.13 -3.37 6.50 Mar-06 9.6 0.0 9.6 3.86 -3.25 7.11
11

Table 3.3A-1. (concluded)
Salinity (ppt) Water Level (ft)
Apr-06 10.5 0.1 10.4 4.21 -2.67 6.88 May-06 13.0 6.9 6.1 3.02 -3.12 6.14 Site Month Maximum Minimum Range Maximum Minimum Range P12 Jun-05 14.2 0.1 14.1 2.33 -2.57 4.90 Jul-05 8.7 0.0 8.7 2.13 -3.01 5.14 Aug-05 12.5 0.1 12.4 2.59 -2.68 5.27 Sep-05 9.4 0.0 9.4 3.57 -2.23 5.80 Oct-05 12.4 0.1 12.3 2.90 -2.64 5.54 Nov-05 7.9 0.0 7.9 2.71 -2.60 5.31 Dec-05 6.6 0.0 6.6 3.42 -2.72 6.14 Jan-06 3.9 0.0 3.9 3.08 -3.11 6.19 Feb-06 6.3 0.0 6.3 2.67 -3.66 6.33 Mar-06 5.6 0.0 5.6 2.79 -3.34 6.13 Apr-06 10.3 0.0 10.3 3.13 -3.05 6.18 May-06 17.6 0.1 17.5 3.24 -2.94 6.18 Site Month Maximum Minimum Range Maximum Minimum Range P13 Jun-05 4.5 0.1 4.4 2.47 -1.79 4.26 Jul-05 3.1 0.1 3.0 2.02 -2.55 4.57 Aug-05 2.0 0.1 1.9 2.42 -2.12 4.54 Sep-05 0.1 0.0 0.1 3.57 -1.80 5.37 Oct-05 6.4 0.1 6.3 2.82 -2.27 5.09 Nov-05 1.2 0.0 1.2 3.12 -2.04 5.16 Dec-05 0.4 0.0 0.4 3.21 -2.64 5.85 Jan-06 0.1 0.0 0.1 2.99 -2.62 5.61 Feb-06 0.1 0.0 0.1 2.51 -2.97 5.48 Mar-06 1.2 0.0 1.2 2.65 -2.74 5.39 Apr-06 7.0 0.0 7.0 2.89 -2.47 5.36 May-06 8.4 0.0 8.4 2.43 -2.27 4.70 Site Month Maximum Minimum Range Maximum Minimum Range P14 Jun-05 0.1 0.0 0.1 1.99 -1.42 3.41 Jul-05 0.9 0.0 0.9 1.83 -1.95 3.78 Aug-05 0.1 0.0 0.1 2.07 -1.55 3.62 Sep-05 0.1 0.0 0.1 3.43 -1.19 4.62 Oct-05 0.1 0.0 0.1 2.31 -1.73 4.04 Nov-05 0.1 0.0 0.1 3.38 -1.15 4.53 Dec-05 0.1 0.0 0.1 3.09 -1.70 4.79 Jan-06 0.0 0.0 0.0 2.85 -1.80 4.65 Feb-06 0.1 0.0 0.1 2.21 -2.14 4.35 Mar-06 0.1 0.0 0.1 2.28 -2.12 4.40 Apr-06 0.1 0.0 0.1 2.44 -1.93 4.37 May-06 0.1 0.0 0.1 1.94 -1.84 3.78
12
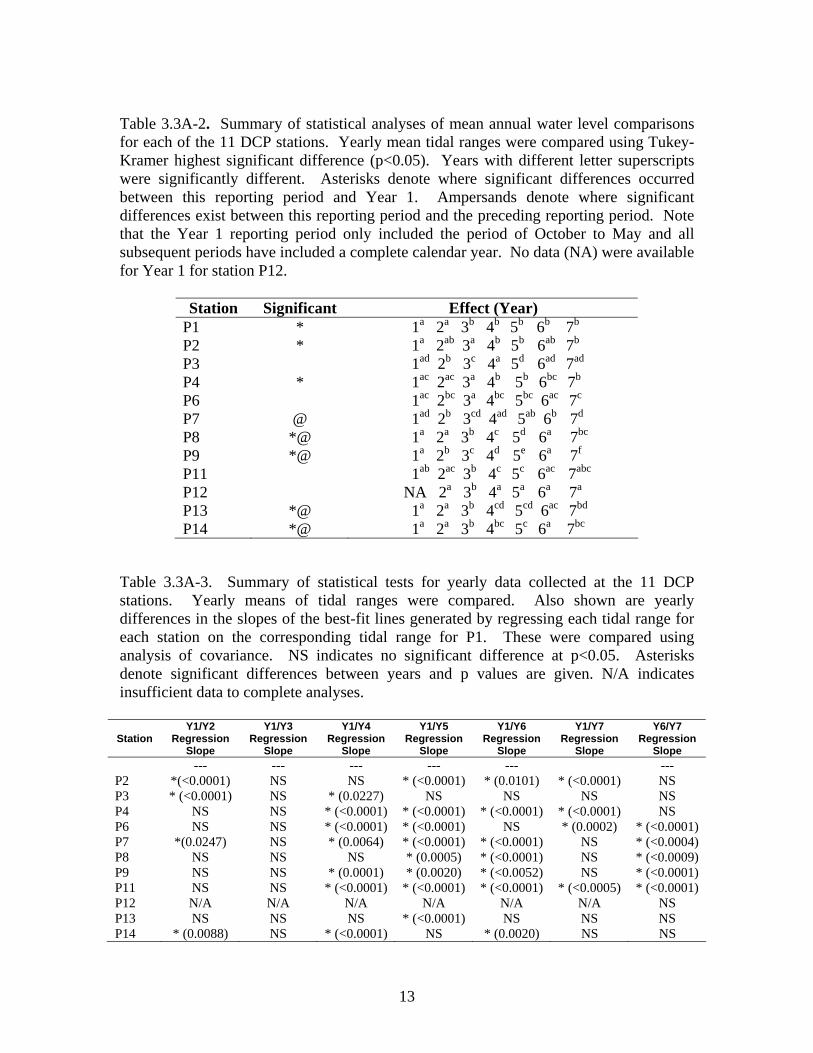
Table 3.3A-2. Summary of statistical analyses of mean annual water level comparisons for each of the 11 DCP stations. Yearly mean tidal ranges were compared using Tukey-Kramer highest significant difference (p<0.05). Years with different letter superscripts were significantly different. Asterisks denote where significant differences occurred between this reporting period and Year 1. Ampersands denote where significant differences exist between this reporting period and the preceding reporting period. Note that the Year 1 reporting period only included the period of October to May and all subsequent periods have included a complete calendar year. No data (NA) were available for Year 1 for station P12.
Station Significant Effect (Year) 1a 2a 3b 4b 5b 6b 7bP1 * 1a 2ab 3a 4b 5b 6ab 7bP2 * 1ad 2b 3c 4a 5d 6ad 7adP3 1ac 2ac 3a 4b 5b 6bc 7bP4 * 1ac 2bc 3a 4bc 5bc 6ac 7cP6 1ad 2b 3cd 4ad 5ab 6b 7dP7 @ 1a 2a 3b 4c 5d 6a 7bcP8 *@ 1a 2b 3c 4d 5e 6a 7fP9 *@ 1ab 2ac 3b 4c 5c 6ac 7abcP11 NA 2a 3b 4a 5a 6a 7aP12 1a 2a 3b 4cd 5cd 6ac 7bdP13 *@ 1a 2a 3b 4bc 5c 6a 7bcP14 *@
Table 3.3A-3. Summary of statistical tests for yearly data collected at the 11 DCP stations. Yearly means of tidal ranges were compared. Also shown are yearly differences in the slopes of the best-fit lines generated by regressing each tidal range for each station on the corresponding tidal range for P1. These were compared using analysis of covariance. NS indicates no significant difference at p<0.05. Asterisks denote significant differences between years and p values are given. N/A indicates insufficient data to complete analyses.
Station
Y1/Y2 Regression
Slope
Y1/Y3 Regression
Slope
Y1/Y4 Regression
Slope
Y1/Y5 Regression
Slope
Y1/Y6 Regression
Slope
Y1/Y7 Regression
Slope
Y6/Y7 Regression
Slope --- --- --- --- --- --- P2 *(<0.0001) NS NS * (<0.0001) * (0.0101) * (<0.0001) NS P3 * (<0.0001) NS * (0.0227) NS NS NS NS P4 NS NS * (<0.0001) * (<0.0001) * (<0.0001) * (<0.0001) NS P6 NS NS * (<0.0001) * (<0.0001) NS * (0.0002) * (<0.0001) P7 *(0.0247) NS * (0.0064) * (<0.0001) * (<0.0001) NS * (<0.0004) P8 NS NS NS * (0.0005) * (<0.0001) NS * (<0.0009) P9 NS NS * (0.0001) * (0.0020) * (<0.0052) NS * (<0.0001) P11 NS NS * (<0.0001) * (<0.0001) * (<0.0001) * (<0.0005) * (<0.0001) P12 N/A N/A N/A N/A N/A N/A NS P13 NS NS NS * (<0.0001) NS NS NS P14 * (0.0088) NS * (<0.0001) NS * (0.0020) NS NS
13

Tidal lags were determined by measuring the difference in time for high (or low) tide at two different stations as described in the Year 1 report. All tidal lags were calculated relative to station P1 and are being used to evaluate the impact of dredging on the propagation of the tidal wave upriver. Mean tidal range, flood duration, ebb duration, and tidal lags for each station are given in Table 3.3A-4. During this reporting period, both the high tide and low tide lag values were comparable to those reported for 2005-2006. The greatest difference between years occurred at station P14 where the mean high tide lag decreased by 0.2 hours. During this reporting period, the mean flood duration and the mean ebb duration varied little (<1%) from the previous reporting period (Table 3.3A-4). For changes that were observed, flood durations decreased at almost all stations whereas ebb duration tended to increase at upstream stations and decrease or remain unchanged lower in the estuary. Yearly comparisons of mean monthly maximum and minimum water levels collected at the 11 DCP stations are summarized in Table 3.3A-5.
Table 3.3A-4. Summary of tidal data generated from the 11 DCP stations along the Cape Fear River and tributaries. Values in italicized parentheses are the percent change between the current monitoring interval and the previous reporting period. Positive values indicate an increase and negative values a decrease. ND indicates that a change was not measurable. N/A indicates that data were insufficient to measure a reliable change. Mean lag times for the previous reporting period are also given in parentheses for both high and low tide.
Station Mean Tidal Mean Flood Mean Ebb Mean High Tide Mean Low Tide Number Range (ft) Duration (hr)
(% change) Duration (hr)
(%change) Lag From P1 (hr) ('05-'06 lag time)
Lag From P1 (hr) ('05-'06 lag time)
P1 4.15 ± 22.04% 6.30 (+0.02) 6.12 (0.00) N/A N/A P2 4.37 ± 15.82% 5.63 (0.00) 6.73 (-0.02) 1.35 (1.38) 1.88 (1.98) P3 2.77 ± 17.13% 6.33 (-0.02) 6.08 (-0.42) 2.98 (2.95) 2.93 (2.88) P4 4.46 ± 15.17% 5.66 (-0.02) 6.73 (0.01) 1.55 (1.62) 2.18 (2.18) P6 4.29 ± 15.00% 5.80 (-0.18) 6.58 (-0.02) 2.07 (2.15) 2.53 (2.57) P7 3.72 ± 16.53% 5.75 (-0.08) 6.38 (+0.08) 2.62 (2.60) 3.08 (3.02) P8 3.21 ± 22.42% 5.78 (-0.12) 6.63 (+0.13) 2.97 (3.07) 3.48 (3.45) P9 2.93 ± 24.35% 5.78 (-0.05) 6.63 (+0.08) 3.32 (3.37) 3.86 (3.82)
P11 4.17 ± 15.91% 5.78 (-0.12) 6.61 (+0.11) 2.12 (2.15) 2.62 (2.57) P12 3.72 ± 14.46% 5.80 (-0.07) 6.60 (-0.10) 2.45 (2.52) 2.93 (2.90) P13 3.13 ± 15.85% 5.81 (-0.07) 6.58 (+0.08) 2.98 (3.17) 3.45 (3.42) P14 2.24 ± 20.06% 5.88 (-0.03) 6.58 (+0.05) 4.01 (4.12) 4.52 (4.48)
14

Table 3.3A-5. Yearly comparisons of mean monthly maximum and minimum water levels collected at the 11 DCP stations. Significant differences were identified using a Wilcoxon Rank Sum test. NS indicates no significant difference at p<0.05. Asterisks denote significant differences between years and p values are given. N/A indicates insufficient data to complete analyses. Additional yearly comparisons are available in previous reports. Station
Yr1/Yr7 Mean Monthly Maximum WL
Yr6/Yr7 Mean Monthly Maximum WL
Yr1/Yr7 Mean Monthly Minimum WL
Yr6/Yr7 Mean Monthly Minimum WL
P1 NS NS NS NS P2 *(0.0016) *(0.0015) *(0.0012) *(0.0140) P3 *(0.0337) NS *(0.0012) NS P4 NS NS NS NS P6 *(0.0227) NS NS *(0.0363) P7 *(0.0097) NS *(0.0009) NS P8 NS NS NS NS P9 *(0.0055) *(0.0047) *(0.0004) NS P11 *(0.0253) NS NS NS P12 N/A NS N/A NS P13 *(0.0038) NS *(0.0448) NS P14 *(0.0136) NS NS NS
Statistical differences between tidal range values for upstream stations, before versus after channel deepening for specified tidal changes at the river mouth (P1) comprise one key approach to determining if the project has resulted in detectable changes in tidal range upstream. One assumption of this approach is that the tidal range at the base station at Ft Caswell (P1) is in equilibrium with open ocean tides and not subject to changes associated with dredging activities. To verify this condition, the observed tidal range at P1 for each reporting period is regressed against the predicted (astronomical) range. Analysis of Covariance (ANCOVA) is then used to determine if significant differences exist between each yearly regression (i.e. slope). The tidal ranges observed at each upstream station are then regressed on the corresponding tidal range for P1. Comparisons of the resultant regression slopes are then conducted between subsequent reporting periods using ANCOVA (p<0.05).
3.4A Tidal Effects
3.41A Ft Caswell (P1) and Outer Town Creek (P2)
The tidal ranges observed at the Ft Caswell base station show good agreement with the predicted tides for the area (Figure 3.41A-1). When observed tidal ranges are regressed against the predicted tidal ranges, the R2 value is similar to those documented in previous reports. The slope of the predicted tidal range versus observed tidal range regression for this monitoring period was not significantly different from the slope
15

reported in 2005-2006. The mean tidal range at P1 was not significantly different from the mean reported in the previous monitoring period, but was significantly lower than the range reported in Year 1 (Table 3.3A-2, Figure 3.3A-1). Mean tidal range at P1 has not significantly differed between subsequent years since the significant decrease noted in Year 2 of this study. There continues to be no significant difference in either the mean monthly maximum or minimum water levels relative to last year’s reporting period or relative to Year 1 (Table3.3A-5). The mean tidal range at the Outer Town Creek (P2) site was not significantly different from the means reported in the previous three monitoring periods or the mean reported Year 2 of the study. This year, the mean tidal range at P2 was significantly higher than the mean reported in Year 1. At station P2, both the mean monthly maximum water level and mean monthly minimum water level were significantly higher from the first year of reporting and the previous reporting period. The mean monthly maximum water level also was significantly higher than the value reported in the previous monitoring period. As seen in Figure 3.41A-2, the tidal range at P2 is strongly and positively correlated with observed tidal ranges at P1. The slope of the P1 versus P2 regression for this monitoring period was not significantly different from the slope reported during 2005-2006 reporting period (Table 3.3A-3). The slope measured during this reporting period at P2 was significantly different from the slope measured in the first monitoring period (p<0.0001) at the p<0.05 significance level. This result is consistent with both the 2004-2005 and 2005-2006 reporting periods. Although tidal fluctuations at this station are impacted by regional climatology (e.g. drought and flooding), P2 was not appreciably affected by climatological events this year as evidenced by the low range in water level variability (R2 = 0.94).
The water level curve at P1 has remained generally symmetrical and continues to show less evidence of the time asymmetries (Table 3.3A-3) measured at other stations. These asymmetries, as evidenced by the unequal flood and ebb durations shown in Table 3.3A-3, begin at site P2 and continue up river to all monitoring sites. The duration of flooding tide at P2 did not change during this reporting period relative to the duration reported in 2005-2006. The ebb tide duration at P2 is comparable to the duration reported in the previous reporting period. The mean high tide lag has not changed appreciably since the last reporting period. The mean low tide lag decreased slightly (0.10 hour) relative to the previous reporting period. When coupled with the data presented in previous monitoring reports, the tidal lags show no consistent pattern and do not indicate a definitive change in the rate of the tidal wave propagation up-estuary.
16
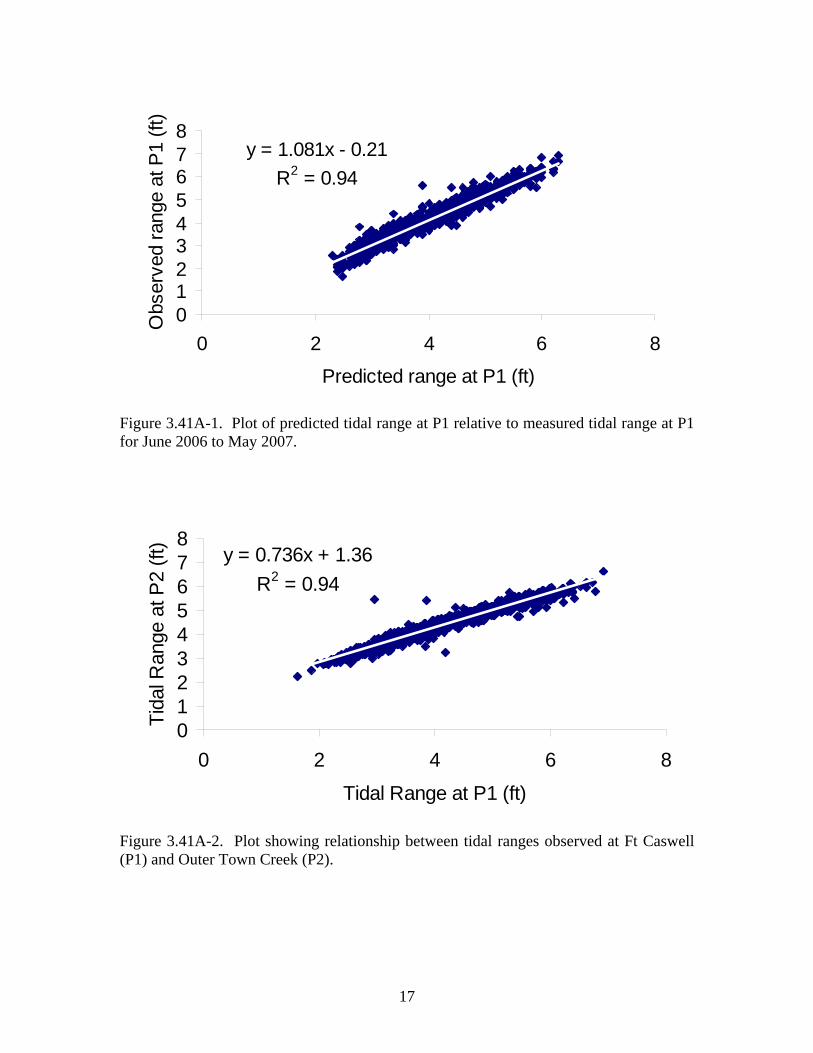
y = 1.081x - 0.21R2 = 0.94
012345678
0 2 4 6
Predicted range at P1 (ft)
Obs
erve
d ra
nge
at P
1 (ft
)
8
Figure 3.41A-1. Plot of predicted tidal range at P1 relative to measured tidal range at P1 for June 2006 to May 2007.
y = 0.736x + 1.36R2 = 0.94
012345678
0 2 4 6 8
Tidal Range at P1 (ft)
Tida
l Ran
ge a
t P2
(ft)
Figure 3.41A-2. Plot showing relationship between tidal ranges observed at Ft Caswell (P1) and Outer Town Creek (P2).
17

3.42A Inner Town Creek (P3)
The mean tidal range observed at this site during this reporting period was approximately 1.6 feet less than the tidal range observed at the creek mouth (Table 3.3A-4, Figure 3.42A-1) and lower than the mean tidal ranges of all other sites except P14. This result is consistent with the results of the previous 2 reporting periods. The mean tidal range from June 2006 to May 2007 was not significantly different from the mean tidal range reported for the previous reporting period or from the mean reported for Year 1. The mean tidal range at P3 during this reporting period is significantly different from the means reported in Year 2 and 3, only. This result is consistent with the findings of the previous reporting period. As reported previously, Years 2 and 3 were strongly influenced by climatological events including regional drought and increased localized precipitation events in the watershed, respectively. Water level curves generated for this station and computed tidal ranges continue to exhibit a wide range of variability and depend on flow conditions in the creek. Both the mean flood and mean ebb duration decreased slightly during this reporting period relative to the previous reporting period (Table 3.3A-4). This contrasts with the previous reporting period when both mean flood and mean ebb duration increased relative to the prior year. There was no significant difference in either mean monthly maximum or mean monthly minimum water level when this reporting period was compared to the previous reporting period. Both the mean monthly maximum and minimum water levels, however, are significantly different from those reported during the first year of monitoring. These results are consistent with the 2005-2006 reporting period.
y = 0.241x + 1.77R2 = 0.22
012345678
0 2 4 6 8
Tidal Range at P1 (ft)
Tida
l Ran
ge a
t P3
(ft)
Figure 3.42A-1. Plot showing relationship between tidal ranges observed at Ft Caswell (P1) and Inner Town Creek (P3).
18

The correlation between tides at P3 and P1 this year was less than the values reported in 2005-2006 (R2<0.46). The slope of the P1 versus P3 regression for this monitoring period was not significantly different from the slope reported in 2005-2006 or significantly different from the slope reported for Year 1 (Table 3.3A-2). This result is consistent with the previous reporting period.
3.43A Corps Yard (P4)
As has been noted for previous reporting periods, the mean tidal range observed at P4 is significantly higher than the mean tidal range at the P1 base station (Figure 3.43A-1). The mean tidal range during the 2006-2007 reporting period was significantly greater than the mean reported for Years 1, 2, and 3, but not significantly different from the means reported for Years 4, 5, and 6. As described in the 2005 -2006 report, Year 3 was exceptional due to the large degree of flooding and high discharge that persisted during most of that reporting period. The slope (0.708) of the P1/P4 regression was significantly greater than the slope reported for the first monitoring period (Table 3.3A-3), but not significantly different from the slope reported last year (0.718). This result is consistent with results reported for 2004-2005 and 2005-2006. Water level curves generated for P4 continue to show a slight time asymmetry that does not occur at P1. The mean ebb and flood durations, 6.73 and 5.66 hours, respectively, are comparable to those reported in 2004-2005 and 2005-2006. These durations have changed by less than 1% since the previous reporting periods. The mean low tide lag has not changed since the last reporting period; however, the mean high tide lag has decreased slightly (Table 3.3A-4). This finding contrasts with the previous reporting period where the mean high tide lag had not changed since the last reporting period, but the mean low tide lag decreased slightly. While the mean high is still less than the lag reported for 2002-2003 when the river was characterized by higher than average discharge, the mean low tide lag for this reporting period was the same as that reported for 2002-2003 (Figure 3.5A-1). Mean maximum and minimum water levels at this station are not significantly different from those reported in 2005-2006 or 2000-2001 (Table 3.3A-5). These results are consistent with those reported for the previous 2 reporting periods. Water levels at the Corps yard continue to be impacted by changes in river discharge, but to a much lesser degree than stations further upstream and to lesser degree than in 2002-2003 and 2003-2004.
19

y = 0.708x + 1.56R2 = 0.93
012345678
0 2 4 6
Tidal Range at P1 (ft)
Tida
l Ran
ge a
t P4
(ft)
8
Figure 3.43A-1. Plot showing relationship between tidal ranges observed at Ft Caswell (P1) and the Corps Yard station (P4). 3.44A Cape Fear River: Eagle Island (P6), Indian Creek (P7), Dollisons Landing (P8),
and Black River (P9)
With the exception of P6, mean tidal ranges computed for mainstem river sites were lower than the mean determined for P1. For the third consecutive year, the mean tidal range at P6 was less than the mean tidal range reported for P2 (Table 3.3A-4). During the 2003-2004 reporting period, the mean tidal range at P6 was identical to the mean reported at P2. Consistent with previous years, tidal range decreased with distance upriver (Table 3.3A-4) with P9 exhibiting the lowest tidal range of these sites. Tidal range variability, however, increased with distance upriver (Table 3.3A-4) with P9 exhibiting the greatest variability. The mean tidal ranges measured at the mainstem river sites were generally lower than last year, with the exception of site P6 which increased by 0.07 feet. With the exception of site P6, changes in mean tidal range at the mainstem stations also were greater (0.12 to 0.28 feet) than changes observed for stations in the Northeast Cape Fear River (Section 3.45). The mean tidal ranges were significantly lower than those measured during the previous reporting period at sites P7, P8, and P9. This contrasts with the previous reporting period when most mainstem stations had mean tidal ranges that were significantly higher than the 2004-2005 reporting period. Further, sites P8 and P9 had mean tidal ranges that were significantly different from the ranges reported for the first project year (Figure 3.3A-1, Table 3.3A-2). During the previous reporting period, P1 and P7 were the only sites that exhibited a mean tidal range that was significantly different from Year 1. This year’s results are more similar to those reported for the 2003-2004 and 2004-2005 reporting periods and may reflect a greater similarity in mean discharge between this reporting period and the mean discharge recorded in Years 4 and 5 (Figure 3.5A-1). With the exception of site P9, the mean monthly maximum
20

water levels did not differ significantly from the values reported in 2005-2006 (Table 3.3A-2). At P9, the mean monthly maximum water level was significantly higher than the mean reported for the previous reporting period. When compared to the Year 1 value, mean monthly maximum values were significantly higher at all stations except P8 where there was no difference. The mean monthly minimum values were significantly different from 2005-2006 only at station P6 (lower). In the previous reporting period, the mean monthly minimum values were significantly different from the previous year also only at P6. The mean monthly minimum values were significantly different from Year 1 values at P7 and P9.
Figures 3.44A-1, 3.44A-2, 3.44A-3, and 3.44A-4 illustrate the relationship between tidal range at these Cape Fear River sites and tidal range at Ft. Caswell. In general, tidal range at each upriver site is positively correlated with tidal range at the mouth. During this reporting period, the R2 values were much lower that the 2005-2006 values for all mainstem stations with the exception of site P6. The increased variability noted during this reporting period may reflect a combination of more frequent periods of increased precipitation, higher river discharge (Figure 3.5A-1), and local landscape modifications that occurred near some of the sites. For example, extensive land clearing occurred near site P7 this year which may have affected local runoff or the introduction of detrital material and sediment to the area surrounding the DCP. It is also possible that some of these sites may be exhibiting a degradation of data quality due to the age of the equipment. Sites P7 and P8 experienced the largest number of lost tides of all stations due to a combination of mechanical errors that persisted over extended periods of time. Comparisons of the regression slopes between this reporting period and Year 6 were significantly different at all of the mainstem sites (Table 3.3A-3). This result contrasts with last year’s report where none of the stations showed a significant difference in slope relative to the previous year except for station P6. When regression slopes for this reporting period were compared to Year 1, only site P6 exhibited a significant difference.
The mainstem upriver sites continue to exhibit pronounced time asymmetries as shown in previous reports. The duration of flooding tide at these stations has increased very slightly (by less than 0.2%), since the last reporting period (Table 3.3A-4). This increase is much lower than in the previous two reporting periods where flooding duration had increased by less than 1.5 to 2% at all stations. The duration of ebb tide also changed very little during this reporting period (also less than 0.2%). With the exception of P6, the duration of ebb tide increased, albeit minimally, at all stations. At station P6, the duration of ebb tide decreased by 0.02%. The mean high tide lag from P1 was comparable to the lag times reported in 2005-2006. P8 exhibited the greatest change; a decrease in mean high tide lag of six minutes. P8 also showed the greatest change (again a decreased in lag time of 6 minutes relative to 2004-2005) during the previous reporting period. Changes in mean low tide lag relative to the previous reporting period also were comparable to 2005-2006, with a slight decrease at site P6 and slight increases at the remaining sites (Table 3.3A-4).
21

y = 0.580x + 1.80R2 = 0.80
012345678
0 2 4 6 8
Tidal Range at P1 (ft)
Tida
l Ran
ge a
t P6
(ft)
Figure 3.44A-1. Plot showing relationship between tidal ranges observed at Ft. Caswell (P1) and Eagle Island (P6).
y = 0.438x + 1.88R2 = 0.41
012345678
0 2 4 6 8
Tidal Range at P1 (ft)
Tida
l Ran
ge a
t P7
(ft)
Figure 3.44A-2. Plot showing relationship between tidal ranges observed at Ft. Caswell (P1) and Indian Creek (P7).
22

y = 0.376x + 1.595R2 = 0.20
012345678
0 2 4 6 8
Tidal Range at P1 (ft)
Tida
l Ran
ge a
t P8
(ft)
Figure 3.44A-3. Plot showing relationship between tidal ranges observed at Ft. Caswell (P1) and Dollisons Landing (P8).
y = 0.292x + 1.67R2 = 0.15
012345678
0 2 4 6 8
Tidal Range at P1 (ft)
Tida
l Ran
ge a
t P9
(ft)
Figure 3.44A-4. Plot showing relationship between tidal ranges observed at Ft. Caswell (P1) and Black River (P9).
23

3.45A Northeast Cape Fear: Smith Creek (P11), Rat Island (P12), Fishing Creek (P13), and Prince George Creek (P14)
The mean tidal ranges computed for northeast Cape Fear sites over the current reporting period were not significantly different from those reported in 2005-2006 at sites P11 and P12 (Figure 3.3A-1, Table 3.3A-2); a finding consistent with last year’s report for these stations. There also was no difference in mean tidal range between this reporting period and Year 1 at station P11. A similar comparison is unavailable for site P12 due to an incomplete data set at that station during the first year of monitoring. Mean tidal ranges at sites P13 and P14, however, were significantly lower than those reported in both 2005-2006 and Year 1 (Table 3.3A-2). This observation contrasts with the 2005-2006 reporting period where mean tidal ranges at these sites were not significantly different from Year 1, but is consistent with the findings reported in 2004-2005. These results most likely reflect discharge variability in the river. Although discharge data are no longer available for the Northeast Cape Fear, discharge on the Cape Fear mainstem increased during this reporting period; reaching a mean in excess of the 30 year average for the first time since 2004-2005 (Figure 3.5A-1). The greater similarity in discharge between this reporting period and the 2004-2005 reporting period may account for the similarity in mean tidal ranges between this reporting period and the 2004-2005 reporting periods. Mean tidal ranges for all of the Northeast Cape Fear River stations decrease upstream and continue to be lower than the mean determined for P1 with the exception of station P11 which was slightly higher (0.02 ft.) than station P1 (Table 3.3A-3). This result is consistent with results from the previous reporting periods. Neither the mean monthly minimum water level nor the mean monthly maximum water level significantly differed from values reported in 2005-2006 (Table 3.3A-5). This result is consistent with previous reporting periods. All of the sites in the Northeast Cape Fear River continue to exhibit time asymmetries. The mean monthly maximum water level, however, were significantly higher than the Year 1 value at all sites except P12 where no Year 1 data are available. Mean minimum water levels exhibited a significant difference from Year 1 only at station P13 (higher). Mean flood durations are shorter than ebb durations and show little variability among sites (Table 3.3A-4). During this monitoring period, mean flood duration changed little relative to the previous reporting period. Where changes were noted, a decrease in duration occurred. The greatest change occurred at P11 where the flood duration decreased by less than 1% (Table 3.3A-4). The mean ebb durations also changed little (~0.1% or less). All sites showed a slight increase except for P12.
Tidal ranges at upstream stations in the Northeast Cape Fear are positively correlated with the tidal range at P1 (Figures 3.45A-1, 3.45A-2, 3.45A-3, and 3.45A-4). The mean tidal range at P14 on the Northeast Cape Fear River continues to be less than the mean range measured at P9, 12 miles from convergence on the Cape Fear River. Consistent with previous years, tidal ranges at stations P11 and P12 are more strongly correlated to tidal ranges observed at P1 than the tidal ranges at P13 and P14. Water levels at these upriver stations continue to be impacted strongly by other types of events; especially increased rainfall and upriver discharge as suggested by the lower R2 values for the most upstream stations (Figures 3.45A-3 and 3.45A-4). Interestingly, tidal ranges
24

at Northeast Cape Fear River stations and P1 during this reporting period are stronger than those at most of the mainstem (i.e. P6, P7, P8, and P9) stations. Comparisons of the regression slopes between this reporting period and last year yielded no significant difference for any of the sites except P11. At site P11, slope decreased from 0.63 to 0.61. A significant difference in regression slope between this reporting period and 2000-2001 also occurred at site P11 (increase). As noted earlier and in previous reports, no Year 1 data were available for P12 with which to make a similar comparison.
y = 0.612x + 1.63R2 = 0.79
012345678
0 2 4 6
Tidal Range at P1 (ft)
Tida
l Ran
ge a
t P11
(ft)
8
Figure 3.45A-1. Plot showing relationship between tidal ranges observed at Ft. Caswell (P1) and Smith Creek (P11).
y = 0.508x + 1.62R2 = 0.74
012345678
0 2 4 6 8
Tidal Range at P1 (ft)
Tida
l Ran
ge a
t P12
(ft)
Figure 3.45A-2. Plot showing relationship between tidal ranges observed at Ft. Caswell (P1) and Smith Creek (P12).
25

y = 0.395x + 1.52R2 = 0.57
012345678
0 2 4 6 8
Tidal Range at P1 (ft)
Tida
l Ran
ge a
t P13
(ft)
Figure 3.45A-3. Plot showing relationship between tidal ranges observed at Ft. Caswell (P1) and Fishing Creek (P13).
y = 0.176x + 1.53R2 = 0.13
012345678
0 2 4 6 8
Tidal Range at P1 (ft)
Tida
l Ran
ge a
t P14
(ft)
Figure 3.45A-4. Plot showing relationship between tidal ranges observed at Ft. Caswell (P1) and Prince George Creek (P14).
26
3.5A Influence of Upstream Flow
The mean annual discharge for the 2003-2004 reporting period (Figure 3.5A-1) was very close to that reported for this year and the mean tidal ranges. Periods of lower, drought-induced water levels and extreme flooding in the system over the last 5 years have contributed to differing tidal conditions in the Cape Fear and Northeast Cape Fear Rivers between monitoring years. These effects are confounded by the shortened data set for Year 1, which included data collected from October to June, only, and covered a period when monthly river discharge was below the long-term average (~5,531 ft3/s) reported by the USGS at Lock and Dam 1 on the Cape Fear mainstem (Figure 3.5A-1). Interpretations related to discharge are also complicated by the fact that the discharge time series for the Northeast Cape Fear River is no longer available. As noted in the 2005-2006 report, information provided by Ramona Traynor at the USGS in Reston, VA indicates that “streamflow data collection at this station was only funded for a short term project. With the completion of the data-collection phase of the project, the station has returned to “gauge-only data collection”. We suggest that the Corps pursue a dialog with the USGS to ensure that discharge data are available in the future. Nonetheless, data from previous years indicate that even though discharge rates in the Northeast Cape Fear River are lower than in the mainstem, periods of increased discharge frequently occur. As discussed in previous reports, the higher tidal ranges observed for P1 for the first two monitoring periods may reflect lower than average flows in the river which have a tendency to produce higher tidal ranges. In contrast, the above average discharges recorded during monitoring Years 3 and 4, may explain the lower mean tidal ranges observed at P1 and other stations during those years. The Year 5 discharge data included fewer high flow events and more closely approximated mean conditions for the river (Figures 3.5A-1 and 3.5A-2) than the previous 3 years. During this reporting period, the mean discharge in the Cape Fear mainstem exceeded the 30 year average for the first time since 2004-2005. The mean discharge for this reporting period is similar to the mean discharge reported for 2003-2004. This similarity in discharge may account for the greater similarity in mean tidal ranges between this reporting period and 2003-2004 than between this reporting period and the intervening years for the upriver stations (Table 3.5A-1).
27

01,0002,0003,0004,0005,0006,0007,0008,0009,000
year 1 year 2 year 3 year 4 year 5 Year6 Year 7
Monitoring Year
Mea
n D
isch
arge
(ft3 /s
ec)
Figure 3.5A-1. Mean discharge for each monitoring period. Monitoring Year 1 is October 2000 to May 2001; monitoring Year 2 in June 2001 to May 2002; monitoring Year 3 is June 2002 to May 2003; monitoring Year 4 is June 2003 to May 2004; monitoring Year 5 is June 2004 to May 2005; monitoring Year 6 is June 2005 to May 2006; and monitoring Year 7 is June 2006 to May 2007. The line denotes the long-term mean discharge for the Cape Fear River as measured at Lock 1 by a USGS gauging station.
Streamflow on the Cape Fear River at Lock 1 for the 2006-2007 Reporting Period
05000
1000015000200002500030000350004000045000
6/1/
2006
7/1/
2006
8/1/
2006
9/1/
2006
10/1
/200
611
/1/2
006
12/1
/200
61/
1/20
072/
1/20
073/
1/20
074/
1/20
075/
1/20
07
Date
Dis
char
ge (f
t3 /sec
)
Figure 3.5A-2. Plot showing discharge in the Cape Fear River at Lock 1 for the current monitoring period. Data available at http://nwis.waterdata.usgs.gov/nc/nwis site number 02105769.
28

Table 3.5A-1. Mean tidal ranges for upriver stations in both the Cape Fear River and Northeast Cape Fear River. The data are derived from tables included in monitoring reports submitted between 2003 and present.
Station Mean Tidal Mean Tidal Mean Tidal Mean Tidal Number Range (ft)
2003-2004 Range (ft) 2004-2005
Range (ft) 2005-2006
Range (ft) 2006-2007
P6 4.33 ± 14.14% 4.29 ± 15.44% 4.22 ± 13.92% 4.29 ± 15.00% P7 3.74 ± 15.0% 3.79 ± 14.33% 3.84 ± 14.05% 3.72 ± 16.53% P8 3.22 ± 19.9% 3.32 ± 16.83% 3.46 ± 15.22% 3.21 ± 22.42% P9 2.81 ± 26.8% 3.03 ± 21.23% 3.21 ± 15.89% 2.93 ± 24.35%
P11 4.19 ± 14.44% 4.22 ± 14.63% 4.21 ± 14.32% 4.17 ± 15.91% P12 3.77 ± 13.4% 3.75 ± 14.16% 3.75 ± 14.53% 3.72 ± 14.46% P13 3.16 ± 13.9% 3.16 ± 13.98% 3.18 ± 14.92% 3.13 ± 15.85% P14 2.19 ± 20.4% 2.21 ± 19.18% 2.31 ± 18.18% 2.24 ± 20.06%
3.6A Tidal Harmonics
Because tides are resonance phenomena, any changes in cross sectional area will affect propagation frequency such that some harmonic components may be altered to a greater or lesser degree. In the CFR, it is anticipated that the tidal amplitudes and phases of the six primary harmonics, as monitored and defined by the National Ocean Service of the National Oceanic and Atmospheric Administration, will change after dredging. By focusing on the primary harmonics for the Lower Cape Fear, we are attempting to resolve differences in water levels resulting from tides versus upstream inputs.
A classical tidal harmonics analysis was performed on each of the individual stations of the Cape Fear River Project (Table 3.6A-1) using the MATLAB version of T-Tide (Pawlowicz et al. 2002). The relative phase and amplitude of the major frequencies in the measured 6-minute water level data have been determined with error estimates and a 95% confidence level. Constituents were considered significant if the signal-to-noise ratio was greater than 1. As expected the M2 component is the dominant constituent at every station. This result is consistent with the previous reporting period. These phase/amplitude data provide a compression of the data in the complete time series and will eventually be used to identify differences in tidal dynamics between the stations along the river that have been impacted by channel modification activities. Table 3.6A-2 shows tidal harmonics for station P4 over the years spanning 1994 to 2006. Station P4 was selected because water level time series data were available for several years prior to the initiation of dredging activities and because harmonic constituents have been well-established. T-tide was used to determine the phase and amplitude of the dominant tidal constituents by year. While the relative dominance of the lesser constituents varied among years, the M2 component was the dominant constituent every year. Neither the amplitude nor the phase of the M2 constituent has changed appreciably over the years examined. For the most part, the amplitude has varied between 2.03 and 2.09. Higher amplitudes were noted in 1997 (pre-dredging) and in 2003 and 2004 (during dredging
29

modifications). Lower amplitudes occurred in 1994, 1995, and 1998 (prior to dredging activities) and again in 2001 and 2002 after dredging had been initiated. There does not appear to be a consistent pattern in amplitude change over the 11 year period examined. The amplitude of the M2 constituent for the current reporting period is very close to the amplitude reported last year. Changes in harmonic amplitude initially appear to be more closely linked to variations in discharge than dredging activities. As expected, the M2 amplitude at sites P2, P6, and P11 (sites just upstream and downstream of P4) are more similar to the P4 M2 amplitude than other monitoring sites.
Table 3.6A-1. Summary of tidal harmonics for reporting period 2006-2007. Errors shown represent the standard error association with each respective data set. Site Tide Amplitude Amplitude Error Phase Phase Error P01 M2 1.9582 0.032 220.44 0.98 N2 0.4363 0.033 209.39 4.54 K1 0.4211 0.035 249.93 4.38 S2 0.275 0.036 131.24 6.93 O1 0.2649 0.032 127 7.83 P02 M2 2.0717 0.043 263.19 1.32 N2 0.4078 0.044 251.43 6.37 K1 0.332 0.047 298.13 7.26 S2 0.2645 0.033 133.59 6.81 O1 0.2596 0.036 152.69 6.84 P03 M2 1.3047 0.05 291.23 1.79 K1 0.2552 0.047 295.33 9.41 N2 0.1929 0.045 340.76 12.84 O1 0.1842 0.023 179.07 7.34 S2 0.1636 0.023 164.13 7.91 P06 M2 2.0632 0.048 278.69 1.35 N2 0.3983 0.047 269.05 6.03 K1 0.3135 0.054 316.6 7.82 S2 0.2544 0.037 163.6 8.31 O1 0.2533 0.034 144.24 6.73 P07 M2 1.777 0.044 290.94 1.36 N2 0.3326 0.043 285.7 8.08 K1 0.2457 0.043 329.2 10.91 O1 0.2407 0.027 173.83 6.77 S2 0.2393 0.026 154.53 7.09 P08 M2 1.5875 0.049 332.23 1.77 K1 0.3343 0.024 181.44 4.79 O1 0.2606 0.045 351.09 9.55 N2 0.2368 0.031 214.11 7.54 S2 0.1515 0.048 355.29 16.85 P09 M2 1.2873 0.067 333.23 2.75 K1 0.2299 0.065 352.28 15.59 O1 0.2131 0.026 214.12 7.63 N2 0.2084 0.025 169.85 6.71
30

Table 3.6A-1. (concluded)
Site Tide Amplitude Amplitude Error Phase Phase Error S2 0.1347 0.058 343.22 27.94 P11 M2 2.013 0.047 303.88 1.25 N2 0.3824 0.047 307.35 7.31 K1 0.3008 0.043 316.75 8.78 O1 0.248 0.033 144.58 8.87 S2 0.2478 0.035 188.95 8.15 P12 M2 1.7744 0.035 314.44 1.35 N2 0.3445 0.037 323.06 6.47 K1 0.2805 0.04 330.96 7.37 S2 0.2243 0.031 197.37 7.05 O1 0.1937 0.031 155.22 8.95 P13 M2 1.4802 0.042 326.72 1.79 N2 0.2628 0.042 333.94 8.45 K1 0.1991 0.027 210.49 6.63 S2 0.1978 0.028 165.23 7.49 O1 0.1953 0.039 342.06 11.68 P14 M2 0.9689 0.054 331.27 2.78 N2 0.1685 0.022 223.98 7.36 K1 0.1586 0.021 179.65 6.84 O1 0.1501 0.051 354.64 18.51 S2 0.0819 0.056 352.76 42.94
Table 3.6A-2. Summary of yearly tidal harmonics for station P4 from 1994 to 2006. Errors shown represent the standard error association with each respective data set. Year Tide Amplitude Amplitude Error Phase Phase Error 1994 M2 2.0292 0.019 278.61 0.53 N2 0.4042 0.016 273.67 2.49 K1 0.2552 0.016 148.7 3.59 S2 0.2475 0.018 310.98 4.5 O1 0.1759 0.019 172.29 5.39 P1 0.092 0.016 158.88 11.02 1995 M2 2.0374 0.016 278.72 0.52 N2 0.3876 0.018 273.44 2.6 S2 0.2349 0.017 311.04 4.78 K1 0.2236 0.016 149.54 4.57 O1 0.1776 0.017 174.01 5.37 P1 0.0829 0.017 157.01 11.85 1996 M2 2.0925 0.023 279.22 0.58 N2 0.3901 0.02 271.06 3.41 S2 0.2511 0.021 312.45 5.64 K1 0.2328 0.022 155.42 5.51 O1 0.1635 0.02 169.37 6.59 P1 0.0936 0.021 163.6 12.77
31

Table 3.6A-2. (continued)
Year Tide Amplitude Amplitude Error Phase Phase Error 1997 M2 2.0934 0.017 279.78 0.42 N2 0.3757 0.018 272.17 2.46 S2 0.2399 0.017 312.47 3.72 K1 0.2268 0.019 156.46 4.81 O1 0.1611 0.017 163.3 6.95 P1 0.0898 0.019 160.1 11.54 1998 M2 2.0315 0.024 281.11 0.63 N2 0.3747 0.02 267.61 2.8 K1 0.2347 0.017 160.05 5.52 S2 0.2306 0.022 311.18 5.14 O1 0.1831 0.016 161.94 5.91 P1 0.0976 0.017 147.25 10.41 1999 M2 2.0322 0.032 281.45 0.89 N2 0.3835 0.033 269.1 4.19 S2 0.2437 0.031 311.72 6.5 K1 0.233 0.018 163.4 3.84 O1 0.1775 0.018 155.05 5.63 P1 0.101 0.018 163.96 10.7 2000 M2 2.061 0.012 281.36 0.3 N2 0.3999 0.011 270.58 1.63 S2 0.246 0.013 308.76 2.42 K1 0.2412 0.014 165.5 2.74 O1 0.172 0.012 151.74 4.37 P1 0.1016 0.012 164.04 6.32 2001 M2 2.0368 0.015 280.83 0.45 N2 0.4185 0.018 269.97 2.45 K1 0.2626 0.016 162.8 3.58 S2 0.2594 0.017 308.46 3.42 O1 0.1945 0.016 155.4 4.36 P1 0.0896 0.015 161.15 10.74 2002 M2 2.0304 0.013 279.96 0.5 N2 0.4274 0.016 272.48 2.26 K1 0.2818 0.015 162.31 2.95 S2 0.2722 0.015 307.5 3.2 O1 0.213 0.013 151.06 4.41 P1 0.1047 0.016 167.79 8.28 2003 M2 2.1106 0.019 277.22 0.48 N2 0.4341 0.021 272 2.86 K1 0.2883 0.019 158.71 3.81 S2 0.2703 0.018 303.72 4.1 O1 0.2267 0.016 157.51 4.85 P1 0.0776 0.017 147.96 13.59
32
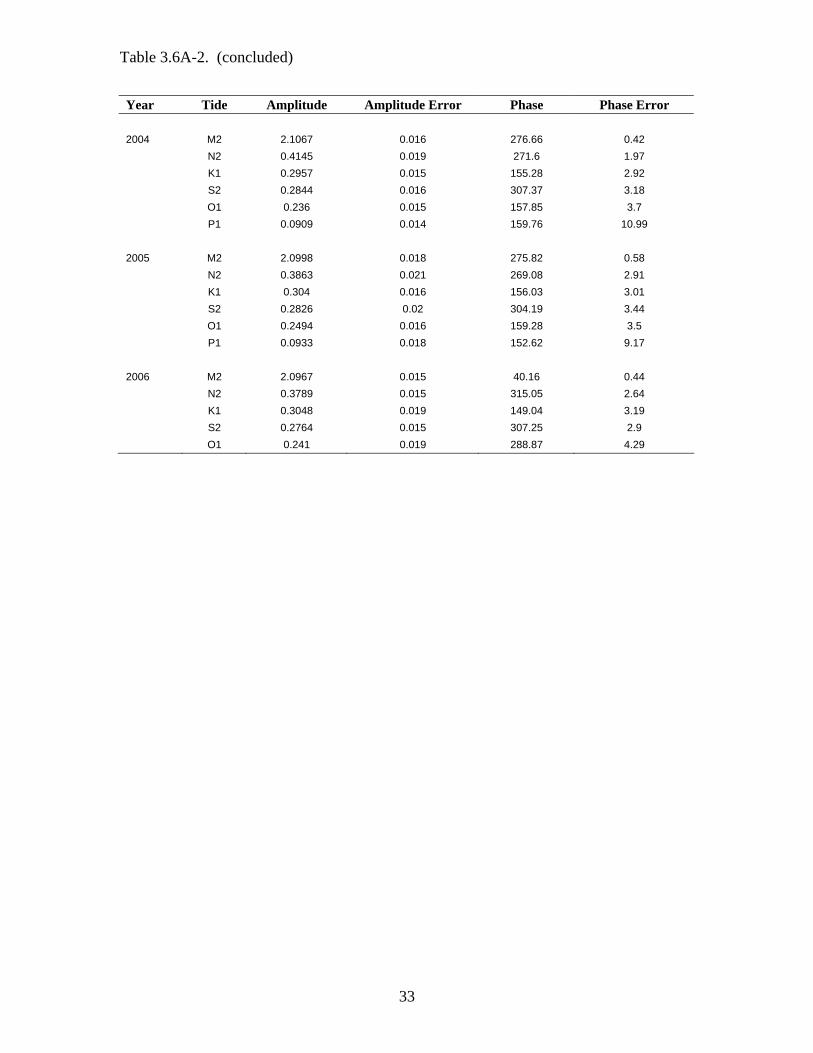
Table 3.6A-2. (concluded)
Year Tide Amplitude Amplitude Error Phase Phase Error 2004 M2 2.1067 0.016 276.66 0.42 N2 0.4145 0.019 271.6 1.97 K1 0.2957 0.015 155.28 2.92 S2 0.2844 0.016 307.37 3.18 O1 0.236 0.015 157.85 3.7 P1 0.0909 0.014 159.76 10.99 2005 M2 2.0998 0.018 275.82 0.58 N2 0.3863 0.021 269.08 2.91 K1 0.304 0.016 156.03 3.01 S2 0.2826 0.02 304.19 3.44 O1 0.2494 0.016 159.28 3.5 P1 0.0933 0.018 152.62 9.17 2006 M2 2.0967 0.015 40.16 0.44 N2 0.3789 0.015 315.05 2.64 K1 0.3048 0.019 149.04 3.19 S2 0.2764 0.015 307.25 2.9 O1 0.241 0.019 288.87 4.29
33

3.0 PART B - SALINITY PROFILES IN THE CAPE FEAR RIVER TO LOCK AND DAM 1
3.1B Summary
Vertical salinity profiles were measured at twelve stations during cruises conducted between August 2006 and May 2007 in the Cape Fear River from P7 to Lock & Dam 1. The cruises consisted of 2 persons on a vessel stopping and collecting data using a GPS for location, YSI85 for salinity detection and Van Durn bottle for water collection. During these nine months of field collection, flow rates over Lock and Dam 1 ranged from 963 cfs to 3,640 cfs (Figure 3.5A-2). During the period of highest flow rate in December 2006 no saline water was observed at any station. Data collected in May 2006, during the lowest flow period, also did not detect saline water at any station from the surface to maximum depth (Figure 3.1B-1). No saline water was measured during any of the nine cruises.
River Salinity At Depth
0 5
10 15 20 25 30 35 40 45 50
0 0.1 0.2 Salinity (ppt)
Dep
th (f
eet)
River Salinity At Depth 05
101520253035404550
0 0.1 0.2 Salinity (ppt)
Dep
th (f
eet)
Site 1 Site 2
River Salinity At Depth 0 5
10 15 20 25 30 35 40 45 50
0 0.1 0.2 Salinity (ppt)
Dep
th (f
eet)
River Salinity At Depth 05
101520253035404550
0 0.1 0.2 Salinity (ppt)
Dep
th (f
eet)
Site 3 Site 4 Figure 3.1B-1. Sites 1 through 4 were the stations closest to the ocean and did not exhibit saline water at any depth during the period of lowest stream flow measured over Lock and Dam 1. Data collected in May 2006. 3.2B Background
Monitoring to detect a potential increased tidal range due to deepening of the Wilmington Harbor has occurred since June of 2000. Surface water salinity has been collected continuously at 12 monitoring stations (Figure 1.2-1) since that time. These measurements, however, did not include measurements of salinity throughout the entire
34

water column. Factors influencing this part of the river are the release of water from Jordan Lake and the resulting flow of water over Lock and Dam 1, variations of tide, and rainfall, which feeds local streams. In order to monitor the salinity gradient, 12 sites (Figure 3.2B-1) were established. The upstream limit of saltwater has become more important since the USACE began a consideration of removal or modifications of locks and dams in the Cape Fear River as part of an overall interest in improving the migration of anadramous fish, especially short-nose sturgeon, an endangered species. Several communities obtain their freshwater from intakes above Lock & Dam 1 on the Cape Fear River. If saline water penetrated upstream to Lock and Dam 1, the water supply of these communities could be threatened. The Wilmington District of USACE requested profiles upstream from the furthest known upstream salinity incursion to determine the extent of saline water upstream.
Figure 3.2B-1. Location of salinity depth sampling stations.
35

3.3B Methods
Twelve collection sites were established randomly and equally spaced along the river. The first station coincided with P7, approximately 14 miles North of Wilmington, North Carolina on the main stem Cape Fear River. Eleven additional sites were established from P7 to Lock and Dam 1 and a GPS fix determined for each. Waypoints (Figure 3.2B-1), established at each sampling location, were used for consistency during the study. When an increase in salinity was observed at the Indian Creek (P7) monitoring station, a cruise was conducted. This resulted in a total of 9 cruises from August 2006 until May 2007. Each cruise began on-or-close to a high tide and followed the high tide upstream. Thus, profiles were collected at high tide at each station when saline water was expected to be at its maximum penetration upstream. Each vertical profile recorded salinity, conductivity, temperature, and dissolved oxygen. These data should provide a view of the salinity wedge and its maximum upstream propagation when all 12 stations are examined together.
Water parameters were measured at each site starting at the surface, and at 5-foot depth intervals until 45 feet or the bottom was reached. Data were collected with a YSI 85 equipped with a 50-foot cable and multi-parameter probe that measured dissolved oxygen, temperature, conductivity, and salinity. The multi-parameter instrument was calibrated prior to the beginning of each sampling day. Water samples were taken with a Van Dorn water bottle at the first and last site at the surface, and lowest 5- foot increment possible. Samples were also collected if a change of conductivity was observed that might indicate ocean-derived salt water. Water samples were added to a 20 ml serum vial with a ratio of 1 ml of sample to 10 ml of milli Q water. Immediately after collection, the samples were capped and placed on ice. Samples were analyzed on a Dionex DX-1500 chromatograph for both chloride and sodium. Prior to analyzing samples the DX-1500 was calibrated using a Dionex seven anion standard. Milli Q water was run through the chromatograph for a control. The ratio of chloride to sodium is a constant and expected in all samples where an increase in conductivity above background was caused by ocean-derived saltwater. Other sources of increased conductivity in water do not show this ratio.
3.4B Results
There were no cruises where ocean-derived saltwater was found at any station. Figure 3.4B-1 illustrates the pattern found at all sites during all nine cruises, i.e. there was no salt water nor was any type of differentiation observed with respect to vertical profile and conductivity. The profile remained linear in shape and consistent during all collections. Data shown in Figure 3.1B-1 were from the period of the year when flow of freshwater over Lock & Dam 1 was lowest. Saline water would be expected to reach its maximum upstream intrusion during this time. Additional data can be found in Appendices B and C.
36

4.0 MARSH/SWAMP FLOOD AND SALINITY LEVELS 4.1 Summary
There were some marked differences in flooding frequency at a number of upstream stations. Significant differences (see Section 3) in tidal ranges occurred in 2006-2007 compared to both the previous reporting year and the initial year (2000-2001). Most occurred for upstream stations likely result from inter-annual difference in upstream discharge.
4.2 Data Base
Few problems were encountered this reporting year with the exception of P6 (Eagle Island) and P7 (Indian Creek) in spring 2007 (Tables 4.2-1 and 4.2-2). Station P6 has experienced additional erosion due to an increase in boat traffic from a boat manufacturing operation in Leland, North Carolina. Boats are tested at high speeds adjacent to P6. Instruments at subsite 1 at P6 were destroyed by wakes and instruments at subsite 2 damaged. At P7, there was extensive development in the adjacent uplands and clearing of the entire wetlands for development. Timber operations, heavy equipment, and the general disturbance at the site prevented the deployment of water level monitors and other electronics at these substations. A few subsites at other stations do not have salinity data (Tables 4.2-3 and 4.2-4) due to equipment failure, but these data losses were minor.
Table 4.2-1. Flooding frequency, duration, depth, and actual water level of marsh/swamp substations during fall 2006. Actual water level is calculated using the maximum depth and marsh/swamp surface elevation relative to NAVD88 datum.
Station Number
Substation Number
Season
Start Date
End Date
# Flood Events
Mean Flood Duration (hr)
Maximum Depth (ft)
Marsh/SwampElevation (ft)
Actual water
level (ft) P3 1 Fall 06 9/20/2006 10/4/2006 26/27 5.6 2.2 0.66 1.5 2 Fall 06 9/20/2006 10/4/2006 26/27 5.4 2.0 0.83 1.2 3 Fall 06 9/20/2006 10/4/2006 26/27 6.0 2.1 0.52 1.6 4 Fall 06 9/20/2006 10/4/2006 26/27 6.0 2.0 1.49 0.5 5 Fall 06 9/20/2006 10/4/2006 22/27 5.3 1.9 0.99 0.9 6 Fall 06 9/20/2006 10/4/2006 22/27 4.4 4.3 3.31 1.0 P6 1 Fall 06 10/4/2006 10/18/2006 27/27 6.6 3.5 0.76 2.7 2 Fall 06 10/4/2006 10/18/2006 27/27 5.4 3.5 1.56 1.9 3 Fall 06 10/4/2006 10/18/2006 27/27 6.7 3.4 0.85 2.6 4 Fall 06 10/11/2006 10/18/2006 14/27 4.5 3.2 1.13 2.1 5 Fall 06 10/4/2006 10/14/2006 17/27 4.9 3.6 1.92 1.7 6 Fall 06 10/4/2006 10/18/2006 21/27 5.0 3.3 1.74 1.6 P7 1 Fall 06 9/15/2006 9/29/2006 27/27 5.3 3.4 1.76 1.6 2 Fall 06 9/15/2006 9/29/2006 16/27 4.7 3.3 2.23 1.1
37
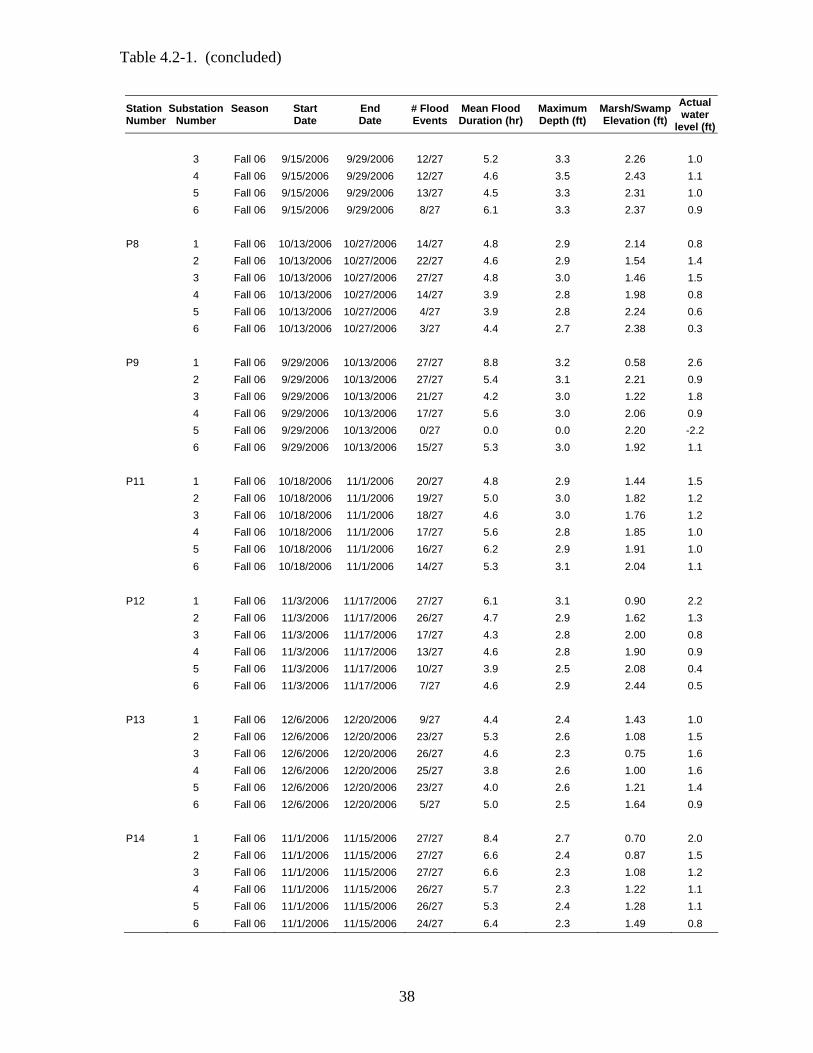
Table 4.2-1. (concluded)
Station Number
Substation Number
Season
Start Date
End Date
# Flood Events
Mean Flood Duration (hr)
Maximum Depth (ft)
Marsh/SwampElevation (ft)
Actual water
level (ft) 3 Fall 06 9/15/2006 9/29/2006 12/27 5.2 3.3 2.26 1.0 4 Fall 06 9/15/2006 9/29/2006 12/27 4.6 3.5 2.43 1.1 5 Fall 06 9/15/2006 9/29/2006 13/27 4.5 3.3 2.31 1.0 6 Fall 06 9/15/2006 9/29/2006 8/27 6.1 3.3 2.37 0.9 P8 1 Fall 06 10/13/2006 10/27/2006 14/27 4.8 2.9 2.14 0.8 2 Fall 06 10/13/2006 10/27/2006 22/27 4.6 2.9 1.54 1.4 3 Fall 06 10/13/2006 10/27/2006 27/27 4.8 3.0 1.46 1.5 4 Fall 06 10/13/2006 10/27/2006 14/27 3.9 2.8 1.98 0.8 5 Fall 06 10/13/2006 10/27/2006 4/27 3.9 2.8 2.24 0.6 6 Fall 06 10/13/2006 10/27/2006 3/27 4.4 2.7 2.38 0.3 P9 1 Fall 06 9/29/2006 10/13/2006 27/27 8.8 3.2 0.58 2.6 2 Fall 06 9/29/2006 10/13/2006 27/27 5.4 3.1 2.21 0.9 3 Fall 06 9/29/2006 10/13/2006 21/27 4.2 3.0 1.22 1.8 4 Fall 06 9/29/2006 10/13/2006 17/27 5.6 3.0 2.06 0.9 5 Fall 06 9/29/2006 10/13/2006 0/27 0.0 0.0 2.20 -2.2 6 Fall 06 9/29/2006 10/13/2006 15/27 5.3 3.0 1.92 1.1 P11 1 Fall 06 10/18/2006 11/1/2006 20/27 4.8 2.9 1.44 1.5 2 Fall 06 10/18/2006 11/1/2006 19/27 5.0 3.0 1.82 1.2 3 Fall 06 10/18/2006 11/1/2006 18/27 4.6 3.0 1.76 1.2 4 Fall 06 10/18/2006 11/1/2006 17/27 5.6 2.8 1.85 1.0 5 Fall 06 10/18/2006 11/1/2006 16/27 6.2 2.9 1.91 1.0 6 Fall 06 10/18/2006 11/1/2006 14/27 5.3 3.1 2.04 1.1 P12 1 Fall 06 11/3/2006 11/17/2006 27/27 6.1 3.1 0.90 2.2 2 Fall 06 11/3/2006 11/17/2006 26/27 4.7 2.9 1.62 1.3 3 Fall 06 11/3/2006 11/17/2006 17/27 4.3 2.8 2.00 0.8 4 Fall 06 11/3/2006 11/17/2006 13/27 4.6 2.8 1.90 0.9 5 Fall 06 11/3/2006 11/17/2006 10/27 3.9 2.5 2.08 0.4 6 Fall 06 11/3/2006 11/17/2006 7/27 4.6 2.9 2.44 0.5 P13 1 Fall 06 12/6/2006 12/20/2006 9/27 4.4 2.4 1.43 1.0 2 Fall 06 12/6/2006 12/20/2006 23/27 5.3 2.6 1.08 1.5 3 Fall 06 12/6/2006 12/20/2006 26/27 4.6 2.3 0.75 1.6 4 Fall 06 12/6/2006 12/20/2006 25/27 3.8 2.6 1.00 1.6 5 Fall 06 12/6/2006 12/20/2006 23/27 4.0 2.6 1.21 1.4 6 Fall 06 12/6/2006 12/20/2006 5/27 5.0 2.5 1.64 0.9 P14 1 Fall 06 11/1/2006 11/15/2006 27/27 8.4 2.7 0.70 2.0 2 Fall 06 11/1/2006 11/15/2006 27/27 6.6 2.4 0.87 1.5 3 Fall 06 11/1/2006 11/15/2006 27/27 6.6 2.3 1.08 1.2 4 Fall 06 11/1/2006 11/15/2006 26/27 5.7 2.3 1.22 1.1 5 Fall 06 11/1/2006 11/15/2006 26/27 5.3 2.4 1.28 1.1 6 Fall 06 11/1/2006 11/15/2006 24/27 6.4 2.3 1.49 0.8
38

39
Table 4.2-2. Flooding frequency, duration, depth, and actual water level of marsh/swamp substations during spring 2007. Actual water level is calculated using the maximum depth and marsh/swamp surface elevation relative to NAVD88 datum.
Station Number
Substation Number
Season
Start Date
End Date
# Flood Events
Mean Flood Duration (hr)
Maximum Depth (ft)
Marsh/SwampElevation (ft)
Actual water
level (ft) P3 1 Spr 07 4/2/2007 4/16/2007 24/27 4.8 2.0 0.66 1.3 2 Spr 07 4/2/2007 4/16/2007 21/27 4.4 1.9 0.83 1.1 3 Spr 07 4/2/2007 4/16/2007 24/27 5.5 1.8 0.52 1.3 4 Spr 07 4/2/2007 4/16/2007 25/27 5.0 1.9 1.49 0.4 5 Spr 07 4/2/2007 4/16/2007 17/27 5.1 1.8 0.99 0.8 6 Spr 07 4/2/2007 4/16/2007 11/27 6.1 4.1 3.31 0.8 P6 1 Spr 07 ND ND ND ND ND ND ND 2 Spr 07 5/1/2007 5/15/2007 24/27 5.9 3.1 1.56 1.5 3 Spr 07 5/1/2007 5/15/2007 27/27 6.5 3.3 0.85 2.5 4 Spr 07 5/1/2007 5/15/2007 26/27 5.8 3.2 1.13 2.1 5 Spr 07 5/1/2007 5/15/2007 21/27 5.3 3.4 1.92 1.5 6 Spr 07 5/1/2007 5/15/2007 18/27 5.7 3.0 1.74 1.3 P7 1 Spr 07 ND ND ND ND ND ND ND 2 Spr 07 ND ND ND ND ND ND ND 3 Spr 07 ND ND ND ND ND ND ND 4 Spr 07 ND ND ND ND ND ND ND 5 Spr 07 ND ND ND ND ND ND ND 6 Spr 07 ND ND ND ND ND ND ND P8 1 Spr 07 3/22/2007 4/4/2007 8/27 5.1 2.7 2.14 0.6 2 Spr 07 3/22/2007 4/4/2007 21/27 4.2 2.7 1.54 1.2 3 Spr 07 3/22/2007 4/4/2007 24/27 4.9 2.8 1.46 1.3 4 Spr 07 3/22/2007 4/4/2007 10/27 5.7 2.6 1.98 0.6 5 Spr 07 3/22/2007 4/4/2007 3/27 7.5 2.6 2.24 0.4 6 Spr 07 3/22/2007 4/4/2007 13/27 6.1 2.6 2.38 0.2 P9 1 Spr 07 2/26/2007 3/12/2007 26/27 8.8 2.9 0.58 2.3 2 Spr 07 2/26/2007 3/12/2007 25/27 6.3 3.4 2.21 1.2 3 Spr 07 2/26/2007 3/12/2007 6/27 4.3 2.6 1.22 1.4 4 Spr 07 2/26/2007 3/12/2007 12/27 4.2 3.2 2.06 1.1 5 Spr 07 2/26/2007 3/12/2007 2/27 7.8 2.8 2.20 0.6 6 Spr 07 2/26/2007 3/12/2007 8/27 5.1 2.9 1.92 1.0 P11 1 Spr 07 4/13/2007 4/27/2007 26/27 4.5 3.7 1.44 2.3 2 Spr 07 4/13/2007 4/27/2007 23/27 5.0 3.6 1.82 1.8 3 Spr 07 4/13/2007 4/27/2007 24/27 5.3 3.2 1.76 1.4 4 Spr 07 4/13/2007 4/27/2007 22/27 5.1 3.3 1.85 1.5 5 Spr 07 4/13/2007 4/27/2007 22/27 5.4 3.1 1.91 1.2 6 Spr 07 4/13/2007 4/27/2007 19/27 5.3 3.2 2.04 1.2
ND=No data available

Table 4.2-2. (concluded)
Station Number
Substation Number
Season
Start Date
End Date
# Flood Events
Mean Flood Duration (hr)
Maximum Depth (ft)
Marsh/SwampElevation (ft)
Actual water
level (ft) P12 1 Spr 07 4/18/2007 5/2/2007 27/27 5.4 3.3 0.90 2.4 2 Spr 07 4/18/2007 5/2/2007 22/27 5.2 3.3 1.62 1.7 3 Spr 07 4/18/2007 5/2/2007 18/27 4.5 3.2 2.00 1.2 4 Spr 07 4/18/2007 5/2/2007 10/27 5.5 3.2 1.90 1.3 5 Spr 07 4/18/2007 5/2/2007 6/27 5.6 2.9 2.08 0.8 6 Spr 07 4/18/2007 5/2/2007 6/27 6.0 3.2 2.44 0.8 P13 1 Spr 07 3/14/2007 3/28/2007 14/27 6.6 2.0 1.43 0.6 2 Spr 07 3/14/2007 3/28/2007 21/27 5.4 2.0 1.08 0.9 3 Spr 07 3/14/2007 3/28/2007 26/27 5.4 2.0 0.75 1.3 4 Spr 07 3/14/2007 3/28/2007 25/27 6.0 2.1 1.00 1.1 5 Spr 07 3/14/2007 3/28/2007 22/27 4.9 1.9 1.21 0.7 6 Spr 07 3/14/2007 3/28/2007 10/27 3.7 1.9 1.64 0.3 P14 1 Spr 07 2/28/2007 3/14/2007 27/27 7.6 2.1 0.70 1.4 2 Spr 07 2/28/2007 3/14/2007 27/27 5.7 2.3 0.87 1.4 3 Spr 07 2/28/2007 3/14/2007 24/27 5.9 2.3 1.08 1.2 4 Spr 07 2/28/2007 3/14/2007 23/27 5.7 2.3 1.22 1.1 5 Spr 07 2/28/2007 3/14/2007 22/27 5.6 2.3 1.28 1.0 6 Spr 07 2/28/2007 3/14/2007 13/27 5.5 2.3 1.49 0.8
40

Table 4.2-3. Summary of salinity data from nine substations collected along the Cape Fear River and its tributaries in fall 2006.
Station Number Station Name Substation Number
Fall 2006 Salinity Range (ppt)
Proportion of flood events containing > 1 ppt salinity
P3 Town Creek 1 <1 – 7 7/27 2 <1 – 5 6/27 3 <1 – 5 5/27 4 <1 – 4 4/27 5 <1 – 2 2/27 6 <1 0/27 P6 Eagle Island 1 ND ND 2 <1 – 13 25/27 3 <1 – 13 25/27 4 <1 – 10 25/27 5 <1 – 7 20/27 6 <1 – 5 12/27 P7 Indian Creek 1 <1 0/27 2 <1 0/27 3 <1 0/27 4 <1 0/27 5 <1 0/27 6 <1 0/27 P8 Dollisons Landing 1 <1 0/27 2 <1 0/27 3 <1 0/27 4 <1 0/27 5 <1 0/27 6 <1 0/27 P9 Black River 1 <1 0/27 2 <1 0/27 3 <1 0/27 4 <1 0/27 5 <1 0/27 6 <1 0/27 P11 Smith Creek 1 <1 – 12 14/27 2 <1 – 8 14/27 3 <1 – 11 14/27 4 <1 – 10 12/27 5 <1 – 18 16/27 6 ND ND P12 Rat Island 1 <1 – 6 9/27 2 <1 – 2 3/27 3 <1 0/27 4 <1 0/27 5 <1 0/27 6 <1 0/27 P13 Fishing Creek 1 <1 0/27 2 <1 0/27
41

Station Number Station Name Substation Number
Fall 2006 Salinity Range (ppt)
Proportion of flood events containing > 1 ppt salinity
3 <1 0/27 4 <1 0/27 5 <1 0/27 6 <1 0/27 P14 Prince George 1 <1 0/27 2 <1 0/27 3 <1 0/27 4 <1 0/27 5 <1 0/27 6 ND ND ND=No data available
Table 4.2-4. Summary of salinity data from nine substations collected along the Cape Fear River and its tributaries in spring 2007.
Station Number Station Name
Substation Number
Spring 2007 Salinity Range (ppt)
Proportion of flood events containing > 1 ppt salinity
P3 Town Creek 1 <1 – 12 21/27 2 <1 – 5 21/27 3 <1 – 2 11/27 4 <1 – 9 16/27 5 <1 – 6 4/27 6 <1 – 8 4/27 P6 Eagle Island 1 ND ND 2 <1 – 16 21/27 3 <1 – 16 21/27 4 <1 – 14 19/27 5 <1 – 10 18/27 6 <1 – 7 15/27 P7 Indian Creek 1 ND ND 2 ND ND 3 ND ND 4 ND ND 5 ND ND 6 ND ND P8 Dollisons Landing 1 <1 0/27 2 <1 0/27 3 <1 0/27 4 <1 0/27 5 <1 0/27 6 <1 0/27 P9 Black River 1 <1 0/27 2 <1 0/27 3 <1 0/27 4 <1 0/27 5 <1 0/27
42

Table 4.2-4. (concluded)
Station Number Station Substation Number
Spring 2007 Salinity Range (ppt)
Proportion of flood events Name containing > 1 ppt salinity
6 <1 0/27 P11 Smith Creek 1 ND ND 2 <1 – 9 5/27 3 <1 – 9 15/27 4 <1 – 9 15/27 5 <1 – 8 2/27 6 <1 – 8 5/27 P12 Rat Island 1 <1 – 1 1/27 2 <1 0/27 3 <1 0/27 4 <1 0/27 5 ND ND 6 <1 0/27 P13 Fishing Creek 1 <1 0/27 2 <1 0/27 3 <1 0/27 4 <1 0/27 5 <1 0/27 6 ND ND P14 Prince George 1 <1 0/27 2 <1 0/27 3 <1 0/27 4 <1 0/27 5 <1 0/27 6 <1 0/27 ND=No data available
4.3 Marsh/Swamp Flooding
The general pattern of flooding within each station was similar to previous years, i.e. some subsites flooded more frequently than adjacent subsites (Tables 4.2-1 and 4.2-2). However, some stations during fall 2006 were noteworthy in that they were flooded less frequently than most previous years. Substation P13, flooded only 9 of 27 tides and two subsites (#4 & #5) at P6, flooded only 14 and 17 of 27 tides, respectively (Table 4.2-1). A closer examination of subsite P1 at P13 clearly shows that tides were affecting pore water, but the absolute elevation of high tide was below the surface level of this subsite (Figure 4.3-1). Note that when tides did flood the marsh/swamp surface the average depth and duration of flooding was not very different than previous years (Hackney et al. 2002a & b; 2003; 2005; 2006; 2007). These data are collected for two-week periods, but all stations are not collected during the same two-week time frame. Typically, each two-week period includes either a new moon or full moon tide, which are usually higher than average. There is no attempt to schedule these two-week collection periods with high or low river flow so it is not unusual for any one station to have a lower frequency of flooding from chance alone.
43

There were significant differences in mean tidal range between the 2005-2006 and the current reporting year (2006-2007) at seven of the eleven stations as noted in Section 3.0 of this report. The most likely explanation is related to differences in upstream freshwater discharge.
P13 substation 1
0.00
0.50
1.00
1.50
2.00
2.50
3.00
December 06, 2007 14 Days December 20, 2007
Wat
er L
evel
(ft)
Figure 4.3-1. Water level flux at Fishing Creek (P13) at subsite 1 from 06-20 December 2006 illustrating the low frequency of surface flooding during this two week (27 tides) interval. Note the tidal signature below the surface of the swamp persists even when the subsite was not flooded. 4.4 Water Salinity in Marshes and Swamps
Salinity of surface water flooding swamps and marshes reflected the overall state of river flows relative to previous reporting periods. This reporting year was similar to 2003-2004 in that tidal ranges at DCP stations and the flow of water through lock & dam 1 were similar. As expected, this was reflected in the salinity measured on the marsh/swamp surface. No salinity was measured at P7, P8, P9, P13, or P14 during fall 2006 (Table 4.2-3). At P12, salinity was measured only at subsites 1 and 2 (Table 4.2-3). The maximum salinity measured was at P11 with 18 ppt (Table 4.2-3). Spring 2007 was similar, although no data were available for P7 (Table 4.2.4). Note, however, that only subsite 1 was influenced by saline water just one time and that was P12 only 1 ppt (Table 4.2-4). The highest salinity was measured at P6 of 16 ppt (Table 4.2-4). Station P3, P6, and P11 were regularly inundated by saline water during both spring 2007 and fall 2006.
44

5.0 MARSH/SWAMP BIOGEOCHEMISTRY 5.1 Summary
Geochemical data were collected at nine stations along the Cape Fear River Estuary beginning in winter of 2000. Data from the winters of 2000-2006 and the summers of 2000-2005 was presented in the previous annual reports for this project (CZR Incorporated 2001; Hackney et al. 2002a, 2002b, 2003, 2005, 2006, 2007). Data presented in the current report includes winter 2007 and summer 2006. The microbial modes of organic matter remineralization of the study sites range from sulfate reducing to methanogenic. Analysis of porewater chloride, sulfate, and methane was performed at six substations per station and at 6 sub-depths per substation. Samples were collected during the winter and summer at eight sites and monthly at P6 (Eagle Island). These data were used to classify the geochemical setting of each substation at each station as methanogenic (M), sulfate reducing (SR), methanogenic with evidence of past sulfate reduction (MPSR), and sulfate reducing with a non-seawater source of sulfate (SRNS). Classifications were compared to the previous data for these sites.
Station P6’s (Eagle Island) geochemistry was analyzed monthly and displayed a steady decrease in salinity from June of 2002 until June of 2003. Salinity slightly rebounded during the winters of 2004 and 2005, however, it was still lower than previous years. Winter 2005 had almost identical conditions as 2004 with the exception of a salinity peak in November (Hackney et al. 2006). This monthly pattern of salinity variation has been observed in previous years where peaks in salinity were observed during November and May (Hackney et al. 2002a, 2002b, 2003). Last year, a similar pattern was observed with both fall (September and November) and spring (April) peaks in salinity at the substations closet to the riverbanks. Although salinity pulses were of similar magnitude to the previous year, it appeared that the consumption of sulfate was more rapid during the current year resulting in conditions unable to support active sulfate reduction. The current year is characterized by high variability in salinity and a lack of carryover from one month to the next. This suggests that the site is either well flushed or the actual floodwater varied more in salinity during the current year compared to previous ones.
5.2 Geochemical Theory and Classification
Porewater sampling of the metabolic products of sulfate reducing and methanogenic bacteria help establish the frequency and duration of organic soil inundation by tidal water carrying ocean-derived salt versus inundation by fresh water. Changes in flooding frequency have a more significant impact if salts from seawater enter the pore space of wetland sediments. In the presence of sufficient seawater sulfate, organic matter is remineralized via sulfate reducing bacteria in anaerobic environments generating hydrogen sulfide. In freshwater environments, organic matter is usually remineralized via methanogens that generate methane as a byproduct. In the presence of high levels of sulfate from seawater, methanogens are replaced by sulfate reducing bacteria and methanogenesis is inhibited. Hydrogen sulfide is toxic and limits both plants
45

and animal species that do not have a behavioral or physiological mechanism to tolerate this bacterial metabolite. Thus, a shift in remineralization pathway can lead to different communities of plants and animals.
Chloride concentrations are a direct measure of salinity as it occurs in a constant proportion in seawater and has no substantial sinks or sources in wetland sediments. Therefore, the term salinity used in the biogeochemistry section of this report will refer to salinity based on measured chloride concentrations.
Chloride and sulfate concentrations are in a constant ratio in seawater (approximately 20:1). Unlike sulfate, which can decrease due to sulfate reduction, there are no common removal mechanisms (biotic or abiotic) for chloride from seawater. Therefore, chloride concentrations can be used as an indicator of the amount of sulfate originally supplied to a site by seawater. Changes in the ratio of chloride to sulfate are an indicator of sulfate reduction. In the presence of sulfate reduction, methanogenic bacteria are out competed and methane production is inhibited. Therefore, low concentrations of methane are another indicator of sulfate reduction. When sulfate concentrations decrease sufficiently, sulfate-reducing bacteria are no longer able to function and methane production dominates. Thus, a sulfate reducing threshold concentration can be identified in sulfate concentration versus depth profiles, where sulfate concentrations no longer decrease with increasing depth and methane concentrations increase. Data from all nine marsh/swamp stations of the present study place the level where the shift occurs at approximately 300 µM sulfate. This corresponds to sulfate being supplied by salinities of approximately 0.4 parts per thousand.
Using this sulfate reducing threshold (300 µM sulfate) stations and substations were classified as sulfate reducing or methanogenic. Methanogenic substations that had a chloride to sulfate ratio significantly greater than seawater (>30:1) were classified as methanogenic sites with evidence of past sulfate reduction. Sulfate reducing sites with ratios less than seawater (5:1) were classified as sulfate reducing with a non-seawater source of sulfate which may also indicate oxidation of hydrogen sulfide in the porewaters. The four main classifications are: 1) sulfate reducing (SR), 2) methanogenic (M), 3) methanogenic with evidence of past sulfate reduction (MPSR) and 4) sulfate reducing with a non-seawater source of sulfate (SRNS). Changes in these classifications will be used to determine changes in biogeochemical setting associated with river dredging, drought, or other factors.
5.3 Geochemical Methodology
Biogeochemical monitoring was established in close proximity to shallow water well/conductivity/temperature substations. Six substations are distributed along the length of each of nine monitoring belt transects with number one near the river or channel and number 6 adjacent to uplands. Substations are roughly perpendicular to the segment of the stream along which they have been established. Sampling devices, peepers, are constructed of thick acrylic with wells (1-cm deep grooves) located at six different depths that sample 1, 6, 11, 16, 21, and 26 cm below the soil surface. Semipermeable
46

membranes allow methane, sulfate, and chlorine to equilibrate with distilled water in wells. Peepers are inserted into the substrate and left for 1 week, which is ample time for equilibration. Peepers have been shown to be reliable collection devices for these types of dissolved substances (Hesslein 1976). The concentrations of all parameters are determined after removing samples from peeper cells with a syringe equipped with a needle. Sulfate and chloride concentrations are stable under oxic conditions and can be stored in serum vials until analysis. Sulfate and chloride concentrations are determined with an ion chromatograph (Hoehler et al. 1994). Salinity is calculated from the chloride concentrations of the equilibrated peeper chamber water based on the constant ratio of chloride to total dissolved salts in seawater. Samples for porewater methane analysis are prepared by extraction of porewater methane into an inert helium headspace within a gas-tight syringe. The headspace gas is then injected into a gas chromatograph equipped with a flame ionization detector (Kelley et al. 1995) for quantitative determination of methane concentration.
Porewater is collected and analyzed at all 54 substations in all nine transect stations during mid-summer and mid-winter, the coldest and warmest parts of the year. This provides data during periods of maximum and minimum bacterial metabolism. In addition, porewater is collected from the Eagle Island station (P6) every month using the same procedures. This station represents a transition between saline and fresh-dominated stations. In addition, the six substations represent the same transition along a different scale, well-flooded to less flooded.
5.4 Eagle Island (P6) Annual Cycles of Sulfate, Chloride, and Methane
Prior to the spring of 2003, Eagle Island had been classified primarily as SR and MPSR classification because both methanogenesis and sulfate reduction occur at this station (CZR Incorporated 2001; Hackney et al. 2002a, 2002b, 2003). The occurrence of methanogenic geochemical classifications increased during the spring of 2003 and continued through the summer of 2004. Following the pulse of salinity during November 2004, many sites returned to SR classification at the near-shore stations and eventually at all locations by spring 2005 (Hackney et al. 2006). During winter 2005 and spring 2006, both fall (September and November) and spring (April) peaks in salinity were observed at the substations closest to the riverbanks (Hackney et al. 2007). Although the salinity pulses were of similar magnitude to the previous year, it appeared that the consumption of sulfate was more rapid resulting in conditions unable to support active sulfate reduction. This resulted in a combination of SR, MPSR and even some M conditions. Salinity input to Eagle Island during the current year was highly variable and showed no discernable trends or patterns. The classifications were similar to the previous year with a combination of SR, MPSR, and M classifications. The only difference between the current year and previous year’s classifications was a higher occurrence of MPSR classifications. Eagle Island’s general classifications are based on the following observations: 1) Methane is present at depth in all substations, but is often at very low concentrations at the surface during times of high sulfate input (Figure 5.4-1), 2) Sulfate concentrations range from below the sulfate reducing threshold of 300 µM indicating methane production, to as high as 4000 µM indicating sufficient sulfate to drive sulfate
47

reduction (Figure 5.4-2). The ratios of sulfate to chloride range from those found in seawater to ratios indicating a depletion of sulfate due to sulfate reduction (Figure 5.4-3). Some lower ratios also occur, possibly indicating oxidation of hydrogen sulfide from previous sulfate reduction.
Salinity input to Eagle Island varies during the 2006-2007 samping year (Figure 5.4-4). Generally the salinity is higher during summer months when the flow rate of the river is lower, however, an input of salt and a corresponding shift in classification was observed during November of 2000, 2001 and 2004 and May of 2001 and 2002 (Hackney et al. 2002a, 2002b, 2006). These events overshadowed seasonal trends and dominated geochemical conditions during these years. During the winter of 2003 and summer of 2002, the pattern of salinity variations was different (Hackney et al. 2003). Instead of salinity peaks during November and May, the salinity steadily decreased from the summer of 2002 until the spring of 2003. A November pulse of salinity during fall (2004) resulted in a shift towards SR classifications leading into the spring of 2005 (Hackney et al. 2006). Salinity variations during the previous reporting period (summer 2005, winter 2006) were surprisingly different in that the fall and spring pulses of salinity did not appear to affect the biogeochemical setting for an extended period of time due to more rapid consumption of sulfate (Hackney et al. 2007). The rapid consumption of sulfate during that year was evidenced by the high ratios of chloride to sulfate observed in the late summer and fall indicating sulfate reduction without replenishment of sulfate from sea salts (Figure 5.4-3). Salinity variations during the current reporting period were highly variable without any obvious trends or patterns (Figure 5.4-4). Peaks in salinity were observed during June, September (S6), October (S1), and May. These peaks were not followed by a slow steady decrease but often displayed dramatic decreases the next month. These results indicate that during the current year either the floodwater salinity varied more rapidly or the flushing and exchange of porewaters was more rapid.
Salinities at the near-shore station S1 were approximately 10-15 ppt during the summer of 2002 (Hackney et al. 2003). By November 2002, they had dropped below 0.5 ppt and remained there until the fall of 2003 (Hackney et al. 2005) when there was a slight increase with salinity values approaching 1 ppt. With the exception of low salinity values in February and April, the salinities though the winter of 2004 remained at approximately 1 ppt. At the beginning of the previous report year (June 2004), salinities at S1 were approximately 2 ppt and steadily decreased to approximately 0.1 ppt through October S1 (Hackney et al. 2006). A sharp increase in salinity reaching values greater than 8 ppt was observed in November. Salinities rapidly decreased and varied between approximately 0.1-2.0 ppt throughout the rest of the study period. During last years reporting period, salinities were approximately 2 ppt with the exceptions of the salinity peaks which ranged from about 4 to 9 ppt (Hackney et al. 2007). Low salinities were observed in June, the winter (December and January) and May. These salinities were less than 0.5 ppt. During the current reporting period S1 salinities ranged from <0.1 ppt to about 5 ppt and were highly variable.
At the most inland station S6, the salinities dropped from about 8 ppt during the summer of 2002 to below 0.5 ppt by March of 2003 (Hackney et al. 2003). They have
48

Eagle Island Methane Substation 1
0
50
100
150
200
June Ju
ly
August
Septem
ber
October
Novembe
r
Decem
ber
Janu
ary
Febr
uary
March
AprilMay
Month
Met
hane
(uM
)
Eagle Island Methane Substation 6
0
50
100
150
200
June
July
August
Septem
ber
October
November
December
Janu
ary
Febru
aryMarc
hApril
May
Month
Met
hane
(uM
)
Figure 5.4-1. Methane concentrations of Eagle Island porewaters vs. month. Top shows nearshore site (S1) and bottom shows most upland site (S6).
49

Eagle Island Sulfate Substation S1
0
2000
4000
6000
June
July
August
Septem
ber
Octobe
r
Novembe
r
Decembe
r
Janu
ary
Febru
aryMarch April
May
Month
Sulfa
te (u
M)
Eagle Island Sulfate Substation 6
0
2000
4000
6000
8000
June
July
August
Septem
ber
October
Novembe
r
Decembe
r
Janu
ary
Febru
aryMarc
hApril
May
Month
Sulfa
te (u
M)
Figure 5.4-2. Sulfate concentrations of Eagle Island porewaters vs. month. Top shows nearshore site (S1) and bottom shows most upland site (S6).
50

Eagle Island Cl-:SO42- Ratio
Substation 1
0
10
20
30
40
50
June Ju
ly
August
Septem
ber
October
Novembe
r
Decem
ber
Janu
ary
Febr
uary
March
AprilMay
Month
Rat
io
Eagle Island Cl-:SO42- Ratio
Substation 6
0
10
20
30
40
50
June Ju
ly
Augus
t
Septem
ber
Octobe
r
Novembe
r
Decem
ber
Janu
ary
Febru
ary
March
April
May
Month
Rat
io
Figure 5.4-3. Chloride to sulfate ratios of Eagle Island porewaters vs. month. Dashed line shows ratio for seawater. Top shows nearshore site (S1) and bottom shows most upland site (S6).
51

Eagle Island Surface Salinity Substation 1
0
2
4
6
8
10
June
July
August
Septem
ber
October
Novembe
r
Decembe
r
January
Febru
aryMarc
hApril
May
Month
Salin
ity (p
pt)
Eagle Island Surface Salinity Substation 6
0
2
4
6
8
10
June
July
August
Septem
ber
October
November
December
Janu
ary
Febru
aryMarch April
May
Month
Salin
ity (p
pt)
Figure 5.4-4. Salinities of Eagle Island porewaters vs. month. Top shows nearshore site (S1) and bottom shows most upland site (S6).
52

53
remained at approximately 0.1 ppt through the winter and spring of 2004 and the previous report year (Hackney et al. 2006). Salinities during the previous reporting year appear to display the fall and winter peaks in salinity which were approximately 1 ppt. During the rest of the year salinities remained in the 0.5 ppt range (Hackney et al. 2007). Salinities at S6 for the current year reached values ranging from approximately 0.2 to 2.5 ppt (Figure 5.4-4)
Sulfate concentrations at Eagle Island generally paralleled salinity trends (Figure 5.4-2), and were similar in magnitude to the previous year (Hackney et al. 2007). Sulfate concentrations at S1 during fall 2004 approached the 8,000-10,000 uM values (Hackney et al. 2006) seen during the summer of 2002 prior to the drop in salinity (Hackney et al. 2003). The current years peaks in sulfate (Figure 5.4-2) are similar to the previous year (Hackney et al. 2007) approaching approximately 4,000 uM at S1. Sulfate values at S6 remained low throughout 2004-2005 staying close to sulfate reducing threshold values (Hackney et al. 2006). During the next year concentrations exceeded threshold concentrations most of the time at this upland site and were as high as 1,700 uM during the spring peak (Hackney et al. 2007). During the current reporting year, sulfate concentrations at S6 ranged from approximately 30-400µM remaining below the threshold concentration for sulfate reduction most of the year with the exception of June, August and October (Figure 5.4-2).
Prior to the decrease in salinity that began during the fall of 2002, the majority of Eagle Island classifications were SR and MPSR (CZR Incorporated 2001; Hackney et al. 2002a, 2002b, 2003). During the following year (Hackney et al. 2005), the majority of sites were methanogenic due to continued fresh conditions with only a few sub-stations having SR classifications primarily resulting from the slight rebound in salt input which began during the winter of 2004. Geochemical classifications of Eagle Island during the 2004-2005 reporting period (Hackney et al. 2006) showed the expected trend for a system experiencing an input of salinity during November. Starting with near-shore stations, classifications shifted to SR. By May 2005, all locations had been converted to SR classifications (Hackney et al. 2006). Last year, Eagle Island classifications were mainly SR and MPSR with a few M classifications (Hackney et al. 2007) and were similar to the classifications at the onset of the monitoring project. MPSR classifications increased last year and continued to increase during the current year likely reflecting high rates of sulfate consumption (Table 5.4-1). This may have been due to higher temperatures or more bioavailable organic matter in this wetland.
The chloride to sulfate ratios (Cl-:SO42-) reflect the consumption of sulfate
observed during the current year (Figure 5.4-3). At S1 the ratios were either close to the ratio of seawater indicating recent resupply of sulfate or considerably less that the sea salt ratio indicating possible oxidation of hydrogen sulfide from previous sulfate reduction. Very low ratios were observed during July and November immediately following peaks in salinity and sulfate during the previous months which is consistent with oxidation of hydrogen sulfide after rapid sulfate reduction during the previous month. Chloride to sulfate ratios for S6 varied considerably but were generally greater than the ratio seawater indicating sulfate reduction had occurred.

54
Table 5.4-1. Eagle Island (P6) Geochemical Classifications by month. Site classifications are as follows: Methanogenic I, Sulfate Reducing II, Methanogenic with evidence of past sulfate reduction I*, Sulfate reducing non-seawater source of sulfate II*.
Sites June 06 July August September October November December January February March April May 07 S1-1 II I II I II I II II* II II II II S1-2 II II II II II I II II* II II II II S1-3 II I* II I II I II II I II II II S1-4 II I* II I II I* II I* I* II I* II S1-5 II I* I* II II I* II I* I* I I* II S1-6 I* I* I* I II I* I* I* I* I* I* I* S2-1 II II II I* II I* I* I* II II II II S2-2 II II II I* II I* I* I* I* I* I* II S2-3 II I* I* II I* I* I* I* I* I* I* II S2-4 II I* I* I I* I* I* I* I* I* I* II S2-5 I* I* I* I I* I* I* I* I* I* I* II S2-6 I* I* I* I* I* I* I* I* I* I* I* II S3-1 II II II I* II I II II I* II II II S3-2 II II II I* II I* II II I* II I II S3-3 II II II I* II I II II I* I* I II S3-4 II I* II I II I* II I* I* I* I* I* S3-5 II I* II I* II I* II I* I* I* I* I* S3-6 II I I* I* I* I* I* I* I* I* I* I* S4-1 II I II I* II I I II I* I* II II S4-2 II I* II I* II I I* I I* I* II I* S4-3 II I* II I* II I II I I* I* I* II S4-4 II I* I* I* II I I* I* I* I* I* II S4-5 I* I* I* I* II I I* I* I* I* I* II S4-6 I* II I* I* II I* I* I* I* I* I* II S5-1 II II I* I* I I I* I I I I II S5-2 I* I I* I* I* I* I* I* I I* I* II S5-3 I* I* I* I I* I* I* I* I* I* I* I* S5-4 I* I* I* I* I* I* I* I* I* I* I* I* S5-5 I* I* I* II I* I* I* I* I* I* I* I* S5-6 I* I* I* I* I* I* I* I* I* I* I I* S6-1 II I II I* II I I* I* I* I I I* S6-2 I* I II I* I* I* I* I* I* I* I I* S6-3 I* I I* I* I* I* I* I* I* I* I* I* S6-4 I* I* I* I* I* I* I I* I I* I* I* S6-5 I* I* I* I* I* I* I* I* I* I* I* I* S6-6 I* I* I* I* I* I* I* I* I* I* I* I*
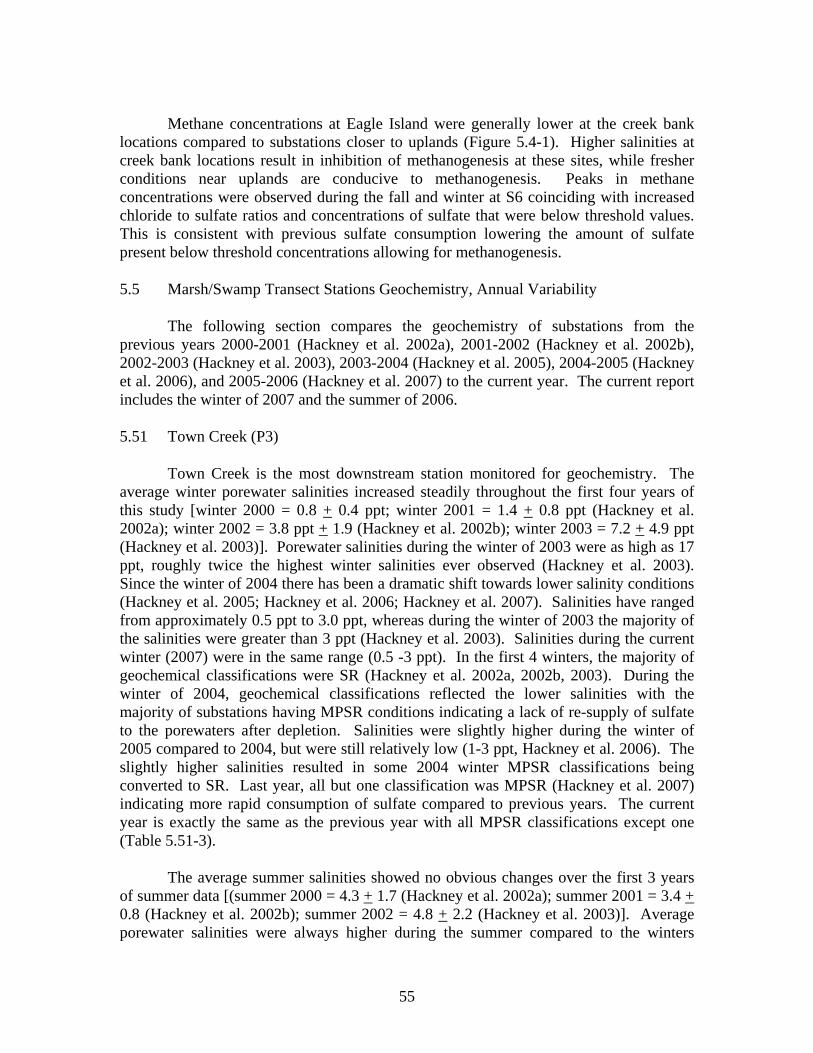
Methane concentrations at Eagle Island were generally lower at the creek bank locations compared to substations closer to uplands (Figure 5.4-1). Higher salinities at creek bank locations result in inhibition of methanogenesis at these sites, while fresher conditions near uplands are conducive to methanogenesis. Peaks in methane concentrations were observed during the fall and winter at S6 coinciding with increased chloride to sulfate ratios and concentrations of sulfate that were below threshold values. This is consistent with previous sulfate consumption lowering the amount of sulfate present below threshold concentrations allowing for methanogenesis.
5.5 Marsh/Swamp Transect Stations Geochemistry, Annual Variability
The following section compares the geochemistry of substations from the previous years 2000-2001 (Hackney et al. 2002a), 2001-2002 (Hackney et al. 2002b), 2002-2003 (Hackney et al. 2003), 2003-2004 (Hackney et al. 2005), 2004-2005 (Hackney et al. 2006), and 2005-2006 (Hackney et al. 2007) to the current year. The current report includes the winter of 2007 and the summer of 2006.
5.51 Town Creek (P3)
Town Creek is the most downstream station monitored for geochemistry. The average winter porewater salinities increased steadily throughout the first four years of this study [winter 2000 = 0.8 + 0.4 ppt; winter 2001 = 1.4 + 0.8 ppt (Hackney et al. 2002a); winter 2002 = 3.8 ppt + 1.9 (Hackney et al. 2002b); winter 2003 = 7.2 + 4.9 ppt (Hackney et al. 2003)]. Porewater salinities during the winter of 2003 were as high as 17 ppt, roughly twice the highest winter salinities ever observed (Hackney et al. 2003). Since the winter of 2004 there has been a dramatic shift towards lower salinity conditions (Hackney et al. 2005; Hackney et al. 2006; Hackney et al. 2007). Salinities have ranged from approximately 0.5 ppt to 3.0 ppt, whereas during the winter of 2003 the majority of the salinities were greater than 3 ppt (Hackney et al. 2003). Salinities during the current winter (2007) were in the same range (0.5 -3 ppt). In the first 4 winters, the majority of geochemical classifications were SR (Hackney et al. 2002a, 2002b, 2003). During the winter of 2004, geochemical classifications reflected the lower salinities with the majority of substations having MPSR conditions indicating a lack of re-supply of sulfate to the porewaters after depletion. Salinities were slightly higher during the winter of 2005 compared to 2004, but were still relatively low (1-3 ppt, Hackney et al. 2006). The slightly higher salinities resulted in some 2004 winter MPSR classifications being converted to SR. Last year, all but one classification was MPSR (Hackney et al. 2007) indicating more rapid consumption of sulfate compared to previous years. The current year is exactly the same as the previous year with all MPSR classifications except one (Table 5.51-3).
The average summer salinities showed no obvious changes over the first 3 years of summer data [(summer 2000 = 4.3 + 1.7 (Hackney et al. 2002a); summer 2001 = 3.4 + 0.8 (Hackney et al. 2002b); summer 2002 = 4.8 + 2.2 (Hackney et al. 2003)]. Average porewater salinities were always higher during the summer compared to the winters
55

reflecting the general trend towards higher freshwater river flow in winter. Salinities during the summer of 2003 ranged from approximately 0.4 ppt to 3.0 ppt (Hackney et al. 2005) in contrast to the previous summer 2002, where the majority of salinities were greater than 3.0 ppt (Hackney et al. 2003). Summer 2003 classifications reflected the fresher conditions with the majority of sites having MPSR conditions for the first time (Hackney et al. 2005). During the summer of 2004, salinities were slightly higher ranging from 2-5 ppt (Hackney et al. 2006) resulting in some MPSR classifications being converted to SR. Last year this trend continued with several more MPSR classifications being converted to SR indicating slightly higher salinities (Hackney et al. 2007). The current year salinities were similar in magnitude to the previous year with values ranging from approximately 2-7 ppt (Table 5.51-1). Classifications were also similar with the exception of a few SR classifications converted to MPSR (Table 5.51-2) likely reflecting higher rates of sulfate reduction since salinities were essentially the same.
Methane concentrations were lower during the summer of 2005 (Hackney et al. 2007) and 2004 (Hackney et al. 2006) compared to the summer (2003) reflecting a continued increase in salinity since the summer of 2003 and increased inhibition of methanogenesis. During the current winter (2007) methane concentrations (Table 5.51-4) were similar to the previous winter of 2006 (Hackney et al. 2007) and slightly elevated compared to the previous winter of 2005 (Hackney et al. 2006) reflecting the slightly fresher conditions during the past two winters.
Table 5.51-1. Salinity of Sites. Salinity in parts per thousand calculated from chloride concentrations in porewaters. A [---] indicates no data. A [nd] means not determined.
Salinity Station Substation Depth (cm) Summer 2006 Winter 2007
Town Creek 1 1 3.87 1.01 P3 1 6 3.54 1.44 1 11 3.01 1.86 1 16 2.84 2.20 1 21 2.92 2.40 1 26 2.92 2.55 2 1 6.02 1.27 2 6 4.95 1.51 2 11 4.66 1.72 2 16 4.97 1.73 2 21 4.33 2.00 2 26 4.00 2.61 3 1 3.88 1.28 3 6 4.00 2.01 3 11 3.36 2.44 3 16 3.19 2.94 3 21 3.15 3.05
3 26 2.69 2.85
56

Table 5.51-1. (continued)
Salinity Station Substation Depth (cm) Summer 2006 Winter 2007
4 1 Town Creek 4.51 1.83 4 6 (continued) 4.19 2.10 4 11 7.19 2.18 4 16 3.56 2.29 4 21 2.52 2.21 4 26 2.08 2.16 5 1 3.35 0.34 5 6 3.46 0.33 5 11 3.20 0.41 5 16 3.01 0.46 5 21 2.61 0.69 5 26 2.10 0.86 6 1 1.38 1.44 6 6 1.49 1.56 6 11 1.47 1.63 6 16 0.95 1.73 6 21 1.35 1.69 6 26 1.64 1.64 1 1 Eagle Island 0.03 0.09 1 6 P6 1.08 0.06 1 11 1.09 0.26 1 16 1.01 0.93 1 21 1.05 1.70 1 26 1.23 2.75 2 1 1.67 2.26 2 6 1.38 2.15 2 11 1.36 1.69 2 16 1.55 3.30 2 21 1.71 3.69 2 26 1.67 3.55 3 1 1.22 1.09 3 6 1.17 1.08 3 11 1.12 1.23 3 16 1.07 1.32 3 21 1.08 1.61 3 26 0.01 1.69 4 1 0.01 0.26 4 6 0.44 0.28 4 11 0.46 0.31 4 16 0.53 0.60 4 21 0.71 0.86 4 26 1.02 1.22 5 1 0.65 0.26 5 6 0.31 0.36
57

Table 5.51-1. (continued)
Salinity Station Substation Depth (cm) Summer 2006 Winter 2007
5 11 Eagle Island 0.33 0.67 5 16 (continued) 0.42 1.05 5 21 0.44 0.86 5 26 0.46 0.83 6 1 0.17 0.24 6 6 0.18 0.70 6 11 0.22 0.58 6 16 0.24 0.72 6 21 0.26 0.82 6 26 0.26 0.55 1 1 Indian Creek 0.03 0.04 1 6 P7 0.05 0.03 1 11 0.07 0.04 1 16 0.10 0.04 1 21 0.12 0.06 1 26 0.13 0.09 2 1 0.02 0.03 2 6 0.03 0.04 2 11 0.04 0.05 2 16 0.04 0.06 2 21 0.04 0.09 2 26 0.04 0.13 3 1 0.01 0.03 3 6 0.02 0.03 3 11 0.03 0.00 3 16 0.03 0.04 3 21 0.03 0.06 3 26 0.03 0.09 4 1 0.03 0.04 4 6 0.04 0.04 4 11 0.05 0.04 4 16 0.04 0.00 4 21 0.06 0.05 4 26 0.07 nd 5 1 0.03 0.02 5 6 0.03 0.02 5 11 0.02 0.02 5 16 0.03 0.02 5 21 0.03 0.02 5 26 0.03 0.02 6 1 0.05 0.02 6 6 0.04 0.02 6 11 0.03 0.02 6 16 0.03 0.02
58

Table 5.51-1. (continued)
Salinity Station Substation Depth (cm) Summer 2006 Winter 2007
6 21 Indian Creek 0.02 0.02 6 26 (continued) 0.02 0.00 1 1 Dollisons 0.05 0.02 1 6 Landing P8 0.04 0.03 1 11 0.04 0.02 1 16 0.04 0.02 1 21 0.04 0.02 1 26 0.04 0.02 2 1 0.05 0.03 2 6 0.04 0.03 2 11 0.04 0.02 2 16 0.05 0.05 2 21 0.04 0.03 2 26 0.04 0.02 3 1 0.04 0.03 3 6 0.05 0.03 3 11 0.05 0.03 3 16 0.05 0.04 3 21 0.05 0.03 3 26 0.05 0.02 4 1 0.04 0.03 4 6 0.04 0.03 4 11 0.08 0.03 4 16 0.04 0.03 4 21 0.04 0.03 4 26 0.04 0.03 5 1 0.12 0.12 5 6 0.12 0.12 5 11 0.10 0.12 5 16 0.10 0.12 5 21 0.10 0.11 5 26 0.12 0.10 6 1 0.16 0.13 6 6 0.17 0.12 6 11 0.18 0.13 6 16 0.17 0.13 6 21 0.16 0.13 6 26 0.18 0.12 1 1 Black River 0.03 0.04 1 6 P9 0.03 0.04 1 11 0.04 0.04 1 16 0.04 0.03 1 21 0.04 0.03 1 26 0.04 0.05
59

Table 5.51-1. (continued)
Salinity Station Substation Depth (cm) Summer 2006 Winter 2007
2 1 Black River 0.03 0.02 2 6 (continued) 0.03 0.02 2 11 0.03 0.02 2 16 0.03 0.02 2 21 0.03 0.02 2 26 0.10 0.03 3 1 0.03 0.02 3 6 0.04 0.02 3 11 0.04 0.03 3 16 0.03 0.03 3 21 0.04 0.01 3 26 0.03 0.03 4 1 0.03 0.02 4 6 0.03 0.02 4 11 0.03 0.02 4 16 0.03 0.02 4 21 0.03 0.02 4 26 0.03 0.02 5 1 0.03 0.02 5 6 0.03 0.03 5 11 0.02 0.01 5 16 0.04 0.02 5 21 0.06 0.02 5 26 0.05 0.02 6 1 0.02 0.02 6 6 0.03 0.02 6 11 0.03 0.02 6 16 0.03 0.02 6 21 0.03 0.02 6 26 0.03 0.02 1 1 Smith Creek 5.81 1.03 1 6 P11 6.19 1.08 1 11 5.97 1.60 1 16 5.12 2.35 1 21 4.52 2.97 1 26 4.72 3.31 2 1 6.97 1.83 2 6 6.35 2.64 2 11 6.03 2.97 2 16 5.79 2.98 2 21 5.66 3.53 2 26 5.19 3.59 3 1 5.81 1.28 3 6 6.54 1.87
60

Table 5.51-1. (continued)
Salinity Station Substation Depth (cm) Summer 2006 Winter 2007
3 11 Smith Creek 6.28 2.28 3 16 (continued) 5.97 2.55 3 21 5.06 3.22 3 26 4.47 3.47 4 1 4.79 1.36 4 6 4.95 1.97 4 11 3.73 2.53 4 16 3.44 2.88 4 21 2.67 2.96 4 26 3.38 2.92 5 1 0.01 1.58 5 6 2.23 2.32 5 11 3.36 2.36 5 16 4.01 2.33 5 21 3.81 2.28 5 26 3.77 2.13 6 1 2.81 0.42 6 6 4.24 0.56 6 11 2.93 0.66 6 16 2.58 0.78 6 21 2.62 0.90 6 26 2.39 1.10 1 1 Rat Island 1.29 0.07 1 6 P12 0.74 0.10 1 11 0.33 0.16 1 16 0.42 0.23 1 21 0.52 0.34 1 26 0.13 0.52 2 1 1.37 0.15 2 6 1.08 0.19 2 11 0.46 0.29 2 16 0.47 0.41 2 21 0.50 0.48 2 26 0.11 0.55 3 1 1.45 0.44 3 6 1.29 0.45 3 11 0.69 0.47 3 16 0.62 0.50 3 21 0.57 0.47 3 26 0.09 0.48 4 1 1.29 0.26 4 6 1.30 0.27 4 11 0.82 0.30 4 16 0.66 0.32
61

Table 5.51-1. (continued)
Salinity Station Substation Depth (cm) Summer 2006 Winter 2007
4 21 Rat Island 0.52 0.35 4 26 (continued) 0.09 0.40 5 1 1.32 0.12 5 6 1.32 0.11 5 11 0.98 0.11 5 16 0.68 0.12 5 21 0.40 0.12 5 26 0.09 0.14 6 1 1.07 0.05 6 6 1.34 0.04 6 11 0.89 0.04 6 16 0.49 0.04 6 21 0.36 0.04 6 26 0.11 0.04 1 1 Fishing Creek 0.05 0.02 1 6 P13 0.05 0.02 1 11 0.05 0.02 1 16 0.05 0.02 1 21 0.05 0.03 1 26 0.06 0.03 2 1 0.04 0.04 2 6 0.04 0.05 2 11 0.05 0.00 2 16 0.04 0.04 2 21 0.05 0.04 2 26 0.06 0.04 3 1 0.00 0.00 3 6 0.02 0.09 3 11 0.02 0.10 3 16 0.03 0.07 3 21 0.02 0.07 3 26 0.02 0.07 4 1 0.04 0.03 4 6 0.05 0.06 4 11 0.05 0.03 4 16 0.05 0.03 4 21 0.06 0.03 4 26 0.05 0.03 5 1 0.04 0.03 5 6 0.04 0.04 5 11 0.04 0.02 5 16 0.04 0.02 5 21 0.02 0.02 5 26 0.04 0.02
62

Table 5.51-1. (continued)
Salinity Station Substation Depth (cm) Summer 2006 Winter 2007
6 1 Fishing Creek 0.01 0.02 6 6 (continued) 0.15 0.02 6 11 0.14 0.02 6 16 0.14 0.02 6 21 0.15 0.02 6 26 0.15 0.02 1 1 Prince George 0.04 0.03 1 6 P14 0.03 0.04 1 11 0.03 0.03 1 16 0.03 0.03 1 21 0.03 0.02 1 26 0.03 0.02 2 1 0.03 0.03 2 6 0.03 0.04 2 11 0.03 0.03 2 16 0.03 0.03 2 21 0.04 0.02 2 26 0.04 0.02 3 1 0.03 0.02 3 6 0.03 0.03 3 11 0.03 0.03 3 16 0.03 0.03 3 21 0.03 0.02 3 26 0.03 0.02 4 1 0.04 0.02 4 6 0.04 0.04 4 11 0.04 0.02 4 16 0.04 0.03 4 21 0.04 0.02 4 26 0.04 0.02 5 1 0.04 0.02 5 6 0.04 0.03 5 11 0.04 0.03 5 16 0.03 0.03 5 21 0.03 0.02 5 26 0.03 0.02 6 1 0.03 0.03 6 6 0.03 0.03 6 11 0.03 0.03 6 16 0.03 0.03 6 21 0.03 0.02 6 26 0.03 0.02
63

64
Table 5.51-2. Classification of Sites Summer. Site classifications are as follows: Methanogenic I, Sulfate Reducing II, Methanogenic with evidence of past sulfate reduction I*, Sulfate reducing non-seawater source of sulfate II*. A [---] indicates no data. A [nd] means not determined.
Station Substation Depth (cm)
Summer 2000
Summer 2001
Summer 2002
Summer 2003
Summer 2004
Summer 2005
Summer 2006
Town Creek 1 1 II II II I* II II* II P3 1 6 II II II I* I* II* II 1 11 II II II I* I* II* II 1 16 II II II I* I* II II 1 21 II II II I* I* II I* 1 26 I* II II I* I* II II 2 1 II II II II II II II 2 6 II II II II I II* II 2 11 II II I* II I II I* 2 16 II II I* II I II I* 2 21 II II I* I* I* II I* 2 26 II II I* II I II I* 3 1 II II II I* II II* II 3 6 II II II I* II II* II 3 11 II II II I* II II I* 3 16 II II II I* I* II I* 3 21 II II II I* I* II I* 3 26 II II II I* I* II II 4 1 II II II I II I* II 4 6 II II II I* II II* II 4 11 II II II I* II II II 4 16 II II II I* II II II 4 21 II II II I* II II I* 4 26 II II II I* II II I* 5 1 II II I* I* I* I II 5 6 II II II I* I* I* II 5 11 II II II I I* I* I* 5 16 II II II I* I* I* I* 5 21 II II II I* I* I* I* 5 26 II II II I* I* I* I* 6 1 II II II I II II* II 6 6 II II II I* I* II II 6 11 II II II I* I* II II 6 16 II II II I* I* II I* 6 21 II II II I* I* II II 6 26 I* II II I* I* II II Eagle Island 1 1 II II II I II II I P6 1 6 II II II Ns II II II 1 11 II II II Ns I* II I* 1 16 II II II I* I* II I*

Table 5.51-2. continued
65
Station Substation Depth (cm)
Summer 2000
Summer 2001
Summer 2002
Summer 2003
Summer 2004
Summer 2005
Summer 2006
Eagle Island 1 21 II II II I* I* I* I* (continued) 1 26 II II I* I* I* II I* 2 1 II II II I I* II II 2 6 II II II I I* II II 2 11 II II II I I* II I* 2 16 II I* II I I* II I* 2 21 II I* II I* I* II I* 2 26 II I* I* I* I* I* I* 3 1 I* II II I* II II II 3 6 I* I* II I* I* II II 3 11 I* I* II I* I* II II 3 16 I* I* II I* I* II I* 3 21 I* I* II I* I* II I* 3 26 I* I* II I* I* II I 4 1 II II I* I* I* II I 4 6 II I* I* I* I* I* I* 4 11 II I* I* I* I* I* I* 4 16 II I* I* I* I* I* I* 4 21 II I* I* I* I* I* I* 4 26 I* I* I* I* I* I* II 5 1 II I* II I* I II II 5 6 I* I* II I* I* II I 5 11 II I* I* I* I* II I* 5 16 I* I* I* I* I* I* I* 5 21 I* I* I* I* I* I* I* 5 26 I* I* I* I* I* I* I* 6 1 II I* II I I II I 6 6 I* I* II I I I* I 6 11 --- I* II I I* I* I 6 16 II I* II I* I I* I* 6 21 I* I* II I* I I* I* 6 26 I* I* I* I* II I I* Indian Creek 1 1 II II II I II II I P7 1 6 II II II I* I II I 1 11 II II II I* I I I 1 16 II II II I* I* I* I 1 21 II II II I* I* I* I* 1 26 I I* II I* I* I* I* 2 1 I II II I I I I 2 6 I I II I* I I I 2 11 I I II I I* I I 2 16 I I* II I* I* I* I 2 21 I I* II I* I* I I 2 26 I I II I* I* I I

Table 5.51-2. continued
66
Station Substation Depth (cm)
Summer 2000
Summer 2001
Summer 2002
Summer 2003
Summer 2004
Summer 2005
Summer 2006
Indian Creek 3 1 II II I* I I I I (continued) 3 6 II I I* I I I I 3 11 I I* I* I I II* I 3 16 I I I* I I* I I 3 21 II I I* I I* I I 3 26 I II I* I* I* I I 4 1 I I II I I I I 4 6 II I II I I* I I 4 11 II I II I I I I 4 16 I I II I I* I I* 4 21 I I II I I* I I* 4 26 I I II I I* I I* 5 1 II I I* I I I I 5 6 I I I* I I I I 5 11 II I I* I I I I 5 16 II --- I* I I I I 5 21 I I* I* I I I I 5 26 I I I* I I I I 6 1 II --- I I I I I 6 6 I --- I I I I I 6 11 I I I I I I I 6 16 I I I I I I I 6 21 I --- I I I I I 6 26 II I I I I I I
Dollisons 1 1 I --- II I I I I Landing P8 1 6 II* II II I I I I 1 11 II* II I I I I I 1 16 II* II I I I I I 1 21 II I II I I* I I 1 26 II I I I I* I I 2 1 II* II I I I I I 2 6 II I I* I I I I 2 11 I II I* I* I I I 2 16 I I* I* I* I I I 2 21 I II I* I* I I I 2 26 I I I* I* I I I 3 1 II I I I I I I 3 6 I --- I* I I I I 3 11 I I I* I* I I I 3 16 I I I* I I* I* I 3 21 I I I* I* I I* I 3 26 I II I* I I I* I 4 1 I I II* I I I I 4 6 I I I I I I I

Table 5.51-2. continued
67
Station Substation Depth (cm)
Summer 2000
Summer 2001
Summer 2002
Summer 2003
Summer 2004
Summer 2005
Summer 2006
Dollisons 4 11 I II I* I I* I I Landing 4 16 I I --- I I I I (continued) 4 21 I II I* I I I I 4 26 I II I* I* I I I 5 1 I I I I I I I 5 6 I I I I I* I I 5 11 I I I* I I* I I 5 16 I I* I* I I* I* I 5 21 I II I* I I* I* I 5 26 I II I* I I* I* I* 6 1 I I I I I* I* I 6 6 I I* I I I* I* I 6 11 I I* I* I I* I* I* 6 16 I I* I* I I* I* I 6 21 I I I* I I* I* I* 6 26 I I I* I I* I* I*
Black River 1 1 I --- I* I I I I P9 1 6 --- --- I* I I I I 1 11 I --- I I I* I I 1 16 I --- II* I I* I I 1 21 II --- I* I I I I 1 26 I II I* I I* I I 2 1 I I* I* I I I I 2 6 I I* I* I I I I 2 11 I I I* I I I I 2 16 I I II* I I I* I 2 21 I I I I I I* I 2 26 I I* I* I I I I* 3 1 I II I* I I I I 3 6 I II* I* I I I I 3 11 I I I --- I I I 3 16 I I II* I I I* I 3 21 I I I I I* I* I 3 26 I I I I I* I I* 4 1 I II I* I II I I 4 6 II II* I I I I I 4 11 I II II* I I I I 4 16 I I II* I I* I I 4 21 I I II* I I I I 4 26 I I II* --- I I I 5 1 II* II* I I I I II* 5 6 II II I I I I II* 5 11 I II II* I I I I 5 16 I I II* I* I I I

Table 5.51-2. continued
68
Station Substation Depth (cm)
Summer 2000
Summer 2001
Summer 2002
Summer 2003
Summer 2004
Summer 2005
Summer 2006
Black River 5 21 II I II* I I* I I (continued) 5 26 II I I I I* I I 6 1 II* --- I I --- I II* 6 6 II* II II* I I I I 6 11 II* I II* I I I* I 6 16 I I* II* I I I* I 6 21 I I I I I I* I 6 26 I I I I I I* I
Smith Creek 1 1 II II II II II II II P11 1 6 II I* II II II II II 1 11 --- II II II II II II 1 16 II II II II II II II 1 21 --- II II II I II I* 1 26 --- II II II I II I* 2 1 II II II II* II II I* 2 6 --- I* II II II II I* 2 11 II II II II II II I* 2 16 II II II II II II I* 2 21 II II II II II II I* 2 26 II II II II II II I* 3 1 II II II II II II II 3 6 II II II I* II II II 3 11 II II II I* II II II 3 16 II II II II I II I* 3 21 II II II I* I* II I* 3 26 II II II II I II II 4 1 II II II II II II II 4 6 II II II II II II II 4 11 II II II II II II II 4 16 II II II II I II I* 4 21 II II II II --- II I* 4 26 II II II II I II I* 5 1 II I* II --- I II I 5 6 II II II II I II II 5 11 II II II II I II II 5 16 II II II II I II II 5 21 II II II II I II I* 5 26 II II II II I II I* 6 1 II II II I II II II 6 6 II I* II I II II II 6 11 II I* II I* II II I* 6 16 II I* II II I II I* 6 21 II --- II II II II I* 6 26 II II II II II II I*

Table 5.51-2. continued
69
Station Substation Depth (cm)
Summer 2000
Summer 2001
Summer 2002
Summer 2003
Summer 2004
Summer 2005
Summer 2006
Rat Island 1 1 II II II I I* II I* P12 1 6 II II II I II II I* 1 11 II II II I I* I* II 1 16 II II II I I* II II 1 21 II II II I* I* II I* 1 26 I II II I* I* I* II 2 1 II I* II I II I I* 2 6 II I* II II II I* II 2 11 II I* II II I I* II 2 16 II II II II I I* I* 2 21 II II I* I* I* I* II 2 26 I* --- II I* I* I* I 3 1 II II II I I II I* 3 6 II I II I II II II 3 11 II I II I II II II 3 16 II I II I II I I* 3 21 II I* II I II I I* 3 26 II I* II I II I I 4 1 II I* II I II I I* 4 6 I* II II I II I I* 4 11 I* I* II I I* I* II 4 16 II I* II I* II I I* 4 21 II I* I* I* II I I* 4 26 I* I* I* I* II I I 5 1 II I II I* I* I* I* 5 6 II I II I* I* I* I* 5 11 I I* II I* I* I* II 5 16 II I* II I* I* I* I* 5 21 II I* II I* I* I* I* 5 26 I* I* II I* I* I* I 6 1 I --- II II I II* I* 6 6 I I II II II I I* 6 11 I I II I* I I I* 6 16 I I* II I* I I I* 6 21 I I II I* I I I* 6 26 I I II I* I* I I
Fishing Creek 1 1 II --- II I I I I P13 1 6 II --- II I I I I 1 11 II I* II I I* I* I 1 16 II II II I I* I* I 1 21 II I* II I I* I* I 1 26 I* II II I I* I* I* 2 1 II I II I I* I I 2 6 II I II I I* I I

Table 5.51-2. continued
70
Station Substation Depth (cm)
Summer 2000
Summer 2001
Summer 2002
Summer 2003
Summer 2004
Summer 2005
Summer 2006
Fishing Creek 2 11 II I II I I* I I (continued) 2 16 II II II I I* I I 2 21 II II II I I* I I 2 26 I* II II I I* I I 3 1 II II II I I* I I 3 6 I I* II I I* I I 3 11 II I* II I I* I I 3 16 II I* II I I* I* I 3 21 II II II I* I* I* I 3 26 I I* II I* I* I* I* 4 1 I I II I I I I 4 6 I II II I I I I 4 11 I I II I I* I I 4 16 I I II I I* I I 4 21 I I II I I* I I 4 26 I I --- I I* I I 5 1 II I II II I I I 5 6 II I II I I I I 5 11 II I II I I I I 5 16 II I II I I I I 5 21 II II II I* I* I I 5 26 II I II I I I I 6 1 I II II I I I I 6 6 II* I I II* I I II 6 11 I I I I I I I 6 16 II II I I I I I 6 21 I I* I I I I I 6 26 I I I I I I I
Prince George 1 1 I I II I I I I P14 1 6 I I II I I I I 1 11 I I* II I I II* I 1 16 I I II I I I I 1 21 I I I* I I II* I 1 26 I I* I* I I I I 2 1 I I II I* I I I 2 6 I I II I* I I I* 2 11 I I II I* I I I 2 16 I I I* I* I I I* 2 21 I I* I* I* I I I 2 26 I I* I* I* I I I 3 1 I I II I I I I 3 6 I II* II I I I I 3 11 I I II I I I I 3 16 I I* II I I I I

Table 5.51-2. continued
Station Substation Depth (cm)
Summer Summer Summer 2002
Summer 2003
Summer Summer Summer 2000 2001 2004 2005 2006
Prince George 3 21 I I I* I I I I (continued) 3 26 I I I* I I I I 4 1 I I II I I I I 4 6 I I II I* I I I 4 11 I* I II I* I I I 4 16 I I II I* I I I 4 21 I I I* I* I* I I 4 26 I I I* I* I* I I 5 1 I II II I I I I 5 6 II II II I I II* I 5 11 I I II I I I I 5 16 I I II I I I I 5 21 I I II I I I I 5 26 I I* I* I I I I 6 1 I I I I I I I 6 6 I I II I I I I 6 11 I I I* I I I I 6 16 I I I* I I I I 6 21 I I I* I I I I 6 26 I II I* I I I I
71

72
Table 5.51-3. Classification of Sites Winter. Site classifications are as follows: Methanogenic I, Sulfate Reducing II, Methanogenic with evidence of past sulfate reduction I*, Sulfate reducing non-seawater source of sulfate II*. A [---] indicates no data. A [nd] means not determined.
Station Substation Depth (cm)
Winter 2000
Winter 2001
Winter 2002
Winter 2003
Winter 2004
Winter 2005
Winter 2006
Winter 2007
Town Creek 1 1 --- II II II I II I* I* P3 1 6 --- II II II I* II I* I* 1 11 --- II II II I* II I* I* 1 16 --- I* II II I* II I* I* 1 21 --- I* II I* I* II I* I* 1 26 I* I* II I* I* II I* I* 2 1 II II II II I* II I* I* 2 6 II II II I* I* II I* I* 2 11 I* II II I* I* I* I* I* 2 16 I II II I* I* II I* I* 2 21 I* II II I* I* I* I* I* 2 26 I* II II II I* I* I* I* 3 1 II I II II II II I* I* 3 6 I II II II I II I* I* 3 11 I II II II I* II I* I* 3 16 I* I* II II I* II I* I* 3 21 I* II II II I* II I* I* 3 26 I* II II II I* II I* I* 4 1 I II II II II II I* I* 4 6 I* I* II II I* II I* I* 4 11 II I* II II I* I* I* I* 4 16 II I* II II I* II I* I* 4 21 II II II II I* II I* I* 4 26 II II II II II II I* I* 5 1 --- II II II I II II I 5 6 I II II II I II I* I* 5 11 I II II II I* II I* I* 5 16 II II II II I* II I* I* 5 21 --- II II II I* II I* I* 5 26 II II II II II II I* I* 6 1 II II II II II II I* I* 6 6 II II II II I* II I* I* 6 11 II II II II I* II I* I* 6 16 II II II II I* II I* I* 6 21 II II II II I* I* I* I* 6 26 II II II II I* II I* I* Eagle Island 1 1 --- II II II II II II* II* P6 1 6 --- II II II II II II* II* 1 11 --- II II II II II II* II 1 16 I II II I II II II* I*

Table 5.51-3. (continued)
73
Station Substation Depth (cm)
Winter 2000
Winter 2001
Winter 2002
Winter 2003
Winter 2004
Winter 2005
Winter 2006
Winter 2007
Eagle Island 1 21 I II II I II II II I* (continued) 1 26 I* II II I* II II II I* 2 1 I II II II II II II I* 2 6 I II II II II II II I* 2 11 --- II II II II II II I* 2 16 --- II II II I* I* I* I* 2 21 I II II II I* I* II I* 2 26 I II II II I* I* I* I* 3 1 I II II II II II II II 3 6 --- II II II II II II II 3 11 I* II II II II II II II 3 16 I* I* II II II II II I* 3 21 I* II II I* I* II II I* 3 26 II II II I* I* I* II I* 4 1 I II II II II II II II 4 6 I* II II I* I* I* II I 4 11 I* II II I* I* I* II I 4 16 II I* II I* I* II I I* 4 21 I* II* II I* I* I* I* I* 4 26 I* II II I* I* I* I* I* 5 1 I II II II II II II I 5 6 I* II I* I* II II II I* 5 11 I II I* I* II I II I* 5 16 I* II I* I* II I I* I* 5 21 I* II II I* I I* II I* 5 26 I* II I* I* II I II I* 6 1 I I* I* II II II II I* 6 6 I* I* I* I* II I II I* 6 11 I I* I* I* I I II I* 6 16 I I* I* I* I I II I* 6 21 I I* I* I* I I II I* 6 26 I I* I* I* I I II I*
Indian Creek 1 1 I I I I I I II* I P7 1 6 I I I II* II* I II* I 1 11 I I I II II* --- II I 1 16 --- I I II II* 0 I I 1 21 I I I II I I I I* 1 26 I I I II I I* I* I* 2 1 I I I* I* I I I I 2 6 I I I* I* I I I I 2 11 I I I* I* I I I I 2 16 I I I* I* I* I I I* 2 21 I* I I* I* I* I I* I*

Table 5.51-3. (continued)
74
Station Substation Depth (cm)
Winter 2000
Winter 2001
Winter 2002
Winter 2003
Winter 2004
Winter 2005
Winter 2006
Winter 2007
Indian Creek 2 26 I* I I* I* I* I I* I (continued) 3 1 I I I I* I I I I 3 6 I* I I I* I I I I 3 11 I* I I* I* I* I I I* 3 16 I I I* I* I* I I I 3 21 I* I I* I* I I* I I* 3 26 I I I* I* I I I I* 4 1 I I I I I I I I 4 6 I I I I* I I I I 4 11 I I I I* I* I I I 4 16 I* I I I* I* I I I 4 21 I* I I I* I* I I I 4 26 I I I I* I* I I --- 5 1 I I I --- I I I I 5 6 I I I I I I I I 5 11 I I I I I I I II* 5 16 I* I I I I I I I 5 21 I I I I I I I I 5 26 I* I I I I I I I 6 1 I I I I I I I I 6 6 I I I I I I I I 6 11 I I I I I I I I 6 16 I I I I I I I I 6 21 I I I I I I I I 6 26 II* I I I I I I I
Dollisons 1 1 --- II* I I I I I I Landing P8 1 6 I II* II* I II I I I 1 11 II II* II* I II I I I 1 16 I II* II* I I I I I 1 21 I* II II* I I I I I 1 26 II* II* I I I I I I 2 1 --- I I I I I I I 2 6 --- I I I I I I I 2 11 II I I I I I I I 2 16 II I I I II* I I I 2 21 I I I I* II* I I I* 2 26 I I I I I I I I* 3 1 II I I I I I I I* 3 6 I I I I I I I I* 3 11 II* II* I I I I I I* 3 16 I II* I I I I I I* 3 21 II I I I II* I I I* 3 26 I I I I I I I I*

Table 5.51-3. (continued)
75
Station Substation Depth (cm)
Winter 2000
Winter 2001
Winter 2002
Winter 2003
Winter 2004
Winter 2005
Winter 2006
Winter 2007
Dollisons 4 1 II I I I I I I I* Landing 4 6 I I I I I I I I* (continued) 4 11 I* I I I I I I I* 4 16 --- I I I I I I I* 4 21 --- I I I I I I I* 4 26 I I I I* I I I I* 5 1 I I I I I I I I* 5 6 II I I I I I* I I* 5 11 --- I I I I I* I* I* 5 16 II I I I I I* I* I* 5 21 I II* I I I I* I* I* 5 26 II I I I II* I I* I* 6 1 I* I I I I I I* I 6 6 I I I I I I* I* I 6 11 II* I I* I I I* I* I 6 16 II I I I* I I II I 6 21 --- I I I I I I* I 6 26 I I I I I I* I* I Black River 1 1 --- I I I* II I I I P9 1 6 I I I I II I I I 1 11 I I I I I I I* I 1 16 I I I I I I I* I 1 21 I II I I I I I* I 1 26 I* II I I I I I I 2 1 I II* I I I I I I 2 6 I II* I I I I I I 2 11 I I I I I I I I 2 16 I* I I I I I I I* 2 21 I II I I I I I I* 2 26 I I I I* I I I I 3 1 I II* I I I I I I 3 6 I II* I I I I I I 3 11 I II* I I I I I I 3 16 I I I I I I I I 3 21 I II I I I I I* I* 3 26 I II* I I I I I* I* 4 1 I II* I I I I I I* 4 6 I* I I I I I I I* 4 11 I* II* I I I I I I* 4 16 I* II* I I I I I* I* 4 21 I* II* I I I I I* I* 4 26 I* II* I I I I I I* 5 1 I* II* I I I I I I*
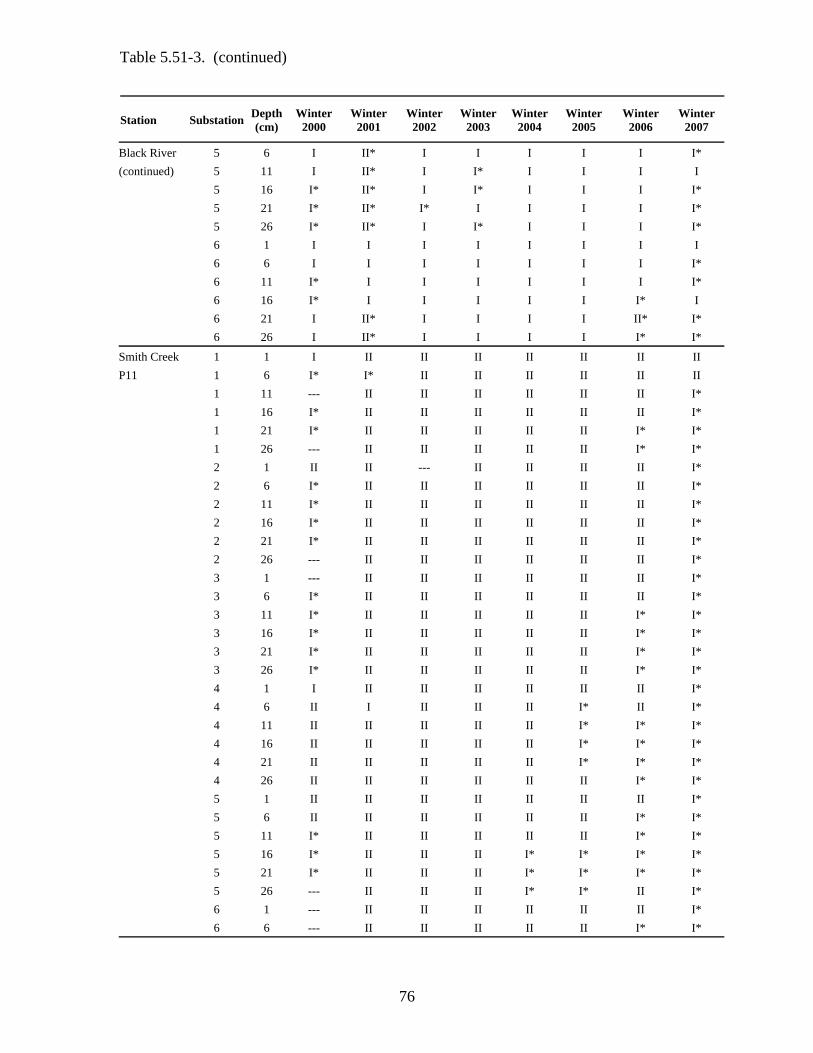
Table 5.51-3. (continued)
76
Station Substation Depth (cm)
Winter 2000
Winter 2001
Winter 2002
Winter 2003
Winter 2004
Winter 2005
Winter 2006
Winter 2007
Black River 5 6 I II* I I I I I I* (continued) 5 11 I II* I I* I I I I 5 16 I* II* I I* I I I I* 5 21 I* II* I* I I I I I* 5 26 I* II* I I* I I I I* 6 1 I I I I I I I I 6 6 I I I I I I I I* 6 11 I* I I I I I I I* 6 16 I* I I I I I I* I 6 21 I II* I I I I II* I* 6 26 I II* I I I I I* I*
Smith Creek 1 1 I II II II II II II II P11 1 6 I* I* II II II II II II 1 11 --- II II II II II II I* 1 16 I* II II II II II II I* 1 21 I* II II II II II I* I* 1 26 --- II II II II II I* I* 2 1 II II --- II II II II I* 2 6 I* II II II II II II I* 2 11 I* II II II II II II I* 2 16 I* II II II II II II I* 2 21 I* II II II II II II I* 2 26 --- II II II II II II I* 3 1 --- II II II II II II I* 3 6 I* II II II II II II I* 3 11 I* II II II II II I* I* 3 16 I* II II II II II I* I* 3 21 I* II II II II II I* I* 3 26 I* II II II II II I* I* 4 1 I II II II II II II I* 4 6 II I II II II I* II I* 4 11 II II II II II I* I* I* 4 16 II II II II II I* I* I* 4 21 II II II II II I* I* I* 4 26 II II II II II II I* I* 5 1 II II II II II II II I* 5 6 II II II II II II I* I* 5 11 I* II II II II II I* I* 5 16 I* II II II I* I* I* I* 5 21 I* II II II I* I* I* I* 5 26 --- II II II I* I* II I* 6 1 --- II II II II II II I* 6 6 --- II II II II II I* I*

Table 5.51-3. (continued)
77
Station Substation Depth (cm)
Winter 2000
Winter 2001
Winter 2002
Winter 2003
Winter 2004
Winter 2005
Winter 2006
Winter 2007
Smith Creek 6 11 --- II II II II II I* I* (continued) 6 16 --- II II II I* II I I* 6 21 --- II II II II II I* I* 6 26 --- II II II II II I* I*
Rat Island 1 1 --- II II II II II II II* P12 1 6 --- II II II II II II II* 1 11 I* II II II II II I* I 1 16 I* II II II II II I* I 1 21 I* II II II I* II I I* 1 26 I* II II II II II II* I* 2 1 I* II II II II II II* II* 2 6 I* I II II II II II II 2 11 I* II II II II II II I 2 16 I* II II II II II II I* 2 21 I* II II II II II I* I* 2 26 I* II II II II II I* I* 3 1 II II II II II II II II 3 6 I II II II II II I* I* 3 11 I* II II II II II I* I* 3 16 I II II II II I I* I* 3 21 I II II II I II I I* 3 26 I II II II I* I I* I* 4 1 I* II II II II II I I* 4 6 I* I* II II II I I* I* 4 11 I* I* II II II I I* I* 4 16 I* I* II I* I I* I* I* 4 21 I* I* II I* I I* I* I* 4 26 I* I* II II I I* I* I* 5 1 I II II II I* I* I I 5 6 I I* I II I* I* I I 5 11 I I* II II II II I I 5 16 I I* II II I* II I I 5 21 I I* I* II I* II I I* 5 26 I I* I* II I* II I I 6 1 I I --- II II* II* II* II* 6 6 I I --- II II* II* II* II* 6 11 I I II II II* II* II* I 6 16 I II II II II II II* II* 6 21 I I II II I II II* I 6 26 I I II II I I* II* I
Fishing 1 1 II II I I I I I I Creek P13 1 6 II II I I I I II* I 1 11 I II II II* I I* II* I

Table 5.51-3. (continued)
78
Station Substation Depth (cm)
Winter 2000
Winter 2001
Winter 2002
Winter 2003
Winter 2004
Winter 2005
Winter 2006
Winter 2007
Fishing 1 16 I II II II* II* I II* I Creek 1 21 I II II II* I I II* I (continued) 1 26 I II II II* I I II* I 2 1 --- II I II* I I* I I 2 6 I II II I I I* I I 2 11 I II II I I I I I 2 16 I I II I I I* I I 2 21 I* I II I I I* I I 2 26 I* I II I* I* I* I I 3 1 I I II I* I* II I I 3 6 I I II II I* I I* I* 3 11 I* I II I* I* I* I* I* 3 16 I I II I* I* I* I* I* 3 21 I* I II I* I* I* I* I* 3 26 I II II I* I* I* I* I* 4 1 II* II II I I I I I 4 6 I II II II I I I I 4 11 I II II II I I I I 4 16 I II II II I I I I 4 21 I I II II I I I I 4 26 I I II II I I I I 5 1 I I --- I I I I I 5 6 I I II I I I I I 5 11 I I II I I I I I 5 16 I I II I I I I I 5 21 I I I* I* I I I I 5 26 I I --- I* I I I I 6 1 II I I I I I I I 6 6 I* I I* I I I I I 6 11 II I I I I I I I 6 16 --- I I I I I I I 6 21 II I I I I I I I 6 26 I I I I I I I I
Prince 1 1 I II* II* --- I I I I George P14 1 6 I I II* II* I I I I 1 11 I I II II* I I I* I* 1 16 I I II II* I I I I 1 21 I I II II* I I I I 1 26 I I II* II* I I I I 2 1 I I II* I I I I I* 2 6 I I II* I I* I I I* 2 11 I I II* I I* I I I* 2 16 I II II* I I* I I I*

Table 5.51-3. (continued)
79
Station Substation Depth (cm)
Winter 2000
Winter 2001
Winter 2002
Winter 2003
Winter 2004
Winter 2005
Winter 2006
Winter 2007
Prince 2 21 I I* II* I I* I* I I George 2 26 I* I II I I* I I* I (continued) 3 1 II I II* --- I I I* I* 3 6 II I II* II* I I I* I* 3 11 I I II I I I I I 3 16 I I II* I I I I I* 3 21 I I II I I* I I I 3 26 I I II I I* I* I I 4 1 I I II* I I I I I* 4 6 I II* II* I I I* I I 4 11 I I II I* I* I* I I 4 16 I I II* I* I* I* I I* 4 21 I I II I* I* I I I 4 26 I I II I* I* I* I I 5 1 I I II II* I I I I 5 6 I I II* I I* I I I 5 11 I I II I I I I I 5 16 I II II I I* I I I 5 21 I I II I I I* I I 5 26 I I II I I I I I 6 1 II* II II* II* I I I I 6 6 I I II II* I I I I 6 11 I I II II* I I I I 6 16 I I II II* I I* I I 6 21 I I I II* I I I I 6 26 I I I I I I* I I

Table 5.51-4. Methane Concentrations of Sites. Porewater methane concentrations are µM. A [nd] means not determined.
Methane Station Substation Depth (cm)
Summer 2006 Winter 2007 Town Creek 1 1 12 94 P3 1 6 38 94 1 11 88 156 1 16 75 117 1 21 93 120 1 26 118 114 2 1 102 248 2 6 135 378 2 11 167 500 2 16 37 428 2 21 162 352 2 26 108 421 3 1 101 151 3 6 126 263 3 11 110 271 3 16 123 294 3 21 116 358 3 26 221 264 4 1 1 308 4 6 26 373 4 11 58 389 4 16 91 392 4 21 107 351 4 26 37 326 5 1 117 45 5 6 284 155 5 11 240 327 5 16 208 370 5 21 265 287 5 26 274 214 6 1 72 276 6 6 101 247 6 11 149 222 6 16 217 305 6 21 178 217 6 26 60 201
80

Table 5.51-4. (continued)
Methane
Station Substation Depth (cm) Summer 2006 Winter 2007
Eagle Island 1 1 nd nd P6 1 6 nd nd 1 11 253 49 1 16 409 385 1 21 377 395 1 26 504 443 2 1 7 176 2 6 41 221 2 11 129 195 2 16 190 178 2 21 326 179 2 26 301 273 3 1 nd 1 3 6 8 nd 3 11 50 2 3 16 143 21 3 21 319 55 3 26 nd 115 4 1 29 30 4 6 117 47 4 11 169 109 4 16 212 135 4 21 262 125 4 26 233 101 5 1 3 404 5 6 218 433 5 11 367 0 5 16 365 536 5 21 406 0 5 26 426 470 6 1 2 130 6 6 nd 265 6 11 146 459 6 16 285 415 6 21 263 519 6 26 335 0
81

Table 5.51-4. (continued)
Methane
Station Substation Depth (cm) Summer 2006 Winter 2007
Indian Creek 1 1 nd nd P7 1 6 5 nd 1 11 83 nd 1 16 181 12 1 21 212 42 1 26 298 37 2 1 145 99 2 6 Nd 288 2 11 141 269 2 16 161 201 2 21 202 129 2 26 229 129 3 1 69 220 3 6 160 306 3 11 312 nd 3 16 247 269 3 21 282 314 3 26 255 289 4 1 164 65 4 6 240 63 4 11 271 87 4 16 169 93 4 21 187 81 4 26 317 101 5 1 31 5 5 6 88 28 5 11 163 34 5 16 197 49 5 21 233 30 5 26 268 39 6 1 84 28 6 6 123 55 6 11 151 72 6 16 149 68 6 21 165 70 6 26 183 10
82

Table 5.51-4. (continued)
Methane
Station Substation Depth (cm) Summer 2006 Winter 2007
Dollisons 1 1 100 57 Landing P8 1 6 299 96 1 11 270 97 1 16 303 94 1 21 286 96 1 26 277 120 2 1 nd 56 2 6 65 67 2 11 105 63 2 16 122 60 2 21 85 75 2 26 85 118 3 1 114 88 3 6 162 41 3 11 156 58 3 16 157 52 3 21 224 64 3 26 208 56 4 1 173 113 4 6 338 58 4 11 341 113 4 16 323 126 4 21 319 119 4 26 319 125 5 1 40 99 5 6 102 91 5 11 204 116 5 16 203 184 5 21 187 181 5 26 217 133 6 1 53 5 6 6 98 17 6 11 150 35 6 16 197 46 6 21 220 62 6 26 209 33
83

Table 5.51-4. (continued)
Methane
Station Substation Depth (cm) Summer 2006 Winter 2007
Black River 1 1 166 283 P9 1 6 331 338 1 11 317 162 1 16 293 149 1 21 303 159 1 26 296 115 2 1 1 2 2 6 48 2 2 11 127 9 2 16 149 22 2 21 150 28 2 26 175 47 3 1 12 181 3 6 124 240 3 11 237 214 3 16 209 181 3 21 157 213 3 26 175 177 4 1 86 2 4 6 223 93 4 11 292 365 4 16 365 451 4 21 363 271 4 26 388 478 5 1 4 107 5 6 65 148 5 11 100 141 5 16 187 124 5 21 200 152 5 26 263 141 6 1 3 254 6 6 203 420 6 11 271 513 6 16 362 562 6 21 344 537 6 26 393 0
84

Table 5.51-4. (continued)
Methane
Station Substation Depth (cm) Summer 2006 Winter 2007
Smith Creek 1 1 8 60 P11 1 6 69 31 1 11 109 172 1 16 130 305 1 21 239 333 1 26 234 333 2 1 144 498 2 6 160 441 2 11 226 510 2 16 274 470 2 21 195 377 2 26 209 270 3 1 126 326 3 6 183 408 3 11 208 412 3 16 224 337 3 21 266 392 3 26 240 422 4 1 6 307 4 6 152 524 4 11 198 0 4 16 346 464 4 21 287 426 4 26 223 402 5 1 nd 259 5 6 102 409 5 11 218 534 5 16 269 426 5 21 224 538 5 26 228 533 6 1 5 152 6 6 84 216 6 11 221 306 6 16 193 253 6 21 339 273 6 26 139 204
85

Table 5.51-4. (continued)
Methane
Station Substation Depth (cm) Summer 2006 Winter 2007
Rat Island 1 1 150 nd P12 1 6 258 9 1 11 180 52 1 16 127 75 1 21 232 97 1 26 154 93 2 1 311 4 2 6 333 94 2 11 338 147 2 16 303 182 2 21 238 222 2 26 312 272 3 1 52 64 3 6 123 388 3 11 156 376 3 16 202 412 3 21 245 391 3 26 nd 300 4 1 62 230 4 6 225 252 4 11 250 319 4 16 209 276 4 21 229 427 4 26 178 440 5 1 187 9 5 6 218 34 5 11 112 72 5 16 311 114 5 21 301 169 5 26 297 132 6 1 242 4 6 6 288 5 6 11 279 8 6 16 274 5 6 21 234 6 6 26 239 5
86
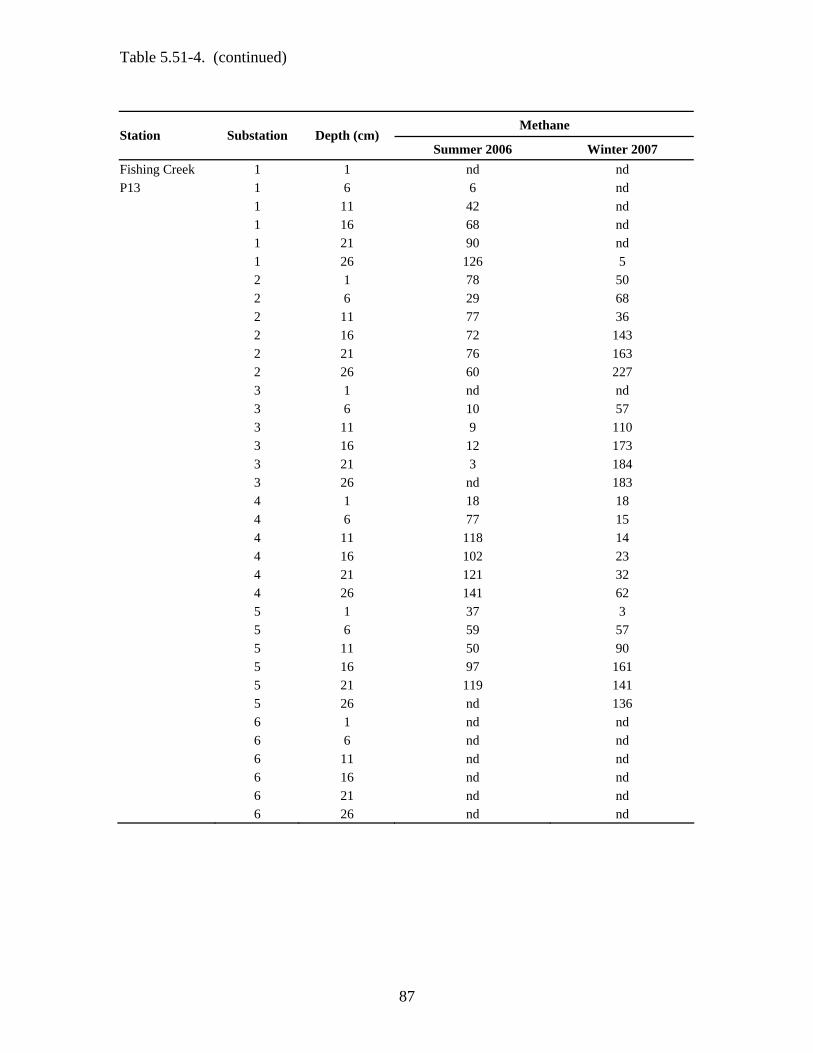
Table 5.51-4. (continued)
Methane
Station Substation Depth (cm) Summer 2006 Winter 2007
Fishing Creek 1 1 nd nd P13 1 6 6 nd 1 11 42 nd 1 16 68 nd 1 21 90 nd 1 26 126 5 2 1 78 50 2 6 29 68 2 11 77 36 2 16 72 143 2 21 76 163 2 26 60 227 3 1 nd nd 3 6 10 57 3 11 9 110 3 16 12 173 3 21 3 184 3 26 nd 183 4 1 18 18 4 6 77 15 4 11 118 14 4 16 102 23 4 21 121 32 4 26 141 62 5 1 37 3 5 6 59 57 5 11 50 90 5 16 97 161 5 21 119 141 5 26 nd 136 6 1 nd nd 6 6 nd nd 6 11 nd nd 6 16 nd nd 6 21 nd nd 6 26 nd nd
87
Table 5.51-4. (continued)
Methane
Station Substation Depth (cm) Summer 2006 Winter 2007
Prince George 1 1 nd nd P14 1 6 70 4 1 11 26 15 1 16 212 20 1 21 191 35 1 26 193 29 2 1 207 15 2 6 228 95 2 11 185 200 2 16 131 120 2 21 177 174 2 26 147 189 3 1 96 2 3 6 61 5 3 11 191 19 3 16 141 39 3 21 144 108 3 26 139 91 4 1 201 26 4 6 233 45 4 11 211 189 4 16 192 220 4 21 206 219 4 26 171 223 5 1 Nd 4 5 6 53 26 5 11 63 49 5 16 119 95 5 21 121 150 5 26 113 222 6 1 6 20 6 6 258 152 6 11 316 227 6 16 327 229 6 21 341 285 6 26 97 183
88

5.52 Indian Creek (P7)
Porewaters of Indian Creek were essentially fresh during the winters of 2000, 2001, and 2002, with highest salinities never exceeding 0.2 ppt (Hackney et al. 2002a, 2002b). Winter porewater salinities increased substantially at this station during the winter of 2003 with salinities as high as 1.3 ppt at the near shore substation S1 and averaged 0.4 + 0.3 ppt at substations 1, 2, 3, and 4 combined (Hackney et al. 2003). The substations closer to uplands, 5 and 6, were still fresh and likely not influenced as much by tidal flood waters. During the winter of 2004, salinities returned to low values with only 2 substations reaching values above 0.2 ppt (Hackney et al. 2005). Classifications were generally MP and MPSR, similar to the winters of 2000, 2002, and 2003, but not as fresh as the winter of 2001 where all classifications were M (Table 5.51-3). Only substation S1 had sulfate concentrations sufficient to sustain sulfate reduction (Table 5.52-1). The winters of 2005, 2006 and the current winter (2007) were very fresh and similar to the winter of 2001. Salinities were generally less than 0.1 ppt (Table 5.51-1) and all classifications were M except for a few MPSR classifications (Table 5.51-3).
An increase in salinity was observed during the summer of 2002 (Hackney et al. 2003). During the previous 2 summers, the majority of the substations had values below 0.5 ppt (Hackney et al. 2002a, 2002b). During the summer of 2002 most values at the non-upland substations had salinities in the 2.0 ppt range clearly showing an increase in salinity. The following summer of 2003 had all but 3 substations sub-depths with salinities below 0.2 ppt indicating very low salinity conditions for this site. For the first time, this site had all methanogenic summer classifications with the majority being M and only a few MPSR (Hackney et al. 2005). Salinities during the summer of 2004 were slightly higher ranging from 0.05-0.13 ppt. Classifications reflected the slightly higher salinities with some M classifications converted to MPSR (Hackney et al. 2006). Salinities last summer (2005) were slightly fresher and similar to the summer of 2003 with most salinities below 0.05 ppt (Hackney et al. 2007). Several MPSR classifications were converted back to M (Table 5.51-2). The current summer (2007) is similar to the previous one with a majority of M classifications and a few MPSR classifications.
Table 5.52-1. Sulfate Concentrations of Sites. Porewater sulfate concentrations are µM. A [---] indicates no data. A [nd] means not determined.
Sulfate Station Substation Depth (cm) Summer 2006 Winter 2007
Town Creek 1 1 1496 99 P3 1 6 694 41 1 11 474 39 1 16 399 40 1 21 124 59 1 26 478 107 2 1 838 51
89

Table 5.52-1. (continued)
Sulfate Station Substation Depth (cm) Summer 2006 Winter 2007
Town Creek 2 6 432 94 (continued) 2 11 160 38 2 16 242 6 2 21 142 14 2 26 211 67 3 1 1194 180 3 6 457 71 3 11 249 18 3 16 278 111 3 21 287 68 3 26 439 126 4 1 2808 82 4 6 1941 43 4 11 1101 68 4 16 384 24 4 21 232 62 4 26 210 57 5 1 871 227 5 6 456 80 5 11 149 75 5 16 59 49 5 21 167 50 5 26 129 187 6 1 405 76 6 6 343 19 6 11 321 38 6 16 193 63 6 21 314 25 6 26 349 67 Eagle Island 1 1 69 413 P6 1 6 322 536 1 11 196 512 1 16 116 104 1 21 72 111 1 26 90 116 2 1 1172 130 2 6 805 64 2 11 283 36 2 16 93 66 2 21 82 150 2 26 80 40 3 1 552 380 3 6 520 374 3 11 397 566
90

Table 5.52-1. (continued)
Sulfate Station Substation Depth (cm) Summer 2006 Winter 2007
Eagle Island 3 16 259 276 (continued) 3 21 170 144 3 26 55 35 4 1 25 364 4 6 227 160 4 11 201 196 4 16 200 25 4 21 161 7 4 26 519 37 5 1 317 140 5 6 223 45 5 11 97 39 5 16 153 22 5 21 78 22 5 26 57 37 6 1 243 32 6 6 145 61 6 11 141 17 6 16 91 31 6 21 125 30 6 26 107 15 Indian Creek 1 1 144 196 P7 1 6 193 221 1 11 136 172 1 16 64 57 1 21 31 17 1 26 27 24 2 1 45 28 2 6 125 41 2 11 45 44 2 16 50 32 2 21 41 22 2 26 37 73 3 1 44 37 3 6 71 34 3 11 50 0 3 16 56 39 3 21 49 7 3 26 32 15 4 1 40 50 4 6 50 58 4 11 40 37 4 16 14 9 4 21 21 30
91

Table 5.52-1. (continued)
Sulfate Station Substation Depth (cm) Summer 2006 Winter 2007
Indian Creek 4 26 24 nd (continued) 5 1 56 43 5 6 65 27 5 11 31 23 5 16 32 20 5 21 43 19 5 26 42 24 6 1 115 27 6 6 99 37 6 11 65 29 6 16 57 24 6 21 41 32 6 26 54 2 Dollisons 1 1 187 28 Landing P8 1 6 69 30 1 11 54 20 1 16 67 13 1 21 44 15 1 26 31 21 2 1 165 19 2 6 125 22 2 11 71 21 2 16 90 36 2 21 44 12 2 26 75 4 3 1 99 13 3 6 96 12 3 11 102 4 3 16 107 19 3 21 105 7 3 26 98 11 4 1 169 5 4 6 135 38 4 11 194 22 4 16 112 14 4 21 97 8 4 26 61 7 5 1 138 16 5 6 101 18 5 11 89 16 5 16 71 24 5 21 79 17 5 26 49 14 6 1 116 52
92

Table 5.52-1. (continued)
Sulfate Station Substation Depth (cm) Summer 2006 Winter 2007
Dollisons Landing 6 6 111 36 (continued) 6 11 60 20 6 16 118 18 6 21 65 27 6 26 62 14 Black River 1 1 56 28 P9 1 6 51 24 1 11 36 35 1 16 32 32 1 21 33 53 1 26 32 60 2 1 187 111 2 6 171 86 2 11 99 61 2 16 51 27 2 21 61 53 2 26 43 29 3 1 223 18 3 6 54 16 3 11 31 16 3 16 32 13 3 21 43 4 3 26 12 15 4 1 274 73 4 6 248 71 4 11 63 23 4 16 55 17 4 21 31 8 4 26 20 9 5 1 320 5 5 6 323 6 5 11 151 7 5 16 46 4 5 21 48 4 5 26 63 8 6 1 305 20 6 6 73 7 6 11 60 10 6 16 37 11 6 21 44 6 6 26 47 3 Smith Creek 1 1 2827 419 P11 1 6 2405 361 1 11 1118 210
93

Table 5.52-1. (continued)
Sulfate Station Substation Depth (cm) Summer 2006 Winter 2007
Smith Creek 1 16 388 67 (continued) 1 21 93 49 1 26 66 7 2 1 121 46 2 6 81 55 2 11 74 32 2 16 116 33 2 21 74 27 2 26 65 3 3 1 938 65 3 6 1101 180 3 11 927 58 3 16 269 37 3 21 86 79 3 26 356 81 4 1 3518 167 4 6 2100 47 4 11 449 37 4 16 155 19 4 21 76 53 4 26 201 92 5 1 78 90 5 6 1013 41 5 11 888 16 5 16 654 21 5 21 220 24 5 26 210 39 6 1 2395 114 6 6 1301 109 6 11 244 28 6 16 177 70 6 21 157 68 6 26 144 73 Rat Island 1 1 279 353 P12 1 6 261 382 1 11 426 260 1 16 363 142 1 21 129 72 1 26 338 70 2 1 238 472 2 6 340 346 2 11 496 232 2 16 120 129 2 21 361 27
94

Table 5.52-1. (continued)
Sulfate Station Substation Depth (cm) Summer 2006 Winter 2007
Rat Island 2 26 162 39 (continued) 3 1 98 488 3 6 360 108 3 11 856 52 3 16 130 46 3 21 146 82 3 26 110 108 4 1 192 59 4 6 277 42 4 11 905 27 4 16 103 47 4 21 177 63 4 26 191 111 5 1 130 134 5 6 237 149 5 11 888 107 5 16 158 111 5 21 66 54 5 26 161 85 6 1 172 499 6 6 156 311 6 11 300 190 6 16 166 321 6 21 133 289 6 26 230 178 Fishing Creek 1 1 131 50 P13 1 6 121 76 1 11 71 122 1 16 38 110 1 21 40 131 1 26 30 116 2 1 31 105 2 6 36 126 2 11 37 3 2 16 24 70 2 21 33 65 2 26 54 26 3 1 10 5 3 6 126 32 3 11 96 18 3 16 118 19 3 21 91 14 3 26 1 12 4 1 67 46
95

Table 5.52-1. (continued)
Sulfate Station Substation Depth (cm) Summer 2006 Winter 2007
Fishing Creek 4 6 48 88 (continued) 4 11 32 124 4 16 35 93 4 21 62 88 4 26 49 77 5 1 82 125 5 6 73 133 5 11 73 53 5 16 54 37 5 21 37 39 5 26 164 82 6 1 27 120 6 6 337 124 6 11 267 164 6 16 245 113 6 21 185 109 6 26 152 121 Prince George 1 1 219 24 P14 1 6 75 26 1 11 73 8 1 16 48 18 1 21 18 16 1 26 52 46 2 1 30 5 2 6 15 11 2 11 26 8 2 16 13 12 2 21 21 23 2 26 43 25 3 1 36 8 3 6 22 6 3 11 20 16 3 16 29 10 3 21 20 19 3 26 18 19 4 1 26 7 4 6 20 20 4 11 31 47 4 16 24 9 4 21 48 28 4 26 28 17 5 1 87 53 5 6 33 34 5 11 35 83
96

Table 5.52-1. (continued)
Sulfate Station Substation Depth (cm) Summer 2006 Winter 2007
Prince George 5 16 22 16 (continued) 5 21 25 26 5 26 30 14 6 1 125 99 6 6 74 26 6 11 37 130 6 16 26 38 6 21 22 74 6 26 29 13 5.53 Dollisons Landing (P8)
Winter porewaters at Dollisons Landing have been essentially fresh with only a few substation sub-depths with sulfate concentrations able to support sulfate reduction, mainly during the winter of 2000 (Hackney et al. 2002a). Since the winter of 2000 the site has remained relatively fresh. During the winters of 2000 and 2001, the site had porewater salinities in the 0.1 to 0.3 ppt range (Hackney et al. 2002a). During the winters of 2002, 2003, and 2004, salinities were below 0.1 ppt (Hackney et al. 2002b, Hackney et al. 2003, Hackney et al. 2005), continuing the low salinity conditions. Salinities during the winters of 2005, 2006, and the current winter were approximately 0.02-0.13 ppt (Hackney et al. 2006; Hackney et al. 2007; Table 5.51-1) with the majority of classifications being M and MPSR (Table 5.51-3). Conditions have remained essentially the same for the past 3 winters.
Salinities during the summer of 2003 were all at or below 0.05 ppt resulting in the lowest salinities observed at this site since the project’s inception. For the first time all substations had methanogenic conditions (Hackney et al. 2005). The majority of substations had M classifications and only a few had MPSR classifications. During the summer of 2004, conditions were slightly saltier in the uplands resulting in several M classifications converted to MPSR (Hackney et al. 2006). Conditions were slightly fresher nearer to the river with a few SR classifications converted to M. Classifications during the summer of 2005 were essentially the same as the previous one with only a few minor exceptions (Table 5.51-2). The current summer’s classifications are similar to the previous two summers with the exception of several MPSR classifications converted to M classifications in the upland sites.
97

5.54 Black River (P9)
Winter porewaters of the Black River station continued to display fresh conditions from the winter of 2002 to present. Most classifications have been M except at the most upland stations during the past winter and the current winter which had some MPSR classifications (Table 5.51-3). Salinities have remained low with the majority of values ranging from 0.02-0.05 ppt (Table 5.51-1.)
On the basis of classifications and salinities, the summer of 2003 was the freshest summer since monitoring began for this site with all M classifications and only one MPSR (Table 5.51-2). During the past three summers conditions have been relatively the same with the majority of classifications being M and a few MPSR classifications. Summer salinities for the past three summers have ranged from approximately 0.01-0.04 ppt (Hackney et al. 2006; Hackney et al. 2007; Table 5.51-1). One notable difference is that the presence of previous sulfate reduction at the upland-most site during 2005 was not present during the current summer (Table 5.51-2).
5.55 Smith Creek (P11)
Porewater salinities during the winter at Smith Creek showed a steady increase from 2000 (Hackney et al. 2002a) to 2002 (Hackney et al. 2002b). However, salinities during the winter of 2003 [av. = 4.4 + 1.1 ppt; (Hackney et al. 2003)] and 2004 [av. = 3.3 + 1.1 ppt; (Hackney et al. 2005)] were lower than the winter of 2002 [(av. = 7.2 + 2.1 ppt; (Hackney et al. 2002b)]. Smith Creek classifications have displayed a steady shift from SR classifications to MPSR classifications since the winter of 2003 (Table 5.51-3). The shift started at the upland stations during the winter of 2003, and have progressed to the nearshore stations. During the current winter all stations are MPSR classifications except for the surface subsites at S1. Salinities have continued in the 1-4 ppt range so the shift is likely due to increased rates of sulfate reduction at this site.
The summer of 2004 salinities ranged from 5-8 ppt (Hackney et al. 2006) with the exception of S5 which displayed very fresh conditions (0.01-0.02 ppt). These salinities are higher than those observed during the summer of 2003 (0.1-4 ppt; Hackney et al. 2005), but are not as high as previous years, which have reached, as high as 14 ppt. Last summer (2005), all classifications were SR indicating saltier conditions particularly in the upland station (Table 5.51-2). Salinities for the current summer are average for this site (approximately 2-7 ppt) (Table 5.51-1). However, several sites have been converted from SR to MPSR classifications similarly to the winter 2007 (Table 5.51-2) strongly suggesting more rapid rates of sulfate reduction occurring at this site during the past year.
5.56 Rat Island (P12)
Vegetation along this transect is strongly transitional, from saline tolerant species near the river to salt intolerant species toward the upland boundary. Porewater salinity reflects the gradient with higher salinity at substations near the river and fresher conditions toward the uplands. Winter salinities steadily increased from 2000-2002
98
(Hackney et al. 2002a, 2002b), with the winter of 2003 showing a dramatic salinity increase in sites adjacent to uplands for the first time (Hackney et al. 2003). Average substation S6 salinities had never exceeded 0.2 ppt, but were 2.7 + 0.2 ppt during the winter of 2003, representing more than a ten fold increase. The salinities during the winter of 2004 returned to lower values similar to those observed during winters of 2001-2002 with the majority of salinities near the upland edge below 0.3 ppt (Hackney et al. 2005). Winter classifications reflected lower salinities with several upland sites returning to methanogenic conditions (Table 5.51-3). The winter of 2005 was similar to the previous one (2004), but conditions were slightly saltier in the uplands with some M classifications converted to MPSR and some MPSR classifications converted to SR (Table 5.51-3). Fresher condition prevailed last year and during the current year with several SR classifications converting to MPSR or M classifications. The past two winters are comparable to the freshest winter so far for this monitoring project, which occurred during the first year, 2000.
The summer of 2002 was the saltiest summer recorded for this site since the inception of this monitoring project. Average salinities at this site (1.9 + 0.2 ppt; Hackney et al. 2003) increased almost tenfold from previous average salinities (0.2 + 0.1 ppt, Hackney et al. 2002a, 2002b). Salinities during the summer of 2003 were lower than that of the summer of 2002 with the majority of salinities below 0.4 ppt (Hackney et al. 2005). Summer salinities during the past three years have been fairly consistent with values in the 0.1 to 1.0 ppt range. With the exception of subsite 3 during the summer of 2004, the past four summer’s classifications have been dominated by as a combination of MPSR and M with a few SR classifications (Table 5.51-2).
5.57 Fishing Creek (P13)
The winter porewater salinities at Fishing Creek displayed a peak during the winter of 2002 (Hackney et al. 2002b) and returned to values similar to the winters of 2000 and 2001 (Hackney et al. 2002a) during the winter of 2003 (Hackney et al. 2003). Salinities of approximately 1 ppt were observed during the winter of 2002 (Hackney et al. 2002b). During the winter of 2003 salinities were all less than 0.5 ppt (Hackney et al. 2003). Winter 2004 salinities displayed a freshening trend with all salinities below 0.1 ppt except for substation 3 (Hackney et al. 2005). On the basis of classifications, winter conditions at Fishing Creek have remained approximately the same throughout the current winter (Table 5.51-3). In general all sites have been M classifications with the exception of S3 which has shown evidence of past sulfate reduction and S1 which occasionally shows a non-sea salt source of sulfate.
Porewater salinities measured during the summer of 2002 were the highest ever obtained for Fishing Creek since the beginning of the project in 2000 with values of approximately 5-7 ppt at the near-bank substation, 3 ppt at the mid substations, and essentially fresh conditions at stations near the upland (Hackney et al. 2003). Porewater salinities during the summer of 2003 were the lowest observed during the project for Fishing Creek with values less than 0.1 ppt at the near-bank substation, less than 0.5 ppt at the mid substations (Hackney et al. 2005). Summer 2003 classifications reflected the
99

fresher conditions with all but 2 sub-depths with methanogenic conditions. In previous summers at least 1/3 of the sub-depths were sulfate reducing (Table 5.51-2). Salinities during the summer of 2004 were still relatively fresh but slightly saltier than the previous fresh summer of 2003. Several M classifications were converted to MPSR (Table 5.51-2) indicating that the spring was saltier than the previous spring of 2003. However, there were no SR classifications such as those observed during the saltier summers of 2000-2002. Last summer (2006) and the current summer displayed fresher conditions similar to the winter of 2003. The majority of classifications were M with a few MPSR classifications.
5.58 Prince George Creek (P14)
Winter salinities peaked during the winter (2002) and decreased during the winters of 2003-2005. Salinities during the winter (2003) ranged from 0.05 to 0.26 ppt (Hackney et al. 2003), while salinities for the winter of 2004 and 2005 were all below 0.1 ppt (Hackney et al. 2005; 2006). For the first time all substation sub-depths were methanogenic (Hackney et al. 2005). Conditions during the winter of 2006 were slightly saltier at the creek bank locations and slightly fresher at the mid and upland locations (Table 5.51-3). Conditions during the current winter are very similar to the previous winter with the exception of a few more MPSR classifications at S2 and S4. No sites had sulfate concentrations able to support sulfate reduction due to lower chloride (Table 5.58-1) and salinities levels (Table 5.51-1).
Summer salinities peaked during 2002 and returned to lower salinity during the summer of (2003). Summer 2002 salinity values were approximately 1 ppt (Hackney et al. 2003), roughly twice previous values (Hackney et al. 2002a, 2002b). The majority of summer (2003) values were below 0.04 ppt (Hackney et al. 2005). Salinities during the summer 2004 were slightly lower than the previous summer of 2003. Prior to the summer of 2002, summer geochemical classifications were essentially all (M). Due to the increase in salinity at this site during the summer 2002, the majority of substations were converted to (SR) (Table 5.51-2). None of the classifications from the summers (2003, 2004) were sulfate reducing and were similar to the previous summers of 2000 and 2001. Conditions during the last summer (2006) were similar with the exception of a few sites displaying a non-sea salt source of sulfate (Table 5.51-3). Classifications during the current summer are all essentially M with two MPSR classifications.
100

Table 5.58-1. Chloride Concentrations of Sites. Chloride concentrations of porewaters in µM.
Chloride Station Substation Depth (cm)
Summer 2006 Winter 2007 1 1 60426 15794 Town Creek 1 6 55300 22485 P3 1 11 47090 29047 1 16 44381 34419 1 21 45684 37487 1 26 45587 39914 2 1 94091 19908 2 6 77401 23586 2 11 72843 26807 2 16 77653 27031 2 21 67672 31179 2 26 62526 40714 3 1 60678 19953 3 6 62547 31398 3 11 52542 38194 3 16 49859 46011 3 21 49201 47606 3 26 42061 44607 4 1 70447 28558 4 6 65440 32884 4 11 112337 33993 4 16 55669 35777 4 21 39389 34588 4 26 32472 33811 5 1 52322 5266 5 6 54081 5224 5 11 50030 6380 5 16 47050 7255 5 21 40738 10843 5 26 32838 13364 6 1 21537 22552 6 6 23274 24398 6 11 22954 25537 6 16 14908 26975 6 21 21113 26441 6 26 25588 25576
101

Table 5.58-1. (continued)
Chloride Station Substation Depth (cm)
Summer 2006 Winter 2007 Eagle Island 1 1 416 1476 P6 1 6 16864 1004 1 11 17072 4056 1 16 15821 14460 1 21 16403 26525 1 26 19167 42937 2 1 26044 35350 2 6 21630 33538 2 11 21288 26353 2 16 24185 51529 2 21 26756 57719 2 26 26132 55419 3 1 19013 16982 3 6 18303 16914 3 11 17429 19271 3 16 16666 20564 3 21 16861 25134 3 26 227 26462 4 1 221 4081 4 6 6840 4416 4 11 7251 4835 4 16 8321 9395 4 21 11125 13511 4 26 15865 19014 5 1 10105 4138 5 6 4774 5568 5 11 5219 10490 5 16 6601 16399 5 21 6804 13424 5 26 7164 13002 6 1 2669 3795 6 6 2886 10985 6 11 3436 9029 6 16 3688 11321 6 21 4010 12740 6 26 4037 8586
102

Table 5.58-1. (continued)
Chloride Station Substation Depth (cm) Summer 2006 Winter 2007
Indian Creek 1 1 441 570 P7 1 6 795 522 1 11 1100 606 1 16 1494 701 1 21 1853 911 1 26 2008 1477 2 1 341 543 2 6 461 653 2 11 556 780 2 16 559 963 2 21 621 1393 2 26 583 2006 3 1 190 531 3 6 329 496 3 11 398 22 3 16 484 632 3 21 474 869 3 26 517 1338 4 1 543 657 4 6 628 677 4 11 707 644 4 16 666 20 4 21 860 729 4 26 1047 nd 5 1 395 363 5 6 404 345 5 11 336 328 5 16 419 353 5 21 490 330 5 26 516 380 6 1 834 305 6 6 695 308 6 11 438 287 6 16 488 305 6 21 369 259 6 26 238 25
103

Table 5.58-1. (continued)
Chloride Station Substation Depth (cm) Summer 2006 Winter 2007
Dollisons 1 1 747 344 Landing P8 1 6 624 453 1 11 580 359 1 16 694 362 1 21 597 362 1 26 610 390 2 1 709 429 2 6 614 434 2 11 635 376 2 16 723 729 2 21 605 407 2 26 636 369 3 1 647 443 3 6 733 478 3 11 789 442 3 16 840 576 3 21 849 530 3 26 753 371 4 1 597 443 4 6 616 471 4 11 1218 492 4 16 556 435 4 21 573 414 4 26 627 411 5 1 1814 1824 5 6 1799 1850 5 11 1596 1866 5 16 1521 1950 5 21 1577 1720 5 26 1871 1602 6 1 2554 2000 6 6 2629 1951 6 11 2788 1993 6 16 2620 2056 6 21 2517 2069 6 26 2738 1930
104

Table 5.58-1. (continued)
Chloride Station Substation Depth (cm) Summer 2006 Winter 2007
Black River 1 1 519 553 P9 1 6 509 618 1 11 564 585 1 16 590 531 1 21 659 539 1 26 679 838 2 1 532 305 2 6 504 296 2 11 462 283 2 16 440 236 2 21 507 390 2 26 1589 416 3 1 537 351 3 6 602 374 3 11 631 410 3 16 530 422 3 21 548 199 3 26 439 416 4 1 504 299 4 6 433 290 4 11 435 311 4 16 440 308 4 21 391 326 4 26 522 335 5 1 399 328 5 6 428 393 5 11 387 199 5 16 642 346 5 21 1015 386 5 26 733 388 6 1 368 264 6 6 391 271 6 11 446 302 6 16 440 293 6 21 466 282 6 26 435 299
105

Table 5.58-1. (continued)
Chloride Station Substation Depth (cm) Summer 2006 Winter 2007
Smith Creek 1 1 90787 16127 P11 1 6 96661 16903 1 11 93279 24927 1 16 79965 36706 1 21 70557 46404 1 26 73683 51690 2 1 108863 28542 2 6 99233 41212 2 11 94141 46483 2 16 90476 46637 2 21 88444 55218 2 26 81075 56053 3 1 90723 20036 3 6 102254 29215 3 11 98072 35602 3 16 93278 39888 3 21 79064 50279 3 26 69839 54232 4 1 74871 21213 4 6 77299 30800 4 11 58220 39551 4 16 53748 45000 4 21 41730 46327 4 26 52821 45588 5 1 188 24737 5 6 34846 36323 5 11 52448 36839 5 16 62667 36374 5 21 59528 35650 5 26 58853 33258 6 1 43848 6552 6 6 66189 8689 6 11 45708 10298 6 16 40323 12205 6 21 40910 14129 6 26 37294 17230
106
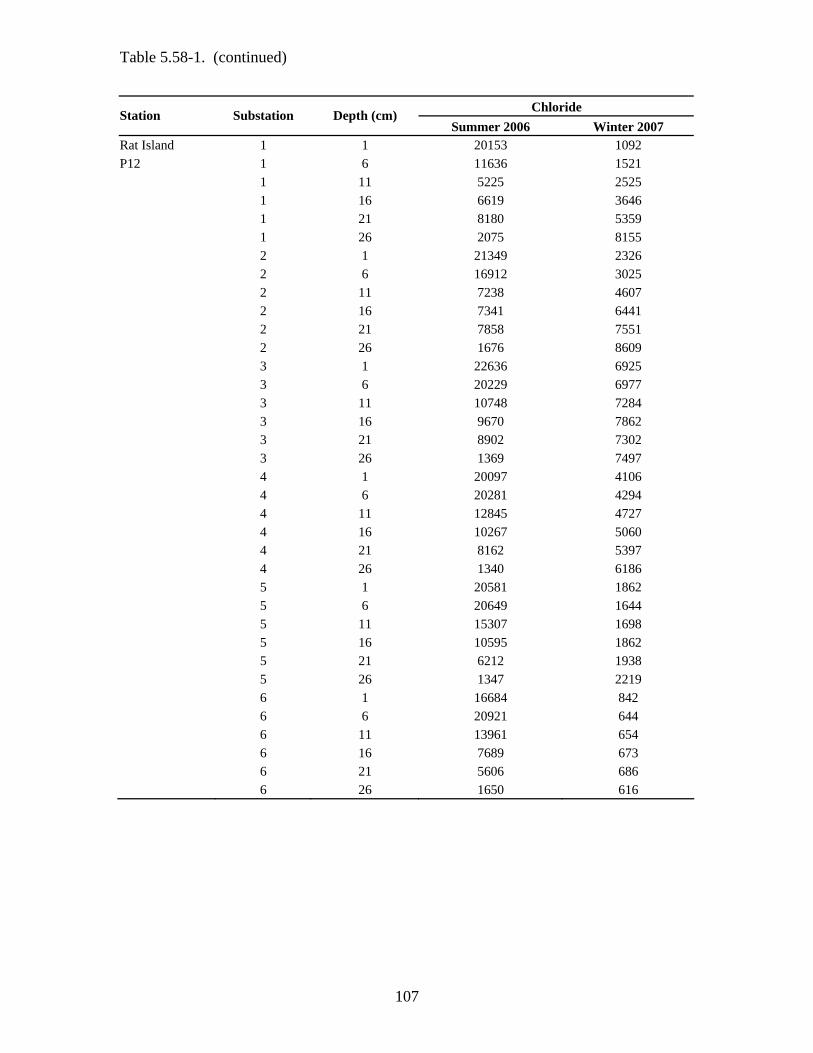
Table 5.58-1. (continued)
Chloride Station Substation Depth (cm) Summer 2006 Winter 2007
Rat Island 1 1 20153 1092 P12 1 6 11636 1521 1 11 5225 2525 1 16 6619 3646 1 21 8180 5359 1 26 2075 8155 2 1 21349 2326 2 6 16912 3025 2 11 7238 4607 2 16 7341 6441 2 21 7858 7551 2 26 1676 8609 3 1 22636 6925 3 6 20229 6977 3 11 10748 7284 3 16 9670 7862 3 21 8902 7302 3 26 1369 7497 4 1 20097 4106 4 6 20281 4294 4 11 12845 4727 4 16 10267 5060 4 21 8162 5397 4 26 1340 6186 5 1 20581 1862 5 6 20649 1644 5 11 15307 1698 5 16 10595 1862 5 21 6212 1938 5 26 1347 2219 6 1 16684 842 6 6 20921 644 6 11 13961 654 6 16 7689 673 6 21 5606 686 6 26 1650 616
107

Table 5.58-1. (continued)
Chloride Station Substation Depth (cm) Summer 2006 Winter 2007
Fishing Creek 1 1 810 254 P13 1 6 729 287 1 11 757 362 1 16 832 334 1 21 796 453 1 26 897 458 2 1 555 579 2 6 662 782 2 11 779 24 2 16 667 589 2 21 711 557 2 26 889 572 3 1 34 41 3 6 275 1341 3 11 240 1589 3 16 486 1129 3 21 244 1113 3 26 297 1101 4 1 548 417 4 6 807 948 4 11 778 488 4 16 709 487 4 21 936 447 4 26 830 460 5 1 604 418 5 6 566 577 5 11 547 366 5 16 563 390 5 21 366 335 5 26 587 376 6 1 95 357 6 6 2345 358 6 11 2154 380 6 16 2204 279 6 21 2367 267 6 26 2304 286
108

Table 5.58-1. (continued)
Chloride Station Substation Depth (cm) Summer 2006 Winter 2007
Prince George 1 1 652 476 P14 1 6 510 574 1 11 541 403 1 16 517 453 1 21 477 290 1 26 520 307 2 1 543 435 2 6 481 563 2 11 536 405 2 16 532 449 2 21 586 321 2 26 684 288 3 1 544 378 3 6 514 485 3 11 493 407 3 16 516 461 3 21 491 323 3 26 432 250 4 1 557 256 4 6 556 577 4 11 582 383 4 16 604 437 4 21 607 316 4 26 624 290 5 1 582 357 5 6 659 458 5 11 669 426 5 16 527 436 5 21 540 274 5 26 482 380 6 1 536 438 6 6 439 527 6 11 498 393 6 16 410 404 6 21 408 349 6 26 433 273
109

5.6 Long Term Trends and Change
The patterns of variations for the current year and previous years follow.
Year 1 (winter 2000, 2001, summer 2000):
During the first year of the study general geochemical classifications were established for the sites in order to compare with future conditions. In the first report, which included the winters of 2000, 2001, and the summer of 2000 (Hackney et al. 2002), three of these stations were primarily sulfate reducing year-round (P3 - Town Creek, P12 - Rat Island, and P11- Smith Creek) two were primarily methanogenic year round (P8 - Dollisons Landing, and P14 - Prince George) and four exhibited mixed conditions with sulfate reduction typically dominating the geochemistry during the summer and methanogenesis dominating during the winter (P7- Indian Creek , P9 - Black River, P12 - Rat Island, P13 - Fishing Creek) (Hackney et al. 2002).
Year 2 (winter 2002, summer 2001):
In the second report, which included the summer of 2001 and the winter of 2002 (Hackney et al. 2002a, 2002b), two Northeast Cape Fear River sites, Prince George (P14) and Fishing Creek (P13), displayed a dramatic change in winter classification from methanogenic in the winters of 2000 and 2001 to sulfate reducing in the Winter of 2002 resulting from an increase in salinity. The other two sites on the Northeast Cape Fear River, Rat Island (P12) and Smith Creek (P11), also showed signs of increased salinity although their general classification did not change. Rat Island (P12) had several methanogenic classifications converted to sulfate reducing. Smith Creek (P11), which was already a sulfate reducing system, recorded higher salinities in porewaters.
The summer geochemical classifications on the Cape Fear River showed the opposite trend with evidence of a slight freshening of the porewaters. Changes in classifications of the Cape Fear River sites were not as dramatic as those observed on the Northeast Cape Fear River. The general trend for Cape Fear River sites was a slight freshening of the porewaters in winter 2002 and saltier conditions in summer 2001 compared to the data contained in the previous report. Town Creek (P3), which is located below the confluence of the Northeast Cape Fear River and the Cape Fear River, displayed a similar trend as that of the Cape Fear River sites with slightly saltier conditions during the summer and slightly fresher conditions during the winter.
Year 3 (winter 2003, summer 2002):
The increases in porewater salinities observed during previous summers continued through the summer of 2002 in the Northeast Cape Fear River (Fishing Creek, Prince George, Rat Island, and Smith Creek). Due to the continued increase in summer salinities, all four sites were classified as sulfate reducing geochemical classifications for the first time. With the exception of Smith Creek, which already had a sulfate reducing geochemical classification, this was the first time the upper Northeast Cape Fear sites
110

have had a summertime sulfate reducing geochemical classifications. A similar increase in summertime porewater salinity was noted in the Cape Fear River sites immediately above the City of Wilmington (Indian Creek, Eagle Island) while the sites further upstream on the Cape Fear River (Black River, Dollisons Landing) had peak salinities occurring during the previous summer (2001). The salinities of Town Creek, the only site below the City of Wilmington monitored for geochemical classification, showed no obvious change in summer porewater salinity.
With the exception of Town Creek, which is below the City of Wilmington, and the Cape Fear River sites immediately above the City of Wilmington (Indian Creek and Eagle Island) all sites had lower winter porewater salinities than previous winters. For the upper Cape Fear River stations (Black River and Dollisons Landing), winter conditions showed a steady decrease in salinity since 2000. Fresher conditions did not cause a shift in geochemical classification for these sites since they were already methanogenic. In the Northeast Cape Fear River (Fishing Creek, Prince George, Rat Island, and Smith Creek), winter (2003) porewater salinities returned to lower values after peaking during the previous winter (2002). The decrease in salinities for the more seaward stations (Rat Island and Smith Creek) was not enough to convert these systems from sulfate reducing geochemical classification. For upstream stations (Fishing Creek and Prince George), several substations that previously converted to sulfate reducing returned to a methanogenic geochemical classification in 2003. Porewater salinities of Town Creek, Indian Creek, and Eagle Island increased during the winter (2003). The changes in geochemical classifications were relatively small for these sites with only slight changes towards higher salinity classifications.
Year 4: (winter 2004, summer 2003)
Low salinity conditions characterize Year 4, summer 2003 and winter 2004. In general, all sites experienced conditions that would be considered low salinity on the basis of previous winters and summers. Several sites had conditions that were the lowest in salinity since the study began in 2000. For the most seaward station, Town Creek, both the winter and summer were the freshest on record. The Cape Fear River sites (Indian Creek, Dollisons Landing, and Black River) had a relatively low salinity winter and a summer that was the freshest observed during this study. While all Northeast Cape Fear River sites had relatively fresher conditions during the current year, there was more variability in the extent to which they experienced low salinities. Fishing Creek had the freshest winter and summer on record, Prince George had the freshest winter on record, and Rat Island had the freshest summer on record. Smith Creek had fresh conditions during both the summer and winter, but not the freshest on record.
Year 5: (winter 2005, summer 2004)
Low salinity conditions characterize Year 5 of the study, summer 2004 and winter 2005. In general, all sites experienced conditions that would be considered low salinity on the basis of previous winters and summers. However, conditions were not as fresh as the previous year. Five stations experienced slightly saltier conditions during the current
111
summer (2004) compared to last summer (Town Creek, Indian Creek, Black River, Smith Creek, and Fishing Creek), while Prince George experienced slightly fresher conditions. The remainder of sites either had no change or a mix of fresher and saltier conditions within the site. Two stations experienced slightly saltier conditions during the current winter (2005) compared to last winter (Town Creek and Rat Island), while Indian Creek experienced slightly fresher conditions. Five sites were essentially the same as the previous winter (Eagle Island, Black River, Smith Creek, Fishing Creek, and Prince George) and Dollisons Landing had both saltier and fresher conditions within the site.
Year 6: (winter 2006, summer 2005)
In general, fresher conditions continued though Year 6 of this monitoring study, although slight differences were noted between the current year and the previous one. During the current winter, these slight changes in salinity and mode of organic matter remineralization varied systematically with river location. NECF river sites (Prince George, Fishing Creek, Rat Island, and Smith Creek) displayed a slight freshening, while all but one (Indian Creek) main stream CFR sites showed slightly saltier conditions (Eagle Island, Black River, and Dollisons Landing). Town Creek, which is the most sea ward location monitored for geochemistry was noticeable fresher.
During the summer there were no consistent patterns with some sites showing slightly saltier conditions (Rat Island creek bank, Smith Creek, Eagle Island, and Town Creek) and some showing slightly fresher conditions (Fishing Creek, Rat Island upland, and Indian Creek). Generally conditions remained fairly fresh during this summer.
Year 7: (winter 2007, summer 2006)
Fresher conditions continued throughout both the winter and summer of year seven of the monitoring project. Classifications at most sites were essentially the same as year six with the exception of very slightly fresher conditions.
112

6.0 BENTHIC INFAUNA COMMUNITIES 6.1 Summary
This chapter summarizes infaunal community patterns at nine sites distributed among the Cape Fear River, Northeast Cape Fear River and Town Creek from 1999-2006. This period covered three major potential system-level impacts: a developing drought in 2001-2002, a period of recovery and relatively higher freshwater input late in 2003 and in 2004, as well as the initiation of channel widening construction in 2001-2002. 2000 and 2002 continued to represent the years of lowest diversity for most sites, with highest diversity occurring at most sites during 2003 or 2004. Species richness was highest in 2004 for 5 of the 9 sites showing significant differences (and not significantly different from the year with highest species richness for the remaining sites). However, there were no consistent patterns for either diversity or richness among the remaining years. Richness and diversity for 2006 was intermediate and not significantly different from 2005. Analysis of Similarity and Multidimensional Scaling Analysis indicated that 1999-2001 samples did not have significantly dissimilar faunal assemblages. However, subsequent years did have distinct infaunal assemblages relative to the 1999-2001 grouping as well as from each other. The overall separation of 2002-2005 from 1999-2001 was greater than differences among the 2002-2005 grouping as indicated by Analysis of Similarity. 2006 samples generally grouped with the 2003-2005 samples with respect to faunal community similarity. The 2006 samples were characterized by high abundances of amphipods at P2 and P3, high abundances of bivalves at P2, high abundances of the deep burrowing functional guild at P3, high abundances of sedentary/tube builders at P12, low abundances of polychaetes at P3, low abundances of oligochaetes at P11, low abundances of sedentary/tube builders at P3, P8, and P11 and low abundances of deep burrowers at P11. Other faunal abundance patterns were intermediate to previous years and these patterns did not, indicate a distinct pattern for 2006 relative to 2003-2005.
6.2 Background
As part of the U.S. Army Corps of Engineers project to deepen the Cape Fear River shipping channel from the mouth of the river to Wilmington Harbor, benthic infaunal communities have been monitored at stations predicted to have the greatest potential impacts. The focus of this sampling effort is on the fringing wetlands that border the river and represent critical habitat and nursery areas for a number of commercially and ecologically important taxa. Changes in the composition and abundance of organisms living within or directly on the sediments of the fringing marsh (infauna) may result from changes in salinity, flow, and tidal currents. Benthic infaunal community patterns integrate environmental changes at a specific site over time. Most infaunal groups have limited post-larval mobility or dispersal, with abundances at a site reflecting a combination of recruitment patterns and site-specific processes. Infauna may be relatively long-lived, with lifespans of months to years for some taxa, and they occupy intermediate trophic positions, consuming detrital or planktonic food sources and being prey for larger fish and decapods. As a result, the infaunal community present in an area represents cumulative impacts of varying environmental factors over a several month
113

period. Changes in the composition of the infaunal community in response to changing environmental conditions may occur more rapidly than for more motile organisms that can migrate to optimal locations. However, changes in this group may also have fundamental importance for local ecosystem functioning because of their key position in nearshore estuarine food webs.
While many benthic species are resilient to short-term disturbances, long-term change associated with fluctuations in water quality, changes in tidal inundation or amplitude, changes in current flow or local hydrology, or changes in salinity regime and other physical factors may alter species composition and abundance. These physical changes may impact the infaunal community through direct mortality, reduced dispersal, food web alteration, and impacts related to increased stress (e.g. reduced feeding, competition). The monitoring effort reported here is designed to detect changes in the infaunal communities at selected sites that may be coincident with the timing of deepening of the Cape Fear River shipping channel. We hope to be able to distinguish potential long-term changes related to these anthropogenic impacts from year-to-year variability related to climatic fluctuations. Current working hypotheses are: 1) Changes in salinity and/or tidal amplitude and/or inundation period will lead to changes in intertidal and shallow subtidal benthic community composition, 2) If alterations of the Cape Fear River shipping channel significantly change estuarine flow characteristics, a change in community composition and function reflecting altered recruitment patterns may follow.
Polychaetes, oligochaetes, amphipods, and insect larvae are the dominant taxonomic groups of the Cape Fear estuary. Polychaetes and amphipods tend to dominate mesohaline sites in the river, while oligochaetes and insects dominate the oligohaline sites, although this pattern may shift among years and site-specific responses may vary with taxonomic composition. The relative importance of specific species that dominate a site changes along the estuarine gradient from polyhaline to oligohaline and tidal freshwater conditions. As noted in previous evaluations of the Cape Fear River estuary, both bivalves and gastropods have conspicuously low abundances in estuarine portions of the river both in the intertidal and subtidal habitats (Mallin et al. 1999 and 2001). Infaunal groups demonstrate a variety of reproductive, dispersal, and functional strategies that can directly relate to timing and magnitude of their response to shifting environmental conditions. Polychaetes (segmented worms bearing specialized appendages) are common throughout the estuary and are generally the numerically dominant taxa in euhaline to mesohaline environments. Polychaetes have a variety of living modes including free-living, burrowing, and sedentary forms. Burrowing and tube-dwelling species dominate in most of the intertidal and shallow subtidal areas and are common prey for fish, shrimp, and crabs. Oligochaetes are another group of segmented worms that generally lack specialized appendages, have a burrowing habit, and exhibit direct development. Direct development in this group can result in locally dense patches and the ability to respond quickly to local environmental changes. Their deeper burrowing habit often makes them less available as a prey resource for fish and decapods than tube-dwelling polychaetes or amphipods. Amphipods are a diverse group of brooding crustaceans. This group can exhibit explosive population growth under
114

optimal conditions, and serves as a critical food resource in fringing wetlands during at least certain time periods. Although many are free-living or pelagic, a large proportion of estuarine amphipods are tube builders that can be highly mobile over small spatial scales and may quickly colonize disturbed habitats. Insect larvae are among the most numerous and diverse groups that inhabit the oligohaline and tidal freshwater regions of the estuary, but are generally absent from lower mesohaline and more saline areas. Insect larvae exploit virtually every habitat type in the upper estuary and are distinct from other groups in having aerial dispersal. However, many insects are very sensitive to salt intrusions and are indicators of changing salinity conditions. Like other infaunal groups, this group includes of a number of living strategies including surface tube-dwelling and free-living species that would be susceptible to predation especially by juvenile fish that recruit into the system heavily in the spring and to a lesser extent in the fall of each year.
6.3 Methodology
Infaunal core samples were collected at nine stations along the Cape Fear River estuarine gradient. Three benthic stations are located in Town Creek (P2 at the mouth of Town Creek, P3A and P3B inner Town Creek), three stations in the main stem Cape Fear above the City of Wilmington (P6-Eagle Island, P7-Indian Creek, and P8-Dollisonss Landing), and three stations in the Northeast Cape Fear River (P11-Smith Creek, P12-Rat Island, and P13-Fishing Creek). These stations are the same as those being monitored for epifauna patterns (Section 7.0) and represent a subset of those stations being monitored for changes in physical factors that may be causal for possible biotic changes (including tidal elevation, inundation, and biogeochemical composition among other variables).
Infaunal core samples (10 cm diameter X 15 cm deep) were collected at two upper intertidal subsites and two lower intertidal subsites at each station. These subsites are fixed stations that were originally marked (and positions recorded using GPS) in 1999. Three replicate core samples were collected within a one-meter area around these points. Core samples are collected at all stations in June of each year. All samples are fixed in a 10% formalin solution (~4% formaldehyde), with Rose Bengal dye added, later sieved through a 500 micron screen to remove excess sediment, and preserved in 50% isopropanol. All organisms are separated from the remaining sediment by sorting under a dissecting microscope and identified to lowest reasonable taxon, in most cases this is genus or species.
The major deepening efforts for the Cape Fear River channel began in winter 2001 and were ongoing at various areas within the Cape Fear system into 2006. Since the current report summarizes data from infaunal samples taken through June 2006, the data represents background conditions (pre-dredging; 1999-2001), possible initial impacts related to the actual sediment removal activities (2002-2006) and any developing hydrologic impacts of channel alterations. Full effects of the deepening project cannot be assessed until 2-3 years of post-dredging data are available to compare to pre-dredging conditions and patterns occurring while dredging was ongoing. However, interim community patterns at each site over the 7 years of sampling were assessed by examining patterns of species diversity, species richness, taxonomic and guild dominance, and
115

community similarity. Per site diversity was calculated using the Shannon-Weiner Diversity Index and was compared along with per sample taxonomic richness among years by site. For comparison of taxonomic richness, taxa were combined where there was uncertainty among years. Abundances of major taxonomic groups (polychaetes, oligochaetes, amphipods, and insects) and major functional guilds (sedentary/tube dwellers, surface/mobile taxa, deep burrowing taxa, and surface burrowing taxa) were compared among years separately for each site using analysis of variance. Abundances were log-transformed before analyses to meet assumptions of homogeneity of variances. Community similarity was compared among site/year combinations using the ANOSIM and multidimensional scaling data analysis procedures of the PRIMER statistical package (Clarke and Gorley 2001). These procedures examine community similarity based on a Bray-Curtis Similarity matrix. All species were included in this analysis and abundances were square root transformed to reduce dominating effects on analyses by common taxa.
6.4 Faunal Patterns
While four locations (two high intertidal and two low intertidal substations) were sampled at each station, mean total abundances for all infaunal species present at a specific station are given by tidal position. In order to more easily compare the relative abundance and shifts in composition between tidal positions and among years, abundance data is presented in three year blocks by tidal position and only for taxa that were present at that site/substation combination. Tables 6.4-1a and 6.4-1b represent the mouth of Town Creek (P2) located in the mesohaline region of the Cape Fear River, while Tables 6.4-2a and 6.4-2b and Tables 6.4-3a and 6.4-3b represent the two inner Town Creek sites, P3A and P3B respectively. Shifts in species composition and relative abundance are evident in the main stem Cape Fear sites; Eagle Island (P6) (Tables 6.4-4a and 6.4-4b), Indian Creek (P7) (Tables 6.4-5a and 6.4-5b), and Dollisons Landing (P8) (Tables 6.4-6a and 6.4-6b). Most of these individual species shifts follow major taxonomic changes (see below), though there was considerable species replacement among years within a guild or higher taxonomic grouping. Mean abundances for the three Northeast Cape Fear River stations, Smith Creek (P11) (Tables 6.4-7a and 6.4-7b), Rat Island (P12) (Tables 6.5-8a and 6.4-8b), and Fishing Creek (P13) (Tables 6.4-9a and 6.4-9b) also show a high degree of variability among years, generally following the shifts in major guild or taxonomic groups.
116

117
Table 6.4-1a. Mean (no. per 0.01 m2) and (standard error) for all taxa collected on the Town Creek mouth site (P2) during June 1999, 2000, 2001, 2002, 2003, 2004, 2005, and 2006. The means presented here represent the combination of two sub-sites for high intertidal areas.
High Intertidal June 99 June 00 June 01 June 02 June 03 June 04 June 05 June 06 Acarina spp. 0(0) 0(0) 0(0) 0(0) 0(0) 1.00(0.71) 0(0) 0.25(0.25) amphipod sp. 0.17(0.17) 0.50(0.23) 0(0) 0(0) 0(0) 0(0) 0(0) 0(0) Bezzia/Palpomia 0.50(0.50) 0(0) 0(0) 2.00(2.00) 2.50(0.86) 3.50(2.06) 0(0) 0.50(0.29) juv. Bivalve 1.00(0.37) 0.50(0.29) 0(0) 0(0) 0.25(0.25) 1.00(0.58) 0.25(0.25) 2.00(0.71) Boccardia sp. A 0(0) 0(0) 0(0) 0(0) 0(0) 0(0) 1.75(1.75) 0(0) Boccardiella sp. 0(0) 26.50(18.62) 0(0) 0.25(0.25) 0.75(0.48) 18.75(6.97) 6.25(4.73) 0.25(0.25) Capitellidae sp. 0(0) 0(0) 0(0) 0.25(0.25) 0(0) 0(0) 0(0) 0(0) Cassidinidea lunifrons 0.17(0.17) 0.50(0.50) 0(0) 0(0) 0.50(0.50) 2.00(1.35) 2.25(0.63) 0.75(0.48) Caulleriella killariensis 0(0) 0(0) 0(0) 0(0) 0.25(0.25) 0(0) 0(0) 0(0) Chironomidae sp. 0(0) 0.25(0.25) 0(0) 0(0) 0(0) 0(0) 0(0) 0(0) Coleoptera sp. 0(0) 0(0) 0(0) 0(0) 0(0) 0(0) 0.25(0.25) 0(0) Corophium acherusicum 0(0) 0(0) 12.50(8.72) 0(0) 0(0) 0(0) 0(0) 0(0) Corophium acutum 0(0) 0(0) 7.75(7.75) 0(0) 0(0) 0(0) 0(0) 0(0) Corophium lacustre 0(0) 4.25(0.85) 0(0) 0(0) 0.50(0.29) 28.25(9.28) 75.25(40.79) 25.00(9.23) Corophium sp. 0.17(0.17) 0(0) 11.75(7.81) 0(0) 0(0) 2.00(2.00) 0(0) 0.50(0.50) Crangonyx pseudogracilis 0(0) 0(0) 0(0) 0.25(0.25) 0(0) 0(0) 0(0) 0(0) Curculionidae sp. 0(0) 0(0) 0(0) 0(0) 0(0) 1.50(1.19) 0(0) 1.00(0.58) Cyathura polita 0(0) 0.75(0.75) 0(0) 0(0) 0(0) 4.50(3.84) 0.25(0.25) 0(0) Dicrotendipes (lobus) 0(0) 0(0) 0(0) 0(0) 0(0) 22.00(17.64) 0(0) 0(0) Dicrotendipes nervosa 0(0) 0(0) 0(0) 0(0) 0(0) 0.25(0.25) 0(0) 0(0) Dicrotendipes sp. 2.00(0.93) 1.00(1.00) 0.25(0.25) 0(0) 7.50(6.85) 1.50(1.50) 0.25(0.25) 0.50(0.50) Dipolydora ligni 0(0) 0(0) 0(0) 0(0) 0(0) 2.00(1.08) 0(0) 0(0) Dolichopodidae sp. 0(0) 0(0) 0(0) 0(0) 0(0) 0.25(0.25) 0(0) 0(0) (Dumosus sp.) 0(0) 0(0) 0(0) 0(0) 0(0) 0(0) 0(0) 0.75(0.75) Eteone heteropoda 0(0) 1.00(0.41) 0(0) 0(0) 0(0) 0(0) 0(0) 0.25(0.25) Eteone sp. 0(0) 0.25(0.25) 0(0) 0(0) 0(0) 0(0) 0(0) 0(0) Fabriciola sp. 0(0) 0(0) 0(0) 37.00(37.00) 0(0) 0(0) 0(0) 0(0) Fabriciola trilobata 0(0) 0(0) 0(0) 5.75(5.42) 0(0) 0.25(0.25) 0.50(0.50) 0(0) Flabelligeridae sp. 0(0) 0(0) 0(0) 0(0) 0(0) 0.25(0.25) 0(0) 0(0) Gammarus sp. 0(0) 0.75(0.48) 0(0) 0.25(0.25) 0(0) 0.25(0.25) 0(0) 0(0) Gammarus tigrinus 0(0) 2.25(2.25) 0(0) 0(0) 0(0) 0(0) 0(0) 4.75(3.82) juv. Gastropod 0(0) 0(0) 0(0) 0(0) 0(0) 0.25(0.25) 0(0) 0(0) Hargeria rapax 0(0) 0(0) 0(0) 0(0) 0.25(0.25) 5.00(4.67) 24.50(12.58) 55.00(26.69)Hobsonia florida 3.67(2.01) 3.00(2.68) 0.50(0.50) 0(0) 0.50(0.50) 11.25(4.27) 0(0) 0.25(0.25) insect pupae 0(0) 0.25(0.25) 0(0) 0(0) 0(0) 0(0) 0(0) 0(0) insect sp. 0.17(0.17) 0(0) 0.25(0.25) 0(0) 0(0) 0(0) 0(0) 0(0) Laeonereis culveri 0.17(0.17) 0.25(0.25) 0(0) 0(0) 0(0) 0(0) 1.25(0.75) 0.25(0.25) Marenzelleria viridis 1.67(1.67) 0(0) 0(0) 0(0) 0(0) 0.50(0.29) 0(0) 0(0) Megalops spp. 0(0) 0(0) 0(0) 0(0) 0(0) 1.50(0.65) 0.25(0.25) 0(0) Melita nitida 0(0) 0(0) 0(0) 0(0) 0(0) 0(0) 0.75(0.48) 0(0) Neanthes succinea 0(0) 0.25(0.25) 1.50(0.96) 0(0) 0(0) 0(0) 1.75(0.63) 0.50(0.50) Nereidae sp. 0(0) 0(0) 0.25(0.25) 0(0) 0(0) 0(0) 0(0) 0(0) Nereis falsa 0(0) 1.25(1.25) 0(0) 0(0) 0(0) 0(0) 1.00(1.00) 0(0) Nereis riisei 0.67(0.49) 0(0) 0(0) 0(0) 0(0) 0(0) 0(0) 0(0) Notophilia sp. 0(0) 0(0) 0(0) 0(0) 0(0) 0.25(0.25) 0(0) 0(0) Oligochaete 36.50(11.55) 8.75(6.79) 2.25(1.31) 0(0) 0(0) 0(0) 0(0) 0(0) Orchestia uhleri 0(0) 0(0) 0(0) 0.75(0.75) 0(0) 0.25(0.25) 0.25(0.25) 0(0) Owenia sp. 0.17(0.17) 0(0) 0(0) 0(0) 0(0) 0(0) 0(0) 0(0) Palaemonetes pugio 0.17(0.17) 0(0) 0(0) 0(0) 0(0) 0(0) 0.50(0.50) 0(0) Parandalia sp. 1.00(0.63) 0(0) 0.50(0.29) 2.75(1.11) 0(0) 4.75(2.93) 1.25(0.95) 0.75(0.48) Polydora caulleryi 0(0) 0(0) 0(0) 0(0) 0(0) 0(0) 0.25(0.25) 0(0) Polydora ligni/cornuta 12.17(10.83) 0.25(0.25) 0.25(0.25) 0.75(0.48) 0(0) 0(0) 2.00(1.68) 1.50(1.50) Polydora socialis 5.50(4.11) 0(0) 3.25(3.25) 0.25(0.25) 0(0) 0(0) 3.25(2.93) 0(0) Polypedilum sp. 1.50(0.72) 0(0) 0(0) 0(0) 13.50(11.51) 0.50(0.29) 0(0) 0(0) Streblospio benedicti 0.83(0.31) 0.75(0.25) 0.25(0.25) 8.25(4.77) 0(0) 0(0) 1.75(1.44) 0(0) Tanais sp. 0.33(0.33) 0(0) 16.75(9.46) 0(0) 0(0) 0(0) 0(0) 0(0) Tanytarus sp. 0(0) 0(0) 0(0) 0(0) 0.75(0.75) 0(0) 0(0) 0(0) Tipulidae sp. 0(0) 0(0) 0(0) 0(0) 0(0) 0.25(0.25) 0(0) 0(0) Tubificidae spp. 0(0) 0(0) 0(0) 2.25(1.93) 2.75(1.55) 52.50(27.52) 31.00(17.61) 6.50(4.63) Tubificoides heterochaetus 0(0) 0(0) 0(0) 0.50(0.50) 0(0) 0(0) 6.25(5.92) 0.25(0.25) Uca minax 0(0) 0(0) 0(0) 0.25(0.25) 0(0) 0.25(0.25) 0(0) 0(0) Uca sp. 0(0) 0(0) 0(0) 0.25(0.25) 0(0) 0(0) 0(0) 0(0)

118
Table 6.4-1b. Mean (no. per 0.01 m2) and (standard error) for all taxa collected on the Town Creek mouth site (P2) during June 1999, 2000, 2001, 2002, 2003, 2004, 2005, and 2006. The means presented here represent the combination of two sub-sites for low intertidal areas. Low Intertidal June 99 June 00 June 01 June 02 June 03 June 04 June 05 June 06Acarina spp. 0(0) 0(0) 0(0) 0(0) 0(0) 0(0) 0.20(0.20) 0(0) amphipod sp. 0.17(0.17) 0.25(0.25) 0(0) 0(0) 0(0) 0(0) 0(0) 0(0) Anurida maritima 0(0) 0(0) 0(0) 0(0) 0(0) 0(0) 0(0) 0.25(0.25)Balanus improvisus 0(0) 0(0) 4.80(4.80) 0(0) 0(0) 0(0) 0(0) 0(0) Balanus sp. 0(0) 0(0) 0(0) 0(0) 0(0) 1.00(0.71) 0(0) 0(0) juv. Bivalve 0(0) 0.25(0.25) 0(0) 0.29(0.18) 0(0) 0.50(0.29) 0.20(0.20) 0.25(0.25)Boccardiella sp. 0(0) 16.50(5.17) 0(0) 0(0) 0(0) 0(0) 0(0) 0(0) Capitella capitata 0(0) 0(0) 0.20(0.20) 0(0) 0(0) 0(0) 0(0) 0(0) Cassidinidea lunifrons 0(0) 0(0) 0.20(0.20) 0(0) 0(0) 0(0) 0(0) 0(0) Cerapus tubularis 0(0) 0(0) 0(0) 0(0) 0(0) 0(0) 0(0) 0.25(0.25)Chironomus sp. 0(0) 0(0) 0(0) 0(0) 0.50(0.50) 0(0) 0(0) 0(0) Collembola sp. 0.17(0.17) 0(0) 0(0) 0(0) 0(0) 0(0) 0.60(0.24) 0(0) Corophium lacustre 0(0) 2.50(1.19) 0(0) 0(0) 0(0) 0(0) 0.20(0.20) 0.50(0.50)Corophium sp. 0(0) 0.25(0.25) 0.20(0.20) 0(0) 0(0) 0.25(0.25) 0(0) 0(0) Cyclaspis varians 0(0) 0(0) 0(0) 0.14(0.14) 0(0) 0(0) 0(0) 0(0) Dicrotendipes sp. 0(0) 0.50(0.50) 0(0) 0(0) 0(0) 0(0) 0(0) 0(0) Edotea (montosa) 0.17(0.17) 0(0) 0(0) 0(0) 0(0) 0(0) 0(0) 0(0) Edotea sp. 0(0) 0(0) 0(0) 0(0) 0(0) 0(0) 0.20(0.20) 0(0) Edotea triloba 0(0) 0(0) 0(0) 0(0) 0(0) 0.25(0.25) 0(0) 0(0) Eteone heteropoda 0(0) 0(0) 0(0) 0.71(0.42) 0(0) 0(0) 0(0) 0(0) Gammarus sp. 0(0) 0.25(0.25) 0.20(0.20) 0.14(0.14) 0(0) 0(0) 0(0) 0(0) Gammarus tigrinus 0.33(0.33) 0(0) 0.20(0.20) 0(0) 0(0) 0(0) 0(0) 0(0) Hargeria rapax 0(0) 0(0) 0(0) 0(0) 0(0) 0(0) 0(0) 0.50(0.29)Haustoridae sp. 0(0) 0(0) 0(0) 0(0) 0(0) 0.25(0.25) 0(0) 0(0) Hobsonia florida 0.83(0.83) 4.00(2.74) 0(0) 0(0) 0.25(0.25) 0.25(0.25) 0(0) 0(0) insect pupae 0(0) 0(0) 0(0) 0(0) 0(0) 0(0) 0.40(0.40) 0(0) Laeonereis culveri 0.17(0.17) 0(0) 0(0) 0(0) 0(0) 0(0) 0(0) 0(0) Mediomastus ambiseta 1.17(0.83) 0(0) 0(0) 2.86(2.54) 0(0) 0(0) 3.40(1.47) 1.75(1.75)Mediomastus sp. 1.67(0.99) 0(0) 0(0) 4.29(2.30) 0.25(0.25) 0.25(0.25) 4.20(1.68) 1.25(0.95)Melita nitida 0(0) 0.50(0.50) 0.20(0.20) 0(0) 0(0) 0(0) 0(0) 0(0) Mucrogammarus
mucronata 0(0) 0(0) 0(0) 0.14(0.14) 0(0) 0(0) 0(0) 0(0) Neanthes succinea 0(0) 1.25(0.95) 0.20(0.20) 0.14(0.14) 0(0) 1.25(0.95) 0(0) 0(0) Nemertea sp. 0.17(0.17) 0(0) 0(0) 0(0) 0(0) 0(0) 0.40(0.24) 0(0) Nereis acuminata 0(0) 0.25(0.25) 0(0) 0(0) 0(0) 0(0) 0(0) 0(0) Oligochaete 4.83(2.21) 2.50(1.19) 0.20(0.20) 0(0) 0(0) 0(0) 0(0) 0(0) Palaemonetes (pugio) 0(0) 0(0) 0(0) 0(0) 0(0) 0(0) 0(0) 0.25(0.25)Parandalia sp. 2.50(0.85) 1.00(0.71) 0.80(0.37) 2.43(1.49) 0(0) 0.75(0.25) 0.20(0.20) 0(0) Paraprionospio pinnata 0.17(0.17) 0(0) 0(0) 0(0) 0(0) 0(0) 0(0) 0(0) Polydora ligni/cornuta 0.83(0.83) 1.50(1.50) 0(0) 0.43(0.43) 0(0) 0(0) 0(0) 0(0) Procladius sp. 0(0) 0(0) 0(0) 0(0) 0.75(0.25) 0(0) 0(0) 0(0) Sphenia antillensis 0(0) 0(0) 0(0) 0(0) 0(0) 0(0) 0(0) 0.25(0.25)Spisula solidessima 0(0) 0(0) 0(0) 0.29(0.18) 0(0) 0(0) 0(0) 0(0) Streblospio benedicti 3.00(1.69) 0(0) 1.60(1.03) 54.29(11.27) 0(0) 0(0) 0.40(0.40) 0(0) Syllidae sp. 0.17(0.17) 0(0) 0(0) 0(0) 0(0) 0(0) 0(0) 0(0) Tanais sp. 0(0) 0.25(0.25) 0(0) 0(0) 0(0) 0(0) 0(0) 0(0) Tanypus sp. 0(0) 0(0) 0(0) 0(0) 0.75(0.75) 0(0) 0(0) 0(0) Tubificidae spp. 0(0) 0(0) 0.20(0.20) 0(0) 0.25(0.25) 0.25(0.25) 0.20(0.20) 1.00(0.71)Tubificoides
heterochaetus 0(0) 0(0) 0.20(0.20) 0.86(0.70) 0(0) 3.25(1.31) 12.80(3.43) 3.50(1.89)

119
Table 6.4-2a. Mean (no. per 0.01 m2) and (standard error) for all taxa collected at P3A upper Town Creek sites during June 1999, 2000, 2001, 2002, 2003, 2004, 2005, and 2006. The means presented here represent the combination of two sub-sites for high intertidal areas.
High Intertidal June 99 June 00 June 01 June 02 June 03 June 04 June 05 June 06 Acarina spp. 0.17(0.17) 0(0) 0(0) 0.17(0.17) 0(0) 0.25(0.25) 0.25(0.25) 0(0) Apedilum sp. 0(0) 0(0) 0(0) 0(0) 0(0) 0.50(0.50) 0(0) 0(0) Bezzia/Palpomyia 0(0) 0(0) 0.40(0.24) 0.17(0.17) 0.75(0.47) 0.25(0.25) 2.00(0.91) 0.25(0.25)juv. Bivalve 0.17(0.17) 0(0) 0(0) 0.17(0.17) 0(0) 0(0) 0.50(0.29) 0(0) Cassidinidea lunifrons 0(0) 0(0) 1.00(0.32) 0(0) 1.25(0.63) 4.00(0.91) 1.00(0) 0.25(0.25)Collembola sp. 0.33(0.21) 0(0) 0(0) 8.67(7.09) 0(0) 1.25(0.48) 0(0) 0(0) Corophium volutator 0(0) 0(0) 0(0) 0(0) 0(0) 0.75(0.48) 1.00(0.41) 0(0) Chironomidae sp. 0(0) 0(0) 0(0) 0(0) 0.25(0.25) 0(0) 0(0) 0(0) Cryptochironomous sp. 0(0) 0(0) 0(0) 0(0) 0.50(0.50) 0(0) 0(0) 0(0) Cyathura (madelinae) 0(0) 0(0) 0(0) 0(0) 0.25(0.25) 0(0) 0(0) 0(0) Cyathura polita 0(0) 0(0) 0(0) 0(0) 0.25(0.25) 1.50(1.19) 2.75(1.11) 0(0) Dicrotendipes (lobus) 0(0) 0(0) 0(0) 0.17(0.17) 0(0) 0(0) 0(0) 0(0) Dicrotendipes sp. 0(0) 0(0) 0(0) 0(0) 0(0) 0(0) 0(0) 0(0) Diptera sp. 0(0) 0(0) 0(0) 0(0) 0(0) 0(0) 0(0) 0.25(0.25)Dolichopodidae sp. 0(0) 3.75(1.38) 0.60(0.40) 0(0) 0.25(0.25) 0(0) 0.25(0.25) 0.50(0.50)Elasmopus sp. 0(0) 0.25(0.25) 0(0) 0(0) 0(0) 0(0) 0(0) 0(0) Enchytraeidae sp. 0(0) 0(0) 0(0) 0(0) 0.25(0.25) 0(0) 0(0) 0(0) Eukiefferiella sp. 0(0) 0(0) 1.80(1.56) 0(0) 0(0) 0(0) 0(0) 0(0) Gammarus tigrinus 0.33(0.33) 0(0) 0(0) 0(0) 0(0) 0(0) 0(0) 0(0) juv. Gastropod 0(0) 0(0) 0(0) 0(0) 0(0) 0(0) 0(0) 0.25(0.25)Hemipodus roseus 0(0) 0.50(0.50) 0.40(0.24) 0(0) 0(0) 0(0) 0(0) 0(0) Hobsonia florida 0(0) 0(0) 0(0) 0(0) 0(0) 0(0) 0.50(0.50) 0(0) insect pupae 0.17(0.17) 0(0) 0(0) 0(0) 0(0) 0(0) 0(0) 0(0) insect sp. 0.17(0.17) 0(0) 0(0) 0(0) 0(0) 0(0) 0(0) 0(0) insect sp. b 0.17(0.17) 0(0) 0(0) 0(0) 0(0) 0(0) 0(0) 0(0) insect sp. g 0.33(0.33) 0(0) 0(0) 0(0) 0(0) 0(0) 0(0) 0(0) Laeonereis culveri 0.67(0.67) 0.50(0.50) 0(0) 0(0) 0(0) 0(0) 0.25(0.25) 0(0) (Limnophyes sp.) 0(0) 0.25(0.25) 0(0) 0(0) 0(0) 0(0) 0(0) 0.50(0.29)Lumbriculidae sp. 0(0) 1.00(1.00) 0.20(0.20) 0(0) 0.75(0.75) 0.75(0.75) 0(0) 0(0) (Lumbriculidae sp.) 0(0) 0(0) 0(0) 0(0) 0(0) 0(0) 0(0) 0.25(0.25)Megalops spp. 0(0) 0(0) 0(0) 0.17(0.17) 0.25(0.25) 0.25(0.25) 0(0) 0(0) Nais sp. 0(0) 0(0) 0(0) 0(0) 0.25(0.25) 0(0) 0(0) 0(0) juv. Nereid 0(0) 0.25(0.25) 0(0) 0(0) 0(0) 0(0) 0(0) 0(0) Oligochaete 36.67(24.02) 42.00(12.81) 9.60(3.98) 0(0) 0(0) 0(0) 0(0) 0(0) Olivella sp. 0(0) 0(0) 0(0) 0.17(0.17) 0(0) 0(0) 0(0) 0(0) Orchestia sp. 0(0) 0(0) 0.80(0.58) 0(0) 0(0) 0(0) 0(0) 0(0) Orchestia uhleri 0(0) 0(0) 0.40(0.40) 0.17(0.17) 0(0) 0.50(0.29) 0(0) 1.75(0.25)Parametriocnemus sp. 0(0) 0(0) 0(0) 0(0) 0(0) 4.00(1.58) 0(0) 0(0) Polypedilum sp. 0(0) 0.25(0.25) 0(0) 0(0) 3.50(2.36) 0.25(0.25) 0(0) 0(0) Procladius sp. 0(0) 0.25(0.25) 0(0) 0(0) 0(0) 0(0) 0(0) 0(0) Spionidae sp. 0(0) 0(0) 0(0) 0.17(0.17) 0(0) 0(0) 0(0) 0(0) Streblospio benedicti 0(0) 0(0) 0(0) 0.17(0.17) 0(0) 0(0) 0(0) 0(0) Tabanus sp. 0(0) 0(0) 0(0) 0(0) 0.50(0.50) 0.25(0.25) 0(0) 0(0) Tubificidae spp. 0(0) 0(0) 2.40(2.40) 6.67(3.26) 6.00(0.25) 26.25(5.76) 21.00(5.02) 29.75(9.80)Tubificoides
heterochaetus
0(0)
0(0)
0(0)
0(0)
0(0)
0.50(0.50)
0(0)
0(0) Uca minax 0(0) 0(0) 0(0) 0(0) 0(0) 0.50(0.29) 0(0) 0(0) Uca pugilator 0.50(0.34) 0(0) 0(0) 0(0) 0(0) 0(0) 0(0) 0(0) Uca pugnax 0.17(0.17) 0(0) 0(0) 0(0) 0(0) 0(0) 0(0) 0(0) Uca sp. 0(0) 0.25(0.25) 0(0) 0.33(0.21) 0.25(0.25) 0(0) 1.00(0.41) 0(0)

120
Table 6.4-2b. Mean (no. per 0.01 m2) and (standard error) for all taxa collected at P3A upper Town Creek sites during June 1999, 2000, 2001, 2002, 2003, 2004, 2005, and 2006. The means presented here represent the combination of two sub-sites for low intertidal areas. Low Intertidal June 99 June 00 June 01 June 02 June 03 June 04 June 05 June 06 Acarina spp. 0(0) 0(0) 0(0) 0(0) 0(0) 4.75(1.25) 0.25(0.25) 0(0) Ampharetidae sp. 0.17(0.17) 0(0) 0(0) 0(0) 0(0) 0(0) 0(0) 0(0) Amphipod sp. 0.67(0.33) 0.25(0.25) 0(0) 0(0) 0(0) 0(0) 0(0) 0(0) Anurida maritime 0(0) 0(0) 0(0) 0(0) 0(0) 0(0) 5.00(5.00) 0.25(0.25) Bezzia/Palpomyia 0(0) 0(0) 0.20(0.20) 0(0) 0(0) 0(0) 0.25(0.25) 0(0) juv. Bivalve 0.17(0.17) 0(0) 0(0) 0(0) 0(0) 0(0) 0(0) 0(0) Boccardiella sp. 0(0) 0(0) 0(0) 0.33(0.21) 0(0) 0(0) 0(0) 0(0) Cassidinidea lunifrons 0.17(0.17) 0.25(0.25) 0.20(0.20) 0(0) 0.50(0.29) 0.25(0.25) 0.25(0.25) 0.25(0.25) Chironomidae sp. 0(0) 0(0) 0(0) 0(0) 0(0) 0(0) 0.25(0.25) 0(0) Coleoptera sp. 0(0) 0(0) 0(0) 0(0) 0(0) 0(0) 0(0) 0.25(0.25) Collembola sp. 0(0) 0(0) 0(0) 0.33(0.21) 0(0) 21.00(7.15) 0(0) 0(0) Corophium lacustre 0(0) 0(0) 0(0) 0(0) 0(0) 0(0) 0.25(0.25) 0(0) Corophium volutator 0(0) 0(0) 0(0) 0(0) 0.25(0.25) 0.50(0.50) 1.75(1.44) 0(0) Cryptochironomous sp. 0(0) 0(0) 0(0) 0(0) 0.25(0.25) 0(0) 0(0) 0(0) Cyathura (madelinae) 0(0) 0(0) 0(0) 0(0) 0.50(0.29) 0(0) 0(0) 0(0) Cyathura polita 0(0) 0(0) 0.40(0.40) 0(0) 0(0) 0(0) 0.25(0.25) 0(0) Dolichopodidae sp. 0(0) 0.25(0.25) 0(0) 0(0) 0(0) 4.25(1.11) 2.00(1.08) 2.25(1.11) Eukiefferiella sp. 0(0) 0(0) 0.40(0.40) 0(0) 0(0) 0(0) 0(0) 0(0) Gammarus plumosa 0.17(0.17) 0(0) 0(0) 0(0) 0(0) 0(0) 0(0) 0(0) Gammarus tigrinus 2.67(2.12) 0(0) 0(0) 0(0) 0(0) 0(0) 0(0) 0(0) juv. Gastropod 0.17(0.17) 0(0) 0(0) 0(0) 0(0) 0(0) 0(0) 0.25(0.25) (Georthocladius sp.) 0(0) 0(0) 0(0) 0(0) 0(0) 0.50(0.50) 0(0) 0(0) Hemiptera sp. 0(0) 0(0) 0(0) 0(0) 0(0) 0(0) 0(0) 0.25(0.25) Hobsonia florida 3.17(1.33) 0(0) 0.60(0.40) 0(0) 0.50(0.29) 0(0) 0(0) 0(0) Hydrophilidae larvae 0(0) 0.25(0.25) 0(0) 0(0) 0(0) 0(0) 0(0) 0(0) insect larva b 0.17(0.17) 0(0) 0(0) 0(0) 0(0) 0(0) 0(0) 0(0) insect pupae 0.17(0.17) 0(0) 0(0) 0(0) 0(0) 0(0) 0.25(0.25) 0(0) Laeonereis culveri 0(0) 0(0) 0(0) 0(0) 0(0) 0.25(0.25) 5.25(2.87) 0(0) (Limnophyes sp.) 0(0) 0(0) 0(0) 0(0) 0(0) 0(0) 0(0) 0.25(0.25) Lumbriculidae sp. 0(0) 0.25(0.25) 0(0) 0(0) 0(0) 13.50(13.5) 0(0) 0(0) Marenzelleria viridis 0.33(0.33) 0(0) 0(0) 0(0) 0(0) 0(0) 0(0) 0(0) Mediomastus ambiseta 0.17(0.17) 0(0) 0(0) 0(0) 0(0) 0(0) 0(0) 0(0) Mediomastus califoriensis 0.17(0.17) 0(0) 0(0) 0(0) 0(0) 0(0) 0(0) 0(0) Megalops spp. 0(0) 0(0) 0(0) 0(0) 0(0) 0.25(0.25) 0(0) 0(0) Melita nitida 0(0) 0(0) 0(0) 0.17(0.17) 0(0) 0(0) 0(0) 0(0) Monopylephorus irroratus 0(0) 0(0) 0(0) 0(0) 0(0) 0(0) 60.25(60.25) 0(0) Monopylephorus sp. 0(0) 0(0) 0(0) 0.17(0.17) 0(0) 0(0) 0(0) 0(0) Munna sp. 0.17(0.17) 0(0) 0(0) 0(0) 0(0) 0(0) 0(0) 0(0) Neanthes succinea 0(0) 0(0) 0(0) 0(0) 0(0) 0.25(0.25) 0(0) 0(0) Oligochaete 5.00(3.85) 83.00(35.67) 12.40(3.91) 0(0) 0(0) 0(0) 0.25(0.25) 0(0) Orchestia sp. 0(0) 0(0) 0.20(0.20) 0(0) 0(0) 0(0) 0(0) 0(0) Orchestia uhleri 0(0) 0(0) 0(0) 0(0) 0(0) 0(0) 0(0) 0.75(0.25) Polydora ligni/cornuta 0.17(0.17) 0(0) 0(0) 0(0) 0(0) 0(0) 0(0) 0(0) Polydora sp. 0.17(0.17) 0(0) 0(0) 0(0) 0(0) 0(0) 0(0) 0(0) Polypedilum sp. 1.00(0.37) 0(0) 0(0) 0(0) 1.50(1.19) 0(0) 0(0) 0(0) Procladius sp. 2.50(0.34) 0(0) 0(0) 0(0) 0(0) 0(0) 0(0) 0(0) Streblospio benedicti 0.17(0.17) 0(0) 0.20(0.20) 1.67(1.12) 0(0) 0(0) 0(0) 0(0) Tanytarsus sp. 0.50(0.34) 0(0) 0(0) 0(0) 0.25(0.25) 0(0) 0(0) 0(0) Tubificidae spp. 0(0) 0(0) 0(0) 4.50(1.34) 2.00(1.08) 44.50(15.44) 43.25(21.26)113.00(94.18)Tubificoides heterochaetus 0(0) 0(0) 0(0) 0.67(0.33) 0(0) 0(0) 0(0) 0(0) Uca pugilator 0.17(0.17) 0(0) 0(0) 0(0) 0(0) 0(0) 0(0) 0(0) Uca sp. 0.17(0.17) 0(0) 0(0) 0(0) 0(0) 0(0) 0(0) 0(0)

121
Table 6.4-3a. Mean (no. per 0.01 m2) and (standard error) for all taxa collected at P3B upper Town Creek sites during June 1999, 2000, 2001, 2002, 2003, 2004, 2005, and 2006. The means presented here represent the combination of two sub-sites for high intertidal areas. High Intertidal June 99 June 00 June 01 June 02 June 03 June 04 June 05 June 06 Ablabesmyia sp. 0(0) 0(0) 0(0) 0(0) 2.00(2.00) 0(0) 0(0) 0(0) Apedilum sp. 0(0) 0(0) 0(0) 0(0) 0(0) 0.50(0.50) 0(0) 0(0) Axarus sp. 0(0) 0(0) 0(0) 0(0) 2.50(2.50) 0(0) 0(0) 0(0) Bezzia/Palpomyia 0(0) 0(0) 0(0) 0.80(0.58) 0.25(0.25) 1.50(0.65) 0.50(0.29) 1.00(0.71) juv. Bivalve 0.40(0.24) 0(0) 0(0) 0(0) 0(0) 0(0) 0(0) 0(0) Boccardiella sp. 0(0) 0(0) 0(0) 0(0) 0.25(0.25) 0(0) 0(0) 0(0) Cassidinidea lunifrons 0(0) 0(0) 0.60(0.24) 0(0) 0.50(0.50) 0.75(0.25) 1.50(0.64) 0.25(0.25) Chrysops sp. 0(0) 0(0) 0(0) 0(0) 0(0) 0.50(0.50) 0(0) 0(0) Collembola sp. 0.40(0.24) 0(0) 0(0) 0.20(0.20) 0.25(0.25) 1.00(0.58) 0(0) 0(0) Corophium lacustre 0(0) 0(0) 0(0) 0(0) 1.25(0.95) 0(0) 0(0) 0(0) Corophium volutator 0(0) 0(0) 0.40(0.20) 0(0) 1.25(0.95) 0.25(0.25) 0(0) 0(0) Cryptochironomous sp. 0(0) 0(0) 0(0) 0(0) 0.25(0.25) 0(0) 0(0) 0(0) Cyathura (madelinae) 0(0) 0(0) 0(0) 0(0) 0.25(0.25) 0(0) 0(0) 0(0) Cyathura polita 0(0) 0(0) 0(0) 0(0) 0(0) 1.00(0.50) 0.50(0.50) 0.25(0.25) Dero sp. 0(0) 0(0) 0(0) 0(0) 0.25(0.25) 0(0) 0(0) 0(0) Dicrotendipes sp. 0(0) 0(0) 0(0) 0(0) 2.50(2.50) 0(0) 0(0) 0(0) Diptera sp. 0(0) 0(0) 0(0) 0.20(0.20) 0.25(0.25) 0(0) 0(0) 0.50(0.50) Dolichopodidae sp. 0(0) 0.50(0.50) 0.40(0.24) 0(0) 0(0) 0.50(0.50) 0(0) 1.00(0.71) Dolichopus sp. 0.40(0.40) 0(0) 0(0) 0(0) 0(0) 0(0) 0(0) 0(0) Enchytraeidae sp. 0(0) 0(0) 0(0) 3.00(3.00) 0(0) 0(0) 0(0) 0(0) Ephydridae sp. 0(0) 0(0) 0(0) 0(0) 0(0) 2.00(1.41) 0(0) 0(0) Erioptera sp. 0(0) 0(0) 0(0) 0(0) 0(0) 0.25(0.25) 0(0) 0(0) Eukiefferiella sp. 0(0) 0(0) 0.20(0.20) 0(0) 0(0) 0(0) 0(0) 0(0) juv. Gastropod 0(0) 0(0) 0(0) 0(0) 0(0) 0.25(0.25) 0(0) 0.25(0.25) Hobsonia florida 0(0) 0(0) 0.80(0.80) 0.20(0.20) 0(0) 0.25(0.25) 0(0) 0(0) Hydrothassa sp. 0(0) 0(0) 0(0) 0.20(0.20) 0(0) 0(0) 0(0) 0(0) insect larva c 0.40(0.24) 0(0) 0(0) 0(0) 0(0) 0(0) 0(0) 0(0) Laeonereis culveri 0(0) 0.25(0.25) 0(0) 0(0) 0(0) 0(0) 0(0) 1.00(0.41) Lumbriculidae sp. 0(0) 0(0) 0(0) 0(0) 0(0) 0(0) 0(0) 0.50(0.50) Marenzelleria viridis 0.20(0.20) 0(0) 0(0) 0(0) 0(0) 0(0) 0(0) 0(0) Megalops spp. 0(0) 0(0) 0(0) 0(0) 0(0) 0.25(0.25) 0.25(0.25) 0(0) Munna sp. 0.20(0.20) 0(0) 0(0) 0(0) 0(0) 0(0) 0(0) 0(0) juv. Nereid 0(0) 0.25(0.25) 0(0) 0(0) 0(0) 0(0) 0(0) 0(0) Nereidae sp. 0(0) 0.75(0.75) 0(0) 0(0) 0(0) 0(0) 0(0) 0(0) Oligochaete 16.40(6.24) 27.30(6.80) 3.00(1.84) 0(0) 0(0) 0(0) 0(0) 0(0) Orchestia sp. 0.20(0.20) 0.25(0.25) 4.20(3.95) 0(0) 0(0) 0(0) 0(0) 0(0) Orchestia uhleri 0(0) 0.75(0.48) 0.20(0.20) 0(0) 0(0) 0(0) 0(0) 0(0) Parametriocnemus sp. 0(0) 0(0) 0(0) 0(0) 0(0) 1.25(0.48) 0(0) 0(0) Paratendipes sp. 0(0) 0(0) 0(0) 0(0) 0(0) 0.75(0.48) 0(0) 0.50(0.50) Platyhelminthes sp. 0(0) 0(0) 0(0) 0(0) 0.25(0.25) 0(0) 0(0) 0(0) Polypedilum sp. 0(0) 0.25(0.25) 0(0) 0(0) 2.50(2.18) 0.25(0.25) 0.25(0.25) 0(0) Procladius sp. 0(0) 0(0) 0(0) 0(0) 1.00(1.00) 0(0) 0(0) 0(0) Streblospio benedicti 0(0) 0.25(0.25) 0.20(0.20) 0.40(0.40) 0(0) 0(0) 0(0) 0(0) Tabanus sp. 0(0) 0(0) 0(0) 0(0) 0(0) 1.25(1.25) 0(0) 0(0) Tanytarsus sp. 0(0) 0(0) 0(0) 0(0) 0.25(0.25) 0(0) 0(0) 0(0) Tubificidae spp. 0(0) 0(0) 1.50(1.19) 0.80(0.58) 8.00(4.74) 16.50(1.71) 9.50(2.99) 37.50(12.30)Uca mixax 0(0) 0(0) 0(0) 0(0) 0(0) 0.50(0.50) 0(0) 0(0) Uca sp. 0.20(0.20) 0(0) 0(0) 0(0) 0(0) 0(0) 0(0) 0(0)

122
Table 6.4-3b. Mean (no. per 0.01 m2) and (standard error) for all taxa collected at P3B upper Town Creek sites during June 1999, 2000, 2001, 2002, 2003, 2004, 2005, and 2006. The means presented here represent the combination of two sub-sites for low intertidal areas. Low Intertidal June 99 June 00 June 01 June 02 June 03 June 04 June 05 June 06 Acarina spp. 0(0) 0(0) 0.25(0.25) 0(0) 0(0) 4.75(2.43) 0(0) 0(0) Amphipod sp. 0.33(0.21) 0(0) 0(0) 0(0) 0(0) 0(0) 0(0) 0(0) Apedilum sp. 0(0) 0(0) 0(0) 0(0) 0(0) 0.25(0.25) 0(0) 0(0) Cassidinidea lunifrons 0.17(0.17) 0(0) 0(0) 0.20(0.20) 0(0) 2.00(2.00) 0(0) 0(0) Chironomidae sp. 0(0) 0(0) 0(0) 0(0) 0.25(0.25) 0(0) 0(0) 0.25(0.25) Collembola sp. 0(0) 0(0) 0(0) 0.20(0.20) 0(0) 13.50(6.54) 0(0) 0(0) Coelotanypus sp. 0(0) 0(0) 0(0) 0(0) 0.25(0.25) 0(0) 0(0) 0(0) Corophium acutum 0(0) 0(0) 0.25(0.25) 0(0) 0(0) 0(0) 0(0) 0(0) Corophium lacustre 0(0) 0(0) 0.50(0.50) 0(0) 0(0) 0(0) 0.25(0.25) 0(0) Corophium volutator 0(0) 0(0) 0(0) 0(0) 0(0) 9.0(5.70) 0(0) 0.25(0.25) Cryptochironomous sp. 0(0) 0(0) 0(0) 0(0) 0.25(0.25) 0(0) 0(0) 0.25(0.25) Cyathura polita 0(0) 0.50(0.29) 0.25(0.25) 0.80(0.80) 0(0) 1.50(0.87) 0.50(0.29) 0.25(0.25) Dicrotendipes sp. 0.17(0.17) 0(0) 0(0) 0.20(0.20) 0(0) 0(0) 0(0) 0(0) Dolichopodidae sp. 0(0) 0.25(0.25) 0.25(0.25) 0(0) 0(0) 1.25(1.25) 0.25(0.25) 0(0) Enchytraeidae sp. 0(0) 0(0) 0(0) 0(0) 0(0) 1.00(1.00) 0(0) 0(0) Gammarus lawrencianus 0.83(0.83) 0(0) 0(0) 0(0) 0(0) 0(0) 0(0) 0(0) Gammarus tigrinus 1.83(1.83) 0(0) 0(0) 0(0) 0(0) 0(0) 0(0) 0(0) Gammarus sp. 0.17(0.17) 0(0) 0(0) 0.40(0.40) 0(0) 0(0) 0(0) 0(0) juv. Gastropod 0(0) 0(0) 0(0) 0(0) 0.25(0.25) 0(0) 0(0) 0(0) Goeldichironomus sp. 0(0) 0(0) 0(0) 0(0) 0(0) 0.25(0.25) 0(0) 0(0) Heteromastus filiformis 0.17(0.17) 0(0) 0(0) 0(0) 0(0) 0(0) 0(0) 0(0) Hobsonia florida 2.50(0.89) 0(0) 0.25(0.25) 0(0) 0(0) 0(0) 0(0) 0(0) insect pupae 0(0) 0(0) 0.25(0.25) 0(0) 0(0) 0(0) 0(0) 0(0) insect sp. 0(0) 0.25(0.25) 0(0) 0(0) 0(0) 0(0) 0(0) 0(0) Laeonereis culveri 0(0) 0.25(0.25) 0(0) 0(0) 0(0) 4.25(3.33) 0.75(0.48) 1.50(0.87) Limnodrilus hoffmeisteri 0(0) 0(0) 0(0) 0(0) 1.75(1.75) 0(0) 0(0) 0(0) (Limnophyes sp.) 0(0) 0(0) 0(0) 0(0) 0(0) 0(0) 0(0) 0.25(0.25) Lumbriculidae sp. 0(0) 0(0) 0(0) 0(0) 0(0) 0.25(0.25) 0(0) 0(0) Marenzelleria viridis 0.17(0.17) 0(0) 0(0) 0(0) 0(0) 0(0) 0(0) 0(0) Marinogammarus sp. 0.17(0.17) 0(0) 0(0) 0(0) 0(0) 0(0) 0(0) 0(0) Melita dentata 0(0) 0(0) 0(0) 0.20(0.20) 0(0) 0(0) 0(0) 0(0) Monopylephorus
irroratus 0(0) 0(0) 0(0) 0(0) 0(0) 0(0) 0.25(0.25) 0(0) Munna sp. 0.50(0.34) 0(0) 0(0) 0(0) 0(0) 0(0) 0(0) 0(0) Namalycastis sp. 0(0) 0(0) 0.25(0.25) 0(0) 0(0) 0(0) 0(0) 0(0) Nimbocera sp. 0.50(0.50) 0(0) 0(0) 0(0) 0(0) 0(0) 0(0) 0(0) Oligochaete 4.83(2.36) 39.30(13.90) 10.50(3.23) 0(0) 0(0) 0(0) 0(0) 0(0) Polydora ligni/cornuta 0(0) 0(0) 0.25(0.25) 0(0) 0(0) 0(0) 0(0) 0(0) Polydora socialis 0(0) 0(0) 0(0) 0.40(0.40) 0(0) 0(0) 0(0) 0(0) Polydora sp. 0.33(0.33) 0(0) 0(0) 0(0) 0(0) 0(0) 0(0) 0(0) Polypedilum sp. 0.67(0.49) 0(0) 0(0) 0(0) 1.50(0.96) 0(0) 0.75(0.48) 1.25(1.25) Procladius sp. 0.50(0.34) 0(0) 0(0) 0(0) 4.50(2.60) 0(0) 0(0) 0(0) Rhithropanapeus harisii 0(0) 0(0) 0(0) 0.20(0.20) 0(0) 0(0) 0(0) 0(0) Strictochironomus sp. 0(0) 0(0) 0(0) 0(0) 0.25(0.25) 0(0) 0(0) 0(0) Streblospio benedicti 0(0) 0(0) 0(0) 3.60(1.03) 0(0) 0(0) 0(0) 0(0) Tharyx sp. 0(0) 0(0) 0.25(0.25) 0(0) 0(0) 0(0) 0(0) 0(0) Tubificidae spp. 0(0) 0(0) 1.00(1.00) 6.60(2.01) 1.75(0.63) 50.25(29.71) 17.50(7.64) 117.00(26.57)Tubificoides
heterochaetus 0(0) 0(0) 0(0) 0.80(0.58) 0.50(0.50) 0(0) 0(0) 0(0) Uca minax 0(0) 0(0) 0(0) 0(0) 0(0) 0.75(0.48) 0(0) 0(0)

123
Table 6.4-4a. Mean (no. per 0.01 m2) and (standard error) for all taxa collected at the lowest main-stem Cape Fear site P6 during June 1999, 2000, 2001, 2002, 2003, 2004, 2005, and 2006. The means presented here represent the combination of two sub-sites for high intertidal areas.
High Intertidal June 99 June 00 June 01 June 02 June 03 June 04 June 05 June 06 Acarina spp. 0(0) 0(0) 0(0) 0(0) 0(0) 0.50(0.29) 0.75(0.48) 1.50(1.50) Anurida maritima 0(0) 0(0) 0(0) 0(0) 0(0) 0(0) 0(0) 17.25(7.05)Bezzia/Palpomyia 0.60(0.24) 0.25 (0.25) 0(0) 0.50(0.29) 6.75(4.01) 4.00(0.91) 3.50(1.55) 1.50(0.64) juv. Bivalve 0.20(0.20) 0(0) 0(0) 0(0) 0(0) 0.25(0.25) 0(0) 0(0) Cassidinidea lunifrons 1.00(1.00) 0(0) 0(0) 0(0) 0(0) 0.50(0.50) 0(0) 0(0) Chrysops sp. 0(0) 0(0) 0(0) 0.25(0.25) 1.00(1.00) 0(0) 0(0) 0(0) Collembola sp. 1.60(0.75) 0(0) 0(0) 1.00(0.41) 1.75(0.63) 0.75(0.25) 0.50(0.50) 1.00(0.71) Curculionidae sp. 0.40(0.40) 0(0) 0(0) 0(0) 0(0) 0.50(0.50) 0.25(0.25) 0(0) Cyathura (madelinae) 0.40(0.40) 0(0) 0(0) 0(0) 0(0) 0(0) 0(0) 0(0) Cyathura polita 0.80(0.58) 0(0) 0(0) 0(0) 0(0) 1.00(0.58) 0(0) 0(0) Dero sp. 0(0) 0(0) 0(0) 0(0) 0.25(0.25) 0(0) 0(0) 0(0) Diptera sp. 0(0) 0(0) 0(0) 0(0) 0.75(0.48) 0(0) 0.25(0.25) 0.50(0.29) Dolichopodidae sp. 0(0) 0.25 (0.25) 1.00(0.41) 0.25(0.25) 1.00(0.58) 1.00(0.41) 0.25(0.25) 0.25(0.25) Dolichopus sp. 0.80(0.80) 0(0) 0(0) 0(0) 0(0) 0(0) 0(0) 0(0) Enchytraeidae sp. 0(0) 0.50 (0.50) 0(0) 0.25(0.25) 0(0) 0(0) 0(0) 0(0) Endochironomus sp. 0(0) 0(0) 0(0) 0(0) 0(0) 0.25(0.25) 0(0) 0(0) Ephydridae sp. 0(0) 0(0) 0(0) 0(0) 0(0) 0.25(0.25) 0(0) 0(0) Eukiefferiella
(claripennis) 0.20(0.20) 0(0) 0(0) 0(0) 0(0) 0(0) 0(0) 0(0) juv. Gastropod 0.20(0.20) 0(0) 0(0) 0(0) 0.25(0.25) 0(0) 0(0) 0(0) Hemipodus roseus 0.80(0.80) 0(0) 1.75(0.85) 0(0) 0(0) 0(0) 0(0) 0(0) insect larva c 0.20(0.20) 0(0) 0(0) 0(0) 0(0) 0(0) 0(0) 0(0) insect sp. h 1.00(1.00) 0(0) 0(0) 0(0) 0(0) 0(0) 0(0) 0(0) insect sp. I 0.40(0.40) 0(0) 0(0) 0(0) 0(0) 0(0) 0(0) 0(0) Laeonereis culveri 3.20(2.03) 2.50(1.66) 0(0) 1.00(0.58) 0(0) 0(0) 1.75(1.03) 1.75(1.03) Lumbriculidae sp. 0(0) 0(0) 0(0) 2.25(2.25) 0(0) 0(0) 0.25(0.25) 0(0) Marenzelleria viridis 0(0) 0.25(0.25) 0(0) 0(0) 0(0) 0(0) 0(0) 0(0) Mesovelia sp. 0(0) 0(0) 0(0) 0(0) 0(0) 0(0) 0.25(0.25) 0(0) Microvelia sp. 0(0) 0(0) 0(0) 0(0) 0.25(0.25) 0(0) 0(0) 0(0) Monopylephorus
irroratus 0(0) 0(0) 0(0) 0(0) 4.00(3.67) 0(0) 6.25(5.01) 0(0) Namalycastis abiuma 0(0) 1.00(0.41) 0(0) 0(0) 0(0) 0(0) 0(0) 0(0) Nereidae sp. 0(0) 0(0) 0(0) 0(0) 0.50(0.50) 0(0) 0(0) 0(0) Oligochaete 9.60(4.84) 9.50(2.90) 6.00(4.06) 0(0) 0(0) 0(0) 0(0) 0(0) Orchestia sp. 1.20(1.00) 0(0) 0(0) 0(0) 0(0) 0(0) 0(0) 0(0) Orchestia uhleri 1.00(0.55) 0(0) 0(0) 0.25(0.25) 0(0) 0(0) 0(0) 0(0) (Ormosia sp.) 0(0) 0(0) 0(0) 0(0) 0(0) 0(0) 0(0) 0.25(0.25) Orthocladiinae sp. 0(0) 0(0) 0(0) 0(0) 0(0) 0.25(0.25) 0(0) 0(0) Parametriocnemus sp. 0(0) 0(0) 0(0) 0(0) 0(0) 1.00(1.00) 0(0) 0(0) Paratendipes sp. 0(0) 0(0) 0(0) 0(0) 0.25(0.25) 0(0) 0(0) 0(0) Polypedilum sp. 0(0) 0(0) 0(0) 0(0) 0.25(0.25) 0(0) 0(0) 0(0) Procladius sp. 0.20(0.20) 0(0) 0(0) 0(0) 0(0) 0(0) 0(0) 0(0) Sabellaria vulgaris
beauforteasis 0(0) 0(0) 0(0) 0(0) 0.25(0.25) 0(0) 0(0) 0(0) Sciomyzidae sp. 0(0) 0(0) 0(0) 0(0) 0(0) 0(0) 0.25(0.25) 0(0) Sthenelais sp. A 0(0) 0(0) 0(0) 0(0) 0.25(0.25) 0(0) 0(0) 0(0) Syrphidae 0(0) 0(0) 0.25(0.25) 0(0) 0(0) 0(0) 0(0) 0(0) Tubificidae spp. 0(0) 0(0) 0(0) 1.50(0.29) 19.75(6.34) 14.25(3.86) 13.25(5.51) 19.00(5.21)Tubificoides
heterochaetus 0(0) 0(0) 0(0) 0(0) 0.25(0.25) 1.00(1.00) 0(0) 0(0) Uca minax 0(0) 0(0) 0.25(0.25) 0.25(0.25) 0(0) 0(0) 0.50(0.50) 0(0) Uca pugilator 0.40(0.40) 0(0) 0(0) 0(0) 0(0) 0(0) 0.25(0.25) 0.25(0.25) Uca pugnax 0(0) 0(0) 0.25(0.25) 0(0) 0(0) 0(0) 0(0) 0(0) Uca sp. 0.20(0.20) 0(0) 0(0) 1.00(0.41) 0(0) 0(0) 0(0) 0(0)

124
Table 6.4-4b. Mean (no. per 0.01 m2) and (standard error) for all taxa collected at the lowest main-stem Cape Fear site P6 during June 1999, 2000, 2001, 2002, 2003 2004, 2005, and 2006. The means presented here represent the combination of two sub-sites for low intertidal areas. Low Intertidal June 99 June 00 June 01 June 02 June 03 June 04 June 05 June 06Acarina spp. 0.20(0.20) 0(0) 0(0) 0(0) 0(0) 0(0) 0.50(0.29) 0(0) Americhelidium
americanum 0(0) 0(0) 0(0) 0(0) 0(0) 0.25(0.25) 0(0) 0(0) amphipod sp. 0.80(0.58) 0(0) 0.40(0.40) 0(0) 0(0) 0(0) 0(0) 0(0) Anurida maritime 0(0) 0(0) 0(0) 0(0) 0(0) 0(0) 89.00(49.14) 0(0) Bezzia/Palpomyia 0.60(0.40) 0(0) 0.20(0.20) 0(0) 0.25(0.25) 0.50(0.29) 0.25(0.25) 0(0) juv. Bivalve 0.60(0.40) 0(0) 0(0) 0(0) 0(0) 0.25(0.25) 0(0) 0(0) Boccardiella sp. 0(0) 0(0) 0(0) 0(0) 0(0) 0(0) 0(0) 4.75(1.84)Capitellidae sp. 0(0) 0(0) 0(0) 0.20(0.20) 0(0) 0(0) 0(0) 0(0) Cassidinidea lunifrons 1.00(0.77) 0(0) 0(0) 0(0) 0(0) 0(0) 0(0) 0(0) Ceratopogonidae sp. 0(0) 0(0) 0(0) 0(0) 0(0) 0(0) 0(0) 0.75(0.75)Coelotanypus sp. 0(0) 0(0) 0(0) 0(0) 0.75(0.75) 0(0) 0(0) 0(0) Collembola sp. 0.20(0.20) 0(0) 0(0) 0(0) 0(0) 2.00(2.00) 3.75(2.39) 0.25(0.25)Cyathura polita 5.00(5.00) 0(0) 0(0) 0(0) 0(0) 0(0) 0(0) 0(0) Dicrotendipes sp. 0(0) 0(0) 0(0) 0(0) 0(0) 0(0) 0(0) 1.00(0.41)Dipolydora sp. 0(0) 0(0) 0(0) 0(0) 0(0) 0.25(0.25) 0(0) 0(0) Dolichopus sp. 0.20(0.20) 0(0) 0(0) 0(0) 0(0) 0(0) 0(0) 0(0) Dolichopodidae sp. 0(0) 0(0) 0(0) 0(0) 0(0) 0.25(0.25) 1.00(0.58) 0(0) Eukiefferiella (claripennis) 0.40(0.40) 0(0) 0(0) 0(0) 0(0) 0(0) 0(0) 0(0) Gammarus daiberi 0.20(0.20) 0(0) 0.20(0.20) 0(0) 0(0) 0(0) 0(0) 0(0) Gammarus sp. 0(0) 0(0) 0(0) 0(0) 0(0) 0.25(0.25) 0(0) 0(0) juv. Gastropod 0.40(0.24) 0(0) 0(0) 0(0) 0(0) 0(0) 0(0) 0(0) Hargeria rapax 0(0) 0(0) 0(0) 0(0) 0(0) 0(0) 0.25(0.25) 0(0) Hobsonia florida 0.20(0.20) 0(0) 0(0) 0(0) 0(0) 0(0) 0(0) 0.25(0.25)insect pupae 1.80(1.11) 0(0) 0(0) 0(0) 0(0) 0(0) 0(0) 0(0) insect sp. 0.20(0.20) 0(0) 0(0) 0(0) 0(0) 0(0) 0(0) 0(0) Laeonereis culveri 0(0) 0(0) 0(0) 0(0) 0(0) 0(0) 0.50(0.50) 0(0) Lumbriculidae sp. 0(0) 0(0) 0(0) 0(0) 0(0) 0(0) 1.50(0.87) 0(0) Marenzelleria viridis 0(0) 2.00(0.91) 3.80(1.16) 0(0) 0(0) 4.75(2.63) 0(0) 3.75(2.84)Melita sp. 1.00(1.00) 0(0) 0(0) 0(0) 0(0) 0(0) 0(0) 0(0) Munna sp. 1.00(1.00) 0(0) 0(0) 0(0) 0(0) 0(0) 0(0) 0(0) Nemertea sp. 0(0) 0(0) 0(0) 0.40(0.40) 0(0) 0(0) 0(0) 0(0) Oligochaete 49.60(18.89) 3.50(1.94) 1.00(0.55) 0(0) 0(0) 0(0) 0(0) 0(0) Parametriocnemus sp. 0(0) 0(0) 0(0) 0(0) 0(0) 0.25(0.25) 0(0) 0(0) Parandalia sp. 0(0) 0(0) 0(0) 0.40(0.24) 0.25(0.25) 0(0) 0(0) 0(0) Pectinaria gouldii 0(0) 0(0) 0(0) 0.20(0.20) 0(0) 0(0) 0(0) 0(0) Polydora socialis 2.60(2.60) 0(0) 0(0) 0(0) 0(0) 0(0) 0(0) 1.00(0.71)Polydora sp. 0(0) 0(0) 0(0) 0.20(0.20) 0(0) 0(0) 0(0) 0(0) Polypedilum sp. 0.40(0.40) 0(0) 0(0) 0(0) 0.50(0.29) 1.50(1.50) 0(0) 0.75(0.25)Procladius sp. 0.60(0.60) 0(0) 0(0) 0(0) 0(0) 0(0) 0(0) 0(0) Pyrrhalta sp. 0(0) 0(0) 0(0) 0(0) 0(0) 0(0) 0.25(0.25) 0(0) Streblospio benedicti 0(0) 0(0) 0(0) 0.40(0.40) 0(0) 0(0) 0(0) 0(0) Spirosperma sp. 0(0) 0(0) 0(0) 0(0) 0.25(0.25) 0(0) 0(0) 0(0) Tabanus sp. 0(0) 0(0) 0(0) 0(0) 0(0) 0(0) 0.25(0.25) 0(0) Tubificidae spp. 0(0) 0(0) 0(0) 0(0) 1.75(0.25) 10.0(5.29) 9.50(4.42) 6.25(1.49)Tubificoides heterochaetus 0(0) 0(0) 0(0) 3.80(2.33) 0(0) 0.50(0.29) 0(0) 0.25(0.25)Uca sp. 0.40(0.40) 0(0) 0(0) 0(0) 0(0) 0(0) 0(0) 0(0)

125
Table 6.4-5a. Mean (no. per 0.01 m2) and (standard error) for all taxa collected at P7 on the main-stem Cape Fear during June 1999, 2000, 2001, 2002, 2003, 2004, 2005, and 2006. The means presented here represent the combination of two sub-sites for high intertidal areas. High Intertidal June 99 June 00 June 01 June 02 June 03 June 04 June 05 June 06 Acarina spp. 0(0) 0.20(0.20) 0(0) 0(0) 0(0) 1.00(0.71) 0(0) 0.75(0.75) Anurida maritima 0(0) 0(0) 0(0) 0(0) 0(0) 0(0) 0(0) 0.25(0.25) Asellus sp. 0(0) 0(0) 0(0) 0(0) 0(0) 0(0) 17.50(8.66) 2.00(2.00) Bezzia/Palpomyia 0.20(0.20) 0(0) 0.17(0.17) 0(0) 2.25(1.03) 0(0) 1.25(0.95) 1.25(0.48) juv. Bivalve 0(0) 0.20(0.20) 0.17(0.17) 0(0) 2.00(0.82) 0.25(0.25) 0.25(0.25) 0.25(0.25) Cassidinidea lunifrons 0(0) 0(0) 1.00(0.52) 0(0) 0.25(0.25) 0.75(0.75) 0(0) 0(0) Celina sp. 0.20(0.20) 0(0) 0(0) 0(0) 0(0) 0(0) 0(0) 0(0) Chironomidae sp. 0(0) 0(0) 0(0) 0(0) 0(0) 0(0) 0.25(0.25) 0(0) Chironomus sp. 0(0) 0(0) 0.17(0.17) 0(0) 0(0) 0(0) 0(0) 0(0) Chrysops sp. 0.20(0.20) 0(0) 0(0) 0(0) 0(0) 0(0) 0(0) 0(0) Collembola sp. 0.40(0.24) 1.20(0.80) 0(0) 0.17(0.17) 0(0) 0.50(0.29) 1.00(0.71) 0.50(0.50) Corophium acherusicum 0(0) 0(0) 0.17(0.17) 0(0) 0(0) 0(0) 0(0) 0(0) Corophium sp. 0(0) 0(0) 0.50(0.50) 0(0) 0(0) 0(0) 0(0) 0(0) Corophium volutator 0(0) 0(0) 0.67(0.67) 0(0) 0(0) 0(0) 0.25(0.25) 0(0) Crangonyx pseudogracilis 0(0) 0(0) 0(0) 0(0) 0(0) 0(0) 0(0) 0.75(0.75) Cryptochironomus sp. 0.20(0.20) 0(0) 0(0) 0(0) 1.00(0.58) 0(0) 0(0) 0(0) Cyathura (madelinae) 0.40(0.40) 0(0) 0(0) 0(0) 0.25(0.25) 0(0) 0(0) 0(0) Cyathura polita 0(0) 0.20(0.20) 3.67(1.02) 0(0) 0(0) 0(0) 0.25(0.25) 0(0) Diptera sp. 0(0) 0(0) 0(0) 0(0) 0(0) 0(0) 0.25(0.25) 0.25(0.25) Dolichopodidae sp. 0(0) 1.60(0.24) 0.50(0.50) 0(0) 0(0) 1.00(0.71) 0.25(0.25) 2.25(0.75) Dolichopus sp. 1.60(0.51) 0(0) 0(0) 0(0) 0(0) 0(0) 0(0) 0(0) Enchytraeidae sp. 0(0) 0(0) 0(0) 0(0) 0(0) 0.25(0.25) 0(0) 0(0) Erioptera sp. 0(0) 0(0) 0(0) 0(0) 0(0) 3.75(1.75) 0(0) 0.25(0.25) Gammarus diaberi 0(0) 0(0) 4.00(4.00) 0(0) 0(0) 0(0) 0(0) 0(0) Gammarus sp. 0(0) 0(0) 0.67(0.67) 0(0) 0(0) 0(0) 0(0) 0(0) juv. Gastropod 0.20(0.20) 0(0) 0(0) 0(0) 0(0) 0(0) 0.25(0.25) 0(0) (Georthocladius sp.) 0(0) 0(0) 0(0) 0(0) 0(0) 0.25(0.25) 0(0) 0(0) Hargeria rapax 0(0) 0(0) 0(0) 0(0) 0(0) 0.25(0.25) 0(0) 0(0) Hobsonia florida 0(0) 0.20(0.20) 0.17(0.17) 0.17(0.17) 0(0) 0(0) 0(0) 0(0) insect larvae 0(0) 0.40(0.40) 0(0) 0(0) 0(0) 0(0) 0(0) 0(0) insect pupae 0.20(0.20) 0(0) 0(0) 0(0) 0(0) 0(0) 0(0) 0(0) insect sp. 0(0) 0(0) 0.67(0.49) 0(0) 0(0) 0(0) 0(0) 0(0) Isochaetides sp. 0(0) 0(0) 0(0) 0(0) 0(0) 0(0) 0(0) 2.00(1.68) isopod sp. 0(0) 0(0) 0.17(0.17) 0(0) 0(0) 0(0) 0(0) 0(0) Laeonereis culveri 0(0) 0(0) 0(0) 0(0) 0(0) 0(0) 1.25(0.95) 2.00(1.68) Limnodrilus hoffmeisteri 0(0) 0(0) 0(0) 0(0) 11.50(3.75) 0(0) 0(0) 0(0) (Limnophyes sp.) 0(0) 0(0) 0(0) 0(0) 0(0) 0(0) 0(0) 0.75(0.75) Lirceus sp. 1.40(1.20) 0(0) 0.67(0.67) 0(0) 0(0) 0(0) 0(0) 0(0) Lumbriculidae sp. 7.40(3.33) 1.00(1.00) 0.33(0.21) 0.17(0.17) 0(0) 17.25(6.70) 4.50(2.06) 3.25(2.14) (Lumbriculidae sp.) 0(0) 0(0) 0(0) 0(0) 0(0) 0(0) 0(0) 1.75(1.03) Megalops spp. 0(0) 0(0) 0(0) 0(0) 0(0) 0.25(0.25) 0(0) 0(0) Micropsectra sp. 0.80(0.37) 0(0) 0(0) 0(0) 0(0) 0(0) 0(0) 0(0) Microtendipes (rydalensis grp.) 0(0) 0(0) 0(0) 0(0) 0.25(0.25) 0(0) 0(0) 0(0) Nemertea sp. 0(0) 0(0) 0(0) 0(0) 0.50(0.50) 0(0) 0(0) 0(0) (Netamelita sp.) 0(0) 0(0) 0(0) 0(0) 0(0) 0(0) 0(0) 1.25(1.25) Noteridae sp. 0(0) 0(0) 0(0) 0(0) 0(0) 0(0) 0.25(0.25) 0(0) Oligochaete 52.20(15.47) 64.20(23.70) 20.17(10.29) 0(0) 0.50(0.50) 0(0) 0(0) 0(0) Omisus sp. 0(0) 0(0) 1.83(1.83) 0(0) 0(0) 0(0) 0(0) 0(0) Orchestia (platensis) 0.20(0.20) 0(0) 0(0) 0(0) 0(0) 0(0) 0(0) 0(0) Orchestia uhleri 0.60(0.60) 0(0) 0(0) 0(0) 0(0) 0.25(0.25) 0.25(0.25) 1.00(1.00) Orchestia sp. 0(0) 0(0) 0.17(0.17) 0(0) 0(0) 0(0) 0(0) 0(0) Orthocladiinae sp. 0(0) 0(0) 0(0) 0(0) 0(0) 0(0) 0.25(0.25) 0(0) Parametriocnemus sp. 0(0) 0(0) 0(0) 0(0) 0(0) 0.50(0.50) 0(0) 0(0) Paratendipes sp. 0(0) 0(0) 1.83(1.64) 0(0) 0(0) 0(0) 13.50(10.44) 1.25(0.75) Peloscolex sp. 0(0) 0(0) 0(0) 0(0) 0(0) 5.50(3.57) 7.75(4.70) 0(0) (Peloscolex sp.) 0(0) 0(0) 0(0) 0(0) 0(0) 0(0) 23.25(18.59) 0(0) Polypedilum sp. 0(0) 0(0) 0.17(0.17) 0(0) 6.75(2.84) 0.25(0.25) 0(0) 0(0) Pristinella sp. 0.40(0.40) 0(0) 0(0) 0(0) 0(0) 0(0) 0(0) 0(0) Spionidae sp. 0(0) 0(0) 0(0) 0.17(0.17) 0(0) 0(0) 0(0) 0(0) Spirosperma carolinensis 0(0) 0(0) 0.83(0.83) 0(0) 0(0) 0(0) 0(0) 10.75(4.30)Spirosperma sp. 0(0) 0(0) 0(0) 0(0) 1.00(0.58) 0(0) 0(0) 0(0) Staphylinidae sp. 0(0) 0(0) 0(0) 0.17(0.17) 0(0) 0(0) 0(0) 0(0) Stictochironomus sp. 0(0) 0(0) 0(0) 0(0) 0.25(0.25) 0(0) 0(0) 0(0) Tabanus sp. 0.20(0.20) 0(0) 0(0) 0(0) 0(0) 0(0) 0(0) 0(0)

High Intertidal June 99 June 00 June 01 June 02 June 03 June 04 June 05 June 06 0(0) Tanytarsus sp. 0(0) 0.20(0.20) 0(0) 0(0) 0(0) 0.50(0.50) 0(0)
Tubificidae spp. 0(0) 0(0) 3.17(2.01) 24.5(5.36) 104.00(30.6) 13.75(3.57) 33.75(18.08) 22.50(5.20)Tubificoides heterochaetus 0.20(0.20) 0(0) 0(0) 0(0) 0(0) 0(0) 0(0) 0(0)
0(0) Uca pugilator 0.40(0.40) 0(0) 0(0) 0(0) 0(0) 0(0) 0(0) Uca sp. 0(0) 0(0) 0.33(0.33) 0(0) 0(0) 0(0) 0.50(0.29) 0(0)
126

127
Table 6.4-5b. Mean (no. per 0.01 m2) and (standard error) for all taxa collected at P7 on the main-stem Cape Fear during June 1999, 2000, 2001, 2002, 2003, 2004, 2005, and 2006. The means presented here represent the combination of two sub-sites for low intertidal areas. Low Intertidal June 99 June 00 June 01 June 02 June 03 June 04 June 05 June 06 Acarina spp. 0(0) 0(0) 0(0) 0(0) 0(0) 0.25(0.25) 0.25(0.25) 0.50(0.50) Anurida maritima 0(0) 0(0) 0(0) 0(0) 0(0) 0(0) 0(0) 0.25(0.25) Arcteonais lomondi 0(0) 0(0) 0(0) 0(0) 0.40(0.24) 0(0) 0(0) 0(0) Asellus sp. 0(0) 0(0) 0(0) 0(0) 0(0) 0(0) 0(0) 0.25(0.25) Aulodrilus pluriseta 0(0) 0(0) 0(0) 0(0) 0.20(0.20) 0(0) 0(0) 0(0) Batea cathariensis 0(0) 0(0) 0.17(0.17) 0(0) 0(0) 0(0) 0(0) 0(0) Bezzia/Palpomyia 0.20(0.20) 0(0) 0(0) 0.17(0.17) 3.80(2.58) 1.75(0.48) 0(0) 0.25(0.25) juv. Bivalve 0.60(0.40) 0.25(0.25) 0(0) 0.17(0.17) 0.40(0.40) 0.25(0.25) 0.50(0.50) 0.50(0.29) Cassidinidea lunifrons 0.60(0.24) 0(0) 0(0) 0(0) 0(0) 0.50(0.50) 0(0) 0.50(0.50) Chironomidae sp. 0(0) 0(0) 0(0) 0(0) 0.20(0.20) 0(0) 0(0) 0(0) Chironomus sp. 0.20(0.20) 0(0) 0(0) 0(0) 0.20(0.20) 0(0) 0(0) 0(0) Chrysops sp. 0(0) 0(0) 0(0) 0(0) 0(0) 0.25(0.25) 0(0) 0(0) Cladotanytarsus sp. 0(0) 0(0) 0(0) 0(0) 0.40(0.40) 0(0) 0(0) 0(0) Coelotanypus sp. 0(0) 0(0) 0(0) 0.17(0.17) 2.00(1.05) 0(0) 0(0) 0(0) Collembola sp. 0(0) 0(0) 0(0) 0(0) 0(0) 0.50(0.29) 0(0) 0(0) Corophium volutator 0(0) 0(0) 0(0) 0(0) 0.20(0.20) 0(0) 0.25(0.25) 0(0) Cryptochironomous sp. 0.60(0.60) 0(0) 0(0) 0(0) 2.00(0.89) 0.75(0.25) 0(0) 0(0) Cryptotendipes sp. 0(0) 0(0) 0(0) 0(0) 0.40(0.40) 0(0) 0(0) 0(0) Cyathura (madelinae) 0.40(0.24) 0(0) 0(0) 0(0) 0(0) 0(0) 0(0) 0(0) Cyathura polita 0(0) 0.50(0.29) 0.67(0.49) 0(0) 0(0) 0.25(0.25) 1.50(0.87) 1.25(0.95) Dicrotendipes sp. 0(0) 0(0) 0(0) 0(0) 0(0) 0(0) 0(0) 0.25(0.25) Diptera sp. 0(0) 0(0) 0(0) 0(0) 0(0) 0(0) 0(0) 0.25(0.25) Dispio uncinata 0(0) 0.25(0.25) 0(0) 0(0) 0(0) 0(0) 0(0) 0(0) Dolichopodidae sp. 0(0) 0.25(0.25) 0.67(0.67) 0(0) 0(0) 0.50(0.29) 0.75(0.48) 0(0) Dolichopus sp. 0.20(0.20) 0(0) 0(0) 0(0) 0(0) 0(0) 0(0) 0(0) Gammarus daiberi 0.20(0.20) 0(0) 0(0) 0(0) 0(0) 0(0) 0(0) 0(0) Gammarus tigrinus 0.60(0.40) 0(0) 0(0) 0(0) 0(0) 0(0) 0(0) 0(0) Dero sp. 0(0) 0(0) 0(0) 0(0) 0.80(0.80) 0(0) 0(0) 0(0) juv. Gastropod 1.00(0.45) 0(0) 0(0) 0(0) 0(0) 0.25(0.25) 0(0) 0(0) insect larvae 0(0) 0(0) 0.33(0.33) 0(0) 0(0) 0(0) 0(0) 0(0) insect pupae 0.40(0.24) 0(0) 0(0) 0(0) 0(0) 0(0) 0(0) 0(0) insect sp. 0(0) 0(0) 0.33(0.21) 0(0) 0(0) 0(0) 0(0) 0(0) insect sp. a 0.40(0.24) 0(0) 0(0) 0(0) 0(0) 0(0) 0(0) 0(0) Isochaetides sp. 0(0) 0(0) 0.50(0.50) 0(0) 0(0) 0(0) 0(0) 0(0) isopod sp. 0(0) 0.25(0.25) 0(0) 0(0) 0(0) 0(0) 0(0) 0(0) Laeonereis culveri 0(0) 0.25(0.25) 0(0) 0(0) 0(0) 0(0) 1.25(0.95) 0.50(0.29) Limnodrilus
hoffmeisteri 0(0) 0(0) 0.50(0.50) 0(0) 2.80(1.16) 0(0) 0(0) 0(0) Lumbriculidae sp. 0(0) 4.00(4.00) 0.83(0.54) 0(0) 0(0) 0(0) 4.00(1.22) 3.00(1.00) (Lumbriculidae sp.) 0(0) 0(0) 0(0) 0(0) 0(0) 0(0) 0(0) 0.25(0.25) Megalops spp. 0.20(0.20) 0(0) 0(0) 0(0) 0(0) 0.25(0.25) 0(0) 0(0) Nereidae sp. 0(0) 0(0) 0(0) 0(0) 0(0) 0(0) 0.25(0.25) 0(0) Oligochaete 17.80(4.55) 64.00(19.63) 46.83(25.24) 0(0) 0(0) 0(0) 0(0) 0(0) Orchestia sp. 0(0) 0(0) 0.17(0.17) 0(0) 0(0) 0(0) 0(0) 0(0) Parametriocnemus sp. 0(0) 0(0) 0(0) 0(0) 0(0) 0.25(0.25) 0(0) 0(0) Paratendipes sp. 0.20(0.20) 1.50(1.19) 0(0) 0(0) 0(0) 1.00(1.00) 2.00(1.08) 0.50(0.50) Peloscolex sp. 0(0) 0(0) 0(0) 0(0) 0(0) 0.25(0.25) 1.50(0.96) 0(0) Polypedilum sp. 1.00(1.00) 1.25(0.48) 0.33(0.33) 0(0) 2.00(0.84) 0.75(0.75) 1.00(0.71) 0(0) Procladius sp. 0.20(0.20) 0(0) 0(0) 0(0) 1.60(0.40) 0(0) 0(0) 0(0) Saetheria sp. 0(0) 0(0) 0(0) 0(0) 0.20(0.20) 0(0) 0(0) 0(0) Spionidae sp. 0(0) 0.25(0.25) 0(0) 0(0) 0(0) 0(0) 0(0) 0(0) Spirosperma
carolinensis 0(0) 0(0) 0.33(0.33) 0(0) 0(0) 0(0) 0(0) 0.50(0.50) Tanytarsus sp. 0(0) 0(0) 0(0) 0(0) 0.40(0.24) 0(0) 0(0) 0.25(0.25) Tubificidae spp. 0(0) 0(0) 8.50(5.38) 11.00(3.34) 48.20(6.85) 24.50(3.23) 38.00(12.86) 60.50(16.78)

128
Table 6.4-6a. Mean (no. per 0.01 m2) and (standard error) for all taxa collected at P8 on the main-stem Cape Fear during June 1999, 2000, 2001, 2002, 2003, 2004, 2005, and 2006. The means presented here represent the combination of two sub-sites for high intertidal areas. High Intertidal June 99 June 00 June 01 June 02 June 03 June 04 June 05 June 06 Acarina spp. 0.17(0.17) 0(0) 0(0) 0(0) 0(0) 0(0) 0.20(0.20) 0(0) Anurida maritima 0(0) 0(0) 0(0) 0(0) 0(0) 0(0) 0(0) 2.00(1.15) Aulodrilus paucichaeta 0(0) 0(0) 0(0) 0(0) 0(0) 0(0) 0.20(0.20) 0(0) Bezzia/Palpomyia 0.33(0.33) 0.75 (0.25) 0.33(0.21) 0(0) 0(0) 1.00(0.00) 0(0) 0(0) juv. Bivalve 11.17(4.32) 23.50(8.51) 5.17(1.82) 0.60(0.40) 2.00(1.15) 18.50(1.16) 0.20(0.20) 1.00(0.58) Branchiura sowerbyi 0(0) 0(0) 0(0) 0(0) 0.25(0.25) 0(0) 0(0) 0(0) Cassidinidea lunifrons 0(0) 0(0) 0(0) 0.40(0.24) 0(0) 0(0) 0(0) 0(0) Coelotanypus sp. 0(0) 0(0) 0(0) 0(0) 0.25(0.25) 0(0) 0(0) 0(0) Coleoptera sp. 0.33(0.33) 0(0) 0(0) 0(0) 0(0) 0(0) 0(0) 0(0) Collembola sp. 1.50(0.43) 6.50(2.53) 0.33(0.21) 0(0) 0(0) 0.75(0.75) 0(0) 0(0) Cryptochironomus sp. 0(0) 0(0) 0(0) 0(0) 0.25(0.25) 0(0) 0(0) 0(0) Curculionidae sp. 0(0) 0(0) 0(0) 0(0) 0(0) 0(0) 0.20(0.20) 0(0) Cyathura polita 0(0) 0(0) 0(0) 0.60(0.40) 0(0) 0(0) 0(0) 0(0) Dero sp. 0(0) 0(0) 0(0) 0(0) 0.25(0.25) 0(0) 0(0) 0(0) Diptera sp. 0(0) 0(0) 0(0) 0(0) 0(0) 0(0) 0(0) 0.50(0.50) Dolichopodidae sp. 0(0) 6.50(2.33) 0.67(0.49) 0.40(0.40) 0.50(0.50) 0.75(0.75) 0.40(0.40) 2.50(1.19) Dolichopus sp. 2.17(.75) 0(0) 0(0) 0(0) 0(0) 0(0) 0(0) 0(0) Enchytraeidae sp. 0(0) 0.25(0.25) 0(0) 0(0) 0.25(0.25) 0.75(0.75) 0(0) 0(0) Erpobdella sp. 0(0) 0.25(0.25) 0(0) 0(0) 0(0) 0(0) 0(0) 0(0) Erioptera sp. 0(0) 0(0) 0(0) 0(0) 0(0) 1.50(1.19) 0(0) 0(0) Fabriciola trilobata 0(0) 0(0) 0(0) 0(0) 0(0) 0.75(0.75) 0(0) 0(0) Gammarus tigrinus 1.33(1.33) 0(0) 0(0) 0(0) 0(0) 0(0) 0(0) 0(0) juv. Gastropod 0.50(0.34) 0(0) 0(0) 0(0) 0(0) 0(0) 0(0) 1.25(0.63) Hydaticus larvae 0.33(0.21) 0(0) 0(0) 0(0) 0(0) 0(0) 0(0) 0(0) Hydrobia sp. 0(0) 0(0) 0.17(0.17) 0(0) 0(0) 0(0) 0(0) 0(0) Hydrophilidae larvae 0(0) 0.25(0.25) 0(0) 0(0) 0(0) 0(0) 0(0) 0(0) insect larvae 0(0) 0(0) 1.33(0.88) 0(0) 0(0) 0(0) 0(0) 0(0) insect pupae 0(0) 0(0) 0.83(0.31) 0(0) 0(0) 0(0) 0(0) 0(0) insect sp. 0.17(0.17) 0(0) 0.17(0.17) 0(0) 0(0) 0(0) 0.20(0.20) 1.25(0.75) Isochaetides sp. 0(0) 0(0) 0(0) 0(0) 0(0) 0(0) 0(0) 2.25(2.25) Limnodrilus hoffmeisteri 0(0) 0(0) 0(0) 0(0) 1.00(0.71) 0(0) 0(0) 0(0) Lumbriculidae sp. 5.00(2.89) 2.00(2.00) 0(0) 1.40(0.75) 0.25(0.25) 4.00(2.83) 4.00(1.70) 3..25(2.63) (Lumbriculidae sp.) 0(0) 0(0) 0(0) 0(0) 0(0) 0(0) 0(0) 1.25(0.75) Micropsectra sp. 3.17(3.17) 0(0) 0(0) 0(0) 0(0) 0(0) 0(0) 0(0) Neanthes succinea 0(0) 0(0) 0(0) 0(0) 0.25(0.25) 0(0) 0(0) 0(0) Nemertea sp. 0(0) 0(0) 0.33(0.21) 0(0) 0.25(0.25) 0(0) 0(0) 0.25(0.25) Oligochaete 73.5(14.07) 180.25(37.14) 44.17(11.32) 0(0) 0(0) 0(0) 0(0) 0(0) Omisus sp. 0(0) 0(0) 0(0) 0.60(0.60) 0(0) 0(0) 0(0) 0(0) Orchestia sp. 0(0) 0(0) 5.50(1.57) 0.20(0.20) 0(0) 0(0) 0(0) 0(0) Orchestia uhleri 3.50(1.48) 2.50(1.50) 0(0) 1.00(1.00) 0(0) 0.59(0.50) 2.60(1.03) 1.25(0.48) Oribatei sp. 0(0) 0(0) 0(0) 0.20(0.20) 0(0) 0(0) 0(0) 0(0) Parametriocnemus sp. 0(0) 0(0) 0(0) 0(0) 0(0) 0.25(0.25) 0(0) 0(0) Paratendipes sp. 0(0) 5.75(2.69) 0(0) 0(0) 1.50(1.19) 0.75(0.48) 0(0) 0(0) Paratendipes subaequalis 0(0) 0(0) 0(0) 0.20(0.20) 0(0) 0(0) 0(0) 0(0) Peloscolex sp. 0(0) 0(0) 0(0) 0(0) 0(0) 0.75(0.48) 6.00(5.02) 0(0) (Peloscolex sp.) 0(0) 0(0) 0(0) 0(0) 0(0) 0(0) 1.50(1.50) 0(0) Pericoma sp. 0(0) 0(0) 0(0) 0(0) 0(0) 3.00(1.22) 0(0) 4.50(2.22) Polypedilum sp. 0.17(0.17) 2.75(2.43) 0.17(0.17) 0.20(0.20) 3.00(1.41) 0(0) 0(0) 0(0) Rheotanytarsus sp. 0.33(0.33) 0.50(0.50) 0(0) 0(0) 0(0) 0(0) 0(0) 0(0) Spirosperma carolinensis 0(0) 0(0) 0(0) 0(0) 0(0) 0(0) 0(0) 7.75(2.93) Spirosperma sp. 0(0) 0(0) 0(0) 0(0) 0.25(0.25) 0(0) 0(0) 0(0) Stratiomya sp. 0.17(0.17) 0(0) 0(0) 0(0) 0(0) 0(0) 0(0) 0(0) Tabanus sp. 0(0) 0(0) 0.17(0.17) 0(0) 0(0) 0(0) 0(0) 0(0) Tanais sp. 0(0) 0(0) 0.17(0.17) 0(0) 0(0) 0(0) 0(0) 0(0) Tanytarsus sp. 1.00(1.00) 7.50(2.99) 0.17(0.17) 0(0) 0(0) 1.75(1.03) 0(0) 0(0) Telmatoscopus sp. 0(0) 0(0) 0(0) 0(0) 0(0) 0(0) 4.20(3.29) 0(0) Tipula sp. 0(0) 0(0) 0(0) 0.20(0.20) 0(0) 0.50(0.50) 0(0) 0(0) Tipulidae sp. 0(0) 0.25(0.25) 0(0) 0(0) 0(0) 0.75(0.48) 0(0) 1.00(1.00) Tubificidae spp. 0(0) 0(0) 0(0) 19.40(9.14) 128.00(39.51) 63.25(16.14) 75.20(18.92) 47.75(8.38)Tubificoides heterochaetus 0.17(0.17) 0(0) 0(0) 1.00(1.00) 0.25(0.25) 0(0) 0.40(0.40) 0(0) Uca pugilator 0.17(0.17) 0.50(0.50) 0(0) 0(0) 0(0) 0(0) 0(0) 0.25(0.25) Uca pugnax 0(0) 0(0) 0.17(0.17) 0(0) 0(0) 0(0) 0(0) 0(0) Uca sp. 0(0) 0.25(0.25) 0(0) 0(0) 0(0) 0(0) 0(0) 0(0)

129
Table 6.4-6b. Mean (no. per 0.01 m2) and (standard error) for all taxa collected at P8 on the main-stem Cape Fear during June 1999, 2000, 2001, 2002, 2003, 2004, 2005, and 2006. The means presented here represent the combination of two sub-sites for low intertidal areas. Low Intertidal June 99 June 00 June 01 June 02 June 03 June 04 June 05 June 06Anurida maritima 0(0) 0(0) 0(0) 0(0) 0(0) 0(0) 0.40(0.24) 0.50(0.50)Apedilum sp. 0(0) 0(0) 0(0) 0(0) 0(0) 0.75(0.75) 0(0) 0(0) Armadillidium quadrifrons 0(0) 0(0) 0(0) 0.25(0.25) 0(0) 0(0) 0(0) 0(0) Bezzia/Palpomyia 0.33(0.33) 0(0) 0.33(0.21) 0.75(0.48) 1.00(0.58) 0.25(0.25) 0.20(0.20) 0(0) juv. Bivalve 1.67(0.56) 5.75(4.46) 1.83(0.31) 0.25(0.25) 1.00(0.71) 0.25(0.25) 1.20(0.37) 1.25(0.75)Branchiura sowerbyi 0(0) 0(0) 0(0) 0(0) 1.00(0.71) 0(0) 0(0) 0(0) Cassidinidea lunifrons 0.83(0.83) 0(0) 0(0) 0(0) 0(0) 0(0) 0(0) 0.25(0.25)Chironomus sp. 0(0) 0(0) 0(0) 0(0) 0(0) 0.25(0.25) 0(0) 0(0) Coelotanypus sp. 0(0) 0(0) 0(0) 0.25(0.25) 0.75(0.48) 0(0) 0(0) 0(0) Collembola sp. 0.17(0.17) 0.25(0.25) 1.00(1.00) 0(0) 0(0) 3.75(3.09) 0(0) 0(0) Corophium lacustre 0(0) 0(0) 0(0) 0(0) 0(0) 0(0) 0.20(0.20) 0.25(0.25)Corophium acherusicum 0(0) 0(0) 3.33(0.99) 0(0) 0(0) 0(0) 0(0) 0(0) Corophium sp. 0(0) 0(0) 0.17(0.17) 0(0) 0(0) 0(0) 0(0) 0(0) Corophium volutator 0(0) 0(0) 0(0) 0(0) 0(0) 0(0) 5.00(2.88) 0(0) Cryptochironomous sp. 0.33(0.33) 0.25(0.25) 0(0) 0(0) 0(0) 0(0) 0(0) 0(0) Cyathura (madelinae) 0.67(0.67) 0.75(0.75) 0(0) 0(0) 0(0) 0(0) 0(0) 0(0) Cyathura polita 0(0) 0(0) 1.50(0.56) 0.25(0.25) 0(0) 0(0) 0(0) 0(0) Dolichopodidae sp. 0(0) 0.75(0.25) 0.67(0.33) 0(0) 0.25(0.25) 2.50(0.64) 0.80(0.20) 1.50(0.64)Dolichopus sp. 1.00(0.82) 0(0) 0(0) 0(0) 0(0) 0(0) 0(0) 0(0) Gammarus tigrinus 1.50(1.15) 0(0) 0(0) 0(0) 0(0) 0(0) 0(0) 0(0) juv. Gastropod 0.17(0.17) 0.50(0.50) 1.00(0.68) 0.50(0.50) 0(0) 0.25(0.25) 0(0) 0(0) Goeldichironomus sp. 0(0) 0(0) 0(0) 0(0) 0(0) 0.50(0.50) 0(0) 0(0) insect pupae 0(0) 0.25(0.25) 0(0) 0(0) 0(0) 0(0) 0(0) 0(0) insect sp. 0(0) 0(0) 0.17(0.17) 0(0) 0(0) 0(0) 0(0) 0(0) insect sp. b 0.17(0.17) 0(0) 0(0) 0(0) 0(0) 0(0) 0(0) 0(0) isopod sp. 0(0) 0(0) 0.83(0.65) 0(0) 0(0) 0(0) 0(0) 0(0) Laeonereis culveri 0(0) 0(0) 0(0) 0(0) 0(0) 0(0) 0(0) 0.25(0.25)Leptochelia sp. 0(0) 0(0) 1.00(0.71) 0(0) 0(0) 0(0) 0(0) 0(0) Limnodrilus hoffmeisteri 0(0) 0(0) 0(0) 0(0) 6.25(5.92) 0(0) 0(0) 0(0) Lumbriculidae sp. 3.00(1.61) 1.50(1.19) 0(0) 0(0) 0(0) 5.00(2.61) 3.80(1.46) 7.25(6.60)(Lumbriculidae sp.) 0(0) 0(0) 0(0) 0(0) 0(0) 0(0) 0(0) 1.25(0.75)Megalops spp. 0.17(0.17) 0(0) 0(0) 0(0) 0(0) 0.25(0.25) 0(0) 0(0) Micropsectra sp. 0.17(0.17) 0(0) 0(0) 0(0) 0(0) 0(0) 0(0) 0(0) Namalycastis sp. 0(0) 0(0) 0.80(1.00) 0(0) 0(0) 0(0) 0(0) 0(0) Oligochaete 122.83(31.34) 103.00(16.91) 63.00(67.60) 0(0) 0(0) 0.25(0.25) 0(0) 0(0) Orchestia sp. 0(0) 0(0) 57.00(21.70) 0(0) 0(0) 0(0) 0(0) 0(0) Orchestia uhleri 0(0) 0.75(0.48) 0(0) 0(0) 0(0) 0(0) 0.40(0.24) 0(0) Orthocladiinae sp. 0(0) 0(0) 0(0) 0(0) 0(0) 0.75(0.75) 0(0) 0(0) Palaemontes pugio 0(0) 0.50(0.50) 0(0) 0(0) 0(0) 0(0) 0(0) 0(0) Parametriocnemus sp. 0(0) 0(0) 0(0) 0(0) 0(0) 0.25(0.25) 0(0) 0(0) Paratendipes sp. 0.17(0.17) 1.00(0.58) 0(0) 0(0) 0(0) 0.50(0.50) 0.60(0.60) 0.25(0.25)Peloscolex sp. 0(0) 0(0) 0(0) 0(0) 0(0) 0(0) 0.20(0.20) 0(0) Polypedilum haterale 2.33(2.33) 0(0) 0(0) 0(0) 0(0) 0(0) 0(0) 0(0) Polypedilum sp. 1.33(0.56) 3.00(1.58) 2.50(2.40) 0(0) 0(0) 0(0) 0(0) 0(0) Pristinella sp. 0.67(0.67) 0(0) 0(0) 0(0) 0(0) 0(0) 0(0) 0(0) Procladius sp. 0(0) 0(0) 0.30(0.50) 0(0) 1.00(0.71) 0(0) 0(0) 0(0) Rheotanytarsus sp. 0.17(0.17) 0(0) 0(0) 0(0) 0(0) 0(0) 0(0) 0(0) Spirosperma sp. 0(0) 0(0) 0(0) 0(0) 0.25(0.25) 0(0) 0(0) 0(0) Tanytarsus sp. 0.33(0.33) 1.00(1.00) 0(0) 0(0) 0(0) 0(0) 0(0) 0(0) Tipulidae sp. 0(0) 0(0) 0(0) 0(0) 0(0) 0.75(0.75) 0(0) 0(0) Tribelos sp. 0.33(0.33) 0.25(0.25) 0(0) 0(0) 0(0) 0(0) 0(0) 0(0) Tubificidae spp. 0(0) 0(0) 0(0) 6.50(2.06) 57.25(32.77) 129.50(47.23) 70.60(17.64) 37.25(3.70)Uca minax 0(0) 0(0) 0(0) 0(0) 0(0) 0.25(0.25) 0(0) 0(0) Uca pugilator 0(0) 0(0) 0(0) 0(0) 0(0) 0(0) 0.20(0.20) 0.25(0.25)(Xestochironomus sp.) 0(0) 0(0) 0(0) 0(0) 0(0) 0(0) 0.20(0.20) 0(0)

130
Table 6.4-7a. Mean (no. per 0.01 m2) and (standard error) for all taxa collected at P11 on the NE Cape Fear River during June 1999, 2000, 2001, 2002, 2003, 2004, 2005, and 2006. The means presented here represent the combination of two sub-sites for high intertidal areas. High Intertidal June 99 June 00 June 01 June 02 June 03 June 04 June 05 June 06 amphipod sp. 0(0) 0(0) 0.25(0.25) 0(0) 0(0) 0(0) 0(0) 0(0) Apedilum sp. 0(0) 0(0) 0(0) 0(0) 0(0) 1.40(0.87) 0(0) 0(0) Bezzia/Palpomia 0(0) 0(0) 0.50(0.50) 0.50(0.29) 0(0) 4.80(2.37) 0.75(0.48) 0.25(0.25) juv. Bivalve 0.25(0.25) 0(0) 0(0) 0(0) 0(0) 0.20(0.20) 0(0) 0(0) Boccardiella sp. 0(0) 1.25(1.25) 0(0) 0(0) 0(0) 0(0) 0(0) 0(0) Cassidinidea lunifrons 1.00(0.71) 0.25(0.25) 1.25(0.48) 0(0) 0(0) 0(0) 0(0) 0.25(0.25) Chironomus sp. 0.50(0.50) 0(0) 0(0) 0(0) 0(0) 3.20(2.06) 0(0) 0(0) Collembola sp. 0(0) 0(0) 0(0) 0(0) 0(0) 0.60(0.24) 0(0) 0(0) Corophium volutator 0(0) 0(0) 0(0) 0(0) 0(0) 0(0) 0.25(0.25) 0(0) Cladotanytarsus sp. 0(0) 0(0) 0(0) 0(0) 0.25(0.25) 0(0) 0(0) 0(0) Cricotopus sp. 0(0) 0(0) 0(0) 0(0) 0(0) 0.20(0.20) 0(0) 0(0) Cryptochironomus sp. 0(0) 0(0) 0(0) 0(0) 1.75(1.44) 0.60(0.60) 0(0) 0(0) Curculionidae sp. 0.75(0.75) 0(0) 0.25(0.25) 0(0) 0(0) 0(0) 4.50(3.57) 1.00(0.71) Cyathura madelinae 0(0) 0.25(0.25) 0(0) 0(0) 0(0) 0(0) 0(0) 0(0) Cyathura polita 0(0) 0.25(0.25) 0(0) 0.25(0.25) 0(0) 0.80(0.58) 0(0) 0.25(0.25) Dicrotendipes lobus 1.00(1.00) 0(0) 0(0) 0(0) 0(0) 0(0) 0(0) 0(0) Dicrotendipes nervosa 0.50(0.50) 0(0) 0.50(0.50) 0(0) 0(0) 0(0) 0(0) 0(0) Dicrotendipes sp. 0(0) 1.00(0.71) 0.50(0.29) 0.25(0.25) 0(0) 0(0) 0.25(0.25) 0.25(0.25) Diptera sp. 0(0) 0(0) 0(0) 0(0) 0(0) 0(0) 0(0) 0.25(0.25) Dolichopodidae sp. 0(0) 0(0) 0(0) 0(0) 0(0) 0.40(0.24) 0(0) 0(0) Edotea triloba 0(0) 0(0) 0.25(0.25) 0(0) 0(0) 0(0) 0(0) 0(0) Gammarus diaberi 0(0) 0(0) 0.25(0.25) 0(0) 0(0) 0(0) 0(0) 0(0) Gammarus tigrinus 0(0) 0.25(0.25) 0(0) 0(0) 0(0) 0(0) 0(0) 0(0) Gammarus mucronatus 0.25(0.25) 0(0) 0(0) 0(0) 0(0) 0(0) 0(0) 0(0) Gammarus sp. 0(0) 0(0) 0(0) 1.50(1.50) 0(0) 0(0) 0(0) 0(0) Goeldichironomus
holoprasinus 0(0) 0(0) 0(0) 0(0) 0(0) 1.60(1.60) 0(0) 0(0) Hobsonia florida 7.50(4.33) 0(0) 3.25(1.11) 0(0) 0(0) 0(0) 2.75(2.75) 1.00(0.58) insect larvae (Elimidae) 0(0) 0.25(0.25) 0(0) 0(0) 0(0) 0(0) 0(0) 0(0) insect larvae 1.25(1.25) 0(0) 0(0) 0(0) 0(0) 0.60(0.60) 0(0) 0(0) insect pupae 1.00(1.00) 0.25(0.25) 0(0) 0(0) 0(0) 0(0) 0(0) 0(0) insect sp. 0(0) 0(0) 0(0) 0.50(0.50) 0(0) 0(0) 0(0) 0(0) Laeonereis culveri 0(0) 0(0) 0(0) 0.50(0.50) 0(0) 0.60(0.60) 0(0) 0(0) Megalopae (Uca) 0(0) 0(0) 0.25(0.25) 0(0) 0(0) 0(0) 0(0) 0(0) Megalops spp. 0(0) 0(0) 0(0) 0.25(0.25) 0(0) 0(0) 0(0) 0(0) Neanthes succinea 0(0) 0(0) 1.75(1.75) 0(0) 0(0) 0.60(0.60) 0(0) 0(0) Nemertea sp. 0(0) 0(0) 0(0) 0.25(0.25) 0(0) 0(0) 0(0) 0(0) Nereidae sp. 0(0) 0(0) 1.00(0.71) 0(0) 0(0) 0(0) 0(0) 0(0) Oligochaete 10.50(3.69) 14.25(7.70) 1.75(0.85) 0(0) 0(0) 0(0) 0(0) 0(0) Oniscus sp. 0(0) 0(0) 0(0) 0(0) 0(0) 0.20(0.20) 0(0) 0(0) Orchestia uhleri 0(0) 0(0) 0(0) 0(0) 0(0) 0.20(0.20) 0(0) 0(0) Paratendipes sp. 0(0) 0.25(0.25) 0(0) 0(0) 0(0) 0(0) 0.25(0.25) 0(0) Polydora ligni/cornuta 0.25(0.25) 0(0) 0(0) 0(0) 0(0) 0(0) 0(0) 0(0) Polydora socialis 0.25(0.25) 0(0) 0(0) 0(0) 0(0) 0(0) 0(0) 0(0) Polydora sp. 0(0) 0(0) 0.25(0.25) 0(0) 0(0) 0(0) 0(0) 0(0) Polypedilium sp. 0.50(.50) 0.25(0.25) 0.50(0.50) 0(0) 3.75(1.49) 2.00(1.26) 0(0) 0(0) Stictochironomus sp. 0(0) 0(0) 0(0) 0(0) 0.25(0.25) 0(0) 0(0) 0(0) Streblospio benedicti 0(0) 0(0) 0(0) 0.75(0.49) 0(0) 0(0) 0.25(0.25) 0(0) Tanytarsus sp. 0(0) 0(0) 0(0) 0(0) 0(0) 0.20(0.20) 0(0) 0(0) Tipulidae sp. 0(0) 0(0) 0(0) 0(0) 0(0) 0.60(0.40) 0(0) 0(0) Tubificidae spp. 0(0) 0(0) 0(0) 9.75(8.76) 4.75(2.59) 13.40(5.55) 47.25(19.55) 10.25(5.51)Tubificoides heterochaetus 0(0) 0(0) 0(0) 1.00(0.71) 0.75(0.48) 2.00(2.00) 0(0) 0.50(0.29) Uca sp. 0(0) 0(0) 0(0) 0(0) 0.25(0.25) 0(0) 0(0) 0(0)
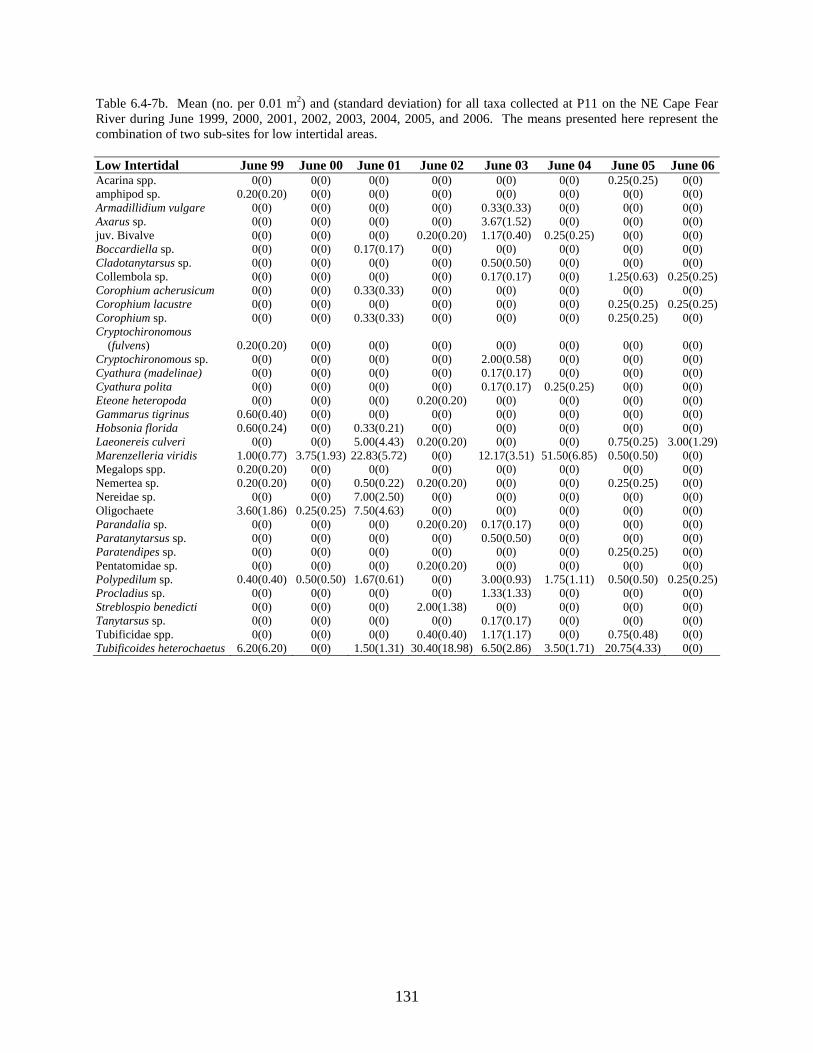
131
Table 6.4-7b. Mean (no. per 0.01 m2) and (standard deviation) for all taxa collected at P11 on the NE Cape Fear River during June 1999, 2000, 2001, 2002, 2003, 2004, 2005, and 2006. The means presented here represent the combination of two sub-sites for low intertidal areas. Low Intertidal June 99 June 00 June 01 June 02 June 03 June 04 June 05 June 06Acarina spp. 0(0) 0(0) 0(0) 0(0) 0(0) 0(0) 0.25(0.25) 0(0) amphipod sp. 0.20(0.20) 0(0) 0(0) 0(0) 0(0) 0(0) 0(0) 0(0) Armadillidium vulgare 0(0) 0(0) 0(0) 0(0) 0.33(0.33) 0(0) 0(0) 0(0) Axarus sp. 0(0) 0(0) 0(0) 0(0) 3.67(1.52) 0(0) 0(0) 0(0) juv. Bivalve 0(0) 0(0) 0(0) 0.20(0.20) 1.17(0.40) 0.25(0.25) 0(0) 0(0) Boccardiella sp. 0(0) 0(0) 0.17(0.17) 0(0) 0(0) 0(0) 0(0) 0(0) Cladotanytarsus sp. 0(0) 0(0) 0(0) 0(0) 0.50(0.50) 0(0) 0(0) 0(0) Collembola sp. 0(0) 0(0) 0(0) 0(0) 0.17(0.17) 0(0) 1.25(0.63) 0.25(0.25)Corophium acherusicum 0(0) 0(0) 0.33(0.33) 0(0) 0(0) 0(0) 0(0) 0(0) Corophium lacustre 0(0) 0(0) 0(0) 0(0) 0(0) 0(0) 0.25(0.25) 0.25(0.25)Corophium sp. 0(0) 0(0) 0.33(0.33) 0(0) 0(0) 0(0) 0.25(0.25) 0(0) Cryptochironomous
(fulvens) 0.20(0.20) 0(0) 0(0) 0(0) 0(0) 0(0) 0(0) 0(0) Cryptochironomous sp. 0(0) 0(0) 0(0) 0(0) 2.00(0.58) 0(0) 0(0) 0(0) Cyathura (madelinae) 0(0) 0(0) 0(0) 0(0) 0.17(0.17) 0(0) 0(0) 0(0) Cyathura polita 0(0) 0(0) 0(0) 0(0) 0.17(0.17) 0.25(0.25) 0(0) 0(0) Eteone heteropoda 0(0) 0(0) 0(0) 0.20(0.20) 0(0) 0(0) 0(0) 0(0) Gammarus tigrinus 0.60(0.40) 0(0) 0(0) 0(0) 0(0) 0(0) 0(0) 0(0) Hobsonia florida 0.60(0.24) 0(0) 0.33(0.21) 0(0) 0(0) 0(0) 0(0) 0(0) Laeonereis culveri 0(0) 0(0) 5.00(4.43) 0.20(0.20) 0(0) 0(0) 0.75(0.25) 3.00(1.29)Marenzelleria viridis 1.00(0.77) 3.75(1.93) 22.83(5.72) 0(0) 12.17(3.51) 51.50(6.85) 0.50(0.50) 0(0) Megalops spp. 0.20(0.20) 0(0) 0(0) 0(0) 0(0) 0(0) 0(0) 0(0) Nemertea sp. 0.20(0.20) 0(0) 0.50(0.22) 0.20(0.20) 0(0) 0(0) 0.25(0.25) 0(0) Nereidae sp. 0(0) 0(0) 7.00(2.50) 0(0) 0(0) 0(0) 0(0) 0(0) Oligochaete 3.60(1.86) 0.25(0.25) 7.50(4.63) 0(0) 0(0) 0(0) 0(0) 0(0) Parandalia sp. 0(0) 0(0) 0(0) 0.20(0.20) 0.17(0.17) 0(0) 0(0) 0(0) Paratanytarsus sp. 0(0) 0(0) 0(0) 0(0) 0.50(0.50) 0(0) 0(0) 0(0) Paratendipes sp. 0(0) 0(0) 0(0) 0(0) 0(0) 0(0) 0.25(0.25) 0(0) Pentatomidae sp. 0(0) 0(0) 0(0) 0.20(0.20) 0(0) 0(0) 0(0) 0(0) Polypedilum sp. 0.40(0.40) 0.50(0.50) 1.67(0.61) 0(0) 3.00(0.93) 1.75(1.11) 0.50(0.50) 0.25(0.25)Procladius sp. 0(0) 0(0) 0(0) 0(0) 1.33(1.33) 0(0) 0(0) 0(0) Streblospio benedicti 0(0) 0(0) 0(0) 2.00(1.38) 0(0) 0(0) 0(0) 0(0) Tanytarsus sp. 0(0) 0(0) 0(0) 0(0) 0.17(0.17) 0(0) 0(0) 0(0) Tubificidae spp. 0(0) 0(0) 0(0) 0.40(0.40) 1.17(1.17) 0(0) 0.75(0.48) 0(0) Tubificoides heterochaetus 6.20(6.20) 0(0) 1.50(1.31) 30.40(18.98) 6.50(2.86) 3.50(1.71) 20.75(4.33) 0(0)

132
Table 6.4-8a. Mean (no. per 0.01 m2) and (standard error) for all taxa collected at P12 on the NE Cape Fear River during June 1999, 2000, 2001, 2002, 2003, 2004, 2005, and 2006. The means presented here represent the combination of two sub-sites for high intertidal areas. High Intertidal June 99 June 00 June 01 June 02 June 03 June 04 June 05 June 06 Acarina sp. 0(0) 0(0) 0.25(0.25) 0(0) 0(0) 0(0) 0(0) 0(0) Bezzia/Palpomyia 1.80(0.37) 0(0) 0.25(0.25) 1.40(0.93) 0.60(0.24) 0.50(0.29) 4.25(2.02) 1.00(0.41) Cassidinidea lunifrons 0.20(0.20) 0.25(0.25) 0.25(0.25) 0.40(0.40) 0(0) 0.25(0.25) 0(0) 0(0) Coleoptera sp. 0(0) 0(0) 0(0) 0(0) 0(0) 0.25(0.25) 0(0) 0(0) Collembola sp. 0.20(0.20) 1.00(0.41) 0(0) 0(0) 0(0) 0.75(0.48) 0.25(0.25) 0.50(0.29) Corophium (lacustre) 0.20(0.20) 0(0) 0(0) 0(0) 0(0) 0(0) 0(0) 0(0) Corophium volutator 0(0) 0(0) 0(0) 0(0) 0(0) 0.25(0.25) 0(0) 0(0) Cricotopus sp. 0.20(0.20) 0(0) 0(0) 0(0) 0(0) 0(0) 0(0) 0(0) Cyathura polita 0(0) 0(0) 0(0) 0(0) 0(0) 0.75(0.25) 0(0) 0(0) Dicrotendipes sp. 0(0) 0(0) 0.25(0.25) 0(0) 0(0) 0(0) 0(0) 0(0) Diptera sp. 0(0) 0(0) 0(0) 0(0) 0.20(0.20) 0(0) 0(0) 0(0) Dispio uncinata 0(0) 0.25(0.25) 0(0) 0(0) 0(0) 0(0) 0(0) 0(0) Dolichopodidae sp. 0(0) 0.25(0.25) 0.75(0.75) 0.20(0.20) 0.40(0.24) 1.00(0.41) 0.25(0.25) 1.00(0.41) Dolichopus sp. 0.60(0.40) 0(0) 0(0) 0(0) 0(0) 0(0) 0(0) 0(0) Donacia sp. 0.20(0.20) 0(0) 0(0) 0.20(0.20) 0(0) 0(0) 0(0) 0(0) Donaciinae sp. 0(0) 0(0) 0.25(0.25) 0.20(0.20) 0(0) 0(0) 0(0) 0(0) Endochironomus sp. 0(0) 0(0) 0(0) 0(0) 0.20(0.20) 0(0) 0(0) 0(0) Ephydra sp. 0(0) 0(0) 0(0) 0(0) 0(0) 0.50(0.50) 0(0) 0(0) Ephydridae sp. 0(0) 0(0) 0(0) 0(0) 0(0) 0.25(0.25) 0(0) 0(0) Gammarus sp. 0(0) 0(0) 0(0) 0.20(0.20) 0(0) 0(0) 0(0) 0(0) juv. Gastropod 0.20(0.20) 0.50(0.50) 0(0) 0(0) 0(0) 0.25(0.25 0(0) 0(0) Hemiptera sp. 0(0) 0(0) 0(0) 0(0) 0.20(0.20) 0(0) 0(0) 0(0) Heterothissocladius sp. 0(0) 0.25(0.25) 0(0) 0(0) 0(0) 0(0) 0(0) 0(0) Homoptera sp. 0(0) 0(0) 0(0) 0(0) 0(0) 0(0) 0(0) 0.50(0.50) Hydrobia sp. 0(0) 0.25(0.25) 0(0) 0(0) 0(0) 0(0) 0(0) 0(0) insect larvae g 0.40(0.40) 0(0) 0(0) 0(0) 0(0) 0(0) 0(0) 0(0) insect larvae h 1.20(1.20) 0(0) 0(0) 0(0) 0(0) 0(0) 0(0) 0(0) insect sp. 0(0) 0(0) 0.75(0.48) 0(0) 0(0) 0(0) 0(0) 0(0) insect sp. f 0(0) 0(0) 0(0) 0(0) 0(0) 0(0) 0(0) 0(0) Laeonereis culveri 1.40(0.51) 0.25(0.25) 0(0) 0(0) 0(0) 0(0) 0(0) 0(0) (Limnophyes sp.) 0(0) 0(0) 0(0) 0(0) 0(0) 0(0) 0(0) 0.25(0.25) Lumbriculidae sp. 0(0) 0.25(0.25) 0(0) 0(0) 0(0) 0(0) 0(0) 0(0) Mesovelia mulsanti 0(0) 0(0) 0(0) 0.20(0.20) 0(0) 0.50(0.50) 0(0) 0(0) Monopylephorus irroratus 1.00(1.00) 0(0) 0(0) 0(0) 0.40(0.40) 0.25(0.25) 0(0) 0(0) Namalycastis sp. 0(0) 0(0) 0.25(0.25) 0(0) 0(0) 0(0) 0(0) 0(0) Neanthes succinea 0(0) 0(0) 0(0) 0(0) 0(0) 0.25(0.25) 0(0) 0(0) Nereidae sp. 0(0) 0.25(0.25) 0.25(0.25) 0(0) 0(0) 0(0) 0(0) 0(0) Ocypode quadrata 0.20(0.20) 0(0) 0(0) 0(0) 0(0) 0(0) 0(0) 0(0) Oligochaete 47.8(15.93) 30.00(9.61) 13.25(7.11) 0(0) 0(0) 0(0) 0(0) 0(0) Orchestia sp. 0(0) 0(0) 0.50(0.50) 0(0) 0(0) 0(0) 0(0) 0(0) Orchestia uhleri 0.20(0.20) 0.50(0.29) 0(0) 0(0) 0(0) 0.25(0.25) 0(0) 0.25(0.25) Orthocladiinae sp. 0(0) 0(0) 0(0) 0(0) 0.20(0.20) 0(0) 0(0) 0.25(0.25) Parametriocnemus sp. 0(0) 0(0) 0(0) 0(0) 0(0) 3.75(1.49) 0(0) 0(0) Paratandipes sp. 0(0) 0(0) 0(0) 0(0) 0.20(0.20) 0(0) 0(0) 0(0) Polypedilium sp. 0(0) 0(0) 0.50(0.50) 0(0) 1.8(1.11) 0.50(0.29) 0(0) 0(0) Pristinella sp. 0.20(0.20) 0(0) 0(0) 0(0) 0(0) 0(0) 0(0) 0(0) Spiophanes bombyx 0(0) 0.25(0.25) 0(0) 0(0) 0(0) 0(0) 0(0) 0(0) Streblospio benedicti 0(0) 0(0) 0(0) 0(0) 0.20(0.20) 0(0) 0(0) 0(0) Tubificidae spp. 0(0) 0(0) 0(0) 3.20(1.16) 17.6(4.15) 55.25(10.0) 25.50(15.94) 9.75(4.09) Uca minax 0.20(0.20) 0(0) 0(0) 0(0) 0(0) 0.50(0.29) 0(0) 0(0) Uca pugilator 0.20(0.20) 0(0) 0(0) 0(0) 0(0) 0(0) 0(0) 0.75(0.48) Uca sp. 0(0) 0.25(0.25) 0.25(0.25) 0.40(0.40) 0(0) 0(0) 0.75(0.75) 0(0)

133
Table 6.4-8b. Mean (no. per 0.01 m2) and (standard deviation) for all taxa collected at P12 on the NE Cape Fear River during June 1999, 2000, 2001, 2002, 2003, 2004, 2005, and 2006. The means presented here represent the combination of two sub-sites for low intertidal areas. Low Intertidal June 99 June 00 June 01 June 02 June 03 June 04 June 05 June 06Ablabesmyia sp. 0(0) 0(0) 0(0) 0(0) 0.20(0.71) 0(0) 0(0) 0(0) Acarina spp. 0(0) 0(0) 0(0) 0(0) 0(0) 0(0) 1.00(0.41) 1.00(0.71)amphipod sp. 0.20(0.20) 0(0) 0(0) 0(0) 0(0) 0(0) 0(0) 0(0) Apedilum sp. 0(0) 0(0) 0(0) 0(0) 0(0) 2.75(2.75) 0(0) 0(0) Axarus sp. 0(0) 0(0) 0(0) 0(0) 0.75(0.75) 0(0) 0(0) 0(0) Bezzia/Palpomyia 0.20(0.20) 0(0) 0(0) 0(0) 0(0) 0(0) 0.50(0.29) 0(0) Boccardiella sp. 0(0) 0(0) 12.50(12.50) 7.60(4.43) 0.75(0.48) 0(0) 0(0) 5.00(2.34)Cassidinidea lunifrons 0(0) 0(0) 0(0) 0(0) 0.75(0.48) 0(0) 0(0) 1.00(0.71)Chironomidae sp. 0(0) 0(0) 0(0) 0(0) 0(0) 0.25(0.25) 0(0) 0(0) Chironomus sp. 0(0) 0(0) 0(0) 0(0) 0.25(0.25) 1.00(1.00) 0(0) 0(0) Collembola sp. 0(0) 0(0) 0.50(0.50) 0(0) 0(0) 0.75(0.49) 0.75(0.75) 0(0) Corophium acherusicum 0(0) 0(0) 1.00(1.00) 0(0) 0(0) 0(0) 0(0) 0(0) Corophium lacustre 0(0) 0(0) 0(0) 0(0) 0(0) 0(0) 0(0) 0.25(0.25)Corophium volutator 0(0) 0(0) 0(0) 0(0) 0(0) 0(0) 0(0) 7.00(6.35)Corophium sp. 0(0) 0(0) 0(0) 0(0) 0(0) 0(0) 0.25(0.25) 0(0) Crangonyx sp. 0(0) 0(0) 0(0) 0.40(0.40) 0(0) 0(0) 0(0) 0(0) Cricotopus sp. 0(0) 0(0) 0(0) 0(0) 0.50(0.50) 0(0) 0(0) 0(0) Cryptochironomus sp. 0(0) 0(0) 0(0) 0(0) 0.75(0.75) 0(0) 0(0) 0(0) Dicrotendipes Lucifer 0(0) 0(0) 0(0) 0(0) 0.25(0.25 0(0) 0(0) 0(0) Dicrotendipes sp. 0(0) 0(0) 0(0) 0(0) 1.75(1.75) 0(0) 0(0) 0(0) Diptera sp. 0(0) 0(0) 0(0) 0(0) 0(0) 0(0) 0.75(0.75) 0(0) Dolichopodidae sp. 0(0) 0(0) 0(0) 0(0) 0(0) 0.25(0.25) 0.50(0.50) 0(0) Edotea sp. 0(0) 0(0) 0(0) 0.20(0.20) 0(0) 0(0) 0(0) 0.25(0.25)Edotea (triloba) 0(0) 0(0) 0(0) 0(0) 0(0) 0.25(0.25) 0(0) 0(0) Enchytraeidae sp. 0(0) 0(0) 0(0) 0(0) 0.25(0.25) 0(0) 0(0) 0(0) Gammarus tigrinus 0.20(0.20) 0(0) 0(0) 0(0) 0(0) 0(0) 0(0) 0(0) Gammarus sp. 0(0) 0(0) 0(0) 0(0) 0.25(0.25) 0(0) 0(0) 0(0) juv. Gastropod 0(0) 0(0) 0.25(0.25) 0(0) 0(0) 0(0) 0(0) 0(0) Goeldichironomus
holoprasinus 0(0) 0(0) 0(0) 0(0) 0(0) 0.25(0.25) 0(0) 0(0) Goeldichironomus sp. 0(0) 0(0) 0(0) 0(0) 0(0) 3.25(2.36) 0(0) 0(0) Geukensia demissa 0(0) 0(0) 0(0) 0(0) 0(0) 0(0) 0(0) 0.25(0.25)Hobsonia florida 0(0) 0(0) 0(0) 0.40(0.40) 0.25(0.25) 0(0) 0(0) 0.50(0.50)Idoteidae sp. 0(0) 0(0) 0(0) 0(0) 0(0) 0(0) 0(0) 0.50(0.50)insect larvae 0(0) 0.25(0.25) 0(0) 0(0) 0(0) 0(0) 0(0) 0(0) insect sp. 0(0) 0.25(0.25) 0(0) 0(0) 0(0) 0(0) 0(0) 0(0) Laeonereis culveri 0(0) 0(0) 0(0) 0.40(0.40) 0(0) 0(0) 0.50(0.50) 1.25(1.25)Lumbriculidae sp. 0(0) 1.75(1.44) 0(0) 0(0) 0(0) 0(0) 0.75(0.75) 0(0) Marenzelleria viridis 0(0) 0(0) 0(0) 0(0) 0(0) 0.75(0.48) 0(0) 0(0) Mediomastus sp. 0.20(0.20) 0(0) 0(0) 0(0) 0(0) 0(0) 0(0) 0(0) Megalops spp. 0(0) 0(0) 0(0) 0.20(0.20) 0(0) 0(0) 0.50(0.29) 0(0) Naididae sp. 0(0) 0(0) 0(0) 0(0) 0.25(0.25) 0(0) 0(0) 0(0) Namalycastis sp. 0(0) 0(0) 0.50(0.50) 0(0) 0(0) 0(0) 0(0) 0(0) Nemertea sp. 0(0) 0(0) 0(0) 0(0) 0(0) 0(0) 0(0) 0.25(0.25)Nereis lamellose 0(0) 0(0) 0(0) 0.20(0.20) 0(0) 0(0) 0(0) 0(0) Oligochaete 1.60(0.51) 7.25(4.40) 2.75(1.49) 0(0) 0(0) 0(0) 0(0) 0(0) Paracladopelma sp. 0.20(0.20) 0(0) 0(0) 0(0) 0(0) 0(0) 0(0) 0(0) Paratendipes sp. 0(0) 0(0) 0(0) 0(0) 0(0) 0(0) 0.25(0.25) 0(0) Paratendipes (subaequalis) 0(0) 0(0) 0(0) 0(0) 0(0) 0(0) 0.50(0.50) 0(0) Polydora ligni/cornuta 0.20(0.20) 0(0) 0(0) 0(0) 0(0) 0(0) 0(0) 0(0) Polydora socialis 0(0) 0(0) 0(0) 0.20(0.20) 0(0) 0(0) 0(0) 0(0) Polydora sp. 0.20(0.20) 0(0) 0(0) 0(0) 0(0) 0(0) 0(0) 0(0) Polypedilum sp. 0.20(0.20) 0(0) 0(0) 0(0) 3.75(1.11) 0(0) 0(0) 0(0) Procladius sp. 0(0) 0(0) 0(0) 0(0) 0.25(0.25) 0(0) 0(0) 0(0) Rhithropanopeus harrisii 0(0) 0(0) 0(0) 0.20(0.20) 0(0) 0(0) 0(0) 0(0) Spiophanes bombyx 0(0) 0(0) 0(0) 0.20(0.20) 0(0) 0(0) 0(0) 0(0) Streblospio benedicti 0(0) 0(0) 0(0) 0.80(0.58) 0(0) 0(0) 0.25(0.25) 0(0) Tanypodinae sp. 0(0) 0(0) 0(0) 0(0) 1.25(1.25) 0(0) 0(0) 0(0) Tanytarsus sp. 0(0) 0(0) 0(0) 0(0) 0.50(0.29) 0(0) 0(0) 0(0) Tubificidae spp. 0(0) 0(0) 0(0) 1.80(1.36) 0.50(0.29) 0.25(0.25) 18.00(15.02) 8.25(4.61)Tubificoides heterochaetus 0(0) 0(0) 0(0) 0.40(0.40) 0(0) 0.75(0.75) 0(0) 0(0)

134
Table 6.4-9a. Mean (no. per 0.01 m2) and (standard error) for all taxa collected at P13 on the NE Cape Fear River during June 1999, 2000, 2001, 2002, 2003, 2004, 2005, and 2006. The means presented here represent the combination of two sub-site for high intertidal areas at each station. High Intertidal June 99 June 00 June 01 June 02 June 03 June 04 June 05 June 06 Acarina spp. 0(0) 0(0) 0(0) 0(0) 0(0) 0(0) 0.50(0.50) 0.25(0.25) Anurida maritima 0(0) 0(0) 0(0) 0(0) 0(0) 0(0) 0.25(0.25) 0.50(0.50) Aricidea suecica 0(0) 0(0) 0(0) 0.25(0.25) 0(0) 0(0) 0(0) 0(0) Bezzia/Palpomyia 0(0) 0(0) 0.20(0.20) 0.75(0.75) 1.00(0.71) 3.75(1.18) 3.75(1.11) 0.25(0.25) juv. Bivalve 0(0) 0.75(0.48) 0(0) 0(0) 0(0) 0(0) 0(0) 0(0) Cassidinidea lunifrons 0(0) 0(0) 0(0) 0(0) 0(0) 0.75(0.48) 0.75(0.25) 0(0) Chironomidae sp. 0(0) 0(0) 0(0) 0(0) 0(0) 0(0) 0(0) 0(0) Chironomus sp. 0(0) 0(0) 0(0) 0(0) 0(0) 0.25(0.25) 0(0) 0(0) Collembola sp. 0.20(0.20) 0(0) 0.80(0.80) 0(0) 0.50(0.50) 1.50(0.96) 0.50(0.50) 0(0) Corophium lacustre 0(0) 0(0) 0(0) 0(0) 0(0) 0(0) 0.25(0.25) 0(0) Corophium sp. 0(0) 0(0) 0(0) 0(0) 0(0) 0(0) 0(0) 0(0) Corophium volutator 0(0) 0(0) 0(0) 0(0) 0(0) 0(0) 0.25(0.25) 0(0) Cryptochironomus sp. 0(0) 0(0) 0(0) 0(0) 0(0) 0(0) 0.25(0.25) 0(0) Cyathura polita 0.20(0.20) 0(0) 0(0) 0(0) 0.50(0.50) 0(0) 1.00(0.71) 0(0) Dicrotendipes sp. 0(0) 0(0) 0(0) 0(0) 0(0) 0(0) 0.25(0.25) 0(0) Dolichopodidae sp. 0(0) 0.50(0.50) 0.20(0.20) 0.25(0.25) 0(0) 0.50(0.29) 0.25(0.25) 0.25(0.25) Dolichopus sp. 0.40(0.24) 0(0) 0(0) 0(0) 0(0) 0(0) 0(0) 0(0) Erioptera sp. 0(0) 0(0) 0(0) 0(0) 0(0) 0(0) 0(0) 0.25(0.25) Goeldichironomus sp. 0(0) 0(0) 0(0) 0(0) 0(0) 0.25(0.25) 0(0) 0(0) Haliplidae sp. 0.20(0.20) 0(0) 0(0) 0(0) 0(0) 0(0) 0(0) 0(0) Helophorus linearis 0(0) 0(0) 0.20(0.20) 0(0) 0(0) 0(0) 0(0) 0(0) Helophorus sp. 0(0) 0(0) 0(0) 0(0) 0(0) 0(0) 0(0) 0.50(0.50) Hydrobia sp. 0(0) 0.25(0.25) 0(0) 0(0) 0(0) 0(0) 0(0) 0(0) Hydrophilidae larvae 0(0) 0(0) 0(0) 0(0) 0(0) 0(0) 0(0) 0.25(0.25) insect pupae 0.20(0.20) 0(0) 0.20(0.20) 0(0) 0(0) 0(0) 0(0) 0(0) insect sp. 0(0) 0(0) 0.40(0.40) 0.25(0.25) 0(0) 0(0) 0(0) 0(0) Laeonereis culveri 0.40(0.24) 2.00(1.08) 0(0) 0.25(0.25) 0(0) 0.75(0.75) 0.50(0.50) 0(0) Limnophila sp. 0(0) 0(0) 0.20(0.20) 0(0) 0(0) 0(0) 0(0) 0(0) Lumbriculidae sp. 1.40(1.40) 0.50(0.29) 18.40(18.40) 1.00(0.58) 0(0) 0.25(0.25) 0.75(0.75) 1.50(1.19) (Lumbriculidae sp.) 0(0) 0(0) 0(0) 0(0) 0(0) 0(0) 0(0) 5.25(3.35) Mediomastus sp. 0.20(0.20) 0(0) 0(0) 0(0) 0(0) 0(0) 0(0) 0(0) Megalopae (Uca) 0(0) 0(0) 0.20(0.20) 0(0) 0(0) 0(0) 0(0) 0(0) Megalops spp. 0(0) 0(0) 0(0) 0(0) 0(0) 0.25(0.25) 0.25(0.25) 0(0) Namalycastis sp. 0(0) 0(0) 0.20(0.20) 0(0) 0(0) 0(0) 0(0) 0(0) Nereidae sp. 0(0) 0(0) 0(0) 0.25(0.25) 0(0) 0(0) 0(0) 0(0) Oligochaete 29.40(6.9) 11.00(3.72) 37.20(14.04) 0(0) 0(0) 0(0) 0(0) 0(0) Oribatei sp. 0(0) 0(0) 0(0) 0.25(0.25) 0(0) 0(0) 0(0) 0(0) Orchestia sp. 0(0) 0(0) 0.40(0.24) 0(0) 0(0) 0(0) 0(0) 0(0) Orchestia uhleri 0(0) 0(0) 0.20(0.20) 0(0) 0(0) 0(0) 0.25(0.25) 0.25(0.25) Parachaetocladius sp. 0(0) 0(0) 0(0) 0(0) 0(0) 0(0) 0.25(0.25) 0(0) Paratendipes sp. 0(0) 0.50(0.50) 0.60(0.40) 0(0) 1.00(0.71) 3.75(0.85) 26.00(14.72) 0.25(0.25) Polichopodidae sp. 0(0) 0(0) 0.20(0.20) 0(0) 0(0) 0(0) 0(0) 0(0) Polypedilium sp. 0.60(0.40) 0(0) 0.40(0.24) 0(0) 5.00(1.22) 0.25(0.25) 0(0) 0(0) Spirosperma carolinensis 0(0) 0(0) 0(0) 0(0) 0(0) 0(0) 0(0) 0.25(0.25) Tabanus sp. 0(0) 0(0) 0(0) 0(0) 0(0) 0(0) 0.25(0.25) 0(0) Tubificidae spp. 0(0) 0(0) 0(0) 2.75(2.43) 6.25(1.97) 60.00(11.37) 95.75(22.76) 49.25(12.97)Tubificoides
heterochaetus 0(0) 0(0) 0(0) 0(0) 0(0) 0(0) 0(0) 0(0) Uca pugilator 0(0) 0(0) 0(0) 0(0) 0(0) 0(0) 0(0) 0.25(0.25) Uca sp. 0(0) 0.25(0.25) 0(0) 0(0) 0(0) 0(0) 0(0) 0(0)

Table 6.4-9b. Mean (no. per 0.01 m2) and (standard error) for all taxa collected at P13 on the NE Cape Fear River during June 1999, 2000, 2001, 2002, 2003, 2004, 2005, and 2006. The means presented here represent the combination of two sub-site for low intertidal areas at each station. Low Intertidal June 99 June 00 June 01 June 02 June 03 June 04 June 05 June 06
0(0) Amphididae sp. 0(0) 0(0) 0(0) 0(0) 0.20(0.20) 0(0) 0(0) Anurida maritima 0(0) 0(0) 0(0) 0(0) 0(0) 0(0) 0(0) 0.25(0.25) Bezzia/Palpomyia 0(0) 0(0) 0.25(0.25) 0.75(0.48) 0(0) 1.50(0.50) 2.00(1.08) 0.50(0.29) Cassidinidea lunifrons 0(0) 0(0) 0(0) 0.25(0.25) 0(0) 0(0) 0(0) 0(0) Chiridotea caeca 0.25(0.25) 0(0) 0(0) 0(0) 0(0) 0(0) 0(0) 0(0) Chironomidae sp. 0(0) 0(0) 0(0) 0(0) 0(0) 0(0) 0(0) 0.25(0.25) Collembola sp. 0(0) 0(0) 0(0) 0(0) 0(0) 0(0) 0.25(0.25) 0(0) Corophium sp. 0(0) 0(0) 0(0) 0(0) 0(0) 0(0) 0.25(0.25) 0(0) Cryptochironomous
(fulvens) 0.50(0.50) 0(0) 0(0) 0(0) 0(0) 0(0) 0(0) 0(0) Cryptochironomous sp. 0(0) 0(0) 0(0) 0(0) 0.80(0.37) 1.00(1.00) 0.50(0.29) 0.75(0.75) Cyathura polita 0(0) 0(0) 0(0) 0(0) 0(0) 0(0) 0.25(0.25) 0.25(0.25) Diptera sp. 0(0) 0(0) 0(0) 0(0) 0(0) 0.50(0.50) 0(0) 0.25(0.25) Dolichopodidae sp. 0(0) 0.25(0.25) 0(0) 0(0) 0(0) 0(0) 0(0) 0(0) Hobsonia florida 0(0) 0(0) 0.25(0.25) 0(0) 0(0) 0(0) 0(0) 0(0) insect pupae 0.25(0.25) 0(0) 0(0) 0(0) 0(0) 0(0) 0(0) 0(0) insect sp. d 0.25(0.25) 0(0) 0(0) 0(0) 0(0) 0(0) 0(0) 0(0) insect sp. e 0.50(0.50) 0(0) 0(0) 0(0) 0(0) 0(0) 0(0) 0(0) Laeonereis culveri 0(0) 0(0) 0(0) 0.25(0.25) 0(0) 0(0) 0(0) 0(0) Larval fish 0.25(0.25) 0(0) 0(0) 0(0) 0(0) 0(0) 0(0) 0(0) Limnodrilus hoffmeisteri 0(0) 0(0) 0(0) 0(0) 0.60(0.24) 0(0) 0(0) 0(0) Lumbriculidae sp. 0(0) 0(0) 0(0) 0(0) 0(0) 0(0) 0(0) 0.25(0.25) Megalopae (Uca) 0(0) 0(0) 0.25(0.25) 0(0) 0(0) 0(0) 0(0) 0(0) Namalycastis sp. 0(0) 0.25(0.25) 0(0) 0(0) 0(0) 0(0) 0(0) 0(0) Oligochaete 34.25(11.13) 29.30(15.37) 8.25(4.97) 0(0) 0(0) 0(0) 0(0) 0(0) Paratendipes sp. 0(0) 0(0) 0(0) 0(0) 0(0) 1.00(1.00) 0.25(0.25) 0(0) Polypedilum sp. 0.25(0.25) 1.00(0.71) 1.25(0.95) 0(0) 0.80(0.20) 1.00(1.00) 0.25(0.25) 0(0) Procladius sp. 0.75(0.48) 0(0) 0(0) 0(0) 0.20(0.20) 0(0) 0(0) 0(0) Streblospio benedicti 0(0) 0(0) 0(0) 0(0) 0.50(0.50) 0(0) 0(0) 0(0) Tubificidae spp. 0(0) 0(0) 0(0) 4.00(3.08) 5.00(2.65) 17.50(0.50) 20.00(2.48) 14.00(4.38)Tubificoides heterochaetus 0(0) 0(0) 0(0) 0(0) 0(0) 0(0) 1.25(1.25) 0(0)
135

ANOVA comparisons of among-year abundances for major taxonomic groups and functional guilds show generally greater abundances of insect larvae in most sites (8 of 9) in 2003-2006 compared to at least certain earlier years (Table 6.4-10) – a period coincident with the lessening of an earlier drought as well as ongoing channel widening. Insect larvae as a group are generally less common with increasing salinity in the estuary. Oligochaetes showed significant patterns less often, and patterns were more variable when they occurred, with higher abundances in 2006, 2005, 2004, 2003, 2000, or 1999 depending on the site. This group also tends to be more abundant in lower salinities, though high numbers are characteristic of certain mesohaline to euhaline marsh, inner marsh locations, and greatest abundances at normally high salinity sites generally occurred during non-drought years. Polychaetes showed a mixed pattern, with no detectable among year differences at 5 sites, greater abundance in drought years at P2 and P11, and greater abundances in 1999 at P3, and in 2005 at P7 (an oligohaline/tidal freshwater site). Functional guild changes paralleled these patterns, with among year variations in surface /mobile fauna reflecting their dominance by insect larvae and certain amphipods in sites where significant among year variations in this functional group occurred, deep burrowers reflecting the patterns for oligochaetes at most sites, and sedentary/tube builders reflecting mixed effects of polychaetes (especially Streblospio and Marenzellaria) and certain tube-dwelling amphipods (Table 6.4-11). In general, 2006 patterns were more similar to 2003-2005 than previous years. The most distinctive faunal pattern during 2006 was relatively higher amphipod abundances at 3 sites.
More pronounced than variations in abundance of higher taxonomic groups was their relative composition as indicated by Analysis of Community Similarity (ANOSIM) and Multidimensional Scaling Analysis (MDS). These analyses indicated that 1999-2001 samples did not have significantly dissimilar faunal assemblages (Figure 6.4-1). However, the period from 2003-2006 was distinct from the 1999-2001 grouping (ANOSIM, R=0.48, p<0.001). There were minor variations within this grouping, but differences were small relative to the differences with 1999-2001. MDS and ANOSIM analyses also indicated that 2002 differed from most other years, though it did not differ from 2003 and 2006. This roughly corresponds to pre-dredging periods differing from those after channel deepening began; and variable patterns among years during this deepening activity. Strong effects of a drought in 2002 also mean this pattern corresponds with pre-drought/developing drought conditions (1999-2001) and post-drought conditions (2003-2006).
136

Table 6.4-10. Among-year comparison of abundance by taxonomic group for each site. Years are listed from greatest abundance to least. F (and p) values are from Analysis of Variance. Where ANOVA indicated a significant year effect, year differences were tested using a SNK post-hoc test. Years with the same superscript do not vary significantly (p<0.05). Years with two letter superscripts were not different from either year. Site Group F(p) SNK(where ANOVA significant) P2 Amphipoda 3.19(0.0056) 06ª 05a 04a 00a 01a 02a 99a 03a Bivalvia 2.85(0.011) 06ª 04ab 99ab 02ab 00ab 05b 03b 01b Decapada 1.91(0.08) NS Gastropoda 1.22(0.30) NS Insecta 4.05(0.0009) 03ª 04ab 99bc 06bc 05bc 00bc 02c 01c Isopoda 3.00(0.08) 4ª 05ab 00ab 06ab 03b 99b 01b 02b Oligochaete 6.08(0.0001) 05ª 04a 99ab 06abc 00bc 01c 02c 03c Polychaete 9.37(0.0001) 02ª 00ab 99bc 05bc 04bc 01cd 06d 03d P3A Amphipoda 2.73(0.01) 06ª 05a 99a 04a 01a 00a 02a 03a Bivalvia 1.51(0.17) NS
Decapada 1.97(0.08) NS Gastropoda 1.38(0.22) NS Insecta 4.57(0.0003) 04ª 05b 03b 99b 06b 00b 02b 01b Isopoda 6.57(0.0001) 4ª 05a 03a 01ab 06b 99b 00b 02b Oligochaete 7.88(0.0001) 00ª 04a 05a 06a 00ab 99b 02b 03b Polychaete 2.81(0.0001) 99ª 05a 02ab 01ab 04ab 00ab 03ab 06b P3B Amphipoda 1.74(0.11) NS Bivalvia 1.69(0.12) NS Decapada 3.86(0.0015) 04ª 05b 02b 99b 00b 01b 06b 03b Gastropda 0.92(0.49) NS Insecta 9.00(0.0001) 04ª 03a 06b 99b 05b 02b 00b 01b Isopoda 2.44(0.02) 04ª 05ab 01ab 06ab 02ab 99ab 03ab 00b Oligochaete 9.09(0.0001) 06ª 00ab 04ab 05bc 99c 03c 01c 02c Polychaete 1.40(0.22) NS P6 Amphipoda 6.78(0.0001) 99ª 01b 04b 02b 00b 05b 06b 03b Bivalvia 2.41(0.03) 99ª 04a 02a 01a 00a 05a 06a 03a Decapada 2.02(0.06) NS Gastropoda 2.28(0.04) 99ª 03a 00a 02a 04a 01a 06a 05a Insecta 9.51(0.0001) 05ª 06b 04bc 99bcd 03bcd 02cd 01de 00e Isopoda 3.24(0.006) 99ª 04ab 02b 01b 00b 05b 06b 03b Oligochaete 3.16(0.007) 99ª 05ab 06ab 04ab 03ab 00ab 02ab 01b Polychaete 1.84(0.09) NS
137

Table 6.4-10. (continued) Site Group F(p) SNK(where ANOVA significant) P7 Amphipoda 3.67(0.002) 01ª 06ab 99ab 05ab 04b 03b 00b 02b Bivalvia 1.67(0.13) NS Decapoda 1.29(0.26) NS Gastropoda 3.78(0.002) 99ª 04b 05b 02b 00b 01b 06b 03b Insecta 8.72(0.0001) 03ª 05a 04ab 06ab 99ab 00b 01b 02c Isopoda 3.44(0.003) 01ª 99ab 05ab 04ab 06ab 00b 03b 02b Oligochaete 4.52(0.0003) 03ª 00a 06a 05a 99ab 01ab 04ab 02b Polychaete 3.29(0.004) 05ª 06ab 00ab 02b 01b 03b 04b 99b P8 Amphipoda 7.81(0.0001) 01ª 05ab 99abc 00bcd 06cd 02cd 04cd 03d Bivalvia 4.33(0.0005) 00ª 04ab 99ab 01ab 03b 06b 05b 02b Decapada 0.87(0.53) NS Gastropoda 1.08(0.39) NS Insecta 5.31(0.0001) 00ª 04a 99ab 06abc 03bc 01bc 05bc 02c Isopoda 2.04(0.06) NS Oligochaete 13.51(0.0001) 00ª 99ab 04ab 05ab 03ab 06b 01b 02c Polychaete 1.25(0.28) NS P11 Amphipoda 0.92(0.498) NS Bivalvia 4.16(0.0008) 03ª 04b 02b 99b 00b 01b 06b 05b Decapada 0.50(0.83) NS Insecta 5.74(0.0001) 03ª 04a 05ab 99b 01b 06b 00b 02b Isopoda 0.63(0.732) NS Oligochaete 2.85(0.0118) 05ª 02ab 99ab 04ab 03ab 01ab 00b 06b Polychaete 3.29(0.0047) 01ª 04ab 03ab 99ab 06b 02b 05b 00b P12 Amphipoda 1.28(0.27) NS Bivalvia 1.18(0.33) NS Decapada 1.08(0.38) NS Gastropda 0.86(0.54) NS Insecta 5.01(0.0001) 04ª 03a 05ab 99ab 06ab 01b 00b 02b Isopoda 1.61(0.14) NS
Oligochaete 2.06(0.06) NS Polychaete 1.44(0.20) NS P13 Amphipoda 3.90(0.0014) 05ª 01ab 06b 00b 04b 03b 0b 99b Bivalvia 1.62(0.14) NS Decapada 0.66(0.70) NS Gastropoda 0.77(0.61) NS Insecta 5.92(0.0001) 05ª 04a 03ab 06b 99b 01b 00b 02b Isopoda 2.47(0.02) 05ª 04ab 99ab 03ab 06ab 02ab 00b 01b Oligochaete 7.10(0.0001) 05ª 04a 99a 06a 00ab 01ab 03bc 02c Polychaete 0.85(0.54) NS
138

Table 6.4-11. Among-year comparison of abundance by functional group for each site. Years are listed from greatest abundance to least. F (and p) values are from Analysis of Variance. Where ANOVA indicated a significant year effect, year differences were tested using a SNK post-hoc test. Years with the same superscript do not vary significantly (p<0.05). Site Group F(p) SNK(where ANOVA significant) P2 Deep burrowing 7.26(0.0001) 05ª 99a 04ab 03abc 06bcd 00cd 01cd 03d Surface/mobile 1.21(0.30) NS Sedentary/tube builder 2.88(0.0) 02ª 00a 04ab 06ab 05ab 99ab 01ab 03b P3A Deep burrowing 8.09(0.0001) 00ª 04ab 05ab 06ab 01bc 99c 02c 03c Surface/mobile 5.03(0.0001) 04ª 05b 03b 99b 06b 01b 00b 02b Sedentary/tube builder 3.26(0.005) 99ª 05a 02ab 04ab 03ab 01ab 00b 06b P3B Deep burrowing 9.90(0.0001) 06ª 00ab 04ab 05bc 99c 03c 01c 02c Surface/mobile 4.80(0.0002) 04ª 03ab 06bc 05bc 99bc 02bc 01c 00c Sedentary/tube builder 3.54(0.003) 04ª 02ab 99ab 01ab 03ab 06b 05b 00b P6 Deep burrowing 3.04(0.008) 99ª 05ab 06ab 04ab 03ab 00ab 02ab 01b Surface/mobile 6.09(0.0001) 05ª 99b 06b 04b 03b 02b 01b 00b Sedentary/tube builder 1.65(0.14) NS P7 Deep burrowing 4.52(0.0003) 03ª 00a 06a 05a 99ab 01ab 04ab 02b Surface/mobile 9.93(0.0001) 05ª 03a 04ab 06ab 99ab 01ab 00b 02c Sedentary/tube builder 0.94(0.48) NS P8 Deep burrowing 13.45(0.0001) 0ª 99ab 04ab 05ab 03ab 06b 01b 02c Surface/mobile 5.47(0.0001) 00ª 99ab 04ab 01bc 06abc 05bc 03bc 02c Sedentary/tube builder 3.65(0.002) 00ª 01ab 04abc 99abc 05abc 03bc 06bc 02c
P11 Deep burrowing 2.88(0.01) 05ª 02ab 99ab 04ab 03ab 01ab 00b 06b Surface/mobile 2.93(0.01) 03ª 04ab 05ab 01ab 99ab 06ab 02b 00b Sedentary/tube builder 3.52(0.003) 01ª 04ab 03ab 99ab 00ab 05ab 02ab 06b P12 Deep burrowing 2.10(0.06) NS Surface/mobile 3.22(0.005) 04ª 03ab 05ab 06ab 99ab 00ab 01ab 02b Sedentary/tube builder 2.23(0.05) 06ª 02a 01a 04a 99a 03a 05a 00a P13 Deep burrowing 7.10(0.0001) 05ª 04a 99a 06a 00ab 01ab 03abc 02c Surface/mobile 4.53(0.0004) 04ª 05a 03b 06b 99b 01b 00b 02b Sedentary/tube builder 1.05(0.40) NS
139

99P11
99P1299P13
99P2
99P3A99P3B
99P6
99P7
99P8
00P11
00P1200P13
00P2
00P3A
00P3B
00P6
00P7
00P8
01P11
01P12
01P13
01P2
01P3A01P3B
01P6
01P7
01P8
02P1102P12
02P13
02P2
02P3A02P3B02P6
02P7 02P8
03P11
03P1203P13
03P2
03P3A
03P3B
03P6
03P7
03P8
04P11
04P1204P13
04P2
04P3A04P3B
04P6
04P7
04P8
05P11
05P1205P13
05P2
05P3A
05P3B05P6
05P705P8
06P1106P12
06P13
06P2
06P3A06P3B
06P6
06P7
06P8
Stress: 0.21
Figure 6.4-1. Multi-dimensional scaling plot for infaunal community assemblages by site and year. These data show that the 1999-2001 years group differently than the 2002-2006 years. While this grouping does coincide with increasing drought conditions, the patterns do not show an accompanying return to conditions demonstrated in the pre-drought years. This rebound may occur on a longer time period, if at all.
Species richness and diversity exhibited significant variation among years and sites. 2000 and 2002 continued to represent the years of lowest diversity for most sites (6 sites exhibited lowest diversity in 2000, 2 sites had lowest diversity in 2002) (Table 6.4-12; Analysis of Variance followed by SNK comparison of means). Highest diversity occurred at most sites during 2003 (2 sites) or 2004 (3 sites), with 2005 having higher diversity for P7 and 2006 for P12. Patterns for other years were not as consistent. With the exception of P12, 2006 diversity patterns were generally intermediate relative to other years. Species richness was highest in 2004 for 5 of the 9 sites showing significant differences (and not significantly different from the year with highest species richness for the remaining sites) (Table 6.4-12). Lowest richness generally occurred in 2000 or 2002 (7 of 9 sites exhibiting significant differences). 2006 richness was intermediate relative to other years for most sites.
140

Table 6.4-12. Among-year comparison of diversity and species richness for each site. Years are listed from greatest abundance to least. F (and p) values are from Analysis of Variance. Where ANOVA indicated a significant year effect, year differences were tested using a SNK post-hoc test. Years with the same superscript do not vary significantly (p<0.05). Years with two letter superscripts were not different from either year. Site Metric F(p) SNK (where ANOVA significant) P2 Diversity 4.47(0.0004) 04a 00ab 06abc 99abc 05abc 03bc 01bc 02c Species Richness 2.88(0.01) 04a 05ab 00ab 06ab 99ab 02ab 01b 03b P3A Diversity 4.88(0.0002) 04a 03ab 99ab 05ab 02abc 01abc 06bc 00c
Species Richness 3.94(0.001) 04a 05a 99ab 03ab 06ab 02b 01b 00b P3B Diversity 4.60(0.0003) 04a 03a 99ab 02ab 05ab 01ab 06b 00b Species Richness 3.26(0.0052) 04a 03ab 99b 06b 05b 01b 02b 00b P6 Diversity 1.74(0.1167) NS Species Richness 4.23(0.0008) 99a 05a 04ab 06ab 03abc 02abc 01bc 00c P7 Diversity 7.80(0.0001) 05a 04a 06a 03ab 99ab 01ab 00bc 02c Species Richness 15.24(0.0001) 05a 03a 04a 06a 99a 01ab 00b 02c P8 Diversity 1.50(0.1807) NS Species Richness 4.38(0.0004) 00a 04a 99a 01a 06a 05a 03a 02b P11 Diversity 3.40(0.0036) 03a 01ab 04ab 99ab 05ab 02ab 06b 00b Species Richness 3.55(0.0027) 03a 04ab 01abc 99abc 05abc 02abc 06bc 00c P12 Diversity 2.69(0.0165) 06a 03ab 04ab 05ab 99ab 02ab 01ab 00b Species Richness 2.20(0.05) 04a 03a 06a 99a 05a 02a 00a 01a P13 Diversity 1.84(0.095) 03a 01ab 04ab 99ab 05ab 02ab 06b 00b Species Richness 3.51(0.003) 04a 05a 06ab 03ab 99ab 01ab 00b 02b
Among site comparisons for 2006, samples indicated low diversity for both low and high intertidal sites at the P3 and P13 sites (Figure 6.4-2) during this sampling period. For low intertidal sites, diversity was also low at P7, P8, and P11. Species richness did not show as strong a pattern, though richness was high at P2, consistent with the higher salinity of this site, and was low at P11 for low intertidal samples (Figure 6.4-3). Site P2 was dominated primarily by amphipods and polychaetes in 2006 while P3 sites were dominated more by oligochaetes. The lower estuarine sites in both the mainstem Cape Fear and the Northeast Cape Fear tributaries (P6 and P11) were dominated by various polychaete species (Marenzellaria, Boccardiella, Laeonereis, Hobsonia) and oligochaetes. Other sites (P12, P13, P7, and P8) were dominated by oligochaetes, insect larvae, and amphipods.
141

0.00
0.20
0.40
0.60
0.80
P2 P3A P3B P6 P7 P8 P11 P12 P13
DIV
ERSI
TY
Figure 6.4-2. Mean diversity for all sites sampled in 2006. This data represents both high and low intertidal subsites. Diversity was calculated using Shannon-Weiner diversity calculation.
142

0
5
10
15
20
25
30
P2 P3A P3B P6 P7 P8 P11 P12 P13
RIC
HNE
SS
Figure 6.4-3. Mean species richness for all sites sampled in 2006. This data represents both high and low intertidal subsites.
143

7.0 EPIBENTHIC STUDIES: DECAPODS AND EPIBENTHIC FISH
7.1 Summary
Fauna that live (during at least a portion of their lives) on or just over the substrate or derive a significant portion of their energy from the benthic environment are characterized as epibenthic. By and large, this group of organisms is represented by larval and/or juvenile stages of many finfish, and adult stages of some finfish taxa, and crustaceans. This study focuses on evaluating the abundance, diversity, and species richness of the epibenthic organisms that utilize both marsh interior and edge habitats along the mesohaline to oligohaline portion of the Cape Fear River estuary. For many taxa, distinct life history strategies depend on these marsh and tidal swamp habitats as refuge and forage for vulnerable early developmental stages. These groups represent a vital link between benthic secondary production and higher trophic levels. Here we evaluate utilization during critical recruitment periods in the spring and fall to detect potential impacts from deepening activities in the lower ~30 kilometers of the estuary. Since 1999, the UNCW Benthic Ecology Lab has conducted a series of seasonal studies focusing on shifts in community level factors such as composition, dominance, diversity, species richness, and abundance of the highly motile epibenthos. The distribution and abundance of this group of organisms is affected by the distribution and species composition of the benthic infauna (critical prey for most of the taxa collected as part of this study) discussed in Chapter 6. Many of the epibenthic organisms that have been the target of this study are the juveniles of commercially important species, e.g. Leiostomus xanthurus (spot) and Paralichthys spp. (flounder), or are critical prey items for fishery species.
This study was initiated in 1999 prior to the deepening of the Cape Fear River. Actual dredging activities started late in 2001, with a major portion of the activities taking place in the 2002-2003 time period, but continuing into 2006. Two methods were employed to sample epibenthos, Breder traps (a passive sampling device) deployed at multiple tidal positions within the marsh and Drop traps (an active density based sampling method) deployed along the shallow subtidal marsh edge habitat. Previous findings indicated changes in species patterns consistent with developing drought conditions in 2001 and 2002, though this period was also coincident with initial construction activity. The 2006-2007 (fall ’06 and spring ’07) sampling period also represents the initial stages of potential drought conditions (rainfall records <12 inches below annual average), but few indications of a response in the epibenthic fish community. Seasonal differences include shifts in species compositions, richness, and diversity. Seasonal shifts in species composition and shifts in abundance were expected based on life history strategies of common taxa. Overall, fall 2006 and spring 2007 represented seasons with intermediate abundances, diversity, and species richness.
7.2 Background
The presence of refuges and sufficient forage habitat are critical to maintaining community diversity and ecosystem function. Shifts in salinity or inundation period have been shown to effect community dynamics and could have an upward cascade effect on
144

prey composition and density. These increased inundation periods or changes in salinity could lead to shifts in vegetation type, dominance, or coverage directly altering habitat quality. Tidal fringing marsh and swamps provide essential habitat for juvenile fishes and crustaceans across the estuarine gradient. The maintenance of these habitats supports the commercial and recreational shrimp fishery (both Farfantepanaeus aztecus and Litopanaeus setiferus) in the lower Cape Fear River and provides essential refuge for juvenile blue crabs, Callinectes sapidus, several species of scianids, and a large number of prey fishes. These are critical fisheries for the Cape Fear region. Changes in the epibenthic organisms (either composition or abundance) could cause significant impacts on these critical groups, either through the direct impacts in the juvenile stages or through the shift in available forage species. Epibenthos are sensitive to changes associated with shifts in salinity and/or tidal inundation. The ingress of juvenile stages of many of the fishery species is closely dependent on the recruitment of prey species. In general, benthic fauna such as annelids tend towards highest abundances in early spring, following a winter relatively free of predator influence and abundant benthic production. Juvenile fish and crustaceans that depend on this benthic resource start invading the estuary by mid February with full recruitment of multi-species assemblages by early March. There is also a slightly smaller recruitment of benthos in the fall of each year and this too is closely followed by benthic feeding fishes and crustaceans. These annual cycles of recruitment were the basis for our focus on spring and fall sampling events.
As part of the long-term project to monitor potential changes in the communities that depend on these habitats, we are examining the epibenthic community (primarily fish and decapods) found along the marsh and swamp boundary. Aside from resident fish and decapods, epibenthos include juveniles of transient fish, crabs and shrimp, as well as larger snails, amphipods, and isopods. These organisms tend to be highly motile, are often able to utilize a variety of habitats, and may respond rapidly to environmental cues. Many species have larval stages that leave the upper estuary, making recruitment, and subsequent impacts on population levels, potentially responsive to changes in river hydrology. Examples of epibenthos in the Cape Fear system include important fisheries species such as the blue crab (Callinectes sapidus), spot (Leiostomus xanthurus), flounder (Paralichthys dentatus), and commercial shrimp (Farfantepanaeus sp. and Litopanaeus sp). Many epibenthos occupy critical intermediate trophic roles, being predators on benthos or plankton and prey for larger fish [e.g. grass shrimp (Palaemonetes spp.), killifish (Fundulus spp.), and bay anchovy (Anchoa sp.)]. Evaluation of epibenthos provides direct information on possible year class strength of target fishery and indicator species as well as indications of resource and ecosystem responses. Epibenthos may respond quickly to changing conditions because of their ability to move away from unfavorable conditions as well as their dependence on annual recruitment events.
Epibenthic taxa may represent indicators of ecosystem level changes for three reasons: 1) their motile lifestyles allow them to quickly respond to physical changes in the environment, 2) many of the species are juveniles that represent a critical “bottleneck” in year class strength that is sensitive to hydrodynamic factors affecting larval ingress, and 3) the intermediate trophic role of many epibenthos may lead to greater responsiveness to both changes in primary consumer abundances (e.g. benthos)
145

and higher predator abundances. Changes in tidal amplitude or salinity regimes may be first detected as a change in the distribution of certain epifaunal organisms, including shifts in dominance at a site or along the upstream/downstream gradient. Epifauna are sensitive to changes in many physical conditions and may show behavioral avoidance depending on the factor (i.e. rapid shift in dissolved oxygen, temperature, or salinity). Conversely, they may show consistency on the longer temporal scale (i.e. timing of ingress/egress into the estuary and dominance patterns). For many epifauna, especially the juveniles of transient fish, a critical factor may be resource limitation. The presence of a consistent and abundant food resource (including benthic fauna) and refuge (structural habitat within the marsh system) are important for determining population levels and survivorship.
The objective of this section of the monitoring project is to evaluate long-term trends in abundance, species composition, and habitat utilization of epibenthos, and to detect shifts (if any) in these patterns concordant with river deepening activities and any associated physical changes. The primary objective of the first 2 years of sampling (fall 1999-spring 2001) was to establish a baseline for species composition and abundance patterns. The third and fourth year of monitoring represents a construction phase of the project, and a potential impact to hydrology may start to become apparent at this time; likewise, a potential impact to the faunal communities may also begin to be detected. Any potential long-term impacts of the river deepening project would be detected by comparison of patterns in multiple years after channel deepening has been completed to pre-construction and construction patterns. As with the benthic infaunal sampling, some of the potential impacts to these communities are similar to those predicted for rapid sea level rise and so may indicate long-term community changes expected in other systems over the next several decades.
In previous reports, there have been three working hypotheses focusing only on main effects of channel deepening; however, a fourth hypothesis dealing with indirect effects of site development is also appropriate to mention;
1) Shifts in salinity, tidal inundation, or tidal amplitude may cause shifts in the epibenthic community composition and/or abundance. 2) Changes in the benthic community resulting from the deepening and widening of the river channel may cause a trophic cascading effect that will change the dominance patterns and distribution of some epibenthic species. 3) Hydrologic alterations may affect annual recruitment patterns into the estuary, especially for transient species. 4) Alteration of salinity regime, tidal inundation and/or tidal amplitude may lead to shifts in dominant marsh vegetation and alter epibenthic assemblages. The fourth hypothesis deals with several sites that seem to be in a state of “development” in terms of dominant vegetation, noted in Section 8.
146

7.3 Methodology
Marshes and boundary wetlands in the Cape Fear River estuary provide a variety of habitats, especially in the tidally influenced areas that have both intertidal and shallow subtidal edge habitats. We use two sampling methods, Breder traps and Drop traps, to target fauna with different utilization patterns. Breder trap sampling targets bottom oriented organisms that utilize the intertidal marsh or swamp habitat during the period of inundation. Breder traps are a passive form of sampling that average use patterns over a several hour period. This method has the advantage of being reliably deployed among a variety of structures. Drop trap sampling targets those organisms that utilize the shallow subtidal or “edge” habitat. It is an instantaneous method that provides reliable estimates for both bottom oriented and pelagic species, with the advantage of allowing high replication, but it is difficult to deploy within heavy structure.
Breder traps are constructed of clear acrylic (31 cm length X 16 cm height X 15 cm width). When submerged, these traps are transparent and catch epibenthic fish and crustaceans passively, as they move into the tidal wetlands. At each station, traps are placed at three tidal heights; lower intertidal (near mean low water), mid intertidal (submerged ~1m depth at mean high water), and upper intertidal (submerged ~ 0.5m at mean high water). Two sets of five traps are set at each tidal height with the opening oriented toward the channel or downstream. The orientation of the traps is based on preliminary data that indicates this positioning is optimal for obtaining highest catches. Each trap is secured to the substrate to ensure it maintains proper orientation. All traps are set on the rising tide and traps are allowed to “fish” for two hours. This time period is based on previous work and represents a compromise between obtaining higher catches and reducing possible loss due to escape, predation, or cannibalism among organisms within the traps. All organisms caught are identified to lowest possible taxon and representative specimens are preserved for verification. All organisms caught are measured for total length. Breder trap sampling is conducted at 9 sites: P11 (Smith Creek), P12 (Rat Island) and P13 (Fishing Creek) in the mainstem Cape Fear River, P6 (Eagle Island), P7 (Indian Creek), and P8 (Dollisons Landing) in the Northeast Cape Fear, and P2 (at the mouth of Town Creek) and 2 sites at P3 in Town Creek.
Drop traps sample those epibenthos utilizing the lower marsh edge or shallow subtidal regions adjacent to the marsh. The drop trap is an aluminum square that is 1m on a side and 1m high with mesh netting and floats attached to the top edge to prevent organisms from escaping. The trap is deployed from a boat using a large boom that suspends the trap 6-8 feet above the water surface. When the trap is released, its weight drives it into the substrate and seals the bottom to prevent organisms from escaping beneath the trap (each drop is checked for an adequate bottom seal upon deployment to ensure that organisms cannot escape). Eighteen replicate drops are made in the shallow subtidal areas at each station. Replicate samples are taken at least 10m apart and at least 20 minutes is allowed between each sample. Once the trap is secured the contents are removed using a steel frame sweep net with a 2mm mesh. The trap is considered empty when five consecutive sweeps of the entire trap yield no organisms. All organisms caught are identified, enumerated, and measured (total length). Representatives of each
147

species caught are preserved for verification. Drop sampling is conducted at the same sites as Breder trap sampling, except that the two P3 subsites are sampled as one site because of edge area limitations.
Drop trap and Breder trap sampling was conducted during the same time window for all stations. At least 24 hours separated the use of each method at a site. While Breder traps were deployed on a single day per site, drop trap samples were collected over a 3+ day period for each site. The collection of drop trap data over a multi-day sampling period gives a more accurate evaluation of the use of the subtidal areas adjacent to each site.
For this report, we present mean abundance of epibenthos for each station by year and season (reflecting seasonal variation in faunal abundances) (Tables 7.4-1 and 7.4-17). To evaluate potential trends and community level responses, analyses for this report focus on differences in diversity, species richness, and total fauna by season across years. Breder trap and drop trap data was analyzed separately. Because of interactions between seasons and among sites the data was analyzed using a 1-way Analysis of Variance among years for each season. The Shannon-Weiner diversity index was used to describe diversity patterns at each site. The Shannon-Weiner diversity index accounts for both species abundance and evenness among species. Comparisons of diversity among sites were conducted using Analysis of Variance. Where significant year effects were found, an SNK test was used to distinguish among years. Overall community comparisons, including all species present, were analyzed using an Analysis of Similarity with Primer 6.0 a multivariate statistical package. Fall and spring data were analyzed separately, results are presented in a multidimensional scaling plot.
7.4 Community Evaluation
Multivariate Analysis
Multivariate analysis techniques were applied to both Breder trap and Drop trap data sets. Due to the large number of subsites per site/season combination, analysis of data collected using Breder traps showed no discernible patterns. However, data from the epibenthic catches along the marsh edge (drop trap), show weak annual groupings for spring (Figure 7.4-1). These data show that 2002 and 2003 continue to group together weakly, likewise 2001 and 2000 appear as closely related groups, and 2004-2007 cluster together. Analyses for fall (Figure 7.4-2) show that 2002 and 2000 form groups, but that most other site/year combinations cluster somewhere between them. These close groupings most likely reflect the overlap in dominant species and an overall similarity of rare species.
Dominance Patterns
Cumulative species curves indicate that the accumulation of new species reached its peak in 2002-2004. Since 2005, only a handful of species have been added to either the Breder trap or drop trap species listing. The current cumulative species listing by Breder trap and drop trap are 58 and 86 respectively. The mean abundance and standard errors for
148

each taxa by site/season/year is presented for marsh samples (Breder traps) in Tables 7.4-1 through 7.4-9, while marsh edge data (drop trap) is presented in Tables 7.4-10 through 7.4-17. Several species were consistently present among the numerically dominant (comprising >10% of the total number of individuals collected) taxa among years and across habitats. Leiostomus xanthurus (spot) was the most common taxa collected in both habitats during spring 2007, comprising 50% or more of the total catch for 7 of 9 sites. Other dominant taxa include two species of goby, Ctenogobius shufeldi (freshwater goby) and Ctenogobius boleosoma, Palaemonetes pugio (grass shrimp), and Trinectes maculates (hogchoker). Several species of flounder (Paralichthyes spp.) were also prominent in both fall and spring catches, but dominant in marsh edge samples rather than marsh interior samples. While the fiddler crabs, Uca minax, and Uca pugilator, were common across most sites and seasons, 2000-spring 2006; in fall 2006 and spring 2007, only Uca minax was dominant. This relatively minor shift in dominance may be reflective of potential shifts in flow or salinity following increasing drought conditions in the Cape Fear region throughout this time period. Anchoa mitchilli (anchovies) and Menidia beryllina (silverside) had previously been reported from marsh edge samples (during fall) and comprised greater than 5% of the total catch in the fall 2006 samples, but were rarely collected in marsh interior samples. Likewise larval clupeids were collected along the marsh edge during spring sampling. These species are surface oriented and feed in open water. However, as reported in the 2006 summary, they are consistently captured along the marsh edge. While we report these species as part of our overall epibenthic evaluation, neither of these species (or the larval clupeids captured along the marsh edge in the spring) are considered epibenthic. Their consistent presence along the marsh edge suggests a potential benefit from utilizing this habitat. It seems likely that these organisms may receive some benefit through a reduction in predation along the shallow margins of the estuary.
Community Measures
Analysis of species richness data from both marsh interior (Breder trap) and marsh edge (drop trap) samples detected significant differences in utilization among years, across both sampling seasons at most sites. Fall 2006 represented an intermediate year in terms of species richness for 6 out of 9 comparisons, and an all time low for one of the inner Town Creek sites and the Eagle Island site (Table 7.4-18). Spring 2007 was intermediate for all comparisons, except the Inner Town Creek site where species numbers were still at an all time low (Table 7.4-19). Marsh edge showed similar patterns to interior samples, with intermediate values for fall 2006 and spring 2007 (Table 7.4-24 and 7.4-25).
149

00SPRP1100SPRP12
00SPRP13
00SPRP2
00SPRP3
00SPRP600SPRP7
00SPRP801SPRP11
01SPRP12
01SPRP13
01SPRP2
01SPRP3
01SPRP6
01SPRP7
01SPRP8
02SPRP11
02SPRP12
02SPRP1302SPRP2
02SPRP3
02SPRP6
02SPRP7
02SPRP8
03SPRP11
03SPRP12 03SPRP13
03SPRP2
03SPRP3
03SPRP603SPRP7
03SPRP8
04SPRP11
04SPRP1204SPRP13
04SPRP204SPRP3
04SPRP604SPRP7
04SPRP8
05SPRP1105SPRP12
05SPRP13
05SPRP2
05SPRP3
05SPRP6
05SPRP705SPRP8
06SPRP1106SPRP12
06SPRP13
06SPRP2
06SPRP306SPRP6
06SPRP7
06SPRP8
07SPRP1107SPRP12
07SPRP13
07SPRP207SPRP307SPRP6
07SPRP7
07SPRP8
Stress: 0.19
Figure 7.4-1. Analysis of similarity (PRIMER 6.0) based on Spring Drop Trap samples from 2000 to 2007. Plot shows weak year groupings for 2000 and 2002. All other years seem to group relatively closely.
99FALLP11
99FALLP12
99FALLP13
99FALLP299FALLP3
99FALLP6
99FALLP7
99FALLP800FALLP11
00FALLP12
00FALLP13
00FALLP2
00FALLP300FALLP600FALLP7
00FALLP8
01FALLP1101FALLP12
01FALLP13
01FALLP201FALLP301FALLP6
01FALLP701FALLP8
02FALLP11
02FALLP1202FALLP13
02FALLP202FALLP302FALLP6
02FALLP7
02FALLP8
03FALLP1103FALLP12
03FALLP13
03FALLP203FALLP3
03FALLP6
03FALLP703FALLP8
04FALLP11
04FALLP1204FALLP13
04FALLP204FALLP304FALLP6
04FALLP704FALLP8
05FALLP11
05FALLP12
05FALLP13
05FALLP2
05FALLP305FALLP6
05FALLP705FALLP8
06FALLP1106FALLP12
06FALLP13
06FALLP2
06FALLP306FALLP606FALLP706FALLP8
Stress: 0.19
Figure 7.4-2. Analysis of similarity (PRIMER 6.0) for Fall Drop Trap samples from 1999 to 2006. This plot shows some clustering of sites, with 2000 and 2002 clustering as groups and most other site-year combinations falling between these two clusters.
150

151
Diversity measures for the two sampling types showed almost identical patterns, with fall 2006 being intermediate for both marsh interior (interestingly 4 sites showed no difference among years) and marsh edge habitats (Tables 7.4-20 and 7.4-26), and intermediate to low in the significant comparisons in spring 2007 (Tables 7.4-21 and 7.4-27). Not surprising, this pattern followed the general trends observed with species richness. Even comparisons of total abundance among years revealed that 2006-2007 sampling year was by and large average (Tables 7.4-22, 7.4-23, 7.4-28, and 7.4-29). The only exception to trend for three indicators (richness, diversity, and total abundance) is the inner Town Creek site. All parameters for interior marsh utilization were low. However, there are no observations that make this site seem remarkable and the other inner Town Creek site follows the trend observed for other sites along the river.

152
Table 7.4-1a. Mean abundance (SE) for epibenthic fauna collected during fall (1999-2006) Breder trap samples at station P2 (Mouth of Town Creek). Fall 1999 Fall 2000 Fall 2001 Fall 2002 Fall 2003 Fall 2004 Fall 2005 Fall 2006 Low Mid Upper Low Mid Upper Low Mid Upper Low Mid Upper Low Mid Upper Low Mid Upper Low Mid Upper Low Mid Upper
Anchoa mitchelli 0(0) 0(0) 0(0) 0(0) 0(0) 0(0) 0(0) 0(0) 0(0) 0(0) 0(0) 0(0) 0(0) 0(0) 0(0) 0(0) 0(0) 0(0) 0(0) 0(0) 0(0) 0(0) 0(0) 0(0)
Callinectes sapidus 0(0) 0(0) 0(0) 0.10 (0.10) 0(0) 0(0) 0.10 (0.10) 0(0) 0.20 (0.20) 0(0) 0.30 (0.15) 0.10 (0.10) 0(0) 0(0) 0(0) 0(0) 0(0) 0(0) 0(0) 0(0) 0(0) 0(0) 0(0) 0(0)
Clupeidae 0(0) 0(0) 0(0) 0(0) 0(0) 0(0) 0(0) 0(0) 0(0) 0(0) 0(0) 0(0) 0(0) 0(0) 0(0) 0(0) 0(0) 0(0) 0(0) 0(0) 0(0) 0(0) 0(0) 0(0)
Ctenogobius boleosoma 0(0) 0(0) 0(0) 0(0) 0(0) 0(0) 0(0) 0(0) 0(0) 0(0) 0(0) 0(0) 0(0) 0(0) 0(0) 0(0) 0(0) 0(0) 0.30 (0.21)
0.30 (0.15)
0.30 (0.21) 0(0) 0.10
(0.10) 0(0)
Ctenogobius shufeldti 0.10 (0.10) 0(0) 0(0) 0(0) 0(0) 0(0) 0(0) 0(0) 0(0) 0(0) 0(0) 0(0) 010 (0.10) 0(0) 0.10 (0.10) 0.10 (0.10)
0.10 (0.10) 0.10 (0.10) 0(0) 0(0) 0(0) 0(0) 0(0) 0(0)
Eucinostomus sp. 0(0) 0(0) 0(0) 0(0) 0(0) 0(0) 0(0) 0(0) 0(0) 0(0) 0(0) 0(0) 0(0) 0(0) 0(0) 0(0) 0(0) 0(0) 0(0) 0(0) 0.10 (0.10) 0(0) 0(0) 0(0)
Farfantepenaeus aztecus 0(0) 0(0) 0(0) 0.70 (0.33) 0.90 (0.28) 0.60 (0.27) 0.10 (0.10) 0.10 (0.10) 0.10 (0.10) 3.50 (0.82) 4.50 (1.18) 3.70 (1.68) 0(0) 0(0) 0(0) 0(0) 0(0) 0(0) 0(0) 0(0) 0(0) 0(0) 0(0) 0(0)
Fundulus heteroclitus 0(0) 0(0) 0(0) 0(0) 0(0) 0(0) 0(0) 0(0) 0(0) 0(0) 0(0) 0(0) 0(0) 0(0) 0(0) 0(0) 0(0) 0.10 (0.10) 0(0) 0(0) 0(0) 0(0) 0(0) 0(0)
Fundulus sp. 0(0) 0(0) 0(0) 0(0) 0(0) 0(0) 0(0) 0(0) 0(0) 0(0) 0(0) 0(0) 0(0) 0(0) 0(0) 0(0) 0(0) 0(0) 0(0) 0(0) 0(0) 0(0) 0(0) 0(0)
Gambusia affinis 0(0) 0.10 (0.10) 0(0) 0(0) 0(0) 0(0) 0(0) 0(0) 0(0) 0(0) 0(0) 0(0) 0(0) 0(0) 0(0) 0(0) 0(0) 0(0) 0(0) 0(0) 0(0) 0(0) 0(0) 0(0)
Hirudinea 0(0) 0(0) 0(0) 0(0) 0(0) 0(0) 0(0) 0(0) 0(0) 0(0) 0(0) 0(0) 0(0) 0(0) 0(0) 0(0) 0(0) 0(0) 0(0) 0(0) 0(0) 0(0) 0(0) 0(0)
Lagodon rhomboides 0(0) 0(0) 0(0) 0(0) 0(0) 0(0) 0(0) 0(0) 0(0) 0(0) 0(0) 0(0) 0(0) 0(0) 0(0) 0(0) 0(0) 0(0) 0(0) 0(0) 0(0) 0(0) 0(0) 0(0)
Leiostomas xanthurus 0(0) 0(0) 0(0) 0(0) 0(0) 0(0) 0(0) 0(0) 0(0) 0(0) 0(0) 0(0) 0(0) 0(0) 0(0) 0(0) 0(0) 0(0) 0(0) 0(0) 0(0) 0(0) 0(0) 0(0)
Litopenaeus setiferus 0(0) 0(0) 0(0) 0(0) 0(0) 0(0) 0(0) 0(0) 0(0) 0(0) 0(0) 0(0) 0(0) 0(0) 0(0) 0.30 (0.15) 0(0) 0.20 (0.13) 0.70
(0.26) 0.50
(0.22) 0.50
(0.17) 0.70
(0.26)0.40
(0.16)0.50
(0.17)
Micropogonias undulatus 0(0) 0(0) 0(0) 0(0) 0(0) 0(0) 0(0) 0(0) 0(0) 0(0) 0(0) 0(0) 0(0) 0(0) 0(0) 0(0) 0(0) 0.10 (0.10) 0.20 (0.13)
0.10 (0.10)
0.20 (0.13) 0(0) 0(0) 0(0)
Mugil cephalus 0(0) 0(0) 0(0) 0(0) 0(0) 0(0) 0(0) 0(0) 0(0) 0(0) 0(0) 0(0) 0(0) 0(0) 0(0) 0(0) 0(0) 0(0) 0(0) 0(0) 0(0) 0(0) 0(0) 0(0)
Palaemonetes pugio 0(0) 0.30 (0.15) 0.10 (0.10) 0(0) 0(0) 0(0) 0.10 (0.10) 0.30 (0.21) 0.40 (0.22) 0.60 (0.31) 0.80 (0.42) 0.30 (0.15) 0(0) 0(0) 0(0) 0.40 (0.31)
0.60 (0.27) 0.50 (0.22) 0(0) 0(0) 0.70
(0.39) 0(0) 0(0) 0.10 (0.10)
Palaemonetes vulgaris 0(0) 0(0) 0(0) 0(0) 0(0) 0(0) 0(0) 0(0) 0(0) 0(0) 0(0) 0(0) 0(0) 0(0) 0(0) 0(0) 0(0) 0(0) 0(0) 0.10 (0.10)
0.10 (0.10) 0(0) 0(0) 0(0)
Paralichthys dentatus 0(0) 0(0) 0(0) 0(0) 0(0) 0(0) 0(0) 0(0) 0(0) 0(0) 0(0) 0(0) 0(0) 0(0) 0(0) 0(0) 0(0) 0(0) 0(0) 0(0) 0(0) 0(0) 0(0) 0(0)
Paralichthys lethostigma 0(0) 0(0) 0(0) 0(0) 0(0) 0(0) 0(0) 0(0) 0(0) 0(0) 0(0) 0.10 (0.10) 0(0) 0(0) 0(0) 0(0) 0(0) 0(0) 0(0) 0(0) 0(0) 0(0) 0(0) 0(0)
Paralichthys sp. 0(0) 0(0) 0(0) 0(0) 0(0) 0(0) 0(0) 0(0) 0(0) 0(0) 0(0) 0(0) 0(0) 0(0) 0(0) 0(0) 0(0) 0(0) 0(0) 0(0) 0(0) 0(0) 0(0) 0(0)
Rhithropanopeus harrisii 0(0) 0(0) 0(0) 0(0) 0(0) 0(0) 0(0) 0(0) 0(0) 0(0) 0(0) 0(0) 0(0) 0(0) 0(0) 0(0) 0(0) 0(0) 0(0) 0(0) 0.10 (0.10) 0(0) 0(0) 0(0)
Symphurus plagiusa 0(0) 0(0) 0(0) 0(0) 0(0) 0(0) 0(0) 0(0) 0.10 (0.10) 0.10 (0.10) 0.20 (0.13) 0(0) 0(0) 0(0) 0(0) 0(0) 0(0) 0(0) 0(0) 0(0) 0(0) 0(0) 0(0) 0(0)
Syngnathidae 0(0) 0(0) 0(0) 0(0) 0(0) 0(0) 0(0) 0(0) 0(0) 0(0) 0.10 (0.10) 0(0) 0(0) 0(0) 0(0) 0(0) 0(0) 0(0) 0(0) 0(0) 0(0) 0(0) 0(0) 0(0)
U/I insect 0(0) 0.10 (0.10) 0(0) 0(0) 0(0) 0(0) 0(0) 0(0) 0(0) 0(0) 0(0) 0(0) 0(0) 0(0) 0(0) 0(0) 0(0) 0(0) 0(0) 0(0) 0(0) 0(0) 0(0) 0(0)
U/I larval fish 0(0) 0(0) 0(0) 0(0) 0(0) 0(0) 0(0) 0(0) 0(0) 0(0) 0(0) 0(0) 0(0) 0(0) 0(0) 0(0) 0(0) 0(0) 0(0) 0(0) 0(0) 0(0) 0(0) 0(0)
Uca minax 0(0) 0(0) 0(0) 0(0) 0(0) 0(0) 0(0) 0(0) 0(0) 0(0) 0(0) 0(0) 0(0) 0(0) 0(0) 0(0) 0(0) 0(0) 0(0) 0(0) 0(0) 0(0) 0(0) 0(0)
Uca pugilator 0(0) 0(0) 0(0) 0(0) 0(0) 0(0) 0(0) 0(0) 0(0) 0(0) 0(0) 0(0) 1.50 (1.19) 0(0) 0(0) 0(0) 0(0) 0(0) 0(0) 0(0) 0(0) 0(0) 0(0) 0(0)
Uca pugnax 0(0) 0(0) 0.10 (0.10) 0(0) 0(0) 0(0) 0(0) 0(0) 0(0) 0(0) 0(0) 0(0) 0(0) 0(0) 0(0) 0(0) 0(0) 0(0) 0(0) 0(0) 0(0) 0(0) 0(0) 0(0)
Uca sp. 0(0) 0(0) 0(0) 0(0) 0(0) 0(0) 0(0) 0(0) 0(0) 0(0) 0(0) 0.80 (0.80) 0.10 (0.10) 0(0) 0(0) 0(0) 0(0) 0(0) 0(0) 0(0) 0(0) 0(0) 0(0) 0(0)

153
Table 7.4-1b. Mean abundance (SE) for epibenthic fauna collected during spring (2000-2007) Breder trap samples at station P2 (Mouth of Town Creek). Spring 2000 Spring 2001 Spring 2002 Spring 2003 Spring 2004 Spring 2005 Spring 2006 Spring 2007 Low Mid Upper Low Mid Upper Low Mid Upper Low Mid Upper Low Mid Upper Low Mid Upper Low Mid Upper Low Mid Upper
Anchoa mitchelli 0(0) 0(0) 0(0) 0(0) 0(0) 0(0) 0(0) 0(0) 0(0) 0(0) 0(0) 0(0) 0(0) 0(0) 0(0) 0(0) 0(0) 0(0) 0(0) 0(0) 0(0) 0(0) 0(0) 0.10 (0.10)
Callinectes sapidus 0(0) 0(0) 0(0) 0(0) 0(0) 0.20 (0.13) 0.10 (0.10) 0.10 (0.10) 0(0) 0(0) 0(0) 0(0) 0(0) 0(0) 0.10 (0.10) 0.70 (0.33) 0.20 (0.13) 0.30 (0.15) 0(0) 0(0) 0(0) 0(0) 0.11 (0.11) 0(0)
Clupeidae 0(0) 0(0) 0(0) 0(0) 0(0) 0(0) 0(0) 0(0) 0(0) 0(0) 0(0) 0(0) 0(0) 0(0) 0(0) 0(0) 0(0) 0(0) 0.40 (0.30)
0.20 (0.13) 0(0) 0.10
(0.10) 0(0) 0(0)
Ctenogobius boleosoma 0(0) 0(0) 0(0) 0(0) 0(0) 0(0) 0(0) 0(0) 0(0) 0(0) 0(0) 0(0) 0(0) 0(0) 0(0) 0.50 (0.22) 0(0) 0(0) 0(0) 0(0) 0(0) 0(0) 0(0) 0(0)
Ctenogobius shufeldti 0.10 (0.10) 0.20 (0.13) 0(0) 0.10 (0.10) 0(0) 0(0) 0(0) 0(0) 0(0) 0(0) 0(0) 0(0) 0.40 (0.27) 0.30 (0.30) 0.10 (0.10) 0.40 (0.22) 0.40 (0.22) 0.10 (0.10) 0(0) 0.10
(0.10) 0(0) 0(0) 0(0) 0(0)
Eucinostomus sp. 0(0) 0(0) 0(0) 0(0) 0(0) 0(0) 0(0) 0(0) 0(0) 0(0) 0(0) 0(0) 0(0) 0(0) 0(0) 0(0) 0(0) 0(0) 0(0) 0(0) 0(0) 0(0) 0(0) 0(0)
Farfantepenaeus aztecus 0(0) 0(0) 0(0) 0(0) 0(0) 0(0) 0(0) 0(0) 0(0) 0(0) 0(0) 0(0) 0(0) 0(0) 0.10 (0.10) 0(0) 0(0) 0(0) 0(0) 0(0) 0(0) 0(0) 0(0) 0(0)
Fundulus heteroclitus 0.10 (0.10) 0.10 (0.10) 0(0) 0.20 (0.13) 0.20 (0.13) 0.10 (0.10) 0(0) 0(0) 0(0) 0(0) 0(0) 0.10 (0.10) 0.30 (0.15) 0.20 (0.13) 1.00 (0.33) 0(0) 0(0) 0(0) 0(0) 0(0) 0.30
(0.21) 0(0) 0(0) 0.20 (0.13)
Fundulus sp. 0(0) 0(0) 0(0) 0(0) 0(0) 0(0) 0(0) 0(0) 0(0) 0(0) 0(0) 0(0) 0(0) 0(0) 0(0) 0.20 (0.13) 0.30 (0.15) 0.20 (0.20) 0(0) 0(0) 0(0) 0(0) 0(0) 0(0)
Gambusia Affinis 0(0) 0(0) 0(0) 0(0) 0(0) 0(0) 0(0) 0(0) 0(0) 0(0) 0(0) 0(0) 0(0) 0(0) 0(0) 0(0) 0(0) 0(0) 0(0) 0(0) 0(0) 0(0) 0(0) 0(0)
Hirudinea 0(0) 0.10 (0.10) 0(0) 0(0) 0(0) 0(0) 0(0) 0(0) 0(0) 0(0) 0(0) 0(0) 0(0) 0(0) 0(0) 0(0) 0(0) 0(0) 0(0) 0(0) 0(0) 0(0) 0(0) 0(0)
Lagodon rhomboides 0.20 (0.13) 0(0) 0(0) 0(0) 0(0) 0(0) 0(0) 0(0) 0(0) 0(0) 0(0) 0(0) 0(0) 0.10 (0.10) 0.10 (0.10) 0.10 (0.10) 0(0) 0(0) 0.40
(0.16)0.30
(0.21) 0(0) 0.40 (0.22)
0.22 (0.15) 0(0)
Leiostomas xanthurus 9.90 (2.66) 5.00 (1.62) 5.30 (2.33) 0(0) 0(0) 0.50 (0.22) 1.00 (0.54) 0.50 (0.27) 0.30 (0.21) 0(0) 0(0) 0(0) 2.60 (1.64) 2.20 (0.44) 1.40 (0.40) 2.10 (0.48) 3.30 (0.67) 2.90 (0.74) 20.60
(7.56)20.70 (5.78)
17.20 (5.67)
11.50 (1.53)
21.44 (2.30)
29.10 (6.92)
Litopenaeus setiferus 0(0) 0(0) 0(0) 0(0) 0(0) 0(0) 0(0) 0(0) 0(0) 0(0) 0(0) 0(0) 0(0) 0(0) 0(0) 0(0) 0(0) 0(0) 0(0) 0(0) 0(0) 0(0) 0(0) 0(0)
Micropogonias undulates 0(0) 0(0) 0(0) 0(0) 0(0) 0(0) 0.10 (0.10) 0(0) 0(0) 0(0) 0(0) 0(0) 0(0) 0(0) 0(0) 0(0) 0(0) 0(0) 0(0) 0(0) 0(0) 0(0) 0(0) 0(0)
Mugil cephalus 0(0) 0(0) 0(0) 0(0) 0(0) 0(0) 0(0) 0.10 (0.10) 0(0) 0(0) 0(0) 0(0) 0(0) 0(0) 0(0) 0(0) 0(0) 0(0) 0(0) 0(0) 0.10 (0.10) 0(0) 0(0) 0.40
(0.40) Palaemonetes pugio 1.50
(0.43) 1.40 (0.52) 2.30 (1.04) 2.00 (0.82) 1.10 (0.53) 1.30 (0.68) 1.00 (0.45) 1.00 (0.47) 0.10 (0.10) 0.80 (0.44) 0.80 (0.51) 1.70 (0.96) 1.60 (0.67) 1.80 (0.36) 1.30 (0.50) 1.90 (0.41) 3.80 (0.57) 1.50 (0.43) 1.00 (0.30)
1.00 (0.49)
1.00 (0.52)
3.70 (0.91)
3.44 (1.00)
0.40 (0.22)
Palaemonetes vulgaris 0(0) 0(0) 0(0) 0(0) 0(0) 0(0) 0(0) 0(0) 0(0) 0(0) 0(0) 0(0) 0(0) 0(0) 0(0) 0(0) 0(0) 0(0) 0(0) 0(0) 0(0) 0(0) 0(0) 0(0)
Paralichthys dentatus 0(0) 0(0) 0(0) 0(0) 0(0) 0 (0) 0(0) 0(0) 0(0) 0.10 (0.10) 0.10 (0.10) 0(0) 0(0) 0(0) 0(0) 0(0) 0(0) 0(0) 0(0) 0(0) 0(0) 0(0) 0(0) 0(0)
Paralichthys lethostigma 0(0) 0(0) 0(0) 0(0) 0(0) 0(0) 0(0) 0(0) 0(0) 0(0) 0(0) 0(0) 0(0) 0(0) 0(0) 0(0) 0(0) 0(0) 0(0) 0(0) 0(0) 0(0) 0(0) 0(0)
Paralichthys sp. 0(0) 0(0) 0(0) 0(0) 0(0) 0 (0) 0(0) 0(0) 0(0) 0(0) 0(0) 0(0) 0(0)
0(0) 0(0)
0(0) 0(0) 0.30 (0.15) 0(0) 0.10 (0.10) 0(0) 0(0) 0(0) 0(0) 0(0) 0(0)
Rhithropanopeus harrisii 0(0) 0(0) 0(0) 0(0) 0(0) 0(0) 0(0) 0(0) 0(0) 0(0) 0(0) 0(0) 0(0) 0(0) 0(0) 0(0) 0(0) 0(0) 0(0) 0(0) 0(0) 0(0) 0(0) 0(0)
Symphurus plagiusa 0(0) 0(0) 0(0) 0(0) 0(0) 0(0) 0(0) 0(0) 0(0) 0(0) 0(0) 0(0) 0(0) 0(0) 0(0) 0(0) 0(0) 0(0) 0(0) 0(0) 0(0) 0(0) 0(0) 0(0)
Syngnathidae 0(0) 0(0) 0(0) 0(0) 0(0) 0(0) 0(0) 0(0) 0(0) 0(0) 0(0) 0(0) 0(0) 0(0) 0(0) 0(0) 0(0) 0(0) 0(0) 0(0) 0(0) 0(0) 0(0) 0(0)
U/I insect 0(0) 0(0) 0(0) 0(0) 0(0) 0(0) 0(0) 0(0) 0(0) 0(0) 0(0) 0(0) 0(0) 0(0) 0(0) 0(0) 0(0) 0(0) 0(0) 0(0) 0(0) 0(0)
U/I larval fish 0(0) 0(0) 0(0) 0(0) 0(0) 0.10 (0.10) 0(0) 0(0) 0(0) 0.20 (0.13) 0.80 (0.59) 0.10 (0.10) 0.30 (0.30) 0(0) 0(0) 0(0) 0(0) 0(0) 0(0) 0(0) 0(0) 0(0) 0(0) 0(0)
Uca minax 0(0) 0(0) 0(0) 0(0) 0(0) 0 (0) 0(0) 0(0) 0(0) 0(0) 0(0) 0.10 (0.10) 0(0) 0(0) 0(0) 0(0) 0(0) 0(0) 0(0) 0(0) 0(0) 0(0) 0(0) 0(0)
Uca pugilator 0(0) 0(0) 0(0) 0(0) 0(0) 0(0) 0(0) 0(0) 0(0) 0(0) 0(0) 0(0) 0(0) 0(0) 0(0) 0(0) 0(0) 0(0) 0(0) 0(0) 0(0) 0(0) 0(0) 0(0)
Uca pugnax 0(0) 0(0) 0(0) 0(0) 0(0) 0(0) 0(0) 0(0) 0(0) 0(0) 0(0) 0(0) 0(0) 0(0) 0(0) 0(0) 0(0) 0(0) 0(0) 0(0) 0(0) 0(0) 0(0) 0(0)
Uca sp. 0(0) 0(0) 0(0) 0(0) 0(0) 0(0) 0(0) 0(0) 0(0) 0(0) 0(0) 0(0) 0(0) 0(0) 0(0) 0(0) 0(0) 0(0) 0(0) 0(0) 0(0) 0(0) 0(0) 0(0)

154
Table 7.4-2a. Mean abundance (SE) for epibenthic fauna collected during fall (1999-2006) Breder trap samples at station P3A (Town Creek). Fall 1999 Fall 2000 Fall 2001 Fall 2002 Fall 2003 Fall 2004 Fall 2005 Fall 2006 Low Mid Upper Low Mid Upper Low Mid Upper Low Mid Upper Low Mid Upper Low Mid Upper Low Mid Upper Low Mid Upper
Callinectes sapidus 0(0) 0(0) 0(0) 0(0) 0(0) 0(0) 0(0) 0(0) 0(0) 0(0) 0(0) 0(0) 0.10 (0.10) 0.10 (0.10) 0(0) 0(0) 0(0) 0(0) 0(0) 0(0) 0(0) 0(0) 0(0) 0(0)
Ctenogobius boleosoma 0(0) 0(0) 0(0) 0(0) 0(0) 0(0) 0(0) 0(0) 0(0) 0(0) 0(0) 0(0) 0(0) 0(0) 0(0) 0(0) 0(0) 0(0) 0(0) 0(0) 0(0) 0(0) 0(0) 0(0)
Ctenogobius shufeldti 0(0) 0.10 (0.10) 0.10 (0.10) 0(0) 0.80
(0.47) 0(0) 0(0) 0(0) 0(0) 0(0) 0(0) 0(0) 0.30 (0.21) 0.10 (0.10) 0.40 (0.22) 0.30
(0.15) 0.30
(0.21) 0(0) 0(0) 0(0) 0(0) 0.10 (0.10) 0(0) 0(0)
Eucinostomus sp. 0(0) 0(0) 0(0) 0(0) 0(0) 0(0) 0(0) 0(0) 0(0) 0(0) 0(0) 0(0) 0(0) 0(0) 0(0) 0(0) 0(0) 0(0) 0(0) 0(0) 0(0) 0(0) 0(0) 0.10 (0.10)
Farfantepenaeus aztecus 0(0) 0(0) 0(0) 0(0) 0(0) 0(0) 0(0) 0(0) 0(0) 0.33 (0.33)
0.20 (0.13) 0.70 (0.50) 0(0) 0(0) 0(0) 0(0) 0(0) 0(0) 0(0) 0(0) 0(0) 0(0) 0(0) 0(0)
Fundulus heteroclitus 0(0) 0(0) 0(0) 0.20 (.20) 0.10 (0.10) 0.10 (0.10) 0.10
(0.10) 0.20
(0.13) 0.40 (0.16) 0.22 (0.15) 0(0) 0(0) 0.10 (0.10) 0.10
(0.10) 0.70 (0.40) 0(0) 0(0) 0(0) 0(0) 0.10 (0.10)
0.10 (0.10) 0(0) 0(0) 0(0)
Fundulus sp. 0(0) 0(0) 0(0) 0(0) 0(0) 0(0) 0(0) 0(0) 0(0) 0(0) 0(0) 0(0) 0(0) 0(0) 0(0) 0(0) 0(0) 0(0) 0(0) 0(0) 0(0) 0(0) 0(0) 0(0)
Gambusia affinis 0(0) 0(0) 0(0) 0(0) 0(0) 0(0) 0(0) 0(0) 0(0) 0(0) 0(0) 0(0) 0(0) 0(0) 0(0) 0(0) 0(0) 0(0) 0(0) 0(0) 0(0) 0(0) 0(0) 0(0)
Gambusia holbrooki 0(0) 0(0) 0(0) 0(0) 0.20 (0.20) 0(0) 0.50
(0.31) 1.10
(0.41) 0.50 (0.31) 0.11 (0.11)
0.20 (0.20) 0.20 (0.20) 0.60 (0.50) 1.60
(0.85) 1.20 (0.57) 0(0) 0(0) 0.10 (0.10) 0(0) 0.70 (0.60)
1.40 (0.60) 0(0) 0(0) 0.40
(0.22)
Gobiosoma sp. 0(0) 0(0) 0(0) 0(0) 0(0) 0(0) 0(0) 0(0) 0(0) 0.11 (0.11) 0(0) 0(0) 0(0) 0(0) 0(0) 0(0) 0(0) 0(0) 0(0) 0(0) 0(0) 0(0) 0(0) 0(0)
Heterandria formosa 0(0) 0(0) 0(0) 0(0) 0(0) 0(0) 0(0) 0(0) 0(0) 0(0) 0(0) 0(0) 0(0) 0(0) 0(0) 0(0) 0(0) 0(0) 0(0) 0(0) 0(0) 0(0) 0(0) 0(0)
Lagodon rhomboides 0(0) 0(0) 0(0) 0(0) 0(0) 0(0) 0(0) 0(0) 0(0) 0(0) 0(0) 0(0) 0(0) 0(0) 0(0) 0(0) 0(0) 0(0) 0(0) 0(0) 0(0) 0(0) 0(0) 0(0)
Leiostomus xanthurus 0(0) 0(0) 0(0) 0(0) 0(0) 0(0) 0(0) 0(0) 0(0) 0(0) 0(0) 0(0) 0(0) 0(0) 0(0) 0(0) 0(0) 0(0) 0(0) 0(0) 0(0) 0(0) 0(0) 0(0)
Lepomis macrochirus 0(0) 0.10 (0.10) 0.10 (0.10) 0.20
(0.20) 0(0) 0(0) 0.10 (0.10) 0(0) 0(0) 0(0) 0(0) 0(0) 0(0) 0(0) 0(0) 0(0) 0(0) 0(0) 0.10
(0.10) 0(0) 0(0) 0(0) 0(0) 0.10 (0.10)
Palaemonetes pugio 0(0) 0(0) 0(0) 0.70 (0.52)
0.40 (0.31) 0.50 (0.31) 0.30
(0.15) 0.40
(0.22) 0(0) 0.33 (0.24)
0.80 (0.61) 0.90 (0.69) 0.20
(0.133) 0.40
(0.16) 0(0) 0(0) 0(0) 0(0) 0(0) 0(0) 0(0) 0(0) 0(0) 0(0)
Paralichthys sp. 0(0) 0(0) 0(0) 0(0) 0(0) 0(0) 0(0) 0(0) 0(0) 0(0) 0(0) 0(0) 0(0) 0(0) 0(0) 0(0) 0(0) 0(0) 0(0) 0(0) 0(0) 0(0) 0(0) 0(0)
Rhithropanopeus harrisi 0(0) 0(0) 0(0) 0(0) 0(0) 0(0) 0(0) 0(0) 0(0) 0(0) 0(0) 0(0) 0(0) 0(0) 0(0) 0(0) 0(0) 0(0) 0(0) 0(0) 0(0) 0(0) 0(0) 0(0)
Uca minax 0(0) 0(0) 0(0) 0(0) 0(0) 0(0) 0(0) 0(0) 0(0) 0.33 (0.17)
0.50 (0.31) 0.50 (0.40) 0(0) 0(0) 0(0) 0(0) 0(0) 0.20 (0.20) 0(0) 0.10
(0.10) 0.10
(0.10) 0(0) 0(0) 0(0)
Uca pugilator 0(0) 0(0) 0(0) 0(0) 0(0) 0(0) 0(0) 0(0) 0(0) 0(0) 0(0) 0(0) 0(0) 0(0) 0(0) 0(0) 0(0) 0(0) 0(0) 0(0) 0(0) 0(0) 0(0) 0(0)
Uca pugnax 0.20 (0.20)
0.40 (0.22) 0.80 (0.25) 0(0) 0.20
(0.20) 0.30 (0.21) 0.20 (0.20)
0.10 (0.10) 0(0) 0(0) 0(0) 0(0) 0(0) 0(0) 0(0) 0(0) 0(0) 0(0) 0(0) 0(0) 0(0) 0(0) 0(0) 0(0)

155
Table 7.4-2b. Mean abundance (SE) for epibenthic fauna collected during spring (2000-2007) Breder trap samples at station P3A (Town Creek). Spring 2000 Spring 2001 Spring 2002 Spring 2003 Spring 2004 Spring 2005 Spring 2006 Spring 2007 Low Mid Upper Low Mid Upper Low Mid Upper Low Mid Upper Low Mid Upper Low Mid Upper Low Mid Upper Low Mid Upper
Callinectes sapidus 0(0) 0(0) 0(0) 0(0) 0(0) 0(0) 0(0) 0(0) 0(0) 0(0) 0(0) 0(0) 0(0) 0(0) 0(0) 0(0) 0(0) 0(0) 0(0) 0(0) 0(0) 0(0) 0(0) 0(0)
Ctenogobius boleosoma 0(0) 0(0) 0(0) 0(0) 0(0) 0(0) 0(0) 0(0) 0(0) 0(0) 0(0) 0(0) 0(0) 0(0) 0(0) 0.20 (0.13) 0(0) 0(0) 0(0) 0(0) 0(0) 0(0) 0(0) 0(0)
Ctenogobius shufeldti 0(0) 0.10 (0.10) 0.20 (0.13) 0(0) 0(0) 0(0) 0(0) 0(0) 0(0) 0(0) 0(0) 0(0) 0.90
(0.35) 0.80
(0.33) 0(0) 0(0) 0(0) 0(0) 0(0) 0(0) 0(0) 0.10 (0.10) 0(0) 0(0)
Eucinostomus sp. 0(0) 0(0) 0(0) 0(0) 0(0) 0(0) 0(0) 0(0) 0(0) 0(0) 0(0) 0(0) 0(0) 0(0) 0(0) 0(0) 0(0) 0(0) 0(0) 0(0) 0(0) 0(0) 0(0) 0(0)
Farfantepenaeus aztecus 0(0) 0(0) 0(0) 0(0) 0(0) 0(0) 0(0) 0(0) 0(0) 0(0) 0(0) 0(0) 0(0) 0(0) 0.10 (0.10) 0(0) 0(0) 0(0) 0(0) 0(0) 0(0) 0(0) 0(0) 0(0)
Fundulus heteroclitus 0(0) 0(0) 0.10 (0.10) 1.00 (0.54)
1.00 (0.89) 1.50 (0.82) 0.10
(0.10) 0.30
(0.15) 0.80 (0.51) 0.20 (0.20)
0.50 (0.27) 0.89 (0.35) 0(0) 0(0) 0(0) 0(0) 0(0) 0(0) 0(0) 0(0) 0.25
(0.16) 0(0) 0(0) 0(0)
Fundulus sp. 0(0) 0(0) 0(0) 0(0) 0(0) 0(0) 0(0) 0(0) 0(0) 0(0) 0(0) 0(0) 0(0) 0(0) 0(0) 0.10 (0.10) 0(0) 0.10 (0.10) 0(0) 0(0) 0(0) 0(0) 0(0) 0(0)
Gambusia affinis 0.10 (0.10)
0.50 (0.27) 0.50 (0.31) 0(0) 0(0) 0(0) 0(0) 0(0) 0(0) 0(0) 0(0) 0(0) 0(0) 0(0) 0(0) 0(0) 0(0) 0(0) 0(0) 0(0) 0(0) 0(0) 0(0) 0(0)
Gambusia holbrooki 0(0) 0(0) 0(0) 0.10 (0.10) 0(0) 0.10 (0.10) 0.30
(0.21) 0.60
(0.43) 0.90 (0.69) 0.10 (0.10)
0.60 (0.34) 0(0) 1.70
(0.86) 0.80
(0.29) 0(0) 0.70 (0.52)
2.40 (1.48) 1.80 (0.92) 0(0) 0(0) 25.38
(11.57) 0(0) 0.60 (0.43)
0.10 (0.10)
Gobiosoma sp. 0(0) 0(0) 0(0) 0(0) 0(0) 0(0) 0(0) 0(0) 0(0) 0(0) 0(0) 0(0) 0(0) 0(0) 0(0) 0(0) 0(0) 0(0) 0(0) 0(0) 0(0) 0(0) 0(0) 0(0)
Heterandria formosa 0(0) 0(0) 0(0) 0(0) 0(0) 0(0) 0(0) 0(0) 0(0) 0(0) 0(0) 0(0) 0(0) 0(0) 0(0) 0(0) 0(0) 0(0) 0(0) 0(0) 0.12 (0.12) 0(0) 0(0) 0(0)
Lagodon rhomboides 0(0) 0(0) 0(0) 0(0) 0(0) 0(0) 0(0) 0(0) 0(0) 0(0) 0(0) 0(0) 1.30 (0.60)
1.50 (0.52) 2.70 (1.75) 0(0) 0(0) 0(0) 0(0) 0(0) 0(0) 0(0) 0.50
(0.34) 0(0)
Leiostomus xanthurus 0(0) 0(0) 0(0) 0(0) 0(0) 0(0) 0(0) 0(0) 0(0) 0(0) 0(0) 0(0) 0.70 (0.60) 0.70 (0.60 0(0) 0.50
(0.40) 0.30
(0.21) 0(0) 6.22 (3.38)
0.70 (0.21) 0(0) 0.20
(0.13) 0.10
(0.10) 0(0)
Lepomis macrochirus 0(0) 0(0) 0(0) 0(0) 0(0) 0(0) 0(0) 0(0) 0(0) 0(0) 0(0) 0(0) 0(0) 0(0) 0(0) 0(0) 0(0) 0(0) 0(0) 0(0) 0(0) 0(0) 0(0) 0(0)
Palaemonetes pugio 0(0) 0(0) 0(0) 0(0) 0(0) 0(0) 0(0) 0(0) 0.10 (0.10) 0(0) 0(0) 0(0) 0.30 (0.15) 0(0) 0(0) 0.20
(0.13) 0.90
(0.55) 0(0) 0.55 (0.24)
0.30 (0.21) 0(0) 0.20
(0.13) 0(0) 0(0)
Paralichthys sp. 0(0) 0(0) 0(0) 0(0) 0(0) 0(0) 0(0) 0(0) 0(0) 0(0) 0(0) 0(0) 0(0) 0(0) 0(0) 0(0) 0(0) 0(0) 0.11 (0.11) 0(0) 0(0) 0.10
(0.10) 0(0) 0(0)
Rhithropanopeus harrisi 0(0) 0(0) 0(0) 0(0) 0(0) 0(0) 0(0) 0(0) 0(0) 0(0) 0(0) 0(0) 0(0) 0(0) 0(0) 0.10 (0.10) 0(0) 0(0) 0(0) 0(0) 0(0) 0(0) 0(0) 0(0)
Uca minax 0(0) 0(0) 0(0) 0(0) 0(0) 0(0) 0(0) 0(0) 0(0) 0.60 (0.31)
0.80 (0.29) 1.11 (0.31) 0(0) 0(0) 0.20 (0.13) 0(0) 0(0) 0.20 (0.20) 0(0) 0(0) 0(0) 0(0) 0(0) 0(0)
Uca pugilator 0(0) 0(0) 0(0) 0(0) 0(0) 0(0) 0.20 (0.13)
1.00 (0.30) 1.10 (0.48) 0(0) 0(0) 0(0) 0(0) 0(0) 0(0) 0(0) 0(0) 0(0) 0(0) 0(0) 0(0) 0(0) 0(0) 0(0)
Uca pugnax 1.50 (0.62)
2.10 (0.57) 2.00 (0.67) 0.10
(0.10) 1.40
(0.56) 1.80 (0.53) 0(0) 0(0) 0(0) 0(0) 0(0) 0(0) 0(0) 0(0) 0(0) 0(0) 0(0) 0(0) 0(0) 0(0) 0(0) 0(0) 0(0) 0(0)
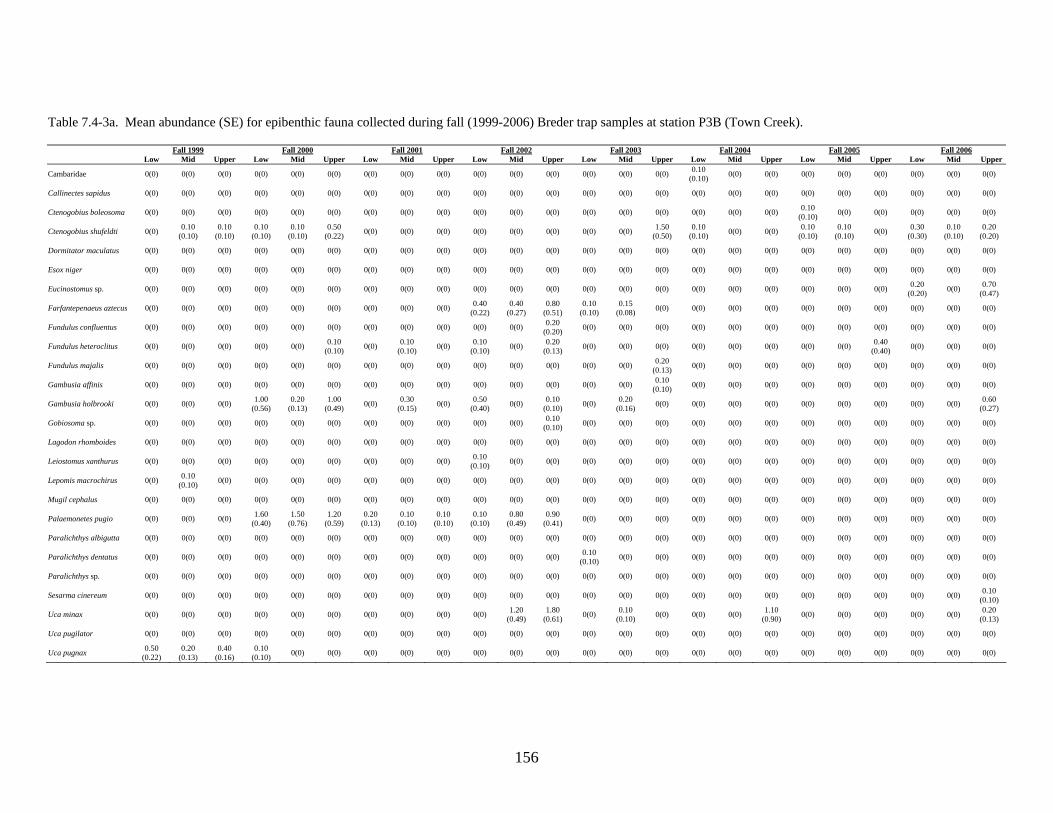
156
Table 7.4-3a. Mean abundance (SE) for epibenthic fauna collected during fall (1999-2006) Breder trap samples at station P3B (Town Creek). Fall 1999 Fall 2000 Fall 2001 Fall 2002 Fall 2003 Fall 2004 Fall 2005 Fall 2006 Low Mid Upper Low Mid Upper Low Mid Upper Low Mid Upper Low Mid Upper Low Mid Upper Low Mid Upper Low Mid Upper
Cambaridae 0(0) 0(0) 0(0) 0(0) 0(0) 0(0) 0(0) 0(0) 0(0) 0(0) 0(0) 0(0) 0(0) 0(0) 0(0) 0.10 (0.10) 0(0) 0(0) 0(0) 0(0) 0(0) 0(0) 0(0) 0(0)
Callinectes sapidus 0(0) 0(0) 0(0) 0(0) 0(0) 0(0) 0(0) 0(0) 0(0) 0(0) 0(0) 0(0) 0(0) 0(0) 0(0) 0(0) 0(0) 0(0) 0(0) 0(0) 0(0) 0(0) 0(0) 0(0)
Ctenogobius boleosoma 0(0) 0(0) 0(0) 0(0) 0(0) 0(0) 0(0) 0(0) 0(0) 0(0) 0(0) 0(0) 0(0) 0(0) 0(0) 0(0) 0(0) 0(0) 0.10 (0.10) 0(0) 0(0) 0(0) 0(0) 0(0)
Ctenogobius shufeldti 0(0) 0.10 (0.10)
0.10 (0.10)
0.10 (0.10)
0.10 (0.10)
0.50 (0.22) 0(0) 0(0) 0(0) 0(0) 0(0) 0(0) 0(0) 0(0) 1.50
(0.50) 0.10
(0.10) 0(0) 0(0) 0.10 (0.10)
0.10 (0.10) 0(0) 0.30
(0.30) 0.10
(0.10) 0.20
(0.20)
Dormitator maculatus 0(0) 0(0) 0(0) 0(0) 0(0) 0(0) 0(0) 0(0) 0(0) 0(0) 0(0) 0(0) 0(0) 0(0) 0(0) 0(0) 0(0) 0(0) 0(0) 0(0) 0(0) 0(0) 0(0) 0(0)
Esox niger 0(0) 0(0) 0(0) 0(0) 0(0) 0(0) 0(0) 0(0) 0(0) 0(0) 0(0) 0(0) 0(0) 0(0) 0(0) 0(0) 0(0) 0(0) 0(0) 0(0) 0(0) 0(0) 0(0) 0(0)
Eucinostomus sp. 0(0) 0(0) 0(0) 0(0) 0(0) 0(0) 0(0) 0(0) 0(0) 0(0) 0(0) 0(0) 0(0) 0(0) 0(0) 0(0) 0(0) 0(0) 0(0) 0(0) 0(0) 0.20 (0.20) 0(0) 0.70
(0.47)
Farfantepenaeus aztecus 0(0) 0(0) 0(0) 0(0) 0(0) 0(0) 0(0) 0(0) 0(0) 0.40 (0.22)
0.40 (0.27)
0.80 (0.51)
0.10 (0.10)
0.15 (0.08) 0(0) 0(0) 0(0) 0(0) 0(0) 0(0) 0(0) 0(0) 0(0) 0(0)
Fundulus confluentus 0(0) 0(0) 0(0) 0(0) 0(0) 0(0) 0(0) 0(0) 0(0) 0(0) 0(0) 0.20 (0.20) 0(0) 0(0) 0(0) 0(0) 0(0) 0(0) 0(0) 0(0) 0(0) 0(0) 0(0) 0(0)
Fundulus heteroclitus 0(0) 0(0) 0(0) 0(0) 0(0) 0.10 (0.10) 0(0) 0.10
(0.10) 0(0) 0.10 (0.10) 0(0) 0.20
(0.13) 0(0) 0(0) 0(0) 0(0) 0(0) 0(0) 0(0) 0(0) 0.40 (0.40) 0(0) 0(0) 0(0)
Fundulus majalis 0(0) 0(0) 0(0) 0(0) 0(0) 0(0) 0(0) 0(0) 0(0) 0(0) 0(0) 0(0) 0(0) 0(0) 0.20 (0.13) 0(0) 0(0) 0(0) 0(0) 0(0) 0(0) 0(0) 0(0) 0(0)
Gambusia affinis 0(0) 0(0) 0(0) 0(0) 0(0) 0(0) 0(0) 0(0) 0(0) 0(0) 0(0) 0(0) 0(0) 0(0) 0.10 (0.10) 0(0) 0(0) 0(0) 0(0) 0(0) 0(0) 0(0) 0(0) 0(0)
Gambusia holbrooki 0(0) 0(0) 0(0) 1.00 (0.56)
0.20 (0.13)
1.00 (0.49) 0(0) 0.30
(0.15) 0(0) 0.50 (0.40) 0(0) 0.10
(0.10) 0(0) 0.20 (0.16) 0(0) 0(0) 0(0) 0(0) 0(0) 0(0) 0(0) 0(0) 0(0) 0.60
(0.27)
Gobiosoma sp. 0(0) 0(0) 0(0) 0(0) 0(0) 0(0) 0(0) 0(0) 0(0) 0(0) 0(0) 0.10 (0.10) 0(0) 0(0) 0(0) 0(0) 0(0) 0(0) 0(0) 0(0) 0(0) 0(0) 0(0) 0(0)
Lagodon rhomboides 0(0) 0(0) 0(0) 0(0) 0(0) 0(0) 0(0) 0(0) 0(0) 0(0) 0(0) 0(0) 0(0) 0(0) 0(0) 0(0) 0(0) 0(0) 0(0) 0(0) 0(0) 0(0) 0(0) 0(0)
Leiostomus xanthurus 0(0) 0(0) 0(0) 0(0) 0(0) 0(0) 0(0) 0(0) 0(0) 0.10 (0.10) 0(0) 0(0) 0(0) 0(0) 0(0) 0(0) 0(0) 0(0) 0(0) 0(0) 0(0) 0(0) 0(0) 0(0)
Lepomis macrochirus 0(0) 0.10 (0.10) 0(0) 0(0) 0(0) 0(0) 0(0) 0(0) 0(0) 0(0) 0(0) 0(0) 0(0) 0(0) 0(0) 0(0) 0(0) 0(0) 0(0) 0(0) 0(0) 0(0) 0(0) 0(0)
Mugil cephalus 0(0) 0(0) 0(0) 0(0) 0(0) 0(0) 0(0) 0(0) 0(0) 0(0) 0(0) 0(0) 0(0) 0(0) 0(0) 0(0) 0(0) 0(0) 0(0) 0(0) 0(0) 0(0) 0(0) 0(0)
Palaemonetes pugio 0(0) 0(0) 0(0) 1.60 (0.40)
1.50 (0.76)
1.20 (0.59)
0.20 (0.13)
0.10 (0.10)
0.10 (0.10)
0.10 (0.10)
0.80 (0.49)
0.90 (0.41) 0(0) 0(0) 0(0) 0(0) 0(0) 0(0) 0(0) 0(0) 0(0) 0(0) 0(0) 0(0)
Paralichthys albigutta 0(0) 0(0) 0(0) 0(0) 0(0) 0(0) 0(0) 0(0) 0(0) 0(0) 0(0) 0(0) 0(0) 0(0) 0(0) 0(0) 0(0) 0(0) 0(0) 0(0) 0(0) 0(0) 0(0) 0(0)
Paralichthys dentatus 0(0) 0(0) 0(0) 0(0) 0(0) 0(0) 0(0) 0(0) 0(0) 0(0) 0(0) 0(0) 0.10 (0.10) 0(0) 0(0) 0(0) 0(0) 0(0) 0(0) 0(0) 0(0) 0(0) 0(0) 0(0)
Paralichthys sp. 0(0) 0(0) 0(0) 0(0) 0(0) 0(0) 0(0) 0(0) 0(0) 0(0) 0(0) 0(0) 0(0) 0(0) 0(0) 0(0) 0(0) 0(0) 0(0) 0(0) 0(0) 0(0) 0(0) 0(0)
Sesarma cinereum 0(0) 0(0) 0(0) 0(0) 0(0) 0(0) 0(0) 0(0) 0(0) 0(0) 0(0) 0(0) 0(0) 0(0) 0(0) 0(0) 0(0) 0(0) 0(0) 0(0) 0(0) 0(0) 0(0) 0.10 (0.10)
Uca minax 0(0) 0(0) 0(0) 0(0) 0(0) 0(0) 0(0) 0(0) 0(0) 0(0) 1.20 (0.49)
1.80 (0.61) 0(0) 0.10
(0.10) 0(0) 0(0) 0(0) 1.10 (0.90) 0(0) 0(0) 0(0) 0(0) 0(0) 0.20
(0.13)
Uca pugilator 0(0) 0(0) 0(0) 0(0) 0(0) 0(0) 0(0) 0(0) 0(0) 0(0) 0(0) 0(0) 0(0) 0(0) 0(0) 0(0) 0(0) 0(0) 0(0) 0(0) 0(0) 0(0) 0(0) 0(0)
Uca pugnax 0.50 (0.22)
0.20 (0.13)
0.40 (0.16)
0.10 (0.10) 0(0) 0(0) 0(0) 0(0) 0(0) 0(0) 0(0) 0(0) 0(0) 0(0) 0(0) 0(0) 0(0) 0(0) 0(0) 0(0) 0(0) 0(0) 0(0) 0(0)

157
Table 7.4-3b. Mean abundance (SE) for epibenthic fauna collected during spring (2000-2007) Breder trap samples at station P3B (Town Creek). Spring 2000 Spring 2001 Spring 2002 Spring 2003 Spring 2004 Spring 2005 Spring 2006 Spring 2007 Low Mid Upper Low Mid Upper Low Mid Upper Low Mid Upper Low Mid Upper Low Mid Upper Low Mid Upper Low Mid Upper
Cambaridae 0(0) 0(0) 0(0) 0(0) 0(0) 0(0) 0(0) 0(0) 0(0) 0(0) 0(0) 0(0) 0(0) 0(0) 0(0) 0(0) 0(0) 0(0) 0(0) 0(0) 0(0) 0(0) 0(0) 0(0)
Callinectes sapidus 0(0) 0(0) 0(0) 0(0) 0(0) 0(0) 0(0) 0(0) 0(0) 0(0) 0(0) 0(0) 0(0) 0(0) 0(0) 0(0) 0(0) 0(0) 0.20 (0.13) 0(0) 0(0) 0.10
(0.10) 0(0) 0(0)
Ctenogobius boleosoma 0(0) 0(0) 0(0) 0(0) 0(0) 0(0) 0(0) 0(0) 0(0) 0(0) 0(0) 0(0) 0(0) 0(0) 0(0) 0.20 (0.13)
0.30 (0.15) 0(0) 0(0) 0(0) 0(0) 0(0) 0(0) 0(0)
Ctenogobius shufeldti 0.10 (0.10)
0.10 (0.10) 0(0) 0(0) 0.10
(0.10) 0(0) 0(0) 0(0) 0(0) 0(0) 0(0) 0(0) 0.20 (0.13)
0.60 (0.27) 0(0) 0.30
(0.21) 0.30
(0.21) 0(0) 0.30 (0.15) 0(0) 0(0) 0.20
(0.13) 0(0) 0(0)
Dormitator maculatus 0(0) 0.10 (0.10) 0.10 (0.10) 0(0) 0(0) 0(0) 0(0) 0(0) 0(0) 0(0) 0(0) 0(0) 0(0) 0(0) 0(0) 0(0) 0(0) 0(0) 0(0) 0(0) 0(0) 0(0) 0(0) 0(0)
Esox niger 0(0) 0(0) 0(0) 0(0) 0(0) 0(0) 0(0) 0(0) 0(0) 0(0) 0(0) 0(0) 0(0) 0(0) 0(0) 0(0) 0.10
(0.10) 0(0) 0(0) 0(0) 0(0) 0(0) 0(0) 0(0)
Eucinostomus sp. 0(0) 0(0) 0(0) 0(0) 0(0) 0(0) 0(0) 0(0) 0(0) 0(0) 0(0) 0(0) 0(0) 0(0) 0(0) 0(0) 0(0) 0(0) 0(0) 0(0) 0(0) 0(0) 0(0) 0(0)
Farfantepenaeus aztecus 0(0) 0(0) 0(0) 0(0) 0(0) 0(0) 0(0) 0(0) 0(0) 0(0) 0(0) 0(0) 0(0) 0(0) 0(0) 0(0) 0(0) 0(0) 0(0) 0(0) 0(0) 0(0) 0(0) 0(0)
Fundulus confluentus 0(0) 0(0) 0(0) 0(0) 0(0) 0(0) 0(0) 0(0) 0(0) 0(0) 0(0) 0(0) 0(0) 0(0) 0(0) 0(0) 0(0) 0(0) 0(0) 0(0) 0(0) 0(0) 0(0) 0(0)
Fundulus heteroclitus 0(0) 0(0) 0(0) 0.10 (0.10) 0(0) 0(0) 0.10
(0.10) 0.10
(0.10) 0(0) 0(0) 0.10 (0.10) 0(0) 0(0) 0(0) 0.10 (0.10) 0(0) 0(0) 0(0) 0(0) 0.30
(0.30) 0.60
(0.31) 0(0) 0(0) 0.14 (0.14)
Fundulus majalis 0(0) 0(0) 0(0) 0(0) 0(0) 0(0) 0(0) 0(0) 0(0) 0(0) 0(0) 0(0) 0(0) 0(0) 0(0) 0(0) 0(0) 0(0) 0(0) 0(0) 0(0) 0(0) 0(0) 0(0)
Gambusia affinis 0.10 (0.10)
0.20 (0.13) 0.30 (0.15) 0(0) 0(0) 0(0) 0(0) 0(0) 0(0) 0(0) 0(0) 0(0) 0(0) 0(0) 0(0) 0(0) 0(0) 0(0) 0(0) 0(0) 0(0) 0(0) 0(0) 0(0)
Gambusia holbrooki 0(0) 0(0) 0(0) 0.40 (0.31)
1.10 (0.67) 0.60 (0.40) 2.30
(0.83) 2.30
(1.04) 0.60 (0.34) 0(0) 0(0) 0(0) 0(0) 0(0) 0.10 (0.10) 0(0) 0(0) 0.10 (0.10) 0(0) 0(0) 0.10 (0.10) 0(0) 0.10
(0.10) 0.14
(0.14)
Gobiosoma sp. 0(0) 0(0) 0(0) 0(0) 0(0) 0(0) 0(0) 0(0) 0.10 (0.10) 0(0) 0(0) 0(0) 0(0) 0(0) 0(0) 0(0) 0(0) 0(0) 0(0) 0(0) 0 (0) 0(0) 0(0) 0(0)
Lagodon rhomboides 0(0) 0(0) 0(0) 0(0) 0(0) 0(0) 0(0) 0(0) 0(0) 0(0) 0(0) 0(0) 0.20 (0.20)
0.30 (0.21) 0(0) 0.20
(0.13) 0.90
(0.35) 0.20 (0.20) 0.10 (0.10) 0(0) 0.10
(0.10) 0(0) 0.50 (0.31) 0(0)
Leiostomus xanthurus 0(0) 0(0) 0(0) 0(0) 0.20 (0.13) 0.10 (0.10) 0(0) 0(0) 0.10 (0.10) 0(0) 0(0) 0(0) 030 (0.15) 1.80
(0.92) 0.10 (0.10) 0.30 (0.21)
0.40 (0.22) 0.30 (0.21) 1.20
(0.71) 1.60
(0.76) 0.20
(0.13) 1.50
(0.70) 3.30
(1.30) 0.14
(0.14)
Lepomis macrochirus 0(0) 0(0) 0(0) 0(0) 0(0) 0(0) 0(0) 0(0) 0(0) 0(0) 0(0) 0(0) 0(0) 0(0) 0(0) 0(0) 0(0) 0(0) 0(0) 0(0) 0(0) 0(0) 0(0) 0(0)
Mugil cephalus 0(0) 0(0) 0(0) 0.10 (0.10) 0(0) 0(0) 0(0) 0(0) 0(0) 0(0) 0(0) 0(0) 0(0) 0(0) 0(0) 0(0) 0(0) 0(0) 0(0) 0(0) 0(0) 0(0) 0(0) 0(0)
Palaemonetes pugio 0(0) 0(0) 0(0) 0.20 (0.20)
0.10 (0.10) 0.10 (0.10) 1.20
(0.53) 0.30
(0.15) 0(0) 0(0) 0(0) 0(0) 0.10 (0.10)
0.20 (0.13) 0.10 (0.10) 0.30
(0.15) 0.80
(0.39) 0.20 (0.13) 0.80 (0.25)
1.00 (0.42)
2.30 (1.32)
0.50 (0.27)
0.30 (0.21)
0.14 (0.14)
Paralichthys albigutta 0(0) 0(0) 0(0) 0(0) 0(0) 0(0) 0(0) 0(0) 0(0) 0(0) 0(0) 0(0) 0(0) 0(0) 0(0) 0.10 (0.10)
0.10 (0.10) 0(0) 0(0) 0(0) 0(0) 0(0) 0(0) 0(0)
Paralichthys dentatus 0(0) 0(0) 0(0) 0(0) 0(0) 0(0) 0(0) 0(0) 0(0) 0.20 (0.20) 0(0) 0.10 (0.10) 0(0) 0(0) 0(0) 0(0) 0(0) 0(0) 0(0) 0(0) 0(0) 0(0) 0(0) 0(0)
Paralichthys sp. 0(0) 0(0) 0(0) 0(0) 0(0) 0(0) 0(0) 0(0) 0(0) 0(0) 0(0) 0(0) 0(0) 0.10 (0.10) 0(0) 0.30
(0.21) 0.10
(0.10) 0(0) 0.20 (0.13)
0.10 (0.10) 0(0) 0.20
(0.13) 0(0) 0(0)
Sesarma cinereum 0(0) 0(0) 0(0) 0(0) 0(0) 0(0) 0(0) 0(0) 0(0) 0(0) 0(0) 0(0) 0(0) 0(0) 0(0) 0(0) 0(0) 0(0) 0(0) 0(0) 0(0) 0(0) 0(0) 0(0)
Uca minax 0(0) 0(0) 0(0) 0(0) 0(0) 0(0) 0(0) 0(0) 0(0) 0(0) 0.80 (0.47) 1.40 (0.60) 0(0) 0(0) 0.20 (0.20) 0(0) 0(0) 0.20 (0.13) 0(0) 0(0) 0(0) 0(0) 0(0) 0.43
(0.20)
Uca pugilator 0(0) 0(0) 0(0) 0(0) 0(0) 0(0) 0.40 (0.22)
0.30 (0.15) 2.60 (0.73) 0(0) 0(0) 0(0) 0(0) 0(0) 0(0) 0(0) 0(0) 0(0) 0(0) 0(0) 0(0) 0(0) 0(0) 0(0)
Uca pugnax 0.70 (0.26)
1.20 (0.49) 0.60 (0.34) 0.20
(0.13) 0.60
(0.40) 0.90 (0.50) 0(0) 0(0) 0(0) 0(0) 0(0) 0(0) 0(0) 0(0) 0(0) 0(0) 0(0) 0(0) 0(0) 0(0) 0(0) 0(0) 0(0) 0(0)

158
Table 7.4-4a. Mean abundance (SE) for epibenthic fauna collected during fall (1999-2006) Breder trap samples at station P6 (Eagle Island). Fall 1999 Fall 2000 Fall 2001 Fall 2002 Fall 2003 Fall 2004 Fall 2005 Fall 2006
Low Mid Upper Low Mid Upper Low Mid Upper Low Mid Upper Low Mid Upper Low Mid Upper Low Mid Upper Low Mid Upper
Callinectes sapidus 0(0) 0(0) 0(0) 0(0) 0(0) 0.10 (0.10) 0(0) 0.10 (0.10) 0.11 (0.11) 0(0) 0(0) 0(0) 0(0) 0(0) 0(0) 0(0) 0(0) 0(0) 0(0) 0.10
(0.10) 0(0) 0(0) 0(0) 0(0)
Ctenogobius boleosoma 0(0) 0(0) 0(0) 0(0) 0(0) 0(0) 0(0) 0(0) 0(0) 0(0) 0(0) 0(0) 0(0) 0(0) 0(0) 0(0) 0(0) 0(0) 0.20 (0.13)
0.10 (0.10)
0.10 (0.10) 0(0) 0(0) 0(0)
Ctenogobius shufeldti 0(0) 0(0) 0(0) 0.10 (0.10)
0.10 (0.10) 0(0) 0.10
(0.10) 0(0) 0(0) 0(0) 0(0) 0(0) 1.50 (0.50)
0.90 (0.55) 0(0) 0.10
(0.10) 0(0) 0(0) 0(0) 0(0) 0.10 (0.10) 0(0) 0.10
(0.10) 0(0)
Diving beetle 0(0) 0(0) 0(0) 0(0) 0(0) 0(0) 0(0) 0(0) 0(0) 0(0) 0(0) 0(0) 0(0) 0(0) 0(0) 0(0) 0(0) 0(0) 0(0) 0(0) 0(0) 0(0) 0(0) 0(0)
Dormitator maculates 0(0) 0.10 (0.10) 0.20 (0.13) 0(0) 0(0) 0(0) 0(0) 0(0) 0(0) 0(0) 0(0) 0(0) 0(0) 0(0) 0(0) 0(0) 0(0) 0(0) 0(0) 0(0) 0(0) 0(0) 0(0) 0(0)
Eucinostomus sp. 0(0) 0(0) 0(0) 0(0) 0(0) 0(0) 0(0) 0(0) 0(0) 0(0) 0(0) 0(0) 0(0) 0(0) 0(0) 0(0) 0.10 (0.10) 0.40 (0.31) 0(0) 0(0) 0(0) 0(0) 0(0) 0(0)
Farfantepenaeus aztecus 0(0) 0(0) 0(0) 0(0) 0(0) 0(0) 0.10 (0.10) 0(0) 0(0) 0(0) 0.90
(0.23) 0.10 (0.10) 0(0) 0(0) 0(0) 0(0) 0(0) 0(0) 0(0) 0(0) 0(0) 0(0) 0(0) 0(0)
Fundulus heteroclitus 0(0) 0(0) 0(0) 0(0) 0(0) 0(0) 0(0) 0(0) 0(0) 0(0) 0(0) 0(0) 0(0) 0.60 (0.50) 0.10 (0.10) 0(0) 0(0) 0(0) 0(0) 0(0) 0.20
(0.13) 0(0) 0(0) 0(0)
Fundulus majalis 0(0) 0(0) 0(0) 0(0) 0(0) 0(0) 0(0) 0(0) 0(0) 0(0) 0(0) 0(0) 0.20 (0.13) 0(0) 0.10 (0.10) 0(0) 0(0) 0(0) 0(0) 0(0) 0(0) 0(0) 0(0) 0(0)
Fundulus sp. 0(0) 0(0) 0(0) 0(0) 0(0) 0(0) 0(0) 0(0) 0(0) 0(0) 0(0) 0(0) 0(0) 0(0) 0(0) 0(0) 0(0) 0(0) 0(0) 0(0) 0(0) 0(0) 0(0) 0(0)
Gambusia affinis 0(0) 0(0) 0(0) 0(0) 0(0) 0(0) 0(0) 0(0) 0(0) 0(0) 0(0) 0(0) 0.10 (0.10) 0(0) 0(0) 0(0) 0(0) 0(0) 0(0) 0(0) 0(0) 0(0) 0(0) 0(0)
Gambusia holbrooki 0(0) 0(0) 0(0) 0(0) 0(0) 0(0) 0(0) 0(0) 0(0) 0(0) 0(0) 0(0) 0(0) 0(0) 0(0) 0(0) 0(0) 0(0) 0(0) 0(0) 0(0) 0(0) 0(0) 0(0)
Lagodon rhomboides 0(0) 0(0) 0(0) 0(0) 0(0) 0(0) 0(0) 0(0) 0(0) 0(0) 0(0) 0(0) 0(0) 0(0) 0(0) 0(0) 0(0) 0(0) 0(0) 0(0) 0(0) 0(0) 0(0) 0(0)
Leiostomus xanthurus 0(0) 0(0) 0(0) 0(0) 0(0) 0(0) 0(0) 0(0) 0(0) 0(0) 0(0) 0(0) 0(0) 0.10 (0.10) 0(0) 0(0) 0(0) 0(0) 0(0) 0(0) 0(0) 0(0) 0(0) 0(0)
Leptocephalus larvae 0(0) 0(0) 0(0) 0(0) 0(0) 0(0) 0(0) 0(0) 0(0) 0(0) 0(0) 0(0) 0(0) 0(0) 0(0) 0(0) 0(0) 0(0) 0(0) 0.10 (0.10) 0(0) 0(0) 0(0) 0(0)
Lutjanus griseus 0(0) 0(0) 0(0) 0(0) 0(0) 0(0) 0(0) 0(0) 0(0) 0(0) 0(0) 0.10 (0.10) 0(0) 0(0) 0(0) 0(0) 0(0) 0(0) 0(0) 0(0) 0(0) 0(0) 0(0) 0(0)
Micropogonias undulates 0(0) 0(0) 0(0) 0(0) 0(0) 0(0) 0(0) 0(0) 0(0) 0(0) 0(0) 0(0) 0(0) 0(0) 0(0) 0(0) 0(0) 0(0) 0.20
(0.20) 0(0) 0.10 (0.10) 0(0) 0(0) 0(0)
Mugil cephalus 0(0) 0(0) 0(0) 0(0) 0(0) 0(0) 0(0) 0(0) 0(0) 0(0) 0(0) 0(0) 0(0) 0(0) 0(0) 0(0) 0(0) 0(0) 0(0) 0(0) 0(0) 0(0) 0(0) 0(0)
Palaemonetes pugio 0(0) 0(0) 0(0) 1.00 (0.60)
0.80 (0.44) 0.20 (0.13) 1.90
(1.49) 1.40
(0.45) 2.89 (1.74) 0.50 (0.22)
0.50 (0.31) 4.22 (4.10) 0(0) 0(0) 0(0) 0.40
(0.22) 0.50
(0.22) 0.20 (0.13) 1.80 (0.70)
1.50 (0.62)
0.80 (0.59) 0(0) 0(0) 0.30 (0.21)
Paralichthys albigutta 0(0) 0(0) 0(0) 0.10 (0.10) 0(0) 0(0) 0(0) 0(0) 0(0) 0(0) 0(0) 0(0) 0(0) 0(0) 0(0) 0(0) 0(0) 0(0) 0(0) 0(0) 0(0) 0(0) 0(0) 0(0)
Paralichthys dentatus 0(0) 0(0) 0(0) 0(0) 0(0) 0(0) 0(0) 0(0) 0(0) 0(0) 0(0) 0(0) 0(0) 0(0) 0(0) 0(0) 0(0) 0(0) 0(0) 0(0) 0(0) 0(0) 0(0) 0(0)
Paralichthys sp. 0(0) 0(0) 0(0) 0(0) 0(0) 0(0) 0(0) 0(0) 0(0) 0(0) 0(0) 0(0) 0(0) 0(0) 0(0) 0(0) 0(0) 0(0) 0(0) 0(0) 0(0) 0(0) 0(0) 0(0)
Rhithropanopeus harrisii 0(0) 0(0) 0(0) 0(0) 0(0) 0(0) 0(0) 0(0) 0(0) 0(0) 0(0) 0(0) 0(0) 0(0) 0(0) 0(0) 0(0) 0(0) 0(0) 0(0) 0(0) 0(0) 0(0) 0(0)
Sygnathidae 0(0) 0(0) 0(0) 0(0) 0(0) 0(0) 0(0) 0(0) 0(0) 0(0) 0(0) 0(0) 0(0) 0.10 (0.10) 0(0) 0(0) 0(0) 0(0) 0(0) 0(0) 0(0) 0(0) 0(0) 0(0)
Uca minax 0(0) 0(0) 0(0) 0(0) 0(0) 0(0) 0(0) 0(0) 0(0) 0(0) 0(0) 0(0) 0(0) 0(0) 0(0) 0(0) 0(0) 0(0) 0(0) 0(0) 0(0) 0(0) 0(0) 0(0)
Uca pugilator 0(0) 0(0) 0(0) 0(0) 0(0) 0(0) 0(0) 0(0) 0(0) 0(0) 0(0) 0(0) 0(0) 0(0) 0(0) 0(0) 0(0) 0(0) 0(0) 0(0) 0(0) 0(0) 0(0) 0(0)
Uca pugnax 0(0) 0(0) 0(0) 0(0) 0(0) 0(0) 0(0) 0(0) 0(0) 0(0) 0(0) 0(0) 0(0) 0(0) 0(0) 0(0) 0(0) 0(0) 0(0) 0(0) 0(0) 0(0) 0(0) 0(0)
Uca sp. 0(0) 0(0) 0(0) 0(0) 0(0) 0(0) 0(0) 0(0) 0(0) 0(0) 0(0) 0(0) 0(0) 0.10 (0.10) 0.50 (0.22) 0(0) 0.10
(0.10) 0(0) 0(0) 0(0) 0(0) 0(0) 0(0) 0(0)
U/I fish 0.10 (0.10) 0(0) 0(0) 0(0) 0(0) 0(0) 0(0) 0(0) 0(0) 0(0) 0(0) 0(0) 0(0) 0(0) 0(0) 0(0) 0(0) 0(0) 0(0) 0(0) 0(0) 0(0) 0(0) 0(0)

159
Table 7.4-4b. Mean abundance (SE) for epibenthic fauna collected during spring (2000-2007) Breder trap samples at station P6 (Eagle Island). Spring 2000 Spring 2001 Spring 2002 Spring 2003 Spring 2004 Spring 2005 Spring 2006 Spring 2007 Low Mid Upper Low Mid Upper Low Mid Upper Low Mid Upper Low Mid Upper Low Mid Upper Low Mid Upper Low Mid Upper
Callinectes sapidus 0(0) 0.10 (0.10) 0.10 (0.10) 0(0) 0.10
(0.10) 0(0) 0.20 (0.13) 0(0) 0(0) 0(0) 0(0) 0(0) 0(0) 0.20
(0.13) 0(0) 0.10 (0.10)
0.20 (0.13) 0(0) 0(0) 0(0) 0(0) 0(0) 0(0) 0.10
(0.10)
Ctenogobius boleosoma 0(0) 0(0) 0(0) 0(0) 0(0) 0(0) 0(0) 0(0) 0(0) 0(0) 0(0) 0(0) 0(0) 0(0) 0(0) 0(0) 0(0) 0(0) 0(0) 0(0) 0(0) 0(0) 0.10 (0.10) 0(0)
Ctenogobius shufeldti 0(0) 0.10 (0.10) 0.10 (0.10) 0.20
(0.13) 0.30
(0.21) 0.10 (0.10) 0.10 (0.10)
0.10 (0.10) 0(0) 0(0) 0(0) 0(0) 0.30
(0.15) 0.50
(0.22) 0.10 (0.10) 0.50 (0.27)
0.90 (0.69) 0(0) 0(0) 0(0) 0(0) 0.10
(0.10) 0.20
(0.13) 0(0)
Diving beetle 0(0) 0(0) 0.10 (0.10) 0(0) 0(0) 0(0) 0(0) 0(0) 0(0) 0(0) 0(0) 0(0) 0(0) 0(0) 0(0) 0(0) 0(0) 0(0) 0(0) 0(0) 0(0) 0(0) 0(0) 0(0)
Dormitator maculates 0(0) 0(0) 0(0) 0(0) 0(0) 0(0) 0(0) 0(0) 0(0) 0(0) 0(0) 0(0) 0(0) 0(0) 0(0) 0(0) 0(0) 0(0) 0(0) 0(0) 0(0) 0(0) 0(0) 0(0)
Eucinostomus sp. 0(0) 0(0) 0(0) 0(0) 0(0) 0(0) 0(0) 0(0) 0(0) 0(0) 0(0) 0(0) 0(0) 0(0) 0(0) 0(0) 0(0) 0(0) 0(0) 0(0) 0(0) 0(0) 0(0) 0(0)
Farfantepenaeus aztecus 0(0) 0(0) 0(0) 0(0) 0(0) 0(0) 0(0) 0(0) 0(0) 0(0) 0(0) 0(0) 0(0) 0(0) 0(0) 0(0) 0(0) 0(0) 0(0) 0(0) 0(0) 0(0) 0(0) 0(0)
Fundulus heteroclitus 0(0) 0(0) 0(0) 0(0) 0(0) 0(0) 0(0) 0.90 (0.59) 1.00 (0.89) 0.50
(0.27) 0.10
(0.10) 0.20 (0.13) 0(0) 0.10 (0.10) 0.20 (0.13) 0(0) 0(0) 0(0) 0.20
(0.13) 0.70
(0.33) 0.20
(0.13) 0.10
(0.10) 0.10
(0.10) 0(0)
Fundulus majalis 0(0) 0(0) 0(0) 0(0) 0(0) 0(0) 0(0) 0(0) 0(0) 0(0) 0(0) 0(0) 0(0) 0(0) 0(0) 0(0) 0(0) 0(0) 0(0) 0(0) 0(0) 0(0) 0(0) 0(0)
Fundulus sp. 0(0) 0(0) 0(0) 0(0) 0(0) 0(0) 0(0) 0(0) 0(0) 0(0) 0(0) 0(0) 0(0) 0(0) 0(0) 0.70 (0.21)
0.40 (0.27) 0.50 (0.27) 0(0) 0(0) 0(0) 0(0) 0(0) 0(0)
Gambusia affinis 0(0) 0(0) 0(0) 0(0) 0(0) 0(0) 0(0) 0(0) 0(0) 0(0) 0(0) 0(0) 0(0) 0(0) 0(0) 0(0) 0(0) 0(0) 0(0) 0(0) 0(0) 0(0) 0(0) 0(0)
Gambusia holbrooki 0(0) 0(0) 0(0) 0(0) 0(0) 0(0) 0(0) 0(0) 0.10 (0.10) 0(0) 0(0) 0(0) 0(0) 0(0) 0(0) 0(0) 0(0) 0(0) 0(0) 0(0) 0(0) 0(0) 0(0) 0(0)
Lagodon rhomboides 0(0) 0.10 (0.10) 0.20 (0.13) 0(0) 0(0) 0(0) 0(0) 0(0) 0(0) 0(0) 0(0) 0(0) 0.20
(0.13) 0(0) 0(0) 0(0) 0(0) 0.10 (0.10) 0(0) 0(0) 0(0) 0(0) 0(0) 0(0)
Leiostomus xanthurus 0(0) 0(0) 0.20 (0.13) 0(0) 0(0) 0.10 (0.10) 0.10 (0.10)
0.10 (0.10) 0.20 (0.20) 0(0) 0(0) 0(0) 8.70
(2.87) 14.30 (4.37)
32.90 (12.60)
5.30 (2.82)
11.40 (3.53)
9.3 0 (3.00)
15.50 (3.14)
30.90 (10.09)
33.50 (9.06)
1.80 (0.96)
0.60 (0.22)
2.20 (1.16)
Leptocephalus larvae 0(0) 0(0) 0(0) 0(0) 0(0) 0(0) 0(0) 0(0) 0(0) 0(0) 0(0) 0(0) 0(0) 0(0) 0(0) 0(0) 0(0) 0(0) 0(0) 0(0) 0(0) 0(0) 0(0) 0(0)
Lutjanus griseus 0(0) 0(0) 0(0) 0(0) 0(0) 0(0) 0(0) 0(0) 0(0) 0(0) 0(0) 0(0) 0(0) 0(0) 0(0) 0(0) 0(0) 0(0) 0(0) 0(0) 0(0) 0(0) 0(0) 0(0)
Micropogonias undulatus 0(0) 0(0) 0(0) 0(0) 0(0) 0(0) 0(0) 0(0) 0(0) 0(0) 0(0) 0(0) 0.60
(0.31) 0.70
(0.40) 2.30 (1.08) 0(0) 0(0) 0(0) 0.80 (0.51)
0.70 (0.42)
0.10 (0.10) 0(0) 0(0) 0(0)
Mugil cephalus 0(0) 0(0) 0(0) 0.30 (0.30)
0.10 (0.10) 0.20 (0.20) 0(0) 0(0) 0.20 (0.20) 0(0) 0(0) 0(0) 0(0) 0(0) 0(0) 0(0) 0(0) 0(0) 0.10
(0.10) 0(0) 0(0) 0(0) 0(0) 0(0)
Palaemonetes pugio 0(0) 0(0) 0(0) 0.10 (0.10) 0(0) 0(0) 0.10
(0.10) 0.10
(0.10) 0.10 (0.10) 0(0) 0(0) 0(0) 0.20 (0.13) 0(0) 0(0) 0(0) 0.10
(0.10) 0(0) 1.40 (0.58)
1.00 (0.30)
4.30 (1.57) 0(0) 0(0) 0(0)
Paralichthys albigutta 0(0) 0(0) 0(0) 0(0) 0(0) 0(0) 0(0) 0(0) 0(0) 0(0) 0(0) 0(0) 0(0) 0(0) 0(0) 0(0) 0(0) 0(0) 0(0) 0(0) 0(0) 0(0) 0(0) 0(0)
Paralichthys dentatus
0.30 (0.30)
0.40 (0.22) 0.10 (0.10) 0.10
(0.10) 0(0) 0(0) 0(0) 0(0) 0(0) 2.30 (0.67)
1.80 (0.63) 0.80 (0.59) 0(0) 0(0) 0(0) 0(0) 0(0) 0(0) 0(0) 0(0) 0(0) 0(0) 0(0) 0(0)
Paralichthys sp. 0(0) 0(0) 0(0) 0(0) 0(0) 0(0) 0(0) 0(0) 0(0) 0(0) 0(0) 0(0) 0.20 (0.20)
0.20 (0.20) 0(0) 0.20
(0.13) 0(0) 0(0) 0.10 (0.10)
0.10 (0.10) 0(0) 0.70
(0.21) 0.50
(0.22) 0(0)
Rhithropanopeus harrisii 0(0) 0(0) 0(0) 0(0) 0(0) 0(0) 0(0) 0(0) 0(0) 0(0) 0(0) 0(0) 0(0) 0(0) 0(0) 0.10 (0.10) 0(0) 0(0) 0(0) 0(0) 0(0) 0(0) 0(0) 0(0)
Sygnathidae 0(0) 0(0) 0(0) 0(0) 0(0) 0(0) 0(0) 0(0) 0(0) 0(0) 0(0) 0(0) 0(0) 0(0) 0(0) 0(0) 0(0) 0(0) 0(0) 0(0) 0(0) 0(0) 0(0) 0(0)
Uca minax 0(0) 0(0) 0(0) 0(0) 0(0) 0(0) 0(0) 0(0) 0(0) 0(0) 0(0) 0(0) 0(0) 0(0) 0(0) 0(0) 0(0) 0(0) 0(0) 0(0) 0(0) 0(0) 0.10 (0.10) 0(0)
Uca pugilator 0(0) 0(0) 0(0) 0(0) 0(0) 0(0) 0(0) 0(0) 0.10 (0.10) 0(0) 0(0) 0(0) 0(0) 0(0) 0(0) 0(0) 0(0) 0(0) 0(0) 0(0) 0(0) 0(0) 0(0) 0(0)
Uca pugnax 0(0) 0(0) 0(0) 0.30 (0.21) 0(0) 0.60 (0.31) 0(0) 0(0) 0(0) 0(0) 0(0) 0(0) 0(0) 0(0) 0(0) 0(0) 0(0) 0(0) 0(0) 0(0) 0(0) 0(0) 0(0) 0(0)
Uca sp. 0(0) 0(0) 0(0) 0(0) 0(0) 0(0) 0(0) 0(0) 0(0) 0(0) 0(0) 0(0) 0(0) 0(0) 0(0) 0(0) 0(0) 0(0) 0(0) 0(0) 0(0) 0(0) 0(0) 0(0)
U/I fish 0(0) 0(0) 0(0) 0(0) 0(0) 0(0) 0(0) 0(0) 0(0) 0(0) 0(0) 0(0) 0(0) 0(0) 0(0) 0(0) 0(0) 0(0) 0(0) 0(0) 0(0) 0(0) 0(0) 0(0)

160
Table 7.4-5a. Mean abundance (SE) for epibenthic fauna collected during fall (1999-2006) Breder trap samples at station P7 (Indian Creek). Fall 1999 Fall 2000 Fall 2001 Fall 2002 Fall 2003 Fall 2004 Fall 2005 Fall 2006
Low Mid Upper Low Mid Upper Low Mid Upper Low Mid Upper Low Mid Upper Low Mid Upper Low Mid Upper Low Mid Upper
Anguilla rostrata 0(0) 0(0) 0(0) 0(0) 0(0) 0(0) 0(0) 0(0) 0(0) 0(0) 0(0) 0(0) 0(0) 0(0) 0(0) 0(0) 0(0) 0.10 (0.10) 0(0) 0(0) 0(0) 0(0) 0(0) 0(0)
Callinectes sapidus 0(0) 0(0) 0(0) 0(0) 0(0) 0(0) 0(0) 0(0) 0(0) 0(0) 0.11 (0.11) 0(0) 0(0) 0(0) 0(0) 0(0) 0(0) 0(0) 0(0) 0(0) 0(0) 0(0) 0(0) 0(0)
Clupidae 0(0) 0(0) 0(0) 0(0) 0(0) 0(0) 0(0) 0(0) 0(0) 0(0) 0(0) 0(0) 0(0) 0(0) 0(0) 0(0) 0(0) 0(0) 0(0) 0(0) 0(0) 0(0) 0(0) 0(0)
Ctenogobius shufeldti 0(0) 0(0) 0.10 (0.10) 0(0) 0.10 (0.10) 0(0) 0(0) 0.20
(0.13) 0(0) 0(0) 0(0) 0(0) 0.50 (0.22)
0.10 (0.10) 0.40 (0.22) 0(0) 0.10
(0.10) 0.20 (0.13) 0(0) 0(0) 0(0) 0.10 (0.10) 0(0) 0.10
(0.10)
Dormitator maculatus 0(0) 0.20 (0.13) 0(0) 0(0) 0(0) 0(0) 0(0) 0(0) 0(0) 0(0) 0(0) 0(0) 0(0) 0(0) 0(0) 0(0) 0(0) 0(0) 0(0) 0(0) 0(0) 0(0) 0(0) 0(0)
Eucinostomus argenteus 0(0) 0(0) 0(0) 0.10 (0.10) 0(0) 0(0) 0(0) 0.10
(0.10) 0(0) 0(0) 0(0) 0(0) 0(0) 0(0) 0(0) 0(0) 0(0) 0(0) 0(0) 0(0) 0(0) 0(0) 0(0) 0(0)
Eucinostomus sp. 0(0) 0(0) 0(0) 0(0) 0(0) 0(0) 0(0) 0(0) 0(0) 0(0) 0(0) 0(0) 0(0) 0(0) 0(0) 0.10 (0.10)
0.10 (0.10) 0.40 (0.31) 0(0) 0(0) 0(0) 0(0) 0(0) 0(0)
Evorthodus lyricus 0(0) 0(0) 0(0) 0(0) 0(0) 0(0) 0(0) 0(0) 0(0) 0(0) 0(0) 0(0) 0(0) 0(0) 0(0) 0(0) 0(0) 0(0) 0.10 (0.10) 0(0) 0(0) 0(0) 0(0) 0(0)
Farfantepenaeus aztecus 0(0) 0(0) 0(0) 0(0) 0(0) 0(0) 0(0) 0(0) 0(0) 0(0) 0.11 (0.11) 0(0) 0(0) 0(0) 0(0) 0(0) 0(0) 0(0) 0(0) 0(0) 0(0) 0(0) 0(0) 0(0)
Fundulus heteroclitus 0(0) 0(0) 0(0) 0(0) 0(0) 0(0) 0(0) 0(0) 0(0) 0(0) 0(0) 0(0) 0(0) 0(0) 0(0) 0(0) 0(0) 0(0) 0(0) 0.10 (0.10) 0(0) 0(0) 0(0) 0(0)
Fundulus sp. 0(0) 0(0) 0(0) 0(0) 0(0) 0(0) 0(0) 0(0) 0(0) 0(0) 0(0) 0(0) 0(0) 0(0) 0(0) 0(0) 0(0) 0(0) 0(0) 0(0) 0(0) 0(0) 0(0) 0(0)
Gambusia holbrooki 0(0) 0(0) 0(0) 0(0) 0(0) 0(0) 0(0) 0(0) 0(0) 0(0) 0(0) 0(0) 0(0) 0(0) 0(0) 0(0) 0.10 (0.10) 0(0) 0(0) 0(0) 0.10
(0.10) 0(0) 0(0) 0.10 (0.10)
Gobiosoma sp. 0(0) 0(0) 0(0) 0(0) 0(0) 0(0) 0(0) 0(0) 0(0) 0.11 (0.11) 0(0) 0(0) 0(0) 0(0) 0(0) 0(0) 0(0) 0(0) 0(0) 0(0) 0(0) 0(0) 0(0) 0(0)
Micropterus salmoides 0(0) 0(0) 0(0) 0(0) 0(0) 0(0) 0(0) 0.10
(0.10) 0(0) 0(0) 0(0) 0(0) 0(0) 0(0) 0(0) 0(0) 0(0) 0(0) 0(0) 0(0) 0(0) 0(0) 0(0) 0(0)
Leiostomus xanthurus 0(0) 0(0) 0(0) 0(0) 0(0) 0(0) 0(0) 0(0) 0(0) 0(0) 0(0) 0(0) 0(0) 0(0) 0(0) 0(0) 0(0) 0(0) 0(0) 0(0) 0(0) 0(0) 0(0) 0(0)
Lepomis macrochirus 0(0) 0(0) 0(0) 0(0) 0(0) 0(0) 0(0) 0(0) 0(0) 0(0) 0(0) 0(0) 0(0) 0(0) 0(0) 0(0) 0(0) 0(0) 0(0) 0(0) 0(0) 0(0) 0(0) 0(0)
Palaemonetes pugio 0(0) 0(0) 0(0) 0(0) 0(0) 0(0) 0(0) 0(0) 0(0) 0.11 (0.11)
1.56 (0.56) 0.56 (0.34) 0(0) 0(0) 0(0) 0(0) 0(0) 0(0) 0.10
(0.10) 0(0) 0(0) 0.10 (0.10)
0.20 (0.20) 0(0)
Paralichthys dentatus 0(0) 0(0) 0(0) 0(0) 0(0) 0(0) 0(0) 0(0) 0(0) 0(0) 0(0) 0(0) 0(0) 0(0) 0(0) 0(0) 0(0) 0(0) 0(0) 0(0) 0(0) 0(0) 0(0) 0(0)
Paralichthys lethostigma 0(0) 0(0) 0(0) 0(0) 0(0) 0(0) 0(0) 0(0) 0(0) 0(0) 0(0) 0(0) 0(0) 0(0) 0(0) 0(0) 0(0) 0(0) 0(0) 0.10 (0.10) 0(0) 0(0) 0(0) 0(0)
Paralichthys sp. 0(0) 0(0) 0(0) 0(0) 0(0) 0(0) 0(0) 0(0) 0(0) 0(0) 0(0) 0(0) 0(0) 0(0) 0(0) 0(0) 0(0) 0(0) 0(0) 0(0) 0(0) 0(0) 0(0) 0(0)
Rhithropanopeus harrisi 0(0) 0(0) 0(0) 0(0) 0(0) 0(0) 0(0) 0(0) 0(0) 0(0) 0(0) 0(0) 0(0) 0(0) 0(0) 0(0) 0(0) 0(0) 0(0) 0.10 (0.10) 0(0) 0(0) 0(0) 0(0)
Uca minax 0(0) 0(0) 0(0) 0(0) 0(0) 0(0) 0(0) 0(0) 0(0) 0(0) 0(0) 0(0) 0(0) 0.10 (0.10) 0.10 (0.10) 0(0) 0(0) 0.40 (0.31) 0(0) 0.10
(0.10) 0.10
(0.10) 0(0) 0(0) 0(0)
Uca pugnax 0.60 (0.34)
0.20 (0.13) 0(0) 0(0) 0(0) 0(0) 0(0) 0(0) 0(0) 0(0) 0(0) 0(0) 0(0) 0(0) 0(0) 0(0) 0(0) 0(0) 0(0) 0(0) 0(0) 0(0) 0(0) 0(0)
Uca sp. 0(0) 0(0) 0(0) 0(0) 0(0) 0(0) 0(0) 0(0) 0(0) 0(0) 0(0) 0(0) 0(0) 0(0) 0(0) 0(0) 0(0) 0(0) 0(0) 0(0) 0(0) 0(0) 0(0) 0(0)

161
Table 7.4-5b. Mean abundance (SE) for epibenthic fauna collected during spring (2000-2007) Breder trap samples at station P7 (Indian Creek). Spring 2000 Spring 2001 Spring 2002 Spring 2003 Spring 2004 Spring 2005 Spring 2006 Spring 2007 Low Mid Upper Low Mid Upper Low Mid Upper Low Mid Upper Low Mid Upper Low Mid Upper Low Mid Upper Low Mid Upper
Anguilla rostrata 0(0) 0(0) 0(0) 0(0) 0(0) 0(0) 0(0) 0(0) 0(0) 0(0) 0(0) 0(0) 0(0) 0(0) 0(0) 0(0) 0(0) 0(0) 0(0) 0(0) 0(0) 0(0) 0(0) 0(0) Callinectes sapidus 0(0) 0(0) 0(0) 0(0) 0(0) 0(0) 0(0) 0(0) 0(0) 0(0) 0(0) 0(0) 0(0) 0(0) 0(0) 0(0) 0(0) 0(0) 0(0) 0(0) 0(0) 0(0) 0(0) 0(0) Clupidae 0(0) 0(0) 0(0) 0(0) 0(0) 0(0) 0(0) 0(0) 0(0) 0(0) 0(0) 0(0) 0(0) 0(0) 0(0) 0(0) 0.10
(0.10) 0(0) 0(0) 0(0) 0(0) 0(0) 0(0) 0(0)
Ctenogobius shufeldti
0.40 (0.16)
1.10 (0.28)
4.33 (3.85)
0.40 (0.22)
0.60 (0.22)
0.30 (0.21) 0(0) 0(0) 0(0) 0(0) 0(0) 0(0) 0.70
(0.42)0.70
(0.30) 0(0) 1.00 (0.49)
0.70 (0.40) 0(0) 0.90
(0.35)0.90
(0.41)0.10
(0.10)0.20
(0.20)0.33
(0.24) 0(0)
Dormitator maculatus
0(0) 0(0) 0(0) 0(0) 0(0) 0(0) 0(0) 0(0) 0(0) 0(0) 0(0) 0(0) 0(0) 0(0) 0(0) 0(0) 0(0) 0(0) 0(0) 0(0) 0(0) 0(0) 0(0) 0(0) Eucinostomus argenteus
0(0) 0(0) 0(0) 0(0) 0(0) 0(0) 0(0) 0(0) 0(0) 0(0) 0(0) 0(0) 0(0) 0(0) 0(0) 0(0) 0(0) 0(0) 0(0) 0(0) 0(0) 0(0) 0(0) 0(0) Eucinostomus sp. 0(0) 0(0) 0(0) 0(0) 0(0) 0(0) 0(0) 0(0) 0(0) 0(0) 0(0) 0(0) 0(0) 0(0) 0(0) 0(0) 0(0) 0(0) 0(0) 0(0) 0(0) 0(0) 0(0) 0(0) Evorthodus lyricus 0(0) 0(0) 0(0) 0(0) 0(0) 0(0) 0(0) 0(0) 0(0) 0(0) 0(0) 0(0) 0(0) 0(0) 0(0) 0(0) 0(0) 0(0) 0(0) 0(0) 0(0) 0(0) 0(0) 0(0) Farfantepenaeus aztecus
0(0) 0(0) 0(0) 0(0) 0(0) 0(0) 0(0) 0(0) 0(0) 0(0) 0(0) 0(0) 0(0) 0(0) 0(0) 0(0) 0(0) 0(0) 0(0) 0(0) 0(0) 0(0) 0(0) 0(0) Fundulus heteroclitus 0(0) 0(0) 0(0) 0(0) 0(0) 0.50
(0.31) 0(0) 0(0) 0(0) 0(0) 0(0) 0(0) 0(0) 0(0) 0.20 (0.13) 0(0) 0.10
(0.10) 0(0) 0(0) 0(0) 0.10 (0.10)
0.10 (0.10) 0(0) 0.11
(0.11) Fundulus sp. 0(0) 0(0) 0(0) 0(0) 0(0) 0(0) 0(0) 0(0) 0(0) 0(0) 0(0) 0(0) 0(0) 0(0) 0(0) 0.20
(0.20)0.10
(0.10)3.00
(1.30) 0(0) 0(0) 0(0) 0(0) 0(0) 0(0)
Gambusia holbrooki
0(0) 0(0) 0(0) 0(0) 0(0) 0(0) 0(0) 0(0) 0(0) 0(0) 0(0) 0(0) 0(0) 0(0) 0(0) 0(0) 0(0) 4.20 (2.09) 0(0) 0(0) 0(0) 0(0) 0.22
(0.15)0.11
(0.11) Gobiosoma sp. 0(0) 0(0) 0(0) 0(0) 0(0) 0(0) 0(0) 0(0) 0(0) 0(0) 0(0) 0(0) 0(0) 0(0) 0(0) 0(0) 0(0) 0(0) 0(0) 0(0) 0(0) 0(0) 0(0) 0(0) Micropterus salmoides 0(0) 0(0) 0(0) 0(0) 0(0) 0(0) 0(0) 0(0) 0(0) 0(0) 0(0) 0(0) 0(0) 0(0) 0(0) 0(0) 0(0) 0(0) 0(0) 0(0) 0(0) 0(0) 0(0) 0(0) Leiostomus xanthurus
0(0) 0(0) 0(0) 6.60 (2.35)
8.20 (3.57)
2.80 (0.66) 0(0) 0(0) 0(0) 0(0) 0(0) 0(0) 1.60
(0.78)0.90
(0.31) 1.10
(0.35)0.40
(0.22)1.10
(0.46)0.50
(0.22)0.40
(0.16)0.60
(0.40)0.30
(0.15) 0(0) 0(0) 0(0)
Lepomis macrochirus
0.10 (0.10) 0(0) 0(0) 0(0) 0(0) 0(0) 0(0) 0(0) 0(0) 0(0) 0(0) 0(0) 0(0) 0(0) 0(0) 0(0) 0(0) 0(0) 0(0) 0(0) 0(0) 0(0) 0(0) 0(0)
Palaemonetes pugio 0(0) 0(0) 0(0) 0(0) 0(0) 0(0) 0(0) 0(0) 0(0) 0(0) 0(0) 0(0) 0(0) 0(0) 0(0) 0(0) 0(0) 0(0) 0(0) 0(0) 0(0) 0(0) 0(0) 0(0) Paralichthys dentatus
0(0) 0(0) 0(0) 0.40 (0.22) 0(0) 0.10
(0.10) 0(0) 0(0) 0.10 (0.10)
0.40 (0.16)
0.30 (0.21) 0(0) 0(0) 0(0) 0(0) 0(0) 0(0) 0(0) 0(0) 0(0) 0(0) 0(0) 0(0) 0(0)
Paralichthys lethostigma
0(0) 0.30 (0.15)
0.67 (0.44) 0(0) 0(0) 0(0) 0(0) 0(0) 0(0) 0(0) 0(0) 0(0) 0(0) 0(0) 0(0) 0(0) 0(0) 0(0) 0(0) 0(0) 0(0) 0(0) 0(0) 0(0)
Paralichthys sp. 0(0) 0(0) 0(0) 0(0) 0(0) 0(0) 0(0) 0(0) 0(0) 0(0) 0(0) 0(0) 1.20 (0.33)
0.70 (0.37)
0.50 (0.17)
0.10 (0.10) 0(0) 0(0) 0(0) 0(0) 0(0) 0.60
(0.34)0.11
(0.11) 0(0)
Rhithropanopeus herbstii
0(0) 0(0) 0(0) 0(0) 0(0) 0(0) 0(0) 0(0) 0.10 (0.10) 0(0) 0(0) 0(0) 0(0) 0(0) 0(0) 0(0) 0(0) 0(0) 0(0) 0(0) 0(0) 0(0) 0(0) 0(0)
Uca minax 0(0) 0(0) 0(0) 0(0) 0(0) 0(0) 0(0) 0(0) 0(0) 0(0) 0.10 (0.10)
0.33 (0.17) 0(0) 0(0) 0(0) 0(0) 0(0) 0(0) 0(0) 0(0) 0(0) 0.10
(0.10)0.55
(0.44)2.22
(1.22) Uca pugnax 0(0) 0(0) 0(0) 0(0) 0(0) 0(0) 0(0) 0(0) 0(0) 0(0) 0(0) 0(0) 0(0) 0(0) 0(0) 0(0) 0(0) 0(0) 0(0) 0(0) 0(0) 0(0) 0(0) 0(0) Uca sp. 0(0) 0(0) 0(0) 0(0) 0(0) 0(0) 0(0) 0(0) 0.10
(0.10) 0(0) 0(0) 0(0) 0(0) 0(0) 0(0) 0(0) 0(0) 0(0) 0(0) 0(0) 0(0) 0(0) 0(0) 0(0)

162
Table 7.4-6a. Mean abundance (SE) for epibenthic fauna collected during fall (1999-2006) Breder trap samples at station P8 (Dollisons Landing). Fall 1999 Fall 2000 Fall 2001 Fall 2002 Fall 2003 Fall 2004 Fall 2005 Fall 2006
Low Mid Upper Low Mid Upper Low Mid Upper Low Mid Upper Low Mid Upper Low Mid Upper Low Mid Upper Low Mid Upper
Amphipoda 0(0) 0(0) 0(0) 0(0) 0(0) 0(0) 0(0) 0(0) 0(0) 0(0) 0(0) 0(0) 0(0) 0(0) 0(0) 0(0) 0(0) 0(0) 0(0) 0(0) 0(0) 0(0) 0(0) 0(0)
Anguilla rostrata 0(0) 0(0) 0(0) 0(0) 0(0) 0(0) 0(0) 0(0) 0(0) 0(0) 0(0) 0(0) 0(0) 0.10 (0.10) 0.10 (0.10) 0(0) 0(0) 0(0) 0(0) 0(0) 0(0) 0(0) 0(0) 0(0)
Callinectes sapidus 0(0) 0(0) 0(0) 0(0) 0(0) 0(0) 0(0) 0(0) 0(0) 0.11 (0.11) 0(0) 0(0) 0(0) 0(0) 0(0) 0(0) 0(0) 0(0) 0(0) 0(0) 0(0) 0(0) 0(0) 0(0)
Cambarus robustus 0(0) 0(0) 0.10 (0.10) 0(0) 0(0) 0(0) 0(0) 0(0) 0(0) 0(0) 0(0) 0(0) 0(0) 0(0) 0(0) 0(0) 0(0) 0(0) 0(0) 0(0) 0(0) 0(0) 0(0) 0(0)
Ctenogobius shufeldti 0.10 (0.10) 0(0) 0(0) 0(0) 0(0) 0(0) 0(0) 0(0) 0(0) 0(0) 0(0) 0(0) 1.10
(0.60) 0.50
(0.27) 0.20 (0.13) 0(0) 0(0) 0(0) 0(0) 0(0) 0(0) 0(0) 0(0) 0(0)
Dormitator maculatus 0(0) 0(0) 0.10 (0.10) 0(0) 0(0) 0(0) 0(0) 0(0) 0(0) 0(0) 0(0) 0(0) 0(0) 0(0) 0(0) 0(0) 0(0) 0(0) 0(0) 0(0) 0(0) 0(0) 0(0) 0(0)
Fundulus confluentus 0(0) 0(0) 0(0) 0(0) 0(0) 0(0) 0(0) 0(0) 0(0) 0.11 (0.11) 0(0) 0(0) 0(0) 0(0) 0(0) 0(0) 0(0) 0(0) 0(0) 0(0) 0(0) 0(0) 0(0) 0(0)
Fundulus diaphanus 0(0) 0(0) 0(0) 0(0) 0(0) 0(0) 0(0) 0(0) 0(0) 0(0) 0(0) 0(0) 0(0) 0(0) 0(0) 0.50 (0.27)
1.60 (0.64) 2.20 (1.17) 0(0) 0(0) 0(0) 0(0) 0(0) 0(0)
Fundulus heteroclitus 0(0) 0(0) 0(0) 0(0) 0(0) 0(0) 0(0) 0(0) 0(0) 0(0) 0(0) 0(0) 0(0) 0(0) 0(0) 0(0) 0(0) 0(0) 0(0) 0.10 (0.10) 0(0) 0.20
(0.13) 0.20
(0.13) 0(0)
Fundulus sp. 0(0) 0(0) 0(0) 0(0) 0(0) 0(0) 0(0) 0(0) 0(0) 0(0) 0(0) 0(0) 0(0) 0(0) 0(0) 0(0) 0(0) 0(0) 0(0) 0(0) 0(0) 0(0) 0(0) 0(0)
Gambusia affinis 0(0) 0(0) 0(0) 0(0) 0(0) 0(0) 0(0) 0(0) 0(0) 0(0) 0(0) 0(0) 0(0) 0(0) 0.20 (0.20) 0(0) 0(0) 0(0) 0(0) 0(0) 0(0) 0(0) 0(0) 0(0)
Gambusia holbrooki 0(0) 0(0) 0(0) 0(0) 0(0) 0(0) 0(0) 0(0) 0(0) 0(0) 0(0) 0(0) 0(0) 0(0) 0(0) 0(0) 0(0) 0(0) 0.40 (0.22)
0.10 (0.10)
0.50 (0.34) 0(0) 0(0) 0(0)
Lagodon rhomboides 0(0) 0(0) 0(0) 0(0) 0(0) 0(0) 0(0) 0(0) 0(0) 0(0) 0(0) 0(0) 0(0) 0(0) 0(0) 0(0) 0(0) 0(0) 0(0) 0(0) 0(0) 0(0) 0(0) 0(0)
Lepomis macrochirus 0(0) 0(0) 0(0) 0.10 (0.10) 0(0) 1.0 0
(1.0) 0(0) 0(0) 0(0) 0(0) 0(0) 0(0) 0(0) 0(0) 0(0) 0(0) 0(0) 0(0) 0(0) 0(0) 0(0) 0(0) 0(0) 0(0)
Menidia beryllina 0(0) 0(0) 0(0) 0(0) 0(0) 0(0) 0(0) 0(0) 0(0) 0(0) 0(0) 0(0) 0(0) 0(0) 0(0) 0(0) 0(0) 0(0) 0(0) 0(0) 0(0) 0(0) 0(0) 0(0)
Micropterus salmoides 0(0) 0(0) 0(0) 0(0) 0(0) 0(0) 0(0) 0(0) 0(0) 0(0) 0(0) 0(0) 0(0) 0(0) 0(0) 0(0) 0(0) 0(0) 0(0) 0(0) 0(0) 0(0) 0(0) 0.10 (0.10)
Palaemonetes pugio 0(0) 0(0) 0(0) 0(0) 0(0) 0(0) 0(0) 0(0) 0(0) 0.78 (0.66)
0.30 (0.21) 1.10 (0.31) 0(0) 0(0) 0(0) 0(0) 0(0) 0(0) 0.10
(0.10) 0(0) 0(0) 0(0) 0(0) 0(0)
Paralichthys dentatus 0(0) 0(0) 0(0) 0(0) 0(0) 0(0) 0(0) 0(0) 0(0) 0(0) 0(0) 0(0) 0(0) 0(0) 0(0) 0(0) 0(0) 0(0) 0(0) 0(0) 0(0) 0(0) 0(0) 0(0)
Paralichthys sp. 0.20 (0.13)
0.20 (0.20) 0(0) 0(0) 0(0) 0(0) 0(0) 0(0) 0(0) 0(0) 0(0) 0(0) 0(0) 0(0) 0(0) 0(0) 0(0) 0(0) 0(0) 0(0) 0(0) 0(0) 0(0) 0(0)
Trinectes maculatus 0(0) 0(0) 0(0) 0(0) 0(0) 0(0) 0(0) 0(0) 0(0) 0(0) 0(0) 0(0) 0.20 (0.13)
0.20 (0.20) 0.10 (0.10) 0(0) 0(0) 0(0) 0(0) 0(0) 0(0) 0(0) 0(0) 0(0)
Uca minax 0(0) 0(0) 0(0) 0(0) 0(0) 0(0) 0(0) 0(0) 0(0) 0(0) 0(0) 0(0) 0(0) 0(0) 0(0) 0(0) 0(0) 0(0) 0(0) 0.40 (0.30)
0.10 (0.10)
0.10 (0.10) 0(0) 0.10 (0.10)

163
Table 7.4-6b. Mean abundance (SE) for epibenthic fauna collected during spring (2000-2007) Breder trap samples at station P8 (Dollisons Landing). Spring 2000 Spring 2001 Spring 2002 Spring 2003 Spring 2004 Spring 2005 Spring 2006 Spring 2007 Low Mid Upper Low Mid Upper Low Mid Upper Low Mid Upper Low Mid Upper Low Mid Upper Low Mid Upper Low Mid Upper
Amphipoda 0(0) 0.10 (0.10) 0(0) 0(0) 0(0) 0(0) 0(0) 0(0) 0(0) 0(0) 0(0) 0(0) 0(0) 0(0) 0(0) 0(0) 0(0) 0(0) 0(0) 0(0) 0(0) 0(0) 0(0) 0(0)
Anguilla rostrata 0(0) 0(0) 0(0) 0(0) 0(0) 0(0) 0(0) 0(0) 0(0) 0(0) 0(0) 0(0) 0(0) 0(0) 0(0) 0(0) 0(0) 0(0) 0(0) 0(0) 0(0) 0(0) 0(0) 0(0)
Callinectes sapidus 0(0) 0(0) 0(0) 0(0) 0(0) 0(0) 0(0) 0(0) 0(0) 0(0) 0(0) 0(0) 0(0) 0(0) 0(0) 0(0) 0(0) 0(0) 0(0) 0(0) 0(0) 0(0) 0(0) 0(0)
Cambarus robustus 0(0) 0(0) 0(0) 0(0) 0(0) 0(0) 0(0) 0(0) 0(0) 0(0) 0(0) 0(0) 0(0) 0(0) 0(0) 0(0) 0(0) 0(0) 0(0) 0(0) 0(0) 0(0) 0(0) 0(0)
Ctenogobius shufeldti 0(0) 0(0) 0(0) 0.60 (0.31)
0.30 (0.15) 0.30 (0.21) 0(0) 0(0) 0(0) 0(0) 0(0) 0(0) 0(0) 0(0) 0(0) 0(0) 0(0) 0(0) 0(0) 0(0) 0(0) 0(0) 0(0) 0(0)
Dormitator maculatus 0(0) 0(0) 0(0) 0(0) 0(0) 0(0) 0(0) 0(0) 0(0) 0(0) 0(0) 0(0) 0(0) 0(0) 0(0) 0(0) 0(0) 0(0) 0(0) 0(0) 0(0) 0(0) 0(0) 0(0)
Fundulus confluentus 0(0) 0(0) 0(0) 0(0) 0(0) 0(0) 0(0) 0(0) 0(0) 0(0) 0(0) 0(0) 0(0) 0(0) 0(0) 0(0) 0(0) 0(0) 0(0) 0(0) 0(0) 0(0) 0(0) 0(0)
Fundulus diaphanus 0(0) 0(0) 0(0) 0(0) 0(0) 0(0) 0(0) 0(0) 0(0) 0(0) 0(0) 0(0) 0(0) 0(0) 0(0) 0(0) 0(0) 0(0) 0(0) 0(0) 0(0) 0(0) 0(0) 0(0)
Fundulus heteroclitus 0(0) 0(0) 0(0) 0(0) 0(0) 0(0) 0(0) 0(0) 0(0) 0(0) 0(0) 0(0) 0.30 (0.21)
0.30 (0.15) 0.10 (0.10) 0(0) 0(0) 0(0) 0.40
(0.22) 2.50
(1.27) 1.20
(0.85) 0(0) 0.20 (0.13)
0.20 (0.13)
Fundulus sp. 0(0) 0(0) 0(0) 0(0) 0(0) 0(0) 0(0) 0(0) 0(0) 0(0) 0(0) 0(0) 0(0) 0(0) 0(0) 0.10 (0.10)
0.60 (0.40) 0.50 (0.31) 0(0) 0(0) 0(0) 0(0) 0(0) 0(0)
Gambusia affinis 0(0) 0(0) 0(0) 0(0) 0(0) 0(0) 0(0) 0(0) 0(0) 0(0) 0(0) 0(0) 0(0) 0(0) 0(0) 0(0) 0(0) 0(0) 0(0) 0(0) 0(0) 0(0) 0(0) 0(0)
Gambusia holbrooki 0(0) 0(0) 0(0) 0(0) 0(0) 0(0) 0(0) 0(0) 0(0) 0(0) 0(0) 0(0) 0(0) 0(0) 0(0) 0(0) 0(0) 0(0) 0(0) 0(0) 0(0) 0(0) 0(0) 0(0)
Lagodon rhomboides 0(0) 0(0) 0(0) 0(0) 0(0) 0(0) 0(0) 0(0) 0(0) 0(0) 0(0) 0(0) 0(0) 0(0) 0.10 (0.10) 0(0) 0(0) 0(0) 0(0) 0(0) 0(0) 0(0) 0(0) 0(0)
Lepomis macrochirus 0(0) 0(0) 0(0) 0(0) 0(0) 0(0) 0(0) 0(0) 0(0) 0(0) 0(0) 0(0) 0(0) 0(0) 0(0) 0(0) 0(0) 0(0) 0(0) 0(0) 0(0) 0(0) 0(0) 0(0)
Menidia beryllina 0.10 (0.10)
0.10 (0.10) 0(0) 0(0) 0(0) 0(0) 0(0) 0(0) 0(0) 0(0) 0(0) 0(0) 0(0) 0(0) 0(0) 0(0) 0(0) 0(0) 0(0) 0(0) 0(0) 0(0) 0(0) 0(0)
Micropterus salmoides 0(0) 0(0) 0(0) 0(0) 0(0) 0(0) 0(0) 0(0) 0(0) 0(0) 0(0) 0(0) 0(0) 0(0) 0(0) 0(0) 0(0) 0(0) 0(0) 0(0) 0(0) 0(0) 0(0) 0(0)
Palaemonetes pugio 0(0) 0(0) 0(0) 0(0) 0(0) 0(0) 0(0) 0(0) 0(0) 0(0) 0(0) 0(0) 0(0) 0(0) 0(0) 0(0) 0(0) 0(0) 0(0) 0(0) 0(0) 0(0) 0(0) 0(0)
Paralichthys dentatus 0(0) 0(0) 0(0) 0.10 (0.10)
0.20 (0.13) 1.00 (0.80) 0(0) 0(0) 0(0) 0.10
(0.10) 0.11
(0.11) 0.10 (0.10) 0(0) 0(0) 0(0) 0(0) 0(0) 0(0) 0(0) 0(0) 0(0) 0(0) 0(0) 0(0)
Paralichthys sp. 0(0) 0(0) 0(0) 0(0) 0(0) 0(0) 0(0) 0(0) 0(0) 0(0) 0(0) 0(0) 1.20 (0.61)
0.20 (0.13) 0(0) 0(0) 0(0) 0(0) 0(0) 0(0) 0(0) 0(0) 0(0) 0(0)
Trinectes maculatus 0(0) 0(0) 0(0) 0(0) 0(0) 0(0) 0(0) 0(0) 0(0) 0(0) 0(0) 0(0) 0(0) 0(0) 0(0) 0(0) 0(0) 0(0) 0(0) 0(0) 0(0) 0(0) 0(0) 0(0)
Uca minax 0(0) 0(0) 0(0) 0(0) 0(0) 0(0) 0(0) 0(0) 0(0) 0(0) 0(0) 0(0) 0(0) 0(0) 0(0) 0(0) 0(0) 0(0) 0(0) 0(0) 0(0) 0(0) 0(0) 0(0)

164
Table 7.4-7a. Mean abundance (SE) for epibenthic fauna collected during fall (1999-2006) Breder trap samples at station P11 (Smith Creek). Fall 1999 Fall 2000 Fall 2001 Fall 2002 Fall 2003 Fall 2004 Fall 2005 Fall 2006
Low Mid Upper Low Mid Upper Low Mid Upper Low Mid Upper Low Mid Upper Low Mid Upper Low Mid Upper Low Mid Upper
Callinectes sapidus 0(0) 0(0) 0(0) 0(0) 0(0) 0(0) 0(0) 0.10 (0.10) 0.10 (0.10) 0(0) 0(0) 0(0) 0(0) 0(0) 0(0) 0.10
(0.10) 0.10
(0.10) 0.10 (0.10) 0(0) 0(0) 0(0) 0(0) 0(0) 0(0)
Ctenogobius boleosoma 0(0) 0(0) 0(0) 0(0) 0(0) 0(0) 0(0) 0(0) 0(0) 0(0) 0(0) 0(0) 0(0) 0(0) 0(0) 0(0) 0(0) 0(0) 0.40 (0.30)
0.40 (0.22) 0(0) 0(0) 0(0) 0(0)
Ctenogobius shufeldti 0.10 (0.10)
0.10 (0.10) 0(0) 0(0) 0(0) 0(0) 0(0) 0(0) 0.10 (0.10) 0(0) 0(0) 0(0) 2.10
(0.85) 0.70
(0.40) 0.30 (0.21) 0.10 (0.10) 0(0) 0.10 (0.10) 0.20
(0.20) 0(0) 0(0) 0.20 (0.20) 0(0) 0.40 (0.16)
Dormitator maculatus 0.10 (0.10) 0(0) 0(0) 0(0) 0(0) 0(0) 0(0) 0(0) 0(0) 0(0) 0(0) 0(0) 0(0) 0(0) 0(0) 0(0) 0(0) 0(0) 0(0) 0(0) 0(0) 0(0) 0(0) 0(0)
Eucinostomus sp. 0(0) 0(0) 0(0) 0(0) 0(0) 0(0) 0(0) 0(0) 0(0) 0(0) 0(0) 0(0) 0(0) 0(0) 0(0) 0(0) 0(0) 0(0) 0(0) 0.10 (0.10)
0.20 (0.13) 0(0) 0(0) 0(0)
Farfantepenaeus aztecus 0(0) 0(0) 0(0) 0(0) 0(0) 0(0) 0.60 (0.27)
0.50 (0.22) 0.20 (0.13) 1.20
(0.70) 1.80
(0.61) 1.20 (0.36) 0(0) 0(0) 0(0) 0(0) 0(0) 0(0) 0(0) 0(0) 0(0) 0(0) 0(0) 0(0)
Fundulus heteroclitus 0(0) 0.10 (0.10) 0(0) 0(0) 0.10
(0.10) 0(0) 0(0) 0(0) 0(0) 0(0) 0(0) 0(0) 0(0) 0(0) 0(0) 0(0) 0(0) 0(0) 0(0) 0(0) 0(0) 0(0) 0.20 (0.20) 0.10 (0.10)
Fundulus majalis 0(0) 0(0) 0(0) 0(0) 0(0) 0(0) 0.20 (0.13) 0(0) 0.30 (0.21) 0(0) 0(0) 0(0) 0(0) 0(0) 0(0) 0(0) 0(0) 0(0) 0(0) 0(0) 0(0) 0(0) 0(0) 0(0)
Lagodon rhomboides 0(0) 0(0) 0(0) 0(0) 0(0) 0(0) 0(0) 0(0) 0(0) 0(0) 0(0) 0(0) 0(0) 0(0) 0(0) 0(0) 0(0) 0(0) 0(0) 0(0) 0(0) 0(0) 0(0) 0(0)
Leiostomus xanthurus 0(0) 0(0) 0(0) 0(0) 0(0) 0(0) 0(0) 0(0) 0(0) 0(0) 0(0) 0(0) 0(0) 0(0) 0(0) 0(0) 0(0) 0(0) 0(0) 0(0) 0(0) 0(0) 0(0) 0(0)
Lepomis macrochirus 0.10 (0.10)
0.10 (0.10) 0(0) 0(0) 0(0) 0(0) 0(0) 0(0) 0(0) 0(0) 0(0) 0(0) 0(0) 0(0) 0(0) 0(0) 0(0) 0(0) 0(0) 0(0) 0(0) 0(0) 0(0) 0(0)
Litopenaeus setiferus 0(0) 0(0) 0(0) 0(0) 0(0) 0(0) 0(0) 0(0) 0(0) 0(0) 0(0) 0(0) 0(0) 0(0) 0(0) 0.20 (0.13)
0.10 (0.10) 0.40 (0.16) 0(0) 0(0) 0(0) 0(0) 0(0) 0(0)
Lutjanus griseus 0(0) 0(0) 0(0) 0(0) 0(0) 0(0) 0(0) 0(0) 0(0) 0.10 (0.10)
0.10 (0.10) 0.20 (0.13) 0(0) 0(0) 0(0) 0(0) 0(0) 0(0) 0(0) 0(0) 0(0) 0(0) 0(0) 0(0)
Menidia beryllina 0.10 (0.10) 0(0) 0(0) 0(0) 0(0) 0(0) 0(0) 0(0) 0(0) 0(0) 0(0) 0(0) 0(0) 0(0) 0(0) 0(0) 0(0) 0(0) 0(0) 0(0) 0(0) 0(0) 0(0) 0(0)
Micropogonias undulatu 0(0) 0(0) 0(0) 0(0) 0(0) 0(0) 0(0) 0(0) 0(0) 0(0) 0(0) 0(0) 0(0) 0(0) 0(0) 0(0) 0.10 (0.10) 0(0) 0(0) 0(0) 0(0) 0(0) 0(0) 0(0)
Mugil cephalus 0(0) 0(0) 0(0) 0(0) 0(0) 0(0) 0(0) 0(0) 0(0) 0(0) 0(0) 0(0) 0(0) 0(0) 0(0) 0(0) 0(0) 0(0) 0(0) 0(0) 0(0) 0(0) 0(0) 0(0)
Palaemonetes pugio 0(0) 0(0) 0(0) 0(0) 0(0) 0(0) 0(0) 0.80 (0.80) 0(0) 0.40
(0.31) 0.40
(0.22) 0.40 (0.16) 0.10 (0.10)
0.10 (0.10) 0(0) 0(0) 0(0) 0(0) 0(0) 0(0) 0(0) 0.10
(0.10) 0.20
(0.13) 0(0)
Paralichthys dentatus 0(0) 0(0) 0(0) 0(0) 0(0) 0(0) 0(0) 0(0) 0(0) 0.10 (0.10) 0(0) 0(0) 0(0) 0(0) 0(0) 0(0) 0(0) 0(0) 0(0) 0(0) 0(0) 0(0) 0(0) 0(0)
Paralichthys lethostigma 0(0) 0(0) 0(0) 0(0) 0(0) 0(0) 0(0) 0(0) 0(0) 0(0) 0.10 (0.10) 0(0) 0(0) 0(0) 0(0) 0(0) 0(0) 0(0) 0(0) 0(0) 0(0) 0(0) 0(0) 0(0)
Paralichthys sp. 0(0) 0(0) 0(0) 0(0) 0(0) 0(0) 0(0) 0(0) 0(0) 0(0) 0(0) 0(0) 0(0) 0(0) 0(0) 0(0) 0(0) 0(0) 0(0) 0(0) 0(0) 0(0) 0(0) 0(0)
Symphorus plagiusa 0(0) 0(0) 0(0) 0(0) 0(0) 0(0) 0(0) 0(0) 0(0) 0.10 (0.10) 0(0) 0.10 (0.10) 0(0) 0(0) 0(0) 0(0) 0(0) 0(0) 0(0) 0(0) 0(0) 0(0) 0(0) 0(0)
Trinectes maculatus 0(0) 0.10 (0.10) 0(0) 0(0) 0(0) 0(0) 0(0) 0(0) 0(0) 0(0) 0(0) 0(0) 0(0) 0(0) 0(0) 0(0) 0(0) 0(0) 0(0) 0(0) 0(0) 0(0) 0(0) 0(0)
U/I larval fish 0.10 (0.10) 0(0) 0(0) 0(0) 0(0) 0(0) 0(0) 0(0) 0(0) 0.10
(0.10) 0(0) 0.40 (0.40) 0(0) 0(0) 0(0) 0(0) 0(0) 0(0) 0(0) 0(0) 0(0) 0(0) 0(0) 0(0)
Uca pugnax 0.10 (0.10)
0.20 (0.13) 8.50 (4.17) 0(0) 0.20
(0.13) 0(0) 0(0) 0(0) 0(0) 0(0) 0(0) 0(0) 0(0) 0(0) 0(0) 0(0) 0(0) 0(0) 0(0) 0(0) 0(0) 0(0) 0(0) 0(0)

165
Table 7.4-7b. Mean abundance (SE) for epibenthic fauna collected during spring (2000-2007) Breder trap samples at station P11 (Smith Creek). Spring 2000 Spring 2001 Spring 2002 Spring 2003 Spring 2004 Spring 2005 Spring 2006 Spring 2007 Low Mid Upper Low Mid Upper Low Mid Upper Low Mid Upper Low Mid Upper Low Mid Upper Low Mid Upper Low Mid Upper
Callinectes sapidus 0(0) 0(0) 0(0) 0.10 (0.10) 0(0) 0(0) 0.30
(0.15) 0(0) 0(0) 0(0) 0.10 (0.10) 0(0) 0(0) 0(0) 0(0) 0(0) 0(0) 0(0) 0(0) 0.10
(0.10) 0(0) 0.11 (0.11) 0(0) 0(0)
Ctenogobius boleosoma 0(0) 0(0) 0(0) 0(0) 0(0) 0(0) 0(0) 0(0) 0(0) 0(0) 0(0) 0(0) 0(0) 0(0) 0(0) 0(0) 0(0) 0(0) 0(0) 0(0) 0(0) 0(0) 0(0) 0(0)
Ctenogobius shufeldti 0(0) 0(0) 0(0) 0.60 (0.31)
0.20 (0.13) 0(0) 0(0) 0(0) 0(0) 0(0) 0(0) 0(0) 0(0) 0.10
(0.10) 0.10 (0.10) 0(0) 0(0) 0(0) 0(0) 0(0) 0(0) 0(0) 0(0) 0(0)
Dormitator maculatus 0(0) 0(0) 0(0) 0(0) 0(0) 0(0) 0(0) 0(0) 0(0) 0(0) 0(0) 0(0) 0(0) 0(0) 0(0) 0(0) 0(0) 0(0) 0(0) 0(0) 0(0) 0(0) 0(0) 0(0)
Eucinostomus sp. 0(0) 0(0) 0(0) 0(0) 0(0) 0(0) 0(0) 0(0) 0(0) 0(0) 0(0) 0(0) 0(0) 0(0) 0(0) 0(0) 0(0) 0(0) 0(0) 0(0) 0(0) 0(0) 0(0) 0(0)
Farfantepenaeus aztecus 0(0) 0(0) 0(0) 0(0) 0(0) 0(0) 0(0) 0(0) 0(0) 0(0) 0(0) 0(0) 0(0) 0(0) 0(0) 0(0) 0(0) 0(0) 0(0) 0(0) 0(0) 0(0) 0(0) 0(0)
Fundulus heteroclitus 0(0) 0(0) 0(0) 0(0) 0(0) 0(0) 0.20 (0.20) 0(0) 0.10 (0.10) 0(0) 0(0) 0(0) 0(0) 0(0) 0(0) 0(0) 0(0) 0(0) 0.10
(0.10) 0(0) 0(0) 0(0) 0(0) 0.10 (0.10)
Fundulus majalis 0(0) 0(0) 0(0) 0(0) 0(0) 0(0) 0(0) 0(0) 0(0) 0(0) 0(0) 0(0) 0(0) 0(0) 0(0) 0(0) 0(0) 0(0) 0(0) 0(0) 0(0) 0(0) 0(0) 0(0)
Lagodon rhomboides 0.10 (0.10) 0(0) 0(0) 0(0) 0(0) 0(0) 0(0) 0(0) 0(0) 0(0) 0(0) 0(0) 0(0) 0(0) 0(0) 1.50
(0.67) 1.10
(0.46) 0.60 (0.31) 0(0) 0(0) 0(0) 0.33 (0.24)
0.70 (0.26)
0.10 (0.10)
Leiostomus xanthurus 1.30 (0.76)
0.30 (0.21)
1.0 0 (0.39) 0(0) 0.10
(0.10) 0(0) 0(0) 0(0) 0(0) 0(0) 0.10 (0.10) 0(0) 6.80
(2.08) 9.70
(3.85) 25.90
(11.83) 15.30 (5.11)
26.60 (8.71)
19.20 (4.62)
21.80 (2.93)
45.20 (6.12)
22.70 (5.51)
13.55 (2.96)
44.30 (9.24)
62.50 (17.35)
Lepomis macrochirus 0(0) 0(0) 0(0) 0(0) 0(0) 0(0) 0(0) 0(0) 0(0) 0(0) 0(0) 0(0) 0(0) 0(0) 0(0) 0(0) 0(0) 0(0) 0(0) 0(0) 0(0) 0(0) 0(0) 0(0)
Litopenaeus setiferus 0(0) 0(0) 0(0) 0(0) 0(0) 0(0) 0(0) 0(0) 0(0) 0(0) 0(0) 0(0) 0(0) 0(0) 0(0) 0(0) 0(0) 0(0) 0(0) 0(0) 0(0) 0(0) 0(0) 0(0)
Lutjanus griseus 0(0) 0(0) 0(0) 0(0) 0(0) 0(0) 0(0) 0(0) 0(0) 0(0) 0(0) 0(0) 0(0) 0(0) 0(0) 0(0) 0(0) 0(0) 0(0) 0(0) 0(0) 0(0) 0(0) 0(0)
Menidia beryllina 0(0) 0(0) 0(0) 0(0) 0(0) 0(0) 0(0) 0(0) 0(0) 0(0) 0(0) 0(0) 0(0) 0(0) 0(0) 0(0) 0(0) 0(0) 0(0) 0(0) 0(0) 0(0) 0(0) 0(0)
Micropogonias undulatu 0(0) 0(0) 0(0) 0(0) 0(0) 0(0) 0.80 (0.61)
0.50 (0.22) 1.10 (0.60) 0(0) 0(0) 0(0) 0(0) 0(0) 0(0) 0(0) 0(0) 0.10 (0.10) 0(0) 0(0) 0.10
(0.10) 0(0) 0(0) 0(0)
Mugil cephalus 0(0) 0(0) 0(0) 0(0) 0.10 (0.10) 0.20 (0.20) 0(0) 0(0) 0.10 (0.10) 0(0) 0(0) 0(0) 0(0) 0(0) 0(0) 0(0) 0(0) 0(0) 0(0) 0.80
(0.59) 1.00
(0.42) 0(0) 0(0) 0(0)
Palaemonetes pugio 0(0) 0(0) 0(0) 0(0) 0(0) 0(0) 0.40 (0.16)
0.40 (0.31) 1.20 (0.63) 0.33
(0.17) 0.10
(0.10) 0.10 (0.10) 0(0) 0(0) 0(0) 0(0) 0(0) 0.10 (0.10) 0(0) 0(0) 0.10 (0.10) 0(0) 0.10
(0.10) 0(0)
Paralichthys dentatus 0(0) 0(0) 0(0) 0.20 (0.13)
0.10 (0.10) 0(0) 0(0) 0(0) 0(0) 0(0) 0(0) 0(0) 0(0) 0(0) 0(0) 0(0) 0(0) 0(0) 0(0) 0(0) 0(0) 0(0) 0(0) 0(0)
Paralichthys lethostigma 0(0) 0(0) 0(0) 0(0) 0(0) 0(0) 0(0) 0(0) 0(0) 0(0) 0(0) 0(0) 0(0) 0(0) 0(0) 0(0) 0(0) 0(0) 0(0) 0(0) 0(0) 0(0) 0(0) 0(0)
Paralichthys sp. 0(0) 0(0) 0(0) 0(0) 0(0) 0(0) 0(0) 0.10 (0.10) 0.10 (0.10) 0.89
(0.56) 0.10
(0.10) 0.30 (0.21) 0(0) 0(0) 0(0) 0(0) 0(0) 0.20 (0.13) 0.40 (0.22) 0(0) 0.10
(0.10) 0.11
(0.11) 0.10
(0.10) 0(0)
Symphorus plagiusa 0(0) 0(0) 0(0) 0(0) 0(0) 0(0) 0(0) 0(0) 0(0) 0(0) 0(0) 0(0) 0(0) 0(0) 0(0) 0(0) 0(0) 0(0) 0(0) 0(0) 0(0) 0(0) 0(0) 0(0)
Trinectes maculatus 0(0) 0(0) 0(0) 0(0) 0(0) 0(0) 0(0) 0(0) 0(0) 0(0) 0(0) 0(0) 0(0) 0(0) 0(0) 0(0) 0(0) 0(0) 0(0) 0(0) 0(0) 0(0) 0(0) 0(0)
U/I larval fish 0(0) 0(0) 0(0) 0(0) 0(0) 0(0) 0(0) 0(0) 0(0) 0(0) 0(0) 0(0) 0(0) 0(0) 0(0) 0(0) 0(0) 0(0) 0(0) 0(0) 0(0) 0(0) 0(0) 0(0)
Uca pugnax 0(0) 0(0) 0(0) 0(0) 0(0) 0(0) 0(0) 0(0) 0(0) 0(0) 0(0) 0(0) 0(0) 0(0) 0(0) 0(0) 0(0) 0(0) 0(0) 0(0) 0(0) 0(0) 0(0) 0(0)

166
Table 7.4-8a. Mean abundance (SE) for epibenthic fauna collected during fall (1999-2006) Breder trap samples at station P12 (Rat Island). Fall 1999 Fall 2000 Fall 2001 Fall 2002 Fall 2003 Fall 2004 Fall 2005 Fall 2006
Low Mid Upper Low Mid Upper Low Mid Upper Low Mid Upper Low Mid Upper Low Mid Upper Low Mid Upper Low Mid Upper
Callinectes sapidus 0(0) 0(0) 0(0) 0(0) 0(0) 0.10 (0.10) 0(0) 0(0) 0(0) 0(0) 0(0) 0(0) 0(0) 0(0) 0(0) 0(0) 0(0) 0(0) 0(0) 0(0) 0(0) 0(0) 0(0) 0(0)
Ctenogobius shufeldti 0(0) 0(0) 0(0) 0.20 (0.20) 0(0) 0(0) 0(0) 0(0) 0.10 (0.10) 0(0) 0(0) 0(0) 0.60
(0.43) 0.60
(0.40) 0.60 (0.31) 0.30 (0.15)
0.70 (0.26) 0(0) 0(0) 0(0) 0(0) 1.10
(0.28) 0.55
(0.29) 0.10
(0.10)
Dormitator maculatus 0.60 (0.34) 0(0) 0.40 (0.22) 0(0) 0(0) 0(0) 0(0) 0(0) 0(0) 0(0) 0(0) 0(0) 0(0) 0(0) 0(0) 0(0) 0(0) 0(0) 0(0) 0(0) 0(0) 0(0) 0(0) 0(0)
Eucinostomus sp. 0(0) 0(0) 0(0) 0(0) 0(0) 0(0) 0(0) 0(0) 0(0) 0(0) 0(0) 0(0) 0(0) 0(0) 0(0) 0(0) 0(0) 0(0) 0.30 (0.15) 0(0) 0(0) 0(0) 0(0) 0(0)
Farfantepenaeus aztecus 0(0) 0(0) 0(0) 0(0) 0(0) 0(0) 0.10 (0.10) 0(0) 0.10 (0.10) 0.30
(0.21) 0.30
(0.15) 0.89 (0.26) 0(0) 0(0) 0(0) 0(0) 0(0) 0(0) 0(0) 0(0) 0(0) 0(0) 0(0) 0(0)
Fundulus heteroclitus 0(0) 0(0) 0(0) 0(0) 0(0) 0(0) 0(0) 0(0) 0(0) 0(0) 0(0) 0(0) 0(0) 0(0) 0(0) 0(0) 0(0) 0(0) 0(0) 0(0) 0(0) 0(0) 0(0) 0(0)
Fundulus sp. 0(0) 0(0) 0(0) 0(0) 0(0) 0(0) 0(0) 0(0) 0(0) 0(0) 0(0) 0(0) 0(0) 0(0) 0(0) 0(0) 0(0) 0(0) 0(0) 0(0) 0(0) 0(0) 0(0) 0(0)
Gobiosoma sp. 0(0) 0(0) 0(0) 0(0) 0(0) 0(0) 0(0) 0(0) 0(0) 0(0) 0(0) 0(0) 0(0) 0(0) 0(0) 0(0) 0(0) 0(0) 0(0) 0(0) 0(0) 0(0) 0(0) 0(0)
Lagodon rhomboides 0(0) 0(0) 0(0) 0(0) 0(0) 0(0) 0(0) 0(0) 0(0) 0(0) 0(0) 0(0) 0(0) 0(0) 0(0) 0(0) 0(0) 0(0) 0(0) 0(0) 0(0) 0(0) 0(0) 0(0)
Leiostomas xanthurus 0(0) 0(0) 0(0) 0(0) 0(0) 0(0) 0(0) 0(0) 0(0) 0(0) 0(0) 0(0) 0(0) 0(0) 0(0) 0(0) 0(0) 0(0) 0(0) 0(0) 0(0) 0(0) 0(0) 0(0)
Lepomis macrochirus 0(0) 0.20 (0.13) 0.10 (0.10) 0(0) 0(0) 0(0) 0(0) 0(0) 0(0) 0(0) 0(0) 0(0) 0(0) 0(0) 0(0) 0(0) 0(0) 0(0) 0(0) 0(0) 0(0) 0(0) 0.11
(0.11) 0(0)
Litopenaeus setiferus 0(0) 0(0) 0(0) 0(0) 0(0) 0(0) 0(0) 0(0) 0(0) 0(0) 0(0) 0(0) 0(0) 0(0) 0(0) 0(0) 0(0) 0(0) 0.60 (0.27)
0.60 (0.16)
0.60 (0.22) 0(0) 0.11
(0.11) 0(0)
Macrobranchium acanth 0 (0) 0 (0) 0 (0) 0 (0) 0 (0) 0 (0) 0 (0) 0 (0) 0 (0) 0 (0) 0 (0) 0 (0) 0 (0) 0 (0) 0 (0) 0 (0) 0 (0) 0 (0) 0 (0) 0 (0) 0 (0) 0 (0) 0 (0) 0 (0)
Micropogonias undulatu 0 (0) 0 (0) 0 (0) 0 (0) 0 (0) 0 (0) 0 (0) 0 (0) 0 (0) 0 (0) 0 (0) 0 (0) 0 (0) 0 (0) 0 (0) 0 (0) 0 (0) 0 (0) 0 (0) 0 (0) 0 (0) 0 (0) 0 (0) 0 (0)
Mugil cephalus 0 (0) 0 (0) 0 (0) 0 (0) 0 (0) 0 (0) 0 (0) 0 (0) 0 (0) 0 (0) 0 (0) 0 (0) 0 (0) 0 (0) 0 (0) 0 (0) 0 (0) 0 (0) 0 (0) 0 (0) 0 (0) 0 (0) 0 (0) 0 (0)
Palaemonetes pugio 0.10 (0.10) 0 (0) 0 (0) 0.40
(0.31) 0 (0) 0 (0) 0 (0) 0 (0) 0 (0) 0 (0) 0 (0) 0.44 (0.24) 0 (0) 0 (0) 0 (0) 0 (0) 0.10 (0.10) 0 (0) 0.70
(0.26) 0.40
(0.22) 0.10
(0.10) 0(0) 0(0) 0(0)
Palaemonetes vulgaris 0 (0) 0 (0) 0 (0) 0 (0) 0 (0) 0 (0) 0 (0) 0 (0) 0 (0) 0 (0) 0 (0) 0 (0) 0 (0) 0 (0) 0 (0) 0 (0) 0 (0) 0 (0) 0 (0) 0 (0) 0 (0) 0 (0) 0 (0) 0 (0)
Paralychthys albigutta 0(0) 0(0) 0(0) 0(0) 0(0) 0(0) 0(0) 0(0) 0(0) 0(0) 0(0) 0(0) 0(0) 0(0) 0(0) 0(0) 0(0) 0(0) 0(0) 0.10 (0.10) 0(0) 0(0) 0(0) 0(0)
Paralichthys dentatus 0 (0) 0 (0) 0 (0) 0 (0) 0 (0) 0 (0) 0 (0) 0 (0) 0 (0) 0 (0) 0 (0) 0 (0) 0 (0) 0 (0) 0 (0) 0 (0) 0 (0) 0 (0) 0 (0) 0 (0) 0 (0) 0 (0) 0 (0) 0 (0)
Paralichthys lethostigma 0 (0) 0 (0) 0 (0) 0 (0) 0 (0) 0 (0) 0 (0) 0 (0) 0 (0) 0 (0) 0 (0) 0 (0) 0 (0) 0 (0) 0 (0) 0 (0) 0 (0) 0 (0) 0 (0) 0 (0) 0 (0) 0 (0) 0 (0) 0 (0)
Paralichthys sp. 0 (0) 0 (0) 0 (0) 0 (0) 0 (0) 0 (0) 0 (0) 0 (0) 0 (0) 0 (0) 0 (0) 0 (0) 0 (0) 0 (0) 0 (0) 0 (0) 0 (0) 0 (0) 0 (0) 0 (0) 0 (0) 0 (0) 0 (0) 0 (0)
Rhithropanopeus herbstii 0 (0) 0 (0) 0 (0) 0 (0) 0 (0) 0 (0) 0 (0) 0 (0) 0 (0) 0 (0) 0 (0) 0 (0) 0 (0) 0 (0) 0 (0) 0 (0) 0 (0) 0 (0) 0 (0) 0 (0) 0 (0) 0 (0) 0 (0) 0 (0)
Syngnathidae 0(0) 0(0) 0(0) 0(0) 0(0) 0(0) 0(0) 0(0) 0(0) 0(0) 0(0) 0.11 (0.11) 0(0) 0(0) 0(0) 0(0) 0(0) 0(0) 0(0) 0(0) 0(0) 0(0) 0(0) 0(0)
Uca minax 0(0) 0(0) 0(0) 0(0) 0(0) 0(0) 0(0) 0(0) 0(0) 0(0) 0(0) 0(0) 0(0) 0(0) 0(0) 0(0) 0(0) 0.20 (0.13) 0(0) 0(0) 0.10 (0.10) 0(0) 0(0) 0.10
(0.10)
Uca pugnax 0(0) 0.20 (0.13) 0.10 (0.10) 0.10
(0.10) 0(0) 1.70 (0.53) 0(0) 0(0) 0(0) 0(0) 0(0) 0(0) 0(0) 0(0) 0(0) 0(0) 0(0) 0(0) 0(0) 0(0) 0(0) 0(0) 0(0) 0(0)
Uca sp. 0(0) 0(0) 0(0) 0(0) 0(0) 0(0) 0(0) 0(0) 0(0) 0(0) 0(0) 0(0) 0(0) 0(0) 0(0) 0(0) 0(0) 0(0) 0(0) 0(0) 0(0) 0(0) 0(0) 0(0)

167
Table 7.4-8b. Mean abundance (SE) for epibenthic fauna collected during spring (2000-2007) Breder trap samples at station P12 (Rat Island). Spring 2000 Spring 2001 Spring 2002 Spring 2003 Spring 2004 Spring 2005 Spring 2006 Spring 2007 Low Mid Upper Low Mid Upper Low Mid Upper Low Mid Upper Low Mid Upper Low Mid Upper Low Mid Upper Low Mid Upper
Callinectes sapidus 0(0) 0(0) 0(0) 0(0) 0(0) 0.10 (0.10) 0(0) 0(0) 0.30 (0.15) 0(0) 0(0) 0(0) 0(0) 0(0) 0(0) 0(0) 0.20 (0.13) 0(0) 0(0) 0(0) 0(0) 0(0) 0(0) 0(0)
Ctenogobius shufeldti 0.60 (0.31)
0.60 (0.31) 0.10 (0.10) 0(0) 0.20
(0.20) 0.10 (0.10) 0(0) 0(0) 0(0) 0(0) 0(0) 0(0) 0(0) 0(0) 0(0) 0.60 (0.22)
0.60 (0.22) 0.10 (0.10) 0.10
(0.10) 0(0) 0(0) 0.60 (0.16)
0.70 (0.15)
0.20 (0.20)
Dormitator maculatus 0(0) 0(0) 0(0) 0(0) 0(0) 0(0) 0(0) 0(0) 0(0) 0(0) 0(0) 0(0) 0(0) 0(0) 0(0) 0(0) 0(0) 0(0) 0(0) 0(0) 0(0) 0(0) 0(0) 0(0)
Eucinostomus sp. 0(0) 0(0) 0(0) 0(0) 0(0) 0(0) 0(0) 0(0) 0(0) 0(0) 0(0) 0(0) 0(0) 0(0) 0(0) 0(0) 0(0) 0(0) 0(0) 0(0) 0(0) 0(0) 0(0) 0(0)
Farfantepenaeus aztecus 0(0) 0(0) 0(0) 0(0) 0(0) 0(0) 0(0) 0(0) 0(0) 0(0) 0(0) 0(0) 0(0) 0(0) 0(0) 0(0) 0(0) 0(0) 0(0) 0(0) 0(0) 0(0) 0(0) 0(0)
Fundulus heteroclitus 0(0) 0(0) 0.10 (0.10) 0(0) 0.20 (0.20) 0.80 (0.49) 0(0) 0(0) 0.30 (0.21) 0(0) 0(0) 0(0) 0.90
(0.41) 0.55
(0.25) 0.90 (0.50) 0(0) 0(0) 0(0) 0.50 (0.22)
0.60 (0.30)
0.90 (0.41) 0(0) 0(0) 0(0)
Fundulus sp. 0(0) 0(0) 0(0) 0(0) 0(0) 0(0) 0(0) 0(0) 0(0) 0(0) 0(0) 0(0) 0(0) 0(0) 0(0) 0.20 (0.13) 0(0) 0(0) 0(0) 0(0) 0(0) 0(0) 0(0) 0(0)
Gobiosoma sp. 0(0) 0(0) 0(0) 0(0) 0(0) 0(0) 0.20 (0.13)
0.20 (0.13) 0(0) 0(0) 0(0) 0(0) 0(0) 0(0) 0(0) 0(0) 0(0) 0(0) 0(0) 0(0) 0(0) 0(0) 0(0) 0(0)
Lagodon rhomboides 0(0) 0(0) 0(0) 0(0) 0(0) 0(0) 0(0) 0(0) 0.10 (0.10) 0(0) 0(0) 0(0) 0(0) 0(0) 0(0) 6.20 (1.54)
3.30 (1.15) 2.90 (0.62) 0(0) 0(0) 0(0) 0.10
(0.10) 0(0) 0(0)
Leiostomas xanthurus 0.20 (0.20)
0.20 (0.13) 0.10 (0.10) 0.50
(0.31) 0.60
(0.27) 0.80 (0.49) 0(0) 0.20 (0.13) 0(0) 0(0) 0(0) 0(0) 0(0) 0(0) 0(0) 13.20
(3.03) 15.40 (5.68)
11.40 (8.63)
31.90 (7.54)
26.60 (7.74) 0(0) 0.30
(0.15) 0.10
(0.10) 2.50
(1.86)
Lepomis macrochirus 0.10 (0.10) 0(0) 0(0) 0(0) 0(0) 0(0) 0(0) 0(0) 0(0) 0(0) 0(0) 0(0) 0(0) 0(0) 0(0) 0(0) 0(0) 0(0) 0(0) 0(0) 0(0) 0(0) 0(0) 0(0)
Litopenaeus setiferus 0 (0) 0 (0) 0 (0) 0 (0) 0 (0) 0 (0) 0 (0) 0 (0) 0 (0) 0 (0) 0 (0) 0 (0) 0 (0) 0 (0) 0 (0) 0 (0) 0 (0) 0 (0) 0 (0) 0 (0) 0 (0) 0 (0) 0 (0) 0 (0)
Macrobranchium acanth 0(0) 0(0) 0(0) 0(0) 0(0) 0(0) 0(0) 0(0) 0(0) 0(0) 0(0) 0(0) 0(0) 0(0) 0(0) 0(0) 0(0) 0(0) 0(0) 0(0) 0(0) 0(0) 0(0) 0.10 (0.10)
Micropogonias undulatu 0(0) 0(0) 0(0) 0(0) 0(0) 0(0) 0(0) 0(0) 0(0) 0(0) 0.10 (0.10) 0(0) 0(0) 0(0) 0(0) 0(0) 0(0) 0(0) 0.10
(0.10) 0(0) 0(0) 0(0) 0(0) 0(0)
Mugil cephalus 0(0) 0(0) 0(0) 0(0) 0(0) 0.10 (0.10) 0(0) 0.20 (0.20) 0(0) 0(0) 0(0) 0(0) 0(0) 0(0) 0(0) 0(0) 0(0) 0(0) 0.10
(0.10) 0.10
(0.10) 0(0) 0(0) 0(0) 0(0)
Palaemonetes pugio 0(0) 0(0) 0(0) 0.20 (0.20)
0.30 (0.21) 0.50 (0.22) 0(0) 1.00
(0.39) 0.50 (0.27) 0.67 (0.55)
1.60 (0.93) 3.50 (3.06) 0(0) 0(0) 0(0) 0(0) 0.20
(0.13) 0(0) 0.30 (0.21)
1.10 (0.58) 0(0) 0(0) 0(0) 0(0)
Palaemonetes vulgaris 0(0) 0(0) 0(0) 0(0) 0(0) 0(0) 0(0) 0(0) 0(0) 0(0) 0(0) 0(0) 0(0) 0(0) 0(0) 0(0) 0(0) 0(0) 0(0) 0(0) 0(0) 0(0) 0.10 (0.10) 0(0)
Paralychthys albigutta 0 (0) 0 (0) 0 (0) 0 (0) 0 (0) 0 (0) 0 (0) 0 (0) 0 (0) 0 (0) 0 (0) 0 (0) 0 (0) 0 (0) 0 (0) 0 (0) 0 (0) 0 (0) 0 (0) 0 (0) 0 (0) 0 (0) 0 (0) 0 (0)
Paralichthys dentatus 0(0) 0(0) 0(0) 0(0) 0.10 (0.10) 0(0) 0(0) 0(0) 0(0) 0.22
(0.15) 1.40
(1.09) 0.40 (0.22) 0(0) 0(0) 0(0) 0(0) 0(0) 0(0) 0(0) 0(0) 0(0) 0(0) 0(0) 0(0)
Paralichthys lethostigma 0(0) 0.30
(0.21) 0.30 (0.15) 0(0) 0(0) 0(0) 0(0) 0(0) 0(0) 0(0) 0(0) 0(0) 0(0) 0(0) 0(0) 0(0) 0(0) 0(0) 0(0) 0(0) 0(0) 0(0) 0.10 (0.10) 0(0)
Paralichthys sp. 0(0) 0(0) 0(0) 0(0) 0(0) 0(0) 0(0) 0(0) 0.20 (0.20) 0(0) 0(0) 0(0) 0(0) 0(0) 0(0) 0.10 (0.10) 0(0) 0(0) 0(0) 0(0) 0(0) 0(0) 0(0) 0(0)
Rhithropanopeus herbstii 0(0) 0(0) 0(0) 0.10
(0.10) 0(0) 0(0) 0(0) 0(0) 0(0) 0(0) 0(0) 0(0) 0(0) 0(0) 0(0) 0(0) 0(0) 0(0) 0(0) 0(0) 0(0) 0(0) 0(0) 0(0)
Syngnathidae 0 (0) 0 (0) 0 (0) 0 (0) 0 (0) 0 (0) 0 (0) 0 (0) 0 (0) 0 (0) 0 (0) 0 (0) 0 (0) 0 (0) 0 (0) 0 (0) 0 (0) 0 (0) 0 (0) 0 (0) 0 (0) 0 (0) 0 (0) 0 (0)
Uca minax 0(0) 0(0) 0(0) 0(0) 0(0) 0(0) 0(0) 0(0) 0(0) 0(0) 0(0) 0(0) 0(0) 0(0) 0(0) 0(0) 0(0) 0(0) 0(0) 0.10 (0.10)
2.30 (1.24) 0(0) 0(0) 0(0)
Uca pugnax 0.10 (0.10) 0(0) 0.10 (0.10) 0(0) 0(0) 0(0) 0(0) 0(0) 0(0) 0(0) 0(0) 0(0) 0(0) 0(0) 0(0) 0(0) 0(0) 0(0) 0(0) 0(0) 0(0) 0(0) 0(0) 0(0)
Uca sp. 0(0) 0(0) 0(0) 0(0) 0(0) 0(0) 0(0) 0(0) 0(0) 0(0) 0(0) 0(0) 0(0) 0(0) 0(0) 0(0) 0.81 (0.55) 1.50 (0.43) 0(0) 0(0) 0(0) 0(0) 0(0) 0(0)
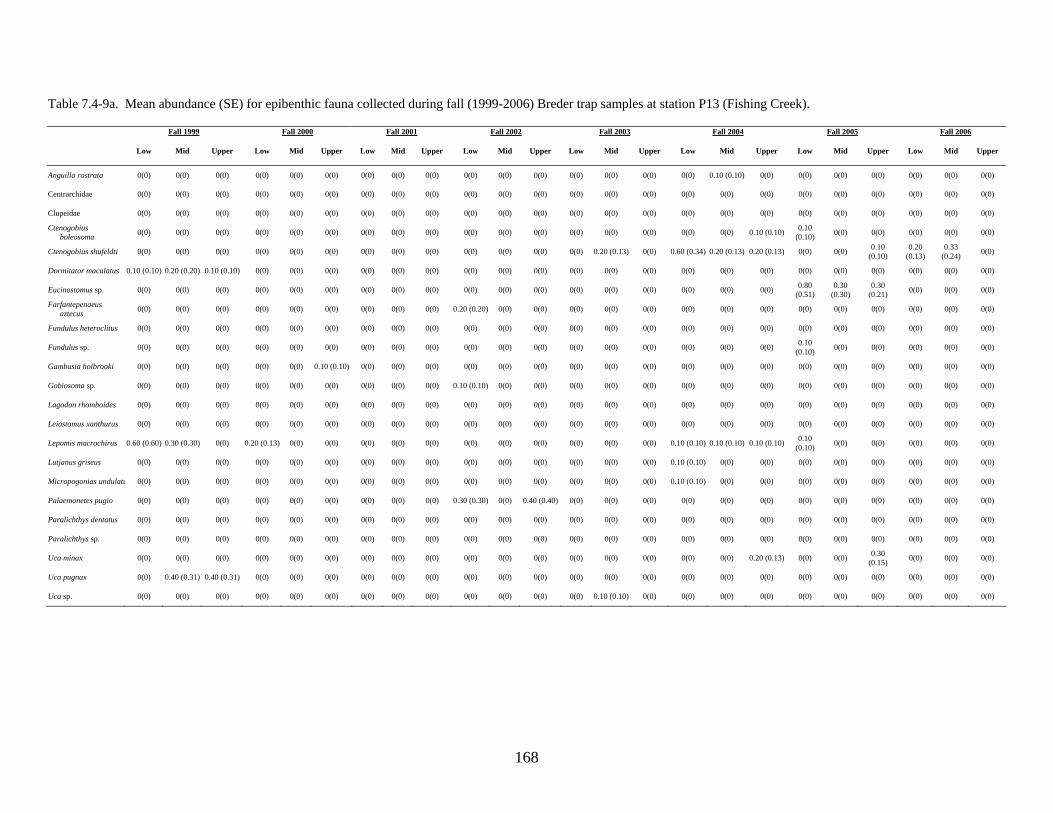
168
Table 7.4-9a. Mean abundance (SE) for epibenthic fauna collected during fall (1999-2006) Breder trap samples at station P13 (Fishing Creek). Fall 1999 Fall 2000 Fall 2001 Fall 2002 Fall 2003 Fall 2004 Fall 2005 Fall 2006
Low Mid Upper Low Mid Upper Low Mid Upper Low Mid Upper Low Mid Upper Low Mid Upper Low Mid Upper Low Mid Upper
Anguilla rostrata 0(0) 0(0) 0(0) 0(0) 0(0) 0(0) 0(0) 0(0) 0(0) 0(0) 0(0) 0(0) 0(0) 0(0) 0(0) 0(0) 0.10 (0.10) 0(0) 0(0) 0(0) 0(0) 0(0) 0(0) 0(0)
Centrarchidae 0(0) 0(0) 0(0) 0(0) 0(0) 0(0) 0(0) 0(0) 0(0) 0(0) 0(0) 0(0) 0(0) 0(0) 0(0) 0(0) 0(0) 0(0) 0(0) 0(0) 0(0) 0(0) 0(0) 0(0)
Clupeidae 0(0) 0(0) 0(0) 0(0) 0(0) 0(0) 0(0) 0(0) 0(0) 0(0) 0(0) 0(0) 0(0) 0(0) 0(0) 0(0) 0(0) 0(0) 0(0) 0(0) 0(0) 0(0) 0(0) 0(0)
Ctenogobius boleosoma 0(0) 0(0) 0(0) 0(0) 0(0) 0(0) 0(0) 0(0) 0(0) 0(0) 0(0) 0(0) 0(0) 0(0) 0(0) 0(0) 0(0) 0.10 (0.10) 0.10
(0.10) 0(0) 0(0) 0(0) 0(0) 0(0)
Ctenogobius shufeldti 0(0) 0(0) 0(0) 0(0) 0(0) 0(0) 0(0) 0(0) 0(0) 0(0) 0(0) 0(0) 0(0) 0.20 (0.13) 0(0) 0.60 (0.34) 0.20 (0.13) 0.20 (0.13) 0(0) 0(0) 0.10 (0.10)
0.20 (0.13)
0.33 (0.24) 0(0)
Dormitator maculatus 0.10 (0.10) 0.20 (0.20) 0.10 (0.10) 0(0) 0(0) 0(0) 0(0) 0(0) 0(0) 0(0) 0(0) 0(0) 0(0) 0(0) 0(0) 0(0) 0(0) 0(0) 0(0) 0(0) 0(0) 0(0) 0(0) 0(0)
Eucinostomus sp. 0(0) 0(0) 0(0) 0(0) 0(0) 0(0) 0(0) 0(0) 0(0) 0(0) 0(0) 0(0) 0(0) 0(0) 0(0) 0(0) 0(0) 0(0) 0.80 (0.51)
0.30 (0.30)
0.30 (0.21) 0(0) 0(0) 0(0)
Farfantepenaeus aztecus 0(0) 0(0) 0(0) 0(0) 0(0) 0(0) 0(0) 0(0) 0(0) 0.20 (0.20) 0(0) 0(0) 0(0) 0(0) 0(0) 0(0) 0(0) 0(0) 0(0) 0(0) 0(0) 0(0) 0(0) 0(0)
Fundulus heteroclitus 0(0) 0(0) 0(0) 0(0) 0(0) 0(0) 0(0) 0(0) 0(0) 0(0) 0(0) 0(0) 0(0) 0(0) 0(0) 0(0) 0(0) 0(0) 0(0) 0(0) 0(0) 0(0) 0(0) 0(0)
Fundulus sp. 0(0) 0(0) 0(0) 0(0) 0(0) 0(0) 0(0) 0(0) 0(0) 0(0) 0(0) 0(0) 0(0) 0(0) 0(0) 0(0) 0(0) 0(0) 0.10 (0.10) 0(0) 0(0) 0(0) 0(0) 0(0)
Gambusia holbrooki 0(0) 0(0) 0(0) 0(0) 0(0) 0.10 (0.10) 0(0) 0(0) 0(0) 0(0) 0(0) 0(0) 0(0) 0(0) 0(0) 0(0) 0(0) 0(0) 0(0) 0(0) 0(0) 0(0) 0(0) 0(0)
Gobiosoma sp. 0(0) 0(0) 0(0) 0(0) 0(0) 0(0) 0(0) 0(0) 0(0) 0.10 (0.10) 0(0) 0(0) 0(0) 0(0) 0(0) 0(0) 0(0) 0(0) 0(0) 0(0) 0(0) 0(0) 0(0) 0(0)
Lagodon rhomboides 0(0) 0(0) 0(0) 0(0) 0(0) 0(0) 0(0) 0(0) 0(0) 0(0) 0(0) 0(0) 0(0) 0(0) 0(0) 0(0) 0(0) 0(0) 0(0) 0(0) 0(0) 0(0) 0(0) 0(0)
Leiostomus xanthurus 0(0) 0(0) 0(0) 0(0) 0(0) 0(0) 0(0) 0(0) 0(0) 0(0) 0(0) 0(0) 0(0) 0(0) 0(0) 0(0) 0(0) 0(0) 0(0) 0(0) 0(0) 0(0) 0(0) 0(0)
Lepomis macrochirus 0.60 (0.60) 0.30 (0.30) 0(0) 0.20 (0.13) 0(0) 0(0) 0(0) 0(0) 0(0) 0(0) 0(0) 0(0) 0(0) 0(0) 0(0) 0.10 (0.10) 0.10 (0.10) 0.10 (0.10) 0.10 (0.10) 0(0) 0(0) 0(0) 0(0) 0(0)
Lutjanus griseus 0(0) 0(0) 0(0) 0(0) 0(0) 0(0) 0(0) 0(0) 0(0) 0(0) 0(0) 0(0) 0(0) 0(0) 0(0) 0.10 (0.10) 0(0) 0(0) 0(0) 0(0) 0(0) 0(0) 0(0) 0(0)
Micropogonias undulatu 0(0) 0(0) 0(0) 0(0) 0(0) 0(0) 0(0) 0(0) 0(0) 0(0) 0(0) 0(0) 0(0) 0(0) 0(0) 0.10 (0.10) 0(0) 0(0) 0(0) 0(0) 0(0) 0(0) 0(0) 0(0)
Palaemonetes pugio 0(0) 0(0) 0(0) 0(0) 0(0) 0(0) 0(0) 0(0) 0(0) 0.30 (0.30) 0(0) 0.40 (0.40) 0(0) 0(0) 0(0) 0(0) 0(0) 0(0) 0(0) 0(0) 0(0) 0(0) 0(0) 0(0)
Paralichthys dentatus 0(0) 0(0) 0(0) 0(0) 0(0) 0(0) 0(0) 0(0) 0(0) 0(0) 0(0) 0(0) 0(0) 0(0) 0(0) 0(0) 0(0) 0(0) 0(0) 0(0) 0(0) 0(0) 0(0) 0(0)
Paralichthys sp. 0(0) 0(0) 0(0) 0(0) 0(0) 0(0) 0(0) 0(0) 0(0) 0(0) 0(0) 0(0) 0(0) 0(0) 0(0) 0(0) 0(0) 0(0) 0(0) 0(0) 0(0) 0(0) 0(0) 0(0)
Uca minax 0(0) 0(0) 0(0) 0(0) 0(0) 0(0) 0(0) 0(0) 0(0) 0(0) 0(0) 0(0) 0(0) 0(0) 0(0) 0(0) 0(0) 0.20 (0.13) 0(0) 0(0) 0.30 (0.15) 0(0) 0(0) 0(0)
Uca pugnax 0(0) 0.40 (0.31) 0.40 (0.31) 0(0) 0(0) 0(0) 0(0) 0(0) 0(0) 0(0) 0(0) 0(0) 0(0) 0(0) 0(0) 0(0) 0(0) 0(0) 0(0) 0(0) 0(0) 0(0) 0(0) 0(0)
Uca sp. 0(0) 0(0) 0(0) 0(0) 0(0) 0(0) 0(0) 0(0) 0(0) 0(0) 0(0) 0(0) 0(0) 0.10 (0.10) 0(0) 0(0) 0(0) 0(0) 0(0) 0(0) 0(0) 0(0) 0(0) 0(0)

169
Table 7.4-9b. Mean abundance (SE) for epibenthic fauna collected during spring (2000-2007) Breder trap samples at station P13 (Fishing Creek). Spring 2000 Spring 2001 Spring 2002 Spring 2003 Spring 2004 Spring 2005 Spring 2006 Spring 2007 Low Mid Upper Low Mid Upper Low Mid Upper Low Mid Upper Low Mid Upper Low Mid Upper Low Mid Upper Low Mid Upper
Anguilla rostrata 0(0) 0(0) 0(0) 0(0) 0(0) 0(0) 0(0) 0(0) 0(0) 0(0) 0(0) 0(0) 0(0) 0(0) 0(0) 0(0) 0(0) 0(0) 0(0) 0(0) 0(0) 0(0) 0(0) 0(0)
Centrarchidae 0(0) 0(0) 0(0) 0(0) 0(0) 0(0) 0(0) 0(0) 0(0) 0(0) 0(0) 0(0) 0(0) 0(0) 0(0) 0(0) 0(0) 0(0) 0(0) 0(0) 0(0) 0.10 (0.10) 0(0) 0(0)
Clupeidae 0(0) 0(0) 0(0) 0(0) 0(0) 0(0) 0(0) 0(0) 0(0) 0(0) 0(0) 0(0) 0(0) 0(0) 0(0) 0(0) 0(0) 0(0) 0(0) 0(0) 0(0) 0(0) 0.10 (0.10) 0(0)
Ctenogobius boleosoma 0(0) 0(0) 0(0) 0(0) 0(0) 0(0) 0(0) 0(0) 0(0) 0(0) 0(0) 0(0) 0(0) 0(0) 0(0) 0(0) 0(0) 0(0) 0(0) 0(0) 0(0) 0(0) 0(0) 0(0)
Ctenogobius shufeldti 0(0) 0(0) 0(0) 0(0) 0(0) 0(0) 0(0) 0(0) 0(0) 0(0) 0(0) 0(0) 0.30 (0.21) 0.70 (0.33) 0(0) 0.10 (0.10) 0.10 (0.10) 0.50 (0.50) 0(0) 0.20 (0.13)
0.20 (0.13) 0(0) 0.10
(0.10) 0(0)
Dormitator maculatus 0(0) 0(0) 0(0) 0(0) 0(0) 0(0) 0(0) 0(0) 0(0) 0(0) 0(0) 0(0) 0(0) 0(0) 0(0) 0(0) 0(0) 0(0) 0(0) 0(0) 0(0) 0(0) 0(0) 0(0)
Eucinostomus sp. 0(0) 0(0) 0(0) 0(0) 0(0) 0(0) 0(0) 0(0) 0(0) 0(0) 0(0) 0(0) 0(0) 0(0) 0(0) 0(0) 0(0) 0(0) 0(0) 0(0) 0(0) 0(0) 0(0) 0(0)
Farfantepenaeus aztecus 0(0) 0(0) 0(0) 0(0) 0(0) 0(0) 0(0) 0(0) 0(0) 0(0) 0(0) 0(0) 0(0) 0(0) 0(0) 0(0) 0(0) 0(0) 0(0) 0(0) 0(0) 0(0) 0(0) 0(0)
Fundulus heteroclitus 0(0) 0(0) 0(0) 0.10 (0.10) 0.80 (0.42) 0.40 (0.22) 0(0) 0(0) 0(0) 0(0) 0(0) 0(0) 1.30 (0.47) 1.00 (0.49) 1.50 (0.70) 0(0) 0(0) 0(0) 0(0) 0(0) 0.20 (0.13)
0.50 (0.34)
0.30 (0.21)
0.20 (0.13)
Fundulus sp. 0(0) 0(0) 0(0) 0(0) 0(0) 0(0) 0(0) 0(0) 0(0) 0(0) 0(0) 0(0) 0(0) 0(0) 0(0) 0(0) 0(0) 0(0) 0(0) 0(0) 0(0) 0(0) 0(0) 0(0)
Gambusia holbrooki 0(0) 0(0) 0(0) 0(0) 0(0) 0(0) 0(0) 0(0) 0(0) 0(0) 0(0) 0(0) 0(0) 0(0) 0(0) 0(0) 0(0) 0(0) 0(0) 0(0) 0(0) 0.20 (0.13)
0.20 (0.13)
0.20 (0.13)
Gobiosoma sp. 0(0) 0(0) 0(0) 0(0) 0(0) 0(0) 0(0) 0(0) 0(0) 0(0) 0(0) 0(0) 0(0) 0(0) 0(0) 0(0) 0(0) 0(0) 0(0) 0(0) 0(0) 0(0) 0(0) 0(0)
Lagodon rhomboides 0(0) 0(0) 0(0) 0(0) 0(0) 0(0) 0(0) 0(0) 0(0) 0(0) 0(0) 0(0) 0(0) 0(0) 0(0) 0.60 (0.34) 0.20 (0.13) 0(0) 0(0) 0(0) 0(0) 0(0) 0.10 (0.10) 0(0)
Leiostomus xanthurus 0(0) 0(0) 0(0) 0(0) 0(0) 0(0) 1.30 (1.10) 0.60 (0.34) 0.20 (0.13) 0(0) 0(0) 0(0) 2.00 (1.31) 2.20 (1.04) 5.50 (2.87) 0.10 (0.10) 0.40 (0.31) 0.10 (0.10) 0(0) 1.70 (0.47)
0.90 (0.46) 0(0) 0(0) 0(0)
Lepomis macrochirus 0(0) 0(0) 0(0) 0(0) 0(0) 0(0) 0(0) 0(0) 0(0) 0(0) 0.10 (0.10) 0(0) 0(0) 0(0) 0(0) 0(0) 0(0) 0(0) 0(0) 0(0) 0(0) 0(0) 0(0) 0(0)
Lutjanus griseus 0(0) 0(0) 0(0) 0(0) 0(0) 0(0) 0(0) 0(0) 0(0) 0(0) 0(0) 0(0) 0(0) 0(0) 0(0) 0(0) 0(0) 0(0) 0(0) 0(0) 0(0) 0(0) 0(0) 0(0)
Micropogonias undulatu 0(0) 0(0) 0(0) 0(0) 0(0) 0(0) 0(0) 0(0) 0(0) 0(0) 0(0) 0(0) 0(0) 0(0) 0(0) 0(0) 0(0) 0(0) 0(0) 0(0) 0(0) 0(0) 0(0) 0(0)
Palaemonetes pugio 0(0) 0(0) 0(0) 0(0) 0(0) 0(0) 0(0) 0(0) 0(0) 0(0) 0(0) 0(0) 0(0) 0(0) 0(0) 0(0) 0(0) 0(0) 0(0) 0(0) 0(0) 0(0) 0(0) 0(0)
Paralichthys dentatus 0(0) 0(0) 0(0) 0(0) 0(0) 0(0) 0(0) 0(0) 0(0) 0.30 (0.21) 0(0) 0(0) 0(0) 0(0) 0(0) 0(0) 0(0) 0(0) 0(0) 0(0) 0(0) 0(0) 0(0) 0(0)
Paralichthys sp. 0(0) 0(0) 0(0) 0(0) 0(0) 0(0) 0(0) 0(0) 0(0) 0(0) 0(0) 0(0) 0.30 (0.30) 0.20 (0.20) 0.40 (0.22) 0(0) 0(0) 0.10 (0.10) 0(0) 0(0) 0(0) 0(0) 0(0) 0(0)
Uca minax 0(0) 0(0) 0(0) 0(0) 0(0) 0(0) 0(0) 0(0) 0(0) 0.20 (0.13) 0.40 (0.16) 0.90 (0.31) 0(0) 0(0) 0(0) 0(0) 0(0) 0(0) 0(0) 0(0) 0.80 (0.39) 0(0) 0(0) 0.10
(0.10)
Uca pugnax 0(0) 0(0) 0.10 (0.10) 0.20 (0.13) 0.60 (0.43) 0.80 (0.33) 0(0) 0(0) 0(0) 0(0) 0(0) 0(0) 0(0) 0(0) 0(0) 0(0) 0(0) 0(0) 0(0) 0(0) 0(0) 0(0) 0(0) 0(0)
Uca sp. 0(0) 0(0) 0(0) 0(0) 0(0) 0(0) 0(0) 0(0) 0(0) 0(0) 0(0) 0(0) 0(0) 0(0) 0(0) 0(0) 0(0) 0(0) 0(0) 0(0) 0(0) 0(0) 0(0) 0(0)

170
Table 7.4-10a. Mean abundance (SE) for epibenthic fauna collected in Fall drop trap sampling at station P2 (Mouth of Town Creek). 1999 2000 2001 2002 2003 2004 2005 2006
Alpheus heterochelis 0 (0) 0 (0) 0 (0) 0.06 (0.06) 0 (0) 0 (0) 0 (0) 0 (0) Anchoa mitchelli 0.44 (0.44) 0 (0) 1.39 (1.33) 0.28 (0.23) 0 (0) 5.22 (5.11) 0.89 (0.46) 1.28 (0.69) Anguilla rostrata 0 (0) 0 (0) 0 (0) 0 (0) 0 (0) 0 (0) 0 (0) 0 (0) Anthinnae 0 (0) 0 (0) 0 (0) 0.06 (0.06) 0 (0) 0 (0) 0 (0) 0 (0) Bivalve 0 (0) 0 (0) 0 (0) 0 (0) 0 (0) 0 (0) 0 (0) 0 (0) Brevoortia tyrannus 0 (0) 0 (0) 0.17 (0.17) 0 (0) 0 (0) 0 (0) 0 (0) 0 (0) Callinectes sapidus 0.33 (0.14) 0.67 (0.23) 0.78 (0.42) 0.11 (0.11) 0 (0) 0.67 (0.40) 1.89 (0.47) 0.78 (0.17) Clupeidae 0 (0) 0 (0) 0 (0) 0 (0) 0 (0) 0 (0) 0 (0) 0 (0) Ctenogobius boleosoma 0 (0) 0 (0) 0 (0) 0 (0) 0 (0) 0 (0) 0.11 (0.08) 0.17 (0.09) Ctenogobius shufeldti 0.44 (0.20) 0 (0) 0.06 (0.06) 0 (0) 0 (0) 0.11 (0.08) 0 (0) 0.05 (0.05) Eucinostomus sp. 0 (0) 0 (0) 0 (0) 0 (0) 0 (0) 0.11 (0.08) 0 (0) 0.11 (0.11) Farfantepenaeus aztecus 0 (0) 0.17 (0.09) 0.17 (0.12) 3.50 (1.35) 0.44 (0.23) 0 (0) 0 (0) 0 (0) Gambusia holbrooki 0 (0) 0 (0) 0 (0) 0 (0) 0.06 (0.06) 0 (0) 0 (0) 0 (0) Gerreidae 0 (0) 0 (0) 0 (0) 0 (0) 0.22 (0.13) 0 (0) 0 (0) 0 (0) Gobiesox punctulatus 0 (0) 0 (0) 0 (0) 0.06 (0.06) 0 (0) 0 (0) 0 (0) 0 (0) Lagodon rhomboids 0 (0) 0.06 (0.06) 0 (0) 0 (0) 0 (0) 0 (0) 0 (0) 0 (0) Larimus fasciatus 0 (0) 0 (0) 0 (0) 0 (0) 0 (0) 0 (0) 0.05 (0.05) 0 (0) Leiostomus xanthurus 0 (0) 0 (0) 0 (0) 0 (0) 0 (0) 0 (0) 0 (0) 0 (0) Litopenaeus setiferus 0 (0) 0.06 (0.06) 0 (0) 0 (0) 0 (0) 1.00 (0.48) 2.11 (0.74) 0.55 (0.29) Lutjanus griseus 0 (0) 0 (0) 0.06 (0.06) 0 (0) 0 (0) 0.06 (0.06) 0 (0) 0 (0) Menidia beryllina 0 (0) 0 (0) 0.39 (0.24) 0 (0) 0 (0) 0.22 (0.22) 0.17 (0.17) 0 (0) Menidia menidia 0 (0) 0 (0) 0 (0) 0.06 (0.06) 0.33 (0.24) 0 (0) 0 (0) 0 (0) Menticirrhus saxatilis 0 (0) 0.06 (0.06) 0 (0) 0 (0) 0 (0) 0 (0) 0 (0) 0 (0) Micropogonias undulates 0 (0) 0 (0) 0.44 (0.27) 0 (0) 0 (0) 0.06 (0.06) 0.83 (0.28) 0 (0) Mugil cephalus 0 (0) 0 (0) 0.06 (0.06) 0 (0) 0 (0) 0 (0) 0 (0) 0 (0) Palaemonetes intermedius 0 (0) 0 (0) 0 (0) 0 (0) 0 (0) 0.27 (0.27) 0 (0) 0 (0) Palaemonetes pugio 1.39 (0.88) 0.78 (0.61) 2.11 (0.81) 0.06 (0.06) 3.06 (0.73) 2.56 (1.25) 2.39 (1.05) 0.28 (0.23) Palaemonetes vulgaris 0 (0) 0 (0) 0 (0) 0 (0) 0 (0) 0 (0) 0.72 (0.45) 0 (0) Panopeus herbstii 0.06 (0.06) 0.50 (0.31) 0 (0) 0 (0) 0 (0) 0 (0) 0 (0) 0 (0) Paralichthys dentatus 0 (0) 0.06 (0.06) 0 (0) 0.06 (0.06) 0 (0) 0 (0) 0 (0) 0 (0) Paralichthys lethostigma 0 (0) 0 (0) 0 (0) 0 (0) 0 (0) 0 (0) 0.05 (0.05) 0 (0) Paralichthys albigutta 0 (0) 0 (0) 0 (0) 0 (0) 0 (0) 0 (0) 0 (0) 0 (0) Paralichthys sp. 0 (0) 0 (0) 0 (0) 0 (0) 0 (0) 0 (0) 0 (0) 0.05 (0.05) Penaeid 0 (0) 0.17 (0.12) 0 (0) 0 (0) 0 (0) 0 (0) 0 (0) 0 (0) Rangia cuneata 0 (0) 0.06 (0.06) 0 (0) 0 (0) 0 (0) 0 (0) 0 (0) 0 (0) Rhithropanopeus harrisii 0.06 (0.06) 0 (0) 0.06 (0.06) 0.06 (0.06) 0 (0) 0.22 (0.10) 0 (0) 0.05 (0.05) Sciaenidae sp. 0 (0) 0 (0) 0 (0) 0 (0) 0.06 (0.06) 0 (0) 0 (0) 0 (0) Sesarma reticulatum 0 (0) 0 (0) 0 (0) 0 (0) 0 (0) 0 (0) 0 (0) 0 (0) Smphurus plagiusa 0 (0) 0 (0) 0 (0) 1.00 (0.44) 0.11 (0.11) 0 (0) 1.33 (0.48) 0 (0) Syngnathid sp. 0 (0) 0 (0) 0 (0) 0.06 (0.06) 0 (0) 0 (0) 0 (0) 0 (0) Trachinotus falcatus 0 (0) 0 (0) 0 (0) 0 (0) 0.06 (0.06) 0 (0) 0 (0) 0 (0) Trinectes maculates 0 (0) 0 (0) 0 (0) 0 (0) 0.06 (0.06) 0 (0) 0.05 (0.05) 0 (0) Uca pugnax 0.06 (0.06) 0 (0) 0.06 (0.06) 0 (0) 0 (0) 0 (0) 0 (0) 0 (0) Uca sp. 0 (0) 0 (0) 0 (0) 0 (0) 0.06 (0.06) 0 (0) 0 (0) 0 (0) U/I larval fish sp. A 0 (0) 0 (0) 0 (0) 0 (0) 0 (0) 0 (0) 0 (0) 0 (0)

171
Table 7.4-10b. Mean abundance (SE) for epibenthic fauna collected in Spring drop trap sampling at station P2 (Mouth of Town Creek). 2000 2001 2002 2003 2004 2005 2006 2007
Alpheus heterochelis 0 (0) 0 (0) 0 (0) 0 (0) 0 (0) 0 (0) 0 (0) 0 (0) Anchoa mitchelli 0 (0) 0 (0) 2.00 (1.94) 0 (0) 0 (0) 0.11 (0.11) 0 (0) 0.05 (0.05) Anguilla rostrata 0 (0) 0.06 (0.06) 0.28 (0.14) 0 (0) 0 (0) 0 (0) 0 (0) 0.05 (0.05) Anthinnae 0 (0) 0 (0) 0 (0) 0 (0) 0 (0) 0 (0) 0 (0) 0 (0) Bivalve 0 (0) 0.06 (0.06) 0 (0) 0 (0) 0 (0) 0 (0) 0 (0) 0 (0) Brevoortia tyrannus 0 (0) 0 (0) 21.67 (20.80) 0 (0) 0 (0) 0 (0) 0 (0) 0 (0) Callinectes sapidus 0.06 (0.06) 0.06 (0.06) 0.50 (0.15) 0.17 (0.09) 0.17 (0.09) 1.17 (0.40) 1.05 (0.23) 0.39 (0.14) Clupeidae 0 (0) 0 (0) 0 (0) 0 (0) 0 (0) 0.22 (0.22) 0 (0) 0.17 (0.12) Ctenogobius boleosoma 0 (0) 0 (0) 0 (0) 0 (0) 0 (0) 0 (0) 0.17 (0.09) 0.22 (0.13) Ctenogobius shufeldti 0.17 (0.09) 0.06 (0.06) 0.11 (0.08) 0 (0) 0.06 (0.06) 0 (0) 0 (0) 0 (0) Eucinostomus sp. 0 (0) 0 (0) 0 (0) 0 (0) 0 (0) 0 (0) 0 (0) 0 (0) Farfantepenaeus aztecus 0 (0) 0 (0) 3.06 (2.37) 0 (0) 1.22 (0.75) 0 (0) 0 (0) 0 (0) Gambusia holbrooki 0 (0) 0 (0) 0 (0) 0 (0) 0.06 (0.06) 0 (0) 0 (0) 0 (0) Gerreidae 0 (0) 0 (0) 0 (0) 0 (0) 0 (0) 0 (0) 0 (0) 0 (0) Gobiesox punctulatus 0 (0) 0 (0) 0 (0) 0 (0) 0 (0) 0 (0) 0 (0) 0 (0) Lagodon rhomboides 0.44 (0.23) 0 (0) 0 (0) 0 (0) 0 (0) 0.22 (0.13) 0 (0) 0.05 (0.05) Larimus fasciatus 0 (0) 0 (0) 0 (0) 0 (0) 0 (0) 0 (0) 0 (0) 0 (0) Leiostomus xanthurus 7.0 (2.41) 62.89 (40.60) 0.22 (0.17) 0 (0) 4.61 (1.39) 7.94 (2.11) 2.55 (0.79) 10.22 (4.82) Litopenaeus setiferus 0 (0) 0 (0) 0 (0) 0 (0) 0 (0) 0 (0) 0 (0) 0 (0) Lutjanus griseus 0 (0) 0 (0) 0 (0) 0 (0) 0 (0) 0 (0) 0 (0) 0 (0) Menidia beryllina 5.61 (3.20) 1.28 (0.75) 1.39 (1.13) 0 (0) 0 (0) 0 (0) 0 (0) 0 (0) Menidia menidia 0 (0) 0 (0) 0 (0) 4.56 (4.38) 0.89 (0.35) 0 (0) 0 (0) 0 (0) Menticirrhus saxatilis 0 (0) 0 (0) 0 (0) 0 (0) 0 (0) 0 (0) 0 (0) 0 (0) Micropogonias undulatus 0 (0) 0 (0) 9.06 (1.89) 16.56 (4.12) 0 (0) 0.06 (0.06) 0.11 (0.11) 0.55 (0.28) Mugil cephalus 0 (0) 1.39 (0.78) 0.89 (0.35) 0 (0) 0 (0) 0 (0) 0 (0) 0 (0) Palaemonetes intermedius 0 (0) 0 (0) 0 (0) 0 (0) 0 (0) 0.06 (0.06) 0 (0) 0 (0) Palaemonetes pugio 5.56 (1.35) 20.22 (10.05) 37.94 (16.39) 1.33 (0.55) 1.33 (0.53) 16.22 (6.10) 3.78 (1.75) 2.78 (1.50) Palaemonetes vulgaris 0 (0) 0 (0) 0 (0) 0 (0) 0 (0) 0 (0) 0 (0) 0 (0) Panopeus herbstii 0.06 (0.06) 0 (0) 0 (0) 0 (0) 0 (0) 0 (0) 0 (0) 0 (0) Paralichthys dentatus 0.11 (0.08) 0 (0) 0.11 (0.08) 0.17 (0.12) 0 (0) 0 (0) 0 (0) 0 (0) Paralichthys lethostigma 0 (0) 0 (0) 0 (0) 0 (0) 0 (0) 0 (0) 0 (0) 0 (0) Paralichthys albigutta 0 (0) 0 (0) 0 (0) 0 (0) 0 (0) 0 (0) 0 (0) 0.05 (0.05) Paralichthys sp. 0 (0) 0 (0) 0 (0) 1.61 (0.57) 0.06 (0.06) 0.11 (0.08) 0 (0) 0.11 (0.08) Penaeid 0 (0) 0 (0) 0 (0) 0 (0) 0 (0) 0 (0) 0 (0) 0 (0) Rangia cuneata 0 (0) 0 (0) 0 (0) 0 (0) 0 (0) 0 (0) 0 (0) 0 (0) Rhithropanopeus harrisii 0 (0) 0 (0) 0.22 (0.10) 0 (0) 0 (0) 0.11 (0.11) 0.05 (0.05) 0.17 (0.12) Sciaenidae sp. 0 (0) 0 (0) 0 (0) 0 (0) 0 (0) 0 (0) 0 (0) 0 (0) Sesarma reticulatum 0 (0) 0.06 (0.06) 0 (0) 0 (0) 0 (0) 0 (0) 0 (0) 0 (0) Symphurus plagiusa 0 (0) 0 (0) 0 (0) 0 (0) 0 (0) 0 (0) 0 (0) 0 (0) Syngnathid sp. 0 (0) 0 (0) 0 (0) 0 (0) 0 (0) 0 (0) 0 (0) 0 (0) Trachinotus falcatus 0 (0) 0 (0) 0 (0) 0 (0) 0 (0) 0 (0) 0 (0) 0 (0) Trinectes maculates 0 (0) 0 (0) 0 (0) 0 (0) 0 (0) 0 (0) 0 (0) 0 (0) Uca pugnax 0 (0) 0 (0) 0 (0) 0 (0) 0 (0) 0 (0) 0 (0) 0 (0) Uca sp. 0 (0) 0 (0) 0 (0) 0 (0) 0 (0) 0 (0) 0 (0) 0 (0) /I larval fish sp. A 0 (0) 0 (0) 0 (0) 0.17 (0.09) 0 (0) 0 (0) 0 (0) 0 (0)

172
Table 7.4-11a. Mean abundance (SE) for epibenthic fauna collected in Fall drop trap sampling at station P3 (Town Creek).
1999 2000 2001 2002 2003 2004 2005 2006 Anchoa mitchelli 1.36 (0.63) 0 (0) 0 (0) 0 (0) 0.11 (0.08) 14.33 (11.63) 0 (0) 0 (0) Anguilla rostrata 0.06 (0.04) 0 (0) 0 (0) 0 (0) 0 (0) 0 (0) 0.05 (0.05) 0 (0) Brevoortia tyrannus 0 (0) 0 (0) 0 (0) 0 (0) 0 (0) 0 (0) 0 (0) 0 (0) Callinectes sapidus 0.11 (0.10) 0 (0) 0.11 (0.08) 0 (0) 0.39 (0.18) 0.22 (0.10) 0.11 (0.08) 0.39 (0.22) Cambarus robustus (0.03) (0.03) 0 (0) 0 (0) 0 (0) 0 (0) 0 (0) 0 (0) 0 (0) Clupeidae 0 (0) 0 (0) 0 (0) 0 (0) 0 (0) 0 (0) 0 (0) 0 (0) Ctenogobius boleosoma 0 (0) 0 (0) 0 (0) 0 (0) 0 (0) 0 (0) 0 (0) 0.05 (0.05) Ctenogobius shufeldti 0.53 (0.34) 0.33 (0.16) 0.17 (0.09) 0 (0) 1.22 (0.45) 2.89 (0.59) 0.22 (0.17) 0.55 (0.20) Eucinostomus argenteus 0 (0) 0 (0) 0.11 (0.08) 0 (0) 0 (0) 0 (0) 0 (0) 0 (0) Eucinostomus sp. 0 (0) 0 (0) 0 (0) 0 (0) 0 (0) 2.11 (1.02) 0.05 (0.05) 0.17 (0.09) Evorthodus lyricus 0 (0) 0 (0) 0 (0) 0 (0) 2.44 (0.89) 0 (0) 0 (0) 0.05 (0.05) Farfantepenaeus aztecus 0 (0) 0 (0) 0 (0) 2.33 (0.67) 3.56 (2.05) 0 (0) 0 (0) 0 (0) Fundulus heteroclitus 0.12 (.08) 0 (0) 0 (0) 0.17 (0.12) 0 (0) 0.06 (0.06) 0 (0) 0 (0) Fundulus majalis 0 (0) 0.06 (0.06) 0 (0) 0 (0) 0 (0) 0 (0) 0 (0) 0 (0) Gambusia holbrooki 0.81 (0.72) 1.83 (0.62) 3.39 (1.72) 0.11 (0.08) 1.00 (0.58) 1.50 (0.78) 1.05 (0.57) 0.78 (0.49) Gobionellus oceanicus 0 (0) 0 (0) 0 (0) 0 (0) 0 (0) 0.56 (0.22) 0.28 (0.16) 0.28 (0.13) Gobiosoma bosc 0 (0) 0 (0) 0 (0) 0 (0) 0 (0) 0.06 (0.06) 0 (0) 0 (0) Lagodon rhomboides 0 (0) 0 (0) 0 (0) 0 (0) 0 (0) 0 (0) 0 (0) 0 (0) Leiostomus xanthurus 0 (0) 0 (0) 0.28 (0.14) 0 (0) 0 (0) 0 (0) 0 (0) 0 (0) Lepomis macrochirus 0.09 (0.07) 0.06 (0.06) 0 (0) 0 (0) 0 (0) 0 (0) 0 (0) 0 (0) Lutjanus griseus 0 (0) 0 (0) 0 (0) 0 (0) 0 (0) 0.11 (0.08) 0 (0) 0 (0) Menidia beryllina 0.06 (0.04) 0 (0) 0.06 (0.06) 0 (0) 2.89 (2.38) 0.22 (0.17) 0.17 (0.17) 0.33 (0.28) Menidia sp. 0 (0) 0 (0) 0 (0) 0 (0) 0 (0) 0 (0) 0 (0) 0 (0) Micropogonias undulatus 0.11 (0.08) 0 (0) 0 (0) 0 (0) 0 (0) 0.78 (0.34) 0 (0) 0 (0) Mugil cephalus 0 (0) 0 (0) 0 (0) 0 (0) 0 (0) 0 (0) 0 (0) 0 (0) Notropis petersoni 0 (0) 0 (0) 0 (0) 0 (0) 0 (0) 0 (0) 0 (0) 0 (0) Palaemonetes pugio 0 (0) 0 (0) 1.39 (0.83) 0.56 (0.30) 0.17 (0.12) 2.11 (1.03) 0 (0) 4.28 (3.38) Panopeus herbstii 0.06 (0.06) 0.17 (0.12) 0.06 (0.06) 0 (0) 0 (0) 0 (0) 0 (0) 0 (0) Paralichthys albigutta 0 (0) 0 (0) 0 (0) 0 (0) 0 (0) 0 (0) 0.05 (0.05) 0 (0) Paralichthys dentatus 0 (0) 0 (0) 0.06 (0.06) 0 (0) 0 (0) 0 (0) 0 (0) 0 (0) Paralichthys lethostigma 0 (0) 0 (0) 0 (0) 0 .06 (0.06) 0.06 (0.06) 0 (0) 0 (0) 0 (0) Paralichthys sp. 0 (0) 0 (0) 0 (0) 0 (0) 0.17 (0.12) 0 (0) 0 (0) 0 (0) Rhithropanopeus harrisii 0 (0) 0 (0) 0.06 (0.06) 0 (0) 0.06 (0.06) 0.56 (0.50) 0.17 (0.09) 0 (0) Sesarma cinereum 0 (0) 0.28 (0.11) 0 (0) 0 (0) 0 (0) 0.06 (0.06) 0 (0) 0 (0) Sesarma reticulatum 0 (0) 0 (0) 0 (0) 0.17 (0.09) 0 (0) 0 (0) 0 (0) 0 (0) Symphurus plagiusa 0 (0) 0 (0) 0 (0) 0 (0) 0 (0) 0 (0) 0 (0) 0 (0) Sygnathidae 0 (0) 0 (0) 0 (0) 0 (0) 0.06 (0.06) 0 (0) 0 (0) 0 (0) Trinectes maculatus 2.14 (1.05) 0.06 (0.06) 0 (0) 0 (0) 0.06 (0.06) 0.06 (0.06) 0 (0) 0.55 (0.25) Uca minax 0 (0) 0 (0) 0 (0) 0.17 (0.09) 0 (0) 0.67 (0.61) 0 (0) 0 (0) Uca pugnax 0.92 (0.47) 5.06 (0.96) 0 (0) 0 (0) 0 (0) 0 (0) 0 (0) 0 (0) Uca sp. 0 (0) 0 (0) 0 (0) 0 (0) 0 (0) 0 (0) 0 (0)

173
Table 7.4-11b. Mean abundance (SE) for epibenthic fauna collected in Spring drop trap sampling at station P3 (Town Creek).
2000 2001 2002 2003 2004 2005 2006 2007 Anchoa mitchelli 0 (0) 0 (0) 0 (0) 0 (0) 0 (0) 0 (0) 0 (0) 0 (0) Anguilla rostrata 0.09 (0.07) 0.28 (0.16) 0 (0) 0 (0) 0.06 (0.06) 0.06 (0.06) 0 (0) 0 (0) Brevoortia tyrannus 0 (0) 0 (0) 4.00 (2.50) 0 (0) 0 (0) 0 (0) 0 (0) 0 (0) Callinectes sapidus 0.20 (0.11) 0.28 (0.16) 0.56 (0.27) 0 (0) 0.56 (0.22) 0.22 (0.13) 0.28 (0.13) 0.17 (0.12) Cambarus robustus 0 (0) 0 (0) 0 (0) 0 (0) 0 (0) 0 (0) 0 (0) 0 (0) Clupeidae 0 (0) 0 (0) 0 (0) 0 (0) 0 (0) 0.39 (0.33) 0 (0) 0 (0) Ctenogobius boleosoma 0 (0) 0 (0) 0 (0) 0 (0) 0 (0) 0.39 (0.23) 0 (0) 0 (0) Ctenogobius shufeldti 0.28 (0.12) 0.73 (0.39) 0.22 (0.17) 0 (0) 5.78 (1.79) 0.17 (0.12) 0.28 (0.13) 0.17 (0.09) Eucinostomus argenteus 0 (0) 0 (0) 0 (0) 0 (0) 0 (0) 0 (0) 0 (0) 0 (0) Eucinostomus sp. 0 (0) 0 (0) 0 (0) 0 (0) 0 (0) 0 (0) 0 (0) 0 (0) Evorthodus lyricus 0 (0) 0 (0) 0 (0) 0 (0) 0 (0) 0 (0) 0 (0) 0 (0) Farfantepenaeus aztecus 0 (0) 0 (0) 0 (0) 0 (0) 1.39 (1.16) 0 (0) 0 (0) 0 (0) Fundulus heteroclitus 0 (0) 0 (0) 0 (0) 0.11 (0.08) 0.11 (0.11) 0 (0) 0 (0) 0 (0) Fundulus majalis 0 (0) 0 (0) 0 (0) 0 (0) 0 (0) 0 (0) 0 (0) 0 (0) Gambusia holbrooki 2.00 (1.28) 0.06 (0.06) 0.22 (0.13) 0 (0) 1.11 (0.54) 0 (0) 7.94 (4.82) 0 (0) Gobionellus oceanicus 0 (0) 0 (0) 0 (0) 0 (0) 0 (0) 0 (0) 0 (0) 0 (0) Gobiosoma bosc 0 (0) 0 (0) 0 (0) 0 (0) 0 (0) 0 (0) 0 (0) 0 (0) Lagodon rhomboides 0.34 (0.19) 0 (0) 0.22 (0.10) 0 (0) 0.11 (0.11) 1.39 (0.89) 0 (0) 0.44 (0.20) Leiostomus xanthurus 0 (0) 0.28 (0.17) 0 (0) 0 (0) 36.39 (13.62) 31.22 (12.62) 13.8 (6.83) 20.28 (5.91) Lepomis macrochirus 1.59 (1.70) 0 (0) 0 (0) 0 (0) 0 (0) 0 (0) 0 (0) 0 (0) Lutjanus griseus 0 (0) 0 (0) 0 (0) 0 (0) 0 (0) 0 (0) 0 (0) 0 (0) Menidia beryllina 0.06 (0.06) 0 (0) 4.33 (2.22) 0 (0) 0 (0) 0 (0) 0 (0) 0 (0) Menidia sp. 0 (0) 0 (0) 0 (0) 0 (0) 0.06 (0.06) 0 (0) 0 (0) 0 (0) Micropogonias undulatus 0 (0) 0 (0) 50.44 (21.43) 0 (0) 0 (0) 0 (0) 0.05 (0.05) 0 (0) Mugil cephalus 0 (0) 0 (0) 2.89 (1.19) 0 (0) 0.06 (0.06) 0 (0) 0.50 (0.40) 0 (0) Notropis petersoni 0 (0) 0.22 (0.22) 0 (0) 0 (0) 0 (0) 0 (0) 0 (0) 0 (0) Palaemonetes pugio 0 (0) 0.17 (0.09) 7.17 (3.23) 0 (0) 10.39 (5.52) 3.94 (3.08) 10.9 (8.27) 5.28 (1.73) Panopeus herbstii 0.06 (0.04) 0 (0) 0 (0) 0 (0) 0 (0) 0 (0) 0 (0) 0 (0) Paralichthys albigutta 0 (0) 0 (0) 0 (0) 0 (0) 0 (0) 0 (0) 0 (0) 0 (0) Paralichthys dentatus 0.45 (0.16) 1.17 (0.59) 0 (0) 0.11 (0.08) 0 (0) 0 (0) 0.05 (0.05) 0 (0) Paralichthys lethostigma 0 (0) 0 (0) 0 (0) 0 (0) 0 (0) 0 (0) 0 (0) 0 (0) Paralichthys sp. 0 (0) 0 (0) 0 (0) 0 (0) 0.44 (0.35) 0.22 (0.13) 0.94 (0.34) 0.11 (0.11) Rhithropanopeus harrisii 0 (0) 0 (0) 0 (0) 0 (0) 0 (0) 0.06 (0.06) 0.05 (0.05) 0 (0) Sesarma cinereum 0 (0) 0 (0) 0 (0) 0 (0) 0 (0) 0 (0) 0 (0) 0 (0) Sesarma reticulatum 0 (0) 0 (0) 0 (0) 0 (0) 0 (0) 0 (0) 0 (0) 0 (0) Symphurus plagiusa 0 (0) 0 (0) 0 (0) 0 (0) 0.06 (0.06) 0 (0) 0 (0) 0 (0) Sygnathidae 0 (0) 0 (0) 0 (0) 0 (0) 0 (0) 0 (0) 0 (0) 0 (0) Trinectes maculatus 0.31 (0.17) 0.39 (0.22) 0 (0) 0 (0) 0 (0) 0 (0) 0 (0) 0 (0) Uca minax 0 (0) 0 (0) 0 (0) 0.50 (0.22) 0 (0) 2.28 (2.22) 0 (0) 0 (0) Uca pugnax 0.03 (0.03) 0 (0) 0 (0) 0 (0) 0 (0) 0 (0) 0 (0) 0 (0) Uca sp. 0 (0) 0 (0) 0.78 (0.46) 0 (0) 0.39 (0.39) 0 (0) 0 (0) 0 (0)

174
Table 7.4-12a. Mean abundance (SE) for epibenthic fauna collected in Fall drop trap sampling at station P6 (Eagle Island).
1999 2000 2001 2001 2003 2004 2005 2006
Anchoa mitchelli 0 (0) 1.00 (0.37) 0 (0) 0 (0) 0 (0) 9.72 (6.05) 3.39 (2.99) 0.22 (0.22) Anguilla rostrata 0 (0) 0 (0) 0 (0) 0 (0) 0 (0) 0 (0) 0 (0) 0 (0) Callinectes sapidus 0.22 (0.10) 0.06 (0.06) 0 (0) 0.06 (0.06) 0.39 (0.16) 0.33 (0.16) 0.39 (0.12) 0.17 (0.09) Clupeidae 0 (0) 0 (0) 0 (0) 0 (0) 0 (0) 0 (0) 0 (0) 0 (0) Corbicula fluminea 0.06 (0.06) 0 (0) 0 (0) 0 (0) 0 (0) 0 (0) 0 (0) 0 (0) Ctenogobius boleosoma 0 (0) 0 (0) 0 (0) 0 (0) 0 (0) 0 (0) 0.22 (0.10) 0.11 (0.11) Ctenogobius shufeldti 0.06 (0.06) 0.22 (0.15) 0 (0) 0 (0) 1.61 (0.51) 0.33 (0.11) 0.17 (0.12) 0.11 (0.08) Eucinostomus harengulus 0 (0) 0 (0) 0 (0) 0 (0) 0 (0) 0.06 (0.06) 0 (0) 0 (0) Eucinostomus sp. 0 (0) 0 (0) 0 (0) 0 (0) 0 (0) 0 (0) 0.11 (0.08) 0.11 (0.11) Farfantepenaeus aztecus 0 (0) 0 (0) 0 (0) 0.83 (0.35) 0 (0) 0 (0) 0 (0) 0 (0) Fundulus heteroclitus 0 (0) 0 (0) 0 (0) 0 (0) 0 (0) 0 (0) 0 (0) 0 (0) Fundulus sp. 0 (0) 0 (0) 0 (0) 0 (0) 0 (0) 0 (0) 0 (0) 0 (0) Gerres cinereus 0 (0) 0.28 (0.16) 0 (0) 0 (0) 0 (0) 0 (0) 0 (0) 0 (0) Lagodon rhomboides 0 (0) 0 (0) 0 (0) 0 (0) 0 (0) 0 (0) 0 (0) 0 (0) Leiostomus xanthurus 0 (0) 0 (0) 0.22 (0.13) 0 (0) 0 (0) 0 (0) 0 (0) 0 (0) Lepomis sp. 0 (0) 0 (0) 0 (0) 0 (0) 0 (0) 0 (0) 0 (0) 0 (0) Litopenaeus setiferus 0 (0) 0 (0) 0 (0) 0 (0) 0 (0) 0.17 (0.09) 0.28 (0.16) 0.05 (0.05) Macrobrachium sp. 0 (0) 0 (0) 0 (0) 0 (0) 0 (0) 0 (0) 0 (0) 0.11 (0.08) Menidia beryllina 0.11 (0.08) 0 (0) 0.17 (0.09) 0.72 (0.42) 0 (0) 0.28 (0.18) 0.05 (0.05) 0.50 (0.40) Menidia menidia 0 (0) 0 (0) 0 (0) 0 (0) 0.06 (0.06) 0 (0) 0 (0) 0 (0) Menidia sp. 0 (0) 0 (0) 0 (0) 0 (0) 0 (0) 0 (0) 0 (0) 0 (0) Micropogonias undulatus 0 (0) 0 (0) 0 (0) 0 (0) 0 (0) 0 (0) 0 (0) 0 (0) Mugil cephalus 0 (0) 0 (0) 0 (0) 0 (0) 0 (0) 0 (0) 0 (0) 0 (0) Palaemonetes pugio 0 (0) 5.44 (3.28) 1.00 (1.00) 0 (0) 0 (0) 14.72 (8.95) 3.39 (2.06) 0.05 (0.05) Panopeus herbstii 0 (0) 0.11 (0.08) 0 (0) 0 (0) 0 (0) 0 (0) 0 (0) 0 (0) Paralichthys dentatus 0 (0) 0 (0) 0 (0) 0 (0) 0 (0) 0 (0) 0 (0) 0 (0) Paralichthys lethostigma 0 (0) 0 (0) 0 (0) 0.06 (0.06) 0 (0) 0 (0) 0.05 (0.05) 0 (0) Paralichthys sp. 0 (0) 0 (0) 0 (0) 0 (0) 0 (0) 0 (0) 0 (0) 0 (0) Rhithropanopeus harrisii 0 (0) 0 (0) 0 (0) 0 (0) 0 (0) 0.22 (0.17) 0.05 (0.05) 0 (0) Sesarma cinereum 0 (0) 0 (0) 0 (0) 0 (0) 0 (0) 0.06 (0.06) 0 (0) 0 (0) Sesarma reticulatum 0 (0) 0 (0) 0 (0) 0 (0) 0 (0) 0 (0) 0 (0) 0 (0) Symphurus plagiusa 0 (0) 0 (0) 0 (0) 0.06 (0.06) 0 (0) 0 (0) 0 (0) 0 (0) Trinectes maculatus 0.44 (0.20) 0.11 (0.08) 0 (0) 0 (0) 0.50 (0.25) 0 (0) 0 (0) 0.05 (0.05) Uca sp. 0 (0) 0 (0) 0 (0) 0 (0) 0 (0) 0 (0) 0.11 (0.08) 0 (0) U/I larval fish 0 (0) 0 (0) 0 (0) 2.44 (1.72) 0 (0) 0 (0) 0 (0) 0 (0)

175
Table 7.4-12b. Mean abundance (SE) for epibenthic fauna collected in Spring drop trap sampling at station P6 (Eagle Island).
2000 2001 2002 2003 2004 2005 2006 2007
Anchoa mitchelli 0 (0) 0 (0) 0 (0) 0 (0) 0 (0) 0 (0) 0.61 (0.42) 0 (0) Anguilla rostrata 0 (0) 0.11 (0.08) 0.05 (0.05) 0.50 (0.25) 0.11 (0.08) 0 (0) 0 (0) 0 (0) Callinectes sapidus 0 (0) 0.06 (0.06) 0.53 (0.18) 0.22 (0.10) 0.61 (0.18) 0.56 (0.25) 0.28 (0.11) 0.05 (0.05) Clupeidae 0 (0) 0 (0) 0.21 (0.21) 0 (0) 0 (0) 37.78 (14.75) 0.94 (0.77) 1.67 (0.72) Corbicula fluminea 0 (0) 0 (0) 0 (0) 0 (0) 0 (0) 0 (0) 0 (0) 0 (0) Ctenogobius boleosoma 0 (0) 0 (0) 0 (0) 0 (0) 0 (0) 0.06 (0.06) 0.05 (0.05) 0 (0) Ctenogobius shufeldti 0.11 (0.11) 0.11 (0.08) 0 (0) 0 (0) 1.78 (0.33) 0.67 (0.21) 0.11 (0.08) 0.33 (0.11) Eucinostomus harengulus 0 (0) 0 (0) 0 (0) 0 (0) 0 (0) 0 (0) 0 (0) 0 (0) Eucinostomus sp. 0 (0) 0 (0) 0 (0) 0 (0) 0 (0) 0 (0) 0 (0) 0 (0) Farfantepenaeus aztecus 0 (0) 0 (0) 0 (0) 0 (0) 0 (0) 0 (0) 0 (0) 0 (0) Fundulus heteroclitus 0 (0) 0 (0) 0.32 (0.27) 0.06 (0.06) 0 (0) 0 (0) 0 (0) 0 (0) Fundulus sp. 0 (0) 0 (0) 0 (0) 0 (0) 0 (0) 0.06 (0.06) 0 (0) 0 (0) Gerres cinereus 0 (0) 0 (0) 0 (0) 0 (0) 0 (0) 0 (0) 0 (0) 0 (0) Lagodon rhomboides 0 (0) 0 (0) 0 (0) 0.06 (0.06) 0.11 (0.08) 0.39 (0.24) 0 (0) 0.11 (0.11) Leiostomus xanthurus 0 (0) 1.72 (0.72) 1.00 (0.52) 0 (0) 25.61 (9.85) 2.50 (1.02) 19.94 (3.90) 74.94 (23.79) Lepomis sp. 0 (0) 0 (0) 0 (0) 0 (0) 0.06 (0.06) 0 (0) 0 (0) 0 (0) Litopenaeus setiferus 0 (0) 0 (0) 0 (0) 0 (0) 0 (0) 0 (0) 0 (0) 0 (0) Macrobrachium sp. 0 (0) 0 (0) 0 (0) 0 (0) 0 (0) 0 (0) 0 (0) 0 (0) Menidia beryllina 0 (0) 20.83 (10.04) 0 (0) 0 (0) 0 (0) 0 (0) 0 (0) 0 (0) Menidia menidia 0 (0) 0 (0) 0 (0) 0.28 (0.28) 0 (0) 0 (0) 0 (0) 0 (0) Menidia sp. 0 (0) 0 (0) 0 (0) 0 (0) 0.06 (0.06) 0 (0) 0 (0) 0 (0) Micropogonias undulatus 0 (0) 0 (0) 0.32 (0.32) 0 (0) 3.44 (2.55) 0 (0) 1.22 (0.62) 0 (0) Mugil cephalus 0 (0) 0.22 (0.17) 0.16 (0.16) 0 (0) 0 (0) 0 (0) 0 (0) 0 (0) Palaemonetes pugio 0 (0) 1.78 (0.60) 8.21 (2.52) 0.22 (0.13) 0.22 (0.13) 2.11 (0.82) 15.6 (8.11) 0.44 (0.25) Panopeus herbstii 0 (0) 0 (0) 0 (0) 0 (0) 0 (0) 0 (0) 0 (0) 0 (0) Paralichthys dentatus 0.17 (0.12) 1.17 (0.56) 0.11 (0.11) 0.44 (0.23) 0 (0) 0 (0) 0 (0) 0 (0) Paralichthys lethostigma 0 (0) 0 (0) 0 (0) 0 (0) 0 (0) 0 (0) 0 (0) 0 (0) Paralichthys sp. 0 (0) 0 (0) 0.26 (0.13) 10.83 (3.68) 11.00 (3.82) 1.06 (0.36) 0.22 (0.10) 0.17 (0.09) Rhithropanopeus harrisii 0 (0) 0 (0) 0.05 (0.05) 0 (0) 0.06 (0.06) 0.17 (0.17) 0.05 (0.05) 0 (0) Sesarma cinereum 0 (0) 0 (0) 0 (0) 0 (0) 0 (0) 0 (0) 0 (0) 0 (0) Sesarma reticulatum 0 (0) 0 (0) 0.05 (0.05) 0 (0) 0 (0) 0 (0) 0 (0) 0 (0) Symphurus plagiusa 0 (0) 0 (0) 0 (0) 0 (0) 0 (0) 0 (0) 0 (0) 0 (0) Trinectes maculatus 0 (0) 0 (0) 0 (0) 0.11 (0.08) 0.06 (0.06) 0 (0) 0 (0) 0 (0) Uca sp. 0 (0) 0 (0) 0 (0) 0 (0) 0 (0) 0 (0) 0 (0) 0 (0) U/I larval fish 0 (0) 0 (0) 0 (0) 0 (0) 0 (0) 0 (0) 0 (0) 0 (0)

176
Table 7.4-13a. Mean abundance (SE) for epibenthic fauna collected in Fall drop trap sampling at station P7 (Indian Creek).
1999 2000 2001 2002 2003 2004 2005 2006
Anguilla rostrata 0 (0) 0 (0) 0 (0) 0.06 (0.06) 0.33 (0.14) 0 (0) 0 (0) 0.05 (0.05) Callinectes sapidus 0.06 (0.06) 0 (0) 0.17 (0.09) 0 (0) 0.11 (0.07) 0.06 (0.06) 0.17 (0.09) 0.11 (0.11) Clupeidae 0 (0) 0 (0) 0 (0) 0 (0) 0.17 (0.17) 0 (0) 0 (0) 0 (0) Ctenogobius boleosoma 0 (0) 0 (0) 0 (0) 0 (0) 0 (0) 0 (0) 0.17 (0.12) 0 (0) Ctenogobius shufeldti 0.06 (0.06) 0.28 (0.18) 0.22 (0.10) 0 (0) 2.11 (0.38) 1.17 (0.35) 0.17 (0.09) 0.17 (0.12) Dorosoma cepedianum 0 (0) 0 (0) 0 (0) 0 (0) 0.06 (0.06) 0 (0) 0 (0) 0 (0) Dorosoma pretense 0.06 (0.06) 0 (0) 0 (0) 0 (0) 0 (0) 0 (0) 0 (0) 0 (0) Esox lucius 0.06 (0.06) 0 (0) 0 (0) 0 (0) 0 (0) 0 (0) 0 (0) 0 (0) Eucinostomus argenteus 0 (0) 0 (0) 0 (0) 0.11 (0.11) 0 (0) 0 (0) 0 (0) 0 (0) Eucinostomus sp. 0 (0) 0 (0) 0 (0) 0 (0) 0 (0) 0 (0) 0 (0) 0.11 (0.11) Evorthodus lyricus 0 (0) 0 (0) 0 (0) 0 (0) 0 (0) 0 (0) 0.05 (0.05) 0 (0) Fundulus heteroclitus 0.06 (0.06) 0 (0) 0 (0) 0 (0) 0 (0) 0 (0) 0 (0) 0 (0) Gambusia holbrooki 0.06 (0.06) 0.17 (0.17) 0 (0) 0 (0) 0 (0) 0 (0) 0.05 (0.05) 0 (0) Gerres cinereus 0 (0) 0.22 (0.10) 0 (0) 0 (0) 0 (0) 0 (0) 0 (0) 0 (0) Gobionellus oceanicus 0 (0) 0 (0) 0 (0) 0 (0) 0 (0) 0.06 (0.06) 0 (0) 0 (0) Gobiosoma sp. 0 (0) 0 (0) 0 (0) 0.06 (0.06) 0 (0) 0 (0) 0 (0) 0 (0) Lagodon rhomboides 0 (0) 0 (0) 0 (0) 0 (0) 0 (0) 0 (0) 0 (0) 0 (0) Leiostomus xanthurus 0 (0) 0 (0) 0 (0) 0 (0) 0 (0) 0 (0) 0.11 (0.11) 0 (0) Litopanaeus setiferus 0 (0) 0 (0) 0 (0) 0 (0) 0 (0) 0 (0) 0 (0) 0.05 (0.05) Menidia beryllina 0 (0) 0 (0) 0 (0) 0 (0) 0 (0) 0 (0) 0 (0) 0 (0) Menidia menidia 0 (0) 0 (0) 0 (0) 0 (0) 0.11 (0.11) 0 (0) 0 (0) 0 (0) Menidia sp. 0 (0) 0 (0) 0 (0) 0 (0) 0 (0) 0 (0) 0 (0) 0 (0) Micropogonias undulatus 0 (0) 0 (0) 0 (0) 0 (0) 0 (0) 0 (0) 0 (0) 0 (0) Mugil cephalus 0 (0) 0 (0) 0 (0) 0 (0) 0 (0) 0 (0) 0 (0) 0 (0) Palaemonetes pugio 0 (0) 0.28 (0.23) 0 (0) 0.33 (0.28) 0 (0) 0 (0) 0 (0) 0 (0) Paralichthys albigutta 0 (0) 0 (0) 0 (0) 0 (0) 0 (0) 0 (0) 0.11 (0.08) 0 (0) Paralichthys dentatus 0 (0) 0 (0) 0.06 (0.06) 0 (0) 0.06 (0.06) 0 (0) 0 (0) 0 (0) Paralichthys lethostigma 0 (0) 0 (0) 0 (0) 0.06 (0.06) 0 (0) 0.06 (0.06) 0 (0) 0 (0) Paralichthys sp. 0 (0) 0 (0) 0 (0) 0 (0) 0 (0) 0.28 (0.19) 0 (0) 0 (0) Rangia sp. 0 (0) 0 (0) 0 (0) 0 (0) 0 (0) 0 (0) 0 (0) 0 (0) Rhithropanopeus harrisii 0 (0) 0 (0) 0 (0) 0 (0) 0 (0) 0 (0) 0 (0) 0.11 (0.11) Trinectes maculatus 0 (0) 0.06 (0.06) 0.44 (0.15) 0 (0) 2.06 (0.60) 0.06 (0.06) 0.05 (0.05) 0.33 (0.18) Uca pugnax 0.06 (0.06) 0.11 (0.11) 0 (0) 0 (0) 0 (0) 0 (0) 0 (0) 0 (0) Uca sp. 0 (0) 0 (0) 0 (0) 0 (0) 0.11 (0.11) 0 (0) 0 (0) 0.05 (0.05) U/I juvenile fish 0 (0) 0.39 (0.33) 0 (0) 0 (0) 0 (0) 0 (0) 0 (0) 0 (0) U/I larval fish 0 (0) 0 (0) 0 (0) 0.11 (0.08) 0 (0) 0 (0) 0 (0) 0 (0)

177
Table 7.4-13b. Mean abundance (SE) for epibenthic fauna collected in Spring drop trap sampling at station P7 (Indian Creek).
2000 2001 2002 2003 2004 2005 2006 2007
Anguilla rostrata 0.71 (0.34) 0.11 (0.11) 0 (0) 0.39 (0.28) 1.06 (0.41) 0 (0) 0 (0) 0.17 (0.09) Callinectes sapidus 0 (0) 0 (0) 0 (0) 0.06 (0.06) 0 (0) 0 (0) 0.05 (0.05) 0.05 (0.05) Clupeidae 0 (0) 0 (0) 0 (0) 0 (0) 0 (0) 0.22 (0.22) 0.83 (0.78) 1.22 (0.77) Ctenogobius boleosoma 0 (0) 0 (0) 0 (0) 0 (0) 0 (0) 0 (0) 0 (0) 0 (0) Ctenogobius shufeldti 0.29 (0.14) 0 (0) 0 (0) 0 (0) 1.72 (0.53) 0.22 (0.13) 0.11 (0.11) 0.22 (0.13) Dorosoma cepedianum 0 (0) 0 (0) 0 (0) 0 (0) 0 (0) 0 (0) 0 (0) 0 (0) Dorosoma pretense 0 (0) 0 (0) 0 (0) 0 (0) 0 (0) 0 (0) 0 (0) 0 (0) Esox lucius 0 (0) 0 (0) 0 (0) 0 (0) 0 (0) 0 (0) 0 (0) 0 (0) Eucinostomus argenteus 0 (0) 0 (0) 0 (0) 0 (0) 0 (0) 0 (0) 0 (0) 0 (0) Eucinostomus sp. 0 (0) 0 (0) 0 (0) 0 (0) 0 (0) 0 (0) 0 (0) 0 (0) Evorthodus lyricus 0 (0) 0 (0) 0 (0) 0 (0) 0 (0) 0 (0) 0 (0) 0 (0) Fundulus heteroclitus 0 (0) 0 (0) 0 (0) 0 (0) 0 (0) 0 (0) 0 (0) 0 (0) Gambusia holbrooki 0 (0) 0 (0) 0 (0) 0 (0) 0 (0) 0 (0) 0 (0) 0 (0) Gerres cinereus 0 (0) 0 (0) 0 (0) 0 (0) 0 (0) 0 (0) 0 (0) 0 (0) Gobionellus oceanicus 0 (0) 0 (0) 0 (0) 0 (0) 0 (0) 0 (0) 0 (0) 0 (0) Gobiosoma sp. 0 (0) 0 (0) 0.06 (0.06) 0 (0) 0 (0) 0 (0) 0 (0) 0 (0) Lagodon rhomboides 0.35 (0.35) 0 (0) 0 (0) 0 (0) 0.06 (0.06) 0 (0) 0 (0) 0.05 (0.05) Leiostomus xanthurus 0 (0) 0 (0) 0 (0) 0 (0) 38.78 (21.08) 0 (0) 11.6 (6.07) 1.00 (0.36) Litopanaeus setiferus 0 (0) 0 (0) 0 (0) 0 (0) 0 (0) 0 (0) 0 (0) 0 (0) Menidia beryllina 0 (0) 0.28 (0.18) 0 (0) 0 (0) 0 (0) 0 (0) 0 (0) 0 (0) Menidia menidia 0 (0) 0 (0) 0 (0) 0.06 (0.06) 0 (0) 0 (0) 0 (0) 0 (0) Menidia sp. 0 (0) 0 (0) 0.06 (0.06) 0 (0) 0.28 (0.23) 0 (0) 0 (0) 0 (0) Micropogonias undulatus 0 (0) 0 (0) 0 (0) 0 (0) 0.06 (0.06) 0 (0) 0.05 (0.05) 0 (0) Mugil cephalus 0 (0) 0 (0) 0.28 (0.28) 0 (0) 0 (0) 0 (0) 0 (0) 0 (0) Palaemonetes pugio 0 (0) 0 (0) 0 (0) 0 (0) 0 (0) 0 (0) 0.05 (0.05) 0 (0) Paralichthys albigutta 0 (0) 0 (0) 0 (0) 0 (0) 0 (0) 0 (0) 0 (0) 0 (0) Paralichthys dentatus 0.47 (0.29) 1.56 (0.56) 0 (0) 1.50 (0.48) 0 (0) 0 (0) 0 (0) 0 (0) Paralichthys lethostigma 0 (0) 0 (0) 0 (0) 0 (0) 0 (0) 0 (0) 0 (0) 0 (0) Paralichthys sp. 0 (0) 0 (0) 0.11 (0.08) 0 (0) 9.50 (2.14) 1.72 (0.40) 0.55 (0.22) 2.83 (0.83) Rangia sp. 0.06 (0.06) 0 (0) 0 (0) 0 (0) 0 (0) 0 (0) 0 (0) 0 (0) Rhithropanopeus harrisii 0 (0) 0 (0) 0 (0) 0 (0) 0 (0) 0.06 (0.06) 0 (0) 0 (0) Trinectes maculatus 0 (0) 0 (0) 0 (0) 0.61 (0.22) 0 (0) 0 (0) 0 (0) 0 (0) Uca pugnax 0.06 (0.06) 0 (0) 0 (0) 0 (0) 0 (0) 0 (0) 0 (0) 0 (0) Uca sp. 0 (0) 0 (0) 0 (0) 0 (0) 0 (0) 0 (0) 0 (0) 0 (0) U/I juvenile fish 0 (0) 0 (0) 0 (0) 0 (0) 0 (0) 0 (0) 0 (0) 0 (0) U/I larval fish 0 (0) 0 (0) 0 (0) 0 (0) 0 (0) 0 (0) 0 (0) 0 (0)

178
Table 7.8-14a. Mean abundance (SE) for epibenthic fauna collected in Fall drop trap sampling at station P8 (Dollisons Landing).
1999 2000 2001 2002 2003 2004 2005 2006
Alosa pseudoharengus 0 (0) 0 (0) 0 (0) 0 (0) 0 (0) 0.17 (0.17) 0 (0) 0 (0) Anguilla rostrata 0 (0) 0 (0) 0 (0) 0 (0) 0.06 (0.06) 0.11 (0.11) 0 (0) 0 (0) Callinectes sapidus 0 (0) 0 (0) 0 (0) 0 (0) 0 (0) 0.11 (0.08) 0.11 (0.08) 0.11 (0.08) Clupeidae 0 (0) 0 (0) 0 (0) 0 (0) 0 (0) 0 (0) 0 (0) 0 (0) Ctenogobius shufeldti 0.11 (0.08) 0 (0) 0.06 (0.06) 0 (0) 2.56 (0.67) 1.00 (0.27) 0.33 (0.16) 0.17 (0.09) Cyprinidae 0 (0) 0 (0) 0 (0) 0 (0) 0.11 (0.11) 0 (0) 0 (0) 0 (0) Dorosoma petenense 0 (0) 0 (0) 0 (0) 0 (0) 0 (0) 0.06 (0.06) 0 (0) 0 (0) Esox niger 0 (0) 0 (0) 0 (0) 0 (0) 0 (0) 0 (0) 0 (0) 0 (0) Eucinostomus harengulus 0 (0) 0 (0) 0 (0) 0 (0) 0 (0) 0.22 (0.10) 0 (0) 0 (0) Eucinostomus sp. 0 (0) 0 (0) 0 (0) 0 (0) 0 (0) 0 (0) 2.89 (2.14) 0.05 (0.05) Farfantepenaeus aztecus 0 (0) 0 (0) 0 (0) 0.06 (0.06) 0 (0) 0 (0) 0 (0) 0 (0) Fundulus heteroclitus 0 (0) 0 (0) 0 (0) 0 (0) 0 (0) 0 (0) 0 (0) 0 (0) Gambusia holbrooki 0.22 (0.22) 0 (0) 0 (0) 0 (0) 0 (0) 0 (0) 0.22 (0.22) 0 (0) Gambusia sp. 0 (0) 0 (0) 0 (0) 0 (0) 0 (0) 0 (0) 0 (0) 0 (0) Gobiosoma sp. 0 (0) 0 (0) 0 (0) 0.17 (0.12) 0 (0) 0 (0) 0 (0) 0 (0) Leiostomus xanthurus 0 (0) 0 (0) 0 (0) 0 (0) 0 (0) 0 (0) 0 (0) 0 (0) Lepomis gibbensis 0 (0) 0 (0) 0 (0) 0 (0) 0 (0) 0 (0) 0 (0) 0 (0) Lepomis macrochirus 0.06 (0.06) 0.06 (0.06) 0 (0) 0 (0) 0 (0) 0 (0) 0 (0) 0 (0) Menidia beryllina 0 (0) 0 (0) 0 (0) 0 (0) 0 (0) 0.11 (0.08) 0 (0) Menidia menidia 0 (0) 0 (0) 0 (0) 0.06 (0.06) 0 (0) 0 (0) 0 (0) 0 (0) Notropis chalybaeus 2.94 (1.98) 0 (0) 0 (0) 0 (0) 0 (0) 0 (0) 0 (0) 0 (0) Notropis petersoni 0 (0) 0 (0) 0 (0) 0 (0) 0 (0) 0 (0) 0 (0) 0 (0) Paralichthys dentatus 0 (0) 0 (0) 0.06 (0.06) 0 (0) 0 (0) 0.06 (0.06) 0.11 (0.08) 0 (0) Paralichthys lethostigma 0 (0) 0 (0) 0 (0) 0 (0) 0 (0) 0.06 (0.06) 0 (0) 0 (0) Paralichthys sp. 0 (0) 0 (0) 0 (0) 0 (0) 0 (0) 0 (0) 0 (0) 0 (0) Penaeid 0 (0) 0 (0) 0 (0) 0 (0) 0 (0) 0 (0) 0 (0) 0 (0) Rhithorpanopeus harrisii 0 (0) 0 (0) 0 (0) 0 (0) 0.11 (0.08) 0.06 (0.06) 0 (0) 0 (0) Sesarma cinereum 0 (0) 0.06 (0.06) 0 (0) 0 (0) 0 (0) 0 (0) 0 (0) 0 (0) Trinectes maculatus 0.17 (0.12) 0 (0) 0.11 (0.11) 0.06 (0.06) 4.00 (1.40) 0.28 (0.14) 0.33 (0.14) 0.94 (0.35) Uca pugnax 0 (0) 0.17 (0.12) 0.17 (0.09) 0 (0) 0 (0) 0 (0) 0 (0) 0 (0) U/I larval fish sp. A 0 (0) 0 (0) 0 (0) 1.17 (0.74) 0 (0) 0 (0) 0 (0) 0 (0) U/I larval fish sp. B 0 (0) 0 (0) 0 (0) 0.17 (0.09) 0 (0) 0 (0) 0 (0) 0 (0)

179
Table 7.8-14b. Mean abundance (SE) for epibenthic fauna collected in Spring drop trap sampling at station P8 (Dollisons Landing).
2000 2001 2002 2003 2004 2005 2006 2007
Alosa pseudoharengus 0 (0) 0 (0) 0 (0) 0 (0) 0 (0) 0 (0) 0 (0) 0 (0) Anguilla rostrata 0 (0) 0.33 (0.18) 0.39 (0.14) 0.06 (0.06) 0.11 (0.08) 0 (0) 0 (0) 0 (0) Callinectes sapidus 0 (0) 0 (0) 0.22 (0.10) 0 (0) 0.06 (0.06) 0 (0) 0 (0) 0 (0) Clupeidae 0 (0) 0 (0) 0 (0) 0 (0) 69.78 (45.05) 7.94 (5.06) 1.61 (0.98) 0.67 (0.40) Ctenogobius shufeldti 0 (0) 0 (0) 0 (0) 0 (0) 2.17 (0.62) 0.33 (0.11) 0.05 (0.05) 0.11 (0.08) Cyprinidae 0 (0) 0 (0) 0 (0) 0 (0) 0 (0) 0 (0) 0 (0) 0 (0) Dorosoma petenense 0 (0) 0 (0) 0 (0) 0 (0) 0 (0) 0 (0) 0 (0) 0 (0) Esox niger 0 (0) 0 (0) 0 (0) 0.12 (0.08) 0 (0) 0 (0) 0 (0) 0 (0) Eucinostomus harengulus 0 (0) 0 (0) 0 (0) 0 (0) 0 (0) 0 (0) 0 (0) 0 (0) Eucinostomus sp. 0 (0) 0 (0) 0 (0) 0 (0) 0 (0) 0 (0) 0 (0) 0 (0) Farfantepenaeus aztecus 0 (0) 0 (0) 0 (0) 0 (0) 0 (0) 0 (0) 0 (0) 0 (0) Fundulus heteroclitus 0 (0) 0 (0) 0 (0) 0.06 (0.06) 0 (0) 0 (0) 0 (0) 0 (0) Gambusia holbrooki 0 (0) 0 (0) 0 (0) 0.06 (0.06) 0 (0) 0 (0) 0 (0) 0.17 (0.17) Gambusia sp. 0 (0) 0 (0) 0 (0) 0 (0) 0.33 (0.23) 0 (0) 0 (0) 0 (0) Gobiosoma sp. 0 (0) 0 (0) 0 (0) 0 (0) 0 (0) 0 (0) 0 (0) 0 (0) Leiostomus xanthurus 0 (0) 0 (0) 0 (0) 0 (0) 0 (0) 0 (0) 1.83 (0.49) 0 (0) Lepomis gibbensis 0 (0) 0 (0) 0 (0) 1.76 (1.76) 0 (0) 0 (0) 0 (0) 0 (0) Lepomis macrochirus 0 (0) 0 (0) 0 (0) 0 (0) 0 (0) 0 (0) 0 (0) 0 (0) Menidia beryllina 0.61 (0.39) 0 (0) 0 (0) 0.12 (0.12) 0 (0) 0.11 (0.08) 0 (0) 0 (0) Menidia menidia 0 (0) 0 (0) 0 (0) 0 (0) 0 (0) 0 (0) 0 (0) 0 (0) Notropis chalybaeus 0 (0) 0 (0) 0 (0) 0 (0) 0 (0) 0 (0) 0 (0) 0 (0) Notropis petersoni 0 (0) 0.06 (0.06) 0 (0) 0 (0) 0 (0) 0 (0) 0 (0) 0 (0) Paralichthys dentatus 0.11 (0.11) 0.06 (0.06) 0 (0) 1.35 (0.34) 0 (0) 0 (0) 0 (0) 0 (0) Paralichthys lethostigma 0 (0) 0 (0) 0 (0) 0 (0) 0 (0) 0 (0) 0 (0) 0 (0) Paralichthys sp. 0 (0) 0 (0) 0 (0) 0 (0) 1.72 (0.40) 0.50 (0.25) 1.50 (0.78) 2.22 (0.60) Penaeid 0 (0) 0 (0) 0.22 (0.13) 0 (0) 0 (0) 0 (0) 0 (0) 0 (0) Rhithorpanopeus harrisii 0 (0) 0 (0) 0 (0) 0 (0) 0 (0) 0 (0) 0 (0) 0 (0) Sesarma cinereum 0 (0) 0 (0) 0.11 (0.11) 0 (0) 0 (0) 0 (0) 0 (0) 0 (0) Trinectes maculatus 0 (0) 0 (0) 0.06 (0.06) 0.18 (0.13) 0 (0) 0 (0) 0 (0) 0.05 (0.05) Uca pugnax 0.06 (0.06) 0 (0) 0 (0) 0 (0) 0 (0) 0 (0) 0 (0) 0 (0) U/I larval fish sp. A 0 (0) 0 (0) 0 (0) 0 (0) 0 (0) 0 (0) 0 (0) 0 (0) U/I larval fish sp. B 0 (0) 0 (0) 0 (0) 0 (0) 0 (0) 0 (0) 0 (0) 0 (0)
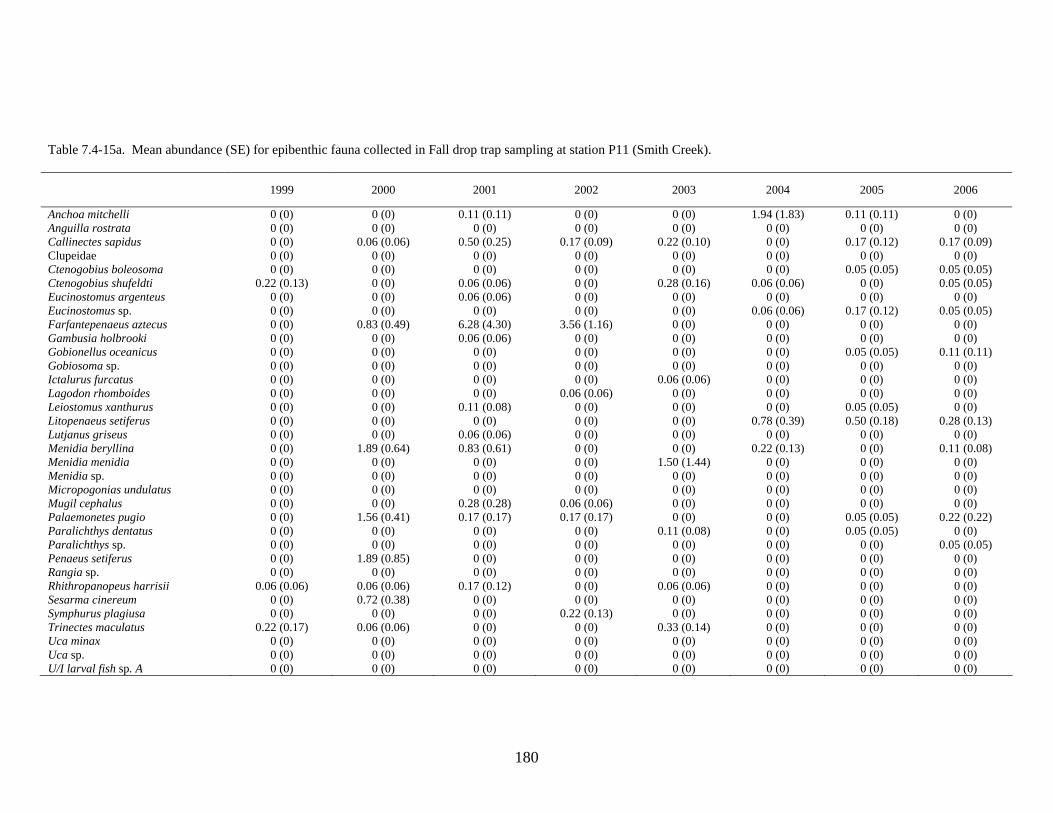
180
Table 7.4-15a. Mean abundance (SE) for epibenthic fauna collected in Fall drop trap sampling at station P11 (Smith Creek).
1999 2000 2001 2002 2003 2004 2005 2006
Anchoa mitchelli 0 (0) 0 (0) 0.11 (0.11) 0 (0) 0 (0) 1.94 (1.83) 0.11 (0.11) 0 (0) Anguilla rostrata 0 (0) 0 (0) 0 (0) 0 (0) 0 (0) 0 (0) 0 (0) 0 (0) Callinectes sapidus 0 (0) 0.06 (0.06) 0.50 (0.25) 0.17 (0.09) 0.22 (0.10) 0 (0) 0.17 (0.12) 0.17 (0.09) Clupeidae 0 (0) 0 (0) 0 (0) 0 (0) 0 (0) 0 (0) 0 (0) 0 (0) Ctenogobius boleosoma 0 (0) 0 (0) 0 (0) 0 (0) 0 (0) 0 (0) 0.05 (0.05) 0.05 (0.05) Ctenogobius shufeldti 0.22 (0.13) 0 (0) 0.06 (0.06) 0 (0) 0.28 (0.16) 0.06 (0.06) 0 (0) 0.05 (0.05) Eucinostomus argenteus 0 (0) 0 (0) 0.06 (0.06) 0 (0) 0 (0) 0 (0) 0 (0) 0 (0) Eucinostomus sp. 0 (0) 0 (0) 0 (0) 0 (0) 0 (0) 0.06 (0.06) 0.17 (0.12) 0.05 (0.05) Farfantepenaeus aztecus 0 (0) 0.83 (0.49) 6.28 (4.30) 3.56 (1.16) 0 (0) 0 (0) 0 (0) 0 (0) Gambusia holbrooki 0 (0) 0 (0) 0.06 (0.06) 0 (0) 0 (0) 0 (0) 0 (0) 0 (0) Gobionellus oceanicus 0 (0) 0 (0) 0 (0) 0 (0) 0 (0) 0 (0) 0.05 (0.05) 0.11 (0.11) Gobiosoma sp. 0 (0) 0 (0) 0 (0) 0 (0) 0 (0) 0 (0) 0 (0) 0 (0) Ictalurus furcatus 0 (0) 0 (0) 0 (0) 0 (0) 0.06 (0.06) 0 (0) 0 (0) 0 (0) Lagodon rhomboides 0 (0) 0 (0) 0 (0) 0.06 (0.06) 0 (0) 0 (0) 0 (0) 0 (0) Leiostomus xanthurus 0 (0) 0 (0) 0.11 (0.08) 0 (0) 0 (0) 0 (0) 0.05 (0.05) 0 (0) Litopenaeus setiferus 0 (0) 0 (0) 0 (0) 0 (0) 0 (0) 0.78 (0.39) 0.50 (0.18) 0.28 (0.13) Lutjanus griseus 0 (0) 0 (0) 0.06 (0.06) 0 (0) 0 (0) 0 (0) 0 (0) 0 (0) Menidia beryllina 0 (0) 1.89 (0.64) 0.83 (0.61) 0 (0) 0 (0) 0.22 (0.13) 0 (0) 0.11 (0.08) Menidia menidia 0 (0) 0 (0) 0 (0) 0 (0) 1.50 (1.44) 0 (0) 0 (0) 0 (0) Menidia sp. 0 (0) 0 (0) 0 (0) 0 (0) 0 (0) 0 (0) 0 (0) 0 (0) Micropogonias undulatus 0 (0) 0 (0) 0 (0) 0 (0) 0 (0) 0 (0) 0 (0) 0 (0) Mugil cephalus 0 (0) 0 (0) 0.28 (0.28) 0.06 (0.06) 0 (0) 0 (0) 0 (0) 0 (0) Palaemonetes pugio 0 (0) 1.56 (0.41) 0.17 (0.17) 0.17 (0.17) 0 (0) 0 (0) 0.05 (0.05) 0.22 (0.22) Paralichthys dentatus 0 (0) 0 (0) 0 (0) 0 (0) 0.11 (0.08) 0 (0) 0.05 (0.05) 0 (0) Paralichthys sp. 0 (0) 0 (0) 0 (0) 0 (0) 0 (0) 0 (0) 0 (0) 0.05 (0.05) Penaeus setiferus 0 (0) 1.89 (0.85) 0 (0) 0 (0) 0 (0) 0 (0) 0 (0) 0 (0) Rangia sp. 0 (0) 0 (0) 0 (0) 0 (0) 0 (0) 0 (0) 0 (0) 0 (0) Rhithropanopeus harrisii 0.06 (0.06) 0.06 (0.06) 0.17 (0.12) 0 (0) 0.06 (0.06) 0 (0) 0 (0) 0 (0) Sesarma cinereum 0 (0) 0.72 (0.38) 0 (0) 0 (0) 0 (0) 0 (0) 0 (0) 0 (0) Symphurus plagiusa 0 (0) 0 (0) 0 (0) 0.22 (0.13) 0 (0) 0 (0) 0 (0) 0 (0) Trinectes maculatus 0.22 (0.17) 0.06 (0.06) 0 (0) 0 (0) 0.33 (0.14) 0 (0) 0 (0) 0 (0) Uca minax 0 (0) 0 (0) 0 (0) 0 (0) 0 (0) 0 (0) 0 (0) 0 (0) Uca sp. 0 (0) 0 (0) 0 (0) 0 (0) 0 (0) 0 (0) 0 (0) 0 (0) U/I larval fish sp. A 0 (0) 0 (0) 0 (0) 0 (0) 0 (0) 0 (0) 0 (0) 0 (0)
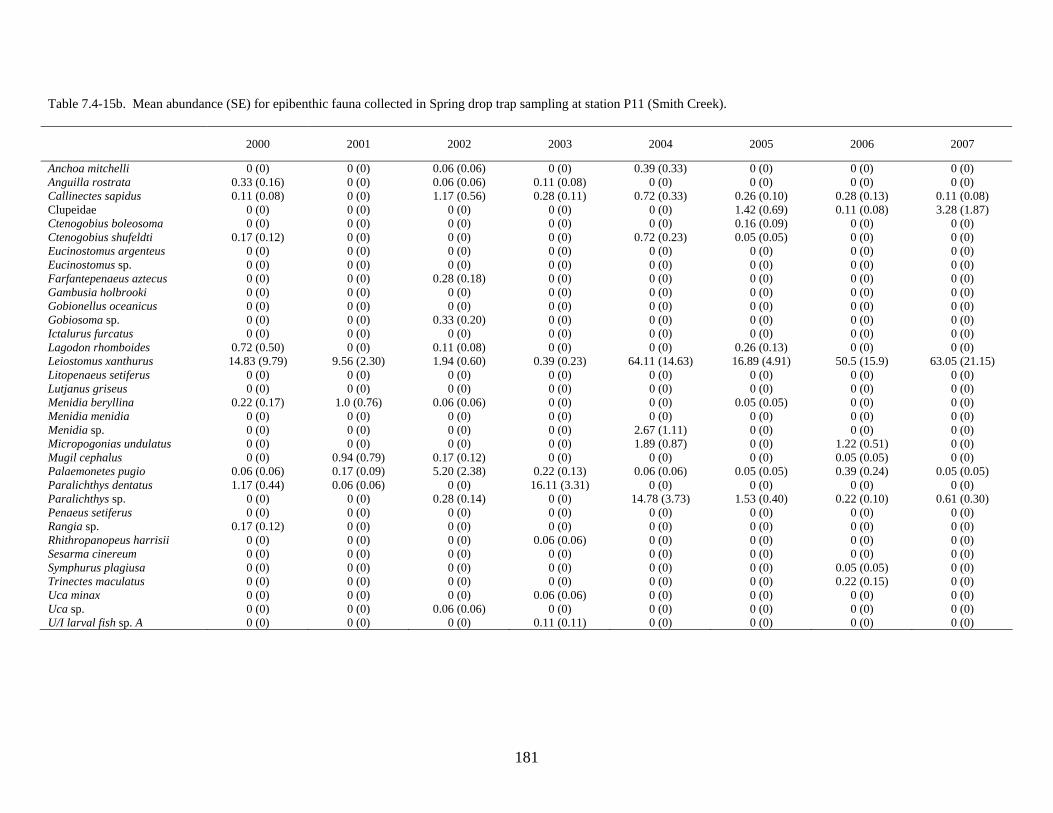
181
Table 7.4-15b. Mean abundance (SE) for epibenthic fauna collected in Spring drop trap sampling at station P11 (Smith Creek).
2000 2001 2002 2003 2004 2005 2006 2007
Anchoa mitchelli 0 (0) 0 (0) 0.06 (0.06) 0 (0) 0.39 (0.33) 0 (0) 0 (0) 0 (0) Anguilla rostrata 0.33 (0.16) 0 (0) 0.06 (0.06) 0.11 (0.08) 0 (0) 0 (0) 0 (0) 0 (0) Callinectes sapidus 0.11 (0.08) 0 (0) 1.17 (0.56) 0.28 (0.11) 0.72 (0.33) 0.26 (0.10) 0.28 (0.13) 0.11 (0.08) Clupeidae 0 (0) 0 (0) 0 (0) 0 (0) 0 (0) 1.42 (0.69) 0.11 (0.08) 3.28 (1.87) Ctenogobius boleosoma 0 (0) 0 (0) 0 (0) 0 (0) 0 (0) 0.16 (0.09) 0 (0) 0 (0) Ctenogobius shufeldti 0.17 (0.12) 0 (0) 0 (0) 0 (0) 0.72 (0.23) 0.05 (0.05) 0 (0) 0 (0) Eucinostomus argenteus 0 (0) 0 (0) 0 (0) 0 (0) 0 (0) 0 (0) 0 (0) 0 (0) Eucinostomus sp. 0 (0) 0 (0) 0 (0) 0 (0) 0 (0) 0 (0) 0 (0) 0 (0) Farfantepenaeus aztecus 0 (0) 0 (0) 0.28 (0.18) 0 (0) 0 (0) 0 (0) 0 (0) 0 (0) Gambusia holbrooki 0 (0) 0 (0) 0 (0) 0 (0) 0 (0) 0 (0) 0 (0) 0 (0) Gobionellus oceanicus 0 (0) 0 (0) 0 (0) 0 (0) 0 (0) 0 (0) 0 (0) 0 (0) Gobiosoma sp. 0 (0) 0 (0) 0.33 (0.20) 0 (0) 0 (0) 0 (0) 0 (0) 0 (0) Ictalurus furcatus 0 (0) 0 (0) 0 (0) 0 (0) 0 (0) 0 (0) 0 (0) 0 (0) Lagodon rhomboides 0.72 (0.50) 0 (0) 0.11 (0.08) 0 (0) 0 (0) 0.26 (0.13) 0 (0) 0 (0) Leiostomus xanthurus 14.83 (9.79) 9.56 (2.30) 1.94 (0.60) 0.39 (0.23) 64.11 (14.63) 16.89 (4.91) 50.5 (15.9) 63.05 (21.15) Litopenaeus setiferus 0 (0) 0 (0) 0 (0) 0 (0) 0 (0) 0 (0) 0 (0) 0 (0) Lutjanus griseus 0 (0) 0 (0) 0 (0) 0 (0) 0 (0) 0 (0) 0 (0) 0 (0) Menidia beryllina 0.22 (0.17) 1.0 (0.76) 0.06 (0.06) 0 (0) 0 (0) 0.05 (0.05) 0 (0) 0 (0) Menidia menidia 0 (0) 0 (0) 0 (0) 0 (0) 0 (0) 0 (0) 0 (0) 0 (0) Menidia sp. 0 (0) 0 (0) 0 (0) 0 (0) 2.67 (1.11) 0 (0) 0 (0) 0 (0) Micropogonias undulatus 0 (0) 0 (0) 0 (0) 0 (0) 1.89 (0.87) 0 (0) 1.22 (0.51) 0 (0) Mugil cephalus 0 (0) 0.94 (0.79) 0.17 (0.12) 0 (0) 0 (0) 0 (0) 0.05 (0.05) 0 (0) Palaemonetes pugio 0.06 (0.06) 0.17 (0.09) 5.20 (2.38) 0.22 (0.13) 0.06 (0.06) 0.05 (0.05) 0.39 (0.24) 0.05 (0.05) Paralichthys dentatus 1.17 (0.44) 0.06 (0.06) 0 (0) 16.11 (3.31) 0 (0) 0 (0) 0 (0) 0 (0) Paralichthys sp. 0 (0) 0 (0) 0.28 (0.14) 0 (0) 14.78 (3.73) 1.53 (0.40) 0.22 (0.10) 0.61 (0.30) Penaeus setiferus 0 (0) 0 (0) 0 (0) 0 (0) 0 (0) 0 (0) 0 (0) 0 (0) Rangia sp. 0.17 (0.12) 0 (0) 0 (0) 0 (0) 0 (0) 0 (0) 0 (0) 0 (0) Rhithropanopeus harrisii 0 (0) 0 (0) 0 (0) 0.06 (0.06) 0 (0) 0 (0) 0 (0) 0 (0) Sesarma cinereum 0 (0) 0 (0) 0 (0) 0 (0) 0 (0) 0 (0) 0 (0) 0 (0) Symphurus plagiusa 0 (0) 0 (0) 0 (0) 0 (0) 0 (0) 0 (0) 0.05 (0.05) 0 (0) Trinectes maculatus 0 (0) 0 (0) 0 (0) 0 (0) 0 (0) 0 (0) 0.22 (0.15) 0 (0) Uca minax 0 (0) 0 (0) 0 (0) 0.06 (0.06) 0 (0) 0 (0) 0 (0) 0 (0) Uca sp. 0 (0) 0 (0) 0.06 (0.06) 0 (0) 0 (0) 0 (0) 0 (0) 0 (0) U/I larval fish sp. A 0 (0) 0 (0) 0 (0) 0.11 (0.11) 0 (0) 0 (0) 0 (0) 0 (0)

182
Table 7.4-16a. Mean abundance (SE) for epibenthic fauna collected in Fall drop trap sampling at station P12 (Rat Island).
1999 2000 2001 2002 2003 2004 2005 2006
Alosa aestivalis 0 (0) 0 (0) 0 (0) 0 (0) 0 (0) 0 (0) 0 (0) 0 (0) Anchoa mitchilli 0 (0) 0 (0) 0 (0) 0 (0) 0 (0) 0 (0) 0.50 (0.36) 0.50 (0.05) Anguilla rostrata 0 (0) 0 (0) 0 (0) 0 (0) 0 (0) 0 (0) 0 (0) 0 (0) Brevoortia tyrannus 0 (0) 0 (0) 0 (0) 0 (0) 0 (0) 0 (0) 0 (0) 0 (0) Callinectes sapidus 0 (0) 0.11 (0.08) 0.56 (0.27) 0.06 (0.06) 0.11 (0.08) 0.22 (0.17) 0.28 (0.13) 0 (0) Clupeidae 0 (0) 0 (0) 0 (0) 0 (0) 0 (0) 0 (0) 0 (0) 0 (0) Ctenogobius boleosoma 0 (0) 0 (0) 0 (0) 0 (0) 0 (0) 0 (0) 0.05 (0.05) 0.22 (0.13) Ctenogobius shufeldti 0.11 (0.08) 0.06 (0.06) 0.06 (0.06) 0 (0) 0.72 (0.40) 0.39 (0.16) 0.11 (0.08) 0.61 (0.24) Eucinostomus sp. 0 (0) 0 (0) 0 (0) 0 (0) 0 (0) 0 (0) 0 (0) 0.05 (0.05) Farfantepenaeus aztecus 0 (0) 0 (0) 0.06 (0.06) 0.22 (0.10) 0 (0) 0 (0) 0 (0) 0 (0) Fundulus heteroclitus 0 (0) 0 (0) 0 (0) 0 (0) 0 (0) 0 (0) 0 (0) 0.67 (0.61) Gambusia holbrooki 0 (0) 0 (0) 0 (0) 0 (0) 0 (0) 0 (0) 0 (0) 0.05 (0.05) Gobionellus oceanicus 0 (0) 0 (0) 0 (0) 0 (0) 0 (0) 0.06 (0.06) 0 (0) 0 (0) Gobiosoma sp. 0 (0) 0 (0) 0 (0) 0 (0) 0 (0) 0 (0) 0 (0) 0 (0) Lagodon rhomboides 0 (0) 0 (0) 0 (0) 0 (0) 0 (0) 0 (0) 0 (0) 0 (0) Leiostomus xanthurus 0 (0) 0 (0) 0.28 (0.23) 0 (0) 0 (0) 0 (0) 0.55 (0.28) 0 (0) Lepomis macrochirus 0.11 (0.08) 0 (0) 0 (0) 0 (0) 0 (0) 0 (0) 0 (0) 0 (0) Litopenaeus setiferus 0 (0) 0 (0) 0 (0) 0 (0) 0 (0) 0 (0) 2.39 (0.78) 0.72 (0.27) Lutjanus griseus 0 (0) 0 (0) 0.06 (0.06) 0 (0) 0 (0) 0 (0) 0.05 (0.05) 0 (0) Micropogonias undulatus 0 (0) 0 (0) 0 (0) 0 (0) 0 (0) 0 (0) 0 (0) 0 (0) Menidia beryllina 0 (0) 0 (0) 0.33 (0.23) 0 (0) 0 (0) 0.28 (0.19) 0.89 (0.49) 0.11 (0.08) Mugil cephalus 0 (0) 0 (0) 0 (0) 0 (0) 0 (0) 0 (0) 0 (0) 0 (0) Palaemonetes pugio 0 (0) 1.22 (0.66) 1.56 (0.89) 0.33 (0.16) 0.11 (0.11) 0 (0) 0.55 (0.03) 0.72 (0.39) Palaemonetes vulgaris 0 (0) 0 (0) 0 (0) 0 (0) 0 (0) 0 (0) 0 (0) 0.05 (0.05) Paralichthys albigutta 0 (0) 0 (0) 0 (0) 0 (0) 0 (0) 0 (0) 0 (0) 0 (0) Paralichthys dentatus 0 (0) 0 (0) 0 (0) 0 (0) 0 (0) 0 (0) 0 (0) 0 (0) Paralichthys lethostigma 0 (0) 0 (0) 0 (0) 0 (0) 0.06 (0.06) 0 (0) 0 (0) 0 (0) Paralichthys sp. 0 (0) 0 (0) 0 (0) 0 (0) 0 (0) 0 (0) 0 (0) 0.05 (0.05) Rhithropanopeus harrisii 0 (0) 0 (0) 0 (0) 0 (0) 0 (0) 0 (0) 0.05 (0.05) 0 (0) Sesarma cinereum 0 (0) 0.17 (0.09) 0 (0) 0 (0) 0 (0) 0 (0) 0 (0) 0 (0) Symphurus plagiusa 0 (0) 0 (0) 0 (0) 0 (0) 0 (0) 0 (0) 0.05 (0.05) 0 (0) Trinectes maculatus 0 (0) 0 (0) 0 (0) 0 (0) 0 (0) 0 (0) 0 (0) 0.05 (0.05) Uca minax 0 (0) 0 (0) 0 (0) 0.11 (0.11) 0 (0) 0 (0) 0 (0) 0 (0) Uca pugnax 0.06 (0.06) 1.11 (0.54) 0 (0) 0 (0) 0 (0) 0 (0) 0 (0) 0 (0) Uca sp. 0 (0) 0 (0) 0 (0) 0 (0) 0.11 (0.11) 0 (0) 0 (0) 0 (0) U/I larval fish 0 (0) 0 (0) 0 (0) 0.22 (0.22) 0 (0) 0 (0) 0 (0) 0 (0)

183
Table 7.4-16b. Mean abundance (SE) for epibenthic fauna collected in Spring drop trap sampling at station P12 (Rat Island).
2000 2001 2002 2003 2004 2005 2006 2007
Alosa aestivalis 0 (0) 0 (0) 0 (0) 0 (0) 2.56 (2.44) 0 (0) 0 (0) 0 (0) Anchoa mitchilli 0 (0) 0 (0) 0 (0) 0 (0) 1.67 (1.05) 0 (0) 0.05 (0.05) 0 (0) Anguilla rostrata 0 (0) 0.33 (0.28) 0 (0) 0 (0) 0.17 (0.12) 0 (0) 0 (0) 0.05 (0.05) Brevoortia tyrannus 0 (0) 0 (0) 0.06 (0.06) 0 (0) 0 (0) 0 (0) 0 (0) 0 (0) Callinectes sapidus 0 (0) 0 (0) 0.78 (0.26) 0 (0) 0.17 (0.09) 0.11 (0.08) 0.28 (0.11) 0 (0) Clupeidae 0 (0) 0 (0) 0 (0) 0 (0) 0 (0) 4.39 (2.94) 1.05 (0.89) 4.55 (2.70) Ctenogobius boleosoma 0 (0) 0 (0) 0 (0) 0 (0) 0 (0) 0.28 (0.14) 0.28 (0.18) 0 (0) Ctenogobius shufeldti 0.06 (0.06) 0.56 (0.23) 0 (0) 0 (0) 1.83 (0.69) 0.17 (0.12) 0.50 (0.24) 0.44 (0.25) Eucinostomus sp. 0 (0) 0 (0) 0 (0) 0 (0) 0 (0) 0 (0) 0 (0) 0 (0) Farfantepenaeus aztecus 0 (0) 0 (0) 0 (0) 0 (0) 0 (0) 0 (0) 0 (0) 0 (0) Fundulus heteroclitus 0 (0) 0 (0) 0 (0) 0 (0) 0 (0) 0 (0) 0.22 (0.10) 0.05 (0.05) Gambusia holbrooki 0 (0) 0 (0) 0 (0) 0 (0) 0 (0) 0 (0) 0.17 (0.17) 0 (0) Gobionellus oceanicus 0 (0) 0 (0) 0 (0) 0 (0) 0 (0) 0 (0) 0 (0) 0 (0) Gobiosoma sp. 0 (0) 0 (0) 0.22 (0.10) 0 (0) 0 (0) 0 (0) 0 (0) 0 (0) Lagodon rhomboides 0 (0) 0 (0) 0 (0) 0 (0) 0.06 (0.06) 1.22 (0.55) 0 (0) 0.11 (0.08) Leiostomus xanthurus 0.11 (0.08) 0 (0) 17.56 (15.35) 0 (0) 16.94 (8.08) 33.11 (9.33) 71.6 (13.9) 88.11 (22.81) Lepomis macrochirus 0 (0) 0 (0) 0 (0) 0 (0) 0 (0) 0 (0) 0 (0) 0 (0) Litopenaeus setiferus 0 (0) 0 (0) 0 (0) 0 (0) 0 (0) 0 (0) 0 (0) 0 (0) Lutjanus griseus 0 (0) 0 (0) 0 (0) 0 (0) 0 (0) 0 (0) 0 (0) 0 (0) Micropogonias undulatus 0 (0) 0 (0) 0 (0) 0 (0) 8.22 (4.56) 0 (0) 4.61 (1.86) 0.72 (0.61) Menidia beryllina 0.17 (0.12) 0.39 (0.39) 0 (0) 0 (0) 0 (0) 0 (0) 0 (0) 0 (0) Mugil cephalus 0 (0) 0 (0) 0 (0) 0 (0) 0 (0) 0.11 (0.11) 0.22 (0.17) 0 (0) Palaemonetes pugio 0.06 (0.06) 1.61 (0.93) 1.50 (0.41) 5.94 (2.60) 0 (0) 0.94 (0.61) 13.1 (3.71) 0.05 (0.05) Palaemonetes vulgaris 0 (0) 0 (0) 0 (0) 0 (0) 0 (0) 0 (0) 0 (0) 0 (0) Paralichthys albigutta 0 (0) 0 (0) 0 (0) 0 (0) 0.06 (0.06) 0 (0) 0 (0) 0 (0) Paralichthys dentatus 0.17 (0.12) 0.33 (0.16) 0 (0) 11.44 (3.57) 0 (0) 0 (0) 0 (0) 0 (0) Paralichthys lethostigma 0 (0) 0 (0) 0 (0) 0 (0) 0 (0) 0 (0) 0 (0) 0 (0) Paralichthys sp. 0 (0) 0 (0) 0 (0) 1.17 (0.68) 2.22 (1.19) 1.06 (0.30) 0.33 (0.18) 0.44 (0.22) Rhithropanopeus harrisii 0 (0) 0 (0) 0.06 (0.06) 0 (0) 0 (0) 0.11 (0.08) 0 (0) 0 (0) Sesarma cinereum 0 (0) 0 (0) 0 (0) 0 (0) 0 (0) 0 (0) 0 (0) 0 (0) Symphurus plagiusa 0 (0) 0 (0) 0 (0) 0 (0) 0 (0) 0 (0) 0 (0) 0 (0) Trinectes maculatus 0 (0) 0 (0) 0.11 (0.08) 0.06 (0.06) 0 (0) 0 (0) 0.17 (0.17) 0 (0) Uca minax 0 (0) 0 (0) 0 (0) 0 (0) 0 (0) 0 (0) 0 (0) 0 (0) Uca pugnax 0 (0) 0 (0) 0 (0) 0 (0) 0 (0) 0 (0) 0 (0) 0 (0) Uca sp. 0 (0) 0 (0) 0 (0) 0 (0) 0.06 (0.06) 0 (0) 0 (0) 0 (0) U/I larval fish 0 (0) 0 (0) 0 (0) 0 (0) 0 (0) 0 (0) 0 (0) 0 (0)

184
Table 7.4-17a. Mean abundance (SE) for epibenthic fauna collected in Fall drop trap sampling at station P13 (Fishing Creek).
1999 2000 2001 2002 2003 2004 2005 2006
Alosa aestivalis 0 (0) 0 (0) 0 (0) 0 (0) 0 (0) 0 (0) 0 (0) 0 (0) Anchoa mitchelli 0 (0) 0 (0) 0 (0) 0.28 (0.28) 0 (0) 0 (0) 0 (0) 0 (0) Anguilla rostrata 0 (0) 0 (0) 0 (0) 0 (0) 0 (0) 0 (0) 0 (0) 0 (0) Callinectes sapidus 0 (0) 0 (0) 0 (0) 0 (0) 0.06 (0.06) 0 (0) 0 (0) 0.05 (0.05) Cambarus robustus 0 (0) 0 (0) 0 (0) 0 (0) 0 (0) 0 (0) 0 (0) 0 (0) Clupeidae 0 (0) 0 (0) 0 (0) 0 (0) 0 (0) 0 (0) 0 (0) 0 (0) Ctenogobius shufeldti 0 (0) 0 (0) 0 (0) 0 (0) 1.39 (0.74) 0.33 (0.18) 0 (0) 0.67 (0.28) Dorosoma petenense 0 (0) 0 (0) 0 (0) 0 (0) 0.06 (0.06) 0 (0) 0 (0) 0 (0) Esox americanus 0 (0) 0 (0) 0 (0) 0 (0) 0 (0) 0 (0) 0 (0) 0 (0) Eucinostomus sp. 0 (0) 0 (0) 0 (0) 0 (0) 0 (0) 0.06 (0.06) 0 (0) 0 (0) Farfantepenaeus aztecus 0 (0) 0 (0) 0 (0) 0.33 (0.16) 0 (0) 0 (0) 0 (0) 0 (0) Gambusia holbrooki 0 (0) 0.33 (0.18) 0 (0) 0 (0) 0 (0) 0 (0) 0 (0) 0 (0) Gobionellus oceanicus 0 (0) 0 (0) 0 (0) 0 (0) 0 (0) 0 (0) 0.17 (0.17) 0 (0) Gobiosoma sp. 0 (0) 0 (0) 0 (0) 0.11 (0.08) 0 (0) 0 (0) 0 (0) 0 (0) Lagodon rhomboides 0 (0) 0 (0) 0 (0) 0 (0) 0 (0) 0 (0) 0 (0) 0 (0) Leiostomus xanthurus 0 (0) 0 (0) 0.39 (0.27) 0 (0) 0 (0) 0 (0) 0 (0) 0 (0) Lepomis macrochirus 0.06 (0.06) 0 (0) 0 (0) 0 (0) 0 (0) 0 (0) 0 (0) 0 (0) Menidia beryllina 0 (0) 0 (0) 0.72 (0.46) 0 (0) 0 (0) 0.06 (0.06) 0 (0) 0 (0) Menidia menidia 0 (0) 0 (0) 0 (0) 4.28 (2.51) 0 (0) 0 (0) 0 (0) 0 (0) Menidia sp. 0 (0) 0 (0) 0 (0) 0 (0) 0.06 (0.06) 0 (0) 0 (0) 0 (0) Mugil cephalus 0 (0) 0 (0) 0 (0) 0 (0) 0 (0) 0 (0) 0 (0) 0 (0) Palaemonetes pugio 0 (0) 0 (0) 0 (0) 0.44 (0.29) 0 (0) 0 (0) 0 (0) 0 (0) Panopeus herbstii 0 (0) 0 (0) 0 (0) 0 (0) 0 (0) 0 (0) 0 (0) 0 (0) Panopeus sp. 0 (0) 0 (0) 0 (0) 0 (0) 0 (0) 0 (0) 0 (0) 0 (0) Paralichthys dentatus 0 (0) 0 (0) 0 (0) 0 (0) 0 (0) 0 (0) 0 (0) 0 (0) Paralichthys sp. 0 (0) 0 (0) 0 (0) 0 (0) 0 (0) 0 (0) 0 (0) 0 (0) Procambarus robostus 0 (0) 0 (0) 0 (0) 0 (0) 0 (0) 0 (0) 0 (0) 0 (0) Rhithropanopeus harrisii 0 (0) 0.22 (0.10) 0 (0) 0 (0) 0.11 (0.11) 0.06 (0.06) 0 (0) 0.11 (0.11) Trinectes maculatus 0 (0) 0 (0) 0 (0) 0 (0) 0 (0) 0.17 (0.12) 0.17 (0.12) 0.78 (0.25) Uca pugnax 0.11 (0.11) 0 (0) 0 (0) 0 (0) 0 (0) 0 (0) 0 (0) 0 (0) U/I larval fish 0 (0) 0 (0) 0 (0) 0.89 (0.89) 0.11 (0.11) 0 (0) 0 (0) 0 (0)

185
Table 7.4-17b. Mean abundance (SE) for epibenthic fauna collected in Spring drop trap sampling at station P13 (Fishing Creek).
2000 2001 2002 2003 2004 2005 2006 2007
Alosa aestivalis 0 (0) 0 (0) 0 (0) 0 (0) 0.06 (0.06) 0 (0) 0 (0) 0 (0) Anchoa mitchelli 0 (0) 0 (0) 0 (0) 0 (0) 0.06 (0.06) 0 (0) 0 (0) 0 (0) Anguilla rostrata 0.17 (0.17) 0.28 (0.14) 0 (0) 0.06 (0.06) 0.11 (0.08) 0.05 (0.05) 0 (0) 0 (0) Callinectes sapidus 0 (0) 0.17 (0.12) 0.06 (0.06) 0 (0) 0.11 (0.08) 0.05 (0.05) 0 (0) 0 (0) Cambarus robustus 0 (0) 0.06 (0.06) 0 (0) 0 (0) 0 (0) 0 (0) 0 (0) 0 (0) Clupeidae 0 (0) 0 (0) 0 (0) 0 (0) 0 (0) 7.05 (5.99) 2.39 (1.60) 2.50 (2.27) Ctenogobius shufeldti 0.22 (0.15) 0.17 (0.09) 0.11 (0.08) 0 (0) 1.17 (0.40) 0.16 (0.09) 0 (0) 0.05 (0.05) Dorosoma petenense 0 (0) 0 (0) 0 (0) 0 (0) 0 (0) 0 (0) 0 (0) 0 (0) Esox americanus 0 (0) 0.11 (0.11) 0 (0) 0 (0) 0 (0) 0 (0) 0 (0) 0 (0) Eucinostomus sp. 0 (0) 0 (0) 0 (0) 0 (0) 0 (0) 0 (0) 0 (0) 0 (0) Farfantepenaeus aztecus 0 (0) 0 (0) 0 (0) 0 (0) 0 (0) 0 (0) 0 (0) 0 (0) Gambusia holbrooki 0 (0) 0 (0) 0 (0) 0 (0) 0 (0) 0 (0) 0 (0) 0 (0) Gobionellus oceanicus 0 (0) 0 (0) 0 (0) 0 (0) 0 (0) 0 (0) 0 (0) 0 (0) Gobiosoma sp. 0 (0) 0 (0) 0 (0) 0 (0) 0 (0) 0 (0) 0 (0) 0 (0) Lagodon rhomboides 0 (0) 0 (0) 0 (0) 0 (0) 0.17 (0.09) 7.32 (6.07) 0 (0) 0.05 (0.05) Leiostomus xanthurus 0 (0) 0 (0) 0.11 (0.11) 0 (0) 27.22 (5.68) 1.26 (0.57) 8.44 (3.65) 3.50 (1.23) Lepomis macrochirus 0.11 (0.11) 0 (0) 0 (0) 0 (0) 0 (0) 0 (0) 0 (0) 0 (0) Menidia beryllina 1.39 (0.97) 0.22 (0.22) 6.89 (6.54) 0 (0) 0 (0) 0 (0) 0 (0) 0 (0) Menidia menidia 0 (0) 0 (0) 0 (0) 0 (0) 0 (0) 0 (0) 0 (0) 0 (0) Menidia sp. 0 (0) 0 (0) 0 (0) 0 (0) 7.28 (3.11) 0 (0) 0 (0) 0 (0) Mugil cephalus 0 (0) 0 (0) 0 (0) 0 (0) 0 (0) 0 (0) 0.39 (0.39) 0.17 (0.17) Palaemonetes pugio 0 (0) 0 (0) 0 (0) 0 (0) 0 (0) 0 (0) 0.11 (0.08) 0 (0) Panopeus herbstii 0 (0) 0 (0) 0 (0) 0 (0) 0 (0) 0 (0) 0 (0) 0 (0) Panopeus sp. 0 (0) 0 (0) 0 (0) 0 (0) 0 (0) 0 (0) 0 (0) 0 (0) Paralichthys dentatus 0.33 (0.16) 0.56 (0.23) 0 (0) 1.29 (0.50) 0 (0) 0 (0) 0 (0) 0 (0) Paralichthys sp. 0 (0) 0 (0) 0 (0) 0 (0) 0.56 (0.20) 1.47 (0.54) 0.17 (0.12) 2.05 (0.48) Procambarus robostus 0 (0) 0 (0) 0.06 (0.06) 0 (0) 0 (0) 0 (0) 0 (0) 0 (0) Rhithropanopeus harrisii 0 (0) 0 (0) 0 (0) 0.24 (0.14) 0 (0) 0 (0) 0 (0) 0 (0) Trinectes maculatus 0.33 (0.20) 0 (0) 0 (0) 0 (0) 0 (0) 0 (0) 0 (0) 0.11 (0.08) Uca pugnax 0 (0) 0 (0) 0 (0) 0 (0) 0 (0) 0 (0) 0 (0) 0 (0)
0 (0) 0 (0) 0 (0) 0 (0) 0 (0) 0 (0) 0 (0) 0 (0) U/I larval fish

Table 7.4-18. Comparison of species richness by year for fall Breder trap samples. SITE F (p) SNK OF F SIGNIFIC AN C E Smith Creek (P11) 8 . 41(0.0001) 02a 01b 99bc 03bc 0 4 b c 0 6 b c 05bc 00c
R at Island (P12) 6 . 07(0.0001) 05a 00b 02b 06b 99 b 04 b 03 b 01b
Fishing Creek (P13) 3 . 80(0.0006) 04a 05ab 99abc 02 abc 06 b c 03 b c 00bc 01c
Town Creek Mouth (P2) 14 .55(0.0001) 02a 05b 04c 00cd 06 cd 01 cd 99cd 03d
Inner Town Creek (P3A) 5 . 54(0.0001) 03a 01ab 02ab 00abc 99 bc 0 5 bc 04bc 06c
Inner Town Creek (P3B) 13 .49(0.0001) 02a 00a 99b 06b 03 b 01 b 04 b 05b
Eagle Island (P6) 7 . 04(0.0001) 05a 03ab 02ab 01ab 04 a bc 00 bc 99c 06c
Indian Creek (P7) 1. 92 NS Dollisons Landing (P8) 3 . 81(0.006) 03a 04ab 02ab 05ab 06 a bc 99 a bc 00bc 01c
Table 7.4-19. Comparison of species richness by year for spring Breder trap samples. SITE F (p) SNK OF F SIGNIFICA N CE Smith Creek (P11 ) 1 8 .39 (0.0001) 06a 05a 07a 04b 02 ab 03 c 00 c 01c
Rat Island (P12) 15 .67(0.0001) 05a 06b 01c 07c 04 c 00 c 02 c 03c
Fishing Creek (P13) 8 .64(0.0001) 04a 06b 07b 05b 01 b 03 b 00 c Town Creek Mouth (P2) 20 .98(0.0001) 05a 04b 07b 06b 00 b 01 c 02 c 03c
Inner Town Creek (P3A) 3.45(0.002) 04a 00ab 02ab 03ab 06 ab 05 ab 01ab 07b
Inner Town Creek (P3B) 4 . 26(0.0002) 05a 06a 02a 07a 01 a 04 a 00 ab 03b
Eagle Island (P6) 14.95(0.0001) 06a 04b 05b 07c 03 c 02 c 01 c 00c
Indian Creek (P7) 11 .60(0.0001) 01a 04a 05ab 06bc 00 bc 07 bc 03cd 02d
4 . 73(0.0001) 04a 01ab 06abc 05 abcd 00 bcd 07cd 03cd 02dDollisons Landing (P8)
186

Table 7.4-20. Comparison of species diversity by year for fall Breder trap samples. SITE F (p) SNK OF F SIGNIFICA N CE Smith Creek (P11) 6.14(0.0001) 02a 01b 99b 03b 06 b 00 b 04 b 05b
Rat Island (P12) 2.43(0.02) 05a 02ab 99ab 04ab 00 b 01 b 06b 03b
Fishing Creek (P13) 1.13 NS Town Creek Mouth (P2) 5 . 90(0.0001) 02a 05b 04b 99b 01 b 06 b 00 b 03b
Inner Town Creek (P3A) 3.25(0.003) 03a 02ab 01ab 00ab 99 ab 05 ab 06b 04b
Inner Town Creek (P3B) 6.45(0.0001) 02a 00ab 06b 03b 99 b 01 b 04 b 05b
Eagle Island (P6) 1. 64 NS Indian Creek (P7) 0 . 81 NS Dollisons Landing (P8) 1.57 NS
Table 7.4-21. Comparison of species diversity by year for spring Breder trap samples. SITE F (p) SNK OF F SIGNIFICAN CE Smith Creek (P11) 4.82(0.0001) 05a 02ab 06ab 07b 01 b 03 b 00b 04b
Rat Island (P12) 10.82(0.0001) 05a 06b 01b 02b 07 b 00 b 0 4 b 03b
Fishing Creek (P13) 3 .55(0.003) 04a 07ab 05ab 06ab 01 b 00 b 03b02b
Town Creek Mouth (P2) 18.59(0.0001) 05a 04b 00c 07c 06 cd 01 d 02 d 03d
Inner Town Creek (P3A) 2.35(0.03) 04a 00ab 03ab 02ab 05 ab 01 b 06b 07b
Inner Town Creek (P3B) 4.07(0.0003) 05a 06ab 02ab 07ab 01 b 04 b 00b 03b
Eagle Island (P6) 5.25(0.0001) 06a 05ab 07abc 04 abc 02 bc 03 bc 00bc 01c
Indian Creek (P7) 7.11(0.0001) 04a 01a 05ab 00bc 07 bc 06 c 02c 03c
Dollisons Landing (P8) 0 .52 NS
187

Table 7.4-22. Comparison of total abundance by year for fall Breder trap samples. SITE F (p) SNK OF F SIGNIFICA N CE Smith Creek (P11) 3 . 37(0.002) 99a 02ab 03b 01b 04 b 05 b 06 b 00b
Rat Island (P1 2) 3 .53(0.002) 05a 00ab 06abc 02 abc 03 abc 99 abc 04bc 01c
Fishing Creek (P13) 3 . 13(0.004) 05a 99a 04a 02a 06 a 03 a 00 a 01a
Town C reek Mouth (P2) 3 0 .47(0.0001) 02a 05b 04b 00b 06 b 01 b 99 b 03b
Inner Town Creek (P3A) 4 . 43(0.0001) 03a 02ab 01abc 00 abc 05 abc 99 bc 04c 06c
Inner Town Creek (P3B) 11 .17(0.0001) 02a 00a 06b 03b 99 b 04 b 01 b 05b
Eagle Island (P6) 2 . 21(0.04) 01a 02a 05a 03a 00 a 04 a 06 a 99a
Indian Creek (P7) 2 . 96(0.006) 02a 04ab 03ab 99ab 05 ab 06 b 01b 00b
Dollisons Landing (P8) 4.55(0.0001) 04b 03ab 02ab 05b 06 b 99 b 00b 01b
Table 7.4-23. Comparison of total abundance by year for spring Breder trap samples. SITE F(p) SNK OF F SIGNIFICANCE Smith Creek (P11) 19.07(0.0001) 07a 06b 05bc 04cd 02d 00d 03d 01d
Rat Island (P12) 16.40(0.0001) 06a 05a 03b 04b 07b 01b 00b 02b
Fishing Creek (P13) 7.59(0.0001) 04a 06b 01b 07b 05b 03b 00b
aTown Creek Mouth (P2) 24.71(0.0001) 07 06a 00b 05bc 04bc 01c 03c 02c
aInner Town Creek (P3A) 3.12(0.003) 06 04b 05b 00b 01b 02b 03b 07b
Inner Town Creek (P3B) 3.10(0.004) 06a 02ab 07ab 04ab 05ab 01ab 00b 03b
Eagle Island (P6) 17.14(0.001) 06a 04b 05c 07c 03c 02c 01c 00c
Indian Creek (P7) 6.69(0.0001) 01a 05b 04bc 00bc 07bc 06bc 03c 02c
Dollisons Landing (P8) 1.29 NS
188

Table 7.4-24. Comparison of species richness by year for fall drop trap samples. SITE F (p) SNK OF F SIGNIFICANCE (high to low) Smith Creek (P11) 4 . 19(.0003) 00a 01b 02b 03b 0 5 b 0 6 b 04 b 99b
Rat Island (P12) 4 . 98(.0001) 05a 06ab 01bc 00b c 0 2 b c 03 b c 04bc 99c
Fishing Creek (P13) 3 . 45(.002) 06a 02ab 03ab 04a b 0 0 a b 0 1 b 05b 99b
Town Creek mouth (P2) 4 . 82(.0001) 05a 03ab 04bc 02bc 01 bc 06 bc 00bc 99c
Town Creek Inner (P3) 9 . 96(.0001) 04a 03a 06b 99b 0 2 b 00 b 05 b 01b
Eagle Island (P6) 4 . 77(.0001) 04a 05ab 00ab 03a bc 0 2 a bc 0 6 b c 99bc 01c
Indian Creek (P7) 4 . 49(.0002) 03a 04b 01b 00b 0 5 b 0 6 b 02 b 99b
Dollisons Landing (P8) 7 .83(.0001) 03a 04a 06b 05b 0 2 b 99 b 00 b 01b
Table 7.4-25. Comparison of species richness by year for spring drop trap samples. SITE F (p) SNK OF F SIGNIFICANCE (high to low) Smith Creek (P11) 5.37(.0001) 04a 03ab 05abc 02 a bc 0 6 b c 0 0 c 07c 01c
Rat Island (P12) 9 . 74(.0001) 06a 05ab 07bc 04b c 0 2 b c 0 3 cd 01cd 00d
Fishing Creek (P13) 11 .35(.0001) 04a 05b 07b 06bc 0 1 b c 0 0 c 03c 02c
Town Creek mouth (P2) 3 . 11(.005) 02a 05b 03b 07b 00 b 01 b 04 b 06b
Town Creek Inner (P3) 9 . 10(.0001) 04a 02ab 06ab 05b c 00 b c 0 7 b c 01c 03d
Eagle Island (P6) 12 .55(.0001) 04a 05ab 06ab 07bc 0 1 bc 0 2 b c 03c 00d
Indian Creek (P7) 13 .36(.0001) 04a 07b 06b 03b 0 5 b c 0 0 b c 01bc 02c
Dollisons Landing (P8) 7 .83(.0001) 04a 06b 07b 03bc 0 5 b c 0 2 b c 01c 00c
189

Table 7.4-26. Comparison of species diversity by year for fall drop trap samples.
SITE F (p) SNK OF F SIGNIFICANCE (high to low) Smith Creek (P11) 5 . 49(.0001) 00a 01b 05b 06b 0 2 b 0 3 b 04 b 99b
Rat Island (P12) 6 . 38(.0001) 05a 06ab 01bc 00bc 02 c 03 c 04c 99c
Fishing Creek (P13) 1 . 74(NS) Town Creek mouth (P2) 4. 11(.0004) 05a 03ab 02bc 01bc 0 4 bc 06 bc 00bc 99c
Town Creek Inner (P3) 5 . 55(.0001) 04a 03ab 99bc 02b c 0 6 b c 00 b c 05c 01c
Eagle Island (P6) 2 . 15(.04) 04a 00ab 05ab 03ab 0 6 ab 0 2 ab 99ab 01b
Indian Creek (P7) 3 . 43(.002) 03a 00b 04b 06b 0 1 b 0 5 b 99 b 02b
Dollisons Landing (P8) 4 .80(.0001) 03a 04ab 06bc 02c 0 5 c 00 c 0 1 c 99c
Table 7.4-27. Comparison of species diversity by year for spring drop trap samples. SITE F (p) SNK OF F SIGNIFICANCE (high to low) Smith Creek (P11) 5 . 75(.0001) 02a 03ab 04abc 05 abc 0 0 abcd 06bcd 01cd 07d
Rat Island (P12) 3 . 75(.001) 06a 02ab 05abc 04 abc 0 3 ab c 0 7 abc 01bc 00c
Fishing Creek (P13) 6 .57(.0001) 04a 05a 07ab 01bc 00 b c 0 6 b c 03c 02c
Town Creek mouth (P2) 0 . 74(NS) Town Creek Inner (P3) 3 . 61(.002) 06a 04a 02a 00a 0 1 ab 0 5 ab 0 7 ab 03b
Eagle Island (P6) 6 . 23(.0001) 04a 06a 05ab 01ab 02 ab 0 3 ab c 07bc 00c
Indian Creek (P7) 6 .41(.0001) 04a 07b 03bc 00bc 0 6 b c 0 5 b c 01bc 02c
Dollisons Landing (P8) 3 . 68(.001) 04a 06ab 07ab 02ab 0 5 ab 03 b 01b 00b
190

Table 7.4-28. Comparison of total abundance by year for fall drop trap samples. SITE F (p) SNK OF F SIGNIFICANCE (high to low) Smith C reek (P11) 4. 73(.0001) 00a 01b 02b 03b 0 4 b 0 5 b 0 6 b 99b
Rat Island (P12) 4. 21(.0003) 05a 06a 01ab 00ab 0 4 ab 03 ab 02ab 99b
Fishing Creek (P13) 3.49(.002) 02a 06ab 03ab 01b 0 4 b 0 0 b 05b 99b
Town Creek mouth (P2) 4. 17(.0003) 05a 03ab 04b 02b 01 b 06 b 00 b 99b
Town Creek Inner (P3) 6 . 74(.0001) 04a 03a 99ab 00bc 0 6 b c 0 2 b c 05bc 01c
Eagle Island (P6) 6 . 27(.0001) 04a 00ab 05ab 02bc 0 3 bc 06 c 99c 01c
Indian Creek (P7) 7 . 56(.0001) 03a 04b 00b 01b 05 b 06 b 02 b 99b
Dollisons Landing (P8) 6 . 67(.0001) 03a 04b 05b 99bc 02 bc 06 bc 0 1bc 00c
Table 7.4-29. Comparison of total abundance by year for spring drop trap samples. SITE F (p) SNK OF F SIGNIFICANCE (high to low) Smith C reek (P11) 4. 99(.0001) 04a 03ab 06abc 07 abc 05 abcd 0 1bcd 02cd 00d
Rat Island (P12) 21 .41(.0001) 06a 07ab 05bc 03c d 0 4 de 0 2 de 01ef 00f
Fishing Creek (P13) 15 .14(.0001) 04a 06b 05b 07b 0 1 c 00 c 0 3 c 02c
Town Creek mouth (P2) 4. 76(.0001) 02a 01ab 03abc 05 abc 0 0 bc 0 7 bc 04bc 06c
Town Creek Inner (P3) 18 .25(.0001) 04a 07ab 05ab 02ab 0 5 b 00 c 0 1cd 03d
Eagle Island (P6) 13 .75(.0001) 07a 04a 06a 05ab 0 1 b 0 2 b 03 b 00c
Indian Creek (P7) 21 .70(.0001) 04a 06b 07bc 03bcd 05 b cd 0 1 cd 00cd 02d
Dollisons Landing (P8) 9 . 74(.0001) 04a 06b 07bc 05bc 0 3 bc 02 b c 00bc 01bc
191

8.0 SENSITIVE HERBACEOUS VEGETATION SAMPLING 8.1 Summary
Monitoring of sensitive herbaceous vegetation at seven stations in the Cape Fear River estuary was completed for the seventh year in 2006. Conditions this year at each of the seven sites varied relative to the effects of salinity changes experienced through the year. Changes this year have been largely those anticipated.
At the Inner Town Creek (P3) the dominant sensitive herbaceous species, Zizaniopsis miliacea, has expanded toward Town Creek where it is currently mixing with Spartina cynosuroides, a species more regularly associated with margins of more saline creeks. The Zizaniopsis miliacea has largely ceased expansion to the east, but appears to be moving north toward the northern boundary of the belt transect. This year the polygon has increased in size by about 2,000 ft2. Zizania aquatica, appeared last year for the first time in the center of the older portion of the sensitive herbaceous vegetation polygon. This species, more of an indicator of oligohaline conditions, is continuing to survive. No new species were noted within the polygon this year. Strong salinity events during the late summer and early fall of 2005 may or may not have had a direct effect on the course of vegetation within the polygon during the growing season of 2006.
The sensitive herbaceous vegetation polygon at Indian Creek (P7) has continued to erode at times of falling tide following the initiation of regular human traffic in the area. Current vegetation existing in this permanent plot continues to diminish in total cover. Saururus cernuus has declined after a maximum cover during the 2004 sampling year. Polygonum virginicum has disappeared from within the plot, but was seen this year just outside. Phanopyrum gymnocarpum, Chasmanthium latifolium (typically a flood plain forest species) and Hymenocallis crassifolia have increased. Hymenocallis may seem more abundant because of the increasing lack of cover throughout the plot and erosion of its underground structures. The clearing includes the entire sampling station. A low level salinity event occurring along the Cape Fear River during late summer low freshwater flow likely had little immediate effect on vegetation. The plot for monitoring sensitive herbaceous vegetation at Dollisons Landing (P8) contains two new species, Hydrocotyle verticillata and Lycopus virginicus. Both species are characteristic of wooded freshwater wetlands, but the former is usually in non-tidal habitats and the latter is often associated with low hummocks or rotten stumps. Saururus cernuus contributes somewhat less cover this year than in most recently past years. Reasons for this decrease in cover and the other minor variations in sensitive herbaceous species occurrences are unknown. The very slight salinity event during September of 2005 in the river at Dollisons Landing may or may not have had a significant effect in the plot. The sensitive herbaceous vegetation plot at Black River (P9) has experienced no apparent salinity events and has remained much the same as last year with the exception of the loss of Ludwigia palustris. Since the plot was relocated last year Boehmeria cylindrica has also appeared. Saururus cernuus remains the dominant species in the plot. The boundaries of Rat Island (P12) sensitive herbaceous vegetation plot have remained fixed since last year and dominance is still largely shared between Schoenoplectus americanus, the sensitive herbaceous species, and Spartina cynosuroides, the non-sensitive herbaceous species.
192

Cover by live stems of Schoenoplectus americanus is down from 90 percent last year to 50 percent this year. This year many of the stems of this species have fallen or show signs of stress, perhaps from salinity events that occurred late last year. There are no new sensitive herbaceous plant species this year, but Peltandra virginica is again visible. Salinity events late last year were strongly evident and have functioned in maintaining the sulfate reducing status of this plot. The habitat is continuing to be controlled by the mesohaline environment in the Northeast Cape Fear River. Further up stream along the Northeast Cape Fear River the Fishing Creek (P13) sensitive herbaceous polygon has shown a loss of cover by the long dominant Pontederia cordata. This year, for the first time, Peltandra virginica, thought to be tolerant of slightly more saline habitats, became the overall dominant plant in the plot. This shift along with a slow increase in diversity at the site may indicate a slight shift toward more brackish conditions. No significant salinity event was detected at the Prince George Creek (P14) monitoring station and the sensitive herbaceous polygon remains much as it was last year, with the exception of aberrations in GPS data. GPS data collected from tidal swamps continue to show results of multipath or deflection of satellite signals and should not be considered adequate for detecting minor polygon changes in size and shape.
8.2 Introduction and Background
It has been assumed as a basis for monitoring vegetation that the effects of flooding and salinity influence the health, viability and species content of plants in the Cape Fear Estuary. In this regard seven stations have been examined annually since 2000 for the purpose of assessing plant species content and percent cover (Table 8.2-1). The current report applies to the seventh year of sensitive herbaceous vegetation data collection during 2006.
Each of the monitoring stations is subject to the astronomical tides experienced within the lower Cape Fear River estuarine system. Six of the seven stations, during the seven years of the sampling, have experienced exposure to ocean-derived salt carried by tidal flooding. Ocean-derived salts have not been documented at Black River, the uppermost Cape Fear River station. Generalized vegetation zones along 50-meter wide transects extending from the tidal shore line to the upland at each station were defined and described as a part of an earlier report (CZR Incorporated 2001). Methods and results from past years’ of sensitive herbaceous species sampling and observations at the seven stations are covered in earlier reports (CZR Incorporated 2001 2002; Hackney 2002a, 2002b, 2003, 2004, 2005, and 2006).
193

Table 8.2-1. Locations, streams and numbers for sensitive herbaceous vegetation monitoring stations in the Wilmington Harbor monitoring project, Cape Fear River Estuary, North Carolina
Station Name Stream Name Station Number
Inner Town Creek Town Creek P3
Indian Creek Cape Fear River P7
Dollisons Landing Cape Fear River P8
Black River Cape Fear River (near Black River) P9
Rat Island Northeast Cape Fear River P12
Fishing Creek Northeast Cape Fear River P13
Prince George Creek Northeast Cape Fear River P14
8.3 Methodology
Data collection methods remain largely the same as those used during previous years of sensitive herbaceous vegetation sampling (CZR Incorporated 2002, Hackney 2002a, 2002b, 2003, 2004, 2005, and 2006). This year’s data for plant species presence and percent cover were gathered from four variable plots and three fixed plots. Percent cover data from previous years were not consulted immediately prior to assessment of conditions for the current year. Assessments are made in the field independent of pre-existing data.
Variable polygons were sampled at Inner Town Creek (P3), Rat Island (P12), Fishing Creek (P13), and Prince George Creek (P14) and are used below to demonstrate yearly changes in size, shape, and plant species cover. These variable-size plots have boundaries created by on-site delineations of recognizable assemblages of sensitive herbaceous species. Polygons at three stations with fixed, four-sided plots were chosen because they best represented larger, more widespread sensitive herbaceous vegetation assemblages. Last year the variable plot at Black River (P9) was converted to a permanent, four-sided plot for the same reason. The original plots being monitored at this site were abandoned because flooding interfered with the species being monitored (Hackney 2005). Permanent plots also occur at Indian Creek (P7) and Dollisons Landing (P8) (CZR Incorporated 2001). Although the plot at Rat Island (P 12) is a variable plot, its shape and size have remained unchanged since it became dominated by salt-tolerant plant species.
Sampling stations were visited during the first week of August 2006, while wetland herbaceous vegetation was at its optimum seasonal development. Polyvinyl chloride (PVC) stakes were added, moved, or removed at three sites in order to remark polygons for the current iteration of sampling. Each stake was renumbered and flagged as necessary. At each station plant species seen in each polygon were listed and their
194

contributed cover percentages were estimated and recorded. Position data of the PVC stakes were recorded using GPS (Global Positioning System) January 23 and 24, 2007 at the three stations. Details of the GPS data gathering process are covered in earlier reports (Hackney 2002a and 2002b).
It appears that multipath problems (those associated with reflection of the GPS signals before reaching the antenna) are still being experience at forested sites. More will be said of these problems in the later sections.
Field personnel responsible for gathering sensitive herbaceous vegetation data and GPS data have not changed since the inception of the project. The same personnel are responsible for analysis and reporting.
8.4 Hydrologic Events and Sensitive Vegetation
The effects of past hydrological events on habitats, growth, and distribution of sensitive herbaceous plant species are being monitored and assessed in tidal marsh and swamp forest communities (Hackney 2005). The changes in growth, contraction, or expansion of several perennial species apparently relative to salinity events within various plots have been remarkable.
Polygon sizes are presented below for each monitoring year (Table 8.41-1). Data covering sensitive herbaceous vegetation are presented below for each of the sampling stations (Tables 8.41-2 through 8.47-1). Polygon configurations are presented for the baseline year (2000), last year (2005), and the current year (2006) (Figures 8.41-1 through 8.47-1). Discussions may allude to interim data. Data from interim years of sensitive herbaceous vegetation sampling are presented in previous reports (CZR Incorporated 2001 and 2002; Hackney 2002a, 2002b, 2003, 2004, 2005, and 2006) and will be referenced as needed in the text.
Additional variables considered important during collection and presentation of the data are discussed for each station. Some of these variables include: 1) changes in sensitive herbaceous species, 2) shifts in dominance of sensitive herbaceous species, 3) changes in cover contributions of sensitive herbaceous species within delineated polygons, 4) variations in shapes and sizes of polygons, 5) habitat-related hydrological factors and, 6) plant characteristics of special importance in vegetation change within the plots.
8.41 Inner Town Creek
Cover by the dominant sensitive herbaceous species, Zizaniopsis miliacea, at the Inner Town Creek site has expanded greatly beyond the area measurements obtained in previous years (Table 8.41-2, Figure 8.41-1). Pre-existing boundaries that occurred near the originally marked clone have coalesced and outlier stems have all merged into one large polygon over 5,500 ft2 in size. This expansion was anticipated last year and now includes the southern part of the levee that once separated the main area of sensitive
195

herbaceous vegetation from that growing along the bank of Town Creek (Figure 8.41-1). Only a small patch of the polygon, resembling a doughnut hole, has apparently not been invaded by Zizaniopsis miliacea. Rhizomes that possibly now are under this area may produce subaerial stems by next year.
Continued northerly expansion of the polygon and union with existing stands dominated by Zizaniopsis miliacea is anticipated. However, Zizaniopsis miliacea is already co-dominant with Spartina cynosuroides that is abundant along the banks of Town Creek. Substrate in the area of the polygon adjacent to substation one (red dot closest to the creek, Figure 8.41-1) has been heavily disturbed by foot traffic along a trail providing access between substations. These regularly perturbed substrate soils do not currently favor growth of Zizaniopsis miliacea though its rhizomes may pass through the disturbed area. A second trail used twice yearly to access the southeastern tip of the polygon may prevent eastern expansion.
Substrate to the east of this latter trail experiences surface retention of tidal waters that may undergo some evaporation and affect increased salinity or concentration of sulfates in the soils. Immediately east of the polygon access trail to the southeastern tip of the polygon, Schoenoplectus robustus is a dominant species and is scattered with Schoenoplectus tabernaemontani. Both of these species are scattered within the polygon. However, these latter species are not considered sensitive herbaceous species.
Other species occurring within the polygon are also of importance. Along the eastern half of the polygon Zizaniopsis miliacea occurs less densely. Here as well Typha angustifolia, not considered a sensitive herbaceous species, is co-dominant. As indicated last year, a small stand of Zizania aquatica, traditional wild rice, has taken root in the southern center of the polygon just east of the levee (Hackney 2006). It is interesting that the area in which the wild rice occurs is the most thoroughly watered portion of the polygon along the small tidal stream that allows regular flooding of the polygon. The substrate here is more of a thick suspension than a consolidated substrate. Sagittaria lancifolia, near this area, now constitutes less cover, but much of the apparent decrease is an artifact of the increase in size of the polygon. The same is true for Peltandra virginica. Cover by Carex hyalinolepis has remained about the same.
196
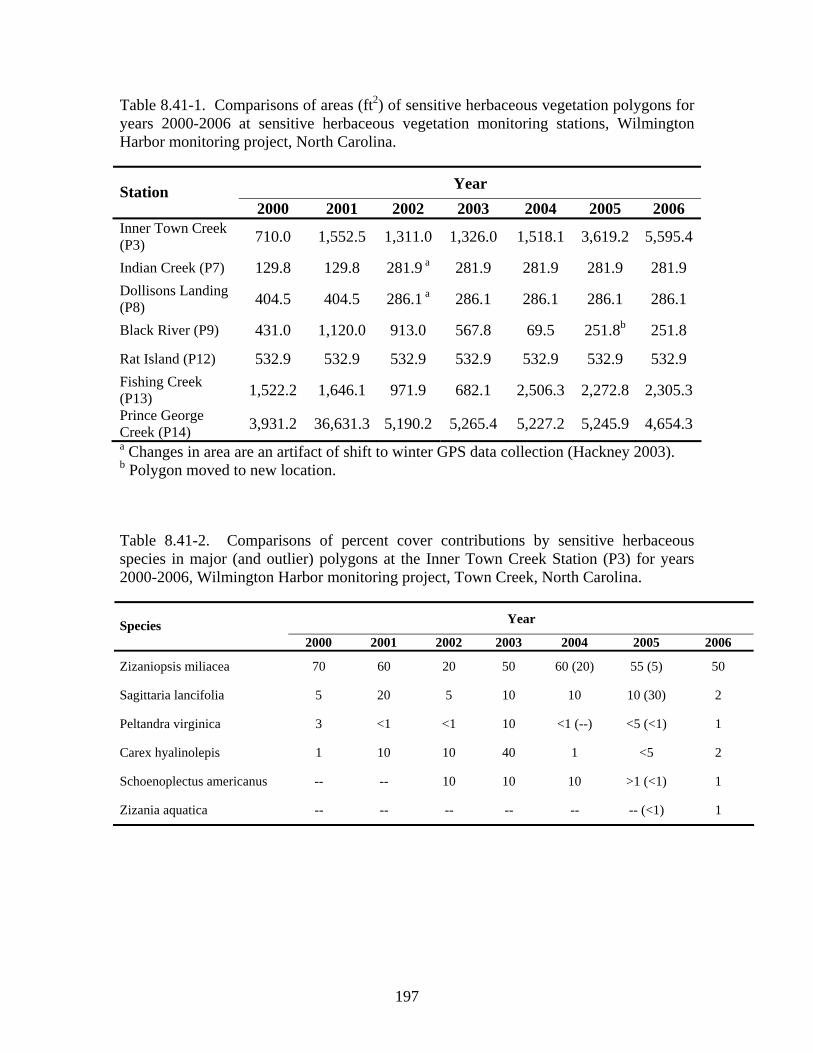
Table 8.41-1. Comparisons of areas (ft2) of sensitive herbaceous vegetation polygons for years 2000-2006 at sensitive herbaceous vegetation monitoring stations, Wilmington Harbor monitoring project, North Carolina.
Year Station 2000 2001 2002 2003 2004 2005 2006
Inner Town Creek (P3) 710.0 1,552.5 1,311.0 1,326.0 1,518.1 3,619.2 5,595.4
Indian Creek (P7) 129.8 129.8 281.9 a 281.9 281.9 281.9 281.9 Dollisons Landing (P8) 404.5 404.5 286.1 a 286.1 286.1 286.1 286.1
Black River (P9) 431.0 1,120.0 913.0 567.8 69.5 251.8b 251.8
532.9 532.9 532.9 532.9 532.9 532.9 532.9 Rat Island (P12) Fishing Creek (P13) 1,522.2 1,646.1 971.9 682.1 2,506.3 2,272.8 2,305.3 Prince George Creek (P14) 3,931.2 36,631.3 5,190.2 5,265.4 5,227.2 5,245.9 4,654.3 a Changes in area are an artifact of shift to winter GPS data collection (Hackney 2003). b Polygon moved to new location. Table 8.41-2. Comparisons of percent cover contributions by sensitive herbaceous species in major (and outlier) polygons at the Inner Town Creek Station (P3) for years 2000-2006, Wilmington Harbor monitoring project, Town Creek, North Carolina.
Year Species 2000 2001 2002 2003 2004 2005 2006
Zizaniopsis miliacea 70 60 20 50 60 (20) 55 (5) 50
Sagittaria lancifolia 5 20 5 10 10 10 (30) 2
Peltandra virginica 3 <1 <1 10 <1 (--) <5 (<1) 1
Carex hyalinolepis 1 10 10 40 1 <5 2
Schoenoplectus americanus -- -- 10 10 10 >1 (<1) 1
Zizania aquatica -- -- -- -- -- -- (<1) 1
197

198

Occurrences of other species within and outside the polygon are also changing. Spartina cynosuroides, which has been present within the polygon for the last two years, now dominates an area along the southwestern edge of the polygon at the corner of the creek and the old irrigation ditch (Figure 8.41-1). This species also occurs interspersed with Zizaneopsis miliacea along the bank of Town Creek.
Along the southern half of the levee, several species have not yet disappeared from the remnants of the old swamp forest. Taxodium ascendens stems were killed by the last major salinity event in 2001and 2002. Rosa palustris is almost dead, but a few stems are still alive. Baccharis halimifolia had invaded several years ago before the inception of this project and is now diminishing. Morella cerifera is still present. Ampelopsis arborea, Parthenocisus quinquifolius and Toxicodendron radicans are surviving.
During the past year monthly salinity values in Town Creek averaged greater that 16 ppt from June to November of 2005 and just over 7 from December of 2005 to July of 2006. The monthly average during September was just over 19 ppt. The mean for November was almost 31 ppt. The yearly average of maximum salinity values in Town Creek (Hackney 2006 and additional data provided by Dr. Lynn Leonard for June and July 2006) roughly place the salinity for the period prior to vegetation sampling in the medium mesohaline range (5-18 ppt, Cowardin, et al. 1979). Monthly mean salinity highs of 19.2 ppt in September and 30.7 ppt in November may or may not have had any significant effect on existing vegetation since these values were realized at the close of the growing season. Neither surface salinity (conductivity) data collected from substations near Town Creek nor biogeochemical data (chloride) indicate clearly that these riverine salinity events influenced adjacent wetlands (Hackney 2006).
8.42 Indian Creek
The combination of a low levee along the Cape Fear River and presence of flood plain forest species lends this site certain characteristics of a brown water flood plain. Dominant swamp forest species dictate the character of a southeastern coastal swamp. Essentially both characteristics combine in a diminishing order as one progresses up stream. Further up stream, characteristics of an alluvial flood plain paralleling a brown water river rising in the piedmont become more abundant as the characteristics of a tidal swamp forest diminish. Species that occupy both flood plain and tidal swamp forests are common in the sensitive herbaceous polygon at this site. However, as time has passed and the pedestrian traffic has continued through the site, both groups have deteriorated (Table 8.42-1, Figure 8.42-1). The polygon was located in an area that was prone to erosion.
Saururus cernuus has declined after a maximum cover during the 2004 sampling year. Polygonum virginicum has disappeared from within the plot, but was seen this year just outside. Phanopyrum gymnocarpum, Chasmanthium latifolium (typically a flood plain forest species), and Hymenocallis crassifolia have increased. Hymenocallis may seem more abundant because of the increasing lack of cover throughout the plot and
199
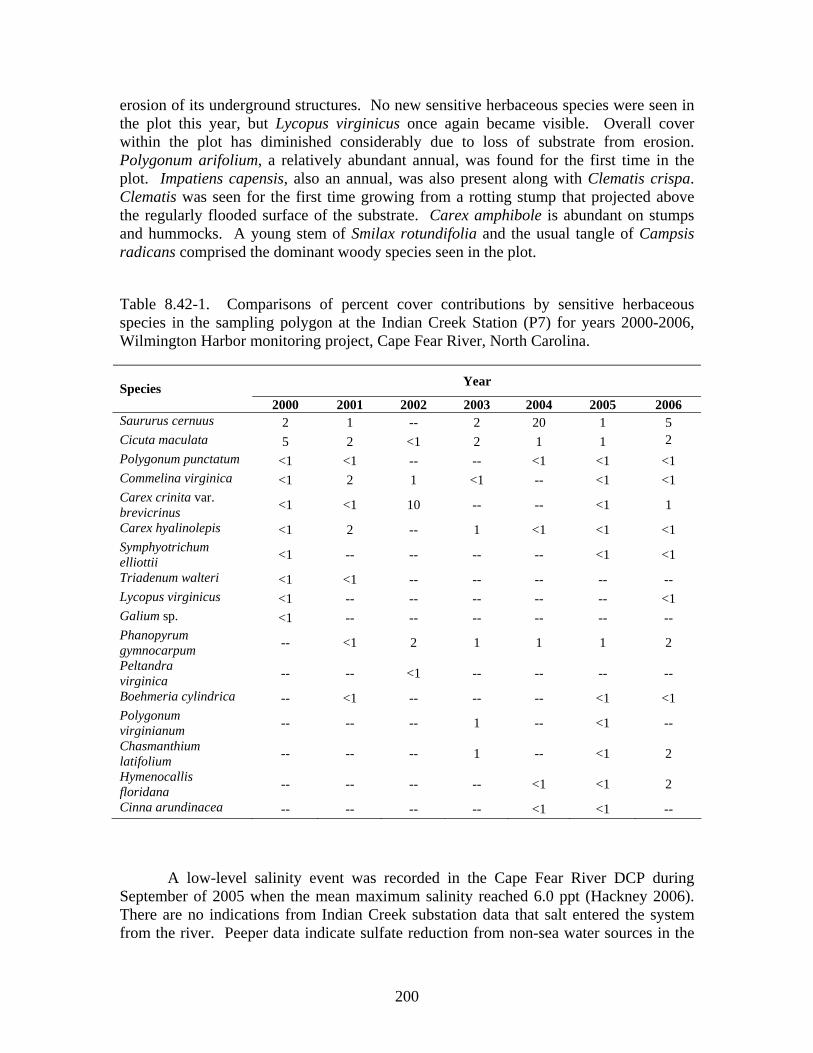
erosion of its underground structures. No new sensitive herbaceous species were seen in the plot this year, but Lycopus virginicus once again became visible. Overall cover within the plot has diminished considerably due to loss of substrate from erosion. Polygonum arifolium, a relatively abundant annual, was found for the first time in the plot. Impatiens capensis, also an annual, was also present along with Clematis crispa. Clematis was seen for the first time growing from a rotting stump that projected above the regularly flooded surface of the substrate. Carex amphibole is abundant on stumps and hummocks. A young stem of Smilax rotundifolia and the usual tangle of Campsis radicans comprised the dominant woody species seen in the plot.
Table 8.42-1. Comparisons of percent cover contributions by sensitive herbaceous species in the sampling polygon at the Indian Creek Station (P7) for years 2000-2006, Wilmington Harbor monitoring project, Cape Fear River, North Carolina.
Year Species 2000 2001 2002 2003 2004 2005 2006
Saururus cernuus 2 1 -- 2 20 1 5 Cicuta maculata 2 5 2 <1 2 1 1 Polygonum punctatum <1 <1 -- -- <1 <1 <1 Commelina virginica <1 2 1 <1 -- <1 <1 Carex crinita var. brevicrinus <1 <1 10 -- -- <1 1
Carex hyalinolepis <1 2 -- 1 <1 <1 <1 Symphyotrichum elliottii <1 -- -- -- -- <1 <1
Triadenum walteri <1 <1 -- -- -- -- -- Lycopus virginicus <1 -- -- -- -- -- <1 Galium sp. <1 -- -- -- -- -- -- Phanopyrum gymnocarpum -- <1 2 1 1 1 2
Peltandra -- -- <1 -- -- -- -- virginica Boehmeria cylindrica -- <1 -- -- -- <1 <1 Polygonum virginianum -- -- -- 1 -- <1 --
Chasmanthium latifolium -- -- -- 1 -- <1 2
Hymenocallis floridana -- -- -- -- <1 <1 2
Cinna arundinacea -- -- -- -- <1 <1 --
A low-level salinity event was recorded in the Cape Fear River DCP during September of 2005 when the mean maximum salinity reached 6.0 ppt (Hackney 2006). There are no indications from Indian Creek substation data that salt entered the system from the river. Peeper data indicate sulfate reduction from non-sea water sources in the
200

winter sample (Hackney 2006). However, a September spike in salinity was documented at the shoreward substation for Eagles Island and may also have been detected had sampling equipment been used on a monthly basis at the Indian Creek Station (Hackney 2006). It is unlikely that this late growing season minor event had any effect on vegetation growth during the 2006 growing season. The most severe limitations on growth of sensitive herbaceous vegetation (and other vegetation) most likely resulted from continued erosion of substrate within the sample plot.
201

202

As of early January in, 2007 the Indian Creek tidal swamp forest was being selectively cut from the southwestern bluff to the river’s edge. The clearing operation being undertaken by an unknown party included swamp forest bordering an old ditch near the mouth of Indian Creek and extended east and northeast beyond the monitoring station for almost a half mile down stream. This clearing process currently involves most vegetation with the exception of larger cypress (Taxodium ascendens), which are being avoided. Many of the straighter trees (Fraxinus spp., Acer rubrum, Nyssa biflora, and some smaller cypress) with sufficiently large trunks are being trimmed and laid in the swamp to form a corduroy road that may connect with the mainland bluff to the east. This road extended from the western bluff to near the natural levee, passing parallel to the levee and along the river east past the station belt transect. The remaining wood felled was being cut and carried with human labor to the adjacent bluff. For purposes of the current project the current Indian Creek site has little further usefulness. It would become difficult to distinguish progressive river changes from the effects of clearing. Continued monitoring to follow the wake of the human modifications at the site might be instructive. However, construction of an additional monitoring site may in order since this is a rather critical part of the river potentially subject to change given significant modifications in salinity or flooding resulting from deepening of the Cape Fear River for Wilmington Harbor. Selection of a second monitoring site for the area will have to consider the final limits and potential effects of these new developments.
8.43 Dollisons Landing
The sensitive herbaceous vegetation sample plot associated with the Dollisons Landing station (P8) is a fixed plot (Table 8.43-1). This sample plot showed little variation that could be considered directly an effect of salinity or flooding (Figure 8.43-1). Two new species have appeared in the plot Hydrocotyle verticillata and Lycopus virginicus. Both species are characteristic of wooded freshwater wetlands, but the former is usually in non-tidal habitats and the latter is often associated with low hummocks or rotten stumps. Saururus cernuus contributes somewhat less cover this year than in most recently past years. Reasons for this decrease in cover and the other minor variations in sensitive herbaceous species occurrences are unknown. Eryngium aquaticum has again appeared in the plot, but remains at a low level of contributed cover. The species has likely been present as rhizome material and is representative of a group of species that occurs in freshwater systems but seems preconditioned to thrive in brackish conditions should they occur.
A low-level spike in salinity (5.4 ppt, expressed as a mean of the maximum readings for the month) was documented at the Dollisons Landing DCP during September of 2005 (Hackney 2006). It is uncertain if this spike was experienced in any way at near-shore substations. The effect, if any, of this spike on the 2006 growing season is unknown.
203

Table 8.43-1. Comparisons of percent cover contributions by sensitive herbaceous species in the sampling polygon at the Dollisons Landing Station (P8) for years 2000-2006, Wilmington Harbor monitoring project, Cape Fear River, North Carolina.
Year Species 2000 2001 2002 2003 2004 2005 2006
Saururus cernuus 30 20 35 35 40 50 30
Boehmeria cylinidrica <1 -- <1 <1 1 <1 <1
Rumex verticillatus <1 -- 2 2 <1 <1 --
Cicuta maculata 2 -- 2 2 <1 <1 <1
Carex sp. 1 -- -- -- -- -- --
Polygonum punctatum 1 1 3 3 -- <1 1
Peltandra virginica 2 1 3 3 <1 1 1
Carex crinita <1 2 -- -- -- -- --
Dulichium arundinaceum <1 -- -- -- -- -- --
Triadenum walteri <1 -- -- -- -- -- --
Eryngium aquaticum -- 3 1 1 -- -- <1
Pontederia cordata -- <1 -- -- -- <1 <1
Hymenocallis floridana -- -- <1 <1 <1 -- --
Alternanthera philoxeroides -- -- <1 <1 -- -- --
Proserpinaca palustris -- -- -- -- <1 -- --
Ipomoea sp. -- -- -- -- <1 -- --
Hydrocotyle verticillata -- -- -- -- -- -- 1
Lycopus virginicus -- -- -- -- -- -- <1
204

205

8.44 Black River
Information included in the following table represents data obtained from both old and new sensitive herbaceous vegetation plots at Black River (P9). The data from 2005 and 2006 are most current and do not represent the previous variable plot which has now been abandoned (Table 8.44-1, Figure 8.44-1). The species compositions of the old and new plots are similar. The old plot will no longer be monitored.
The loss of Ludwigia palustris from the new plot is not surprising considering the mobility of this species within the old plot. Boehmeria cylindrica has appeared in the new plot as has Cicuta maculata. Physostegia leptophylla was not present this year. Saururus cernuus remains the dominant species.
Changes resulting from salinity events have not been noted from this plot, and no significant changes in cover have occurred since last year.
Table 8.44-1. Comparisons of percent cover contributions by sensitive herbaceous species in old polygons from years 2000-2004 and new sensitive herbaceous polygon for 2005 and 2006 at the Black River (P9), Wilmington Harbor monitoring project, Cape Fear River, North Carolina (plots relocated in 2005 and 2006, designated with a superscript aby the year designation)..
Year Species a a2000 2001 2002 2003 2004 2005 2006
Ludwigia palustris 50 20 20 1 5 5 --
Polygonum punctatum -- 15 1 -- 1 <1 <1
Symphyotrichum elliottii -- 2 <1 1 <1 <1 <1
Scutellaria lateriflora -- -- <1 -- -- -- --
Boehmeria cylindrical -- -- <1 -- <1 -- <1
Saururus cernuus -- -- -- -- -- 10 10
Physostegia leptophylla -- -- -- -- -- <1 --
Peltandra virginica -- -- -- -- -- <1 1
Cicuta maculate -- -- -- -- -- -- <1 aPlot relocated in 2005
206

207

8.45 Rat Island
The sensitive herbaceous polygon at the Rat Island (P12) sampling station remains the same size and shape as in previous years (Figure 8.45-1). The overall cover by live sensitive herbaceous species has decreased (Table 8.45.1). Stems of Schoenoplectus americanus cover half of the polygon, but many appear dead this year. Stems are brown and laying horizontally on the substrate. Those that are erect show signs of stress and have brown spots scattered over their surfaces. Stem death could have resulted from continued salt intrusion, competition for light, or both.
The maximum monthly salinity levels have averaged 11.4 ppt between August of 2005 and July of 2006, the month just prior to sampling (Hackney 2006 and additional data provided by Dr. Lynn Leonard for June and July 2006). This value places the salinity for the period prior to sampling roughly in the medium mesohaline range, 5-18 ppt, the same as last year, but last year’s average was slightly lower (10.31 ppt). Maximum salinity values at the substation nearest the river during spring of 2006 most nearly approximated the oligohaline range, 0.5-5.0 ppt (Cowardin et al. 1979). As could be expected, the surface substrate at the substation nearest the sensitive herbaceous vegetation plot showed sulfate oxidation during summer and sulfate oxidation later in the winter (Hackney 2006).
Additional species contributing significantly to the over all cover within the polygon, Carex hyalinolepis and Sagittaria lancifolia, apparently have expanded their cover slightly over 2005. However, this apparent increase may be an artifact of increased visibility. Peltandra virginica again became visible from the rootstocks that have maintained a presence in the plot. Corms of Hymenocallis floridana are still visible. It is not known if the latter species is still flowering in the plot during the spring.
Spartina cynosuroides, though not a sensitive herbaceous species, continues to maintain 50% of the cover within the plot as noted last year. The major dominance prevails along the outer, eastern edges of the plot along the Northeast Cape Fear River. It appears to be moving west as well, outside of the plot. Pluchea odorata and Schoenoplectus tabernaemontani were noted in the plot, but only as one or two scattered individuals. A few scattered stems of Rumex verticillata, Alternanthera philoxeroides, and Zizania aquatica were noted west of and outside the plot, but did not appear healthy. The Zizania stem had been grazed by insects and was depauperate. Polygonum arifolium, an annual, and Typha angustifolia were both noted outside the plot, rare and in poor condition.
The rhizomes of Schoenoplectus americanus and Spartina cynosuroides compete for space within the substrate. As conditions favor the latter, the former will appear to give way above the soil. Ultimately, the rhizomes of Schoenoplectus will fail to bud and subaerial stems will disappear, assuming a steady increase in salinity. It is possible that with the decrease in cover by live stems of Schoenoplectus americanus this year there will be a visible increase in cover by Spartina cynosuroides in 2007.
208

Table 8.45-1. Comparisons of percent cover contributions by sensitive herbaceous species in the polygon for years 2000-2006 at the Rat Island (P12), Wilmington Harbor monitoring project, Northeast Cape Fear River, North Carolina.
Year Speciesa
2000 2001 2002 2003 2004 2005 2006
Schoenoplectus americanus 100 20 30 50 25 90 50
Carex hyalinolepis 20 8 10 <1 2 <1 2
Sagittaria lancifolia 10 30 -- 5 10 <1 5
Alternanthera philoxeroides <1 -- <1 -- -- -- --
Boltonia asteroides <1 <1 -- -- -- -- --
Symphyotrichum subulatum <1 <1 <1 <1 -- -- --
Peltandra virginica -- 1 -- -- -- -- <1
Rumex verticillatus -- 1 -- -- -- -- --
Hymenocallis floridana -- <1 -- 1 <1 <1 <1
Polygonum punctatum -- -- -- -- <1 -- -- a Symphyotrichum tenuifolium was reconsidered as salt tolerant and removed from the table.
209

210

8.46 Fishing Creek
This year the simple diversity of the Fishing Creek sensitive herbaceous species polygon has increased to 22 species, the highest of all the stations. This amounts to two more species than accounted for last year (Table 8.46-1). The sensitive herbaceous species polygon demonstrates a shape and size similar to those of past years (Figure 8.46-1 and Table 8.41-1). Apparent changes in size and shape are largely GPS data artifacts.
Table 8.46-1. Comparisons of percent cover contributions by sensitive herbaceous species in polygons from years 2000-2006 at the Fishing Creek Station (P13), Wilmington Harbor monitoring project, Northeast Cape Fear River, North Carolina.
Year Species 2000 2001 2002 2003 2004 2005 2006
Pontederia cordata 20 40 50 30 30 35 20 Symphyotrichum elliottii <1 -- -- -- -- 1 -- Polygonum punctatum 2 1 -- <1 10 2 3 Sium suave <1 2 5 1 1 -- 2 Zizaniopsis miliacea 2 <1 <1 5 5 <1 -- Saururus cernuus 2 2 -- 1 5 1 1 Cicuta maculata <1 2 -- -- 1 1 <1 Sagittaria lancifolia 2 20 5 20 5 1 3 Orontium aquaticum <1 -- -- -- -- -- -- Peltandra virginica <1 1 5 30 12 5 25 Rhynchospora corniculata <1 <1 -- -- <1 -- <1 Carex sp. <1 -- -- -- -- -- -- Alternanthera philoxeroides -- 5 <1 <1 -- 1 <1 Zizania aquatica -- 2 <1 50 <1 <1 <1 Boltonia asteroides -- 1 -- -- <1 <1 <1 Rumex verticillatus -- <1 2 1 -- <1 <1 Cinna arundinacea -- <1 -- <1 <1 -- <1 Eryngium aquaticum -- <1 5 2 2 5 2 Schoenoplectus americanus -- -- <1 -- -- -- -- Carex hyalinolepis -- -- -- 1 -- -- -- Apios americana -- -- -- <1 <1 <1 <1 Hymenocallis floridana -- -- -- 2 -- -- -- Ludwigia palustris -- -- -- <1 <1 -- <1 Hypericum mutilum -- -- -- -- <1 -- -- Boehmeria cylindrica -- -- -- -- <1 <1 <1 Lycopus virginicus -- -- -- -- -- <1 <1 Lycopus virginicus -- -- -- -- -- <1 <1 Cyperus sp. -- -- -- -- -- <1 -- Elymus virginicus -- -- -- -- -- <1 -- Lobelia cardinalis -- -- -- -- -- -- <1 Carex crus-corvi -- -- -- -- -- -- <1 Bidens laevis -- -- -- -- -- -- <1 Mikania scandens -- -- -- -- -- -- <1
211

212

Pontederia cordata, long the dominant sensitive herbaceous species at the site, now exhibits less cover than Peltandra virginica. From 2000 Peltandra virginica increased irregularly in cover until this year when it became dominant in the plot. During 2003 the two contributed the same cover within the polygon. During 2004, following the rebound from the previous salinity event, Pontederia cordata became less abundant than Zizania aquatica. Zizania has not since shown such subaerial prevalence.
The average of the mean monthly maximum salinity readings between September 2005 and July 2006 from the Northeast Cape Fear River at Fishing Creek station is about 4.4 ppt (Hackney 2006 and supplemental water data obtained from Lynn Leonard). This average is somewhat higher than the same average for last year, which was 2.7 ppt. The difference is due largely to a spike in salinity that extended up the Northeast Cape Fear River during September and October of 2006. Maximum values for these months were 16.7 ppt and 13.7 ppt, respectively. An equally important salinity value for the period was the average monthly minimum value for the month of October, 2005. This value was 8.5 ppt. Such a value indicates that mean salinity levels at Fishing Creek did not decrease for an appreciable time during the month of October. In the winter of 2006, substation peeper sampling detected non-seawater sulfate reduction just below the surface (Hackney 2006).
Salinity regimes for the months September and October of 2005 may have had a significant influence on the growth of sensitive herbaceous plant species during the 2006 growing season. These regimes could have been responsible for the decrease in Pontederia cordata subaerial cover in the sensitive herbaceous species polygon this year as well as the increase in cover by Peltandra virginica. The shift in dominance is significant. These salinity highs occurred during periods of low freshwater flow along the Northeast Cape Fear River as well as along the main stem of the estuary when daily minimum discharge was below zero cubic feet per second (Figure 8.46-2). Such periods of low flow and the subsequent adjustments in vegetative cover will be the important events to monitor for clues to future changes in tidal swamp forest habitat in the lower Cape Fear River Estuary. An increase in diversity and a slight shift in dominance may indicate a subsequent shift toward a more saline environment.
Other notable species present at this station include Impatiens capensis, an annual that occupied nearly 50 percent of the polygon last year. This year the plants constitute about 10 percent of the cover within the polygon. Since this species likely requires nearly freshwater conditions for germination and growth, it is possible that either seed cast, germination or early growth were truncated by some factor or set of factors late during the 2005 growing season or the first part of the 2006 growing season. Multi-annual counts of various stages of annual species could be instructive in determining the effects of salinity and or flooding events could be instructive. Periodicity of alternate freshwater and saline water flooding may have a profound influence in vegetation that exists opportunistically from year to year.
Seedlings of Taxodium ascendens were seen within the sensitive herbaceous polygon this year. This occurrence seems to indicate that salinity conditions had not been
213

sufficiently severe as to retard germination and early growth of that species during the early part of the 2006 growing season. However, Lilaeopsis chinensis, a broadly mesohaline species, still occupies exposed organic mud flats at the site. Otherwise, the site is best characterized as an oligohaline habitat.
Figure 8.46-2. River flow along the Northeast Cape Fear River at the NC 53 bridge near Burgaw, NC (http://waterdata.usgs.gov/nc/nwis/uv/?site_no=02108566&PARAmeter_cd=00065,00060) 8.47 Prince George Creek
Shape, size, and species content of the sensitive herbaceous vegetation polygon at Prince George Creek have remained similar since 2005 (Table 8.47-1, Figure 8.47-1). Most apparent changes in shape and size of the polygon are artifacts of GPS data aberrations.
Saururus cernuus has increased in its contribution of total cover since last year following a year with few or no salinity events. The salinity event seen in September of 2005 at lower reaches of the Northeast Cape Fear River was manifested at the Prince
214

George Creek station as a slight spike at a mean of 0.8 ppt for the month (Hackney 2006). This is considered scarcely significant. Peltandra virginica is denser at this station than it has ever been. Reasons for this increase in cover are unknown.
Table 8.47-1. Comparisons of percent cover contributions by sensitive herbaceous species in polygons from years 2000-2006 at the Prince George Creek Station (P14), Wilmington Harbor monitoring project, Northeast Cape Fear River, North Carolina.
Year Species 2000 2001 2002 2003 2004 2005 2006
Saururus cernuus 35 60 20 40 40 20 50 aPolygonum punctatum 20 15 -- <1 20 30 10
Peltandra virginica 10 8 1 5 10 5 30 Pontederia cordata -- 5 -- -- <1 -- <1 Cicuta maculata -- <1 <1 <1 -- -- <1 Zizania aquatica -- <1 -- -- -- -- -- Cinna arundinacea -- <1 -- -- <1 <1 <1 Boehmeria cylindrica -- <1 <1 -- -- 1 -- Carex lupulina -- <1 <1 -- -- -- -- Alternanthera philoxeroides -- -- <1 -- -- -- --
Decodon verticillatus -- -- <1 <1 <1 <1 <1 Hymenocallis floridana -- -- <1 <1 1 1 1 Zizaniopsis miliacea -- -- -- <1 <1 <1 <1 Triadenum walteri -- -- -- <1 -- -- -- Hydrocotyle sp. -- -- -- -- <1 -- <1 Lobelia cardinalis -- -- -- -- -- <1 -- Ludwigia palustris -- -- -- -- -- -- <1 a Previously identified as Polygonum hydropiper and Polygonum hydropiperoides.
Simple diversity stands at 11 species and is the highest yet seen at this station. Reasons for this increase in diversity may relate to frequent human traffic in the area as well as general site disturbance. Apparent increases in diversity could also relate, at least in part, to an increase in visibility at the site due to familiarity. The newest addition to sensitive herbaceous species at the site is Ludwigia palustris. The mobility of this species is related to flooding conditions and the release of propagules.
215
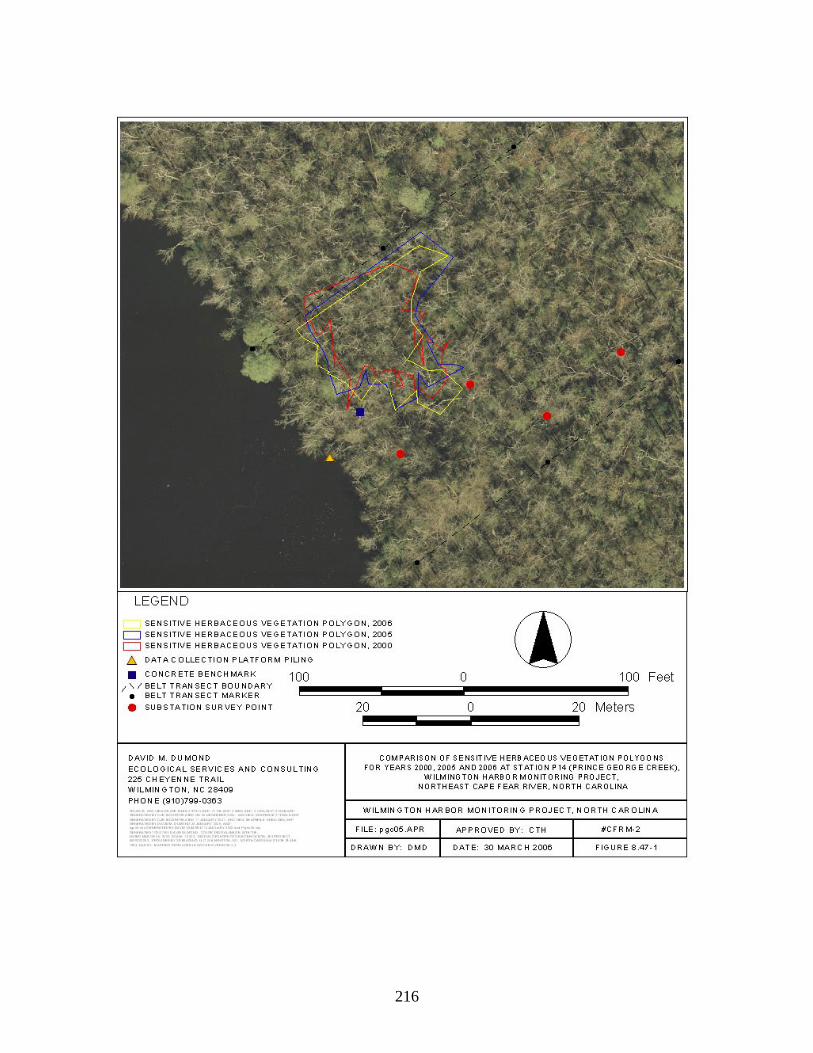
216

8.5 Discussion
The sensitive herbaceous vegetation data for this sampling year are not outstandingly different from those of the previous year. However, it will be worth while to briefly discuss some factors which may have roles in shaping the data. These factors deal with collection of GPS data, the nature of the minor salinity events, increases in diversity and the periodic visibility of species.
Methods for collection of GPS data have been discussed in previous reports. Points at the ends of straight-line segments of a polygon are marked during summer by placement of polyvinyl chloride (pvc) stakes. These segments mark the sides of a polygon and the boundaries of a community of sensitive herbaceous species (that may as well include other species). Data for GPS gathered during the following winter at each point. The signals reaching the antenna seem to be subject to bounce and deflection by wetland vegetation resulting in the collection of aberrant data. The deflection is thought to be caused by woody vegetation because aberrant points do not generally appear in data gathered in habitats not dominated by trees.
To date GPS data have been gathered using signals from the nearest US Coast Guard DGPS beacon which differentially corrects satellite data and broadcasts correction signals. NAVCEN or Navigation Center operates the Coast Guard Maritime Differential GPS (DGPS) Service and the developing Nationwide DGPS Service, consisting of over 60 remote broadcast sites. The Service broadcasts correction signals on marine radio-beacon frequencies to improve the accuracy of and integrity to GPS-derived positions (http://www.navcen.uscg.gov/misc/ directions.htm).
The habitats with the most trees seem to demonstrate the most aberrant data. The results of this bounce are points in the data set that show unexpected deviations from the real situation. All points in a data set may show some degree of aberration, rendering the entire data set questionable for the purposes intended. A mapped polygon that exhibits acute angular projections to points along its sides is symptomatic of poorly received data. The aberrations usually result in point locations that deviate two to three meters from their expected positions.
In short, use of map-grade DGPS data in swamp forest situations can not be considered a satisfactory tool to define changing boundaries of sensitive herbaceous vegetation plots. It is not known if post processing of direct satellite data will correct the problem. This method of GPS data collection will be employed next year. However, post processing DGPS data has had little or no effect on correction of the aberrations.
A salinity event (as defined in Hackney et al. 2003) may have briefly influenced salt concentrations in both the Cape Fear and the Northeast Cape Fear Rivers. Past salinity events detected during the course of the current project have occurred during periods of low river flow. The short-term salinity event that occurred during September and October of 2005 has been documented in river flow records at both Lock and Dam Number One (Hackney 2006) and at the US Geological Survey station on the Northeast
217

Cape Fear River (see Figure 8.5-1 in Hackney et al. 2006). The lowest periods of daily minimum discharge occurred in September and October 2005. This salinity event was followed by a pulse of freshwater through the Northeast Cape Fear River, most likely due to precipitation in the watershed. This salinity event constitutes only a minor adjustment in the general quantity of the river flow. However, the quality of the flow, or its periodicity, relative to the course of the growing season may have had some effect at Fishing Creek. The slight increase in diversity and the slight shift in dominance could represent the first change of a slightly higher salinity regime.
Time-related changes in species presence at the Fishing Creek and Prince George Creek polygons as well as the periodic appearance and disappearance of species may be due to one or more of three phenomena. Movements of annuals (and assumedly mobile perennials) are subject to activities of various vectors including wildlife and humans, wind and water flow. Water in particular is capable of moving plant diaspores in and out of the system depending on tides and floods. The salinity of these flood waters influences later growth and survival of seeds and vegetative diaspores. A brackish water inundation in fall or winter can have different effects than one in mid summer. All these characteristics seem to work in unison to elevate diversity, one of the possible indices of potential change in mildly brackish systems.
Tidal distribution of plant diaspores is likely very important in tidal habitats and add, possibly measurably, to the chaotic nature of tidal systems and the absence of predictable successional development. Human activities promote disturbance of substrates while humans as diaspore vectors increase both establishment and movement of species.
Rhizome-based plant species, particularly herbaceous species, perennate for periods with no obvious subaerial structures. The functions of such habits remain unclear, but are assumed to allow the plants to survive through unfavorable conditions. Appearance and disappearance of above-ground structures of such plants is the perceived result of the salt content of flood waters.
218

9.0 LITERATURE CITED Clarke, K.R. and R.N. Gorley. 2001. PRIMER v5: User Manual / Tutorial. PRIMER-E: Plymouth, United
Kingdom. CZR Incorporated. 2001. Monitor Potential Effects of Increased Tidal Range on the Cape Fear River
Ecosystem Due to Deepening Wilmington Harbor, North Carolina. Part B. Initial Baseline Monitoring. Prepared for U. S. Army Corps of Engineers, Wilmington District, Wilmington, NC.
Hackney, C. T., M. Posey, L.L. Leonard, T Alphin, G.B. Avery Jr., and others. 2002a. Monitoring Effects
of a Potential Increased Tidal Range in the Cape Fear River Ecosystem Due to Deepening Wilmington Harbor, North Carolina Year 1: August 1, 2000 – July 31, 2001. Unpublished report prepared for the U. S. Army Corps of Engineers, Wilmington District. University of North Carolina at Wilmington Department of Biological Sciences, Wilmington, NC.
Hackney, C. T., M. Posey, L.L. Leonard, T Alphin, G.B. Avery Jr., and others. 2002b. Monitoring Effects
of a Potential Increased Tidal Range in the Cape Fear River Ecosystem Due to Deepening Wilmington Harbor, North Carolina Year 2: June 1, 2001 – May 31, 2002. Unpublished report prepared for the U. S. Army Corps of Engineers, Wilmington District. University of North Carolina at Wilmington Department of Biological Sciences, Wilmington, NC.
Hackney, C. T., M. Posey, L.L. Leonard, T Alphin, G.B. Avery Jr., and others. 2003. Monitoring Effects
of a Potential Increased Tidal Range in the Cape Fear River Ecosystem Due to Deepening Wilmington Harbor, North Carolina Year 3: June 1, 2002 – May 31, 2003. Unpublished report prepared for the U. S. Army Corps of Engineers, Wilmington District. University of North Carolina at Wilmington Department of Biological Sciences, Wilmington, NC.
Hackney, C. T., M. Posey, L.L. Leonard, T Alphin, G.B. Avery Jr., D.M. DuMond, and others. 2005.
Monitoring Effects of a Potential Increased Tidal Range in the Cape Fear River Ecosystem Due to Deepening Wilmington Harbor, North Carolina Year 4: June 1, 2003 – May 31, 2004. Unpublished report prepared for the U. S. Army Corps of Engineers, Wilmington District. University of North Carolina at Wilmington Department of Biological Sciences, Wilmington, NC.
Hackney, C. T., Posey, L.L. Leonard, T Alphin, G.B. Avery Jr., D.M. DuMond, and others. 2006.
Monitoring Effects of a Potential Increased Tidal Range in the Cape Fear River Ecosystem Due to Deepening Wilmington Harbor, North Carolina Year 5: June 1, 2004 – May 31, 2005. Unpublished report prepared for the U. S. Army Corps of Engineers, Wilmington District. University of North Carolina at Wilmington Department of Biological Sciences, Wilmington, NC.
Hackney, C. T., Posey, L.L. Leonard, T Alphin, G.B. Avery Jr., D.M. DuMond, and others. 2007.
Monitoring Effects of a Potential Increased Tidal Range in the Cape Fear River Ecosystem Due to Deepening Wilmington Harbor, North Carolina Year 6: June 1, 2004 – May 31, 2005. Unpublished report prepared for the U. S. Army Corps of Engineers, Wilmington District. University of North Carolina at Wilmington Department of Biological Sciences, Wilmington, NC.
Hesslein, R.H. 1976. An in situ sampler for close interval pore water studies. Limnology and
Oceanography 21:912-914. Hoehler, T.M., M.J. Alperin, D.B. Albert and C.S. Martens. 1994. Field and laboratory studies of methane
oxidation in an anoxic marine sediment: Evidence for a methanogen-sulfate reducer consortium. Global Biogeochemical Cycles 8:451-463.
219

Kartesz, J.T., and C.A. Meacham. 1999. Synthesis of the North American Flora, Version 1.0. North Carolina Botanical Garden, Chapel Hill, NC.
Kelley, C.A., C.S. Marten, and W. Ussler III. 1995. Methane dynamics across a tidally flooded riverbank
margin. Limnology and Oceanography 40:1112-1129. Mallin, M., M. Posey, G. Shank, M. McIver, S. Ensign, and T. Alphin. 1999. Hurricane effects on water-
quality and benthos in the Cape Fear watershed: Natural and anthropogenic impacts. Ecological Applications 9(1): 350-362.
Mallin, M., M.H. Posey, T.E. Lankford, M.R. McIver, S.H. Ensign, T.D. Alphin, M.S. Williams, M.L. Moser, and J.F. Merritt. 2001. Environmental assessment of the lower Cape Fear River system 2000-2001. CMS Report No. 01-02.
Mitsch, W. J and J. M. Gosselink. 1993. Wetlands. Van Nostrand Reinhold. New York. Pawlowicz, R., B. Beardsley, and S. Lentz. 2002. Classical tidal harmonic analysis including error
estimates in MATLAB using T_TIDE. Computers and Geosciences 28: 929-937.
220

APPENDIX A
LIST OF TIDAL RANGE DATA FOR ALL 14 STATIONS USED TO GENERATE FIGURES AND TABLES IN
SECTION 3.0 (1 June 2006 – 31 May 2007)

222
Appendix A. List of tidal range data for all 14 stations used to generate figures and tables in Section 3.0. Station P01 P02 P03 P04 P06 P07 P08 P09 P11 P12 P13 P14
1 3.97 4.32 3.07 4.41 3.92 3.97 xxx 3.55 4.25 3.84 3.38 2.64 2 3.34 3.84 2.79 4.02 3.57 3.61 xxx 3.22 3.88 3.51 3.08 2.38 3 3.04 3.53 2.59 3.60 4.00 3.33 xxx 2.97 3.54 3.22 2.86 2.26 4 3.68 4.06 2.91 4.07 4.05 3.77 xxx 3.40 3.98 3.62 3.22 2.58 5 3.67 4.06 2.87 4.18 3.68 3.75 xxx 3.31 4.01 3.62 3.17 2.46 6 3.04 3.57 2.62 3.77 3.38 3.40 xxx 3.01 3.62 3.30 2.92 2.27 7 2.89 3.25 2.43 3.42 3.64 3.15 2.93 2.82 3.38 3.04 2.68 2.07 8 3.29 3.59 2.64 3.68 4.02 3.41 3.17 3.05 3.63 3.28 2.89 2.24 9 3.81 3.98 2.86 4.08 3.60 3.78 3.52 3.39 3.99 3.60 3.19 2.47 10 3.37 3.55 2.59 3.65 3.54 3.35 3.10 2.98 3.59 3.21 2.83 2.20 11 2.99 3.52 2.58 3.52 3.64 3.33 3.10 2.99 3.52 3.20 2.86 2.33 12 3.29 3.63 2.64 3.65 3.62 3.42 3.18 3.06 3.61 3.29 2.92 2.33 13 3.2 3.55 2.68 3.72 3.81 3.39 3.19 3.08 3.61 3.30 2.96 2.41 14 3.15 3.76 2.79 3.91 3.42 3.60 3.41 3.35 3.79 3.48 3.14 2.57 15 2.94 3.37 2.43 3.45 3.22 3.20 2.96 2.83 3.41 3.08 2.71 2.10 16 3.03 3.18 2.44 3.22 3.72 3.00 2.77 2.65 3.21 2.89 2.57 2.00 17 3.49 3.67 2.79 3.70 4.20 3.54 3.36 3.26 3.69 3.41 3.11 2.57 18 3.88 4.18 2.94 4.20 3.76 4.04 3.78 3.65 4.17 3.88 3.44 2.80 19 3.32 3.75 2.55 3.81 3.39 3.55 3.24 3.09 3.76 3.43 2.97 2.28 20 3.03 3.33 2.39 3.43 3.70 3.16 2.91 2.79 3.38 3.06 2.70 2.10 21 3.32 3.64 2.66 3.77 4.09 3.47 3.25 3.15 3.67 3.37 3.02 2.40 22 3.74 4.13 2.96 4.19 3.73 3.85 3.63 3.50 4.07 3.73 3.34 2.69 23 3.46 3.82 2.50 3.83 3.29 3.47 3.23 3.06 3.70 3.32 2.90 2.18 24 2.84 3.25 2.22 3.33 3.72 3.03 2.79 2.65 3.26 2.91 2.55 1.91 25 3.24 3.62 2.63 3.73 4.50 3.50 3.30 3.15 3.68 3.34 3.01 2.42 26 4.17 4.60 3.00 4.58 4.05 4.24 3.96 3.80 4.47 4.03 3.58 2.78 27 3.86 4.18 2.57 4.13 3.38 3.72 3.39 3.19 4.02 3.55 3.06 2.22 28 2.9 3.33 2.26 3.41 3.77 3.11 2.84 xxx 3.35 2.98 2.61 1.94 29 3.45 3.75 2.65 3.82 4.48 3.52 3.51 xxx 3.74 3.40 3.01 2.34 30 4.51 4.62 3.05 4.58 4.36 4.18 3.89 3.72 4.46 4.01 3.52 2.70 31 xxx 4.48 2.72 4.40 3.38 3.92 3.54 3.28 4.31 3.77 3.19 2.20 32 xxx 3.29 2.17 3.37 3.80 2.97 2.61 2.42 3.30 2.89 2.43 1.69 33 xxx 3.69 2.74 3.88 4.92 3.53 3.27 3.18 3.73 3.41 3.07 2.52 34 4.84 4.98 3.28 5.08 4.58 4.58 4.27 4.10 4.86 4.38 3.88 3.02 35 4.65 4.67 2.86 4.73 3.66 4.10 3.70 3.43 4.52 3.97 3.35 2.34 36 3.35 3.61 2.41 3.73 4.10 3.26 2.90 2.70 3.60 3.18 2.70 1.92 37 3.77 4.07 2.93 4.24 5.18 3.83 3.54 3.39 4.06 3.70 3.30 2.59 38 5.2 5.30 3.43 5.39 4.73 4.81 4.47 4.27 5.06 4.63 4.06 3.09 39 4.91 4.85 2.91 4.84 3.53 4.19 3.76 3.47 4.66 4.08 3.40 2.29 40 3.44 3.52 2.34 3.56 3.99 3.10 2.74 2.53 3.47 3.06 2.57 1.75 41 3.87 4.03 2.90 4.10 5.16 3.71 3.44 3.11 3.95 3.61 3.21 2.55 42 5.52 5.40 3.48 5.38 4.97 4.77 4.42 4.21 5.12 4.60 4.02 3.09 43 5.51 5.19 3.08 5.18 3.96 4.39 3.90 3.58 4.90 4.26 3.53 2.37 44 3.92 3.93 2.56 4.03 4.18 3.48 3.07 2.84 3.88 3.40 2.83 1.92 45 4.18 4.16 2.98 4.25 5.21 3.81 3.47 3.15 4.12 3.72 3.24 2.20 46 5.53 5.34 3.48 5.42 5.17 4.77 4.38 4.01 5.16 4.63 4.01 2.76

Appendix A. (continued)
223
47 5.43 5.34 3.31 5.43 4.13 4.58 4.10 3.77 5.10 4.45 3.69 2.47 48 4.15 4.15 2.76 4.27 4.25 3.61 3.20 2.95 4.05 3.54 2.93 1.93 49 4.09 4.25 3.01 4.35 5.43 3.84 3.50 3.29 4.16 3.76 3.27 2.49 50 5.66 5.61 3.61 5.59 4.52 4.95 4.55 4.27 5.32 4.75 4.07 3.03 51 5 4.80 2.84 4.72 4.51 3.96 3.49 3.14 4.48 3.90 3.14 2.02 52 4.23 4.59 2.88 4.70 5.26 3.99 3.55 3.21 4.50 3.96 3.24 2.16 53 5.6 5.32 3.15 5.50 4.82 4.52 3.89 3.41 5.18 4.46 3.58 2.13 54 5.69 4.95 2.93 5.03 4.98 4.11 3.53 3.09 4.70 4.04 3.24 1.92 55 5.12 5.07 3.15 5.14 4.46 4.38 3.80 3.37 4.84 4.28 3.58 2.46 56 4.29 4.44 2.85 4.56 4.19 3.94 3.43 3.03 4.31 3.79 3.15 2.12 57 3.87 4.14 2.91 4.29 5.16 3.67 3.13 2.69 4.08 3.68 3.20 2.38 58 5.17 5.24 3.38 5.30 4.82 4.57 3.99 3.49 5.02 4.48 3.85 2.80 59 5.05 4.98 2.98 5.02 4.29 3.92 3.14 2.40 4.72 4.10 3.35 2.13 60 4.11 4.28 2.73 4.43 4.44 3.41 2.63 1.90 4.17 3.65 3.01 1.94 61 4.17 4.40 2.94 4.55 4.84 3.60 2.76 2.02 4.33 3.85 3.27 2.30 62 4.82 4.92 3.12 4.98 4.98 3.99 3.16 2.39 4.74 4.18 3.51 2.43 63 5.08 5.16 3.17 5.17 4.72 3.99 3.03 2.14 4.92 4.28 3.55 2.36 64 4.6 4.81 3.03 4.90 4.31 3.75 2.78 1.91 4.65 4.05 3.38 2.25 65 3.97 4.37 2.81 4.43 4.52 3.42 2.52 1.70 4.22 3.71 3.12 2.12 66 4.3 4.64 2.93 4.65 4.96 3.61 2.71 1.87 4.44 3.90 3.27 2.23 67 5.12 5.07 3.18 5.22 4.83 3.87 2.81 1.86 4.89 4.29 3.57 2.41 68 4.78 4.88 3.08 5.10 4.44 3.77 2.73 1.80 4.75 4.17 3.46 2.31 69 4.08 4.47 2.91 4.63 4.36 3.48 2.50 1.62 4.37 3.87 3.25 2.23 70 4.1 4.42 2.89 4.54 4.83 3.40 2.43 1.58 4.28 3.79 3.18 2.20 71 4.68 4.92 3.21 5.09 5.06 3.75 2.67 1.75 4.76 4.21 3.56 2.50 72 4.85 5.16 3.29 5.31 4.59 3.96 2.86 1.90 4.97 4.39 3.71 2.57 73 4.38 4.67 2.93 4.78 4.13 3.58 2.56 1.65 4.51 3.94 3.26 2.16 74 3.83 4.21 2.77 4.34 4.69 3.18 2.21 1.39 4.09 3.58 2.98 2.00 75 4.46 4.79 3.22 4.95 5.19 3.73 2.73 1.92 4.65 4.15 3.56 2.59 76 5.1 5.34 3.40 5.46 4.83 4.15 3.09 2.20 5.11 4.53 3.85 2.74 77 4.61 4.96 3.11 5.05 4.12 3.91 2.98 2.17 4.74 4.16 3.48 2.36 78 3.79 4.21 2.80 4.34 4.61 3.25 2.36 1.61 4.07 3.59 3.01 2.05 79 4.35 4.67 3.23 4.80 5.26 3.86 3.10 2.49 4.53 4.06 3.53 2.66 80 5.32 5.45 3.53 5.46 4.88 4.47 3.66 3.01 5.16 4.59 3.96 2.94 81 4.74 5.02 3.16 5.06 4.25 4.15 3.42 2.82 4.76 4.18 3.51 2.42 82 3.86 xxx 2.86 4.42 4.61 3.54 2.83 2.25 4.15 3.66 3.08 2.13 83 4.18 xxx 3.15 4.76 5.38 4.02 3.44 2.99 4.51 4.05 3.51 2.65 84 5.27 xxx 3.56 5.56 4.92 4.72 4.09 3.63 5.25 4.69 4.03 2.98 85 4.71 5.00 3.11 5.10 4.17 4.23 3.55 3.03 4.79 4.20 3.49 2.36 86 3.71 4.18 2.77 4.34 4.61 3.56 2.94 2.45 4.09 3.60 3.01 2.06 87 4.19 4.61 3.15 4.78 5.53 4.07 3.54 3.05 4.52 4.04 3.48 2.59 88 5.56 5.67 3.58 5.73 5.04 4.86 4.24 3.78 5.40 4.79 4.08 2.97 89 5.07 5.18 3.07 5.24 4.08 4.32 3.70 3.20 4.90 4.26 3.50 2.29 90 3.68 4.07 2.65 4.23 4.61 3.48 2.93 2.48 4.00 3.49 2.90 1.93 91 4.18 4.57 3.15 4.74 5.41 4.15 3.75 3.42 4.52 4.05 3.49 2.60 92 5.38 5.51 3.52 5.60 4.98 4.80 4.32 3.97 5.29 4.71 4.01 2.91 93 5.01 5.09 3.09 5.16 4.19 4.35 3.85 3.46 4.85 4.23 3.51 2.35 94 3.85 4.15 2.71 4.29 4.37 3.66 3.23 2.91 4.09 3.57 2.97 2.04

Appendix A. (continued)
224
95 4.08 4.31 2.95 4.43 5.05 3.93 3.56 3.28 4.26 3.82 3.30 2.40 96 5.07 5.12 3.29 5.17 4.84 4.55 4.13 3.81 4.92 4.40 3.79 2.71 97 4.86 4.97 2.98 5.00 4.22 4.23 3.72 3.34 4.72 4.12 3.42 2.25 98 3.76 4.18 2.68 4.31 4.22 3.72 3.28 2.94 4.10 3.60 3.01 2.00 99 3.98 4.25 2.80 4.33 5.01 3.77 3.34 2.99 4.11 3.66 3.12 2.23
100 5.12 5.18 3.20 5.15 4.72 4.47 3.97 3.59 4.86 4.31 3.65 2.58 101 4.85 4.86 2.74 4.87 3.94 4.00 3.40 2.90 4.57 3.96 3.22 1.99 102 3.68 3.92 2.44 4.05 4.29 3.30 2.78 2.30 3.85 3.34 2.72 1.72 103 3.98 4.25 2.77 4.39 4.89 3.79 3.29 2.87 4.19 3.73 3.14 2.18 104 4.83 4.96 3.05 5.04 4.83 4.34 3.79 3.35 4.75 4.22 3.55 2.46 105 4.64 4.89 2.88 4.99 3.98 4.20 3.58 3.08 4.68 4.08 3.34 2.14 106 3.52 3.95 2.48 4.11 3.96 3.43 2.86 2.40 3.88 3.38 2.77 1.76 107 3.48 3.94 2.66 4.07 4.70 3.53 3.11 2.76 3.87 3.43 2.93 2.08 108 4.54 4.78 3.02 4.84 4.56 4.20 3.73 3.36 4.57 4.05 3.45 2.45 109 4.29 4.60 2.75 4.70 4.07 3.97 3.45 3.01 4.40 3.82 3.14 1.98 110 3.55 4.02 2.50 4.19 3.83 3.54 3.06 2.64 3.95 3.44 2.84 1.84 111 3.33 3.85 2.50 3.92 4.18 3.41 3.05 2.54 3.72 3.27 2.72 1.80 112 3.87 4.29 2.69 4.29 4.29 3.72 3.33 2.97 4.06 3.58 2.98 1.97 113 3.97 4.37 2.68 4.39 3.90 3.76 3.29 2.88 4.17 3.62 2.99 1.90 114 3.42 3.90 2.45 3.97 3.62 3.41 2.98 2.58 3.79 3.28 2.71 1.70 115 3.26 3.57 2.38 3.70 3.91 3.24 2.84 2.49 3.52 3.10 2.60 1.73 116 3.68 3.88 2.52 3.99 4.20 3.50 3.08 2.73 3.79 3.34 2.79 1.87 117 3.74 4.20 2.75 4.30 3.87 3.69 3.23 2.80 4.08 3.61 3.02 2.02 118 3.22 3.85 2.57 3.97 3.55 3.39 2.94 2.52 3.77 3.32 2.78 1.85 119 2.95 3.50 2.38 3.61 3.73 3.16 2.74 2.39 3.46 3.05 2.58 1.79 120 3.21 3.69 2.45 3.79 3.97 3.33 2.91 2.55 3.63 3.20 2.70 1.87 121 3.43 3.96 2.69 4.09 3.89 3.52 3.05 2.65 3.87 3.41 2.88 1.98 122 3.25 3.88 2.63 4.01 3.42 3.45 2.98 2.68 3.80 3.36 2.84 1.95 123 2.99 3.50 2.31 3.48 3.34 3.04 2.62 2.25 3.35 2.95 2.43 1.59 124 2.95 3.43 2.29 3.38 3.88 2.95 2.53 2.17 3.27 2.89 2.39 1.58 125 3.3 3.86 2.72 3.97 4.09 3.48 3.05 2.67 3.79 3.38 2.91 2.06 126 3.5 4.12 2.77 4.18 3.51 3.68 3.25 2.86 3.99 3.53 3.02 2.11 127 2.98 3.52 2.34 3.53 3.12 3.12 2.72 2.37 3.40 2.96 2.46 1.61 128 2.54 3.06 2.18 3.17 3.79 2.75 2.35 2.01 3.03 2.66 2.21 1.46 129 3.05 3.74 2.71 3.88 4.28 3.44 3.07 2.76 3.70 3.32 2.87 2.13 130 3.63 4.24 2.90 4.36 3.57 3.89 3.50 3.19 4.16 3.71 3.18 2.31 131 3.05 3.53 2.35 3.61 2.90 3.21 2.86 2.57 3.45 3.02 2.49 1.61 132 2.3 2.86 2.05 2.93 3.61 2.56 2.24 1.96 2.81 2.48 2.05 xxx 133 2.93 3.55 2.64 3.66 4.29 3.35 3.12 2.92 3.52 3.20 2.81 xxx 134 3.77 4.25 2.95 4.37 3.87 3.98 3.70 3.50 4.18 3.75 3.27 xxx 135 xxx 3.84 2.57 3.92 3.10 3.53 3.21 2.99 3.74 3.27 2.74 xxx 136 xxx 3.04 2.17 3.12 xxx 2.78 2.47 2.26 3.00 2.62 2.17 xxx 137 3.33 3.93 2.90 4.06 xxx 3.76 3.49 xxx 3.95 3.56 3.12 xxx 138 4.08 4.22 3.03 4.32 3.52 3.96 3.68 xxx 4.16 3.72 3.24 xxx 139 3.25 3.49 2.59 3.60 3.11 3.26 3.09 3.01 3.42 3.07 2.70 xxx 140 2.6 3.01 2.27 3.10 3.89 2.84 2.67 2.57 3.00 2.68 2.34 xxx 141 3.34 3.77 2.84 3.92 4.83 3.63 3.39 3.25 3.80 3.46 xxx xxx 142 4.63 4.86 3.42 4.91 4.19 4.51 4.27 4.11 4.74 4.29 3.78 xxx

Appendix A. (continued)
225
143 4.13 4.28 2.84 4.29 3.55 3.78 3.47 3.24 4.10 3.58 3.00 xxx 144 3.02 3.49 2.48 3.61 4.13 3.18 2.88 2.67 3.47 3.03 2.51 xxx 145 3.54 4.06 2.99 4.17 5.06 3.82 3.56 3.38 4.03 3.64 3.19 xxx 146 4.81 5.12 3.46 5.19 4.66 4.72 4.41 4.19 4.94 4.43 3.86 xxx 147 4.57 4.82 3.09 4.82 3.77 4.20 3.74 3.41 4.57 3.99 3.33 xxx 148 3.23 3.74 2.62 3.83 4.31 3.39 3.02 2.74 3.66 3.22 2.68 xxx 149 3.79 4.23 3.11 4.39 5.24 3.97 3.64 3.39 4.19 3.81 3.33 xxx 150 5.17 5.32 3.59 5.40 4.99 4.85 4.45 4.15 5.12 4.58 3.97 xxx 151 5 5.12 3.31 5.16 4.05 4.44 3.90 3.48 4.88 4.27 3.58 xxx 152 3.6 3.97 2.80 4.14 4.52 3.56 3.10 2.74 3.93 3.46 2.89 xxx 153 4.14 4.45 3.28 4.64 5.62 4.08 3.74 3.43 4.42 4.01 3.52 xxx 154 5.63 5.70 3.82 5.77 5.28 5.04 4.62 4.27 5.45 4.88 4.24 xxx 155 5.52 5.40 3.43 5.43 4.27 4.62 4.02 3.57 5.13 4.47 3.72 xxx 156 4.07 4.22 2.92 4.36 4.79 3.71 3.18 2.79 4.16 3.63 3.02 xxx 157 4.5 4.62 3.39 4.88 5.72 4.15 3.94 3.64 4.66 4.19 3.66 xxx 158 5.89 5.74 3.86 5.91 5.40 4.98 4.67 4.34 5.58 4.98 4.30 xxx 159 5.57 5.51 3.53 5.57 4.53 4.83 4.27 3.91 5.26 4.62 3.86 xxx 160 4.31 4.55 3.12 4.63 4.80 4.01 3.50 3.19 4.40 3.88 3.26 xxx 161 4.63 4.79 3.42 4.90 5.76 xxx 4.03 3.83 4.66 4.20 3.65 xxx 162 6.02 5.88 3.89 5.94 5.42 xxx 4.75 4.47 5.61 5.02 4.32 xxx 163 5.79 5.56 3.49 5.61 4.60 4.81 4.28 3.96 5.28 4.61 3.85 xxx 164 4.57 4.63 3.11 4.75 4.82 4.08 3.56 3.34 4.44 3.94 3.31 xxx 165 4.88 4.87 3.39 4.93 5.45 xxx 4.05 3.84 4.74 4.21 3.65 xxx 166 5.83 5.59 3.70 5.60 5.41 xxx 4.53 4.28 5.31 4.74 4.08 xxx 167 5.72 5.51 3.53 5.60 4.80 4.79 4.36 4.09 5.28 4.63 3.89 xxx 168 4.74 4.78 3.22 4.94 4.73 4.23 3.81 3.61 4.63 4.12 3.45 xxx 169 4.56 4.73 3.31 4.83 5.27 xxx 4.00 3.80 4.62 4.14 3.58 xxx 170 5.45 5.37 3.58 5.43 5.23 xxx 4.42 4.19 5.15 4.59 3.97 xxx 171 5.57 5.34 3.45 5.43 4.74 4.70 4.30 3.96 5.11 4.51 3.80 xxx 172 4.91 4.84 3.22 4.90 4.71 4.24 3.71 3.58 4.64 4.09 3.45 xxx 173 4.57 4.87 3.18 4.82 4.88 4.24 3.90 3.69 4.58 4.09 3.54 xxx 174 5 5.07 3.30 4.99 5.15 4.45 4.10 3.88 4.75 4.27 3.70 xxx 175 5.33 5.22 3.46 5.33 5.06 xxx 4.26 4.00 5.03 4.47 3.81 xxx 176 5.19 5.11 3.43 5.27 4.47 xxx 4.16 3.90 4.94 4.38 3.72 xxx 177 4.26 4.57 3.12 4.61 4.49 4.09 3.79 3.60 4.39 3.93 3.40 xxx 178 4.21 4.58 3.13 4.65 4.84 4.13 3.82 3.63 4.43 3.97 3.44 xxx 179 4.62 4.86 3.35 5.06 5.07 4.41 4.10 3.89 4.76 4.27 3.71 xxx 180 4.98 5.13 3.45 5.27 4.41 4.63 4.30 4.09 4.98 4.45 3.86 xxx 181 4.22 4.48 2.96 4.57 4.08 4.04 3.69 3.50 4.36 3.85 3.30 xxx 182 3.7 4.09 2.80 4.21 4.69 3.72 3.40 3.23 4.02 3.58 3.08 xxx 183 4.49 4.71 3.26 4.89 5.06 4.29 3.97 3.79 4.60 4.14 3.61 xxx 184 4.95 5.10 3.43 5.27 4.53 4.65 4.29 4.09 4.96 4.44 3.86 xxx 185 4.3 4.58 3.06 4.63 3.88 4.16 3.79 3.59 4.47 3.96 3.41 xxx 186 3.45 3.87 2.73 3.96 4.41 3.54 3.22 3.04 3.84 3.40 2.94 xxx 187 3.96 4.38 3.16 4.54 5.03 4.03 3.78 3.62 4.34 3.91 3.47 xxx 188 4.79 5.09 3.47 5.18 4.56 4.63 4.34 4.17 4.96 4.45 3.92 xxx 189 4.4 4.62 3.08 4.65 3.78 4.17 3.82 3.61 4.51 4.00 3.46 xxx 190 3.44 3.71 2.64 3.82 4.23 3.41 3.09 2.91 3.73 3.31 2.87 xxx

Appendix A. (continued)
226
191 3.85 4.15 3.08 4.35 5.11 3.88 3.67 3.51 4.18 3.81 3.41 xxx 192 5.01 5.19 3.56 5.31 4.53 4.74 4.51 4.33 5.05 4.58 4.06 3.18 193 4.5 4.63 3.03 4.66 3.75 4.10 3.70 3.48 4.48 3.95 3.37 2.43 194 3.37 3.69 2.63 3.79 4.19 3.36 3.00 2.83 3.70 3.28 2.82 2.06 195 3.9 4.15 3.05 4.27 5.15 3.91 3.60 3.45 4.13 3.74 3.33 2.60 196 5.1 5.22 3.52 5.31 4.34 4.80 4.42 4.22 5.09 4.56 4.01 3.07 197 4.41 4.49 2.89 4.49 3.48 3.95 3.56 3.34 4.33 3.80 3.23 2.29 198 3.25 3.52 2.51 3.59 4.07 3.16 2.86 2.71 3.46 3.08 2.65 1.93 199 3.94 4.12 3.01 4.20 4.95 3.77 3.51 3.33 4.03 3.63 3.20 2.49 200 5.09 5.10 3.45 5.12 4.59 4.59 4.24 4.03 4.90 4.38 3.83 2.91 201 4.65 4.82 3.02 4.72 3.09 4.12 3.71 3.47 4.53 3.97 3.34 2.36 202 2.91 3.19 2.15 3.11 4.13 2.68 2.35 2.17 3.04 2.65 2.22 1.56 203 3.97 4.10 3.05 4.16 5.14 xxx 3.57 3.43 4.06 3.71 3.36 2.70 204 5.27 5.26 3.65 5.29 5.02 xxx 4.49 4.30 5.08 4.59 4.08 3.20 205 5.09 5.08 3.48 5.13 4.06 4.48 4.22 4.00 4.96 4.41 3.82 2.86 206 3.88 3.96 2.83 4.08 4.25 3.51 xxx 3.10 3.98 3.54 3.06 2.26 207 3.85 4.10 3.04 4.31 5.18 xxx xxx 3.49 4.16 3.79 3.40 2.70 208 5.08 5.18 3.65 5.32 4.70 xxx xxx 4.34 5.11 4.64 4.14 3.27 209 4.73 4.75 3.25 4.85 4.23 4.28 xxx 3.67 4.64 4.11 3.52 2.55 210 3.86 4.19 xxx 4.27 4.32 3.80 xxx xxx 4.17 3.67 3.13 2.28 211 xxx 4.27 xxx 4.41 4.87 3.95 xxx xxx 4.26 3.82 3.35 2.58 212 xxx 4.92 xxx 5.04 4.63 4.53 xxx xxx 4.82 4.37 3.87 3.02 213 4.53 4.73 xxx 4.77 4.05 4.23 xxx xxx 4.57 4.06 3.49 2.53 214 3.74 4.06 xxx 4.14 4.01 3.64 xxx xxx 3.98 3.53 3.04 2.22 215 3.71 4.06 xxx 4.12 4.60 3.67 xxx xxx 3.95 3.54 3.09 2.35 216 4.5 4.72 xxx 4.74 4.53 4.25 xxx xxx 4.55 4.06 3.53 2.67 217 4.45 4.60 xxx 4.65 4.16 4.11 xxx xxx 4.46 3.93 3.34 2.41 218 3.81 4.12 xxx 4.24 4.05 3.77 xxx xxx 4.07 3.61 3.08 2.21 219 3.73 4.02 xxx 4.10 4.32 3.70 3.39 xxx 3.97 3.55 3.09 2.26 220 4.22 4.39 xxx 4.40 4.35 3.98 3.68 xxx 4.24 3.79 3.30 2.43 221 4.35 4.50 xxx 4.45 3.97 3.97 3.59 xxx 4.27 3.79 3.26 2.40 222 3.59 3.95 xxx 4.02 4.00 3.63 3.29 xxx 3.81 3.44 2.96 2.17 223 3.69 3.92 2.88 3.99 4.14 3.66 3.34 xxx 4.06 3.51 3.05 2.31 224 3.95 4.12 2.97 4.15 4.60 3.80 3.49 xxx 4.04 3.62 3.13 2.34 225 4.26 4.54 3.30 4.68 4.30 4.19 3.85 xxx 4.48 4.05 3.56 2.72 226 3.77 4.24 3.02 4.34 3.95 3.88 3.56 xxx 4.09 3.75 3.29 2.47 227 3.41 3.86 2.82 3.95 4.06 3.60 3.31 xxx 4.04 3.48 3.07 2.37 228 3.68 3.93 2.95 4.10 4.29 3.71 3.41 xxx 3.98 3.60 3.16 2.47 229 3.8 4.19 3.14 4.35 4.32 3.94 3.63 xxx 4.19 3.81 3.36 2.62 230 3.8 4.22 3.15 4.38 3.78 3.98 3.66 xxx 4.22 3.83 3.38 2.63 231 3.42 3.67 2.72 3.82 3.72 3.46 3.17 xxx 3.70 3.30 2.85 2.12 232 3.39 3.61 2.71 3.72 4.16 3.40 3.11 xxx 3.63 3.26 2.84 2.16 233 3.65 4.04 3.01 4.16 4.40 3.82 3.53 xxx 4.05 3.67 3.23 2.49 234 3.94 4.38 3.16 4.44 3.50 4.06 3.77 xxx 4.31 3.90 3.42 2.62 235 3.04 3.49 2.51 3.63 xxx 3.22 2.99 xxx 3.45 3.08 2.65 1.96 236 2.87 3.27 2.44 3.45 xxx 3.07 2.84 xxx 3.29 2.95 2.55 xxx 237 3.34 3.79 2.79 3.93 xxx 3.60 3.34 3.16 3.80 3.42 2.96 2.26 238 3.52 4.05 2.93 4.04 xxx 3.76 3.48 3.32 4.00 3.60 3.12 2.39

Appendix A. (continued)
227
239 2.98 3.69 2.52 3.47 xxx 3.25 3.01 2.86 3.50 3.09 2.64 1.95 240 2.49 3.21 2.27 3.16 xxx 2.84 2.59 2.43 3.09 2.73 2.32 1.69 241 2.94 3.55 2.71 3.71 xxx 3.42 3.23 3.11 3.56 3.27 2.91 2.36 242 3.48 4.05 2.97 4.06 xxx xxx 3.64 3.53 3.79 3.67 3.25 2.57 243 3 3.52 2.55 3.52 xxx xxx 3.08 2.96 3.54 3.17 2.74 2.06 244 2.39 2.94 2.22 3.07 xxx xxx 2.55 2.42 3.00 2.68 2.31 1.73 245 3 3.53 2.73 3.75 xxx xxx 3.25 3.15 3.60 3.30 2.96 2.41 246 3.71 4.19 3.10 4.30 xxx xxx 3.81 3.72 3.87 3.84 3.42 2.74 247 3.25 3.76 2.68 3.72 xxx xxx 3.23 3.12 3.72 3.33 2.89 2.17 248 2.38 2.97 2.24 3.08 xxx xxx 2.53 2.44 3.00 2.67 2.33 1.77 249 2.9 3.47 2.71 3.68 xxx xxx 3.21 3.09 3.56 3.26 2.94 2.41 250 4.03 4.47 3.27 4.48 xxx xxx 4.02 3.94 4.45 4.05 3.61 2.88 251 3.58 4.31 2.84 4.02 xxx xxx 3.40 3.27 4.02 3.54 3.06 2.31 252 2.55 3.36 2.27 3.21 xxx xxx 2.54 2.44 3.16 2.75 2.37 1.81 253 2.99 3.54 2.71 3.66 xxx xxx 3.22 3.15 3.61 3.30 2.98 2.46 254 4.47 4.76 3.37 4.83 xxx xxx 4.23 4.10 4.67 4.25 3.79 3.03 255 4.11 4.43 2.94 4.50 xxx xxx 3.61 3.40 4.29 3.78 3.25 2.36 256 3.2 3.66 2.61 3.81 xxx xxx 3.04 2.89 3.64 3.24 2.81 2.07 257 3.53 4.06 2.92 4.18 xxx xxx 3.44 3.25 4.02 3.60 3.16 2.44 258 4.87 5.20 3.39 5.17 xxx xxx 4.25 4.02 4.95 4.40 3.82 2.89 259 4.67 4.87 3.05 4.85 xxx xxx 3.77 3.51 4.62 4.05 3.40 2.30 260 3.51 3.90 2.67 4.02 xxx xxx 3.12 2.93 3.85 3.40 2.88 1.98 261 4.02 4.37 3.09 4.41 xxx xxx xxx xxx 4.28 3.86 3.36 2.56 262 5.44 5.56 3.57 5.48 xxx xxx 4.50 4.25 5.27 4.71 4.04 2.98 263 5.31 5.25 3.19 5.22 xxx xxx 3.95 3.62 4.96 4.32 3.55 2.31 264 3.85 4.02 2.70 4.12 xxx xxx 3.12 2.89 3.95 3.45 2.87 1.90 265 4.65 4.68 3.32 3.97 xxx 4.22 3.99 3.77 4.62 4.14 3.62 2.74 266 6.14 5.70 3.67 4.84 xxx 4.92 4.60 4.37 5.33 4.82 4.09 3.00 267 6.1 5.67 3.54 5.64 xxx 4.84 4.32 4.00 5.34 4.68 3.91 2.70 268 4.95 4.84 3.20 4.93 xxx 4.28 3.83 3.57 4.70 4.15 3.49 2.43 269 5.03 4.99 3.40 5.07 xxx 4.37 4.00 3.69 4.84 4.29 3.65 2.60 270 6.35 6.13 3.90 6.14 xxx 5.22 4.78 4.45 5.80 5.11 4.34 3.10 271 5.7 5.49 3.26 5.51 xxx 4.54 3.96 3.58 5.15 4.44 3.59 2.17 272 5.03 4.92 3.09 4.98 xxx 4.20 3.69 3.38 4.72 4.12 3.37 2.09 273 5.29 5.05 3.19 5.11 xxx 4.35 3.87 3.49 4.83 4.20 3.41 2.12 274 6.11 5.70 3.46 5.69 xxx 4.77 4.22 3.83 5.36 4.64 3.75 2.34 275 6.24 5.74 3.27 5.72 xxx 4.73 4.12 3.71 xxx 4.60 3.67 2.14 276 5.48 5.12 3.03 5.17 xxx 4.31 3.75 3.40 xxx 4.19 3.35 1.96 277 5.28 5.24 3.23 5.31 xxx 4.55 4.08 3.78 5.00 4.38 3.59 2.30 278 5.88 5.69 3.41 5.71 xxx 4.82 4.32 3.97 5.33 4.65 3.81 2.43 279 5.72 5.34 3.05 5.38 xxx 4.44 3.91 3.55 5.00 4.30 3.46 2.04 280 5.81 5.40 3.11 5.41 xxx 4.49 3.95 3.60 5.07 4.36 3.52 2.09 281 5.22 5.04 2.85 5.03 xxx 4.17 3.68 3.35 4.71 4.04 3.23 1.89 282 5.3 5.16 2.91 5.14 xxx 4.28 3.77 3.41 4.83 4.15 3.32 1.95 283 5.57 5.32 2.91 5.27 xxx 4.36 3.81 3.43 4.95 4.23 3.35 1.90 284 5.47 5.14 2.84 5.12 xxx 4.24 3.71 3.35 4.80 4.12 3.27 1.85 285 5.18 4.97 2.80 4.96 xxx 4.15 3.64 3.31 4.65 4.01 3.20 1.87 286 4.42 4.50 2.63 4.54 xxx 3.83 3.36 3.07 4.28 3.71 2.95 1.73

Appendix A. (continued)
228
287 5.16 5.09 3.09 5.17 xxx 4.41 3.97 3.69 4.83 4.24 3.48 2.23 288 5.17 5.11 3.06 5.20 xxx 4.42 3.96 3.69 4.85 4.22 3.45 2.17 289 4.69 4.74 2.92 4.79 xxx 4.14 3.72 3.48 4.53 3.95 3.25 2.12 290 4.14 4.30 2.72 4.37 xxx 3.77 3.39 3.16 4.12 3.60 2.96 1.93 291 4.49 4.64 3.03 4.78 xxx 4.15 3.78 3.57 4.47 3.97 3.35 2.37 292 4.91 5.01 3.18 5.17 xxx 4.49 4.08 3.85 4.81 4.27 3.59 2.48 293 4.3 4.50 2.87 4.57 xxx 4.02 3.62 3.39 4.39 3.83 3.19 2.13 294 3.47 3.73 2.53 3.82 xxx 3.34 3.01 2.82 3.67 3.22 2.68 1.81 295 3.97 4.24 3.01 4.44 xxx 3.96 3.69 3.55 4.20 3.81 3.32 2.55 296 4.81 4.85 3.24 4.94 xxx xxx 4.08 3.91 4.67 4.20 3.63 2.70 297 4.02 4.20 2.79 4.28 xxx xxx 3.48 3.31 4.11 3.63 3.11 2.25 298 3.07 3.38 2.41 3.56 xxx xxx 2.84 2.68 3.43 3.03 2.59 1.86 299 3.77 3.99 2.94 4.18 xxx xxx 3.55 3.42 4.01 3.67 3.26 2.58 300 4.65 4.74 3.27 4.84 4.05 xxx 4.13 3.98 4.65 4.22 3.72 2.91 301 3.98 4.17 2.82 4.23 3.39 3.80 3.51 3.36 4.09 3.65 3.15 2.35 302 2.97 3.38 2.44 3.54 3.83 3.15 2.90 2.76 3.42 3.07 2.65 1.98 303 3.42 3.80 2.79 3.97 4.64 3.60 3.35 3.20 3.84 3.49 3.08 2.41 304 4.38 4.66 3.21 4.73 4.21 4.32 4.05 3.90 4.57 4.14 3.64 2.82 305 3.97 4.25 2.83 4.31 3.54 3.85 3.54 3.35 4.17 3.72 3.19 2.29 306 3.09 3.49 2.47 3.61 3.90 3.20 2.92 2.76 3.50 3.12 2.69 1.95 307 3.43 3.86 2.82 3.97 4.64 3.61 3.35 3.22 3.85 3.49 3.07 2.41 308 4.32 4.67 3.21 4.76 4.29 4.32 4.03 3.88 4.59 4.14 3.63 2.80 309 4.08 4.32 2.83 4.37 3.58 3.89 3.53 3.32 4.24 3.72 3.18 2.26 310 3.09 3.54 2.47 3.61 3.94 3.22 2.88 2.71 3.53 3.11 2.66 1.91 311 3.63 3.95 2.84 3.94 4.65 3.65 3.39 3.25 3.87 3.50 3.08 2.39 312 4.55 4.71 3.21 4.72 4.39 4.31 4.02 3.86 4.56 4.12 3.61 2.76 313 4.33 4.43 2.92 4.48 3.55 3.97 3.64 3.44 4.33 3.82 3.26 2.31 314 3.28 3.49 2.46 3.57 4.06 3.18 2.89 2.72 3.50 3.09 2.64 1.86 315 3.81 4.03 2.94 4.17 4.63 3.78 3.56 3.41 4.02 3.65 3.24 2.40 316 4.63 4.67 3.28 4.79 4.25 4.34 4.06 3.93 4.64 4.17 3.70 2.77 317 4.17 4.25 2.94 4.35 3.78 3.91 3.57 3.39 4.20 3.73 3.20 2.35 318 3.47 3.71 2.64 3.81 3.74 3.44 3.12 2.97 3.71 3.29 2.80 2.05 319 3.7 3.77 xxx 3.83 4.59 3.46 3.19 3.07 3.67 3.28 2.85 2.11 320 4.8 4.71 xxx 4.73 4.54 4.28 3.97 3.81 4.53 4.04 3.53 2.63 321 4.59 4.64 2.88 4.70 3.92 4.11 3.72 3.47 4.48 3.90 3.23 2.07 322 3.81 3.96 2.60 4.05 4.02 3.53 3.21 3.01 3.85 3.39 2.82 1.86 323 3.81 4.12 2.77 4.17 4.72 3.70 3.39 3.18 3.93 3.54 2.93 1.99 324 4.78 4.93 3.08 4.90 4.41 4.34 3.97 3.74 4.64 4.13 3.41 2.29 325 4.36 4.53 2.72 4.56 4.04 3.90 3.50 3.23 4.32 3.75 3.06 1.95 326 3.83 4.08 2.58 4.15 4.18 3.59 3.26 3.05 3.94 3.44 2.83 1.83 327 4.08 4.28 2.68 4.31 4.47 3.74 3.38 3.14 4.07 3.58 2.99 1.97 328 4.39 4.59 2.82 4.63 4.37 4.00 3.62 3.38 4.35 3.83 3.18 2.09 329 4.28 4.54 2.71 4.49 4.09 3.87 3.50 3.24 4.26 3.73 3.06 1.95 330 3.91 4.24 2.57 4.17 4.21 3.61 3.27 3.04 3.98 3.48 2.87 1.84 331 3.96 4.26 2.71 4.33 4.33 3.78 3.45 3.15 4.09 3.61 3.03 2.04 332 4.2 4.42 2.75 4.48 4.26 3.89 3.52 3.31 4.23 3.73 3.10 2.07 333 4.16 4.33 2.72 4.38 4.13 3.84 3.51 3.31 4.17 3.69 3.07 2.05 334 4 4.16 2.65 4.23 4.13 3.71 3.40 3.21 4.02 3.57 2.98 1.99
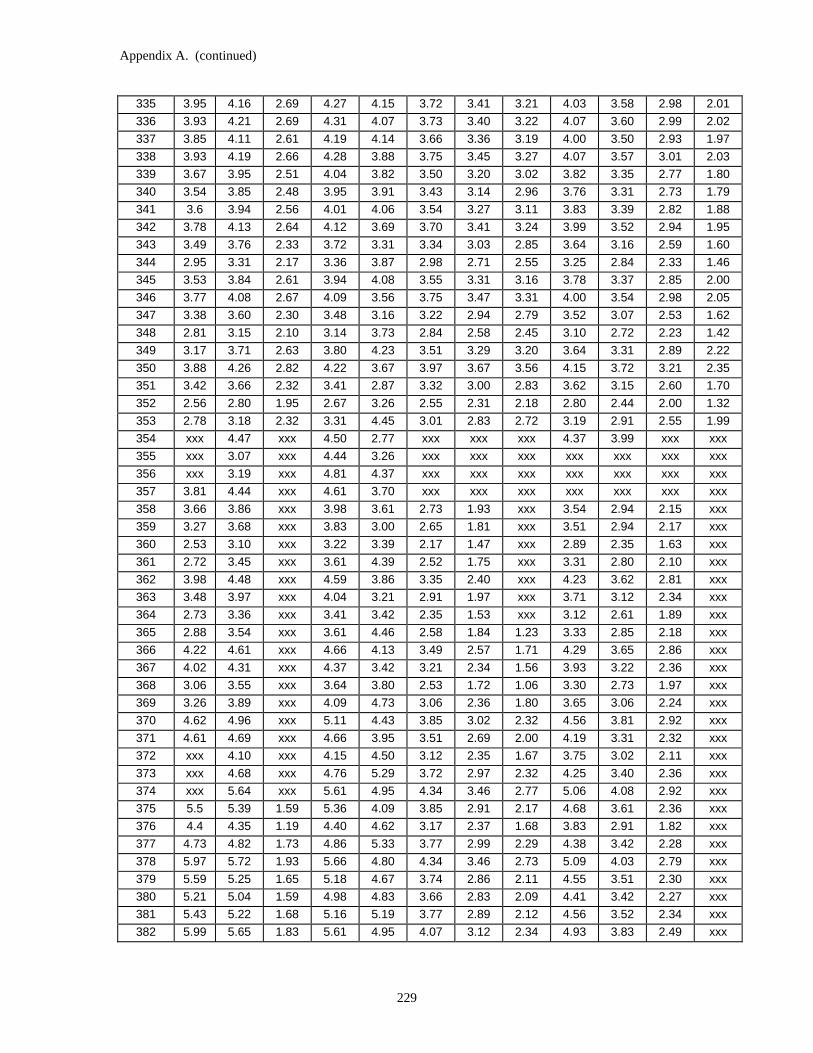
Appendix A. (continued)
229
335 3.95 4.16 2.69 4.27 4.15 3.72 3.41 3.21 4.03 3.58 2.98 2.01 336 3.93 4.21 2.69 4.31 4.07 3.73 3.40 3.22 4.07 3.60 2.99 2.02 337 3.85 4.11 2.61 4.19 4.14 3.66 3.36 3.19 4.00 3.50 2.93 1.97 338 3.93 4.19 2.66 4.28 3.88 3.75 3.45 3.27 4.07 3.57 3.01 2.03 339 3.67 3.95 2.51 4.04 3.82 3.50 3.20 3.02 3.82 3.35 2.77 1.80 340 3.54 3.85 2.48 3.95 3.91 3.43 3.14 2.96 3.76 3.31 2.73 1.79 341 3.6 3.94 2.56 4.01 4.06 3.54 3.27 3.11 3.83 3.39 2.82 1.88 342 3.78 4.13 2.64 4.12 3.69 3.70 3.41 3.24 3.99 3.52 2.94 1.95 343 3.49 3.76 2.33 3.72 3.31 3.34 3.03 2.85 3.64 3.16 2.59 1.60 344 2.95 3.31 2.17 3.36 3.87 2.98 2.71 2.55 3.25 2.84 2.33 1.46 345 3.53 3.84 2.61 3.94 4.08 3.55 3.31 3.16 3.78 3.37 2.85 2.00 346 3.77 4.08 2.67 4.09 3.56 3.75 3.47 3.31 4.00 3.54 2.98 2.05 347 3.38 3.60 2.30 3.48 3.16 3.22 2.94 2.79 3.52 3.07 2.53 1.62 348 2.81 3.15 2.10 3.14 3.73 2.84 2.58 2.45 3.10 2.72 2.23 1.42 349 3.17 3.71 2.63 3.80 4.23 3.51 3.29 3.20 3.64 3.31 2.89 2.22 350 3.88 4.26 2.82 4.22 3.67 3.97 3.67 3.56 4.15 3.72 3.21 2.35 351 3.42 3.66 2.32 3.41 2.87 3.32 3.00 2.83 3.62 3.15 2.60 1.70 352 2.56 2.80 1.95 2.67 3.26 2.55 2.31 2.18 2.80 2.44 2.00 1.32 353 2.78 3.18 2.32 3.31 4.45 3.01 2.83 2.72 3.19 2.91 2.55 1.99 354 xxx 4.47 xxx 4.50 2.77 xxx xxx xxx 4.37 3.99 xxx xxx 355 xxx 3.07 xxx 4.44 3.26 xxx xxx xxx xxx xxx xxx xxx 356 xxx 3.19 xxx 4.81 4.37 xxx xxx xxx xxx xxx xxx xxx 357 3.81 4.44 xxx 4.61 3.70 xxx xxx xxx xxx xxx xxx xxx 358 3.66 3.86 xxx 3.98 3.61 2.73 1.93 xxx 3.54 2.94 2.15 xxx 359 3.27 3.68 xxx 3.83 3.00 2.65 1.81 xxx 3.51 2.94 2.17 xxx 360 2.53 3.10 xxx 3.22 3.39 2.17 1.47 xxx 2.89 2.35 1.63 xxx 361 2.72 3.45 xxx 3.61 4.39 2.52 1.75 xxx 3.31 2.80 2.10 xxx 362 3.98 4.48 xxx 4.59 3.86 3.35 2.40 xxx 4.23 3.62 2.81 xxx 363 3.48 3.97 xxx 4.04 3.21 2.91 1.97 xxx 3.71 3.12 2.34 xxx 364 2.73 3.36 xxx 3.41 3.42 2.35 1.53 xxx 3.12 2.61 1.89 xxx 365 2.88 3.54 xxx 3.61 4.46 2.58 1.84 1.23 3.33 2.85 2.18 xxx 366 4.22 4.61 xxx 4.66 4.13 3.49 2.57 1.71 4.29 3.65 2.86 xxx 367 4.02 4.31 xxx 4.37 3.42 3.21 2.34 1.56 3.93 3.22 2.36 xxx 368 3.06 3.55 xxx 3.64 3.80 2.53 1.72 1.06 3.30 2.73 1.97 xxx 369 3.26 3.89 xxx 4.09 4.73 3.06 2.36 1.80 3.65 3.06 2.24 xxx 370 4.62 4.96 xxx 5.11 4.43 3.85 3.02 2.32 4.56 3.81 2.92 xxx 371 4.61 4.69 xxx 4.66 3.95 3.51 2.69 2.00 4.19 3.31 2.32 xxx 372 xxx 4.10 xxx 4.15 4.50 3.12 2.35 1.67 3.75 3.02 2.11 xxx 373 xxx 4.68 xxx 4.76 5.29 3.72 2.97 2.32 4.25 3.40 2.36 xxx 374 xxx 5.64 xxx 5.61 4.95 4.34 3.46 2.77 5.06 4.08 2.92 xxx 375 5.5 5.39 1.59 5.36 4.09 3.85 2.91 2.17 4.68 3.61 2.36 xxx 376 4.4 4.35 1.19 4.40 4.62 3.17 2.37 1.68 3.83 2.91 1.82 xxx 377 4.73 4.82 1.73 4.86 5.33 3.77 2.99 2.29 4.38 3.42 2.28 xxx 378 5.97 5.72 1.93 5.66 4.80 4.34 3.46 2.73 5.09 4.03 2.79 xxx 379 5.59 5.25 1.65 5.18 4.67 3.74 2.86 2.11 4.55 3.51 2.30 xxx 380 5.21 5.04 1.59 4.98 4.83 3.66 2.83 2.09 4.41 3.42 2.27 xxx 381 5.43 5.22 1.68 5.16 5.19 3.77 2.89 2.12 4.56 3.52 2.34 xxx 382 5.99 5.65 1.83 5.61 4.95 4.07 3.12 2.34 4.93 3.83 2.49 xxx

Appendix A. (continued)
230
383 5.97 5.45 1.68 5.40 4.76 3.76 2.81 2.02 4.69 3.61 2.23 xxx 384 5.71 5.21 1.62 5.16 4.85 3.63 2.74 1.97 4.50 3.46 2.17 xxx 385 5.74 5.33 xxx 5.26 4.98 3.73 2.82 2.04 4.60 3.53 2.28 xxx 386 5.87 5.49 xxx 5.42 5.00 3.82 2.88 2.09 4.72 3.62 2.29 xxx 387 6.06 5.51 xxx 5.19 4.90 3.86 2.85 2.06 4.74 3.64 2.30 xxx 388 5.92 5.38 xxx 5.08 4.91 3.78 2.79 2.01 4.63 3.55 2.27 xxx 389 5.79 5.38 xxx 5.11 4.76 3.82 2.86 2.11 4.65 3.61 2.36 xxx 390 5.47 5.21 xxx 5.08 4.92 3.70 2.75 2.01 4.51 3.47 2.28 xxx 391 5.67 5.35 xxx 5.10 5.05 3.84 2.93 2.17 4.68 3.65 2.49 xxx 392 5.99 5.54 xxx 5.08 4.84 3.93 2.99 2.21 4.79 3.72 2.51 xxx 393 5.63 5.32 xxx 5.24 4.39 3.80 2.87 2.14 4.60 3.61 2.46 xxx 394 4.99 4.78 xxx 4.72 4.70 3.43 2.57 1.86 4.15 3.23 2.14 xxx 395 5.08 5.01 xxx 3.98 5.00 3.78 2.98 2.30 4.48 3.58 2.51 xxx 396 5.84 5.44 xxx 4.38 4.56 4.00 3.13 2.43 4.78 3.78 2.65 xxx 397 5.08 4.95 xxx 4.87 4.07 3.62 2.82 2.17 4.36 3.48 2.46 xxx 398 4.24 4.32 1.71 4.32 4.38 3.21 2.48 1.85 3.86 3.07 2.10 xxx 399 4.66 4.62 2.07 4.58 4.82 3.60 2.92 2.32 4.20 3.42 2.50 xxx 400 5.31 5.18 2.24 5.11 4.35 3.94 3.18 2.56 4.64 3.75 2.74 xxx 401 4.69 4.67 1.96 4.68 3.70 3.47 2.72 2.14 4.18 3.39 2.47 xxx 402 3.62 3.87 1.65 3.94 3.93 2.92 2.26 1.71 3.53 2.86 2.02 0.70 403 3.67 4.02 1.99 4.11 4.65 3.25 2.71 2.23 3.76 3.17 2.38 1.08 404 4.7 4.92 2.33 4.95 3.96 3.85 3.19 2.66 4.49 3.74 2.81 1.32 405 4.12 4.23 1.79 4.27 3.34 3.18 2.53 2.02 3.82 3.14 2.31 1.05 406 3.16 3.44 1.52 3.53 3.61 2.67 2.12 1.66 3.19 2.65 1.93 0.81 407 3.57 3.74 1.69 3.80 4.10 2.97 2.44 2.00 3.43 2.87 2.15 0.99 408 4.08 4.28 1.97 4.36 3.92 3.38 2.81 2.35 3.93 3.26 2.47 1.20 409 3.72 4.10 1.45 4.18 3.06 3.13 2.53 2.01 3.76 3.09 2.32 1.07 410 2.76 3.15 1.21 3.23 3.54 2.40 1.86 1.36 2.89 2.37 1.70 0.62 411 3.05 3.54 1.39 3.67 4.00 3.01 2.53 2.09 3.38 2.90 2.27 1.11 412 3.85 4.13 1.72 4.21 3.68 3.40 2.89 2.43 3.84 3.26 2.54 1.22 413 3.61 3.84 1.29 3.86 3.07 3.08 2.55 2.10 3.55 3.00 2.32 1.15 414 2.64 3.12 1.01 3.19 3.61 2.54 2.05 1.62 2.93 2.47 1.87 0.81 415 3 3.65 1.32 3.76 3.95 3.09 2.66 2.27 3.48 3.00 2.41 1.32 416 3.66 4.06 1.52 4.13 3.57 3.38 2.95 2.56 3.82 3.26 2.59 1.34 417 3.39 3.65 1.36 3.70 3.31 3.06 2.59 2.17 3.45 2.98 2.37 1.26 418 2.91 3.33 1.16 3.40 3.41 2.85 2.38 1.96 3.18 2.75 2.17 1.11 419 2.92 3.41 1.38 3.50 4.16 2.95 2.50 2.09 3.29 2.88 2.32 1.33 420 3.95 4.26 1.69 4.30 3.78 3.60 3.09 2.65 4.03 3.48 2.79 1.58 421 3.77 3.96 1.36 3.98 3.14 3.09 2.47 1.94 3.64 3.08 2.37 1.12 422 2.78 3.20 1.04 3.26 3.80 2.55 1.98 1.47 3.00 2.58 2.00 0.95 423 3.42 3.83 1.66 3.88 4.23 3.23 2.67 2.18 3.65 3.18 2.56 1.45 424 3.98 4.32 1.77 4.36 4.04 3.60 3.01 2.50 4.09 3.52 2.80 1.52 425 3.94 4.17 1.68 4.20 3.72 3.38 2.75 2.23 3.92 3.33 2.59 1.33 426 3.49 3.84 1.47 3.85 4.11 3.09 2.48 1.98 3.61 3.07 2.39 1.21 427 3.81 4.20 1.91 4.23 4.43 3.56 3.02 2.58 3.98 3.45 2.79 1.57 428 4.23 4.62 2.02 4.63 4.39 3.82 3.23 2.76 4.31 3.71 2.97 1.64 429 xxx 4.57 2.15 4.57 3.58 3.78 3.24 2.80 4.27 3.69 2.96 1.66 430 xxx 3.66 1.72 3.71 3.88 3.04 2.57 2.18 3.46 3.00 2.40 1.29

Appendix A. (continued)
231
431 3.44 3.88 2.06 3.99 4.44 3.47 3.10 2.80 3.77 3.33 2.81 1.81 432 4.2 4.53 2.29 4.61 4.57 3.95 3.52 3.18 4.32 3.77 3.12 1.95 433 4.32 4.69 2.42 4.74 4.19 3.99 3.53 3.17 4.44 3.87 3.16 1.91 434 3.92 4.25 2.18 4.31 4.09 3.64 3.21 2.89 4.05 3.54 2.90 1.72 435 3.88 4.16 2.29 4.21 4.28 3.63 3.27 3.01 3.97 3.51 2.92 1.89 436 4.05 4.37 2.34 4.44 4.28 3.81 3.42 3.12 4.18 3.67 3.03 1.93 437 4.08 4.36 2.42 4.42 4.19 3.80 3.41 3.10 4.17 3.66 3.02 1.93 438 3.96 4.26 2.36 4.30 4.19 3.71 3.33 3.04 4.07 3.58 2.96 1.89 439 4.03 4.27 2.41 4.31 4.16 3.70 3.31 3.04 4.07 3.57 2.95 1.92 440 3.92 4.23 2.37 4.31 4.21 3.67 3.28 2.99 4.04 3.54 2.90 1.88 441 4.04 4.28 2.52 4.36 4.23 3.77 3.41 3.15 4.08 3.60 3.00 2.00 442 3.95 4.27 2.51 4.38 4.39 3.80 3.43 3.18 4.12 3.63 3.03 2.01 443 4.3 4.47 2.67 4.55 4.04 3.94 3.53 3.27 4.27 3.75 3.13 2.06 444 3.9 4.11 2.47 4.18 4.35 3.60 3.21 2.98 3.91 3.43 2.86 1.87 445 3.98 4.35 2.80 4.45 4.56 3.95 3.61 3.41 4.23 3.79 3.26 2.34 446 4.2 4.57 2.85 4.68 4.31 4.15 3.79 3.56 4.43 3.95 3.39 2.41 447 4.18 4.38 2.75 4.50 3.96 3.89 3.51 3.26 4.18 3.69 3.11 2.14 448 3.73 4.00 2.57 4.13 4.26 3.55 3.19 2.97 3.84 3.40 2.85 1.96 449 3.75 4.19 2.87 4.34 4.24 3.89 3.60 3.43 4.16 3.74 3.28 2.44 450 4.07 4.23 2.85 4.33 4.29 3.87 3.58 xxx 4.13 3.69 3.22 2.40 451 4.01 4.31 2.92 4.39 3.97 3.91 3.64 xxx 4.16 3.77 3.25 2.46 452 3.51 3.94 2.70 4.06 3.98 3.59 3.33 3.14 3.85 3.48 3.00 2.22 453 3.41 3.89 2.85 4.02 4.47 3.67 3.45 3.32 3.90 3.55 3.16 2.53 454 4.13 4.45 3.11 4.56 4.06 4.14 3.89 3.73 4.38 3.99 3.53 2.80 455 3.89 4.10 2.74 4.23 3.53 3.69 3.36 3.16 3.94 3.51 2.99 2.17 456 3.12 3.52 2.47 3.64 3.71 3.20 2.91 2.75 3.42 3.06 2.61 1.93 457 3.24 3.65 2.67 3.74 4.32 3.44 3.24 3.14 3.62 3.31 2.94 2.38 458 4.11 4.34 3.01 4.41 3.83 4.03 3.78 3.64 4.23 3.85 3.40 2.67 459 3.68 3.88 2.56 3.96 3.31 3.50 3.20 3.02 3.74 3.33 2.83 2.05 460 2.97 3.27 2.29 3.38 3.52 3.00 2.74 2.58 3.23 2.88 2.45 1.80 461 3.01 3.45 2.52 3.58 4.18 3.28 3.07 2.96 3.44 3.13 2.78 2.21 462 3.85 4.21 2.89 4.30 3.71 3.93 3.67 3.52 4.11 3.73 3.30 2.55 463 3.42 3.77 2.40 3.86 3.13 3.38 3.06 2.86 3.67 3.23 2.71 1.87 464 2.66 3.09 2.13 3.22 4.03 2.83 2.57 2.42 3.07 2.72 2.28 1.62 465 3.63 3.91 2.76 4.04 4.34 3.67 3.42 3.28 3.88 3.53 3.09 2.43 466 4.11 4.30 2.91 4.39 3.64 3.97 3.67 3.51 4.21 3.80 3.31 2.54 467 3.28 3.65 2.47 3.72 3.05 3.36 3.09 2.94 3.60 3.20 2.76 2.09 468 xxx 2.96 2.08 3.08 3.17 2.76 2.50 2.36 2.99 xxx 2.26 1.68 469 xxx 3.07 2.30 3.25 4.02 2.97 2.80 2.74 3.11 2.88 2.60 2.18 470 3.69 4.04 2.78 4.17 3.59 3.82 3.61 3.51 3.97 3.66 3.29 2.66 471 3.28 3.63 2.37 3.70 3.03 3.32 3.06 2.91 3.56 3.20 2.76 2.04 472 2.49 2.97 2.09 3.12 3.51 2.77 2.56 2.44 3.00 2.70 2.33 1.77 473 2.97 3.45 2.47 3.63 4.20 3.28 3.07 2.95 3.46 3.15 2.80 2.22 474 3.93 4.28 2.84 4.34 4.08 3.93 3.61 3.51 4.14 3.75 3.31 2.56 475 3.83 4.15 2.64 4.19 3.47 3.71 3.41 3.21 4.03 3.58 3.06 2.20 476 3.01 3.42 2.33 3.55 3.80 3.14 2.88 2.72 3.42 3.05 2.61 1.90 477 3.25 3.73 2.64 3.90 4.42 3.53 3.29 3.17 3.74 3.40 3.02 2.38 478 4.19 4.47 2.97 4.55 4.34 4.12 3.84 3.68 4.36 3.92 3.47 2.68

Appendix A. (continued)
232
479 4.26 4.42 2.79 4.45 3.87 3.92 3.56 3.33 4.27 3.76 3.20 2.26 480 3.52 3.85 2.55 3.95 4.26 3.47 3.15 2.94 3.80 3.36 2.86 2.03 481 3.96 4.27 2.93 4.36 4.93 3.95 3.66 3.49 4.17 3.77 3.33 2.58 482 4.94 5.04 3.24 5.07 4.70 4.55 4.18 3.96 4.83 4.33 3.77 2.85 483 4.83 4.81 2.93 4.85 4.34 4.20 3.75 3.46 4.61 4.04 3.38 2.30 484 4.32 4.39 2.79 4.47 4.58 3.90 3.50 3.24 4.26 3.75 3.17 2.20 485 4.62 4.67 3.01 4.73 5.16 4.19 3.82 3.58 4.51 4.00 3.43 2.50 486 5.39 5.33 3.27 5.35 5.01 4.66 4.21 3.93 5.08 4.47 3.79 2.71 487 5.41 5.19 3.02 5.23 4.79 4.40 3.87 3.54 4.91 4.25 3.50 2.29 488 5.17 4.94 2.92 4.98 4.90 4.22 3.72 3.41 4.67 4.07 3.37 2.22 489 5.33 5.08 3.06 4.61 5.23 4.39 3.93 3.65 4.79 4.20 3.52 2.45 490 5.86 5.48 3.20 4.98 5.13 4.63 4.13 3.82 5.11 4.46 3.71 2.55 491 5.83 5.35 3.01 5.37 5.12 4.46 3.89 3.52 4.99 4.32 3.52 2.26 492 5.72 5.32 3.04 5.35 5.04 4.47 3.92 3.56 4.99 4.33 3.56 2.31 493 5.74 5.23 2.93 5.29 4.54 4.38 3.86 3.50 4.91 4.26 3.47 2.13 494 5.42 4.74 2.73 4.74 5.06 3.97 3.49 3.16 4.43 3.86 3.14 1.95 495 5.58 5.25 3.16 5.21 5.67 4.55 4.12 3.84 4.95 4.37 3.71 2.63 496 6.2 5.90 3.41 5.90 5.21 5.03 4.53 4.19 5.55 4.84 4.07 2.80 497 5.97 5.46 3.00 5.46 5.06 4.50 3.95 3.56 5.09 4.38 3.56 2.25 498 5.68 5.26 2.90 5.25 5.02 4.38 3.85 3.47 4.92 4.26 3.47 2.22 499 5.71 5.23 2.91 5.20 5.54 4.38 3.86 3.51 4.89 4.26 3.47 2.23 500 6.62 5.92 3.24 5.82 5.16 4.81 4.22 3.83 5.42 4.70 3.84 2.47 501 6.42 5.52 2.68 5.50 4.55 xxx 3.72 3.27 4.99 4.24 3.32 1.87 502 5.47 4.71 2.40 4.76 4.65 3.87 3.35 2.98 4.39 3.78 2.99 1.73 503 xxx 4.82 2.50 4.81 5.43 4.05 3.62 3.30 4.53 3.94 3.21 1.99 504 xxx 5.78 2.94 5.73 5.01 4.68 4.13 3.72 5.31 xxx 3.69 2.26 505 6.01 5.39 2.41 5.33 4.06 4.14 3.47 2.99 4.87 xxx 3.16 1.66 506 4.42 4.22 1.98 4.23 4.60 3.41 2.91 2.55 3.94 xxx 2.66 1.45 507 4.9 4.74 2.53 4.77 5.20 4.06 3.60 3.27 4.51 xxx 3.21 1.96 508 5.91 5.47 2.80 5.46 4.66 4.54 3.97 3.57 5.09 xxx 3.52 2.08 509 5.3 4.93 2.34 4.87 3.92 3.98 3.38 2.98 4.52 xxx 3.05 1.70 510 4.01 4.01 2.02 4.05 4.19 3.38 2.91 2.58 3.81 xxx 2.62 1.48 511 4.19 4.26 2.32 4.33 4.80 3.72 3.35 3.07 4.10 xxx 2.96 1.87 512 5.11 4.99 2.60 5.00 4.51 4.22 3.74 3.40 4.70 xxx 3.30 2.04 513 4.87 4.77 2.35 4.68 3.58 3.91 3.37 3.02 4.41 xxx 3.01 1.76 514 3.44 3.66 1.90 3.67 3.87 3.12 2.70 2.45 3.49 xxx 2.42 1.41 515 3.68 3.95 2.31 4.02 4.26 3.54 3.24 3.09 3.78 xxx 2.90 2.07 516 4.29 4.46 2.48 4.47 4.07 3.89 3.53 3.33 4.18 xxx 3.11 2.16 517 4.01 4.18 2.33 4.23 3.23 3.67 3.27 3.03 4.01 xxx 2.89 1.91 518 2.92 3.19 1.90 3.31 3.71 2.86 2.56 2.39 3.14 xxx 2.28 1.52 519 3.28 3.61 2.42 3.79 4.50 3.41 3.19 3.08 3.60 xxx 2.89 2.24 520 4.4 4.58 2.77 4.65 3.83 4.16 3.84 3.87 4.41 xxx 3.44 2.54 521 3.62 3.92 2.32 3.94 3.12 3.47 3.17 2.98 3.79 xxx 2.83 1.99 522 2.7 3.08 1.94 3.19 3.44 2.80 2.55 2.41 3.07 xxx 2.31 1.65 523 3.02 3.36 2.27 3.53 4.00 3.18 2.95 2.83 3.29 xxx 2.69 2.07 524 3.78 4.03 2.54 4.12 3.92 3.71 3.45 3.29 3.96 3.57 3.11 2.34 525 3.76 4.03 2.43 3.95 3.31 3.55 3.24 3.06 3.89 3.43 2.91 2.05 526 2.89 3.31 2.09 3.32 3.45 2.97 2.69 2.55 3.26 2.89 2.45 1.74

Appendix A. (continued)
233
527 2.92 3.41 2.33 3.57 3.79 3.18 2.95 2.85 3.41 3.10 2.71 2.12 528 3.39 3.81 2.49 3.91 3.95 3.52 3.27 3.15 3.76 3.41 2.96 2.29 529 3.61 4.09 2.61 4.00 3.47 3.64 3.38 3.25 3.91 3.52 3.05 2.32 530 3.03 3.57 2.31 3.51 3.55 3.16 2.89 2.77 3.44 3.07 2.65 1.99 531 3.07 3.51 2.52 3.64 3.76 3.32 3.08 2.99 3.51 3.22 2.88 2.33 532 3.36 3.73 2.62 3.86 3.94 3.52 3.29 3.19 3.69 3.40 3.04 2.44 533 3.54 3.87 2.72 4.01 3.79 3.64 3.38 3.25 3.88 3.54 3.12 2.46 534 3.3 3.71 2.64 3.84 3.46 3.51 3.26 3.13 3.75 3.42 3.01 2.39 535 3.18 3.46 2.44 3.51 3.88 3.22 2.98 2.86 3.44 3.13 2.73 2.13 536 3.57 3.89 2.69 4.06 3.92 3.64 3.39 3.26 3.85 3.52 3.09 2.42 537 3.65 3.90 2.60 4.17 3.64 3.62 3.34 3.17 3.86 3.50 3.01 2.21 538 3.42 3.59 2.46 4.07 3.80 3.34 3.07 2.92 3.58 3.24 2.79 2.06 539 3.46 3.77 2.67 4.02 3.95 3.55 3.29 3.18 3.74 3.40 3.02 2.43 540 3.65 3.97 2.72 4.15 3.97 3.69 3.42 3.28 3.89 3.52 3.10 2.45 541 3.64 3.96 2.66 4.27 4.16 3.66 3.34 3.15 3.91 3.52 3.05 2.31 542 3.94 4.17 2.77 4.31 3.93 3.84 3.52 3.34 4.10 3.69 3.20 2.43 543 3.78 3.97 2.53 4.23 4.12 3.57 3.24 3.04 3.88 3.47 2.94 2.15 544 3.97 4.16 2.65 4.19 3.79 3.75 3.41 3.21 4.06 3.63 3.09 2.27 545 3.65 3.85 2.39 4.31 4.11 3.43 3.08 2.87 3.73 3.30 2.79 1.92 546 3.99 4.19 2.57 4.56 4.28 3.71 3.36 3.15 4.06 3.59 3.03 2.10 547 4.41 4.37 2.58 4.23 3.72 3.80 xxx 3.08 4.21 3.69 3.06 1.98 548 3.69 3.73 2.31 3.83 4.20 3.30 2.93 2.72 3.62 3.20 2.67 1.74 549 3.94 4.20 2.72 4.33 4.51 3.79 3.46 3.25 4.11 3.69 3.18 2.34 550 4.61 4.65 2.87 4.65 4.24 4.09 3.72 3.49 4.42 3.93 3.36 2.42 551 4.32 4.39 2.65 4.39 4.10 3.80 3.42 3.18 4.17 3.69 3.10 2.15 552 4 4.16 2.57 4.25 3.91 3.65 3.29 3.05 4.04 3.58 3.00 2.07 553 3.74 3.97 2.52 4.05 4.42 3.54 3.24 3.04 3.87 3.45 2.95 2.12 554 4.48 4.55 2.80 4.61 4.40 4.02 3.66 3.42 4.39 3.89 3.32 2.38 555 4.6 4.55 2.59 4.54 3.70 3.84 3.37 3.04 4.34 3.76 3.07 1.94 556 3.5 3.71 2.23 3.76 4.32 3.19 2.80 2.53 3.62 3.16 2.60 1.67 557 4.17 4.33 2.83 4.40 4.13 3.93 3.58 3.37 4.23 3.80 3.29 2.44 558 4.26 4.27 2.75 4.22 3.99 3.74 3.42 3.22 4.05 3.63 3.12 2.28 559 3.98 4.10 2.74 4.07 3.51 3.64 3.46 3.23 3.92 3.55 3.10 2.39 560 3.13 3.46 2.37 3.58 4.18 3.16 2.86 2.70 3.46 3.09 2.66 2.01 561 3.75 4.10 3.03 4.22 4.66 3.89 3.63 3.50 4.12 3.81 3.45 2.84 562 4.59 4.75 3.31 4.74 4.23 4.37 4.11 3.96 4.62 4.24 3.81 3.09 563 4.24 4.33 2.96 4.30 3.66 3.88 4.00 3.38 4.21 3.77 3.28 2.55 564 3.26 3.58 2.57 3.72 3.72 3.32 2.99 2.85 3.62 3.26 2.85 2.21 565 3.24 3.68 2.75 3.78 4.54 3.47 3.22 3.13 3.69 3.41 3.08 2.53 566 4.47 4.66 3.25 4.64 4.23 4.29 4.02 3.89 4.51 4.15 3.72 3.02 567 4.22 4.33 2.90 4.38 3.40 3.88 3.55 3.36 4.21 3.77 3.27 2.46 568 2.91 3.33 2.41 3.49 3.65 3.05 2.76 2.60 3.36 3.03 2.65 2.02 569 3.08 3.52 2.67 3.70 4.49 3.38 3.16 3.05 3.59 3.32 3.00 2.48 570 4.29 4.51 3.18 4.61 4.04 4.22 3.96 3.82 4.45 4.08 3.65 2.94 571 4.06 4.12 2.75 4.19 3.35 3.71 3.40 3.22 4.02 3.61 3.13 2.35 572 3.07 3.28 2.34 3.41 3.56 3.02 2.73 2.58 3.31 2.99 2.61 1.99 573 3.05 3.43 2.54 3.58 4.61 3.27 3.04 2.93 3.51 3.21 2.88 2.33 574 4.4 4.64 3.15 4.70 3.55 4.29 4.02 3.85 4.56 4.14 3.68 2.92
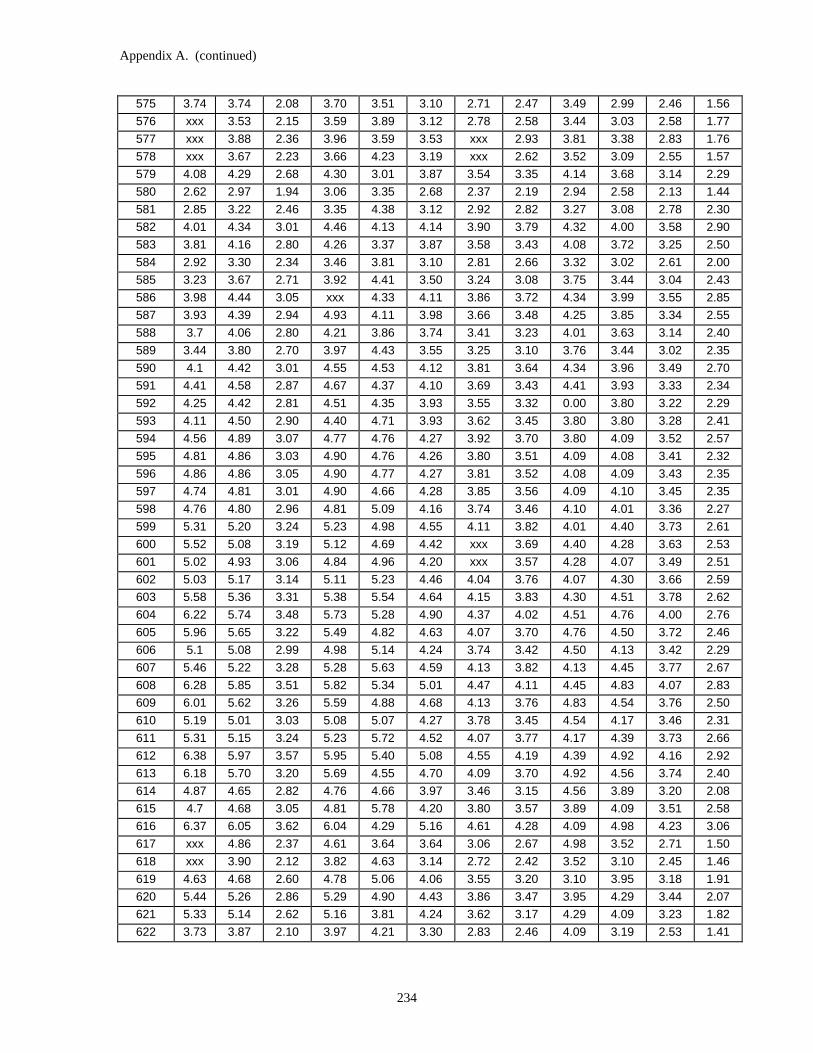
Appendix A. (continued)
234
575 3.74 3.74 2.08 3.70 3.51 3.10 2.71 2.47 3.49 2.99 2.46 1.56 576 xxx 3.53 2.15 3.59 3.89 3.12 2.78 2.58 3.44 3.03 2.58 1.77 577 xxx 3.88 2.36 3.96 3.59 3.53 xxx 2.93 3.81 3.38 2.83 1.76 578 xxx 3.67 2.23 3.66 4.23 3.19 xxx 2.62 3.52 3.09 2.55 1.57 579 4.08 4.29 2.68 4.30 3.01 3.87 3.54 3.35 4.14 3.68 3.14 2.29 580 2.62 2.97 1.94 3.06 3.35 2.68 2.37 2.19 2.94 2.58 2.13 1.44 581 2.85 3.22 2.46 3.35 4.38 3.12 2.92 2.82 3.27 3.08 2.78 2.30 582 4.01 4.34 3.01 4.46 4.13 4.14 3.90 3.79 4.32 4.00 3.58 2.90 583 3.81 4.16 2.80 4.26 3.37 3.87 3.58 3.43 4.08 3.72 3.25 2.50 584 2.92 3.30 2.34 3.46 3.81 3.10 2.81 2.66 3.32 3.02 2.61 2.00 585 3.23 3.67 2.71 3.92 4.41 3.50 3.24 3.08 3.75 3.44 3.04 2.43 586 3.98 4.44 3.05 xxx 4.33 4.11 3.86 3.72 4.34 3.99 3.55 2.85 587 3.93 4.39 2.94 4.93 4.11 3.98 3.66 3.48 4.25 3.85 3.34 2.55 588 3.7 4.06 2.80 4.21 3.86 3.74 3.41 3.23 4.01 3.63 3.14 2.40 589 3.44 3.80 2.70 3.97 4.43 3.55 3.25 3.10 3.76 3.44 3.02 2.35 590 4.1 4.42 3.01 4.55 4.53 4.12 3.81 3.64 4.34 3.96 3.49 2.70 591 4.41 4.58 2.87 4.67 4.37 4.10 3.69 3.43 4.41 3.93 3.33 2.34 592 4.25 4.42 2.81 4.51 4.35 3.93 3.55 3.32 0.00 3.80 3.22 2.29 593 4.11 4.50 2.90 4.40 4.71 3.93 3.62 3.45 3.80 3.80 3.28 2.41 594 4.56 4.89 3.07 4.77 4.76 4.27 3.92 3.70 3.80 4.09 3.52 2.57 595 4.81 4.86 3.03 4.90 4.76 4.26 3.80 3.51 4.09 4.08 3.41 2.32 596 4.86 4.86 3.05 4.90 4.77 4.27 3.81 3.52 4.08 4.09 3.43 2.35 597 4.74 4.81 3.01 4.90 4.66 4.28 3.85 3.56 4.09 4.10 3.45 2.35 598 4.76 4.80 2.96 4.81 5.09 4.16 3.74 3.46 4.10 4.01 3.36 2.27 599 5.31 5.20 3.24 5.23 4.98 4.55 4.11 3.82 4.01 4.40 3.73 2.61 600 5.52 5.08 3.19 5.12 4.69 4.42 xxx 3.69 4.40 4.28 3.63 2.53 601 5.02 4.93 3.06 4.84 4.96 4.20 xxx 3.57 4.28 4.07 3.49 2.51 602 5.03 5.17 3.14 5.11 5.23 4.46 4.04 3.76 4.07 4.30 3.66 2.59 603 5.58 5.36 3.31 5.38 5.54 4.64 4.15 3.83 4.30 4.51 3.78 2.62 604 6.22 5.74 3.48 5.73 5.28 4.90 4.37 4.02 4.51 4.76 4.00 2.76 605 5.96 5.65 3.22 5.49 4.82 4.63 4.07 3.70 4.76 4.50 3.72 2.46 606 5.1 5.08 2.99 4.98 5.14 4.24 3.74 3.42 4.50 4.13 3.42 2.29 607 5.46 5.22 3.28 5.28 5.63 4.59 4.13 3.82 4.13 4.45 3.77 2.67 608 6.28 5.85 3.51 5.82 5.34 5.01 4.47 4.11 4.45 4.83 4.07 2.83 609 6.01 5.62 3.26 5.59 4.88 4.68 4.13 3.76 4.83 4.54 3.76 2.50 610 5.19 5.01 3.03 5.08 5.07 4.27 3.78 3.45 4.54 4.17 3.46 2.31 611 5.31 5.15 3.24 5.23 5.72 4.52 4.07 3.77 4.17 4.39 3.73 2.66 612 6.38 5.97 3.57 5.95 5.40 5.08 4.55 4.19 4.39 4.92 4.16 2.92 613 6.18 5.70 3.20 5.69 4.55 4.70 4.09 3.70 4.92 4.56 3.74 2.40 614 4.87 4.65 2.82 4.76 4.66 3.97 3.46 3.15 4.56 3.89 3.20 2.08 615 4.7 4.68 3.05 4.81 5.78 4.20 3.80 3.57 3.89 4.09 3.51 2.58 616 6.37 6.05 3.62 6.04 4.29 5.16 4.61 4.28 4.09 4.98 4.23 3.06 617 xxx 4.86 2.37 4.61 3.64 3.64 3.06 2.67 4.98 3.52 2.71 1.50 618 xxx 3.90 2.12 3.82 4.63 3.14 2.72 2.42 3.52 3.10 2.45 1.46 619 4.63 4.68 2.60 4.78 5.06 4.06 3.55 3.20 3.10 3.95 3.18 1.91 620 5.44 5.26 2.86 5.29 4.90 4.43 3.86 3.47 3.95 4.29 3.44 2.07 621 5.33 5.14 2.62 5.16 3.81 4.24 3.62 3.17 4.29 4.09 3.23 1.82 622 3.73 3.87 2.10 3.97 4.21 3.30 2.83 2.46 4.09 3.19 2.53 1.41

Appendix A. (continued)
235
623 3.89 4.20 2.51 4.30 4.97 3.77 3.37 3.08 3.19 3.67 3.11 2.12 624 5.1 5.08 2.86 5.11 4.34 4.46 3.99 3.66 3.67 4.25 3.54 2.34 625 4.44 4.47 2.38 4.50 3.70 3.76 3.21 2.78 4.25 3.66 2.95 1.79 626 3.42 3.71 2.06 3.77 3.87 3.19 2.71 2.30 3.66 3.12 2.53 1.55 627 3.53 3.89 2.34 3.95 4.66 3.41 2.95 2.56 3.12 3.36 2.85 1.95 628 4.55 4.77 2.71 4.79 4.18 4.14 3.63 3.22 3.36 4.00 3.36 2.25 629 4.09 4.29 2.26 4.29 3.53 3.56 2.97 2.47 4.00 3.49 2.80 1.68 630 3.16 3.53 1.93 3.59 3.76 2.95 2.40 1.92 3.49 2.96 2.38 1.42 631 3.34 3.74 2.21 3.85 4.29 3.25 2.78 2.36 2.96 3.23 2.71 1.81 632 4.01 4.32 2.45 4.42 3.74 3.76 3.27 2.84 3.23 3.68 3.06 2.02 633 3.51 3.80 2.10 3.86 3.25 3.24 2.76 2.34 3.68 3.17 2.57 1.56 634 2.85 3.30 1.88 3.35 3.87 2.78 2.32 1.91 3.17 2.77 2.27 1.39 635 xxx 3.79 2.25 3.88 3.47 3.38 xxx 2.48 2.77 3.32 2.78 1.79 636 xxx 3.38 2.04 3.49 4.09 3.00 xxx 2.13 3.32 2.95 2.42 1.52 637 3.63 4.07 2.75 4.13 3.60 3.72 3.33 3.01 2.95 3.66 3.21 2.49 638 3.02 3.53 2.36 3.63 3.39 3.26 2.86 2.60 3.66 3.17 2.74 2.07 639 2.76 3.24 2.37 3.45 3.86 3.09 2.81 2.58 3.17 3.01 2.64 2.05 640 3.35 3.75 2.62 3.92 3.58 3.54 3.25 2.99 3.01 3.45 3.04 2.38 641 3.09 3.50 2.47 3.62 3.82 3.29 2.98 2.73 3.45 3.18 2.77 2.15 642 3.29 3.76 2.58 3.88 3.42 3.52 3.20 2.95 3.18 3.39 2.95 2.26 643 2.91 3.37 2.20 3.50 3.57 3.07 2.72 2.41 3.39 2.96 2.49 1.76 644 3.06 3.55 2.30 3.63 3.78 3.22 2.85 2.53 2.96 3.12 2.65 1.90 645 3.3 3.80 2.48 3.87 3.74 3.41 2.99 2.64 3.12 3.31 2.82 2.01 646 3.3 3.72 2.47 3.86 3.47 3.37 2.97 2.62 3.31 3.26 2.77 1.98 647 2.97 5.43 2.24 3.61 3.54 3.08 2.71 2.37 3.26 3.00 2.52 1.76 648 3.04 3.29 2.28 3.64 3.60 3.15 2.76 2.42 3.00 3.07 2.61 1.83 649 3.32 3.57 2.25 3.64 4.30 3.18 2.75 2.38 3.07 3.08 2.55 1.71 650 3.96 4.31 2.63 4.37 3.10 xxx 3.32 2.93 3.08 3.69 3.07 2.09 651 xxx 3.13 1.57 3.05 2.51 xxx xxx xxx 3.69 xxx xxx xxx 652 xxx 2.55 1.29 2.39 4.54 xxx xxx xxx xxx xxx xxx xxx 653 xxx 4.59 2.72 4.65 4.37 xxx 3.27 2.72 xxx 3.89 3.25 2.17 654 4.23 4.37 2.62 4.53 4.26 3.78 3.17 2.65 3.89 3.71 3.05 1.96 655 3.93 4.26 2.69 4.33 3.87 3.66 3.03 2.50 3.71 3.70 3.14 2.17 656 3.41 3.83 2.46 3.95 4.10 3.28 2.68 2.16 3.70 3.34 2.81 1.90 657 3.54 4.08 2.79 4.21 4.50 3.51 2.89 2.34 3.34 3.65 3.17 2.38 658 4.2 4.54 2.98 4.60 4.32 3.90 3.26 2.69 3.65 3.96 3.45 2.58 659 4.05 4.30 2.78 4.46 4.10 3.57 2.89 2.25 3.96 3.72 3.16 2.22 660 3.61 4.03 2.65 4.26 4.00 3.35 2.68 2.06 3.72 3.55 3.00 2.10 661 3.48 3.98 2.71 4.14 4.76 3.34 2.66 2.05 3.55 3.53 3.03 2.22 662 4.55 4.84 3.07 4.89 4.40 4.06 3.36 2.71 3.53 4.15 3.56 2.57 663 4.24 4.51 2.65 4.59 3.89 3.56 2.81 2.09 4.15 3.72 3.05 1.94 664 3.38 3.90 2.42 4.08 4.24 3.08 2.34 1.66 3.72 3.32 2.72 1.75 665 3.77 4.21 2.73 4.40 4.65 3.46 2.71 2.04 3.32 3.68 3.11 2.16 666 4.58 4.71 2.94 4.80 4.70 3.84 3.08 2.37 3.68 4.01 3.39 2.35 667 4.49 4.76 2.90 4.89 3.61 3.82 3.02 2.26 4.01 4.01 3.34 2.20 668 3.33 3.60 2.40 3.83 4.33 2.83 2.12 1.52 4.01 3.11 2.58 1.68 669 3.78 4.19 2.81 4.52 4.77 3.53 2.82 2.24 3.11 3.87 3.38 2.54 670 5.03 4.79 3.10 4.97 3.41 3.89 3.10 2.41 3.87 4.20 3.65 2.76

Appendix A. (continued)
236
671 3.84 3.52 1.90 3.55 3.62 2.73 2.15 1.60 xxx xxx 2.39 1.61 672 3.56 3.67 2.09 3.72 3.82 2.96 2.38 1.85 xxx xxx 2.64 1.85 673 3.83 3.90 2.12 3.98 4.89 3.03 2.35 1.69 xxx 3.19 2.55 1.32 674 4.98 5.06 2.69 5.10 4.20 4.03 3.32 2.61 xxx 4.19 3.47 2.19 675 4.86 4.58 1.77 4.52 3.16 3.08 2.19 1.35 xxx 3.26 2.33 xxx 676 3.23 3.35 1.44 3.42 3.65 2.22 1.54 0.95 3.26 2.50 1.81 xxx 677 3.48 3.79 1.74 3.90 4.74 2.65 1.80 1.04 2.50 2.97 2.19 xxx 678 4.77 4.93 2.28 4.96 4.46 3.64 2.63 1.69 2.97 3.82 2.93 xxx 679 4.87 4.78 1.56 4.78 3.42 3.05 1.92 0.90 3.82 3.43 2.46 xxx 680 3.36 3.68 1.14 3.76 3.59 2.23 1.39 xxx 3.43 2.65 1.79 xxx 681 3.33 3.87 1.66 3.92 4.63 2.49 1.47 xxx 2.65 3.00 2.23 xxx 682 4.75 4.96 2.11 4.95 4.04 3.36 2.16 xxx 3.00 3.74 2.86 xxx 683 4.35 4.42 1.51 4.40 3.30 2.61 1.44 xxx 3.74 3.19 2.33 xxx 684 3.4 3.64 1.23 3.65 3.31 2.09 1.18 xxx 3.19 2.67 1.89 xxx 685 3.3 3.68 1.48 3.66 4.29 2.05 1.12 xxx 2.67 2.79 2.07 xxx 686 4.45 4.64 1.83 4.66 4.01 2.87 1.75 xxx 2.79 3.50 2.67 xxx 687 4.47 4.46 1.55 4.48 3.14 2.38 1.18 xxx 3.50 3.11 2.21 xxx 688 3.35 3.57 1.21 3.58 3.21 1.82 0.93 xxx 3.11 2.51 1.74 xxx 689 3.21 3.68 1.59 3.65 3.93 1.80 0.87 xxx 2.51 2.69 1.93 xxx 690 4.04 4.37 1.79 4.36 3.77 2.38 1.37 xxx 2.69 3.20 2.38 xxx 691 4.23 4.31 1.67 4.27 2.96 2.03 0.88 xxx 3.20 2.95 2.08 xxx 692 3.24 3.50 1.33 3.44 3.15 1.60 0.79 xxx 2.95 2.34 1.55 xxx 693 3.35 3.72 1.74 3.68 3.73 1.55 0.63 xxx 2.34 2.63 1.84 xxx 694 3.95 4.28 1.88 4.23 3.67 2.05 1.07 xxx 2.63 3.09 2.27 xxx 695 4.15 4.34 2.04 4.25 3.22 1.83 0.73 xxx 3.09 3.03 2.16 xxx 696 3.55 3.87 1.79 3.79 3.23 1.65 0.76 xxx 3.03 2.66 1.82 xxx 697 3.55 3.91 1.97 3.83 3.27 1.56 0.59 xxx 2.66 2.75 1.95 xxx 698 3.63 3.94 1.96 3.86 3.54 1.67 0.73 xxx 2.75 2.77 1.96 xxx 699 4.14 4.32 2.28 4.21 3.49 1.75 0.69 xxx 2.77 3.05 2.19 xxx 700 4.01 4.25 2.18 4.16 3.36 1.73 0.68 xxx 3.05 2.99 2.13 xxx 701 3.78 4.06 2.20 4.03 3.30 1.65 0.70 xxx 2.99 2.91 2.11 xxx 702 3.75 4.01 2.15 3.96 3.62 1.59 0.62 xxx 2.91 2.85 2.05 xxx 703 4.19 4.38 2.46 4.26 3.96 1.83 0.80 xxx 2.85 3.15 2.32 xxx 704 4.59 4.74 2.57 4.60 3.60 1.98 0.82 xxx 3.15 3.40 2.52 xxx 705 4.22 4.31 2.32 4.20 3.42 1.85 0.87 xxx 3.40 3.07 2.24 xxx 706 4 4.13 2.25 4.05 3.56 1.67 0.67 xxx 3.07 2.94 2.13 xxx 707 4.5 4.56 2.52 4.43 0.24 2.03 0.93 xxx 2.94 3.28 2.43 xxx 708 4.98 5.01 2.70 4.90 4.25 2.26 0.99 xxx xxx 3.60 2.70 xxx 709 4.84 4.55 2.42 4.26 3.73 2.06 1.04 xxx 4.35 3.10 2.32 xxx 710 4.16 4.06 2.19 3.80 3.26 1.67 0.71 xxx 3.71 2.77 2.04 xxx 711 5.02 4.93 2.77 4.86 4.23 2.41 1.20 xxx 3.70 3.65 2.76 xxx 712 5.5 5.13 2.84 4.98 4.33 2.38 1.04 xxx 4.36 3.68 2.75 xxx 713 5.06 5.06 2.84 4.97 4.40 2.51 1.33 xxx 4.44 3.77 2.90 xxx 714 4.42 4.54 2.58 4.45 3.88 2.04 0.93 xxx 4.46 3.32 2.49 1.03 715 4.78 4.82 2.93 4.75 4.21 2.47 1.36 xxx 3.97 3.70 2.93 1.58 716 6.12 5.67 3.26 5.55 5.01 2.96 1.57 xxx 4.32 4.31 3.37 1.80 717 5.28 5.07 2.65 4.96 4.49 2.70 1.50 xxx 5.06 3.80 2.94 1.49 718 4.56 4.58 2.47 4.50 4.01 2.31 1.19 xxx 4.49 3.44 2.66 1.31

Appendix A. (continued)
237
719 5.17 5.07 2.89 4.98 4.48 2.84 1.61 xxx 4.05 3.88 3.08 1.70 720 5.52 5.42 3.03 5.33 4.81 3.03 1.66 xxx 4.51 4.13 3.25 1.72 721 5.48 5.39 2.98 5.34 4.86 3.15 1.90 xxx 4.84 4.15 3.28 1.80 722 4.47 4.61 2.65 4.59 4.12 2.52 1.38 xxx 4.87 3.55 2.79 1.45 723 4.62 4.80 2.94 4.72 4.33 3.03 1.84 xxx 4.16 3.84 3.18 1.96 724 6.03 5.93 3.40 5.78 5.39 3.84 2.35 1.24 4.36 4.62 3.76 2.23 725 5.62 5.47 2.89 5.39 4.98 3.54 2.20 1.22 5.34 4.15 3.24 1.71 726 4.44 4.52 2.50 4.51 4.10 2.77 1.58 0.74 4.89 3.50 2.75 1.44 727 4.51 4.82 2.88 4.79 4.47 3.31 2.16 1.32 4.08 3.91 3.25 2.06 728 5.88 5.86 3.30 5.75 5.40 4.10 2.72 1.58 4.45 4.59 3.75 2.29 729 5.67 5.52 2.85 5.46 5.07 3.77 2.56 1.55 5.31 4.20 3.29 1.78 730 4.11 4.34 2.38 4.35 3.97 2.78 1.73 0.91 4.95 3.39 2.67 1.41 731 4.2 4.65 2.83 4.65 4.36 3.42 2.47 1.74 3.95 3.85 3.24 2.12 732 5.38 5.54 3.18 5.48 5.16 4.08 2.94 1.95 4.33 4.43 3.64 2.31 733 5.16 5.29 2.91 5.28 5.00 4.01 3.11 2.26 5.06 4.18 3.37 2.01 734 3.24 3.68 2.22 3.69 3.44 2.55 1.78 1.12 4.83 2.93 2.33 1.29 735 4.54 4.73 3.39 5.24 5.05 4.14 3.50 2.94 3.39 4.57 4.02 3.02 736 5.75 5.40 3.60 5.90 5.66 4.66 3.90 3.16 4.89 xxx 4.34 3.20 737 4.5 4.68 3.02 4.77 4.61 4.05 3.47 2.97 xxx xxx 3.40 2.47 738 3.37 3.99 2.69 4.20 4.06 3.53 2.98 2.53 xxx 3.54 3.01 2.17 739 3.61 4.14 2.96 4.32 4.25 3.84 3.40 3.04 3.96 3.77 3.29 2.55 740 4.42 4.78 3.24 4.90 4.79 4.34 3.87 3.48 4.15 4.23 3.69 2.82 741 4.19 4.56 3.05 4.70 4.55 4.08 3.62 3.26 4.68 3.95 3.40 2.54 742 3.15 3.66 2.58 3.85 3.73 3.30 2.86 2.52 4.42 3.27 2.82 2.14 743 3.61 4.13 3.01 4.32 4.24 3.83 3.51 3.22 3.65 3.80 3.37 2.71 744 4.02 4.46 3.16 4.64 4.56 4.12 3.79 3.52 4.16 4.03 3.54 2.77 745 3.65 4.17 3.05 4.35 4.27 3.93 3.58 3.35 4.45 3.80 3.36 2.75 746 3.22 3.80 2.78 3.99 3.91 3.58 3.25 3.01 4.17 3.49 3.08 2.52 747 3.11 3.73 2.76 3.92 3.84 3.56 3.27 3.06 3.84 3.44 3.05 2.49 748 3.49 4.09 2.99 4.25 4.16 3.87 xxx 3.34 3.77 3.74 3.32 2.69 749 3.42 4.00 2.92 4.16 4.07 3.77 3.45 3.27 4.08 3.64 3.25 2.64 750 3.11 3.69 2.74 3.88 3.79 3.48 3.18 2.99 3.98 3.39 3.02 2.46 751 2.77 3.36 2.53 3.62 3.51 3.23 2.99 2.82 3.71 3.14 2.79 2.29 752 2.93 3.43 2.59 3.66 3.58 3.31 3.06 2.90 3.43 3.22 2.87 2.35 753 3.06 3.62 2.76 3.81 3.74 3.49 3.27 3.13 3.50 3.40 3.09 2.60 754 3.48 3.91 2.88 4.06 3.97 3.69 3.45 3.30 3.66 3.60 3.24 2.68 755 3.22 3.62 2.61 3.79 3.67 3.38 3.11 2.95 3.88 3.29 2.90 2.32 756 2.67 3.30 2.46 3.47 3.40 3.13 2.89 2.72 3.58 3.05 2.71 2.20 757 2.79 3.43 2.62 3.62 3.56 3.34 3.13 3.01 3.30 3.24 2.94 2.47 758 3.43 3.94 2.93 4.13 4.00 3.77 3.54 3.41 3.47 3.67 3.32 2.74 759 3.08 3.52 2.48 3.70 3.58 3.28 3.02 2.84 3.94 3.19 2.78 2.15 760 2.59 3.10 2.28 3.30 3.24 2.95 2.70 2.53 3.52 2.86 2.50 1.98 761 2.84 3.37 2.54 3.56 3.51 3.29 3.09 2.96 3.15 3.18 2.87 2.38 762 3.7 4.11 2.93 4.26 4.13 3.88 3.65 3.50 3.41 3.76 3.37 2.73 763 3.25 3.71 2.48 3.83 3.65 3.35 3.07 2.87 4.05 3.25 2.81 2.10 764 2.58 3.23 2.26 3.37 3.24 2.97 2.66 2.53 3.61 2.88 2.52 1.93 765 3.38 3.91 2.77 4.08 3.99 3.66 3.38 3.19 3.18 3.54 3.12 2.44 766 3.97 4.30 2.96 4.43 4.32 3.96 3.67 3.47 3.86 3.83 3.35 2.60

Appendix A. (continued)
238
767 3.57 3.98 2.72 4.08 3.97 3.64 3.36 3.17 4.21 3.51 3.06 2.36 768 2.77 3.31 2.37 3.48 3.40 3.10 2.84 2.66 3.89 3.00 2.61 2.01 769 3.31 3.86 2.81 3.99 3.93 3.67 3.40 3.24 3.33 3.54 3.15 2.56 770 4.31 4.69 3.20 4.75 4.62 4.34 4.03 3.84 3.84 4.16 3.69 2.93 771 3.97 4.35 2.91 4.43 4.26 3.95 3.61 3.39 4.54 3.78 3.29 2.48 772 3.05 3.59 2.55 3.77 3.65 3.35 3.03 2.84 4.19 3.23 2.81 2.14 773 3.41 3.89 2.85 4.11 4.01 3.73 3.44 3.28 3.57 3.60 3.19 2.57 774 4.5 4.79 3.29 4.91 4.76 4.46 4.14 3.93 3.91 4.26 3.76 2.99 775 4.61 4.75 3.08 4.86 4.66 4.25 3.85 3.57 4.66 4.06 3.48 2.56 776 3.48 3.81 2.60 4.01 3.87 3.48 3.10 2.86 4.56 3.35 2.87 2.08 777 3.78 4.20 3.07 4.40 4.33 3.94 3.71 3.53 3.77 3.88 3.47 2.79 778 4.81 5.02 3.46 5.14 5.02 4.59 4.33 4.11 4.22 4.48 3.97 3.16 779 4.6 4.83 3.20 4.94 4.75 4.33 3.95 3.68 4.91 4.16 3.59 2.71 780 3.71 4.08 2.82 4.25 4.10 3.71 3.35 3.10 4.65 3.59 3.08 2.32 781 3.82 4.21 3.07 4.42 4.35 3.97 3.74 3.55 4.00 3.91 3.48 2.81 782 5.47 5.46 3.66 5.55 5.39 4.93 4.64 4.40 4.25 4.80 4.27 3.37 783 4.93 4.95 3.09 5.00 4.76 4.29 3.85 3.54 5.28 4.11 3.49 2.47 784 3.77 4.04 2.74 4.22 4.03 3.63 3.25 2.99 4.69 3.51 2.98 2.15 785 4.07 4.27 3.00 4.47 4.34 3.99 3.69 3.49 3.97 3.85 3.38 2.66 786 5.06 5.15 3.38 5.25 5.08 4.67 4.31 4.06 4.24 4.48 3.91 3.02 787 5.28 5.21 3.24 5.31 5.06 4.53 4.07 3.72 4.97 4.36 3.68 2.58 788 4.09 4.32 2.82 4.43 4.28 3.79 3.36 3.07 4.95 3.68 3.10 2.17 789 4.02 4.38 3.08 4.48 4.41 4.07 3.75 3.57 4.20 3.94 3.48 2.76 790 5.48 5.53 3.60 5.63 5.43 5.02 4.63 4.37 4.32 4.82 4.23 3.27 791 5 4.85 2.77 4.83 4.60 4.06 3.55 3.18 5.31 3.90 3.18 2.03 792 4.06 4.27 2.65 4.38 4.29 3.83 3.45 3.18 4.51 3.67 3.08 2.21 793 4.82 4.73 2.85 4.88 4.71 4.00 3.37 2.85 4.18 3.89 3.09 1.77 794 5.53 5.22 3.04 5.28 5.07 4.36 3.70 3.12 4.54 4.24 3.41 2.01 795 xxx 4.98 2.77 5.01 4.78 4.02 3.29 2.64 4.90 3.93 3.06 1.59 796 xxx 4.08 2.47 4.20 4.02 3.32 2.64 2.06 4.61 3.33 2.62 1.37 797 4.04 4.29 2.69 4.47 4.31 3.69 3.03 2.48 3.87 3.65 2.98 1.78 798 5.14 5.12 3.02 5.22 5.01 4.34 3.66 3.05 4.18 4.21 3.40 2.01 799 4.98 4.94 2.63 5.06 4.78 3.98 3.19 2.46 4.86 3.97 3.09 1.66 800 4.36 4.36 2.45 4.52 4.27 3.51 2.74 2.05 4.64 3.56 2.79 1.50 801 3.82 4.00 xxx 4.17 3.99 3.31 2.66 2.04 4.14 3.40 2.73 1.57 802 xxx 5.88 xxx 6.02 5.70 4.82 4.04 xxx 3.89 4.80 3.86 2.35 803 xxx 5.30 xxx 5.32 4.82 3.58 2.61 1.75 5.56 3.74 2.68 0.94 804 xxx 3.95 xxx 4.02 3.69 2.67 1.86 1.12 4.64 2.93 2.18 0.92 805 xxx 4.16 xxx 4.21 3.98 3.10 2.27 1.49 3.54 3.23 2.47 1.13 806 4.08 4.06 1.63 4.08 3.83 2.95 2.13 1.36 3.83 3.07 2.29 0.99 807 4.64 4.76 1.67 4.77 4.47 3.44 2.45 1.58 3.69 3.65 2.76 1.33 808 4.18 4.25 1.45 4.21 3.90 2.95 2.07 1.32 4.34 3.17 2.32 0.91 809 4.01 4.37 1.65 4.40 4.09 3.13 2.27 1.49 3.79 3.48 2.76 1.45 810 4.17 4.53 1.72 4.59 4.28 3.30 2.38 1.56 4.02 3.59 2.84 1.44 811 4.24 4.52 1.79 4.52 4.26 3.28 2.28 1.44 4.18 3.61 2.88 1.58 812 4.62 4.82 1.90 4.80 4.55 3.53 2.50 1.60 4.18 3.83 3.03 1.66 813 3.97 4.37 1.74 4.43 4.14 3.10 2.17 1.28 4.44 3.49 2.74 1.44 814 3.56 4.04 1.53 4.14 3.85 2.87 2.01 1.22 4.04 3.25 2.56 1.33

Appendix A. (continued)
239
815 3.94 4.43 2.04 4.46 4.18 3.19 2.15 1.30 3.77 3.60 2.91 1.66 816 4.54 4.90 2.16 4.91 4.63 3.58 2.48 1.53 4.12 3.95 3.17 1.80 817 4.34 4.69 2.06 4.74 4.41 3.23 2.18 1.20 4.54 3.70 2.90 1.51 818 3.45 3.99 1.70 4.06 3.75 2.70 1.79 1.02 4.33 3.16 2.49 1.26 819 3.95 4.46 2.30 4.50 4.21 3.05 2.02 1.17 3.70 3.65 3.00 1.74 820 5.16 5.37 2.59 5.38 5.09 3.80 2.61 1.58 4.17 4.33 3.51 2.03 821 4.44 4.71 2.20 4.75 4.42 3.16 2.04 1.06 4.98 3.66 2.84 1.43 822 3.51 4.01 1.91 4.49 3.75 2.63 1.69 0.91 4.31 3.17 2.49 1.26 823 4.21 4.56 2.38 5.02 4.25 3.02 1.93 1.04 3.70 3.65 2.93 1.61 824 5.39 5.54 2.76 5.56 5.20 3.82 2.56 1.48 4.22 4.36 3.47 1.95 825 4.59 4.81 2.30 4.82 4.47 3.13 1.98 xxx 5.09 3.67 2.77 1.34 826 3.85 4.29 2.07 4.34 4.00 2.75 1.72 xxx 4.37 3.35 2.56 1.27 827 4.3 4.39 2.17 4.33 3.99 2.79 1.76 xxx 3.95 3.34 2.57 1.29 828 5.36 5.30 2.59 5.18 4.83 3.55 2.38 xxx 3.95 3.97 3.08 1.62 829 5.45 5.36 2.40 5.15 4.74 3.34 2.13 xxx 4.73 3.79 2.84 1.26 830 3.78 4.02 1.81 3.89 3.47 2.24 1.27 xxx 4.61 2.84 2.09 0.82 831 4.7 5.02 2.70 5.04 4.65 3.34 2.22 xxx 3.46 3.98 3.18 1.79 832 5.49 5.47 2.81 5.40 5.00 3.55 2.27 1.24 4.63 4.20 3.29 1.72 833 4.6 4.88 2.59 4.85 4.52 3.35 2.30 1.43 4.94 3.85 3.06 1.71 834 4.15 4.55 2.42 4.56 4.22 3.07 2.03 1.17 4.44 3.61 2.86 1.55 835 4.59 4.89 2.71 4.91 4.59 3.45 2.44 1.61 4.16 3.93 3.19 1.88 836 5.57 5.61 3.01 5.55 5.25 4.04 2.90 1.87 4.53 4.43 3.56 2.07 837 5.13 5.31 2.70 5.18 4.88 3.76 2.71 1.77 5.14 4.03 3.16 1.68 838 4.22 4.57 2.37 4.55 4.22 3.13 2.17 1.35 4.74 3.52 2.78 1.46 839 4.56 5.02 2.74 4.91 4.61 3.57 2.63 1.83 4.12 3.93 3.23 1.93 840 5.29 5.74 3.03 5.50 5.20 4.12 3.08 2.13 4.52 4.39 3.56 2.08 841 5.57 5.60 2.86 5.45 5.13 3.98 2.95 2.01 5.09 4.24 3.33 1.79 842 4.38 4.60 2.46 4.60 4.28 3.19 2.27 1.48 4.99 3.58 2.82 1.48 843 4.27 4.73 2.86 4.82 4.54 3.59 2.75 2.02 4.19 3.96 3.33 2.10 844 5.11 5.41 3.09 5.42 5.15 4.14 3.20 2.31 4.47 4.39 3.64 2.23 845 4.98 5.17 2.79 5.11 4.85 3.88 2.93 2.08 5.02 4.03 3.23 1.84 846 3.97 4.43 2.49 4.46 4.20 3.29 2.39 1.68 4.69 3.55 2.86 1.61 847 xxx 4.00 2.54 4.08 3.90 3.26 2.57 1.98 4.10 3.46 2.98 1.94 848 xxx 4.29 2.66 4.31 4.13 3.45 2.71 2.04 3.81 3.61 3.05 1.97 849 4.8 4.95 2.91 5.01 4.75 3.89 3.00 2.26 4.05 4.04 3.29 2.04 850 3.77 4.10 2.54 4.23 3.94 3.16 2.36 1.73 4.63 3.39 2.76 1.66 851 3.51 4.19 2.85 4.32 4.11 3.44 2.73 2.16 3.88 3.70 3.20 2.28 852 4.42 4.86 3.12 4.92 4.74 3.99 3.20 2.52 4.08 4.16 3.57 2.52 853 4.17 4.45 2.73 4.48 4.30 3.55 2.78 2.10 4.64 3.66 3.05 1.98 854 3.78 4.24 2.68 4.29 4.10 3.38 2.65 2.02 4.18 3.55 2.99 1.97 855 3.49 3.81 2.34 3.71 3.55 2.90 2.25 1.66 4.02 3.04 2.54 1.62 856 3.59 3.99 2.43 3.84 3.70 3.03 2.37 1.76 3.45 3.17 2.64 1.70 857 3.97 4.57 2.78 4.58 4.39 3.56 2.72 1.99 3.59 3.81 3.19 2.10 858 3.34 3.84 2.43 3.93 3.70 2.96 2.20 1.58 4.31 3.20 2.65 1.68 859 2.84 3.56 2.42 3.66 3.48 2.85 2.18 1.62 3.65 3.12 2.70 1.93 860 3.55 4.40 2.76 4.43 4.27 3.54 2.77 2.06 3.47 3.76 3.24 2.31 861 4.36 5.09 3.08 5.06 4.84 3.93 2.97 2.16 4.21 4.23 3.59 2.46 862 3.54 4.19 2.68 4.27 4.02 3.21 2.36 1.70 4.76 3.55 2.98 1.98

Appendix A. (continued)
240
863 3.33 3.98 2.69 4.11 3.90 3.12 2.38 1.75 4.00 3.51 3.04 2.22 864 3.61 4.13 2.73 4.22 4.03 3.22 2.46 1.78 3.90 3.57 3.09 2.27 865 2.78 3.50 2.49 3.62 3.45 2.81 2.15 1.56 3.99 3.10 2.73 2.11 866 3.07 3.72 2.58 3.85 3.68 3.02 2.33 1.71 3.43 3.32 2.93 2.26 867 2.77 3.37 2.31 3.59 3.40 2.71 2.06 1.43 3.66 3.00 2.58 1.85 868 2.28 2.81 2.00 3.05 2.87 2.26 1.71 1.19 3.36 2.57 2.21 1.58 869 2.6 3.28 2.39 3.33 3.16 2.57 1.97 1.44 2.86 2.98 2.71 2.19 870 3.37 4.09 2.76 4.13 3.96 3.26 2.52 1.84 3.19 3.61 3.23 2.54 871 2.82 3.43 2.32 3.67 3.42 2.76 2.04 1.38 3.94 2.97 2.53 1.82 872 1.64 2.23 1.60 2.44 2.23 1.75 1.26 0.84 3.36 1.97 1.69 1.18 873 2.47 2.95 2.31 3.11 2.96 2.42 1.86 1.39 2.22 2.82 2.61 2.17 874 3.48 4.06 2.96 4.25 4.06 3.34 2.57 1.88 3.01 3.75 3.39 2.76 875 2.98 3.65 2.54 3.89 3.64 2.95 2.22 1.57 4.06 3.22 2.79 2.06 876 1.98 2.78 2.01 3.00 2.80 2.23 1.63 1.13 3.59 2.51 2.17 1.58 877 2.4 3.17 2.44 3.35 3.22 2.61 2.06 1.56 2.79 3.02 2.74 2.25 878 3.53 4.14 3.02 4.33 4.15 3.40 2.70 2.01 3.24 3.81 3.42 2.78 879 3.24 3.81 2.62 4.02 3.79 3.10 2.38 1.71 4.13 3.33 2.86 2.12 880 2.09 2.84 2.04 3.06 2.87 2.30 1.70 1.19 3.72 2.56 2.19 1.55 881 2.65 3.47 2.64 3.66 3.53 2.93 2.34 1.84 2.85 3.30 2.97 2.39 882 4.05 4.62 3.28 4.78 4.62 3.89 3.14 2.44 3.55 4.21 3.74 2.99 883 3.59 4.13 2.75 4.21 4.04 3.40 2.70 2.07 4.59 3.54 3.03 2.23 884 2.69 3.44 2.41 3.54 3.39 2.80 2.15 1.60 3.97 3.00 2.59 1.91 885 3.27 3.91 2.78 4.05 3.92 3.35 2.73 2.23 3.35 3.49 3.03 2.30 886 4.29 4.75 3.25 4.84 4.69 4.06 3.37 2.78 3.87 4.17 3.62 2.75 887 4.2 4.56 2.95 4.67 4.53 3.90 3.26 2.71 4.62 3.88 3.26 2.26 888 3.08 3.46 2.35 3.60 3.45 2.84 2.24 1.76 4.41 2.94 2.43 1.61 889 3.83 4.39 3.18 4.66 4.55 xxx 3.57 3.20 3.38 4.12 3.68 2.92 890 5.31 5.29 3.61 5.45 5.34 xxx 4.30 3.87 4.48 4.74 4.20 3.28 891 4.31 4.48 2.99 4.54 4.45 3.97 3.54 3.17 5.20 3.85 3.32 2.53 892 3.7 4.10 2.80 4.24 4.15 3.68 3.27 2.91 4.30 3.62 3.12 2.37 893 3.88 4.15 2.92 4.35 4.23 3.81 3.45 3.11 4.03 3.71 3.23 2.47 894 5.43 5.47 3.51 5.47 5.29 4.76 4.30 3.90 4.12 4.63 4.01 3.03 895 5.06 5.01 2.84 4.98 5.17 4.09 3.52 3.01 5.17 3.99 3.24 2.07 896 4.09 4.34 2.61 4.44 4.28 3.66 3.14 2.68 4.62 3.62 2.95 1.89 897 4.69 4.86 3.01 4.92 4.86 4.22 3.68 3.25 4.19 4.13 3.48 2.41 898 5.21 5.36 3.23 5.38 5.21 4.61 4.03 3.57 4.69 4.47 3.76 2.60 899 5.35 5.34 3.05 5.35 5.14 4.46 3.78 3.26 5.07 4.33 3.54 2.26 900 4.32 4.54 2.74 4.66 4.49 3.89 3.29 2.80 4.99 3.80 3.12 1.99 901 4.78 5.09 3.27 5.27 5.12 4.54 4.03 3.57 4.36 4.48 3.85 2.80 902 5.86 5.82 3.53 5.89 5.68 5.02 4.45 3.95 4.99 4.92 4.16 2.97 903 5.39 5.39 3.10 5.35 5.14 4.47 3.87 3.33 5.55 4.38 3.61 2.40 904 4.7 4.87 2.91 4.94 4.76 4.17 3.60 3.10 5.01 4.07 3.38 2.26 905 4.98 5.03 3.15 5.20 5.01 4.43 3.90 3.44 4.63 4.33 3.66 2.62 906 5.79 5.66 3.41 5.74 5.51 4.85 4.27 3.77 4.88 4.74 4.01 2.84 907 5.83 5.54 3.14 5.63 5.37 4.59 3.92 3.34 5.36 4.52 3.70 2.38 908 5.33 5.26 3.11 5.44 5.20 4.46 3.85 3.29 5.21 4.42 3.65 2.43 909 4.88 4.84 2.74 5.01 4.78 4.10 3.52 2.98 5.05 4.02 3.29 2.09 910 4.73 4.69 2.72 4.82 4.63 3.97 3.38 2.84 4.63 3.90 3.19 2.03

Appendix A. (continued)
241
911 5.32 5.09 2.82 5.21 5.00 4.26 3.62 3.03 4.50 4.22 3.43 2.14 912 5.18 4.97 2.79 5.10 4.89 4.17 3.55 2.97 4.86 4.12 3.35 2.10 913 4.87 4.85 2.73 4.95 4.78 4.12 3.48 2.94 4.74 4.09 3.39 2.23 914 5.4 5.17 2.85 5.23 5.04 4.36 3.70 3.15 4.65 4.29 3.54 2.30 915 5.09 4.98 2.57 5.06 4.84 4.10 3.40 2.77 4.89 4.09 3.33 2.09 916 4.87 4.97 2.64 5.07 4.88 4.14 3.45 2.82 4.70 4.14 3.40 2.17 917 4.62 4.71 2.36 4.81 4.63 3.89 3.14 2.48 4.74 3.90 3.16 1.93 918 4.46 4.57 2.34 4.71 4.51 3.78 3.03 2.37 4.49 3.81 3.09 1.90 919 4.67 4.82 2.44 4.97 4.74 3.93 3.17 2.47 4.38 4.02 3.29 2.07 920 4.93 5.04 2.54 5.16 4.94 4.11 3.34 2.65 4.62 4.17 3.42 2.14 921 4.46 4.54 2.24 4.64 4.46 3.66 2.93 2.26 4.79 3.73 3.01 1.81 922 3.9 4.05 2.01 4.20 4.02 3.26 2.54 1.87 4.32 3.38 2.72 1.63 923 4.18 4.52 2.48 4.69 4.51 3.78 3.10 2.46 3.91 3.91 3.30 2.23 924 4.19 4.51 2.44 4.66 4.48 3.75 3.07 2.43 4.40 3.85 3.23 2.17 925 4.17 4.48 2.52 4.67 4.47 3.76 3.09 2.47 4.36 3.83 3.22 2.18 926 3.75 4.29 2.40 4.50 4.31 3.60 2.94 2.34 4.35 3.70 3.10 2.10 927 3.74 4.25 2.54 4.40 4.26 3.63 2.99 2.44 4.20 3.68 3.09 2.18 928 4.5 4.78 2.74 4.89 4.73 4.08 3.43 2.86 4.16 4.07 3.41 2.38 929 4.18 4.42 2.47 4.46 4.28 3.61 xxx 2.42 4.61 3.60 2.95 1.91 930 2.78 3.47 2.04 3.61 3.46 2.84 xxx 1.73 4.13 2.94 2.42 1.55 931 3.64 4.32 2.82 4.51 4.37 3.81 3.23 2.74 3.36 3.88 3.38 2.49 932 4.64 4.93 3.02 4.95 4.83 4.23 3.63 3.11 4.29 4.18 3.60 2.64 933 3.86 4.24 2.60 4.32 4.20 3.65 3.10 2.61 4.72 3.56 3.00 2.10 934 3.28 3.94 2.49 4.13 3.98 3.47 2.92 2.43 4.09 3.43 2.90 2.02 935 xxx 5.12 3.34 5.36 5.22 4.52 3.96 3.42 3.88 4.61 4.02 2.96 936 xxx 4.99 3.18 5.22 5.05 4.36 3.82 3.29 5.08 4.38 3.75 2.69 937 4.11 4.43 2.96 4.57 4.48 3.97 3.47 3.01 4.90 3.90 3.34 2.51 938 3.63 4.15 2.82 4.31 4.25 3.74 3.24 2.80 4.37 3.75 3.26 2.49 939 3.73 4.23 2.92 4.42 4.30 3.83 3.33 2.91 4.15 3.77 3.26 2.47 940 4.86 5.16 3.38 5.30 5.15 4.62 4.07 3.60 4.19 4.50 3.90 2.92 941 4.24 4.40 2.75 4.48 4.32 3.79 3.27 2.79 5.02 3.69 3.09 2.10 942 3.56 3.97 2.58 4.10 3.95 3.45 2.95 2.49 4.20 3.41 2.87 1.97 943 4.69 4.90 3.10 5.09 4.91 4.30 3.70 3.21 3.85 4.22 3.55 2.48 944 4.66 4.57 2.93 4.73 4.56 3.96 3.37 2.90 4.76 3.89 3.24 2.25 945 3.87 4.21 2.93 4.41 4.29 3.91 3.54 3.20 4.42 3.81 3.35 2.62 946 4.24 4.65 3.07 4.86 4.69 4.26 3.87 3.52 4.20 4.14 3.60 2.72 947 4.21 4.57 2.95 4.73 4.57 4.06 3.62 3.25 4.60 3.93 3.32 2.37 948 5.14 5.26 3.32 5.29 5.13 4.55 4.06 3.65 4.45 4.45 3.79 2.76 949 4.97 4.96 2.74 4.99 4.77 4.08 3.53 3.06 5.00 3.97 3.22 2.02 950 4.66 4.78 2.72 4.86 4.67 4.02 3.48 3.03 4.60 3.92 3.19 2.02 951 4.27 4.37 2.39 4.44 4.26 3.66 3.13 2.69 4.52 3.55 2.84 1.75 952 5.07 5.00 2.75 5.04 4.82 4.15 3.56 3.07 4.12 4.03 3.26 2.07 953 5.22 4.98 2.48 5.00 4.73 3.98 3.27 2.67 4.66 3.91 3.06 1.66 954 3.98 4.11 2.14 4.23 4.04 3.40 2.71 2.22 4.57 3.37 2.65 1.43 955 4.79 4.93 2.61 5.04 4.86 4.19 3.51 2.93 3.90 4.14 3.38 2.12 956 4.83 4.87 2.59 4.94 4.74 4.08 3.42 2.85 4.73 4.00 3.24 2.00 957 4.73 4.76 2.49 4.84 4.67 4.02 3.38 2.84 4.60 3.96 3.24 2.05 958 4.04 4.28 2.26 4.41 4.28 3.66 3.04 2.51 4.53 3.61 2.93 1.82

Appendix A. (continued)
242
959 4.63 4.90 2.78 5.06 4.92 4.29 3.66 3.11 4.14 4.29 3.63 2.55 960 5.01 5.11 2.83 5.25 5.08 4.45 3.82 3.26 4.80 4.36 3.66 2.54 961 4.48 4.57 2.61 4.70 4.54 3.96 xxx 2.83 4.93 3.89 3.27 2.25 962 3.69 4.05 2.38 4.16 4.08 3.51 2.93 2.43 4.40 3.53 2.97 2.05 963 4.39 4.77 3.01 4.14 4.90 4.16 3.65 3.14 3.97 4.32 3.72 2.74 964 4.4 4.62 2.89 4.05 4.72 4.00 3.51 3.00 4.78 4.14 3.54 2.60 965 3.98 4.39 2.94 4.58 4.42 3.91 3.37 2.93 4.61 3.90 3.36 2.56 966 3.79 4.30 2.81 4.47 4.34 3.83 3.30 2.85 4.34 3.79 3.26 2.46 967 3.95 4.54 3.14 4.78 4.68 xxx 3.67 3.23 4.23 4.12 3.61 2.81 968 4.18 4.57 3.06 4.85 4.73 xxx 3.72 3.30 4.55 4.16 3.63 2.78 969 3.81 4.15 2.93 4.34 4.23 3.81 3.38 3.02 4.61 3.71 3.23 2.46 970 3.85 4.46 3.11 4.61 4.52 4.07 3.61 3.22 4.12 4.02 3.56 2.78 971 4 4.30 2.94 4.44 4.35 3.88 xxx 3.01 4.42 3.78 3.25 2.35 972 3.08 3.48 2.37 3.67 3.56 3.12 xxx 2.33 4.22 3.09 2.60 1.82 973 3.03 3.81 2.82 4.07 3.98 3.48 xxx 2.92 3.48 3.62 3.25 2.60 974 4.02 4.43 3.22 4.65 4.55 4.04 3.77 3.43 3.93 4.08 3.65 2.91 975 3.24 3.76 2.68 3.92 3.85 3.48 3.11 2.79 4.45 3.36 2.92 2.23 976 3.16 3.65 2.63 3.84 3.77 3.40 xxx 2.70 3.75 3.32 2.89 2.22 977 3.09 3.51 2.58 3.69 3.61 3.29 2.96 2.66 3.69 3.19 2.80 2.19 978 3.37 3.89 2.84 4.04 3.97 3.63 3.27 2.97 3.53 3.53 3.14 2.46 979 2.92 3.47 2.46 3.67 3.58 3.24 2.91 2.61 3.88 3.13 2.72 2.05 980 2.36 2.84 2.00 2.96 2.91 2.57 2.27 1.98 3.48 2.52 2.13 1.56 981 2.35 2.87 2.14 2.95 2.93 2.67 2.44 2.21 2.85 2.62 2.33 1.88 982 3.19 3.62 2.66 3.75 3.68 3.41 3.16 2.91 2.88 3.32 2.98 2.39 983 3.04 3.48 2.44 3.63 3.51 3.20 2.90 2.62 3.58 3.09 2.67 1.98 984 2.06 2.73 1.89 2.83 2.72 2.41 2.12 1.84 3.39 2.37 2.05 1.47 985 2.34 3.05 2.26 3.08 3.04 2.81 2.56 2.34 2.64 2.76 2.50 2.13 986 3.03 3.61 2.66 3.70 3.67 3.44 3.17 2.96 2.99 3.31 2.98 2.48 987 3.11 3.65 2.61 3.83 3.74 3.40 3.08 2.80 3.57 3.28 2.86 2.21 988 2.12 2.79 2.02 3.01 2.97 2.65 2.37 2.10 3.61 2.57 2.23 1.69 989 2.33 2.99 2.37 3.12 3.15 2.97 2.78 2.61 2.86 2.90 2.69 2.35 990 3.31 3.87 2.93 3.98 3.93 3.71 3.48 3.31 3.07 3.62 3.29 2.78 991 3.08 3.67 2.60 3.85 3.73 3.39 3.09 2.85 3.84 3.32 2.88 2.23 992 1.86 2.49 1.78 2.66 2.59 2.29 2.01 1.78 3.62 2.26 1.97 1.55 993 2.52 3.13 2.44 3.34 3.28 3.06 2.84 2.67 2.50 3.02 2.79 2.43 994 3.68 4.25 3.22 4.47 4.35 4.10 3.86 3.69 3.22 4.01 3.64 3.05 995 3.42 3.86 2.81 4.03 3.89 3.58 3.28 3.08 4.27 3.50 3.09 2.49 996 2.72 3.28 2.41 3.44 3.39 3.11 2.83 2.63 3.80 3.03 2.66 2.14 997 xxx 3.05 2.30 3.16 3.12 2.93 2.72 2.57 3.29 2.85 2.55 2.08 998 xxx 4.07 3.01 4.16 4.01 3.79 3.55 3.36 3.03 3.70 3.35 2.74 999 xxx 4.32 2.90 4.38 4.29 3.92 3.53 3.21 3.95 3.78 3.28 2.47
1000 xxx 3.18 2.19 3.29 3.26 2.93 2.37 2.31 4.18 2.83 2.40 1.78 1001 3.54 4.13 3.09 4.45 4.38 xxx 3.73 3.50 3.16 3.99 3.58 2.98 1002 5.22 5.37 3.75 5.58 5.43 xxx 4.66 4.39 4.27 4.89 4.35 3.51 1003 4.31 4.49 3.01 4.61 4.42 3.96 3.55 3.20 5.30 3.89 3.36 2.51 1004 4 4.49 3.03 4.58 4.47 4.03 3.63 3.29 4.33 3.92 3.42 2.60 1005 4.71 4.88 3.16 4.96 4.82 4.19 3.62 3.11 4.36 4.18 3.56 2.58 1006 5.42 5.27 3.43 5.40 5.23 4.60 4.01 3.47 4.70 4.56 3.90 2.86

Appendix A. (continued)
243
1007 5.28 5.17 3.20 5.28 5.05 4.26 3.50 2.81 5.09 4.34 3.63 2.46 1008 4.49 4.69 2.98 4.88 4.68 3.92 3.18 2.49 4.93 4.01 3.35 2.26 1009 4.87 4.99 3.28 5.13 4.97 4.21 3.43 2.73 4.56 4.35 3.71 2.70 1010 5.69 5.64 3.55 5.70 5.54 4.73 3.93 3.24 4.86 4.81 4.08 2.95 1011 5.88 5.47 3.26 5.46 5.23 4.34 3.45 2.70 5.41 4.45 3.63 2.36 1012 5.27 5.22 3.12 5.19 4.98 4.10 3.21 2.44 5.10 4.24 3.47 2.27 1013 5.81 5.68 3.50 5.84 5.61 4.67 3.74 2.97 4.87 4.81 4.03 2.77 1014 5.88 5.46 3.42 5.61 5.32 4.39 3.47 2.71 5.49 4.57 3.81 2.64 1015 5.84 5.46 3.55 5.77 5.50 4.63 3.81 3.06 5.21 4.78 4.04 2.89 1016 5.46 5.13 3.36 5.45 5.18 4.34 3.06 2.83 5.35 4.46 3.73 2.60 1017 5.93 5.13 3.85 5.98 5.76 xxx 4.15 3.50 5.02 5.10 4.37 3.37 1018 6.23 5.32 3.90 6.23 6.00 xxx 4.39 3.72 5.18 5.31 4.57 3.48 1019 5.63 5.31 3.52 5.53 5.28 4.55 3.81 3.25 5.41 4.58 3.90 2.83 1020 5.87 5.63 3.69 5.88 5.62 4.85 4.09 3.52 5.15 4.87 4.15 3.02 1021 5.58 5.53 3.54 5.71 5.45 4.69 3.93 3.30 5.48 4.71 4.01 2.85 1022 5.09 5.17 3.42 5.42 5.15 4.42 3.68 3.06 5.33 4.48 3.84 2.77 1023 5.32 5.19 3.41 5.38 5.12 4.43 3.72 3.14 5.08 4.42 3.74 2.67 1024 5.79 5.64 3.57 5.73 5.48 4.75 4.01 3.42 5.00 4.73 3.99 2.83 1025 5.22 5.30 3.35 5.43 5.19 4.49 3.79 3.22 5.35 4.48 3.76 2.65 1026 4.91 4.96 3.22 5.11 4.90 4.23 3.55 2.99 5.06 4.24 3.56 2.51 1027 5.41 5.27 3.41 5.46 5.22 4.52 3.84 3.28 4.78 4.52 3.83 2.73 1028 5.72 5.55 3.56 5.69 5.45 4.72 4.02 3.45 5.09 4.72 4.01 2.88 1029 4.77 4.93 3.13 5.08 4.88 4.21 3.59 3.05 5.31 4.20 3.53 2.45 1030 4.43 4.68 3.04 4.88 4.66 4.01 3.41 2.87 4.75 4.02 3.38 2.34 1031 4.6 4.79 3.13 4.99 4.78 4.19 3.92 3.10 4.55 4.18 3.54 2.53 1032 4.9 4.84 3.15 5.01 4.81 4.21 3.62 3.12 4.66 4.19 3.54 2.54 1033 4.65 4.77 3.11 4.88 4.76 4.17 3.63 3.16 4.68 4.11 3.51 2.59 1034 3.78 4.06 2.73 4.19 4.07 3.50 2.99 2.54 4.64 3.52 2.98 2.17 1035 4 4.27 3.02 4.42 4.28 3.82 3.37 3.00 3.99 3.79 3.29 2.57 1036 5.02 5.19 3.45 5.34 5.15 4.64 4.13 3.73 4.20 4.54 3.95 3.05 1037 4.2 4.50 2.86 4.68 4.46 3.93 3.47 3.06 5.04 3.83 3.24 2.31 1038 3.31 3.86 2.60 4.02 3.90 3.41 2.99 2.61 4.34 3.38 2.87 2.06 1039 3.52 4.03 2.81 4.15 4.10 3.73 3.37 3.09 3.81 3.60 3.13 2.41 1040 4.48 4.70 3.11 4.81 4.68 4.25 3.83 3.52 4.00 4.10 3.55 2.68 1041 3.84 4.12 2.58 4.23 4.06 3.62 3.20 2.88 4.58 3.49 2.90 2.01 1042 3.06 3.65 2.45 3.82 3.71 3.32 2.94 2.65 3.97 3.24 2.73 2.00 1043 xxx 3.78 2.57 3.85 3.82 3.48 3.15 2.88 3.63 3.34 2.85 2.05 1044 xxx 4.02 2.66 4.02 3.97 3.61 3.26 2.98 3.72 3.46 2.94 2.08 1045 4.01 4.23 2.75 4.32 4.21 3.82 3.42 3.11 3.87 3.65 3.10 2.21 1046 3.12 3.60 2.42 3.77 3.69 3.33 2.96 2.67 4.10 3.18 2.68 1.88 1047 3.34 3.90 2.81 4.09 4.04 3.73 3.44 3.21 3.59 3.61 3.18 2.53 1048 4.38 4.58 3.11 4.69 4.59 4.22 3.90 3.65 3.96 4.06 3.54 2.74 1049 3.75 4.12 2.68 4.19 4.08 3.64 3.30 3.02 4.49 3.53 3.00 2.17 1050 3.14 3.73 2.50 3.84 3.74 3.36 3.05 2.79 3.98 3.26 2.79 2.06 1051 3.69 4.18 2.85 4.34 4.22 3.81 3.42 3.12 3.65 3.69 3.19 2.39 1052 4.41 4.67 3.07 4.78 4.66 4.22 3.81 3.47 4.11 4.05 3.48 2.57 1053 4.25 4.56 2.94 4.63 4.49 3.98 3.53 3.12 4.52 3.91 3.32 2.44 1054 3.72 4.18 2.78 4.32 4.20 3.73 3.30 2.92 4.37 3.66 3.11 2.29

Appendix A. (continued)
244
1055 3.7 4.20 2.81 4.35 4.22 3.75 3.32 2.94 4.08 3.67 3.14 2.30 1056 4.49 4.78 3.09 4.85 4.71 4.20 3.73 3.32 4.10 4.08 3.50 2.56 1057 4.22 4.37 2.71 4.39 4.21 3.70 3.19 2.75 4.58 3.59 2.97 2.01 1058 3.8 4.22 2.67 4.31 4.13 3.64 3.14 2.71 4.10 3.56 2.98 2.05 1059 3.97 3.86 2.32 3.76 3.57 3.08 2.58 2.12 4.03 2.97 2.40 1.50 1060 4.52 4.62 2.77 4.57 4.39 3.76 3.20 2.70 3.47 3.67 3.01 2.01 1061 5.5 5.43 2.98 5.63 5.32 4.38 3.48 2.74 4.80 4.36 3.37 1.77 1062 4.42 4.22 2.42 4.41 4.16 3.34 2.52 1.85 5.18 3.43 2.65 1.37 1063 4.28 4.73 3.03 4.81 4.66 4.05 3.42 2.89 4.03 4.02 3.33 2.14 1064 xxx 5.00 3.09 5.02 4.86 4.25 3.63 3.07 4.54 4.14 3.41 2.15 1065 xxx 4.70 2.99 4.77 4.58 3.96 4.26 2.74 4.72 3.89 3.19 1.98 1066 xxx 4.57 2.92 4.71 4.51 3.90 3.26 2.69 4.44 3.82 3.13 1.94 1067 4.8 5.00 3.26 5.16 4.96 4.20 3.41 2.72 4.36 4.27 3.56 2.34 1068 4.23 4.45 2.94 4.60 4.40 3.65 2.88 2.23 4.84 3.75 3.07 1.96 1069 4.22 4.64 3.26 4.83 4.65 3.89 3.16 2.46 4.30 4.11 3.55 2.60 1070 4.67 4.94 3.34 5.10 4.91 4.16 3.38 2.69 4.56 4.28 3.66 2.62 1071 4.31 4.73 3.22 4.82 4.64 3.86 3.04 2.30 4.77 4.05 3.45 2.50 1072 4.36 4.77 3.26 4.86 4.67 3.87 xxx 2.32 4.53 4.09 3.49 2.56 1073 4.22 4.39 2.99 4.53 4.31 3.50 xxx 1.98 4.58 3.72 3.13 2.21 1074 4.21 4.57 3.10 4.72 4.51 3.70 2.89 2.17 4.21 3.91 3.31 2.34 1075 4.5 5.03 3.35 5.16 4.92 3.99 3.04 2.22 4.41 4.29 3.63 2.57 1076 4.21 4.52 3.08 4.64 4.41 3.51 2.63 1.87 4.85 3.83 3.23 2.27 1077 3.7 4.09 2.92 4.24 4.10 3.25 2.52 1.85 4.35 3.59 3.10 2.33 1078 4.59 4.93 3.32 5.04 4.90 4.02 3.20 2.42 4.00 4.27 3.68 2.73 1079 4.06 4.35 2.78 4.47 4.28 3.51 2.67 1.90 4.76 3.65 3.01 1.98 1080 3.62 4.16 2.74 4.36 4.17 3.39 2.56 1.83 4.18 3.59 2.97 1.98 1081 3.8 4.36 2.86 4.52 4.31 3.53 2.69 1.97 4.10 3.70 3.07 2.04 1082 3.82 4.30 2.86 4.42 4.20 3.41 2.58 1.86 4.23 3.62 3.02 2.02 1083 4.02 4.52 3.00 4.72 4.54 3.69 2.93 2.22 4.12 3.92 3.31 2.29 1084 3.25 3.60 2.48 3.86 3.68 2.90 2.20 1.58 4.44 3.17 2.63 1.75 1085 2.85 3.34 2.51 3.59 3.46 2.92 2.42 1.97 3.62 3.10 2.74 2.14 1086 3.79 4.24 2.96 4.41 4.26 3.68 3.12 2.57 3.42 3.75 3.29 2.54 1087 3.25 4.05 2.65 3.95 3.93 3.40 2.86 2.36 4.17 3.42 2.91 2.13 1088 2.71 3.41 2.36 3.36 3.36 2.82 2.29 1.83 3.86 2.98 2.54 1.86 1089 3.19 3.58 2.63 3.78 3.68 3.15 2.69 2.27 3.34 3.26 2.83 2.21 1090 3.54 4.04 2.83 4.15 4.07 3.55 3.08 2.62 3.60 3.58 3.11 2.40 1091 3.31 3.84 2.65 3.96 3.82 3.37 2.94 2.51 3.97 3.33 2.88 2.15 1092 2.3 2.99 2.16 3.18 3.06 2.60 2.19 1.79 3.73 2.66 2.27 1.65 1093 2.44 3.11 2.37 3.29 3.23 2.91 2.59 2.30 3.01 2.91 2.60 2.11 1094 3.32 3.83 2.82 3.99 3.90 3.58 3.23 2.92 3.19 3.53 3.15 2.55 1095 3.13 3.62 2.58 3.80 3.71 3.34 2.99 2.67 3.80 3.27 2.81 2.16 1096 2.13 2.79 2.04 2.96 2.89 2.52 2.18 1.89 3.58 2.50 2.11 1.60 1097 2.21 2.96 2.24 3.05 3.00 2.77 2.51 2.32 2.80 2.71 2.44 2.08 1098 3.31 3.92 2.80 3.97 3.91 3.67 3.39 3.17 2.95 3.55 3.18 2.61 1099 3.08 3.77 2.53 3.81 3.72 3.38 3.07 2.78 3.83 3.30 2.86 2.18 1100 2.14 2.78 1.97 2.89 2.82 2.51 2.24 1.98 3.63 2.48 2.14 1.64 1101 2.15 2.72 2.14 2.89 2.85 2.66 2.48 2.32 2.74 2.59 2.36 2.04 1102 3.05 3.65 2.68 3.76 3.69 3.47 3.26 3.08 2.77 3.35 3.03 2.54
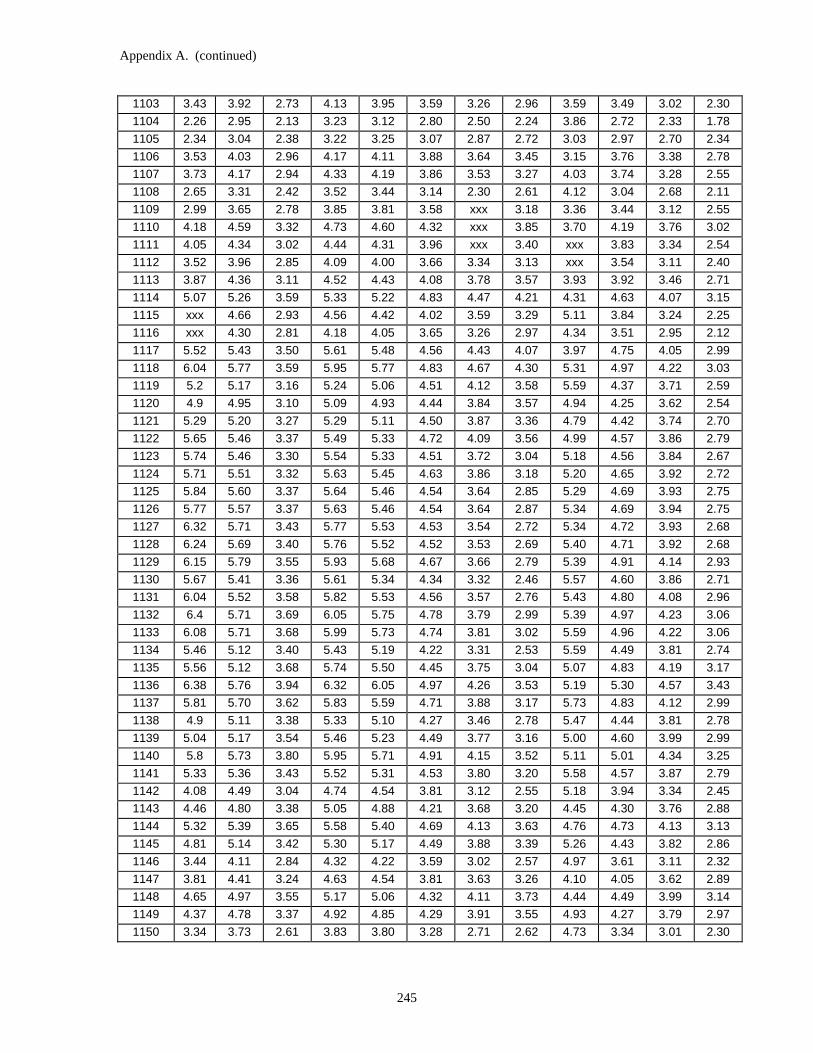
Appendix A. (continued)
245
1103 3.43 3.92 2.73 4.13 3.95 3.59 3.26 2.96 3.59 3.49 3.02 2.30 1104 2.26 2.95 2.13 3.23 3.12 2.80 2.50 2.24 3.86 2.72 2.33 1.78 1105 2.34 3.04 2.38 3.22 3.25 3.07 2.87 2.72 3.03 2.97 2.70 2.34 1106 3.53 4.03 2.96 4.17 4.11 3.88 3.64 3.45 3.15 3.76 3.38 2.78 1107 3.73 4.17 2.94 4.33 4.19 3.86 3.53 3.27 4.03 3.74 3.28 2.55 1108 2.65 3.31 2.42 3.52 3.44 3.14 2.30 2.61 4.12 3.04 2.68 2.11 1109 2.99 3.65 2.78 3.85 3.81 3.58 xxx 3.18 3.36 3.44 3.12 2.55 1110 4.18 4.59 3.32 4.73 4.60 4.32 xxx 3.85 3.70 4.19 3.76 3.02 1111 4.05 4.34 3.02 4.44 4.31 3.96 xxx 3.40 xxx 3.83 3.34 2.54 1112 3.52 3.96 2.85 4.09 4.00 3.66 3.34 3.13 xxx 3.54 3.11 2.40 1113 3.87 4.36 3.11 4.52 4.43 4.08 3.78 3.57 3.93 3.92 3.46 2.71 1114 5.07 5.26 3.59 5.33 5.22 4.83 4.47 4.21 4.31 4.63 4.07 3.15 1115 xxx 4.66 2.93 4.56 4.42 4.02 3.59 3.29 5.11 3.84 3.24 2.25 1116 xxx 4.30 2.81 4.18 4.05 3.65 3.26 2.97 4.34 3.51 2.95 2.12 1117 5.52 5.43 3.50 5.61 5.48 4.56 4.43 4.07 3.97 4.75 4.05 2.99 1118 6.04 5.77 3.59 5.95 5.77 4.83 4.67 4.30 5.31 4.97 4.22 3.03 1119 5.2 5.17 3.16 5.24 5.06 4.51 4.12 3.58 5.59 4.37 3.71 2.59 1120 4.9 4.95 3.10 5.09 4.93 4.44 3.84 3.57 4.94 4.25 3.62 2.54 1121 5.29 5.20 3.27 5.29 5.11 4.50 3.87 3.36 4.79 4.42 3.74 2.70 1122 5.65 5.46 3.37 5.49 5.33 4.72 4.09 3.56 4.99 4.57 3.86 2.79 1123 5.74 5.46 3.30 5.54 5.33 4.51 3.72 3.04 5.18 4.56 3.84 2.67 1124 5.71 5.51 3.32 5.63 5.45 4.63 3.86 3.18 5.20 4.65 3.92 2.72 1125 5.84 5.60 3.37 5.64 5.46 4.54 3.64 2.85 5.29 4.69 3.93 2.75 1126 5.77 5.57 3.37 5.63 5.46 4.54 3.64 2.87 5.34 4.69 3.94 2.75 1127 6.32 5.71 3.43 5.77 5.53 4.53 3.54 2.72 5.34 4.72 3.93 2.68 1128 6.24 5.69 3.40 5.76 5.52 4.52 3.53 2.69 5.40 4.71 3.92 2.68 1129 6.15 5.79 3.55 5.93 5.68 4.67 3.66 2.79 5.39 4.91 4.14 2.93 1130 5.67 5.41 3.36 5.61 5.34 4.34 3.32 2.46 5.57 4.60 3.86 2.71 1131 6.04 5.52 3.58 5.82 5.53 4.56 3.57 2.76 5.43 4.80 4.08 2.96 1132 6.4 5.71 3.69 6.05 5.75 4.78 3.79 2.99 5.39 4.97 4.23 3.06 1133 6.08 5.71 3.68 5.99 5.73 4.74 3.81 3.02 5.59 4.96 4.22 3.06 1134 5.46 5.12 3.40 5.43 5.19 4.22 3.31 2.53 5.59 4.49 3.81 2.74 1135 5.56 5.12 3.68 5.74 5.50 4.45 3.75 3.04 5.07 4.83 4.19 3.17 1136 6.38 5.76 3.94 6.32 6.05 4.97 4.26 3.53 5.19 5.30 4.57 3.43 1137 5.81 5.70 3.62 5.83 5.59 4.71 3.88 3.17 5.73 4.83 4.12 2.99 1138 4.9 5.11 3.38 5.33 5.10 4.27 3.46 2.78 5.47 4.44 3.81 2.78 1139 5.04 5.17 3.54 5.46 5.23 4.49 3.77 3.16 5.00 4.60 3.99 2.99 1140 5.8 5.73 3.80 5.95 5.71 4.91 4.15 3.52 5.11 5.01 4.34 3.25 1141 5.33 5.36 3.43 5.52 5.31 4.53 3.80 3.20 5.58 4.57 3.87 2.79 1142 4.08 4.49 3.04 4.74 4.54 3.81 3.12 2.55 5.18 3.94 3.34 2.45 1143 4.46 4.80 3.38 5.05 4.88 4.21 3.68 3.20 4.45 4.30 3.76 2.88 1144 5.32 5.39 3.65 5.58 5.40 4.69 4.13 3.63 4.76 4.73 4.13 3.13 1145 4.81 5.14 3.42 5.30 5.17 4.49 3.88 3.39 5.26 4.43 3.82 2.86 1146 3.44 4.11 2.84 4.32 4.22 3.59 3.02 2.57 4.97 3.61 3.11 2.32 1147 3.81 4.41 3.24 4.63 4.54 3.81 3.63 3.26 4.10 4.05 3.62 2.89 1148 4.65 4.97 3.55 5.17 5.06 4.32 4.11 3.73 4.44 4.49 3.99 3.14 1149 4.37 4.78 3.37 4.92 4.85 4.29 3.91 3.55 4.93 4.27 3.79 2.97 1150 3.34 3.73 2.61 3.83 3.80 3.28 2.71 2.62 4.73 3.34 3.01 2.30

Appendix A. (continued)
246
1151 3.03 3.55 2.72 3.74 3.71 3.31 3.19 2.98 3.73 3.39 3.11 2.60 1152 4.42 4.73 3.51 4.89 4.82 4.35 4.18 3.93 3.67 4.36 3.94 3.24 1153 4.19 4.46 3.17 4.59 4.50 4.09 3.73 3.43 4.73 3.96 3.48 2.71 1154 2.99 3.62 2.63 3.83 3.79 3.42 3.11 2.85 4.39 3.35 2.94 2.30 1155 3.01 3.61 2.75 3.82 3.78 3.53 3.29 3.12 3.71 3.41 3.08 2.56 1156 3.93 4.38 3.27 4.55 4.45 4.17 3.89 3.68 3.71 4.04 3.64 3.01 1157 4.02 4.43 3.17 4.62 4.49 4.12 3.76 3.48 4.39 3.99 3.52 2.76 1158 2.97 3.66 2.69 3.92 3.84 3.50 3.17 2.92 4.40 3.41 3.02 2.38 1159 3.24 3.89 2.94 4.12 4.11 3.70 3.56 3.36 3.76 3.71 3.35 2.74 1160 3.91 4.32 3.24 4.52 4.47 4.04 3.88 3.66 4.01 4.03 3.63 2.93 1161 3.72 4.18 3.13 4.40 4.29 3.99 3.70 3.49 4.37 3.87 3.48 2.82 1162 3.44 4.04 3.02 4.25 4.17 3.87 3.58 3.38 4.21 3.76 3.38 2.75 1163 3.58 4.07 3.03 4.32 4.26 3.90 3.69 3.49 4.09 3.83 3.42 2.74 1164 4.16 4.38 3.26 4.60 4.49 4.10 3.87 3.65 4.18 4.05 3.62 2.91 1165 3.7 4.27 3.12 4.49 4.38 4.09 3.85 3.66 4.41 3.87 3.54 2.85 1166 3.9 4.33 3.15 4.53 4.41 4.10 3.83 3.64 4.30 3.98 3.56 2.87 1167 3.64 3.97 2.85 4.15 4.04 3.70 3.42 3.24 4.34 3.58 3.14 2.45 1168 3.84 4.23 3.02 4.40 4.29 3.94 3.66 3.46 3.97 3.83 3.37 2.65 1169 4.26 4.56 3.18 4.73 4.55 4.18 3.87 3.64 4.23 4.04 3.52 2.72 1170 4.11 4.67 3.17 4.72 4.53 4.16 3.85 3.64 4.47 4.03 3.52 2.73 1171 4.07 4.59 3.07 4.59 4.46 4.09 3.74 3.52 4.45 3.93 3.41 2.60 1172 4.26 4.56 3.13 4.67 4.55 4.19 3.83 3.60 4.38 4.01 3.48 2.64 1173 4.21 4.39 3.03 4.51 4.35 4.01 3.67 3.25 4.47 3.85 3.35 2.56 1174 4.23 4.43 3.06 4.57 4.41 4.06 3.72 3.51 4.28 3.90 3.40 2.62 1175 4.39 4.61 3.13 4.76 4.63 4.22 3.84 3.60 4.40 4.05 3.49 2.64 1176 3.98 4.24 2.96 4.40 4.31 3.91 3.54 3.32 4.54 3.76 3.24 2.46 1177 4.29 4.43 3.17 4.52 4.42 4.08 3.76 3.55 4.22 3.91 3.42 2.66 1178 4.68 4.80 3.32 4.88 4.75 4.40 4.04 3.83 4.32 4.18 3.65 2.80 1179 4.37 4.61 3.15 4.74 4.61 4.22 3.85 3.61 4.70 4.04 3.50 2.63 1180 4.05 4.30 3.02 4.44 4.33 3.96 3.61 3.39 4.52 3.81 3.30 2.51 1181 4.14 4.25 2.98 4.36 4.26 3.90 3.58 3.37 4.28 3.75 3.25 2.49 1182 4.69 4.71 3.20 4.81 4.67 4.28 3.93 3.70 4.18 4.11 3.56 2.71 1183 4.63 4.79 3.21 4.94 4.79 4.35 3.96 3.69 4.59 4.18 3.59 2.67 1184 3.93 4.25 2.95 4.37 4.30 3.89 3.52 3.27 4.70 3.75 3.22 2.41 1185 3.91 4.26 3.03 4.40 4.33 3.99 3.65 3.42 4.21 3.82 3.33 2.61 1186 4.8 4.97 3.36 5.07 4.91 4.53 4.16 3.93 4.26 4.33 3.77 2.92 1187 4.45 4.58 2.97 4.63 4.47 4.06 3.65 3.39 4.86 3.88 3.29 2.37 1188 3.87 4.22 2.85 4.36 4.24 3.84 3.44 3.19 4.42 3.70 3.14 2.30 1189 4.04 4.15 2.83 4.29 4.17 3.83 xxx 3.30 4.22 3.66 3.15 2.36 1190 4.7 4.57 3.02 4.66 4.48 4.12 xxx 3.53 4.08 3.93 3.37 2.50 1191 4.77 4.90 3.18 5.01 4.86 4.40 xxx 3.72 4.40 4.23 3.60 2.62 1192 4.07 4.21 2.85 4.32 4.23 3.79 xxx 3.18 4.77 3.66 3.11 2.26 1193 3.49 3.75 2.64 3.84 3.79 3.49 xxx 3.08 4.13 3.35 2.93 2.30 1194 4.26 4.42 2.96 4.53 4.39 4.08 xxx 3.61 3.70 3.89 3.40 2.65 1195 4.28 4.59 2.98 4.71 4.52 4.13 xxx 3.55 4.30 3.95 3.38 2.49 1196 3.58 3.96 2.70 4.12 3.99 3.63 xxx 3.11 4.47 3.50 3.01 2.21 1197 3.13 3.41 2.38 3.51 3.39 3.13 xxx 2.73 3.94 3.02 2.60 1.94 1198 4.04 4.32 2.86 4.40 4.20 3.91 xxx 3.40 3.36 3.75 3.24 2.44

Appendix A. (continued)
247
1199 xxx 5.06 3.09 5.19 4.97 4.46 xxx 3.63 4.17 4.28 3.55 2.33 1200 xxx 3.53 2.27 3.65 3.56 3.06 xxx 2.33 4.88 3.02 2.45 1.50 1201 3.16 3.51 2.64 3.55 3.54 3.32 xxx 3.05 3.49 3.24 2.93 2.44 1202 3.81 4.15 2.97 4.28 4.13 3.92 xxx 3.64 3.48 3.78 3.39 2.77 1203 3.64 4.06 2.92 4.26 4.06 3.79 xxx 3.41 4.07 3.67 3.24 2.56 1204 2.71 3.37 2.49 3.54 3.45 3.19 xxx 2.85 4.04 3.09 2.74 2.17 1205 2.67 3.14 2.38 3.25 3.22 3.02 xxx 2.75 3.43 2.93 2.63 2.14 1206 3.56 3.81 2.79 3.86 3.81 3.62 xxx 3.31 3.20 3.50 3.13 2.54 1207 3.77 4.15 2.96 4.23 4.11 3.86 xxx 3.52 3.78 3.73 3.29 2.62 1208 2.84 3.33 2.38 3.40 3.37 3.12 xxx 2.77 4.07 3.02 2.63 2.06 1209 2.68 3.15 2.40 3.25 3.29 3.12 xxx 2.84 3.33 3.01 2.72 2.27 1210 3.55 3.89 2.91 4.07 3.97 3.80 xxx 3.52 3.25 3.66 3.32 2.75 1211 3.47 3.92 2.82 4.13 3.93 3.68 xxx 3.33 3.94 3.57 3.17 2.52 1212 2.6 3.10 2.29 3.30 3.22 2.97 xxx 2.66 3.92 2.88 2.56 2.04 1213 2.49 2.97 2.27 3.07 3.06 2.91 2.74 2.72 3.18 2.81 2.58 2.21 1214 3.7 4.10 2.96 4.12 4.01 3.84 3.65 3.58 3.02 3.71 3.36 2.81 1215 3.43 3.71 2.51 3.70 3.59 3.32 3.10 2.96 4.00 3.26 2.82 2.18 1216 2.96 3.38 2.41 3.40 3.34 3.07 2.71 2.77 3.60 3.02 2.66 2.11 1217 2.86 3.25 2.36 3.35 3.26 3.05 2.86 2.77 3.32 2.95 2.64 2.16 1218 3.53 3.86 2.64 3.95 3.82 3.61 3.40 3.27 3.24 3.46 3.06 2.48 1219 4.27 4.58 3.08 4.70 4.53 4.19 xxx 3.63 3.82 4.00 3.48 2.56 1220 3.22 3.67 2.57 3.81 3.70 3.36 xxx 2.85 4.49 3.26 2.83 2.05 1221 3.63 4.10 3.05 4.22 4.16 3.85 3.64 3.51 3.67 3.79 3.41 2.80 1222 3.86 4.14 3.03 4.26 4.18 3.88 3.67 3.54 4.13 3.79 3.38 2.72 1223 4.19 4.51 3.30 4.66 4.57 xxx 4.03 3.76 4.14 4.13 3.69 2.93 1224 4.26 4.77 3.39 4.84 4.75 xxx 4.10 3.95 4.51 4.26 3.79 2.95 1225 4.21 4.64 3.34 4.72 4.61 xxx 3.89 3.69 4.69 4.17 3.72 2.91 1226 4.92 5.05 3.57 5.21 5.05 xxx 4.39 4.18 4.58 4.53 4.02 3.15 1227 4.84 4.91 3.38 5.06 4.85 4.39 3.95 3.63 4.98 4.33 3.74 2.86 1228 5.08 5.26 3.57 5.42 5.24 4.77 3.68 3.98 4.80 4.66 4.05 3.12 1229 4.65 4.48 2.89 4.53 4.33 3.84 3.33 2.95 5.15 3.73 3.13 2.20 1230 5.36 5.37 3.37 5.47 5.26 4.70 4.10 3.66 4.26 4.58 3.91 2.89 1231 xxx 4.53 2.40 4.45 4.17 3.41 xxx 2.11 5.19 3.40 2.56 1.18 1232 xxx 4.28 2.32 4.15 3.89 3.13 xxx 1.91 3.96 3.22 2.47 1.28 1233 xxx 6.32 3.59 6.45 6.11 5.01 xxx 3.09 3.94 5.02 3.90 2.06 1234 xxx 5.06 3.03 5.26 5.00 3.98 xxx 2.20 5.95 4.09 3.12 1.54 1235 5.79 5.09 3.64 5.92 5.74 4.52 xxx 3.26 4.86 4.88 4.03 2.52 1236 6.79 5.79 3.81 6.55 6.26 5.05 xxx 3.76 5.27 5.27 4.31 2.61 1237 6.03 5.75 3.51 5.91 5.63 4.71 xxx 3.03 5.81 4.74 3.84 2.35 1238 5.59 5.38 3.36 5.53 5.27 4.38 xxx 2.72 5.45 4.44 3.58 2.19 1239 5.41 5.31 3.37 5.49 5.22 4.29 xxx 2.62 5.12 4.48 3.68 2.38 1240 6.92 6.59 3.90 6.74 6.36 5.31 xxx 3.53 5.10 5.38 4.41 2.80 1241 6.18 5.84 3.22 5.94 5.52 4.35 xxx 2.38 6.18 4.58 3.59 1.97 1242 5.36 5.16 3.02 5.30 5.00 3.93 xxx 1.99 5.40 4.22 3.35 1.88 1243 5.49 5.19 3.02 5.32 5.01 3.97 xxx 1.95 4.91 4.22 3.37 1.91 1244 6.62 6.17 3.43 6.24 5.81 4.66 xxx 2.60 4.91 4.84 3.86 2.21 1245 6.26 5.81 2.96 5.89 5.44 4.12 xxx 1.99 5.68 4.45 3.40 1.69 1246 5.14 4.89 2.61 5.01 4.71 3.51 xxx 1.48 5.32 3.90 3.01 1.52

Appendix A. (continued)
248
1247 5.12 4.99 2.80 5.10 4.80 3.68 2.61 1.63 4.60 4.03 3.17 1.72 1248 6.22 5.90 3.20 6.00 5.56 4.34 3.21 2.23 4.69 4.63 3.61 1.98 1249 5.98 5.88 2.85 5.76 5.28 3.92 2.80 1.78 5.44 4.34 3.28 1.60 1250 4.44 4.56 2.34 4.47 4.14 2.92 1.96 1.08 5.19 3.46 2.63 1.28 1251 4.67 4.60 2.74 4.74 4.44 3.38 2.36 1.50 4.09 3.79 3.04 1.76 1252 5.83 5.71 3.19 5.85 5.42 4.26 3.09 2.09 4.37 4.52 3.59 2.04 1253 5.33 5.32 2.77 5.46 5.01 3.75 2.66 1.66 5.29 4.11 3.14 1.57 1254 3.86 4.15 2.29 4.33 3.98 2.84 1.89 1.06 4.89 3.34 2.57 1.26 1255 4.15 4.48 2.73 4.62 4.33 3.35 2.35 1.54 xxx 3.71 3.04 1.82 1256 5.06 5.19 3.01 5.30 4.97 3.92 2.81 1.81 xxx 4.17 3.35 1.96 1257 4.8 5.05 2.85 5.21 4.84 3.74 2.69 1.70 4.83 4.04 3.19 1.78 1258 3.36 4.01 2.39 4.17 3.86 2.86 1.94 1.16 4.73 3.27 2.59 1.38 1259 3.67 4.27 2.80 4.40 4.16 3.28 2.37 1.63 3.82 3.64 3.07 2.00 1260 4.53 4.86 3.01 5.01 4.70 3.73 2.71 1.80 4.11 4.03 3.34 2.14 1261 4.28 4.71 2.89 4.86 4.55 3.60 2.65 1.77 4.60 3.87 3.17 2.01 1262 3.16 3.94 2.52 4.10 3.87 2.99 2.13 1.38 4.45 3.31 2.70 1.65 1263 3.19 3.92 2.71 4.08 3.89 3.14 2.35 1.69 3.80 3.41 2.91 2.04 1264 3.96 4.41 2.92 4.57 4.30 3.48 2.60 1.83 3.82 3.72 3.16 2.22 1265 4.04 4.45 2.92 4.61 4.30 3.48 2.63 1.88 4.21 3.72 3.15 2.19 1266 3.17 3.90 2.64 4.06 3.81 3.05 2.26 1.57 4.22 3.32 2.79 1.90 1267 2.97 3.80 2.65 3.91 3.77 3.08 2.36 1.74 3.69 3.31 2.82 2.05 1268 3.57 4.18 2.84 4.20 4.05 3.32 2.54 1.86 3.70 3.54 3.02 2.21 1269 3.67 4.25 2.85 4.30 4.11 3.37 2.59 1.90 3.98 3.57 3.04 2.19 1270 3.32 4.04 2.74 4.17 4.00 3.26 2.49 1.82 4.04 3.46 2.94 2.08 1271 3.01 3.77 2.62 3.91 3.79 3.15 2.45 1.85 3.92 3.31 2.85 2.10 1272 3.44 3.98 2.73 4.09 3.95 3.29 2.58 1.94 3.71 3.43 2.94 2.14 1273 3.58 4.14 2.81 4.22 4.06 3.36 2.66 2.00 3.86 3.53 3.03 2.22 1274 3.38 4.09 2.78 4.21 4.04 3.35 2.65 2.00 3.98 3.53 3.02 2.20 1275 3.26 3.94 2.66 4.07 3.94 3.30 2.65 2.07 3.95 3.41 2.89 2.08 1276 3.43 4.03 2.71 4.13 4.00 3.36 2.70 2.11 3.85 3.46 2.94 2.12 1277 3.59 4.05 2.72 4.08 3.95 3.43 3.30 2.41 3.91 3.41 2.91 2.10 1278 3.83 4.38 2.85 4.36 4.22 3.66 2.90 2.63 3.84 3.65 3.12 2.25 1279 3.75 4.32 2.69 4.40 4.31 3.81 3.32 2.90 4.10 3.64 3.01 2.00 1280 3.25 3.63 2.42 3.72 3.64 3.17 2.69 2.29 4.18 3.10 2.55 1.69 1281 3.55 4.05 2.85 4.24 4.17 3.85 xxx 3.29 3.54 3.66 3.19 2.44 1282 4.13 4.55 3.03 4.73 4.59 4.18 xxx 3.57 4.05 4.00 3.44 2.55 1283 3.99 4.45 2.91 4.56 4.44 4.01 xxx 3.37 4.48 3.83 3.23 2.33 1284 3.5 3.95 2.70 4.09 4.01 3.62 xxx 3.01 4.33 3.48 2.95 2.14 1285 3.59 4.10 2.89 4.31 4.19 3.87 xxx 3.39 3.91 3.68 3.22 2.45 1286 4.21 4.68 3.12 4.89 4.69 4.30 xxx 3.75 4.08 4.09 3.55 2.66 1287 4.19 4.66 3.02 4.82 4.61 4.18 xxx 3.55 4.57 3.98 3.38 2.47 1288 3.5 4.00 2.74 4.15 4.02 3.66 3.27 3.07 4.49 3.52 2.99 2.18 1289 3.81 4.13 2.94 4.30 4.15 3.85 3.55 3.40 3.95 3.71 3.25 2.52 1290 4.54 4.79 3.21 4.99 4.74 4.38 4.06 3.86 4.08 4.18 3.65 2.80 1291 4.49 4.82 3.14 4.97 4.76 4.32 3.92 3.66 4.53 4.12 3.50 2.54 1292 3.46 3.93 2.73 4.07 3.97 3.59 3.22 3.00 4.64 3.46 2.93 2.13 1293 3.65 4.04 2.96 4.19 4.07 3.77 3.48 3.33 3.88 3.62 3.19 2.54 1294 4.52 4.80 3.30 5.00 4.76 4.42 4.09 3.90 4.00 4.20 3.69 2.89

Appendix A. (continued)
249
1295 4.5 4.79 3.18 4.98 4.76 4.34 3.95 3.69 4.65 4.14 3.54 2.61 1296 3.53 3.98 2.78 4.16 4.06 3.68 3.30 3.09 4.67 3.53 3.01 2.22 1297 3.59 4.00 2.93 4.15 4.07 3.79 3.49 3.34 4.07 3.62 3.20 2.54 1298 4.7 4.85 3.35 4.96 4.79 4.45 4.14 3.94 3.99 4.25 3.73 2.92 1299 4.55 4.77 3.18 4.90 4.74 4.32 3.94 3.70 4.71 4.12 3.53 2.62 1300 3.49 3.87 2.75 3.99 3.93 3.57 3.22 3.04 4.65 3.41 2.93 2.19 1301 3.58 4.01 2.94 4.18 4.11 3.80 3.53 3.24 3.84 3.67 3.24 2.58 1302 4.7 4.76 3.32 4.87 4.73 4.39 4.10 3.92 4.04 4.22 3.71 2.92 1303 4.35 4.49 3.05 4.61 4.44 4.09 3.78 3.58 4.67 3.92 3.39 2.56 1304 3.52 3.90 2.76 4.05 3.93 3.59 3.29 3.10 4.39 3.48 3.01 2.27 1305 3.33 3.81 2.80 3.99 3.90 3.62 3.38 3.25 3.87 3.49 3.11 2.49 1306 4.57 4.83 3.28 4.92 4.77 4.44 4.14 3.96 3.83 4.24 3.75 2.96 1307 4.28 4.65 2.85 4.52 4.37 3.95 3.57 3.33 4.70 3.79 3.20 2.30 1308 3.16 3.74 2.48 3.72 3.65 3.30 2.97 2.79 4.32 3.19 2.71 1.98 1309 3.38 3.75 2.69 3.88 3.81 3.51 3.21 3.03 3.60 3.39 2.97 2.29 1310 4.36 4.62 3.08 4.65 4.52 4.20 3.88 3.66 3.76 4.02 3.51 2.67 1311 4.4 4.72 3.03 4.83 4.67 4.30 3.92 3.68 4.47 4.13 3.53 2.57 1312 2.91 3.01 2.07 3.13 3.01 2.67 2.33 2.14 4.63 2.59 2.16 1.53 1313 3.03 3.31 2.52 3.51 3.42 3.22 3.04 2.97 2.96 1.59 2.84 2.45 1314 4.44 4.55 3.26 4.71 4.58 4.38 4.19 4.09 3.25 4.21 3.82 3.22 1315 3.86 3.89 2.67 4.03 3.94 3.68 3.42 3.27 4.53 3.54 3.11 2.35 1316 3.2 3.30 2.35 3.35 3.25 2.96 2.68 2.54 3.91 2.87 2.52 1.87 1317 3.22 3.50 2.59 3.63 3.52 3.37 3.12 3.02 3.22 1.90 2.89 2.38 1318 4.55 4.52 3.09 4.65 4.56 4.37 4.13 3.98 3.41 4.14 3.72 2.99 1319 3.88 3.77 2.40 3.78 3.68 3.47 3.20 3.02 4.58 3.29 2.88 2.04 1320 3.19 3.41 2.28 3.48 3.41 3.19 2.95 2.81 3.65 3.07 2.72 1.99 1321 3.11 3.28 2.14 3.29 3.22 2.96 2.74 2.60 3.37 2.89 2.52 1.83 1322 3.94 4.06 2.56 4.10 3.99 3.70 3.44 3.24 3.18 3.58 3.10 2.25 1323 4.24 4.28 2.50 4.32 4.16 3.70 3.38 3.07 3.95 3.57 2.94 1.87 1324 3.13 3.53 2.18 3.65 3.56 3.16 2.90 2.65 4.10 3.07 2.54 1.64 1325 3.32 3.68 2.42 3.74 3.67 3.39 3.14 2.96 3.48 3.23 2.75 1.96 1326 3.82 4.10 2.59 4.12 4.02 3.73 2.11 3.23 3.59 3.54 2.99 2.10 1327 4.34 4.47 2.78 4.52 4.38 4.03 xxx 4.42 3.97 xxx 3.20 2.17 1328 3.5 3.73 2.45 3.86 3.77 3.45 xxx 2.92 4.33 xxx 2.76 1.86 1329 3.32 3.68 2.58 3.78 3.73 3.53 3.28 3.14 3.70 3.32 2.90 2.22 1330 3.88 4.16 2.73 4.24 4.13 3.87 3.59 3.40 3.65 3.64 3.13 2.33 1331 4.48 4.60 2.97 4.60 4.45 4.14 3.83 3.60 4.06 3.93 3.39 2.46 1332 4.05 4.32 2.85 4.35 4.24 3.98 3.67 3.53 4.41 3.76 3.26 2.37 1333 3.74 4.07 2.77 4.17 4.08 3.84 3.54 3.37 4.20 3.62 3.14 2.34 1334 4.24 4.39 2.90 4.46 4.33 4.04 3.71 3.51 4.02 3.82 3.29 2.43 1335 4.53 4.72 2.98 4.69 4.51 4.15 3.78 3.53 4.26 3.94 3.36 2.37 1336 4.58 4.84 3.06 4.81 4.65 4.27 3.91 3.69 4.44 4.06 3.47 2.47 1337 4.5 4.61 2.93 4.71 4.56 4.15 3.78 3.51 4.58 3.96 3.34 2.30 1338 4.48 4.51 2.87 4.59 4.44 4.05 3.66 3.40 4.48 3.85 3.24 2.23 1339 4.77 4.77 3.08 4.97 4.79 4.41 4.03 3.77 4.36 4.18 3.55 2.52 1340 5.36 5.05 3.20 5.18 4.97 4.56 4.16 3.88 4.73 4.33 3.66 2.58 1341 4.65 4.57 2.84 4.62 4.46 4.06 3.68 3.41 4.90 3.87 3.23 2.22 1342 4.6 4.71 2.90 4.78 4.62 4.18 3.80 3.52 4.38 4.01 3.36 2.32

Appendix A. (continued)
250
1343 5.26 5.09 3.04 5.16 4.94 4.40 3.94 3.60 4.54 4.23 3.47 2.28 1344 5.72 5.47 3.21 5.55 5.29 4.69 4.19 3.84 4.84 4.53 3.71 2.44 1345 5.78 5.43 3.11 5.44 5.21 4.58 4.04 3.65 5.19 4.42 3.57 2.23 1346 4.5 4.42 2.70 4.50 4.36 3.88 3.42 3.11 5.11 3.72 3.02 1.90 1347 5.55 5.16 3.35 5.22 5.01 4.60 4.16 3.88 4.27 4.36 3.71 2.63 1348 6.52 5.98 3.64 6.00 5.71 5.17 4.66 4.33 4.91 4.93 4.15 2.87 1349 6.05 5.58 3.32 5.62 5.38 4.75 4.20 3.82 5.60 4.59 3.75 2.41 1350 4.8 4.58 2.91 4.70 4.56 4.05 xxx 3.26 5.27 3.88 3.17 2.05 1351 5.26 4.97 3.32 4.99 4.83 4.42 xxx 3.73 4.45 4.19 3.56 2.59 1352 6.73 6.14 3.76 6.08 5.78 5.22 4.70 4.37 4.70 5.00 4.20 2.97 1353 6.26 5.83 3.42 5.86 5.57 4.87 4.30 3.89 5.66 4.74 3.86 2.46 1354 4.67 4.45 2.88 4.58 4.41 3.86 3.38 3.08 5.47 3.75 3.07 1.98 1355 5.23 5.01 3.47 5.27 5.09 4.37 4.22 3.99 4.31 4.45 3.86 2.88 1356 6.59 6.08 3.89 6.21 5.97 5.15 4.95 4.63 4.96 5.19 4.44 3.23 1357 6.17 5.69 3.48 5.78 5.54 4.89 4.34 3.94 5.84 4.74 3.92 2.63 1358 4.77 4.48 2.98 4.68 4.51 3.97 3.48 3.16 5.44 3.86 3.20 2.14 1359 4.69 4.59 3.27 4.80 4.64 4.21 3.92 3.70 4.42 4.12 3.60 2.76 1360 6.36 6.03 3.81 6.04 5.79 5.23 4.85 4.54 4.54 5.10 4.39 3.26 1361 5.72 5.42 3.23 5.38 5.13 4.53 4.02 3.66 5.69 4.42 3.65 2.42 1362 4.34 4.37 2.86 4.48 4.31 3.82 3.40 3.12 5.07 3.75 3.14 2.13 1363 4.41 4.41 2.98 4.55 4.36 3.96 3.60 3.38 4.25 3.83 3.27 2.37 1364 5.65 5.50 3.46 5.58 5.31 4.79 4.36 4.04 4.28 4.65 3.93 2.80 1365 5.34 5.20 3.04 5.20 4.97 4.34 3.85 3.47 5.24 4.25 3.46 2.19 1366 3.6 3.83 2.49 3.92 3.81 3.32 2.93 2.67 4.91 3.27 2.69 1.73 1367 3.99 4.12 2.90 4.22 4.12 3.81 3.51 3.35 3.74 3.65 3.18 2.40 1368 5.1 4.94 3.21 5.00 4.81 4.44 4.05 3.82 4.04 4.24 3.63 2.65 1369 4.77 4.83 3.09 4.91 4.73 4.29 3.87 3.62 4.75 4.13 3.47 2.44 1370 3.49 3.88 2.67 4.01 3.91 3.53 3.54 2.97 4.68 3.41 2.88 2.04 1371 3.7 3.99 2.89 4.14 4.07 3.76 3.45 3.29 3.85 3.61 3.14 2.40 1372 4.53 4.60 3.15 4.69 4.57 4.23 3.89 3.69 3.99 4.05 3.49 2.63 1373 4.2 4.44 3.00 4.54 4.38 4.02 3.71 3.51 4.50 3.88 3.33 2.46 1374 3.51 3.87 2.70 3.94 3.85 3.52 3.23 3.15 4.33 3.40 2.94 2.17 1375 3.39 3.83 2.75 3.87 3.85 3.57 3.31 3.18 3.78 3.44 3.03 2.36 1376 4.01 4.28 3.01 4.36 4.26 3.96 3.69 3.53 3.78 3.81 3.34 2.59 1377 4.05 4.33 2.99 4.46 4.30 3.98 3.71 3.53 4.21 3.83 3.33 2.56 1378 3.46 3.70 2.65 3.86 3.79 3.47 3.21 3.05 4.27 3.35 2.91 2.22 1379 3.25 3.56 2.62 3.64 3.65 3.40 3.16 3.04 3.73 3.27 2.91 2.30 1380 3.57 3.89 2.79 3.94 3.90 3.64 3.40 3.26 3.58 3.51 3.11 2.46 1381 3.9 4.19 3.03 4.37 4.23 3.97 3.72 3.57 3.84 3.84 3.38 2.70 1382 3.62 4.03 2.93 4.23 4.11 3.82 3.60 3.46 4.18 3.72 3.28 2.60 1383 3.14 3.58 2.56 3.58 3.57 3.34 3.08 2.96 4.04 3.24 2.85 2.20 1384 3.24 3.69 2.66 3.70 3.67 3.44 3.20 3.08 3.52 3.35 2.95 2.31 1385 3.61 3.96 2.89 4.12 xxx 3.76 3.51 3.37 3.65 3.62 3.21 2.53 1386 3.65 4.01 2.90 4.17 xxx 3.84 3.58 3.44 3.95 3.68 3.28 2.58 1387 3.33 3.68 2.63 3.77 3.74 3.52 3.26 3.11 4.01 3.35 2.96 2.27 1388 2.96 3.36 2.43 3.44 3.40 3.18 2.91 2.76 3.70 3.03 2.67 2.04 1389 3.49 3.93 2.90 4.02 3.95 3.76 3.49 3.35 3.37 3.57 3.22 2.63 1390 3.79 4.21 3.06 4.35 4.26 4.07 3.81 3.68 3.90 3.86 3.46 2.79

Appendix A. (continued)
1391 3.56 3.94 2.81 3.99 3.97 3.70 3.44 3.28 4.20 3.55 3.12 2.38 1392 2.98 3.38 2.49 3.42 3.43 3.16 2.92 2.78 3.93 3.05 2.69 2.09 1393 3.39 3.73 2.82 3.82 3.78 3.59 3.39 3.26 3.40 3.45 3.12 2.59 1394 4.21 4.48 3.21 4.57 4.49 4.27 4.02 3.86 3.74 4.07 3.63 2.93 1395 3.83 4.11 2.90 4.23 4.17 3.89 3.59 3.40 4.44 3.71 3.26 2.50 1396 3.07 3.47 2.55 3.54 3.53 3.27 3.00 2.85 4.12 3.14 2.80 2.17 1397 3.31 3.71 2.77 3.78 3.72 3.52 3.29 3.17 3.47 3.38 3.05 2.51 1398 4.29 4.54 3.22 4.63 4.51 4.26 4.00 3.85 3.66 4.08 3.63 2.94 1399 4.04 4.29 2.95 4.36 4.30 3.96 3.65 3.46 4.47 3.79 3.30 2.49 1400 3.14 3.45 2.54 3.55 3.54 3.25 2.99 2.82 4.25 3.12 2.75 2.10 1401 3.37 3.66 2.76 3.84 3.75 3.54 3.33 3.18 3.48 3.39 3.06 2.49 1402 4.46 4.66 3.26 4.78 4.64 4.37 4.12 3.96 3.69 4.17 3.71 2.97 1403 4.17 4.42 2.94 4.44 4.36 4.00 3.68 3.48 4.57 3.82 3.28 2.46 1404 3.24 3.61 2.56 3.67 3.66 3.36 3.05 2.88 4.29 3.20 2.77 2.09 1405 3.24 3.65 2.71 3.84 3.76 3.54 3.28 3.08 3.59 3.37 3.00 2.40 1406 4.54 4.75 3.23 4.87 4.71 4.40 4.11 3.91 3.71 4.21 3.70 2.90 1407 4.36 4.48 2.89 4.54 4.43 4.01 3.67 3.42 4.65 3.84 3.24 2.31 1408 3.13 3.45 2.43 3.56 3.52 3.20 2.90 2.71 4.34 3.05 2.60 1.89 1409 3.55 3.92 2.86 4.04 3.96 3.74 3.48 3.26 3.44 3.55 3.15 2.51 1410 4.68 4.90 3.27 3.98 4.78 4.47 4.16 3.95 3.89 4.26 3.73 2.88
251

APPENDIX B
CRUISE DATABASE BY DATE AND SITE SHOWING ALL PARAMETERS COLLECTED BY DEPTH

Appendix B. Cruise database by date and site showing all para-meters collected by depth.
Physical Measurements Collected At Depth
Site: 1 Way point: 013 Date: 8/22/2006 Latitude: 34º 16.837 N Longitude: 78º 00.263 W
Depth Conductivity Temp Salinity D.O.
326 uS 28.7 ºC 0.1 ppt 2.33 mg/L Surface
326 uS 28.7 ºC 0.1 ppt 2.33 mg/L 5 ft 326.8 uS 28.6 ºC 0.1 ppt 2.35 mg/L 10 ft
330 uS 28.6 ºC 0.1 ppt 2.25 mg/L 15 ft
333 uS 28.6 ºC 0.1 ppt 2.31 mg/L 20 ft
326 uS 28.6 ºC 0.1 ppt 2.34 mg/L 25 ft
326 uS 28.6 ºC 0.1 ppt 2.36 mg/L 30 ft
328 uS 28.6 ºC 0.1 ppt 2.34 mg/L 35 ft
330 uS 28.6 ºC 0.1 ppt 2.35 mg/L 40 ft
321 uS 28.6 ºC 0.1 ppt 2.38 mg/L 45 ft
253

Appendix B. (continued)
Physical Measurements Collected At Depth
Site: 2 Way point: 014 Date: 8/22/2006 Latitude: 34º 19.396 N Longitude: 78º 00.549 W
Depth Conductivity Temp Salinity D.O.
277 uS 28.8 ºC 0.1 ppt 2.38 mg/L Surface
278 uS 28.8 ºC 0.1 ppt 2.26 mg/L 5 ft
279 uS 28.7 ºC 0.1 ppt 2.45 mg/L 10 ft
278 uS 28.8 ºC 0.1 ppt 2.37 mg/L 15 ft
278 uS 28.8 ºC 0.1 ppt 2.26 mg/L 20 ft
278 uS 28.8 ºC 0.1 ppt 2.34 mg/L 25 ft
278 uS 28.8 ºC 0.1 ppt 2.33 mg/L 30 ft
ND uS ND ºC ND ppt ND mg/L 35 ft
ND uS ND ºC ND ppt ND mg/L 40 ft
ND uS ND ºC ND ppt ND mg/L 45 ft
254

Appendix B. (continued)
Physical Measurements Collected At Depth
Site: 3 Way point: 015 Date: 8/22/2006 Latitude: 34º 20.187 N Longitude: 78º 02.900 W
Depth Conductivity Temp Salinity D.O.
254 uS 28.8 ºC 0.1 ppt 2.96 mg/L Surface
255 uS 28.7 ºC 0.1 ppt 2.76 mg/L 5 ft
254 uS 28.7 ºC 0.1 ppt 2.7 mg/L 10 ft
255 uS 28.7 ºC 0.1 ppt 2.74 mg/L 15 ft
255 uS 28.7 ºC 0.1 ppt 2.67 mg/L 20 ft
ND uS ND ºC ND ppt ND mg/L 25 ft
ND uS ND ºC ND ppt ND mg/L 30 ft
ND uS ND ºC ND ppt ND mg/L 35 ft
ND uS ND ºC ND ppt ND mg/L 40 ft
ND uS ND ºC ND ppt ND mg/L 45 ft
255

Appendix B. (continued)
Physical Measurements Collected At Depth Site: 4 Way point: 016 Date: 8/22/2006 Latitude: 34º 20.276 N Longitude: 78º 04.509 W Depth Conductivity Temp Salinity D.O. Surface 262 uS 28.9 ºC 0.1 ppt 2.86 mg/L
5 ft 261 uS 28.9 ºC 0.1 ppt 2.8 mg/L
10 ft 245 uS 28.9 ºC 0.1 ppt 2.88 mg/L
15 ft 263 uS 28.9 ºC 0.1 ppt 2.9 mg/L
20 ft 262 uS 28.8 ºC 0.1 ppt 2.72 mg/L
25 ft ND uS ND ºC ND ppt ND mg/L
30 ft ND uS ND ºC ND ppt ND mg/L
35 ft ND uS ND ºC ND ppt ND mg/L
40 ft ND uS ND ºC ND ppt ND mg/L
45 ft ND uS ND ºC ND ppt ND mg/L
256

Appendix B. (continued)
Physical Measurements Collected At Depth Site: 5 Way point: 017 Date: 8/22/2006 Latitude: 34º 21.312 N Longitude: 78º 06.122 W
Depth Conductivity Temp Salinity D.O. 368.7 uS 29.4 ºC 0.2 ppt 3.03 mg/L Surface
369.1 uS 29.4 ºC 0.2 ppt 3.05 mg/L 5 ft
369.9 uS 29.4 ºC 0.2 ppt 3.27 mg/L 10 ft
369.3 uS 29.3 ºC 0.2 ppt 3.24 mg/L 15 ft
ND uS ND ºC ND ppt ND mg/L 20 ft
ND uS ND ºC ND ppt ND mg/L 25 ft
ND uS ND ºC ND ppt ND mg/L 30 ft
ND uS ND ºC ND ppt ND mg/L 35 ft
ND uS ND ºC ND ppt ND mg/L 40 ft
ND uS ND ºC ND ppt ND mg/L 45 ft
257

Appendix B. (continued)
Physical Measurements Collected At Depth Site: 6 Way point: 018 Date: 8/22/2006 Latitude: 34º 21.963 N Longitude: 78º 08.109 W
Depth Conductivity Temp Salinity D.O.
352 uS 29.5 ºC 0.2 ppt 3.84 mg/L Surface 351.5 uS 29.4 ºC 0.2 ppt 3.01 mg/L 5 ft
351.7 uS 29.4 ºC 0.2 ppt 2.92 mg/L 10 ft
352.3 uS 29.4 ºC 0.2 ppt 3.17 mg/L 15 ft
ND uS ND ºC ND ppt ND mg/L 20 ft
ND uS ND ºC ND ppt ND mg/L 25 ft
ND uS ND ºC ND ppt ND mg/L 30 ft
ND uS ND ºC ND ppt ND mg/L 35 ft
ND uS ND ºC ND ppt ND mg/L 40 ft
ND uS ND ºC ND ppt ND mg/L 45 ft
258

Appendix B. (continued)
Physical Measurements Collected At Depth Site: 7 Way point: 019 Date: 8/22/2006 Latitude: 34º 21.440 N Longitude: 78º 09.949 W
Depth Conductivity Temp Salinity D.O. 399.2 uS 29.6 ºC 0.2 ppt 3.75 mg/L Surface
392.6 uS 29.3 ºC 0.2 ppt 3.37 mg/L 5 ft
386 uS 29.2 ºC 0.2 ppt 3.4 mg/L 10 ft
376.4 uS 29.2 ºC 0.2 ppt 3.42 mg/L 15 ft
ND uS ND ºC ND ppt ND mg/L 20 ft
ND uS ND ºC ND ppt ND mg/L 25 ft
ND uS ND ºC ND ppt ND mg/L 30 ft
ND uS ND ºC ND ppt ND mg/L 35 ft
ND uS ND ºC ND ppt ND mg/L 40 ft
ND uS ND ºC ND ppt ND mg/L 45 ft
259

Appendix B. (continued)
Physical Measurements Collected At Depth Site: 8 Way point: 020 Date: 8/22/2006 Latitude: 34º 21.413 N Longitude: 78º 12.560 W
Depth Conductivity Temp Salinity D.O.
156 uS 29.6 ºC 0.1 ppt 4.25 mg/L Surface
160 uS 29 ºC 0.1 ppt 3.88 mg/L 5 ft
156 uS 28.8 ºC 0.1 ppt 3.92 mg/L 10 ft
154 uS 28.8 ºC 0.1 ppt 3.81 mg/L 15 ft
159 uS 28.8 ºC 0.1 ppt 3.77 mg/L 20 ft
ND uS ND ºC ND ppt ND mg/L 25 ft
ND uS ND ºC ND ppt ND mg/L 30 ft
ND uS ND ºC ND ppt ND mg/L 35 ft
ND uS ND ºC ND ppt ND mg/L 40 ft
ND uS ND ºC ND ppt ND mg/L 45 ft
260

Appendix B. (continued)
Physical Measurements Collected At Depth Site: 9 Way point: 021 Date: 8/22/2006 Latitude: 34º 22.470 N Longitude: 78º 13.560 W
Depth Conductivity Temp Salinity D.O. 131.8 uS 30 ºC 0.1 ppt 4.81 mg/L Surface
127.9 uS 28.8 ºC 0.1 ppt 4.11 mg/L 5 ft
127.8 uS 28.7 ºC 0.1 ppt 3.91 mg/L 10 ft
127.8 uS 28.6 ºC 0.1 ppt 3.9 mg/L 15 ft
ND uS ND ºC ND ppt ND mg/L 20 ft
ND uS ND ºC ND ppt ND mg/L 25 ft
ND uS ND ºC ND ppt ND mg/L 30 ft
ND uS ND ºC ND ppt ND mg/L 35 ft
ND uS ND ºC ND ppt ND mg/L 40 ft
ND uS ND ºC ND ppt ND mg/L 45 ft
261

Appendix B. (continued)
Physical Measurements Collected At Depth Site: 10 Way point: 022 Date: 8/22/2006 Latitude: 34º 23.075 N Longitude: 78º 14.705 W
Depth Conductivity Temp Salinity D.O. 131.8 uS 31.2 ºC 0.1 ppt 5.28 mg/L Surface
126 uS 28.9 ºC 0.1 ppt 3.84 mg/L 5 ft
125 uS 28.8 ºC 0.1 ppt 3.74 mg/L 10 ft
125 uS 28.7 ºC 0.1 ppt 3.9 mg/L 15 ft
ND uS ND ºC ND ppt ND mg/L 20 ft
ND uS ND ºC ND ppt ND mg/L 25 ft
ND uS ND ºC ND ppt ND mg/L 30 ft
ND uS ND ºC ND ppt ND mg/L 35 ft
ND uS ND ºC ND ppt ND mg/L 40 ft
ND uS ND ºC ND ppt ND mg/L 45 ft
262

Appendix B. (continued)
Physical Measurements Collected At Depth Site: 11 Way point: 023 Date: 8/22/2006 Latitude: 34º 23.824 N Longitude: 78º 16.050 W
Depth Conductivity Temp Salinity D.O.
128 uS 29.8 ºC 0.1 ppt 5.76 mg/L Surface
125 uS 28.7 ºC 0.1 ppt 4.07 mg/L 5 ft 125.3 uS 28.5 ºC 0.1 ppt 3.66 mg/L 10 ft
ND uS ND ºC ND ppt ND mg/L 15 ft
ND uS ND ºC ND ppt ND mg/L 20 ft
ND uS ND ºC ND ppt ND mg/L 25 ft
ND uS ND ºC ND ppt ND mg/L 30 ft
ND uS ND ºC ND ppt ND mg/L 35 ft
ND uS ND ºC ND ppt ND mg/L 40 ft
ND uS ND ºC ND ppt ND mg/L 45 ft
263

Appendix B. (continued)
Physical Measurements Collected At Depth Site: 12 Way point: 024 Date: 8/22/2006 Latitude: 34º 24.218 N Longitude: 78º 17.528 W
Depth Conductivity Temp Salinity D.O. 126.8 uS 29 ºC 0.1 ppt 4.5 mg/L Surface
126.9 uS 28.9 ºC 0.1 ppt 4.19 mg/L 5 ft
126.8 uS 28.9 ºC 0.1 ppt 4.37 mg/L 10 ft
126.8 uS 28.9 ºC 0.1 ppt 4.42 mg/L 15 ft
ND uS ND ºC ND ppt ND mg/L 20 ft
ND uS ND ºC ND ppt ND mg/L 25 ft
ND uS ND ºC ND ppt ND mg/L 30 ft
ND uS ND ºC ND ppt ND mg/L 35 ft
ND uS ND ºC ND ppt ND mg/L 40 ft
ND uS ND ºC ND ppt ND mg/L 45 ft
264

Appendix B. (continued)
Physical Measurements Collected At Depth
Site: Way point: 9/16/2006 1 013 Date: Latitude: 34º 16.837 N Longitude: 78º 00.263 W
Depth Conductivity Temp Salinity D.O. Surface 103.3 uS 23 ºC 0.1 ppt 3.22 mg/L
5 ft 102.1 uS 23.2 ºC 0.1 ppt 2.91 mg/L
10 ft 101.7 uS 23.2 ºC 0.1 ppt 2.91 mg/L
15 ft 101.5 uS 23.2 ºC 0.1 ppt 2.83 mg/L
20 ft 94.6 uS 23.2 ºC 0.1 ppt 2.78 mg/L
25 ft 100.6 uS 23.2 ºC 0.1 ppt 3.02 mg/L
30 ft 95.9 uS 23.2 ºC 0.1 ppt 2.72 mg/L
35 ft 103.3 uS 23.2 ºC 0.1 ppt 2.98 mg/L
40 ft 102.2 uS 23.3 ºC 0.1 ppt 3.08 mg/L
45 ft 102 uS 23.3 ºC 0.1 ppt 3.04 mg/L
265

Appendix B. (continued)
Physical Measurements Collected At Depth
Site: Way point: Date: 9/16/2006 2 014 Latitude: 34º 19.396 N Longitude: 78º 00.549 W
Depth Conductivity Temp Salinity D.O. Surface 93.5 uS 22.4 ºC 0.1 ppt 3.1 mg/L
5 ft 93.5 uS 23 ºC 0.1 ppt 3.05 mg/L
10 ft 93.5 uS 23.1 ºC 0.1 ppt 3.07 mg/L
15 ft 93.6 uS 23.1 ºC 0.1 ppt 3.04 mg/L
20 ft 93.9 uS 23.1 ºC 0.1 ppt 3.02 mg/L
25 ft 93.7 uS 23.1 ºC 0.1 ppt 2.95 mg/L
30 ft 93.6 uS 23 ºC 0.1 ppt 3.14 mg/L
35 ft ND uS ND ºC ND ppt ND mg/L
40 ft ND uS ND ºC ND ppt ND mg/L
45 ft ND uS ND ºC ND ppt ND mg/L
266

Appendix B. (continued)
Physical Measurements Collected At Depth
Site: Way point: Date: 9/16/2006 2 015 Latitude: 34º 20.187 N Longitude: 78º 02.900 W
Depth Conductivity Temp Salinity D.O. Surface 106.1 uS 23.8 ºC 0.1 ppt 4.12 mg/L
5 ft 109.5 uS 23.9 ºC 0.1 ppt 4 mg/L
10 ft 113.4 uS 23.9 ºC 0.1 ppt 4 mg/L
15 ft 115.4 uS 23.9 ºC 0.1 ppt 3.96 mg/L
20 ft 119.5 uS 23.9 ºC 0.1 ppt 3.93 mg/L
25 ft ND uS ND ºC ND ppt ND mg/L
30 ft ND uS ND ºC ND ppt ND mg/L
35 ft ND uS ND ºC ND ppt ND mg/L
40 ft ND uS ND ºC ND ppt ND mg/L
45 ft ND uS ND ºC ND ppt ND mg/L
267

Appendix B. (continued)
Physical Measurements Collected At Depth Site: 4 Way point: 016 Date: 9/16/2006 Latitude: 34º 20.276 N Longitude: 78º 04.509 W Depth Conductivity Temp Salinity D.O. Surface 95.2 uS 23.8 ºC 0.1 ppt 4.37 mg/L
5 ft 95.4 uS 23.8 ºC 0.1 ppt 4.31 mg/L
10 ft 97.4 uS 23.9 ºC 0.1 ppt 4.21 mg/L
15 ft 97.3 uS 24 ºC 0.1 ppt 4.18 mg/L
20 ft 97.8 uS 24 ºC 0.1 ppt 4.08 mg/L
25 ft ND uS ND ºC ND ppt ND mg/L
30 ft ND uS ND ºC ND ppt ND mg/L
35 ft ND uS ND ºC ND ppt ND mg/L
40 ft ND uS ND ºC ND ppt ND mg/L
45 ft ND uS ND ºC ND ppt ND mg/L
268

Appendix B. (continued)
Physical Measurements Collected At Depth Site: 5 Way point: 017 Date: 9/16/2006 Latitude: 34º 21.312 N Longitude: 78º 06.122 W
Depth Conductivity Temp Salinity D.O. Surface 170 uS 24.1 ºC 0.1 ppt 4.04 mg/L
5 ft 170.7 uS 24.2 ºC 0.1 ppt 4.14 mg/L
10 ft 171 uS 24.2 ºC 0.1 ppt 4.17 mg/L
15 ft 170.7 uS 24.2 ºC 0.1 ppt 4.31 mg/L
20 ft ND uS ND ºC ND ppt ND mg/L
25 ft ND uS ND ºC ND ppt ND mg/L
30 ft ND uS ND ºC ND ppt ND mg/L
35 ft ND uS ND ºC ND ppt ND mg/L
40 ft ND uS ND ºC ND ppt ND mg/L
45 ft ND uS ND ºC ND ppt ND mg/L
269

Appendix B. (continued)
Physical Measurements Collected At Depth Site: 6 Way point: 018 Date: 9/16/2006 Latitude: 34º 21.963 N Longitude: 78º 08.109 W
Depth Conductivity Temp Salinity D.O. Surface 94.5 uS 23.9 ºC 0 ppt 4.4 mg/L
5 ft 94.5 uS 24 ºC 0 ppt 4.27 mg/L
10 ft 94.6 uS 24 ºC 0 ppt 4.28 mg/L
15 ft 94.5 uS 24 ºC 0 ppt 4.26 mg/L
20 ft 94.7 uS 24 ºC 0 ppt 4.28 mg/L
25 ft ND uS ND ºC ND ppt ND mg/L
30 ft ND uS ND ºC ND ppt ND mg/L
35 ft ND uS ND ºC ND ppt ND mg/L
40 ft ND uS ND ºC ND ppt ND mg/L
45 ft ND uS ND ºC ND ppt ND mg/L
270

Appendix B. (continued)
Physical Measurements Collected At Depth Site: 7 Way point: 019 Date: 9/16/2006 Latitude: 34º 21.440 N Longitude: 78º 09.949 W
Depth Conductivity Temp Salinity D.O.
Surface 88.6 uS 23.8 ºC 0 ppt 4.61 mg/L
5 ft 89.4 uS 23.9 ºC 0 ppt 4.51 mg/L
10 ft 89.2 uS 23.9 ºC 0 ppt 4.43 mg/L
15 ft 89.2 uS 23.9 ºC 0 ppt 4.4 mg/L
20 ft 89.1 uS 23.9 ºC 0 ppt 4.21 mg/L
25 ft ND uS ND ºC ND ppt ND mg/L
30 ft ND uS ND ºC ND ppt ND mg/L
35 ft ND uS ND ºC ND ppt ND mg/L
40 ft ND uS ND ºC ND ppt ND mg/L
45 ft ND uS ND ºC ND ppt ND mg/L
271

Appendix B. (continued)
Physical Measurements Collected At Depth Site: 8 Way point: 020 Date: 9/16/2006 Latitude: 34º 21.413 N Longitude: 78º 12.560 W
Depth Conductivity Temp Salinity D.O. Surface 80.1 uS 24.2 ºC 0 ppt 4.73 mg/L
5 ft 80 uS 24.1 ºC 0 ppt 4.73 mg/L
10 ft 79.9 uS 24.1 ºC 0 ppt 4.7 mg/L
15 ft 79.9 uS 24.1 ºC 0 ppt 4.77 mg/L
20 ft 79.9 uS 24.1 ºC 0 ppt 4.62 mg/L
25 ft ND uS ND ºC ND ppt ND mg/L
30 ft ND uS ND ºC ND ppt ND mg/L
35 ft ND uS ND ºC ND ppt ND mg/L
40 ft ND uS ND ºC ND ppt ND mg/L
45 ft ND uS ND ºC ND ppt ND mg/L
272
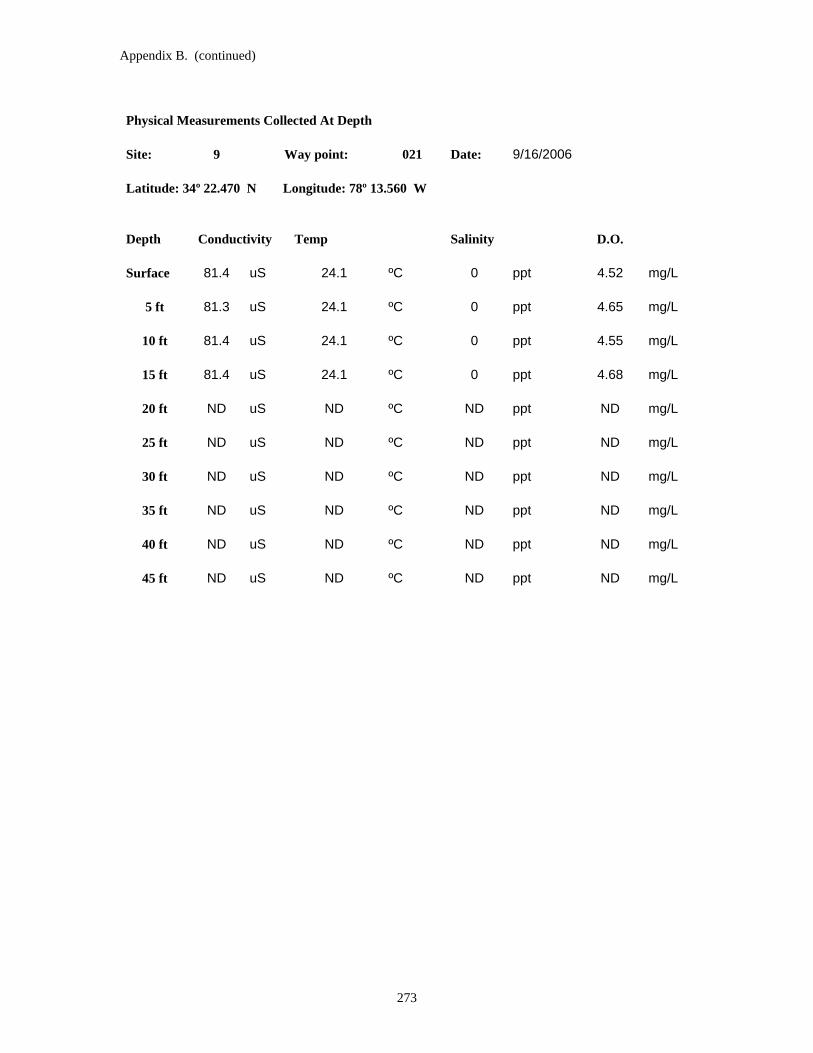
Appendix B. (continued)
Physical Measurements Collected At Depth Site: 9 Way point: 021 Date: 9/16/2006 Latitude: 34º 22.470 N Longitude: 78º 13.560 W
Depth Conductivity Temp Salinity D.O. Surface 81.4 uS 24.1 ºC 0 ppt 4.52 mg/L
5 ft 81.3 uS 24.1 ºC 0 ppt 4.65 mg/L
10 ft 81.4 uS 24.1 ºC 0 ppt 4.55 mg/L
15 ft 81.4 uS 24.1 ºC 0 ppt 4.68 mg/L
20 ft ND uS ND ºC ND ppt ND mg/L
25 ft ND uS ND ºC ND ppt ND mg/L
30 ft ND uS ND ºC ND ppt ND mg/L
35 ft ND uS ND ºC ND ppt ND mg/L
40 ft ND uS ND ºC ND ppt ND mg/L
45 ft ND uS ND ºC ND ppt ND mg/L
273

Appendix B. (continued)
Physical Measurements Collected At Depth Site: 10 Way point: 022 Date: 9/16/2006 Latitude: 34º 23.075 N Longitude: 78º 14.705 W
Depth Conductivity Temp Salinity D.O. Surface 82.7 uS 24.1 ºC 0 ppt 4.67 mg/L
5 ft 82.7 uS 24.1 ºC 0 ppt 4.71 mg/L
10 ft 82.8 uS 24.1 ºC 0 ppt 4.71 mg/L
15 ft 82.8 uS 24.1 ºC 0 ppt 4.71 mg/L
20 ft 82.9 uS 24.1 ºC 0 ppt 4.84 mg/L
25 ft ND uS ND ºC ND ppt ND mg/L
30 ft ND uS ND ºC ND ppt ND mg/L
35 ft ND uS ND ºC ND ppt ND mg/L
40 ft ND uS ND ºC ND ppt ND mg/L
45 ft ND uS ND ºC ND ppt ND mg/L
274

Appendix B. (continued)
Physical Measurements Collected At Depth Site: 11 Way point: 023 Date: 9/16/2006 Latitude: 34º 23.824 N Longitude: 78º 16.050 W
Depth Conductivity Temp Salinity D.O. Surface 84.8 uS 24.2 ºC 0 ppt 5.06 mg/L
5 ft 84.2 uS 24.2 ºC 0 ppt 5.04 mg/L
10 ft 84.8 uS 24.2 ºC 0 ppt 5.04 mg/L
15 ft 84.8 uS 24.2 ºC 0 ppt 5.03 mg/L
20 ft ND uS ND ºC ND ppt ND mg/L
25 ft ND uS ND ºC ND ppt ND mg/L
30 ft ND uS ND ºC ND ppt ND mg/L
35 ft ND uS ND ºC ND ppt ND mg/L
40 ft ND uS ND ºC ND ppt ND mg/L
45 ft ND uS ND ºC ND ppt ND mg/L
275

Appendix B. (continued)
Physical Measurements Collected At Depth Site: 12 Way point: 024 Date: 9/16/2006 Latitude: 34º 24.218 N Longitude: 78º 17.528 W
Depth Conductivity Temp Salinity D.O. Surface 85.5 uS 24.2 ºC 0 ppt 5.51 mg/L
5 ft 85.5 uS 24.2 ºC 0 ppt 5.24 mg/L
10 ft 85.5 uS 24.2 ºC 0 ppt 5.01 mg/L
15 ft 85.6 uS 24.2 ºC 0 ppt 4.93 mg/L
20 ft ND uS ND ºC ND ppt ND mg/L
25 ft ND uS ND ºC ND ppt ND mg/L
30 ft ND uS ND ºC ND ppt ND mg/L
35 ft ND uS ND ºC ND ppt ND mg/L
40 ft ND uS ND ºC ND ppt ND mg/L
45 ft ND uS ND ºC ND ppt ND mg/L
276

Appendix B. (continued)
Physical Measurements Collected At Depth
Site: 1 Way point: Date: 9/23/2006 013 Latitude: 34º 16.837 N Longitude: 78º 00.263 W
Depth Conductivity Temp Salinity D.O. Surface 130.5 uS 23.4 ºC 0.1 ppt 3.26 mg/L
5 ft 130.2 uS 23.4 ºC 0.1 ppt 3.44 mg/L
10 ft 130.8 uS 23.3 ºC 0.1 ppt 3.31 mg/L
15 ft 130.5 uS 23.4 ºC 0.1 ppt 3.33 mg/L
20 ft 130.6 uS 23.4 ºC 0.1 ppt 3.39 mg/L
25 ft 130.2 uS 23.4 ºC 0.1 ppt 3.18 mg/L
30 ft 130.1 uS 23.4 ºC 0.1 ppt 3.39 mg/L
35 ft 130.1 uS 23.4 ºC 0.1 ppt 3.44 mg/L
40 ft 130.3 uS 23.4 ºC 0.1 ppt 3.25 mg/L
45 ft 130.6 uS 23.4 ºC 0.1 ppt 3.23 mg/L
277

Appendix B. (continued)
Physical Measurements Collected At Depth
Site: 2 Way point: Date: 9/23/2006 014 Latitude: 34º 19.396 N Longitude: 78º 00.549 W
Depth Conductivity Temp Salinity D.O. Surface 137.1 uS 23.3 ºC 0.1 ppt 3.59 mg/L
5 ft 137.1 uS 23.2 ºC 0.1 ppt 3.35 mg/L
10 ft 137 uS 23.2 ºC 0.1 ppt 3.51 mg/L
15 ft 137.2 uS 23.2 ºC 0.1 ppt 3.42 mg/L
20 ft 137.4 uS 23.2 ºC 0.1 ppt 3.37 mg/L
25 ft 137 uS 23.2 ºC 0.1 ppt 3.49 mg/L
30 ft 137.1 uS 23.2 ºC 0.1 ppt 3.43 mg/L
35 ft ND uS ND ºC ND ppt ND mg/L
40 ft ND uS ND ºC ND ppt ND mg/L
45 ft ND uS ND ºC ND ppt ND mg/L
278

Appendix B. (continued)
Physical Measurements Collected At Depth
Site: Way point: Date: 9/23/2006 3 015 Latitude: 34º 20.187 N Longitude: 78º 02.900 W
Depth Conductivity Temp Salinity D.O. Surface 138.3 uS 23.3 ºC 0.1 ppt 3.64 mg/L
5 ft 124.4 uS 23.1 ºC 0.1 ppt 3.46 mg/L
10 ft 129.2 uS 23 ºC 0.1 ppt 3.24 mg/L
15 ft 129.2 uS 22.9 ºC 0.1 ppt 3.52 mg/L
20 ft 129.3 uS 22.9 ºC 0.1 ppt 3.53 mg/L
25 ft ND uS ND ºC ND ppt ND mg/L
30 ft ND uS ND ºC ND ppt ND mg/L
35 ft ND uS ND ºC ND ppt ND mg/L
40 ft ND uS ND ºC ND ppt ND mg/L
45 ft ND uS ND ºC ND ppt ND mg/L
279

Appendix B. (continued)
Physical Measurements Collected At Depth Site: 4 Way point: 016 Date: 9/23/2006 Latitude: 34º 20.276 N Longitude: 78º 04.509 W Depth Conductivity Temp Salinity D.O. Surface 150.1 uS 23.4 ºC 0.1 ppt 3.69 mg/L
5 ft 149.2 uS 23.2 ºC 0.1 ppt 3.65 mg/L
10 ft 149.2 uS 23.2 ºC 0.1 ppt 3.75 mg/L
15 ft 148.5 uS 23.1 ºC 0.1 ppt 3.82 mg/L
20 ft 147.9 uS 23.1 ºC 0.1 ppt 3.85 mg/L
25 ft ND uS ND ºC ND ppt ND mg/L
30 ft ND uS ND ºC ND ppt ND mg/L
35 ft ND uS ND ºC ND ppt ND mg/L
40 ft ND uS ND ºC ND ppt ND mg/L
45 ft ND uS ND ºC ND ppt ND mg/L
280

Appendix B. (continued)
Physical Measurements Collected At Depth Site: 5 Way point: 017 Date: 9/23/2006 Latitude: 34º 21.312 N Longitude: 78º 06.122 W
Depth Conductivity Temp Salinity D.O. Surface 259.2 uS 24.6 ºC 0.1 ppt 4.5 mg/L
5 ft 258.9 uS 24.5 ºC 0.1 ppt 4.42 mg/L
10 ft 258.6 uS 24.4 ºC 0.1 ppt 4.31 mg/L
15 ft 258.7 uS 24.4 ºC 0.1 ppt 4.4 mg/L
20 ft ND uS ND ºC ND ppt ND mg/L
25 ft ND uS ND ºC ND ppt ND mg/L
30 ft ND uS ND ºC ND ppt ND mg/L
35 ft ND uS ND ºC ND ppt ND mg/L
40 ft ND uS ND ºC ND ppt ND mg/L
45 ft ND uS ND ºC ND ppt ND mg/L
281

Appendix B. (continued)
Physical Measurements Collected At Depth Site: 6 Way point: 018 Date: 9/23/2006 Latitude: 34º 21.963 N Longitude: 78º 08.109 W
Depth Conductivity Temp Salinity D.O. Surface 197.7 uS 24.6 ºC 0.1 ppt 4.55 mg/L
5 ft 198.1 uS 24.4 ºC 0.1 ppt 4.64 mg/L
10 ft 202 uS 24.3 ºC 0.1 ppt 4.37 mg/L
15 ft 203.9 uS 24.3 ºC 0.1 ppt 4.35 mg/L
20 ft 201.9 uS 24.2 ºC 0.1 ppt 4.73 mg/L
25 ft ND uS ND ºC ND ppt ND mg/L
30 ft ND uS ND ºC ND ppt ND mg/L
35 ft ND uS ND ºC ND ppt ND mg/L
40 ft ND uS ND ºC ND ppt ND mg/L
45 ft ND uS ND ºC ND ppt ND mg/L
282

Appendix B. (continued)
Physical Measurements Collected At Depth Site: 7 Way point: 019 Date: 9/23/2006 Latitude: 34º 21.440 N Longitude: 78º 09.949 W
Depth Conductivity Temp Salinity D.O. Surface 252.8 uS 24.9 ºC 0.1 ppt 4.74 mg/L
5 ft 255.1 uS 24.6 ºC 0.1 ppt 4.78 mg/L
10 ft 257.5 uS 24.5 ºC 0.1 ppt 4.74 mg/L
15 ft 255.7 uS 24.4 ºC 0.1 ppt 4.8 mg/L
20 ft 247.8 uS 24.4 ºC 0.1 ppt 4.81 mg/L
25 ft 251 uS 24.4 ºC 0.1 ppt 4.56 mg/L
30 ft ND uS ND ºC ND ppt ND mg/L
35 ft ND uS ND ºC ND ppt ND mg/L
40 ft ND uS ND ºC ND ppt ND mg/L
45 ft ND uS ND ºC ND ppt ND mg/L
283

Appendix B. (continued)
Physical Measurements Collected At Depth Site: 8 Way point: 020 Date: 9/23/2006 Latitude: 34º 21.413 N Longitude: 78º 12.560 W
Depth Conductivity Temp Salinity D.O. Surface 165.4 uS 25.1 ºC 0.1 ppt 5.16 mg/L
5 ft 170 uS 24.7 ºC 0.1 ppt 4.91 mg/L
10 ft 173 uS 24.6 ºC 0.1 ppt 4.94 mg/L
15 ft 180.5 uS 24.5 ºC 0.1 ppt 4.78 mg/L
20 ft 177.9 uS 24.4 ºC 0.1 ppt 4.85 mg/L
25 ft 171.8 uS 24.3 ºC 0.1 ppt 4.89 mg/L
30 ft ND uS ND ºC ND ppt ND mg/L
35 ft ND uS ND ºC ND ppt ND mg/L
40 ft ND uS ND ºC ND ppt ND mg/L
45 ft ND uS ND ºC ND ppt ND mg/L
284

Appendix B. (continued)
Physical Measurements Collected At Depth Site: 9 Way point: 021 Date: 9/23/2006 Latitude: 34º 22.470 N Longitude: 78º 13.560 W
Depth Conductivity Temp Salinity D.O. Surface 161 uS 25.1 ºC 0.1 ppt 5.01 mg/L
5 ft 160 uS 24.7 ºC 0.1 ppt 4.81 mg/L
10 ft 159.6 uS 24.6 ºC 0.1 ppt 4.91 mg/L
15 ft 159.6 uS 24.5 ºC 0.1 ppt 4.55 mg/L
20 ft ND uS ND ºC ND ppt ND mg/L
25 ft ND uS ND ºC ND ppt ND mg/L
30 ft ND uS ND ºC ND ppt ND mg/L
35 ft ND uS ND ºC ND ppt ND mg/L
40 ft ND uS ND ºC ND ppt ND mg/L
45 ft ND uS ND ºC ND ppt ND mg/L
285

Appendix B. (continued)
Physical Measurements Collected At Depth Site: 10 Way point: 022 Date: 9/23/2006 Latitude: 34º 23.075 N Longitude: 78º 14.705 W
Depth Conductivity Temp Salinity D.O. Surface 162.7 uS 25 ºC 0.1 ppt 5.08 mg/L
5 ft 165.6 uS 24.9 ºC 0.1 ppt 5 mg/L
10 ft 164.1 uS 24.5 ºC 0.1 ppt 4.72 mg/L
15 ft 164.2 uS 24.5 ºC 0.1 ppt 4.94 mg/L
20 ft 164.2 uS 24.5 ºC 0.1 ppt 4.99 mg/L
25 ft ND uS ND ºC ND ppt ND mg/L
30 ft ND uS ND ºC ND ppt ND mg/L
35 ft ND uS ND ºC ND ppt ND mg/L
40 ft ND uS ND ºC ND ppt ND mg/L
45 ft ND uS ND ºC ND ppt ND mg/L
286

Appendix B. (continued)
Physical Measurements Collected At Depth Site: 11 Way point: 023 Date: 9/23/2006 Latitude: 34º 23.824 N Longitude: 78º 16.050 W
Depth Conductivity Temp Salinity D.O. Surface 176.4 uS 25.7 ºC 0.1 ppt 5.03 mg/L
5 ft 173 uS 24.8 ºC 0.1 ppt 5.12 mg/L
10 ft 173.1 uS 24.7 ºC 0.1 ppt 5.22 mg/L
15 ft 173.1 uS 24.6 ºC 0.1 ppt 5.17 mg/L
20 ft 173.1 uS 24.6 ºC 0.1 ppt 5.24 mg/L
25 ft ND uS ND ºC ND ppt ND mg/L
30 ft ND uS ND ºC ND ppt ND mg/L
35 ft ND uS ND ºC ND ppt ND mg/L
40 ft ND uS ND ºC ND ppt ND mg/L
45 ft ND uS ND ºC ND ppt ND mg/L
287

Appendix B. (continued)
Physical Measurements Collected At Depth Site: 12 Way point: 024 Date: 9/23/2006 Latitude: 34º 24.218 N Longitude: 78º 17.528 W
Depth Conductivity Temp Salinity D.O. Surface 179.6 uS 24.8 ºC 0.1 ppt 5.14 mg/L
5 ft 179.4 uS 24.7 ºC 0.1 ppt 5.02 mg/L
10 ft 179.5 uS 24.7 ºC 0.1 ppt 5.09 mg/L
15 ft 179.5 uS 24.7 ºC 0.1 ppt 5.16 mg/L
20 ft ND uS ND ºC ND ppt ND mg/L
25 ft ND uS ND ºC ND ppt ND mg/L
30 ft ND uS ND ºC ND ppt ND mg/L
35 ft ND uS ND ºC ND ppt ND mg/L
40 ft ND uS ND ºC ND ppt ND mg/L
45 ft ND uS ND ºC ND ppt ND mg/L
288

Appendix B. (continued)
Physical Measurements Collected At Depth
Site: 1 Way point: Date: 9/23/2006 013 Latitude: 34º 16.837 N Longitude: 78º 00.263 W
Depth Conductivity Temp Salinity D.O. Surface 130.5 uS 23.4 ºC 0.1 ppt 3.26 mg/L
5 ft 130.2 uS 23.4 ºC 0.1 ppt 3.44 mg/L
10 ft 130.8 uS 23.3 ºC 0.1 ppt 3.31 mg/L
15 ft 130.5 uS 23.4 ºC 0.1 ppt 3.33 mg/L
20 ft 130.6 uS 23.4 ºC 0.1 ppt 3.39 mg/L
25 ft 130.2 uS 23.4 ºC 0.1 ppt 3.18 mg/L
30 ft 130.1 uS 23.4 ºC 0.1 ppt 3.39 mg/L
35 ft 130.1 uS 23.4 ºC 0.1 ppt 3.44 mg/L
40 ft 130.3 uS 23.4 ºC 0.1 ppt 3.25 mg/L
45 ft 130.6 uS 23.4 ºC 0.1 ppt 3.23 mg/L
289

Appendix B. (continued)
Physical Measurements Collected At Depth
Site: 2 Way point: Date: 9/23/2006 014 Latitude: 34º 19.396 N Longitude: 78º 00.549 W
Depth Conductivity Temp Salinity D.O. Surface 137.1 uS 23.3 ºC 0.1 ppt 3.59 mg/L
5 ft 137.1 uS 23.2 ºC 0.1 ppt 3.35 mg/L
10 ft 137 uS 23.2 ºC 0.1 ppt 3.51 mg/L
15 ft 137.2 uS 23.2 ºC 0.1 ppt 3.42 mg/L
20 ft 137.4 uS 23.2 ºC 0.1 ppt 3.37 mg/L
25 ft 137 uS 23.2 ºC 0.1 ppt 3.49 mg/L
30 ft 137.1 uS 23.2 ºC 0.1 ppt 3.43 mg/L
35 ft ND uS ND ºC ND ppt ND mg/L
40 ft ND uS ND ºC ND ppt ND mg/L
45 ft ND uS ND ºC ND ppt ND mg/L
290

Appendix B. (continued)
Physical Measurements Collected At Depth
Site: Way point: Date: 9/23/2006 3 015 Latitude: 34º 20.187 N Longitude: 78º 02.900 W
Depth Conductivity Temp Salinity D.O. Surface 138.3 uS 23.3 ºC 0.1 ppt 3.64 mg/L
5 ft 124.4 uS 23.1 ºC 0.1 ppt 3.46 mg/L
10 ft 129.2 uS 23 ºC 0.1 ppt 3.24 mg/L
15 ft 129.2 uS 22.9 ºC 0.1 ppt 3.52 mg/L
20 ft 129.3 uS 22.9 ºC 0.1 ppt 3.53 mg/L
25 ft ND uS ND ºC ND ppt ND mg/L
30 ft ND uS ND ºC ND ppt ND mg/L
35 ft ND uS ND ºC ND ppt ND mg/L
40 ft ND uS ND ºC ND ppt ND mg/L
45 ft ND uS ND ºC ND ppt ND mg/L
291
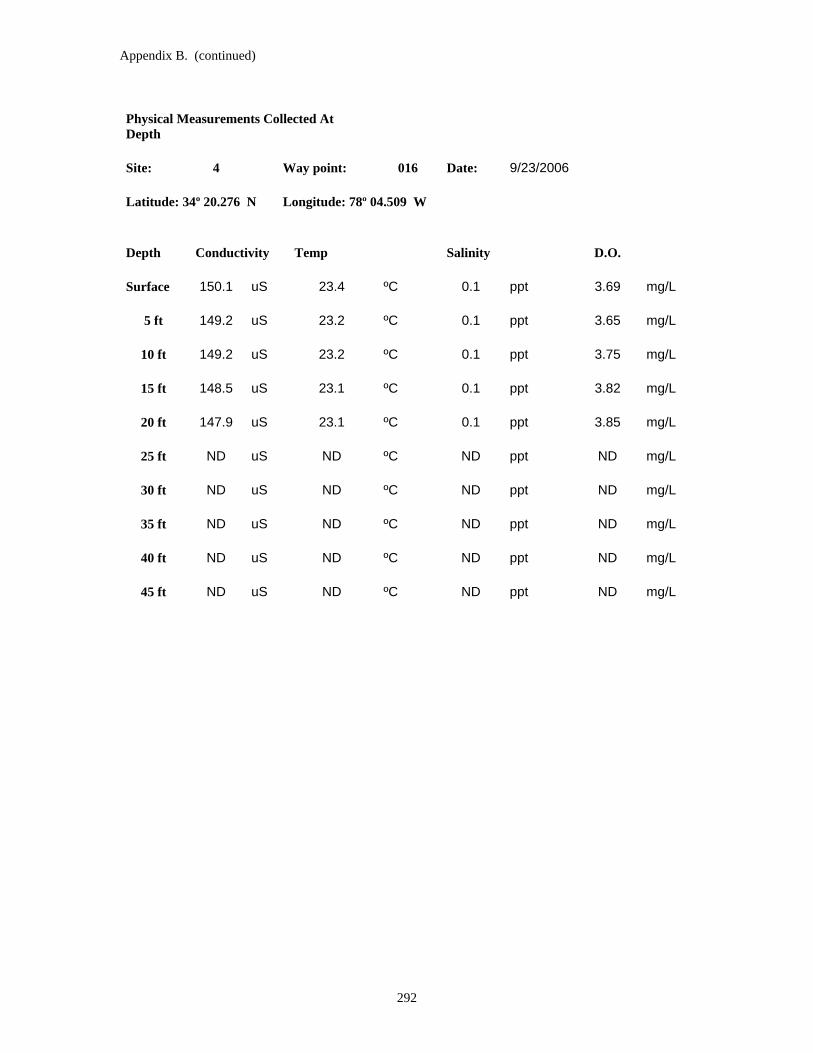
Appendix B. (continued)
Physical Measurements Collected At Depth Site: 4 Way point: 016 Date: 9/23/2006 Latitude: 34º 20.276 N Longitude: 78º 04.509 W Depth Conductivity Temp Salinity D.O. Surface 150.1 uS 23.4 ºC 0.1 ppt 3.69 mg/L
5 ft 149.2 uS 23.2 ºC 0.1 ppt 3.65 mg/L
10 ft 149.2 uS 23.2 ºC 0.1 ppt 3.75 mg/L
15 ft 148.5 uS 23.1 ºC 0.1 ppt 3.82 mg/L
20 ft 147.9 uS 23.1 ºC 0.1 ppt 3.85 mg/L
25 ft ND uS ND ºC ND ppt ND mg/L
30 ft ND uS ND ºC ND ppt ND mg/L
35 ft ND uS ND ºC ND ppt ND mg/L
40 ft ND uS ND ºC ND ppt ND mg/L
45 ft ND uS ND ºC ND ppt ND mg/L
292

Appendix B. (continued)
Physical Measurements Collected At Depth Site: 5 Way point: 017 Date: 9/23/2006 Latitude: 34º 21.312 N Longitude: 78º 06.122 W
Depth Conductivity Temp Salinity D.O. Surface 259.2 uS 24.6 ºC 0.1 ppt 4.5 mg/L
5 ft 258.9 uS 24.5 ºC 0.1 ppt 4.42 mg/L
10 ft 258.6 uS 24.4 ºC 0.1 ppt 4.31 mg/L
15 ft 258.7 uS 24.4 ºC 0.1 ppt 4.4 mg/L
20 ft ND uS ND ºC ND ppt ND mg/L
25 ft ND uS ND ºC ND ppt ND mg/L
30 ft ND uS ND ºC ND ppt ND mg/L
35 ft ND uS ND ºC ND ppt ND mg/L
40 ft ND uS ND ºC ND ppt ND mg/L
45 ft ND uS ND ºC ND ppt ND mg/L
293

Appendix B. (continued)
Physical Measurements Collected At Depth Site: 6 Way point: 018 Date: 9/23/2006 Latitude: 34º 21.963 N Longitude: 78º 08.109 W
Depth Conductivity Temp Salinity D.O. Surface 197.7 uS 24.6 ºC 0.1 ppt 4.55 mg/L
5 ft 198.1 uS 24.4 ºC 0.1 ppt 4.64 mg/L
10 ft 202 uS 24.3 ºC 0.1 ppt 4.37 mg/L
15 ft 203.9 uS 24.3 ºC 0.1 ppt 4.35 mg/L
20 ft 201.9 uS 24.2 ºC 0.1 ppt 4.73 mg/L
25 ft ND uS ND ºC ND ppt ND mg/L
30 ft ND uS ND ºC ND ppt ND mg/L
35 ft ND uS ND ºC ND ppt ND mg/L
40 ft ND uS ND ºC ND ppt ND mg/L
45 ft ND uS ND ºC ND ppt ND mg/L
294

Appendix B. (continued)
Physical Measurements Collected At Depth Site: 7 Way point: 019 Date: 9/23/2006 Latitude: 34º 21.440 N Longitude: 78º 09.949 W
Depth Conductivity Temp Salinity D.O. Surface 252.8 uS 24.9 ºC 0.1 ppt 4.74 mg/L
5 ft 255.1 uS 24.6 ºC 0.1 ppt 4.78 mg/L
10 ft 257.5 uS 24.5 ºC 0.1 ppt 4.74 mg/L
15 ft 255.7 uS 24.4 ºC 0.1 ppt 4.8 mg/L
20 ft 247.8 uS 24.4 ºC 0.1 ppt 4.81 mg/L
25 ft 251 uS 24.4 ºC 0.1 ppt 4.56 mg/L
30 ft ND uS ND ºC ND ppt ND mg/L
35 ft ND uS ND ºC ND ppt ND mg/L
40 ft ND uS ND ºC ND ppt ND mg/L
45 ft ND uS ND ºC ND ppt ND mg/L
295

Appendix B. (continued)
Physical Measurements Collected At Depth Site: 8 Way point: 020 Date: 9/23/2006 Latitude: 34º 21.413 N Longitude: 78º 12.560 W
Depth Conductivity Temp Salinity D.O. Surface 165.4 uS 25.1 ºC 0.1 ppt 5.16 mg/L
5 ft 170 uS 24.7 ºC 0.1 ppt 4.91 mg/L
10 ft 173 uS 24.6 ºC 0.1 ppt 4.94 mg/L
15 ft 180.5 uS 24.5 ºC 0.1 ppt 4.78 mg/L
20 ft 177.9 uS 24.4 ºC 0.1 ppt 4.85 mg/L
25 ft 171.8 uS 24.3 ºC 0.1 ppt 4.89 mg/L
30 ft ND uS ND ºC ND ppt ND mg/L
35 ft ND uS ND ºC ND ppt ND mg/L
40 ft ND uS ND ºC ND ppt ND mg/L
45 ft ND uS ND ºC ND ppt ND mg/L
296

Appendix B. (continued)
Physical Measurements Collected At Depth Site: 9 Way point: 021 Date: 9/23/2006 Latitude: 34º 22.470 N Longitude: 78º 13.560 W
Depth Conductivity Temp Salinity D.O. Surface 161 uS 25.1 ºC 0.1 ppt 5.01 mg/L
5 ft 160 uS 24.7 ºC 0.1 ppt 4.81 mg/L
10 ft 159.6 uS 24.6 ºC 0.1 ppt 4.91 mg/L
15 ft 159.6 uS 24.5 ºC 0.1 ppt 4.55 mg/L
20 ft ND uS ND ºC ND ppt ND mg/L
25 ft ND uS ND ºC ND ppt ND mg/L
30 ft ND uS ND ºC ND ppt ND mg/L
35 ft ND uS ND ºC ND ppt ND mg/L
40 ft ND uS ND ºC ND ppt ND mg/L
45 ft ND uS ND ºC ND ppt ND mg/L
297

Appendix B. (continued)
Physical Measurements Collected At Depth Site: 10 Way point: 022 Date: 9/23/2006 Latitude: 34º 23.075 N Longitude: 78º 14.705 W
Depth Conductivity Temp Salinity D.O. Surface 162.7 uS 25 ºC 0.1 ppt 5.08 mg/L
5 ft 165.6 uS 24.9 ºC 0.1 ppt 5 mg/L
10 ft 164.1 uS 24.5 ºC 0.1 ppt 4.72 mg/L
15 ft 164.2 uS 24.5 ºC 0.1 ppt 4.94 mg/L
20 ft 164.2 uS 24.5 ºC 0.1 ppt 4.99 mg/L
25 ft ND uS ND ºC ND ppt ND mg/L
30 ft ND uS ND ºC ND ppt ND mg/L
35 ft ND uS ND ºC ND ppt ND mg/L
40 ft ND uS ND ºC ND ppt ND mg/L
45 ft ND uS ND ºC ND ppt ND mg/L
298

Appendix B. (continued)
Physical Measurements Collected At Depth Site: 11 Way point: 023 Date: 9/23/2006 Latitude: 34º 23.824 N Longitude: 78º 16.050 W
Depth Conductivity Temp Salinity D.O. Surface 176.4 uS 25.7 ºC 0.1 ppt 5.03 mg/L
5 ft 173 uS 24.8 ºC 0.1 ppt 5.12 mg/L
10 ft 173.1 uS 24.7 ºC 0.1 ppt 5.22 mg/L
15 ft 173.1 uS 24.6 ºC 0.1 ppt 5.17 mg/L
20 ft 173.1 uS 24.6 ºC 0.1 ppt 5.24 mg/L
25 ft ND uS ND ºC ND ppt ND mg/L
30 ft ND uS ND ºC ND ppt ND mg/L
35 ft ND uS ND ºC ND ppt ND mg/L
40 ft ND uS ND ºC ND ppt ND mg/L
45 ft ND uS ND ºC ND ppt ND mg/L
299
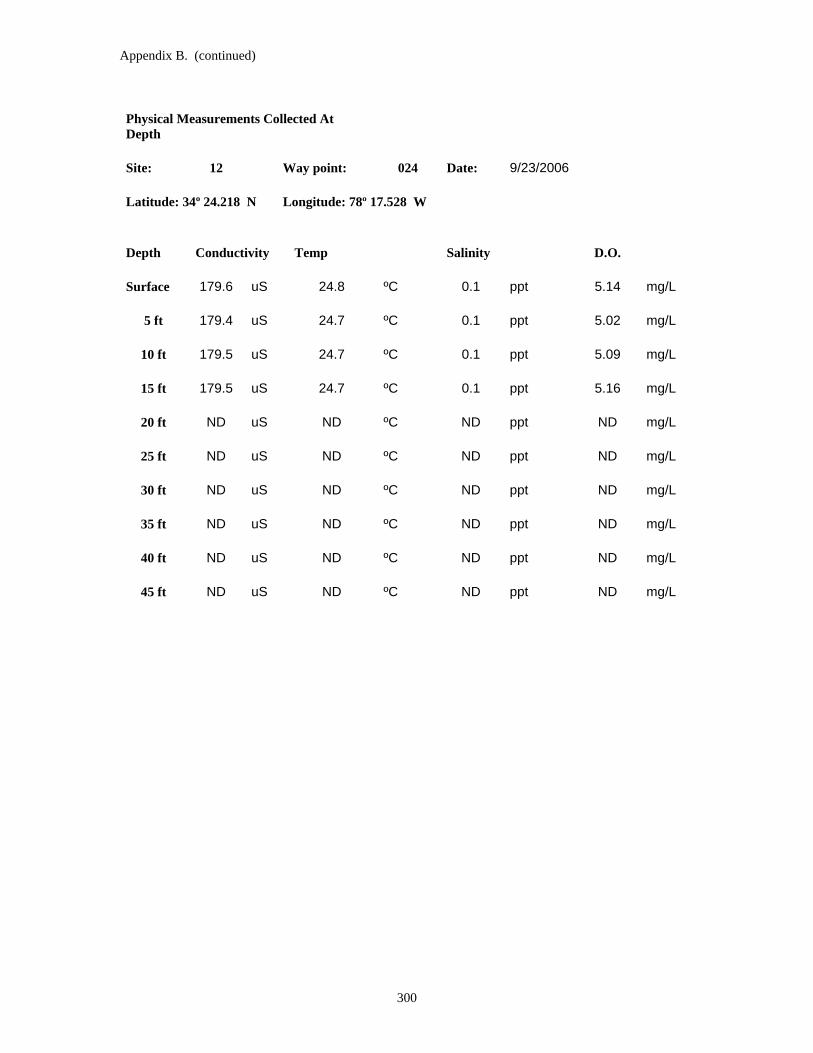
Appendix B. (continued)
Physical Measurements Collected At Depth Site: 12 Way point: 024 Date: 9/23/2006 Latitude: 34º 24.218 N Longitude: 78º 17.528 W
Depth Conductivity Temp Salinity D.O. Surface 179.6 uS 24.8 ºC 0.1 ppt 5.14 mg/L
5 ft 179.4 uS 24.7 ºC 0.1 ppt 5.02 mg/L
10 ft 179.5 uS 24.7 ºC 0.1 ppt 5.09 mg/L
15 ft 179.5 uS 24.7 ºC 0.1 ppt 5.16 mg/L
20 ft ND uS ND ºC ND ppt ND mg/L
25 ft ND uS ND ºC ND ppt ND mg/L
30 ft ND uS ND ºC ND ppt ND mg/L
35 ft ND uS ND ºC ND ppt ND mg/L
40 ft ND uS ND ºC ND ppt ND mg/L
45 ft ND uS ND ºC ND ppt ND mg/L
300
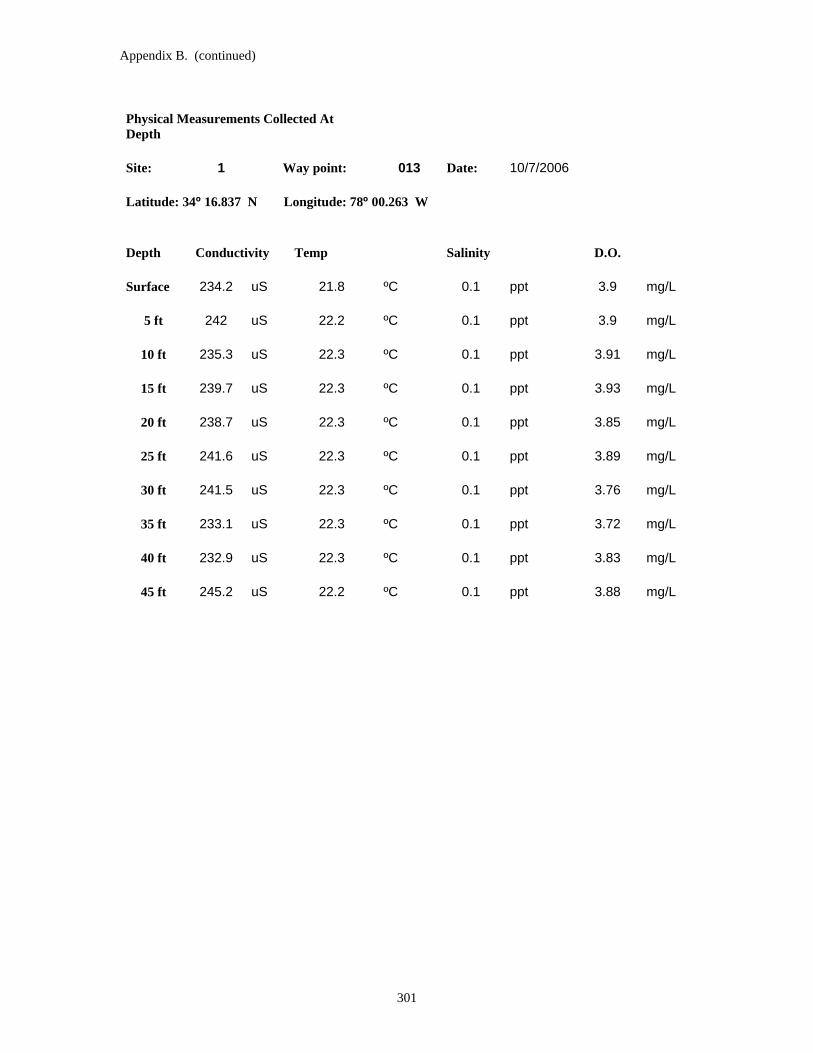
Appendix B. (continued)
Physical Measurements Collected At Depth Site: Way point: Date: 10/7/2006 1 013 Latitude: 34º 16.837 N Longitude: 78º 00.263 W
Depth Conductivity Temp Salinity D.O. Surface 234.2 uS 21.8 ºC 0.1 ppt 3.9 mg/L
5 ft 242 uS 22.2 ºC 0.1 ppt 3.9 mg/L
10 ft 235.3 uS 22.3 ºC 0.1 ppt 3.91 mg/L
15 ft 239.7 uS 22.3 ºC 0.1 ppt 3.93 mg/L
20 ft 238.7 uS 22.3 ºC 0.1 ppt 3.85 mg/L
25 ft 241.6 uS 22.3 ºC 0.1 ppt 3.89 mg/L
30 ft 241.5 uS 22.3 ºC 0.1 ppt 3.76 mg/L
35 ft 233.1 uS 22.3 ºC 0.1 ppt 3.72 mg/L
40 ft 232.9 uS 22.3 ºC 0.1 ppt 3.83 mg/L
45 ft 245.2 uS 22.2 ºC 0.1 ppt 3.88 mg/L
301

Appendix B. (continued)
Physical Measurements Collected At Depth
Site: Way point: Date: 10/7/2006 1 014 Latitude: 34º 19.396 N Longitude: 78º 00.549 W
Depth Conductivity Temp Salinity D.O. Surface 195.3 uS 21.9 ºC 0.1 ppt 4.04 mg/L
5 ft 195.2 uS 22 ºC 0.1 ppt 4.01 mg/L
10 ft 195.2 uS 22.1 ºC 0.1 ppt 3.93 mg/L
15 ft 195.3 uS 22.2 ºC 0.1 ppt 3.95 mg/L
20 ft 195.3 uS 22.2 ºC 0.1 ppt 3.98 mg/L
25 ft 195.3 uS 22.2 ºC 0.1 ppt 3.95 mg/L
30 ft 195.3 uS 22.3 ºC 0.1 ppt 3.82 mg/L
35 ft ND uS ND ºC ND ppt ND mg/L
40 ft ND uS ND ºC ND ppt ND mg/L
45 ft ND uS ND ºC ND ppt ND mg/L
302

Appendix B. (continued)
Physical Measurements Collected At Depth
Site: Way point: Date: 10/7/2006 3 015 Latitude: 34º 20.187 N Longitude: 78º 02.900 W
Depth Conductivity Temp Salinity D.O. Surface 200 uS 21.9 ºC 0.1 ppt 4.16 mg/L
5 ft 188.2 uS 22 ºC 0.1 ppt 4.15 mg/L
10 ft 188.1 uS 22 ºC 0.1 ppt 4.16 mg/L
15 ft 188.1 uS 22.1 ºC 0.1 ppt 4.15 mg/L
20 ft 188.2 uS 22.1 ºC 0.1 ppt 4.14 mg/L
25 ft 188.2 uS 22.1 ºC 0.1 ppt 4.11 mg/L
30 ft ND uS ND ºC ND ppt ND mg/L
35 ft ND uS ND ºC ND ppt ND mg/L
40 ft ND uS ND ºC ND ppt ND mg/L
45 ft ND uS ND ºC ND ppt ND mg/L
303

Appendix B. (continued)
Physical Measurements Collected At Depth Site: 4 Way point: 016 Date: 10/7/2006 Latitude: 34º 20.276 N Longitude: 78º 04.509 W Depth Conductivity Temp Salinity D.O. Surface 193.1 uS 21.8 ºC 0.1 ppt 4.3 mg/L
5 ft 194.1 uS 21.9 ºC 0.1 ppt 4.28 mg/L
10 ft 197.5 uS 22 ºC 0.1 ppt 4.27 mg/L
15 ft 193.2 uS 22 ºC 0.1 ppt 4.22 mg/L
20 ft 192.6 uS 22 ºC 0.1 ppt 4.13 mg/L
25 ft 192.8 uS 22 ºC 0.1 ppt 4.15 mg/L
30 ft ND uS ND ºC ND ppt ND mg/L
35 ft ND uS ND ºC ND ppt ND mg/L
40 ft ND uS ND ºC ND ppt ND mg/L
45 ft ND uS ND ºC ND ppt ND mg/L
304

Appendix B. (continued)
Physical Measurements Collected At Depth Site: 5 Way point: 017 Date: 10/7/2006 Latitude: 34º 21.312 N Longitude: 78º 06.122 W
Depth Conductivity Temp Salinity D.O. Surface 268.5 uS 22.5 ºC 0.1 ppt 4.71 mg/L
5 ft 268.4 uS 22.7 ºC 0.1 ppt 4.64 mg/L
10 ft 268.3 uS 22.7 ºC 0.1 ppt 4.68 mg/L
15 ft 268.4 uS 22.7 ºC 0.1 ppt 4.51 mg/L
20 ft 268.4 uS 22.8 ºC 0.1 ppt 4.5 mg/L
25 ft ND uS ND ºC ND ppt ND mg/L
30 ft ND uS ND ºC ND ppt ND mg/L
35 ft ND uS ND ºC ND ppt ND mg/L
40 ft ND uS ND ºC ND ppt ND mg/L
45 ft ND uS ND ºC ND ppt ND mg/L
305

Appendix B. (continued)
Physical Measurements Collected At Depth Site: 6 Way point: 018 Date: 10/7/2006 Latitude: 34º 21.963 N Longitude: 78º 08.109 W
Depth Conductivity Temp Salinity D.O. Surface 292 uS 22.7 ºC 0.1 ppt 4.53 mg/L
5 ft 292 uS 22.7 ºC 0.1 ppt 4.7 mg/L
10 ft 292.2 uS 22.7 ºC 0.1 ppt 4.76 mg/L
15 ft 292 uS 22.8 ºC 0.1 ppt 4.83 mg/L
20 ft 292 uS 22.8 ºC 0.1 ppt 4.75 mg/L
25 ft ND uS ND ºC ND ppt ND mg/L
30 ft ND uS ND ºC ND ppt ND mg/L
35 ft ND uS ND ºC ND ppt ND mg/L
40 ft ND uS ND ºC ND ppt ND mg/L
45 ft ND uS ND ºC ND ppt ND mg/L
306
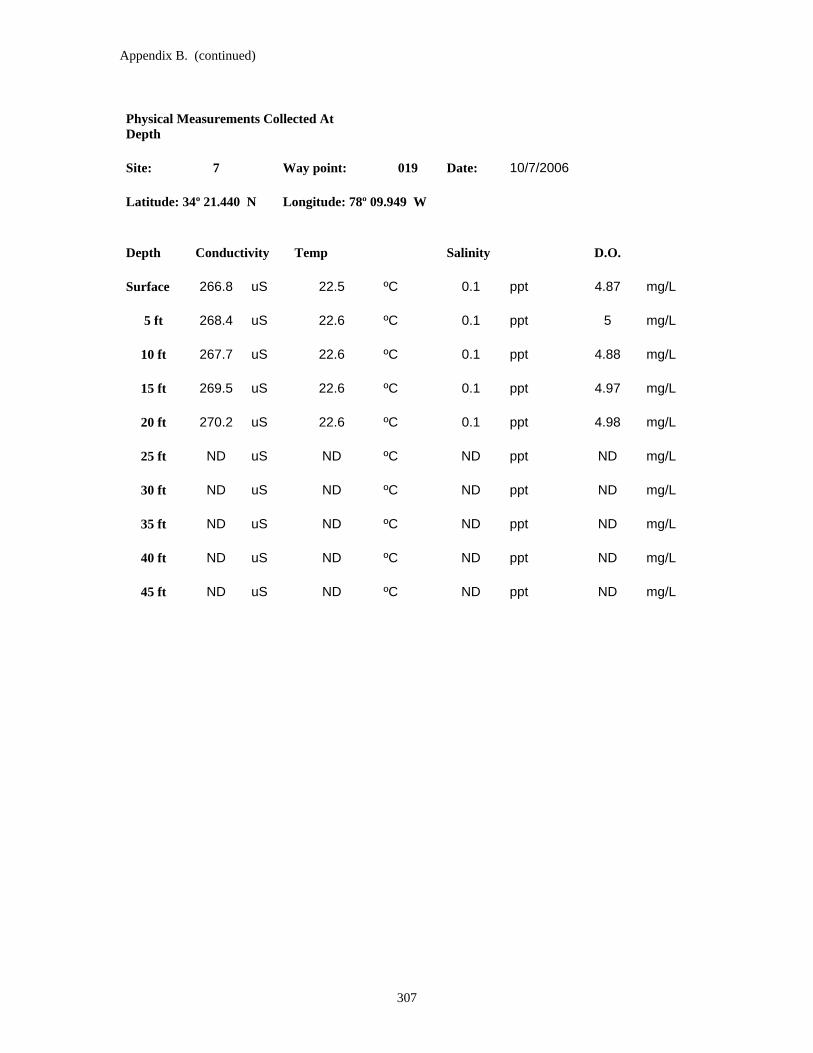
Appendix B. (continued)
Physical Measurements Collected At Depth Site: 7 Way point: 019 Date: 10/7/2006 Latitude: 34º 21.440 N Longitude: 78º 09.949 W
Depth Conductivity Temp Salinity D.O. Surface 266.8 uS 22.5 ºC 0.1 ppt 4.87 mg/L
5 ft 268.4 uS 22.6 ºC 0.1 ppt 5 mg/L
10 ft 267.7 uS 22.6 ºC 0.1 ppt 4.88 mg/L
15 ft 269.5 uS 22.6 ºC 0.1 ppt 4.97 mg/L
20 ft 270.2 uS 22.6 ºC 0.1 ppt 4.98 mg/L
25 ft ND uS ND ºC ND ppt ND mg/L
30 ft ND uS ND ºC ND ppt ND mg/L
35 ft ND uS ND ºC ND ppt ND mg/L
40 ft ND uS ND ºC ND ppt ND mg/L
45 ft ND uS ND ºC ND ppt ND mg/L
307

Appendix B. (continued)
Physical Measurements Collected At Depth Site: 8 Way point: 020 Date: 10/7/2006 Latitude: 34º 21.413 N Longitude: 78º 12.560 W
Depth Conductivity Temp Salinity D.O. Surface 96.4 uS 22.2 ºC 0.1 ppt 5.01 mg/L
5 ft 166.6 uS 22.3 ºC 0.1 ppt 5.2 mg/L
10 ft 167.9 uS 22.3 ºC 0.1 ppt 5.21 mg/L
15 ft 168.1 uS 22.3 ºC 0.1 ppt 4.55 mg/L
20 ft 168.5 uS 22.4 ºC 0.1 ppt 4.64 mg/L
25 ft ND uS ND ºC ND ppt ND mg/L
30 ft ND uS ND ºC ND ppt ND mg/L
35 ft ND uS ND ºC ND ppt ND mg/L
40 ft ND uS ND ºC ND ppt ND mg/L
45 ft ND uS ND ºC ND ppt ND mg/L
308

Appendix B. (continued)
Physical Measurements Collected At Depth Site: 9 Way point: 021 Date: 10/7/2006 Latitude: 34º 22.470 N Longitude: 78º 13.560 W
Depth Conductivity Temp Salinity D.O. Surface 68.7 uS 22 ºC 0.1 ppt 5.31 mg/L
5 ft 135.6 uS 22.2 ºC 0.1 ppt 5.05 mg/L
10 ft 135.6 uS 22.2 ºC 0.1 ppt 5.18 mg/L
15 ft 135.6 uS 22.2 ºC 0.1 ppt 5.4 mg/L
20 ft ND uS ND ºC ND ppt ND mg/L
25 ft ND uS ND ºC ND ppt ND mg/L
30 ft ND uS ND ºC ND ppt ND mg/L
35 ft ND uS ND ºC ND ppt ND mg/L
40 ft ND uS ND ºC ND ppt ND mg/L
45 ft ND uS ND ºC ND ppt ND mg/L
309

Appendix B. (continued)
Physical Measurements Collected At Depth Site: 10 Way point: 022 Date: 10/7/2006 Latitude: 34º 23.075 N Longitude: 78º 14.705 W
Depth Conductivity Temp Salinity D.O. Surface 136.2 uS 22.2 ºC 0.1 ppt 5.11 mg/L
5 ft 136.3 uS 22.3 ºC 0.1 ppt 5.58 mg/L
10 ft 136.4 uS 22.4 ºC 0.1 ppt 4.97 mg/L
15 ft 136.3 uS 22.4 ºC 0.1 ppt 4.89 mg/L
20 ft 136.4 uS 22.4 ºC 0.1 ppt 5.34 mg/L
25 ft ND uS ND ºC ND ppt ND mg/L
30 ft ND uS ND ºC ND ppt ND mg/L
35 ft ND uS ND ºC ND ppt ND mg/L
40 ft ND uS ND ºC ND ppt ND mg/L
45 ft ND uS ND ºC ND ppt ND mg/L
310

Appendix B. (continued)
Physical Measurements Collected At Depth Site: 11 Way point: 023 Date: 10/7/2006 Latitude: 34º 23.824 N Longitude: 78º 16.050 W
Depth Conductivity Temp Salinity D.O. Surface 136.9 uS 22.1 ºC 0.1 ppt 5.4 mg/L
5 ft 137 uS 22.1 ºC 0.1 ppt 5.43 mg/L
10 ft 137.1 uS 22.2 ºC 0.1 ppt 5.64 mg/L
15 ft 137.1 uS 22.2 ºC 0.1 ppt 5.55 mg/L
20 ft 137.1 uS 22.2 ºC 0.1 ppt 5.51 mg/L
25 ft 137.3 uS 22.2 ºC 0.1 ppt 5.61 mg/L
30 ft ND uS ND ºC ND ppt ND mg/L
35 ft ND uS ND ºC ND ppt ND mg/L
40 ft ND uS ND ºC ND ppt ND mg/L
45 ft ND uS ND ºC ND ppt ND mg/L
311

Appendix B. (continued)
Physical Measurements Collected At Depth Site: 12 Way point: 024 Date: 10/7/2006 Latitude: 34º 24.218 N Longitude: 78º 17.528 W
Depth Conductivity Temp Salinity D.O. Surface 136.7 uS 22.2 ºC 0.1 ppt 5.63 mg/L
5 ft 136.7 uS 22.3 ºC 0.1 ppt 5.88 mg/L
10 ft 136.8 uS 22.3 ºC 0.1 ppt 5.9 mg/L
15 ft 136.8 uS 22.3 ºC 0.1 ppt 5.6 mg/L
20 ft ND uS ND ºC ND ppt ND mg/L
25 ft ND uS ND ºC ND ppt ND mg/L
30 ft ND uS ND ºC ND ppt ND mg/L
35 ft ND uS ND ºC ND ppt ND mg/L
40 ft ND uS ND ºC ND ppt ND mg/L
45 ft ND uS ND ºC ND ppt ND mg/L
312

Appendix B. (continued)
Physical Measurements Collected At Depth
Site: Way point: Date: 10/21/2006 1 013 Latitude: 34º 16.837 N Longitude: 78º 00.263 W
Depth Conductivity Temp Salinity D.O. 224.9 uS 19.7 ºC 0.1 ppt 4.67 mg/L Surface
225.1 uS 19.9 ºC 0.1 ppt 4.62 mg/L 5 ft
225.3 uS 19.9 ºC 0.1 ppt 4.6 mg/L 10 ft
225.4 uS 20 ºC 0.1 ppt 4.55 mg/L 15 ft
225.4 uS 20 ºC 0.1 ppt 4.52 mg/L 20 ft
225.4 uS 20 ºC 0.1 ppt 4.66 mg/L 25 ft
224.9 uS 20 ºC 0.1 ppt 4.57 mg/L 30 ft
225.2 uS 20 ºC 0.1 ppt 4.61 mg/L 35 ft
224.5 uS 20 ºC 0.1 ppt 4.6 mg/L 40 ft
224.1 uS 20 ºC 0.1 ppt 4.17 mg/L 45 ft
313

Appendix B. (continued)
Physical Measurements Collected At Depth
Site: Way point: Date: 10/21/2006 2 014 Latitude: 34º 19.396 N Longitude: 78º 00.549 W
Depth Conductivity Temp Salinity D.O.
229 uS 20.2 ºC 0.1 ppt 4.47 mg/L Surface 228.9 uS 20.2 ºC 0.1 ppt 4.72 mg/L 5 ft
228.4 uS 20.2 ºC 0.1 ppt 4.78 mg/L 10 ft
228.7 uS 20.2 ºC 0.1 ppt 4.75 mg/L 15 ft
228.1 uS 20.2 ºC 0.1 ppt 4.71 mg/L 20 ft
227.6 uS 20.2 ºC 0.1 ppt 4.77 mg/L 25 ft
228.2 uS 20.2 ºC 0.1 ppt 4.62 mg/L 30 ft
ND uS ND ºC ND ppt ND mg/L 35 ft
ND uS ND ºC ND ppt ND mg/L 40 ft
ND uS ND ºC ND ppt ND mg/L 45 ft
314

Appendix B. (continued)
Physical Measurements Collected At Depth
Site: Way point: Date: 10/21/2006 3 015 Latitude: 34º 20.187 N Longitude: 78º 02.900 W
Depth Conductivity Temp Salinity D.O. 204.4 uS 20.1 ºC 0.1 ppt 4.78 mg/L Surface
204.3 uS 20.1 ºC 0.1 ppt 4.99 mg/L 5 ft
203.9 uS 20.1 ºC 0.1 ppt 4.87 mg/L 10 ft
203.7 uS 20.1 ºC 0.1 ppt 4.94 mg/L 15 ft
203.8 uS 20.1 ºC 0.1 ppt 5.03 mg/L 20 ft
ND uS ND ºC ND ppt ND mg/L 25 ft
ND uS ND ºC ND ppt ND mg/L 30 ft
ND uS ND ºC ND ppt ND mg/L 35 ft
ND uS ND ºC ND ppt ND mg/L 40 ft
ND uS ND ºC ND ppt ND mg/L 45 ft
315

Appendix B. (continued)
Physical Measurements Collected At Depth Site: 4 Way point: 016 Date: 10/21/2006 Latitude: 34º 20.276 N Longitude: 78º 04.509 W
Depth Conductivity Temp Salinity D.O. 206.8 uS 20.1 ºC 0.1 ppt 5.11 mg/L Surface
205.4 uS 20.1 ºC 0.1 ppt 5.26 mg/L 5 ft
205.4 uS 20.1 ºC 0.1 ppt 5.2 mg/L 10 ft
204.8 uS 20.1 ºC 0.1 ppt 5.25 mg/L 15 ft
204.9 uS 20.1 ºC 0.1 ppt 5.3 mg/L 20 ft
205.4 uS 20.1 ºC 0.1 ppt 5.1 mg/L 25 ft
ND uS ND ºC ND ppt ND mg/L 30 ft
ND uS ND ºC ND ppt ND mg/L 35 ft
ND uS ND ºC ND ppt ND mg/L 40 ft
ND uS ND ºC ND ppt ND mg/L 45 ft
316

Appendix B. (continued)
Physical Measurements Collected At Depth Site: 5 Way point: 017 Date: 10/21/2006 Latitude: 34º 21.312 N Longitude: 78º 06.122 W
Depth Conductivity Temp Salinity D.O. 170.5 uS 20 ºC 0.1 ppt 5.75 mg/L Surface
170.5 uS 20 ºC ND ppt 5.85 mg/L 5 ft
170.2 uS 20 ºC 0.1 ppt 5.87 mg/L 10 ft
169.4 uS 20 ºC 0.1 ppt 5.94 mg/L 15 ft
169 uS 20 ºC 0.1 ppt 5.84 mg/L 20 ft
ND uS ND ºC ND ppt ND mg/L 25 ft
ND uS ND ºC ND ppt ND mg/L 30 ft
ND uS ND ºC ND ppt ND mg/L 35 ft
ND uS ND ºC ND ppt ND mg/L 40 ft
ND uS ND ºC ND ppt ND mg/L 45 ft
317

Appendix B. (continued)
Physical Measurements Collected At Depth Site: 6 Way point: 018 Date: 10/21/2006 Latitude: 34º 21.963 N Longitude: 78º 08.109 W
Depth Conductivity Temp Salinity D.O. 217.9 uS 20.3 ºC 0.1 ppt 5.66 mg/L Surface
217 uS 20 ºC 0.1 ppt 5.83 mg/L 5 ft
217.5 uS 19.9 ºC 0.1 ppt 5.83 mg/L 10 ft
217.4 uS 19.9 ºC 0.1 ppt 5.88 mg/L 15 ft
217.4 uS 19.9 ºC 0.1 ppt 5.21 mg/L 20 ft
ND uS ND ºC ND ppt ND mg/L 25 ft
ND uS ND ºC ND ppt ND mg/L 30 ft
ND uS ND ºC ND ppt ND mg/L 35 ft
ND uS ND ºC ND ppt ND mg/L 40 ft
ND uS ND ºC ND ppt ND mg/L 45 ft
318

Appendix B. (continued)
Physical Measurements Collected At Depth Site: 7 Way point: 019 Date: 10/21/2006 Latitude: 34º 21.440 N Longitude: 78º 09.949 W
Depth Conductivity Temp Salinity D.O. 153.1 uS 20.2 ºC 0.1 ppt 5.93 mg/L Surface
149.8 uS 19.7 ºC 0.1 ppt 5.91 mg/L 5 ft
150 uS 19.7 ºC 0.1 ppt 5.61 mg/L 10 ft
150.1 uS 19.7 ºC 0.1 ppt 6 mg/L 15 ft
150.5 uS 19.7 ºC 0.1 ppt 6.06 mg/L 20 ft
ND uS ND ºC ND ppt ND mg/L 25 ft
ND uS ND ºC ND ppt ND mg/L 30 ft
ND uS ND ºC ND ppt ND mg/L 35 ft
ND uS ND ºC ND ppt ND mg/L 40 ft
ND uS ND ºC ND ppt ND mg/L 45 ft
319

Appendix B. (continued)
Physical Measurements Collected At Depth Site: 8 Way point: 020 Date: 10/21/2006 Latitude: 34º 21.413 N Longitude: 78º 12.560 W
Depth Conductivity Temp Salinity D.O. 134.9 uS 19.6 ºC 0.1 ppt 5.99 mg/L Surface
134.8 uS 19.5 ºC 0.1 ppt 6.25 mg/L 5 ft
134.7 uS 19.5 ºC 0.1 ppt 6.32 mg/L 10 ft
134.7 uS 19.5 ºC 0.1 ppt 6.33 mg/L 15 ft
134.8 uS 19.5 ºC 0.1 ppt 6.27 mg/L 20 ft
134.8 uS 19.5 ºC 0.1 ppt 6.43 mg/L 25 ft
ND uS ND ºC ND ppt ND mg/L 30 ft
ND uS ND ºC ND ppt ND mg/L 35 ft
ND uS ND ºC ND ppt ND mg/L 40 ft
ND uS ND ºC ND ppt ND mg/L 45 ft
320

Appendix B. (continued)
Physical Measurements Collected At Depth Site: 9 Way point: 021 Date: 10/21/2006 Latitude: 34º 22.470 N Longitude: 78º 13.560 W
Depth Conductivity Temp Salinity D.O. 136.1 uS 19.6 ºC 0.1 ppt 6.28 mg/L Surface
136.1 uS 19.6 ºC 0.1 ppt 6.18 mg/L 5 ft
136.1 uS 19.6 ºC 0.1 ppt 6.21 mg/L 10 ft
136.1 uS 19.1 ºC 0.1 ppt 6.35 mg/L 15 ft
ND uS ND ºC ND ppt ND mg/L 20 ft
ND uS ND ºC ND ppt ND mg/L 25 ft
ND uS ND ºC ND ppt ND mg/L 30 ft
ND uS ND ºC ND ppt ND mg/L 35 ft
ND uS ND ºC ND ppt ND mg/L 40 ft
ND uS ND ºC ND ppt ND mg/L 45 ft
321

Appendix B. (continued)
Physical Measurements Collected At Depth Site: 10 Way point: 022 Date: 10/21/2006 Latitude: 34º 23.075 N Longitude: 78º 14.705 W
Depth Conductivity Temp Salinity D.O. 136.9 uS 19.7 ºC 0.1 ppt 6.13 mg/L Surface
136.8 uS 19.6 ºC 0.1 ppt 6.37 mg/L 5 ft
136.8 uS 19.6 ºC 0.1 ppt 6.39 mg/L 10 ft
136.8 uS 19.6 ºC 0.1 ppt 6.47 mg/L 15 ft
136.8 uS 19.6 ºC 0.1 ppt 6.42 mg/L 20 ft
ND uS ND ºC ND ppt ND mg/L 25 ft
ND uS ND ºC ND ppt ND mg/L 30 ft
ND uS ND ºC ND ppt ND mg/L 35 ft
ND uS ND ºC ND ppt ND mg/L 40 ft
ND uS ND ºC ND ppt ND mg/L 45 ft
322

Appendix B. (continued)
Physical Measurements Collected At Depth Site: 11 Way point: 023 Date: 10/21/2006 Latitude: 34º 23.824 N Longitude: 78º 16.050 W
Depth Conductivity Temp Salinity D.O.
136 uS 19.7 ºC 0.1 ppt 6.57 mg/L Surface 136.3 uS 19.6 ºC 0.1 ppt 6.32 mg/L 5 ft
136.3 uS 19.6 ºC 0.1 ppt 6.58 mg/L 10 ft
136.3 uS 19.6 ºC 0.1 ppt 6.42 mg/L 15 ft
136.3 uS 19.6 ºC 0.1 ppt 6.52 mg/L 20 ft
136.3 uS 19.6 ºC 0.1 ppt 5.84 mg/L 25 ft
ND uS ND ºC ND ppt ND mg/L 30 ft
ND uS ND ºC ND ppt ND mg/L 35 ft
ND uS ND ºC ND ppt ND mg/L 40 ft
ND uS ND ºC ND ppt ND mg/L 45 ft
323

Appendix B. (continued)
Physical Measurements Collected At Depth Site: 12 Way point: 024 Date: 10/21/2006 Latitude: 34º 24.218 N Longitude: 78º 17.528 W
Depth Conductivity Temp Salinity D.O. 136.9 uS 19.6 ºC 0.1 ppt 6.5 mg/L Surface
136.9 uS 19.6 ºC 0.1 ppt 6.53 mg/L 5 ft
136.8 uS 19.6 ºC 0.1 ppt 6.57 mg/L 10 ft
136.8 uS 19.6 ºC 0.1 ppt 6.5 mg/L 15 ft
ND uS ND ºC ND ppt ND mg/L 20 ft
ND uS ND ºC ND ppt ND mg/L 25 ft
ND uS ND ºC ND ppt ND mg/L 30 ft
ND uS ND ºC ND ppt ND mg/L 35 ft
ND uS ND ºC ND ppt ND mg/L 40 ft
ND uS ND ºC ND ppt ND mg/L 45 ft
324

Appendix B. (continued)
Physical Measurements Collected At Depth
Site: Way point: Date: 12/16/2006 1 013 Latitude: 34º 16.837 N Longitude: 78º 00.263 W
Depth Conductivity Temp Salinity D.O.
96.9 uS 8.9 ºC 0.1 ppt 8.07 mg/L Surface
96.9 uS 8.9 ºC 0.1 ppt 8.26 mg/L 5 ft
97 uS 8.9 ºC 0.1 ppt 7.93 mg/L 10 ft
97 uS 8.9 ºC 0.1 ppt 8.11 mg/L 15 ft
97.1 uS 8.9 ºC 0.1 ppt 8.26 mg/L 20 ft
96.6 uS 8.9 ºC 0.1 ppt 8.3 mg/L 25 ft
96.6 uS 8.9 ºC 0.1 ppt 8.33 mg/L 30 ft
96.5 uS 8.9 ºC 0.1 ppt 8.13 mg/L 35 ft
96.4 uS 8.9 ºC 0.1 ppt 7.97 mg/L 40 ft
96.4 uS 8.9 ºC 0.1 ppt 8.33 mg/L 45 ft
325

Appendix B. (continued)
Physical Measurements Collected At Depth
Site: Way point: Date: 12/16/2006 2 014 Latitude: 34º 19.396 N Longitude: 78º 00.549 W
Depth Conductivity Temp Salinity D.O.
31.6 uS 9 ºC 0 ppt 8.57 mg/L Surface
96.8 uS 9.1 ºC 0.1 ppt 8.22 mg/L 5 ft
97.1 uS 9.1 ºC 0.1 ppt 8.16 mg/L 10 ft
97 uS 9 ºC 0.1 ppt 8.17 mg/L 15 ft
97.1 uS 9 ºC 0.1 ppt 8.16 mg/L 20 ft
97 uS 9.1 ºC 0.1 ppt 8.34 mg/L 25 ft
96.9 uS 9.1 ºC 0.1 ppt 8.26 mg/L 30 ft
ND uS ND ºC ND ppt ND mg/L 35 ft
ND uS ND ºC ND ppt ND mg/L 40 ft
ND uS ND ºC ND ppt ND mg/L 45 ft
326

Appendix B. (continued)
Physical Measurements Collected At Depth
Site: Way point: Date: 12/16/2006 3 015 Latitude: 34º 20.187 N Longitude: 78º 02.900 W
Depth Conductivity Temp Salinity D.O.
84.7 uS 9 ºC 0.1 ppt 8.08 mg/L Surface
87.8 uS 9.1 ºC 0.1 ppt 7.93 mg/L 5 ft
87.7 uS 9.1 ºC 0.1 ppt 8.19 mg/L 10 ft
92.7 uS 9.1 ºC 0.1 ppt 7.75 mg/L 15 ft
94.5 uS 9.1 ºC 0.1 ppt 7.79 mg/L 20 ft
ND uS ND ºC ND ppt ND mg/L 25 ft
ND uS ND ºC ND ppt ND mg/L 30 ft
ND uS ND ºC ND ppt ND mg/L 35 ft
ND uS ND ºC ND ppt ND mg/L 40 ft
ND uS ND ºC ND ppt ND mg/L 45 ft
327

Appendix B. (continued)
Physical Measurements Collected At Depth Site: 4 Way point: 016 Date: 12/16/2006 Latitude: 34º 20.276 N Longitude: 78º 04.509 W
Depth Conductivity Temp Salinity D.O. 102.7 uS 9 ºC 0.1 ppt 8.66 mg/L Surface
102.9 uS 9 ºC 0.1 ppt 8.61 mg/L 5 ft
102.8 uS 9 ºC 0.1 ppt 8.62 mg/L 10 ft
103.1 uS 9 ºC 0.1 ppt 8.63 mg/L 15 ft
102.8 uS 9 ºC 0.1 ppt 8.71 mg/L 20 ft
103.1 uS 9 ºC 0.1 ppt 8.73 mg/L 25 ft
ND uS ND ºC ND ppt ND mg/L 30 ft
ND uS ND ºC ND ppt ND mg/L 35 ft
ND uS ND ºC ND ppt ND mg/L 40 ft
ND uS ND ºC ND ppt ND mg/L 45 ft
328

Appendix B. (continued)
Physical Measurements Collected At Depth Site: 5 Way point: 017 Date: 12/16/2006 Latitude: 34º 21.312 N Longitude: 78º 06.122 W
Depth Conductivity Temp Salinity D.O. 120.5 uS 8.9 ºC 0.1 ppt 8.82 mg/L Surface
120.3 uS 8.9 ºC 0.1 ppt 8.77 mg/L 5 ft
120.3 uS 9 ºC 0.1 ppt 8.92 mg/L 10 ft
118.9 uS 8.9 ºC 0.1 ppt 8.77 mg/L 15 ft
ND uS ND ºC ND ppt ND mg/L 20 ft
ND uS ND ºC ND ppt ND mg/L 25 ft
ND uS ND ºC ND ppt ND mg/L 30 ft
ND uS ND ºC ND ppt ND mg/L 35 ft
ND uS ND ºC ND ppt ND mg/L 40 ft
ND uS ND ºC ND ppt ND mg/L 45 ft
329

Appendix B. (continued)
Physical Measurements Collected At Depth Site: 6 Way point: 018 Date: 12/16/2006 Latitude: 34º 21.963 N Longitude: 78º 08.109 W
Depth Conductivity Temp Salinity D.O. 101.1 uS 8.8 ºC 0.1 ppt 9.08 mg/L Surface
101.1 uS 8.8 ºC 0.1 ppt 9.07 mg/L 5 ft
101 uS 8.8 ºC 0.1 ppt 9.12 mg/L 10 ft
101 uS 8.8 ºC 0.1 ppt 9.14 mg/L 15 ft
101 uS 8.8 ºC 0.1 ppt 9.11 mg/L 20 ft
ND uS ND ºC ND ppt ND mg/L 25 ft
ND uS ND ºC ND ppt ND mg/L 30 ft
ND uS ND ºC ND ppt ND mg/L 35 ft
ND uS ND ºC ND ppt ND mg/L 40 ft
ND uS ND ºC ND ppt ND mg/L 45 ft
330

Appendix B. (continued)
Physical Measurements Collected At Depth Site: 7 Way point: 019 Date: 12/16/2006 Latitude: 34º 21.440 N Longitude: 78º 09.949 W
Depth Conductivity Temp Salinity D.O.
95 uS 8.6 ºC 0.1 ppt 8.85 mg/L Surface
95 uS 8.6 ºC 0.1 ppt 8.93 mg/L 5 ft
94.8 uS 8.6 ºC 0.1 ppt 8.89 mg/L 10 ft
94.7 uS 8.6 ºC 0.1 ppt 9.06 mg/L 15 ft
94.3 uS 8.6 ºC 0.1 ppt 9.19 mg/L 20 ft
ND uS ND ºC ND ppt ND mg/L 25 ft
ND uS ND ºC ND ppt ND mg/L 30 ft
ND uS ND ºC ND ppt ND mg/L 35 ft
ND uS ND ºC ND ppt ND mg/L 40 ft
ND uS ND ºC ND ppt ND mg/L 45 ft
331

Appendix B. (continued)
Physical Measurements Collected At Depth Site: 8 Way point: 020 Date: 12/16/2006 Latitude: 34º 21.413 N Longitude: 78º 12.560 W
Depth Conductivity Temp Salinity D.O.
67.2 uS 8.4 ºC 0 ppt 9.09 mg/L Surface
67.2 uS 8.4 ºC 0 ppt 9.08 mg/L 5 ft
67.2 uS 8.4 ºC 0 ppt 9.36 mg/L 10 ft
67.3 uS 8.4 ºC 0 ppt 9.2 mg/L 15 ft
67.3 uS 8.4 ºC 0 ppt 9.18 mg/L 20 ft
67.2 uS 8.4 ºC 0 ppt 9.09 mg/L 25 ft
ND uS ND ºC ND ppt ND mg/L 30 ft
ND uS ND ºC ND ppt ND mg/L 35 ft
ND uS ND ºC ND ppt ND mg/L 40 ft
ND uS ND ºC ND ppt ND mg/L 45 ft
332

Appendix B. (continued)
Physical Measurements Collected At Depth Site: 9 Way point: 021 Date: 12/16/2006 Latitude: 34º 22.470 N Longitude: 78º 13.560 W
Depth Conductivity Temp Salinity D.O.
67.6 uS 8.4 ºC 0 ppt 9.05 mg/L Surface
67.5 uS 8.3 ºC 0 ppt 9.17 mg/L 5 ft
67.6 uS 8.3 ºC 0 ppt 9.27 mg/L 10 ft
67.5 uS 8.3 ºC 0 ppt 8.99 mg/L 15 ft
ND uS ND ºC ND ppt ND mg/L 20 ft
ND uS ND ºC ND ppt ND mg/L 25 ft
ND uS ND ºC ND ppt ND mg/L 30 ft
ND uS ND ºC ND ppt ND mg/L 35 ft
ND uS ND ºC ND ppt ND mg/L 40 ft
ND uS ND ºC ND ppt ND mg/L 45 ft
333

Appendix B. (continued)
Physical Measurements Collected At Depth Site: 10 Way point: 022 Date: 12/16/2006 Latitude: 34º 23.075 N Longitude: 78º 14.705 W
Depth Conductivity Temp Salinity D.O.
68 uS 8.4 ºC 0 ppt 8.97 mg/L Surface
67.9 uS 8.4 ºC 0 ppt 9.43 mg/L 5 ft
68 uS 8.4 ºC 0 ppt 9.29 mg/L 10 ft
68 uS 8.4 ºC 0 ppt 9.14 mg/L 15 ft
68 uS 8.4 ºC 0 ppt 9.14 mg/L 20 ft
ND uS ND ºC ND ppt ND mg/L 25 ft
ND uS ND ºC ND ppt ND mg/L 30 ft
ND uS ND ºC ND ppt ND mg/L 35 ft
ND uS ND ºC ND ppt ND mg/L 40 ft
ND uS ND ºC ND ppt ND mg/L 45 ft
334

Appendix B. (continued)
Physical Measurements Collected At Depth Site: 11 Way point: 023 Date: 12/16/2006 Latitude: 34º 23.824 N Longitude: 78º 16.050 W
Depth Conductivity Temp Salinity D.O.
68 uS 8.4 ºC 0 ppt 9.37 mg/L Surface
68 uS 8.4 ºC 0 ppt 9.44 mg/L 5 ft
68.1 uS 8.3 ºC 0 ppt 9.4 mg/L 10 ft
68 uS 8.3 ºC 0 ppt 9.28 mg/L 15 ft
68 uS 8.3 ºC 0 ppt 9.34 mg/L 20 ft
ND uS ND ºC ND ppt ND mg/L 25 ft
ND uS ND ºC ND ppt ND mg/L 30 ft
ND uS ND ºC ND ppt ND mg/L 35 ft
ND uS ND ºC ND ppt ND mg/L 40 ft
ND uS ND ºC ND ppt ND mg/L 45 ft
335

Appendix B. (continued)
Physical Measurements Collected At Depth Site: 12 Way point: 024 Date: 12/16/2006 Latitude: 34º 24.218 N Longitude: 78º 17.528 W
Depth Conductivity Temp Salinity D.O.
68 uS 8.3 ºC 0 ppt 9.48 mg/L Surface
68 uS 8.3 ºC 0 ppt 9.42 mg/L 5 ft
68 uS 8.3 ºC 0 ppt 9.4 mg/L 10 ft
68 uS 8.3 ºC 0 ppt 9.47 mg/L 15 ft
ND uS ND ºC ND ppt ND mg/L 20 ft
ND uS ND ºC ND ppt ND mg/L 25 ft
ND uS ND ºC ND ppt ND mg/L 30 ft
ND uS ND ºC ND ppt ND mg/L 35 ft
ND uS ND ºC ND ppt ND mg/L 40 ft
ND uS ND ºC ND ppt ND mg/L 45 ft
336
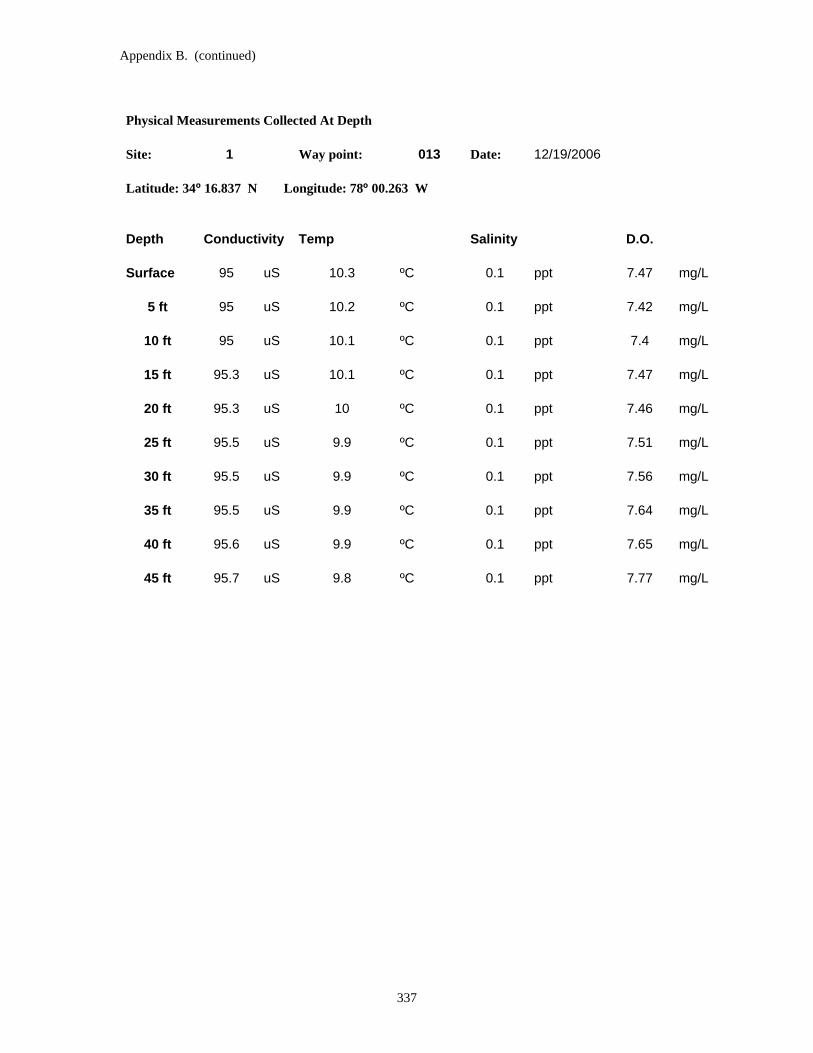
Appendix B. (continued)
Physical Measurements Collected At Depth
Site: Way point: Date: 12/19/2006 1 013 Latitude: 34º 16.837 N Longitude: 78º 00.263 W
Depth Conductivity Temp Salinity D.O.
95 uS 10.3 ºC 0.1 ppt 7.47 mg/L Surface
95 uS 10.2 ºC 0.1 ppt 7.42 mg/L 5 ft
95 uS 10.1 ºC 0.1 ppt 7.4 mg/L 10 ft
95.3 uS 10.1 ºC 0.1 ppt 7.47 mg/L 15 ft
95.3 uS 10 ºC 0.1 ppt 7.46 mg/L 20 ft
95.5 uS 9.9 ºC 0.1 ppt 7.51 mg/L 25 ft
95.5 uS 9.9 ºC 0.1 ppt 7.56 mg/L 30 ft
95.5 uS 9.9 ºC 0.1 ppt 7.64 mg/L 35 ft
95.6 uS 9.9 ºC 0.1 ppt 7.65 mg/L 40 ft
95.7 uS 9.8 ºC 0.1 ppt 7.77 mg/L 45 ft
337
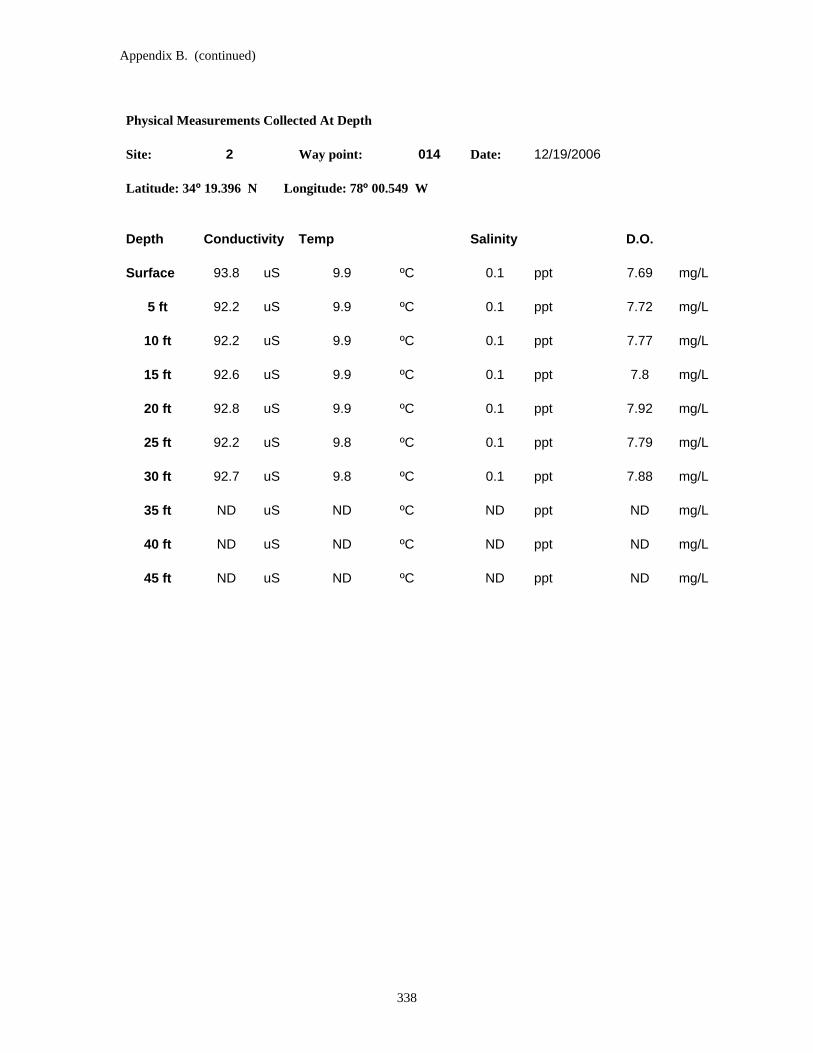
Appendix B. (continued)
Physical Measurements Collected At Depth
Site: Way point: Date: 12/19/2006 2 014 Latitude: 34º 19.396 N Longitude: 78º 00.549 W
Depth Conductivity Temp Salinity D.O.
93.8 uS 9.9 ºC 0.1 ppt 7.69 mg/L Surface
92.2 uS 9.9 ºC 0.1 ppt 7.72 mg/L 5 ft
92.2 uS 9.9 ºC 0.1 ppt 7.77 mg/L 10 ft
92.6 uS 9.9 ºC 0.1 ppt 7.8 mg/L 15 ft
92.8 uS 9.9 ºC 0.1 ppt 7.92 mg/L 20 ft
92.2 uS 9.8 ºC 0.1 ppt 7.79 mg/L 25 ft
92.7 uS 9.8 ºC 0.1 ppt 7.88 mg/L 30 ft
ND uS ND ºC ND ppt ND mg/L 35 ft
ND uS ND ºC ND ppt ND mg/L 40 ft
ND uS ND ºC ND ppt ND mg/L 45 ft
338

Appendix B. (continued)
Physical Measurements Collected At Depth
Site: Way point: Date: 12/19/2006 2 014 Latitude: 34º 19.396 N Longitude: 78º 00.549 W
Depth Conductivity Temp Salinity D.O.
93.8 uS 9.9 ºC 0.1 ppt 7.69 mg/L Surface
92.2 uS 9.9 ºC 0.1 ppt 7.72 mg/L 5 ft
92.2 uS 9.9 ºC 0.1 ppt 7.77 mg/L 10 ft
92.6 uS 9.9 ºC 0.1 ppt 7.8 mg/L 15 ft
92.8 uS 9.9 ºC 0.1 ppt 7.92 mg/L 20 ft
92.2 uS 9.8 ºC 0.1 ppt 7.79 mg/L 25 ft
92.7 uS 9.8 ºC 0.1 ppt 7.88 mg/L 30 ft
ND uS ND ºC ND ppt ND mg/L 35 ft
ND uS ND ºC ND ppt ND mg/L 40 ft
ND uS ND ºC ND ppt ND mg/L 45 ft
339

Appendix B. (continued)
Physical Measurements Collected At Depth Site: 4 Way point: 016 Date: 12/19/2006 Latitude: 34º 20.276 N Longitude: 78º 04.509 W
Depth Conductivity Temp Salinity D.O. 103.8 uS 10 ºC 0.1 ppt 7.7 mg/L Surface
103.8 uS 9.9 ºC 0.1 ppt 7.91 mg/L 5 ft
103.3 uS 9.9 ºC 0.1 ppt 7.95 mg/L 10 ft
103.2 uS 9.8 ºC 0.1 ppt 8.09 mg/L 15 ft
103.4 uS 9.8 ºC 0.1 ppt 8.05 mg/L 20 ft
ND uS ND ºC ND ppt ND mg/L 25 ft
ND uS ND ºC ND ppt ND mg/L 30 ft
ND uS ND ºC ND ppt ND mg/L 35 ft
ND uS ND ºC ND ppt ND mg/L 40 ft
ND uS ND ºC ND ppt ND mg/L 45 ft
340

Appendix B. (continued)
Physical Measurements Collected At Depth Site: 5 Way point: 017 Date: 12/19/2006 Latitude: 34º 21.312 N Longitude: 78º 06.122 W
Depth Conductivity Temp Salinity D.O.
89.4 uS 9.5 ºC 0.1 ppt 8.71 mg/L Surface
89.1 uS 9.4 ºC 0.1 ppt 8.53 mg/L 5 ft
89.3 uS 9.4 ºC 0.1 ppt 8.47 mg/L 10 ft
89.3 uS 9.4 ºC 0.1 ppt 8.39 mg/L 15 ft
ND uS ND ºC ND ppt ND mg/L 20 ft
ND uS ND ºC ND ppt ND mg/L 25 ft
ND uS ND ºC ND ppt ND mg/L 30 ft
ND uS ND ºC ND ppt ND mg/L 35 ft
ND uS ND ºC ND ppt ND mg/L 40 ft
ND uS ND ºC ND ppt ND mg/L 45 ft
341
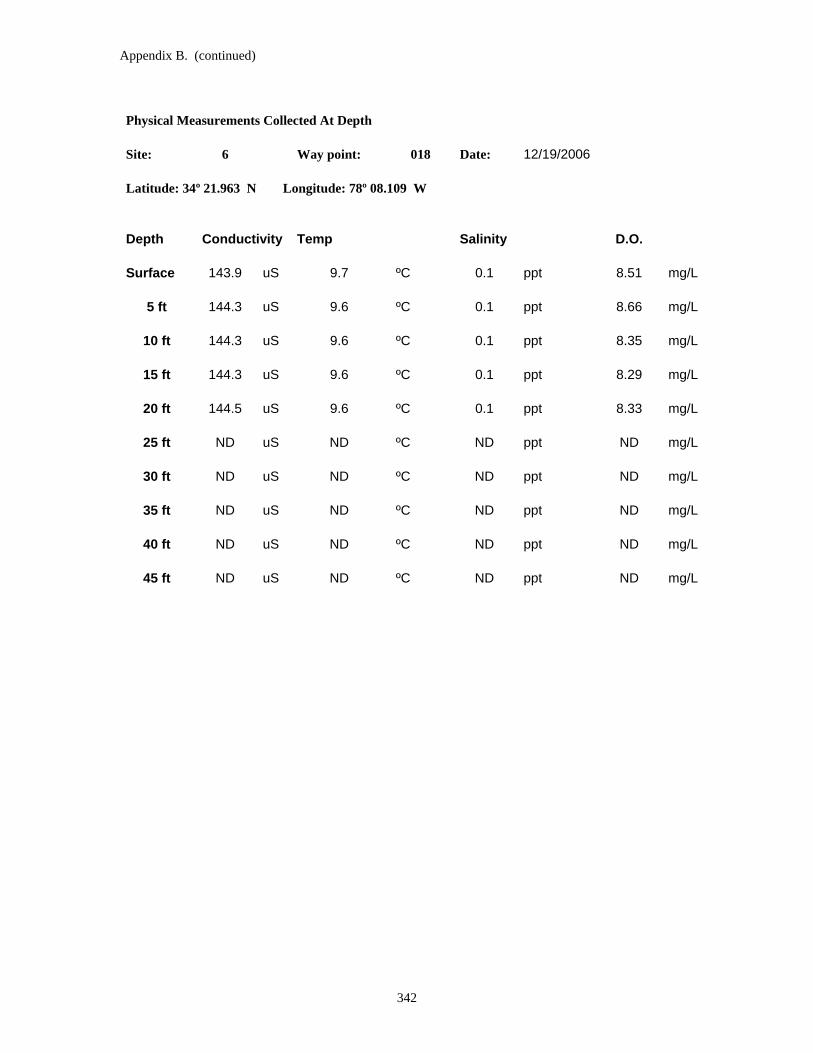
Appendix B. (continued)
Physical Measurements Collected At Depth Site: 6 Way point: 018 Date: 12/19/2006 Latitude: 34º 21.963 N Longitude: 78º 08.109 W
Depth Conductivity Temp Salinity D.O. 143.9 uS 9.7 ºC 0.1 ppt 8.51 mg/L Surface
144.3 uS 9.6 ºC 0.1 ppt 8.66 mg/L 5 ft
144.3 uS 9.6 ºC 0.1 ppt 8.35 mg/L 10 ft
144.3 uS 9.6 ºC 0.1 ppt 8.29 mg/L 15 ft
144.5 uS 9.6 ºC 0.1 ppt 8.33 mg/L 20 ft
ND uS ND ºC ND ppt ND mg/L 25 ft
ND uS ND ºC ND ppt ND mg/L 30 ft
ND uS ND ºC ND ppt ND mg/L 35 ft
ND uS ND ºC ND ppt ND mg/L 40 ft
ND uS ND ºC ND ppt ND mg/L 45 ft
342

Appendix B. (continued)
Physical Measurements Collected At Depth Site: 7 Way point: 019 Date: 12/19/2006 Latitude: 34º 21.440 N Longitude: 78º 09.949 W
Depth Conductivity Temp Salinity D.O.
84 uS 9.5 ºC 0.1 ppt 8.68 mg/L Surface
83.4 uS 9.5 ºC 0.1 ppt 8.41 mg/L 5 ft
84 uS 9.4 ºC 0.1 ppt 8.45 mg/L 10 ft
84 uS 9.4 ºC 0.1 ppt 8.48 mg/L 15 ft
84.3 uS 9.4 ºC 0.1 ppt 8.57 mg/L 20 ft
ND uS ND ºC ND ppt ND mg/L 25 ft
ND uS ND ºC ND ppt ND mg/L 30 ft
ND uS ND ºC ND ppt ND mg/L 35 ft
ND uS ND ºC ND ppt ND mg/L 40 ft
ND uS ND ºC ND ppt ND mg/L 45 ft
343

Appendix B. (continued)
Physical Measurements Collected At Depth Site: 8 Way point: 020 Date: 12/19/2006 Latitude: 34º 21.413 N Longitude: 78º 12.560 W
Depth Conductivity Temp Salinity D.O.
72 uS 9.5 ºC 0 ppt 8.9 mg/L Surface
71.6 uS 9.3 ºC 0 ppt 8.66 mg/L 5 ft
71.6 uS 9.3 ºC 0 ppt 8.66 mg/L 10 ft
71.6 uS 9.3 ºC 0 ppt 8.81 mg/L 15 ft
71.6 uS 9.3 ºC 0 ppt 8.87 mg/L 20 ft
71.8 uS 9.3 ºC 0 ppt 8.94 mg/L 25 ft
ND uS ND ºC ND ppt ND mg/L 30 ft
ND uS ND ºC ND ppt ND mg/L 35 ft
ND uS ND ºC ND ppt ND mg/L 40 ft
ND uS ND ºC ND ppt ND mg/L 45 ft
344

Appendix B. (continued)
Physical Measurements Collected At Depth Site: 9 Way point: 021 Date: 12/19/2006 Latitude: 34º 22.470 N Longitude: 78º 13.560 W
Depth Conductivity Temp Salinity D.O.
72.3 uS 9.5 ºC 0 ppt 8.79 mg/L Surface
72.2 uS 9.5 ºC 0 ppt 8.65 mg/L 5 ft
72.3 uS 9.4 ºC 0 ppt 8.64 mg/L 10 ft
72.3 uS 9.4 ºC 0 ppt 8.43 mg/L 15 ft
ND uS ND ºC ND ppt ND mg/L 20 ft
ND uS ND ºC ND ppt ND mg/L 25 ft
ND uS ND ºC ND ppt ND mg/L 30 ft
ND uS ND ºC ND ppt ND mg/L 35 ft
ND uS ND ºC ND ppt ND mg/L 40 ft
ND uS ND ºC ND ppt ND mg/L 45 ft
345
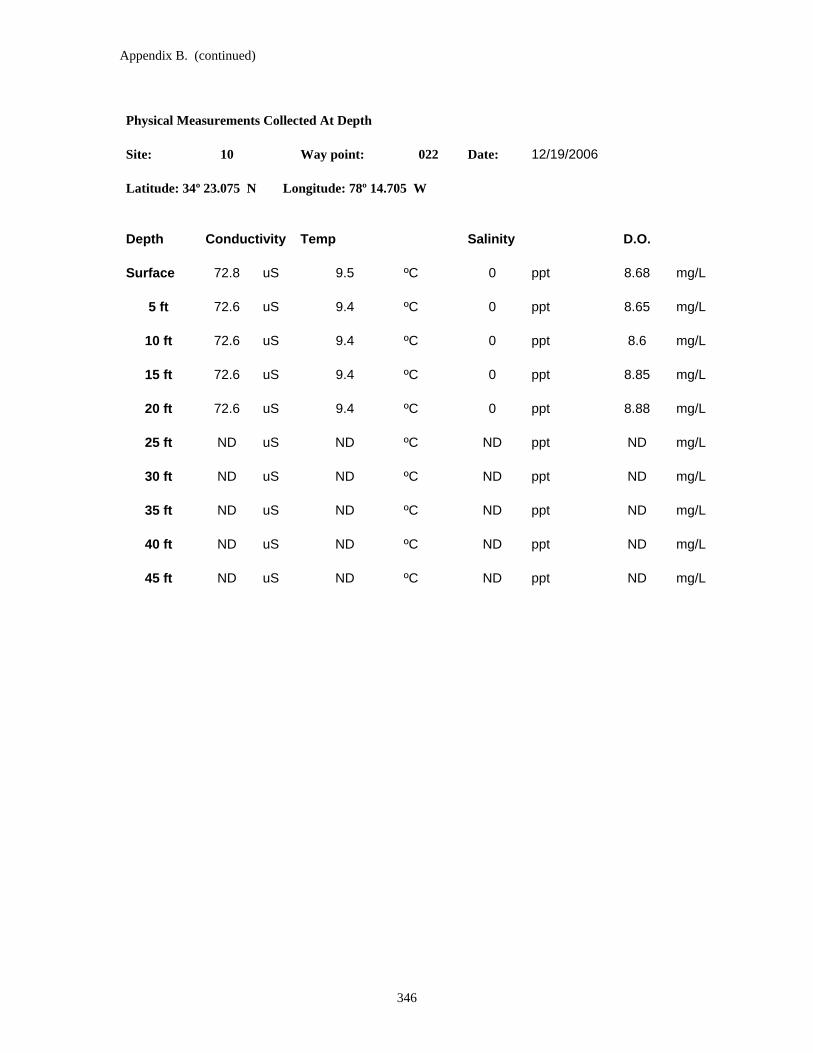
Appendix B. (continued)
Physical Measurements Collected At Depth Site: 10 Way point: 022 Date: 12/19/2006 Latitude: 34º 23.075 N Longitude: 78º 14.705 W
Depth Conductivity Temp Salinity D.O.
72.8 uS 9.5 ºC 0 ppt 8.68 mg/L Surface
72.6 uS 9.4 ºC 0 ppt 8.65 mg/L 5 ft
72.6 uS 9.4 ºC 0 ppt 8.6 mg/L 10 ft
72.6 uS 9.4 ºC 0 ppt 8.85 mg/L 15 ft
72.6 uS 9.4 ºC 0 ppt 8.88 mg/L 20 ft
ND uS ND ºC ND ppt ND mg/L 25 ft
ND uS ND ºC ND ppt ND mg/L 30 ft
ND uS ND ºC ND ppt ND mg/L 35 ft
ND uS ND ºC ND ppt ND mg/L 40 ft
ND uS ND ºC ND ppt ND mg/L 45 ft
346

Appendix B. (continued)
Physical Measurements Collected At Depth Site: 11 Way point: 023 Date: 12/19/2006 Latitude: 34º 23.824 N Longitude: 78º 16.050 W
Depth Conductivity Temp Salinity D.O.
72.7 uS 9.5 ºC 0 ppt 8.88 mg/L Surface
72.6 uS 9.5 ºC 0 ppt 8.95 mg/L 5 ft
72.6 uS 9.5 ºC 0 ppt 8.99 mg/L 10 ft
72.6 uS 9.4 ºC 0 ppt 9.01 mg/L 15 ft
72.6 uS 9.4 ºC 0 ppt 8.99 mg/L 20 ft
ND uS ND ºC ND ppt ND mg/L 25 ft
ND uS ND ºC ND ppt ND mg/L 30 ft
ND uS ND ºC ND ppt ND mg/L 35 ft
ND uS ND ºC ND ppt ND mg/L 40 ft
ND uS ND ºC ND ppt ND mg/L 45 ft
347

Appendix B. (continued)
Physical Measurements Collected At Depth Site: 12 Way point: 024 Date: 12/19/2006 Latitude: 34º 24.218 N Longitude: 78º 17.528 W
Depth Conductivity Temp Salinity D.O.
72.5 uS 9.6 ºC 0 ppt 8.95 mg/L Surface
72.5 uS 9.5 ºC 0 ppt 8.93 mg/L 5 ft
72.5 uS 9.5 ºC 0 ppt 9 mg/L 10 ft
72.5 uS 9.5 ºC 0 ppt 8.94 mg/L 15 ft
ND uS ND ºC ND ppt ND mg/L 20 ft
ND uS ND ºC ND ppt ND mg/L 25 ft
ND uS ND ºC ND ppt ND mg/L 30 ft
ND uS ND ºC ND ppt ND mg/L 35 ft
ND uS ND ºC ND ppt ND mg/L 40 ft
ND uS ND ºC ND ppt ND mg/L 45 ft
348

Appendix B. (continued)
Physical Measurements At Depth
Site: Way point: Date: 1/6/2007 1 013 Latitude: 34º 16.837 N Longitude: 78º 00.263 W
Depth Conductivity Temp Salinity D.O.
75.8 uS 12.9 ºC 0 ppt 6.32 mg/L Surface
75.4 uS 12.7 ºC 0 ppt 6.27 mg/L 5 ft
75.4 uS 12.6 ºC 0 ppt 6.25 mg/L 10 ft
98.8 uS 12.6 ºC 0 ppt 6.41 mg/L 15 ft
75.2 uS 12.6 ºC 0 ppt 6.46 mg/L 20 ft
75.3 uS 12.6 ºC 0 ppt 6.52 mg/L 25 ft
75.3 uS 12.5 ºC 0 ppt 6.54 mg/L 30 ft
75.3 uS 12.5 ºC 0 ppt 6.53 mg/L 35 ft
75.3 uS 12.5 ºC 0 ppt 6.53 mg/L 40 ft
75.3 uS 12.5 ºC 0 ppt 6.34 mg/L 45 ft
349
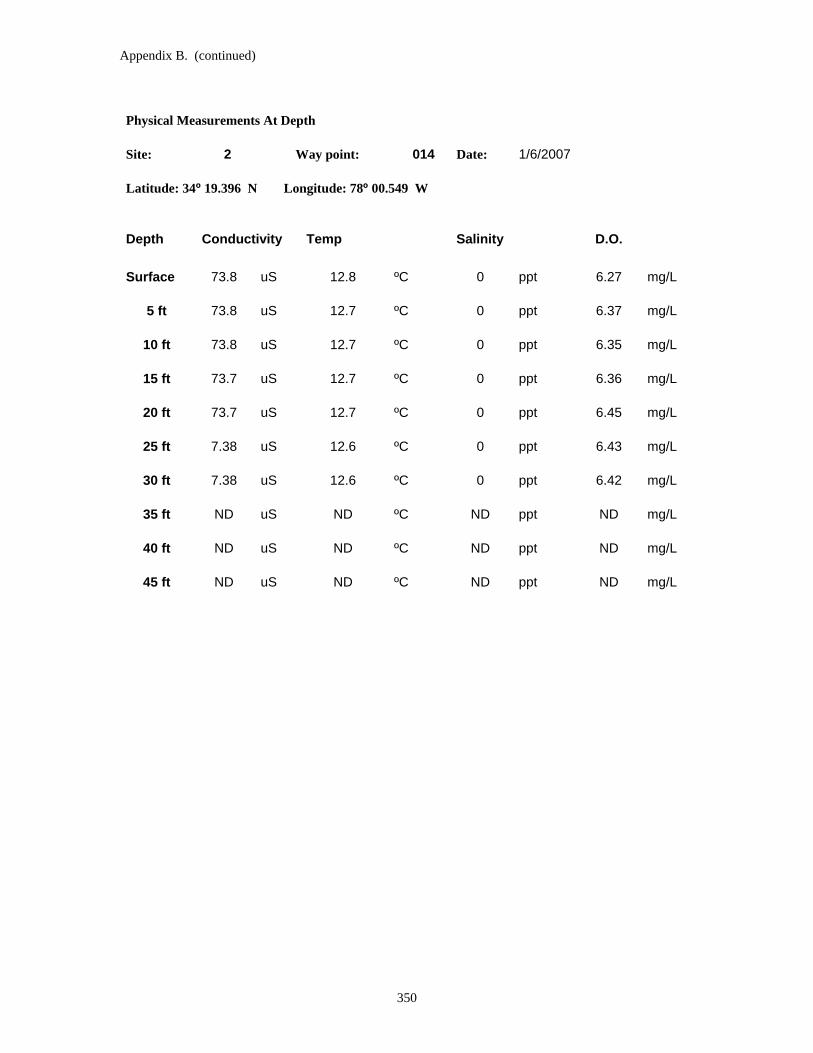
Appendix B. (continued)
Physical Measurements At Depth
Site: Way point: Date: 1/6/2007 2 014 Latitude: 34º 19.396 N Longitude: 78º 00.549 W
Depth Conductivity Temp Salinity D.O.
73.8 uS 12.8 ºC 0 ppt 6.27 mg/L Surface
73.8 uS 12.7 ºC 0 ppt 6.37 mg/L 5 ft
73.8 uS 12.7 ºC 0 ppt 6.35 mg/L 10 ft
73.7 uS 12.7 ºC 0 ppt 6.36 mg/L 15 ft
73.7 uS 12.7 ºC 0 ppt 6.45 mg/L 20 ft
7.38 uS 12.6 ºC 0 ppt 6.43 mg/L 25 ft
7.38 uS 12.6 ºC 0 ppt 6.42 mg/L 30 ft
ND uS ND ºC ND ppt ND mg/L 35 ft
ND uS ND ºC ND ppt ND mg/L 40 ft
ND uS ND ºC ND ppt ND mg/L 45 ft
350

Appendix B. (continued)
Physical Measurements At Depth
Site: Way point: Date: 1/6/2007 3 015 Latitude: 34º 20.187 N Longitude: 78º 02.900 W
Depth Conductivity Temp Salinity D.O.
93.5 uS 12 ºC 0.1 ppt 7.09 mg/L Surface
94.7 uS 11.9 ºC 0.1 ppt 7.15 mg/L 5 ft
94.7 uS 11.8 ºC 0.1 ppt 7.16 mg/L 10 ft
94.9 uS 11.7 ºC 0.1 ppt 7.29 mg/L 15 ft
94.4 uS 11.7 ºC 0.1 ppt 7.35 mg/L 20 ft
ND uS ND ºC ND ppt ND mg/L 25 ft
ND uS ND ºC ND ppt ND mg/L 30 ft
ND uS ND ºC ND ppt ND mg/L 35 ft
ND uS ND ºC ND ppt ND mg/L 40 ft
ND uS ND ºC ND ppt ND mg/L 45 ft
351

Appendix B. (continued)
Physical Measurements At Depth Site: 4 Way point: 016 Date: 1/6/2006 Latitude: 34º 20.276 N Longitude: 78º 04.509 W
Depth Conductivity Temp Salinity D.O.
95.4 uS 11.9 ºC 0.1 ppt 7.23 mg/L Surface
95.8 uS 11.8 ºC 0.1 ppt 7.33 mg/L 5 ft
95.8 uS 11.7 ºC 0.1 ppt 7.38 mg/L 10 ft
95.8 uS 11.7 ºC 0.1 ppt 7.42 mg/L 15 ft
95.8 uS 11.7 ºC 0.1 ppt 7.42 mg/L 20 ft
ND uS ND ºC ND ppt ND mg/L 25 ft
ND uS ND ºC ND ppt ND mg/L 30 ft
ND uS ND ºC ND ppt ND mg/L 35 ft
ND uS ND ºC ND ppt ND mg/L 40 ft
ND uS ND ºC ND ppt ND mg/L 45 ft
352
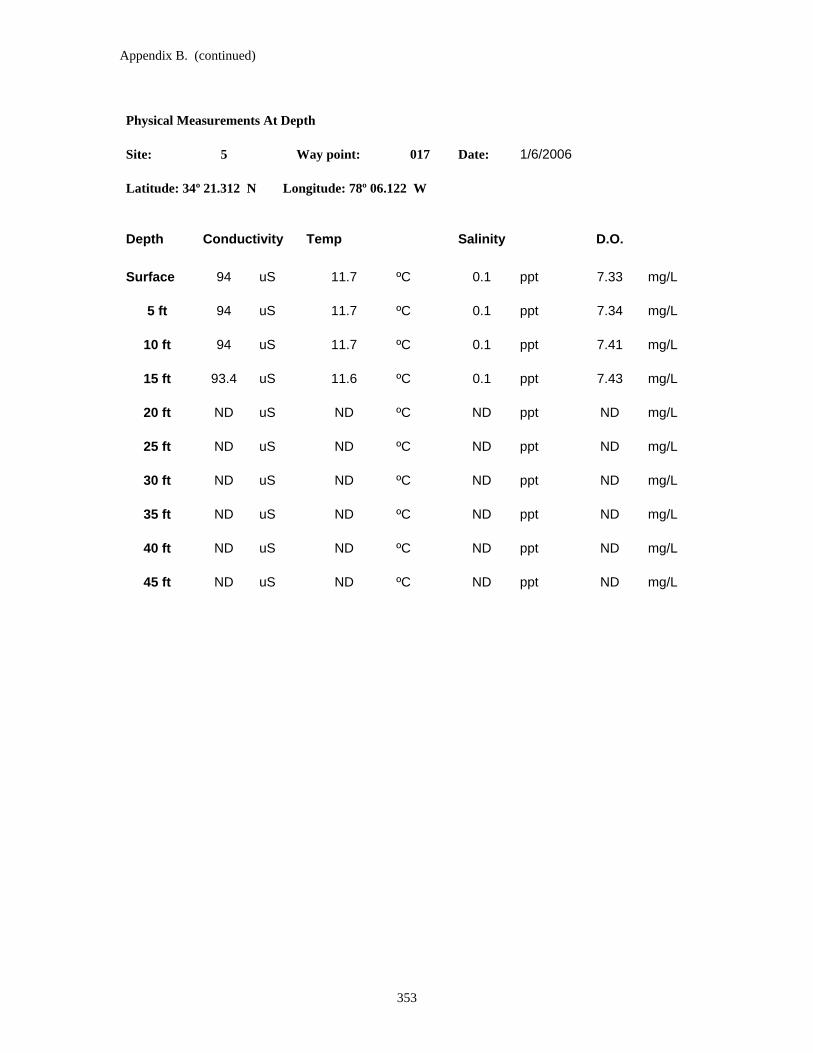
Appendix B. (continued)
Physical Measurements At Depth Site: 5 Way point: 017 Date: 1/6/2006 Latitude: 34º 21.312 N Longitude: 78º 06.122 W
Depth Conductivity Temp Salinity D.O.
94 uS 11.7 ºC 0.1 ppt 7.33 mg/L Surface
94 uS 11.7 ºC 0.1 ppt 7.34 mg/L 5 ft
94 uS 11.7 ºC 0.1 ppt 7.41 mg/L 10 ft
93.4 uS 11.6 ºC 0.1 ppt 7.43 mg/L 15 ft
ND uS ND ºC ND ppt ND mg/L 20 ft
ND uS ND ºC ND ppt ND mg/L 25 ft
ND uS ND ºC ND ppt ND mg/L 30 ft
ND uS ND ºC ND ppt ND mg/L 35 ft
ND uS ND ºC ND ppt ND mg/L 40 ft
ND uS ND ºC ND ppt ND mg/L 45 ft
353

Appendix B. (continued)
Physical Measurements At Depth Site: 6 Way point: 018 Date: 1/6/2006 Latitude: 34º 21.963 N Longitude: 78º 08.109 W
Depth Conductivity Temp Salinity D.O.
93.2 uS 12.5 ºC 0.1 ppt 6.47 mg/L Surface
93.8 uS 12 ºC 0.1 ppt 7.21 mg/L 5 ft
93.8 uS 11.9 ºC 0.1 ppt 7.32 mg/L 10 ft
93.7 uS 11.9 ºC 0.1 ppt 7.38 mg/L 15 ft
93.8 uS 11.7 ºC 0.1 ppt 7.41 mg/L 20 ft
ND uS ND ºC ND ppt ND mg/L 25 ft
ND uS ND ºC ND ppt ND mg/L 30 ft
ND uS ND ºC ND ppt ND mg/L 35 ft
ND uS ND ºC ND ppt ND mg/L 40 ft
ND uS ND ºC ND ppt ND mg/L 45 ft
354

Appendix B. (continued)
Physical Measurements At Depth Site: 7 Way point: 019 Date: 1/6/2006 Latitude: 34º 21.440 N Longitude: 78º 09.949 W
Depth Conductivity Temp Salinity D.O.
98.8 uS 11.9 ºC 0.1 ppt 7.15 mg/L Surface
98.8 uS 11.9 ºC 0.1 ppt 7.22 mg/L 5 ft
97.7 uS 11.8 ºC 0.1 ppt 7.27 mg/L 10 ft
97.1 uS 11.8 ºC 0.1 ppt 7.28 mg/L 15 ft
97.1 uS 11.7 ºC 0.1 ppt 7.3 mg/L 20 ft
ND uS ND ºC ND ppt ND mg/L 25 ft
ND uS ND ºC ND ppt ND mg/L 30 ft
ND uS ND ºC ND ppt ND mg/L 35 ft
ND uS ND ºC ND ppt ND mg/L 40 ft
ND uS ND ºC ND ppt ND mg/L 45 ft
355

Appendix B. (continued)
Physical Measurements At Depth Site: 8 Way point: 020 Date: 1/6/2006 Latitude: 34º 21.413 N Longitude: 78º 12.560 W
Depth Conductivity Temp Salinity D.O.
77.4 uS 11.9 ºC 0.1 ppt 7.24 mg/L Surface
77.3 uS 11.8 ºC 0.1 ppt 7.4 mg/L 5 ft
77.3 uS 11.7 ºC 0.1 ppt 7.41 mg/L 10 ft
77.4 uS 11.6 ºC 0.1 ppt 7.46 mg/L 15 ft
77.3 uS 11.5 ºC 0.1 ppt 7.58 mg/L 20 ft
77.3 uS 11.5 ºC 0.1 ppt 7.59 mg/L 25 ft
ND uS ND ºC ND ppt ND mg/L 30 ft
ND uS ND ºC ND ppt ND mg/L 35 ft
ND uS ND ºC ND ppt ND mg/L 40 ft
ND uS ND ºC ND ppt ND mg/L 45 ft
356

Appendix B. (continued)
Physical Measurements At Depth Site: 9 Way point: 021 Date: 1/6/2006 Latitude: 34º 22.470 N Longitude: 78º 13.560 W
Depth Conductivity Temp Salinity D.O.
77.6 uS 11.8 ºC 0.1 ppt 7.28 mg/L Surface
77.6 uS 11.7 ºC 0.1 ppt 7.39 mg/L 5 ft
77.6 uS 11.6 ºC 0.1 ppt 7.48 mg/L 10 ft
77.6 uS 11.6 ºC 0.1 ppt 7.5 mg/L 15 ft
77.6 uS 11.5 ºC 0.1 ppt 7.51 mg/L 20 ft
ND uS ND ºC ND ppt ND mg/L 25 ft
ND uS ND ºC ND ppt ND mg/L 30 ft
ND uS ND ºC ND ppt ND mg/L 35 ft
ND uS ND ºC ND ppt ND mg/L 40 ft
ND uS ND ºC ND ppt ND mg/L 45 ft
357
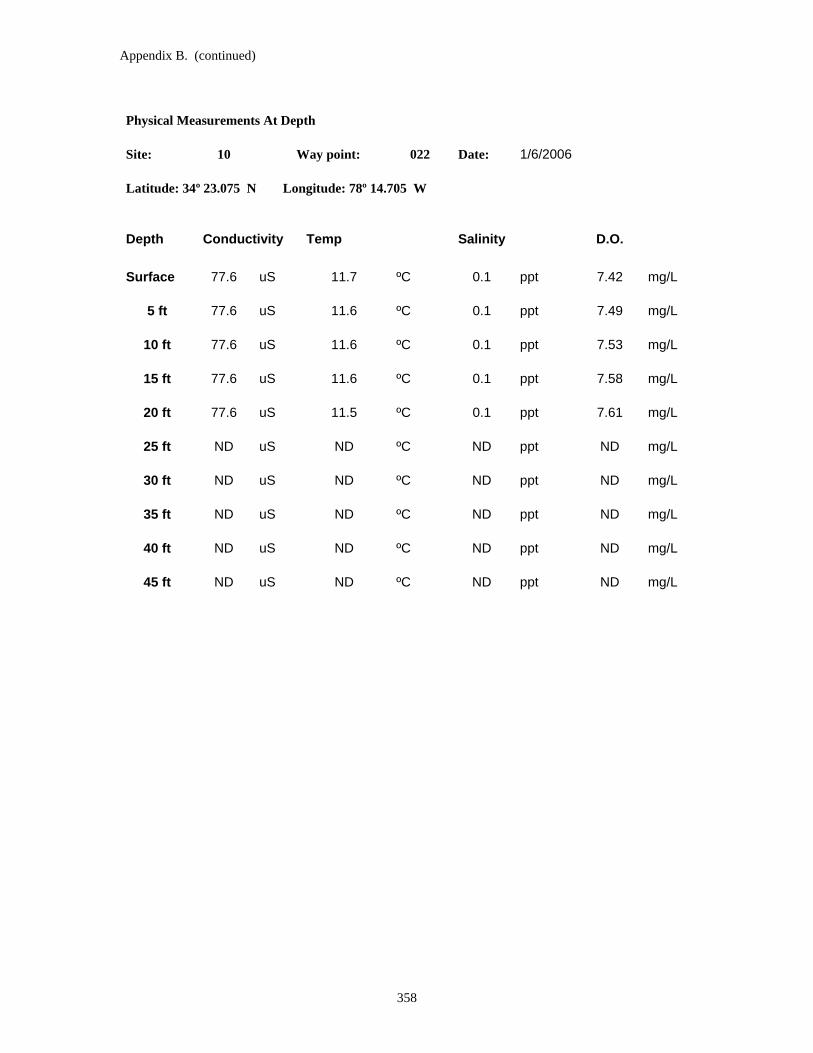
Appendix B. (continued)
Physical Measurements At Depth Site: 10 Way point: 022 Date: 1/6/2006 Latitude: 34º 23.075 N Longitude: 78º 14.705 W
Depth Conductivity Temp Salinity D.O.
77.6 uS 11.7 ºC 0.1 ppt 7.42 mg/L Surface
77.6 uS 11.6 ºC 0.1 ppt 7.49 mg/L 5 ft
77.6 uS 11.6 ºC 0.1 ppt 7.53 mg/L 10 ft
77.6 uS 11.6 ºC 0.1 ppt 7.58 mg/L 15 ft
77.6 uS 11.5 ºC 0.1 ppt 7.61 mg/L 20 ft
ND uS ND ºC ND ppt ND mg/L 25 ft
ND uS ND ºC ND ppt ND mg/L 30 ft
ND uS ND ºC ND ppt ND mg/L 35 ft
ND uS ND ºC ND ppt ND mg/L 40 ft
ND uS ND ºC ND ppt ND mg/L 45 ft
358

Appendix B. (continued)
Physical Measurements At Depth Site: 11 Way point: 023 Date: 1/6/2006 Latitude: 34º 23.824 N Longitude: 78º 16.050 W
Depth Conductivity Temp Salinity D.O.
78.3 uS 11.6 ºC 0.1 ppt 7.49 mg/L Surface
78.5 uS 11.5 ºC 0.1 ppt 7.61 mg/L 5 ft
78.1 uS 11.4 ºC 0.1 ppt 7.65 mg/L 10 ft
77.8 uS 11.4 ºC 0.1 ppt 7.63 mg/L 15 ft
77.8 uS 11.4 ºC 0.1 ppt 7.64 mg/L 20 ft
ND uS ND ºC ND ppt ND mg/L 25 ft
ND uS ND ºC ND ppt ND mg/L 30 ft
ND uS ND ºC ND ppt ND mg/L 35 ft
ND uS ND ºC ND ppt ND mg/L 40 ft
ND uS ND ºC ND ppt ND mg/L 45 ft
359
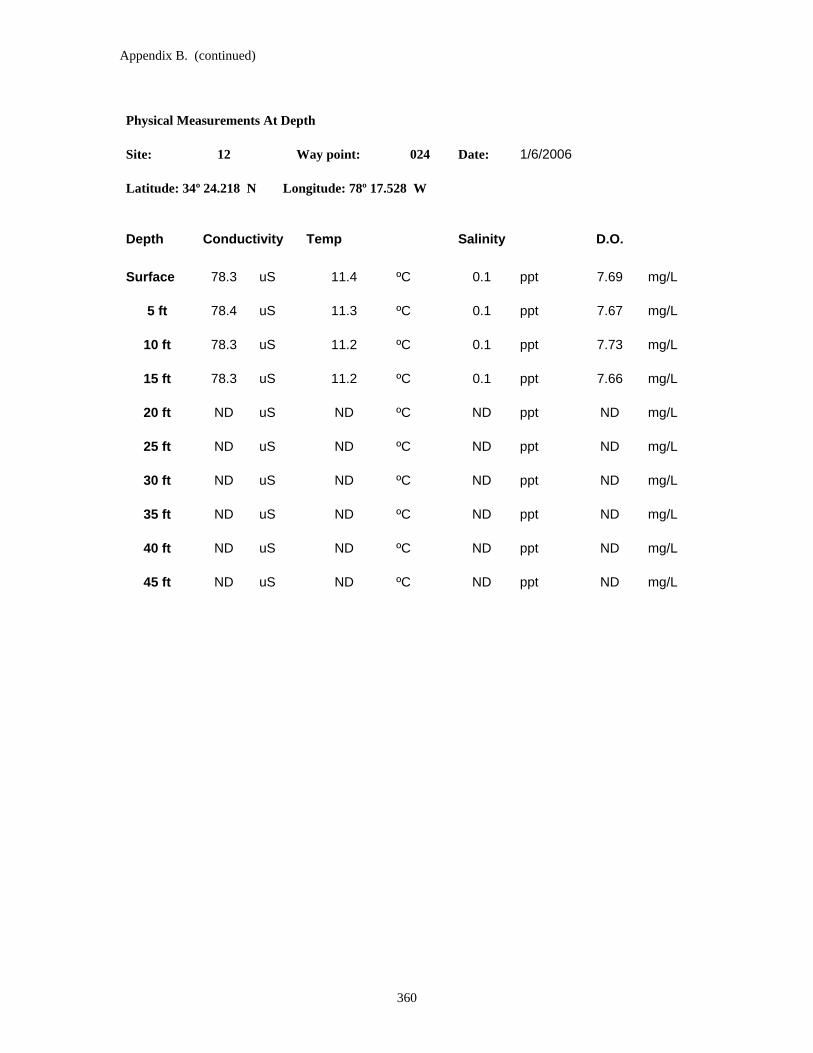
Appendix B. (continued)
Physical Measurements At Depth Site: 12 Way point: 024 Date: 1/6/2006 Latitude: 34º 24.218 N Longitude: 78º 17.528 W
Depth Conductivity Temp Salinity D.O.
78.3 uS 11.4 ºC 0.1 ppt 7.69 mg/L Surface
78.4 uS 11.3 ºC 0.1 ppt 7.67 mg/L 5 ft
78.3 uS 11.2 ºC 0.1 ppt 7.73 mg/L 10 ft
78.3 uS 11.2 ºC 0.1 ppt 7.66 mg/L 15 ft
ND uS ND ºC ND ppt ND mg/L 20 ft
ND uS ND ºC ND ppt ND mg/L 25 ft
ND uS ND ºC ND ppt ND mg/L 30 ft
ND uS ND ºC ND ppt ND mg/L 35 ft
ND uS ND ºC ND ppt ND mg/L 40 ft
ND uS ND ºC ND ppt ND mg/L 45 ft
360

Appendix B. (continued)
Physical Measurements Collected At Depth
Site: Way point: Date: 5/22/2007 1 013 Latitude: 34º 16.837 N Longitude: 78º 00.263 W
Depth Conductivity Temp Salinity D.O. 196.3 uS 23.6 ºC 0.1 ppt 4.91 mg/L Surface
199.4 uS 23.4 ºC 0.1 ppt 4.84 mg/L 5 ft
198.9 uS 23.2 ºC 0.1 ppt 4.74 mg/L 10 ft
199.9 uS 23.3 ºC 0.1 ppt 4.84 mg/L 15 ft
197.6 uS 23.3 ºC 0.1 ppt 4.67 mg/L 20 ft
195.6 uS 23.2 ºC 0.1 ppt 4.65 mg/L 25 ft
203.3 uS 23.3 ºC 0.1 ppt 4.8 mg/L 30 ft
202.4 uS 23.2 ºC 0.1 ppt 4.85 mg/L 35 ft
203.2 uS 23.2 ºC 0.1 ppt 4.83 mg/L 40 ft
210.3 uS 23.3 ºC 0.1 ppt 4.74 mg/L 45 ft
361

Appendix B. (continued)
Physical Measurements Collected At Depth
Site: Way point: Date: 5/22/2007 2 014 Latitude: 34º 19.396 N Longitude: 78º 00.549 W
Depth Conductivity Temp Salinity D.O. 176.8 uS 23.7 ºC 0.1 ppt 4.85 mg/L Surface
175.9 uS 23.6 ºC 0.1 ppt 4.84 mg/L 5 ft
176.1 uS 23.6 ºC 0.1 ppt 4.82 mg/L 10 ft
176.4 uS 23.5 ºC 0.1 ppt 4.77 mg/L 15 ft
176.3 uS 23.5 ºC 0.1 ppt 4.83 mg/L 20 ft
176.2 uS 23.5 ºC 0.1 ppt 4.84 mg/L 25 ft
176.1 uS 23.5 ºC 0.1 ppt 4.78 mg/L 30 ft
ND uS ND ºC ND ppt ND mg/L 35 ft
ND uS ND ºC ND ppt ND mg/L 40 ft
ND uS ND ºC ND ppt ND mg/L 45 ft
362

Appendix B. (continued)
Physical Measurements Collected At Depth
Site: Way point: Date: 5/22/2007 3 015 Latitude: 34º 20.187 N Longitude: 78º 02.900 W
Depth Conductivity Temp Salinity D.O.
170 uS 23.5 ºC 0.1 ppt 4.83 mg/L Surface 169.8 uS 23.5 ºC 0.1 ppt 4.79 mg/L 5 ft
169.8 uS 23.4 ºC 0.1 ppt 4.79 mg/L 10 ft
169.8 uS 23.4 ºC 0.1 ppt 4.74 mg/L 15 ft
175.2 uS 23.4 ºC 0.1 ppt 4.73 mg/L 20 ft
169.8 uS 23.4 ºC 0.1 ppt 4.76 mg/L 25 ft
ND uS ND ºC ND ppt ND mg/L 30 ft
ND uS ND ºC ND ppt ND mg/L 35 ft
ND uS ND ºC ND ppt ND mg/L 40 ft
ND uS ND ºC ND ppt ND mg/L 45 ft
363

Appendix B. (continued)
Physical Measurements Collected At Depth Site: 4 Way point: 016 Date: 5/22/2007 Latitude: 34º 20.276 N Longitude: 78º 04.509 W
Depth Conductivity Temp Salinity D.O. 183.2 uS 23.9 ºC 0.1 ppt 4.91 mg/L Surface
183.6 uS 23.8 ºC 0.1 ppt 4.9 mg/L 5 ft
185.9 uS 23.7 ºC 0.1 ppt 4.91 mg/L 10 ft
185.1 uS 23.7 ºC 0.1 ppt 4.84 mg/L 15 ft
185.2 uS 23.7 ºC 0.1 ppt 4.83 mg/L 20 ft
182.5 uS 23.7 ºC 0.1 ppt 4.81 mg/L 25 ft
ND uS ND ºC ND ppt ND mg/L 30 ft
ND uS ND ºC ND ppt ND mg/L 35 ft
ND uS ND ºC ND ppt ND mg/L 40 ft
ND uS ND ºC ND ppt ND mg/L 45 ft
364

Appendix B. (continued)
Physical Measurements Collected At Depth Site: 5 Way point: 017 Date: 5/22/2007 Latitude: 34º 21.312 N Longitude: 78º 06.122 W
Depth Conductivity Temp Salinity D.O. 222.2 uS 24.2 ºC 0.1 ppt 5.48 mg/L Surface
222 uS 24.1 ºC 0.1 ppt 5.29 mg/L 5 ft
222.6 uS 24 ºC 0.1 ppt 5.27 mg/L 10 ft
222.5 uS 24 ºC 0.1 ppt 5.22 mg/L 15 ft
222.4 uS 24 ºC 0.1 ppt 5.21 mg/L 20 ft
ND uS ND ºC ND ppt ND mg/L 25 ft
ND uS ND ºC ND ppt ND mg/L 30 ft
ND uS ND ºC ND ppt ND mg/L 35 ft
ND uS ND ºC ND ppt ND mg/L 40 ft
ND uS ND ºC ND ppt ND mg/L 45 ft
365

Appendix B. (continued)
Physical Measurements Collected At Depth Site: 6 Way point: 018 Date: 5/22/2007 Latitude: 34º 21.963 N Longitude: 78º 08.109 W
Depth Conductivity Temp Salinity D.O. 238.6 uS 24.3 ºC 0.1 ppt 5.43 mg/L Surface
237.1 uS 24.2 ºC 0.1 ppt 5.33 mg/L 5 ft
236.5 uS 24.2 ºC 0.1 ppt 5.32 mg/L 10 ft
236.2 uS 24.1 ºC 0.1 ppt 5.52 mg/L 15 ft
235.7 uS 24.1 ºC 0.1 ppt 5.3 mg/L 20 ft
ND uS ND ºC ND ppt ND mg/L 25 ft
ND uS ND ºC ND ppt ND mg/L 30 ft
ND uS ND ºC ND ppt ND mg/L 35 ft
ND uS ND ºC ND ppt ND mg/L 40 ft
ND uS ND ºC ND ppt ND mg/L 45 ft
366

Appendix B. (continued)
Physical Measurements Collected At Depth Site: 7 Way point: 019 Date: 5/22/2007 Latitude: 34º 21.440 N Longitude: 78º 09.949 W
Depth Conductivity Temp Salinity D.O. 269.1 uS 24.4 ºC 0.1 ppt 5.35 mg/L Surface
270 uS 24.1 ºC 0.1 ppt 5.42 mg/L 5 ft
271 uS 24 ºC 0.1 ppt 5.43 mg/L 10 ft
270.8 uS 24 ºC 0.1 ppt 5.52 mg/L 15 ft
270.9 uS 24 ºC 0.1 ppt 5.41 mg/L 20 ft
ND uS ND ºC ND ppt ND mg/L 25 ft
ND uS ND ºC ND ppt ND mg/L 30 ft
ND uS ND ºC ND ppt ND mg/L 35 ft
ND uS ND ºC ND ppt ND mg/L 40 ft
ND uS ND ºC ND ppt ND mg/L 45 ft
367

Appendix B. (continued)
Physical Measurements Collected At Depth Site: 8 Way point: 020 Date: 5/22/2007 Latitude: 34º 21.413 N Longitude: 78º 12.560 W
Depth Conductivity Temp Salinity D.O. 130.2 uS 24.4 ºC 0.1 ppt 6.05 mg/L Surface
143.3 uS 24.1 ºC 0.1 ppt 5.36 mg/L 5 ft
138.4 uS 24 ºC 0.1 ppt 5.08 mg/L 10 ft
139 uS 23.9 ºC 0.1 ppt 5.77 mg/L 15 ft
139.4 uS 23.9 ºC 0.1 ppt 5.65 mg/L 20 ft
140.6 uS 23.9 ºC 0.1 ppt 5.54 mg/L 25 ft
ND uS ND ºC ND ppt ND mg/L 30 ft
ND uS ND ºC ND ppt ND mg/L 35 ft
ND uS ND ºC ND ppt ND mg/L 40 ft
ND uS ND ºC ND ppt ND mg/L 45 ft
368

Appendix B. (continued)
Physical Measurements Collected At Depth Site: 9 Way point: 021 Date: 5/22/2007 Latitude: 34º 22.470 N Longitude: 78º 13.560 W
Depth Conductivity Temp Salinity D.O. 115.7 uS 24.8 ºC 0.1 ppt 6.61 mg/L Surface
115 uS 24.5 ºC 0.1 ppt 5.76 mg/L 5 ft
114.3 uS 24.1 ºC 0.1 ppt 5.41 mg/L 10 ft
113.7 uS 23.9 ºC 0.1 ppt 5 mg/L 15 ft
ND uS ND ºC ND ppt ND mg/L 20 ft
ND uS ND ºC ND ppt ND mg/L 25 ft
ND uS ND ºC ND ppt ND mg/L 30 ft
ND uS ND ºC ND ppt ND mg/L 35 ft
ND uS ND ºC ND ppt ND mg/L 40 ft
ND uS ND ºC ND ppt ND mg/L 45 ft
369

Appendix B. (continued)
Physical Measurements Collected At Depth Site: 10 Way point: 022 Date: 5/22/2007 Latitude: 34º 23.075 N Longitude: 78º 14.705 W
Depth Conductivity Temp Salinity D.O. 117.1 uS 25.2 ºC 0.1 ppt 6.99 mg/L Surface
116.6 uS 24.3 ºC 0.1 ppt 6.41 mg/L 5 ft
114.3 uS 23.9 ºC 0.1 ppt 6.32 mg/L 10 ft
114.2 uS 23.8 ºC 0.1 ppt 6.07 mg/L 15 ft
114.1 uS 23.4 ºC 0.1 ppt 5.65 mg/L 20 ft
ND uS ND ºC ND ppt ND mg/L 25 ft
ND uS ND ºC ND ppt ND mg/L 30 ft
ND uS ND ºC ND ppt ND mg/L 35 ft
ND uS ND ºC ND ppt ND mg/L 40 ft
ND uS ND ºC ND ppt ND mg/L 45 ft
370

Appendix B. (continued)
Physical Measurements Collected At Depth Site: 11 Way point: 023 Date: 5/22/2007 Latitude: 34º 23.824 N Longitude: 78º 16.050 W
Depth Conductivity Temp Salinity D.O. 119.1 uS 25.6 ºC 0.1 ppt 7.35 mg/L Surface
114.9 uS 24.2 ºC 0.1 ppt 6.85 mg/L 5 ft
114.4 uS 23.6 ºC 0.1 ppt 5.63 mg/L 10 ft
114.1 uS 23.5 ºC 0.1 ppt 6.05 mg/L 15 ft
114 uS 23.5 ºC 0.1 ppt 4.89 mg/L 20 ft
ND uS ND ºC ND ppt ND mg/L 25 ft
ND uS ND ºC ND ppt ND mg/L 30 ft
ND uS ND ºC ND ppt ND mg/L 35 ft
ND uS ND ºC ND ppt ND mg/L 40 ft
ND uS ND ºC ND ppt ND mg/L 45 ft
371

Appendix B. (continued)
Physical Measurements Collected At Depth Site: 12 Way point: 024 Date: 5/22/2007 Latitude: 34º 24.218 N Longitude: 78º 17.528 W
Depth Conductivity Temp Salinity D.O. 114.2 uS 24.2 ºC 0.1 ppt 6.4 mg/L Surface
113.9 uS 23.9 ºC 0.1 ppt 6.57 mg/L 5 ft
113.9 uS 23.8 ºC 0.1 ppt 6.23 mg/L 10 ft
114 uS 23.8 ºC 0.1 ppt 6.15 mg/L 15 ft
ND uS ND ºC ND ppt ND mg/L 20 ft
ND uS ND ºC ND ppt ND mg/L 25 ft
ND uS ND ºC ND ppt ND mg/L 30 ft
ND uS ND ºC ND ppt ND mg/L 35 ft
ND uS ND ºC ND ppt ND mg/L 40 ft
ND uS ND ºC ND ppt ND mg/L 45 ft
372

APPENDIX C
SALINITY PROFILES FOR ALL SITES FOR ALL COLLECTION DATES

Appendix C. (continued)
Sampling date: 8/22/2006 Site 1
River Salinity At Depth
05
101520253035404550
0 0.1 0.2
Salinity (ppt)
Dep
th (f
eet)
Salinity
Site 2
River Salinity At Depth
05
101520253035404550
0 0.1 0.2
Salinity (ppt)
Dep
th (f
eet)
Salinity
374

Appendix C. (continued)
Sampling date: 8/22/2006 Site 3
River Salinity At Depth
05
101520253035404550
0 0.1 0.2
Salinity (ppt)
Dep
th (f
eet)
Salinity
Site 4
River Salinity At Depth
05
101520253035404550
0 0.1 0.2
Salinity (ppt)
Dep
th (f
eet)
Salinity
375
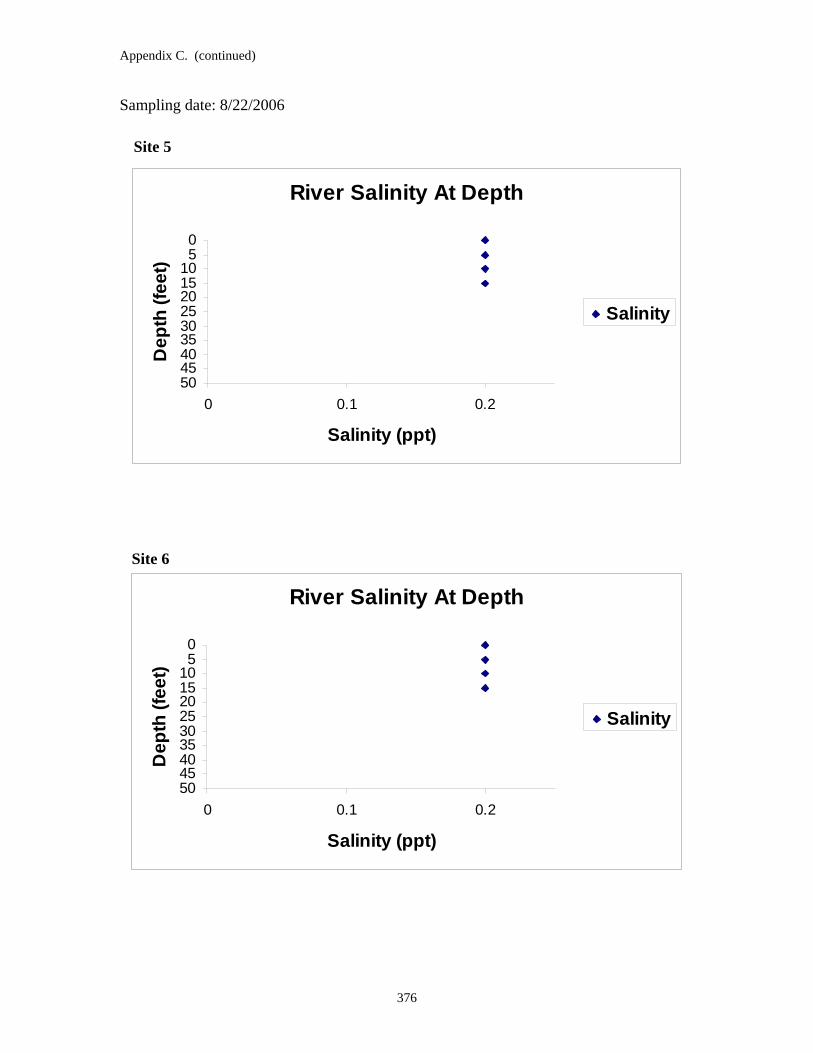
Appendix C. (continued)
Sampling date: 8/22/2006
Site 5
River Salinity At Depth
05
101520253035404550
0 0.1 0.2
Salinity (ppt)
Dep
th (f
eet)
Salinity
Site 6
River Salinity At Depth
05
101520253035404550
0 0.1 0.2
Salinity (ppt)
Dep
th (f
eet)
Salinity
376

Appendix C. (continued)
Sampling date: 8/22/2006 Site 7
River Salinity At Depth
05
101520253035404550
0 0.1 0.2
Salinity (ppt)
Dep
th (f
eet)
Salinity
Site 8
River Salinity At Depth
05
101520253035404550
0 0.1 0.2
Salinity (ppt)
Dep
th (f
eet)
Salinity
377

Appendix C. (continued)
Sampling date: 8/22/2006
Site 9
River Salinity At Depth
05
101520253035404550
0 0.1 0.2
Salinity (ppt)
Dep
th (f
eet)
Salinity
Site 10
River Salinity At Depth
05
101520253035404550
0 0.1 0.2
Salinity (ppt)
Dep
th (f
eet)
Salinity
378

Appendix C. (continued)
Sampling date: 8/22/2006 Site 11
River Salinity At Depth
05
101520253035404550
0 0.1 0.2
Salinity (ppt)
Dep
th (f
eet)
Salinity
Site 12
River Salinity At Depth
05
101520253035404550
0 0.1 0.2
Salinity (ppt)
Dep
th (f
eet)
Salinity
379

Appendix C. (continued)
Sampling date: 9/16/2006 Site 1
River Salinity At Depth
05
101520253035404550
0 0.1 0.2
Salinity (ppt)
Dep
th (f
eet)
Salinity
Site 2
River Salinity At Depth
05
101520253035404550
0 0.1 0.2
Salinity (ppt)
Dep
th (f
eet)
Salinity
380

Appendix C. (continued)
Sampling date: 9/16/2006 Site 3
River Salinity At Depth
05
101520253035404550
0 0.1 0.2
Salinity (ppt)
Dep
th (f
eet)
Salinity
Site 4
River Salinity At Depth
05
101520253035404550
0 0.1 0.2
Salinity (ppt)
Dep
th (f
eet)
Salinity
381
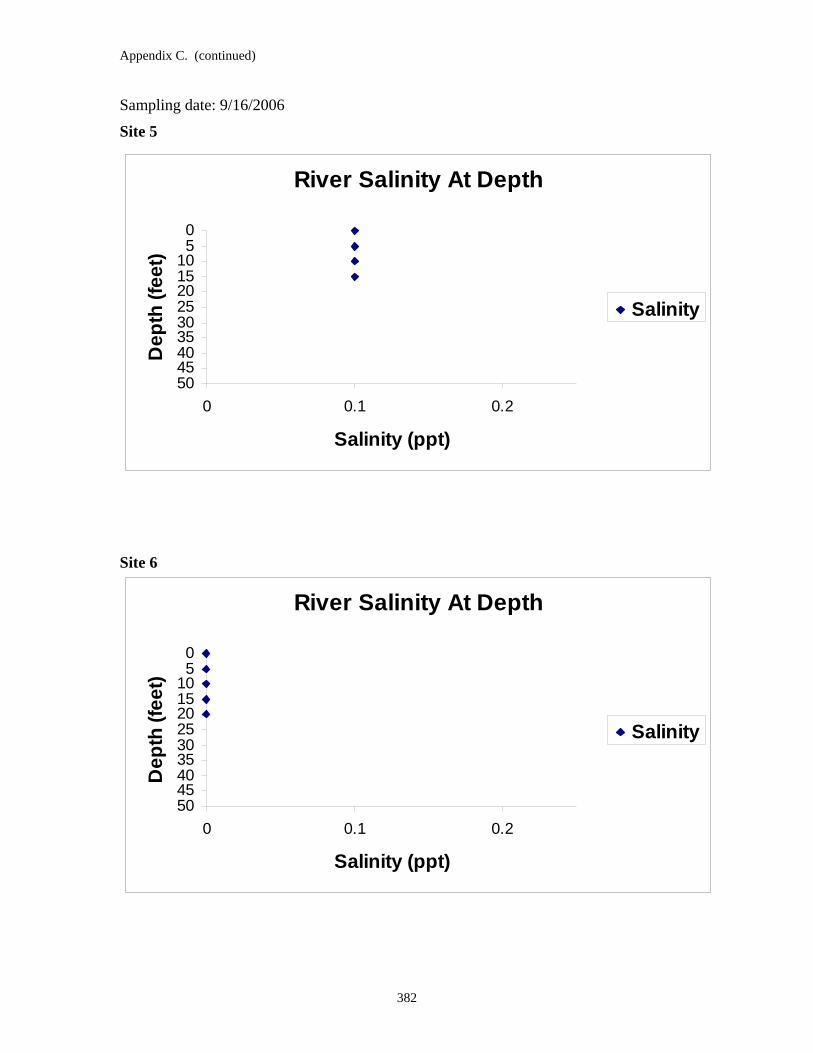
Appendix C. (continued)
Sampling date: 9/16/2006
Site 5
River Salinity At Depth
05
101520253035404550
0 0.1 0.2
Salinity (ppt)
Dep
th (f
eet)
Salinity
Site 6
River Salinity At Depth
05
101520253035404550
0 0.1 0.2
Salinity (ppt)
Dep
th (f
eet)
Salinity
382

Appendix C. (continued)
Sampling date: 9/16/2006 Site 7
River Salinity At Depth
05
101520253035404550
0 0.1 0.2
Salinity (ppt)
Dep
th (f
eet)
Salinity
Site 8
River Salinity At Depth
05
101520253035404550
0 0.1 0.2
Salinity (ppt)
Dep
th (f
eet)
Salinity
383

Appendix C. (continued)
Sampling date: 9/16/2006
Site 9
River Salinity At Depth
05
101520253035404550
0 0.1 0.2
Salinity (ppt)
Dep
th (f
eet)
Salinity
Site 10
River Salinity At Depth
05
101520253035404550
0 0.1 0.2
Salinity (ppt)
Dep
th (f
eet)
Salinity
384

Appendix C. (continued)
Sampling date: 9/16/2006 Site 11
River Salinity At Depth
05
101520253035404550
0 0.1 0.2
Salinity (ppt)
Dep
th (f
eet)
Salinity
Site 12
River Salinity At Depth
05
101520253035404550
0 0.1 0.2
Salinity (ppt)
Dep
th (f
eet)
Salinity
385
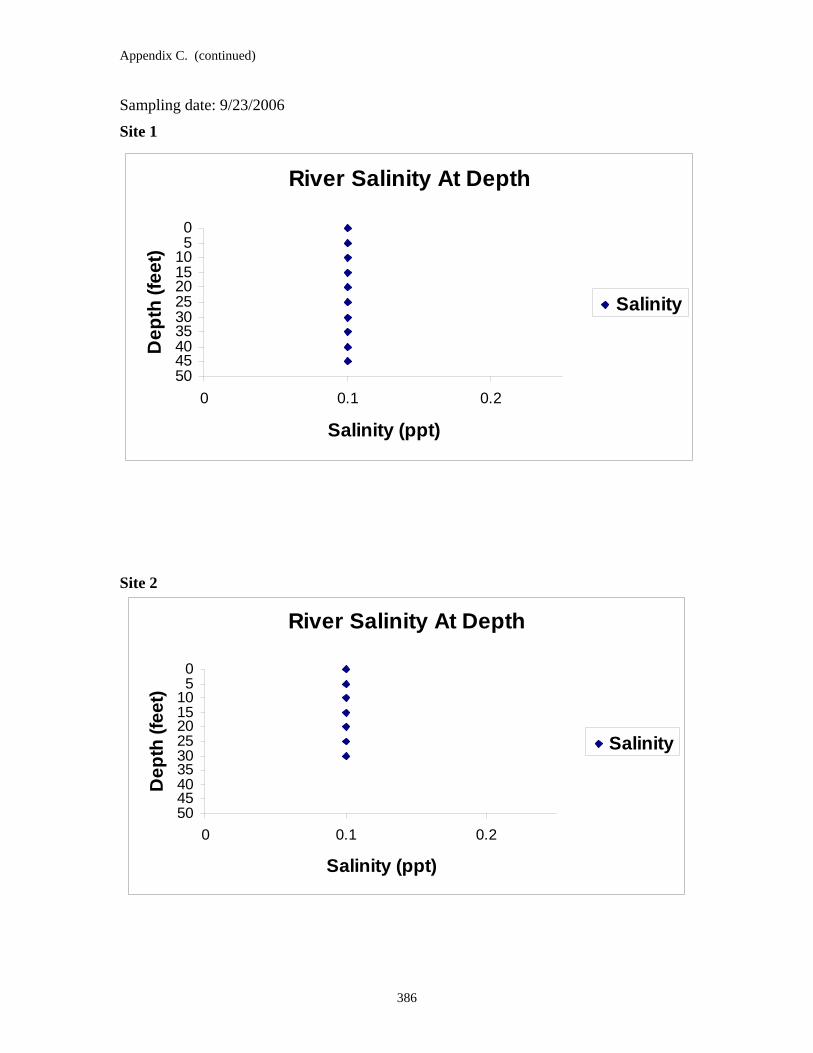
Appendix C. (continued)
Sampling date: 9/23/2006 Site 1
River Salinity At Depth
05
101520253035404550
0 0.1 0.2
Salinity (ppt)
Dep
th (f
eet)
Salinity
Site 2
River Salinity At Depth
05
101520253035404550
0 0.1 0.2
Salinity (ppt)
Dep
th (f
eet)
Salinity
386

Appendix C. (continued)
Sampling date: 9/23/2006 Site 3
River Salinity At Depth
05
101520253035404550
0 0.1 0.2
Salinity (ppt)
Dep
th (f
eet)
Salinity
Site 4
River Salinity At Depth
05
101520253035404550
0 0.1 0.2
Salinity (ppt)
Dep
th (f
eet)
Salinity
387

Appendix C. (continued)
Sampling date: 9/23/2006
Site 5
River Salinity At Depth
05
101520253035404550
0 0.1 0.2
Salinity (ppt)
Dep
th (f
eet)
Salinity
Site 6
River Salinity At Depth
05
101520253035404550
0 0.1 0.2
Salinity (ppt)
Dep
th (f
eet)
Salinity
388

Appendix C. (continued)
Sampling date: 9/23/2006 Site 7
River Salinity At Depth
05
101520253035404550
0 0.1 0.2
Salinity (ppt)
Dep
th (f
eet)
Salinity
Site 8
River Salinity At Depth
05
101520253035404550
0 0.1 0.2
Salinity (ppt)
Dep
th (f
eet)
Salinity
389

Appendix C. (continued)
Sampling date: 9/23/2006
Site 9
River Salinity At Depth
05
101520253035404550
0 0.1 0.2
Salinity (ppt)
Dep
th (f
eet)
Salinity
Site 10
River Salinity At Depth
05
101520253035404550
0 0.1 0.2
Salinity (ppt)
Dep
th (f
eet)
Salinity
390

Appendix C. (continued)
Sampling date: 9/23/2006 Site 11
River Salinity At Depth
05
101520253035404550
0 0.1 0.2
Salinity (ppt)
Dep
th (f
eet)
Salinity
Site 12
River Salinity At Depth
05
101520253035404550
0 0.1 0.2
Salinity (ppt)
Dep
th (f
eet)
Salinity
391

Appendix C. (continued)
Sampling date: 10/07/2006 Site 1
River Salinity At Depth
05
101520253035404550
0 0.1 0.2
Salinity (ppt)
Dep
th (f
eet)
Salinity
Site 2
River Salinity At Depth
05
101520253035404550
0 0.1 0.2
Salinity (ppt)
Dep
th (f
eet)
Salinity
392

Appendix C. (continued)
Sampling date: 10/07/2006 Site 3
River Salinity At Depth
05
101520253035404550
0 0.1 0.2
Salinity (ppt)
Dep
th (f
eet)
Salinity
Site 4
River Salinity At Depth
05
101520253035404550
0 0.1 0.2
Salinity (ppt)
Dep
th (f
eet)
Salinity
393

Appendix C. (continued)
Sampling date: 10/07/2006
Site 5
River Salinity At Depth
05
101520253035404550
0 0.1 0.2
Salinity (ppt)
Dep
th (f
eet)
Salinity
Site 6
River Salinity At Depth
05
101520253035404550
0 0.1 0.2
Salinity (ppt)
Dep
th (f
eet)
Salinity
394

Appendix C. (continued)
Sampling date: 10/07/2006 Site 7
River Salinity At Depth
05
101520253035404550
0 0.1 0.2
Salinity (ppt)
Dep
th (f
eet)
Salinity
Site 8
River Salinity At Depth
05
101520253035404550
0 0.1 0.2
Salinity (ppt)
Dep
th (f
eet)
Salinity
395

Appendix C. (continued)
Sampling date: 10/07/2006
Site 9
River Salinity At Depth
05
101520253035404550
0 0.1 0.2
Salinity (ppt)
Dep
th (f
eet)
Salinity
Site 10
River Salinity At Depth
05
101520253035404550
0 0.1 0.2
Salinity (ppt)
Dep
th (f
eet)
Salinity
396

Appendix C. (continued)
Sampling date: 10/07/2006 Site 11
River Salinity At Depth
05
101520253035404550
0 0.1 0.2
Salinity (ppt)
Dep
th (f
eet)
Salinity
Site 12
River Salinity At Depth
05
101520253035404550
0 0.1 0.2
Salinity (ppt)
Dep
th (f
eet)
Salinity
397

Appendix C. (continued)
Sampling date: 10/21/2006 Site 1
River Salinity At Depth
05
101520253035404550
0 0.1 0.2
Salinity (ppt)
Dep
th (f
eet)
Salinity
Site 2
River Salinity At Depth
05
101520253035404550
0 0.1 0.2
Salinity (ppt)
Dep
th (f
eet)
Salinity
398
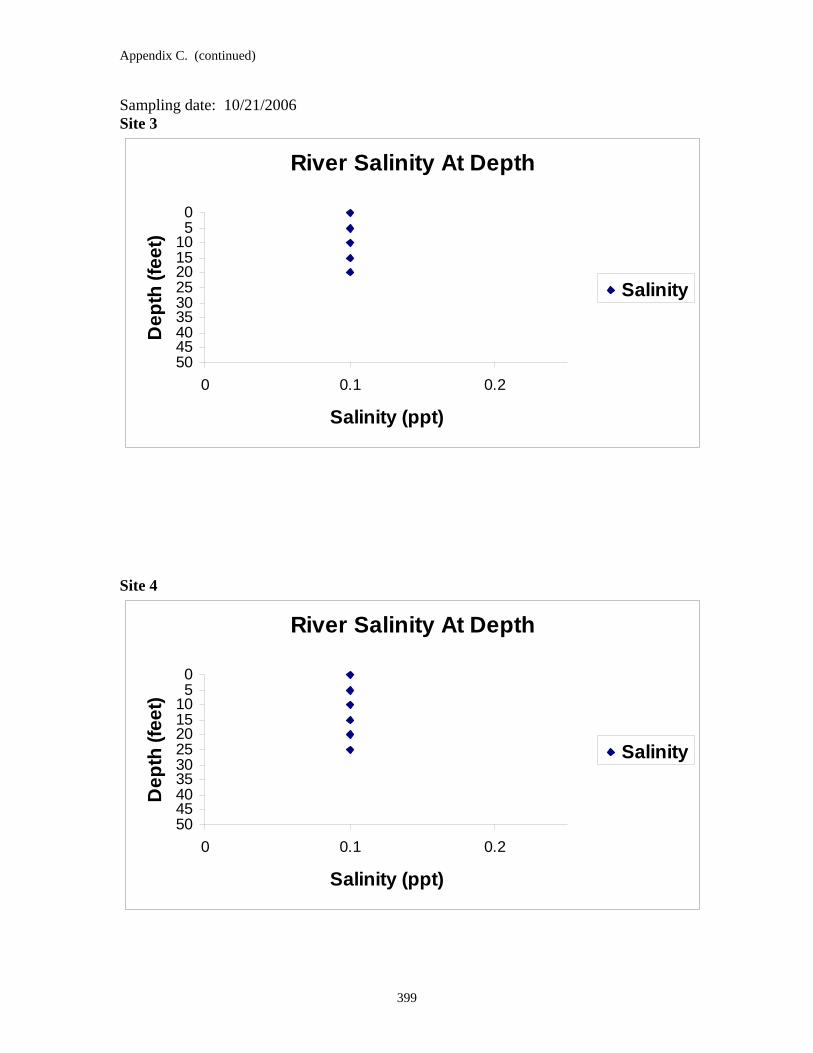
Appendix C. (continued)
Sampling date: 10/21/2006 Site 3
River Salinity At Depth
05
101520253035404550
0 0.1 0.2
Salinity (ppt)
Dep
th (f
eet)
Salinity
Site 4
River Salinity At Depth
05
101520253035404550
0 0.1 0.2
Salinity (ppt)
Dep
th (f
eet)
Salinity
399

Appendix C. (continued)
Sampling date: 10/21/2006 Site 5
River Salinity At Depth
05
101520253035404550
0 0.1 0.2
Salinity (ppt)
Dep
th (f
eet)
Salinity
Site 6
River Salinity At Depth
05
101520253035404550
0 0.1 0.2
Salinity (ppt)
Dep
th (f
eet)
Salinity
400

Appendix C. (continued)
Sampling date: 10/21/2006 Site 7
River Salinity At Depth
05
101520253035404550
0 0.1 0.2
Salinity (ppt)
Dep
th (f
eet)
Salinity
Site 8
River Salinity At Depth
05
101520253035404550
0 0.1 0.2
Salinity (ppt)
Dep
th (f
eet)
Salinity
401

Appendix C. (continued)
Sampling date: 10/21/2006 Site 9
River Salinity At Depth
05
101520253035404550
0 0.1 0.2
Salinity (ppt)
Dep
th (f
eet)
Salinity
Site 10
River Salinity At Depth
05
101520253035404550
0 0.1 0.2
Salinity (ppt)
Dep
th (f
eet)
Salinity
402

Appendix C. (continued)
Sampling date: 10/21/2006 Site 11
River Salinity At Depth
05
101520253035404550
0 0.1 0.2
Salinity (ppt)
Dep
th (f
eet)
Salinity
Site 12
River Salinity At Depth
05
101520253035404550
0 0.1 0.2
Salinity (ppt)
Dep
th (f
eet)
Salinity
403

Appendix C. (continued)
Sampling date: 12/16/2006 Site 1
River Salinity At Depth
05
101520253035404550
0 0.1 0.2
Salinity (ppt)
Dep
th (f
eet)
Salinity
Site 2
River Salinity At Depth
05
101520253035404550
0 0.1 0.2
Salinity (ppt)
Dep
th (f
eet)
Salinity
404

Appendix C. (continued)
Sampling date: 12/16/2006 Site 3
River Salinity At Depth
05
101520253035404550
0 0.1 0.2
Salinity (ppt)
Dep
th (f
eet)
Salinity
Site 4
River Salinity At Depth
05
101520253035404550
0 0.1 0.2
Salinity (ppt)
Dep
th (f
eet)
Salinity
405

Appendix C. (continued)
Sampling date: 12/16/2006 Site 5
River Salinity At Depth
05
101520253035404550
0 0.1 0.2
Salinity (ppt)
Dep
th (f
eet)
Salinity
Site 6
River Salinity At Depth
05
101520253035404550
0 0.1 0.2
Salinity (ppt)
Dep
th (f
eet)
Salinity
406

Appendix C. (continued)
Sampling date: 12/16/2006 Site 7
River Salinity At Depth
05
101520253035404550
0 0.1 0.2
Salinity (ppt)
Dep
th (f
eet)
Salinity
Site 8
River Salinity At Depth
05
101520253035404550
0 0.1 0.2
Salinity (ppt)
Dep
th (f
eet)
Salinity
407

Appendix C. (continued)
Sampling date: 12/16/2006 Site 9
River Salinity At Depth
05
101520253035404550
0 0.1 0.2
Salinity (ppt)
Dep
th (f
eet)
Salinity
Site 10
River Salinity At Depth
05
101520253035404550
0 0.1 0.2
Salinity (ppt)
Dep
th (f
eet)
Salinity
408

Appendix C. (continued)
Sampling date: 12/16/2006 Site 11
River Salinity At Depth
05
101520253035404550
0 0.1 0.2
Salinity (ppt)
Dep
th (f
eet)
Salinity
Site 12
River Salinity At Depth
05
101520253035404550
0 0.1 0.2
Salinity (ppt)
Dep
th (f
eet)
Salinity
409

Appendix C. (continued)
Sampling date: 12/19/2006 Site 1
River Salinity At Depth
05
101520253035404550
0 0.1 0.2
Salinity (ppt)
Dep
th (f
eet)
Salinity
Site 2
River Salinity At Depth
05
101520253035404550
0 0.1 0.2
Salinity (ppt)
Dep
th (f
eet)
Salinity
410

Appendix C. (continued)
Sampling date: 12/19/2006 Site 3
River Salinity At Depth
05
101520253035404550
0 0.1 0.2
Salinity (ppt)
Dep
th (f
eet)
Salinity
Site 4
River Salinity At Depth
05
101520253035404550
0 0.1 0.2
Salinity (ppt)
Dep
th (f
eet)
Salinity
411

Appendix C. (continued)
Sampling date: 12/19/2006 Site 5
River Salinity At Depth
05
101520253035404550
0 0.1 0.2
Salinity (ppt)
Dep
th (f
eet)
Salinity
Site 6
River Salinity At Depth
05
101520253035404550
0 0.1 0.2
Salinity (ppt)
Dep
th (f
eet)
Salinity
412

Appendix C. (continued)
Sampling date: 12/19/2006 Site 7
River Salinity At Depth
05
101520253035404550
0 0.1 0.2
Salinity (ppt)
Dep
th (f
eet)
Salinity
Site 8
River Salinity At Depth
05
101520253035404550
0 0.1 0.2
Salinity (ppt)
Dep
th (f
eet)
Salinity
413

Appendix C. (continued)
Sampling date: 12/19/2006 Site 9
River Salinity At Depth
05
101520253035404550
0 0.1 0.2
Salinity (ppt)
Dep
th (f
eet)
Salinity
Site 10
River Salinity At Depth
05
101520253035404550
0 0.1 0.2
Salinity (ppt)
Dep
th (f
eet)
Salinity
414

Appendix C. (continued)
Sampling date: 12/19/2006 Site 11
River Salinity At Depth
05
101520253035404550
0 0.1 0.2
Salinity (ppt)
Dep
th (f
eet)
Salinity
Site 12
River Salinity At Depth
05
101520253035404550
0 0.1 0.2
Salinity (ppt)
Dep
th (f
eet)
Salinity
415

Appendix C. (continued)
Sampling date: 1/06/2007 Site 1
River Salinity At Depth
05
101520253035404550
0 0.1 0.2
Salinity (ppt)
Dep
th (f
eet)
Salinity
Site 2
River Salinity At Depth
05
101520253035404550
0 0.1 0.2
Salinity (ppt)
Dep
th (f
eet)
Salinity
416

Appendix C. (continued)
Sampling date: 1/06/2007 Site 3
River Salinity At Depth
05
101520253035404550
0 0.1 0.2
Salinity (ppt)
Dep
th (f
eet)
Salinity
Site 4
River Salinity At Depth
05
101520253035404550
0 0.1 0.2
Salinity (ppt)
Dep
th (f
eet)
Salinity
417

Appendix C. (continued)
Sampling date: 1/06/2007 Site 5
River Salinity At Depth
05
101520253035404550
0 0.1 0.2
Salinity (ppt)
Dep
th (f
eet)
Salinity
Site 6
River Salinity At Depth
05
101520253035404550
0 0.1 0.2
Salinity (ppt)
Dep
th (f
eet)
Salinity
418

Appendix C. (continued)
Sampling date: 1/06/2007 Site 7
River Salinity At Depth
05
101520253035404550
0 0.1 0.2
Salinity (ppt)
Dep
th (f
eet)
Salinity
Site 8
River Salinity At Depth
05
101520253035404550
0 0.1 0.2
Salinity (ppt)
Dep
th (f
eet)
Salinity
419

Appendix C. (continued)
Sampling date: 1/06/2007 Site 9
River Salinity At Depth
05
101520253035404550
0 0.1 0.2
Salinity (ppt)
Dep
th (f
eet)
Salinity
Site 10
River Salinity At Depth
05
101520253035404550
0 0.1 0.2
Salinity (ppt)
Dep
th (f
eet)
Salinity
420

Appendix C. (continued)
Sampling date: 1/06/2007 Site 11
River Salinity At Depth
05
101520253035404550
0 0.1 0.2
Salinity (ppt)
Dep
th (f
eet)
Salinity
Site 12
River Salinity At Depth
05
101520253035404550
0 0.1 0.2
Salinity (ppt)
Dep
th (f
eet)
Salinity
421
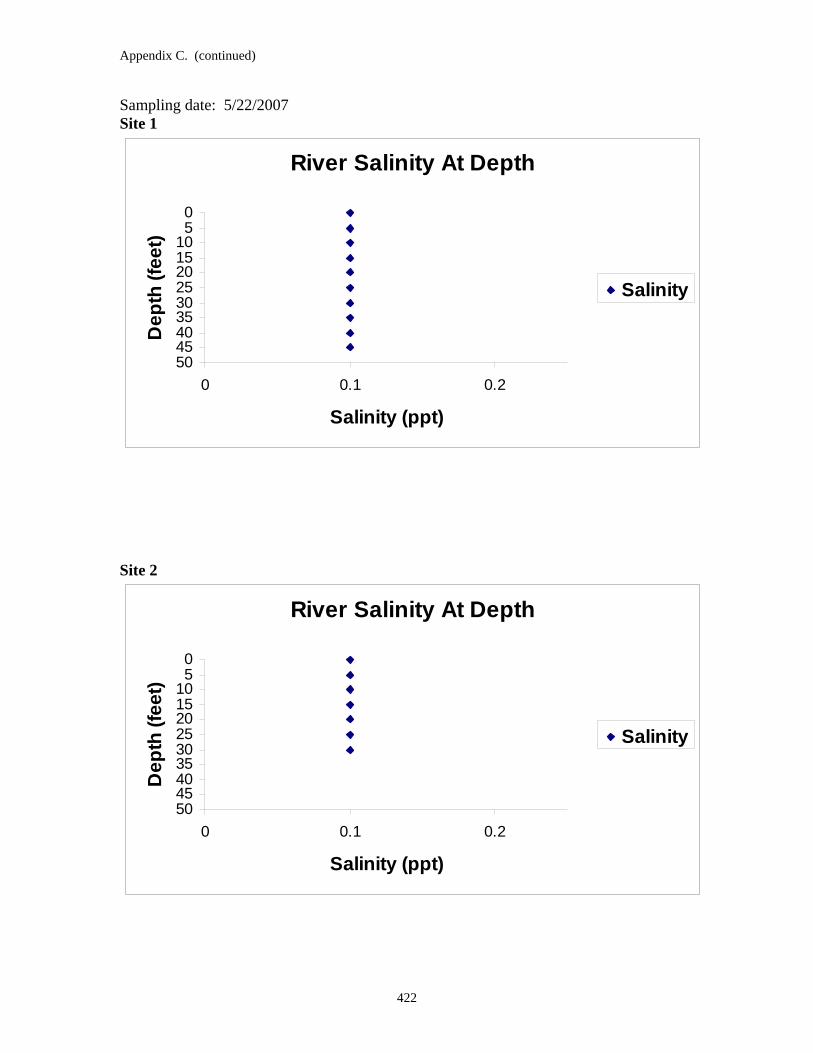
Appendix C. (continued)
Sampling date: 5/22/2007 Site 1
River Salinity At Depth
05
101520253035404550
0 0.1 0.2
Salinity (ppt)
Dep
th (f
eet)
Salinity
Site 2
River Salinity At Depth
05
101520253035404550
0 0.1 0.2
Salinity (ppt)
Dep
th (f
eet)
Salinity
422

Appendix C. (continued)
Sampling date: 5/22/2007 Site 3
River Salinity At Depth
05
101520253035404550
0 0.1 0.2
Salinity (ppt)
Dep
th (f
eet)
Salinity
Site 4
River Salinity At Depth
05
101520253035404550
0 0.1 0.2
Salinity (ppt)
Dep
th (f
eet)
Salinity
423

Appendix C. (continued)
Sampling date: 5/22/2007 Site 5
River Salinity At Depth
05
101520253035404550
0 0.1 0.2
Salinity (ppt)
Dep
th (f
eet)
Salinity
Site 6
River Salinity At Depth
05
101520253035404550
0 0.1 0.2
Salinity (ppt)
Dep
th (f
eet)
Salinity
424

Appendix C. (continued)
Sampling date: 5/22/2007 Site 7
River Salinity At Depth
05
101520253035404550
0 0.1 0.2
Salinity (ppt)
Dep
th (f
eet)
Salinity
Site 8
River Salinity At Depth
05
101520253035404550
0 0.1 0.2
Salinity (ppt)
Dep
th (f
eet)
Salinity
425
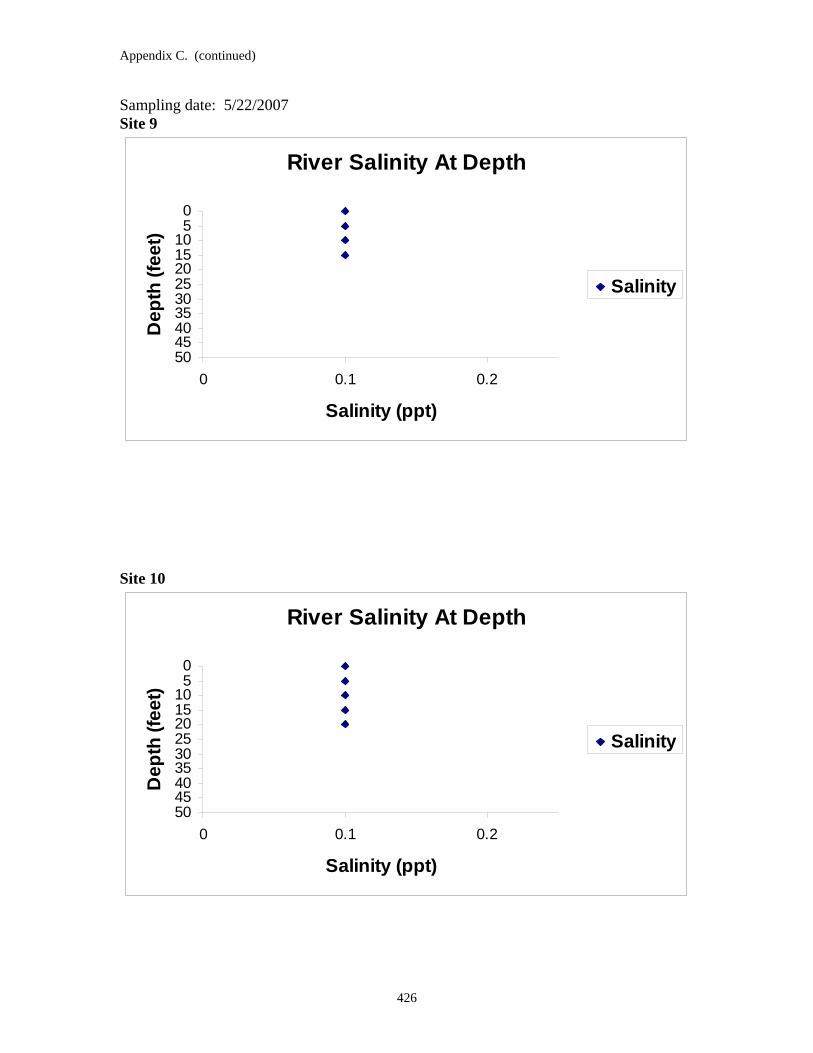
Appendix C. (continued)
Sampling date: 5/22/2007 Site 9
River Salinity At Depth
05
101520253035404550
0 0.1 0.2
Salinity (ppt)
Dep
th (f
eet)
Salinity
Site 10
River Salinity At Depth
05
101520253035404550
0 0.1 0.2
Salinity (ppt)
Dep
th (f
eet)
Salinity
426

Appendix C. (continued)
Site 11
River Salinity At Depth
05
101520253035404550
0 0.1 0.2
Salinity (ppt)
Dep
th (f
eet)
Salinity
Site 12
River Salinity At Depth
05
101520253035404550
0 0.1 0.2
Salinity (ppt)
Dep
th (f
eet)
Salinity
427

APPENDIX D
LIST OF SPECIES, COMMON NAMES AND AUTHORITIES FOR PLANTS SEEN IN
OR NEAR POLYGONS AT SAMPLING STATIONS IN THE CAPE FEAR RIVER ESTUARY,
WILMINGTON HARBOR MONITORING PROJECT, NORTH CAROLINA
428

Appendix D. List of Plant Species A list of plant species used in text and tables with accompanying authorities and common names follows. Both common and scientific names for vascular plants follow Kartesz and Meachum 2005. Species considered sensitive herbaceous species are marked with an asterisk (*). The list is cumulative for the project. Acer rubrum L. Red Maple *Alternanthera philoxeroides (Mart.) Griseb. Alligator-Weed Amaranthus cannabinus (L.)Sauer Tidal-Marsh Amaranth Apios americana Medik. Groundnut *Aster sp. Probably Symphyotrichum elliottii. Bidens laevis (L.)B.S.P. Smooth Beggarticks Bidens mitis (Michx.)Sherff. Small-furit Beggarticks *Bidens laevis (L.)Britton Smooth Beggarticks Bidens sp. Beggarticks *Boehmeria cylindrica (L.) Sw. Small-Spike False Nettle *Boltonia asteroides (L.) L’Hér. White Doll’s-Daisy Campsis radicans (L.) Seem. Ex Bureau Trumpet-Creeper *Carex L. Sedge Carex amphibole Steud. Eastern narrow-leaf Sedge *Carex crinita Lam. Fringed Sedge *Carex crinita var. brevicrinis Fern. Fringed Sedge *Carex crus-corvi Shuttlw. Ex Kunze Raven-Foot Sedge *Carex hyalinolepis Steud. Shoreline Sedge Carex leptalea Wahlenb. Bristly-stalk Sedge *Carex lupulina Muhl. Ex Willd. Hop Sedge *Chasmanthium latifolium (Michx.) Yates Indian Wood-Oats *Cicuta maculata L. Spotted Water-Hemlock *Cinna arundinacea L. Sweet Wood-Reed *Commelina virginica L. Virginia Dayflower *Cyperus L. Umbrella Sedge *Decodon verticillatus (L.) Ell. Swamp-Loosestrife *Dulichium arundinaceum (L.) Britt. Three-Way Sedge *Elymus virginicus L. Virginia Wild Rye *Eryngium aquaticum L. Rattlesnake-Master Fraxinus caroliniana P. Mill. Carolina Ash Fraxinus pennsylvanica Marsh. Green Ash Fraxinus profunda (Bush) Bush Pumpkin Ash *Galium L. Bedstraw Hydrocotyle L. Marsh-Pennywort *Hydrocotyle verticillata Thunb. Whorled Marsh-Pennywort *Hymenocallis floridana (Raf.) Morton Florida Spider-Lily Hypericum mutilum L. Dwarf St. John’s-Wort Impatiens capensis Meerb. Spotted Touch-Me-Not Ipomoea L. Morning-Glory Lilaeopsis chinensis (L.) Kuntze Eastern Grasswort *Lobelia cardinalis L. Cardinal-Flower *Ludwigia grandiflora (M. Micheli) Greuter & Burdet Large-Flower Primrose-Willow *Ludwigia palustris (L.) Ell. Marsh Primrose-Willow *Lycopus virginicus L. Virginia Water-Horehound *Mikania scandens (L.) Willd. Climbing Hempvine Murdannia keisak (Hassk.) Hand.-Maz. Wart-Removing-Herb Nyssa aquatica L. Water Tupelo Nyssa biflora Walt. Swamp Tupelo Oenothera fruticosa ssp. glauca (Michx.) Straley Narrow-leaf Evening Primrose
429

Appendix D. (continued)
*Orontium aquaticum L. Goldenclub Osmunda regalis L. Gray Royal Fern Packera glabella (Poir.) C. Jeffrey Cress-Leaf Groundsel *Peltandra virginica (L.) Schott Green Arrow-Arum *Phanopyrum gymnocarpon (Ell.) Nash Savannah-Panic Grass Physostegia leptophylla Small Slender-Leaf False Dragonhead Pilea pumila (L.) Gray Canadian Clearweed Platanthera flava (L.) Lindley Pluchea odorata (L.) Cass. Sweetscent Polygonum arifolium L. Halberd-Leaf Tearthumb *Polygonum hydropiper L. Mild Water-Pepper *Polygonum hydropiperoides Michx. Swamp Smartweed *Polygonum punctatum Ell. Dotted Smartweed *Polygonum virginianum L. Jumpseed *Pontederia cordata L. Pickerelweed Porella pinnata L Leafy Liverwort Proserpinaca palustris L. Marsh Mermaidweed *Rhynchospora corniculata (Lam.) Gray Short-Bristle Horned Beak Sedge *Rhynchospora inundata (Oakes) Fern. Narrow-Fruit Horned Beak Sedge Rosa palustris Marsh. Swamp Rose *Rumex verticillatus L. Swamp Dock *Sagittaria lancifolia L. Bull-Tongue Arrowhead *Saururus cernuus L. Lizard’s-Tail *Scutellaria lateriflora L. Mad Dog Skullcap *Schoenoplectus americanus (Pers.) Volk. Ex Schinz & R. Keller Chairmaker’s Club-Rush Schoenoplectus robustus (Pursh) M.T. Strong Seaside Club-Rush Schoenoplectus tabernaemontani (K.C. Gmel.) Palla Soft-Stem Club-Rush *Sium suave Walt. Hemlock Water-Parsnip Smilax rotundifolia L. Horsebrier Solidago sempervirens var. mexicana (L.) Fern. Seaside Goldenrod Spartina cynosuroides (L.) Roth Big Cord Grass *Symphyotrichum elliottii (Torr. & Gray) Nesom Marsh American-Aster Symphyotrichum subulatum (Michx.) Nesom Seaside American-Aster Symphyotrichum tenuifolium (L.) Nesom Perennial Saltmarsh American-Aster Taxodium ascendens Brongn. Pond-Cypress Toxicodendron radicans (L.) Kuntze Eastern Poison-Ivy *Triadenum walteri (J.G. Gmel.) Gleason Greater Marsh-St. John’s-Wort *Typha latifolia L. Broad-Leaf Cat-Tail Typha angustifolia L. Narrow-Leaf Cat-Tail Typha ×glauca Godr. (pro sp.) *Zizania aquatica L. Indian Wild Rice *Zizaniopsis miliacea (Michx.) Doell & Aschers. Marsh-Millet Literature Cited Kartesz, J.T., and C.A. Meacham. 2005. Synthesis of the North American Flora, Prepublication Version 2.0. Missouri Botanical Garden Press, St. Louis.
430

APPENDIX E
METADATA COVERING GIS/GPS FILES USED IN TEXT FIGURES IN SENSITIVE HERBACEOUS
VEGETATION POLYGONS: 2006 ASSESSMENTS AT SEVEN STATIONS ESTABLISHED FOR THE
WILMINGTON HARBOR MONITORING PROJECT IN THE CAPE FEAR RIVER ESTUARY,
NORTH CAROLINA
431

Appendix E. (continued)
METADATA
POSITIONS OF MONITORING STATION COMPONENTS AND SENSITIVE HERBACEOUS PLANT SPECIES POLYGONS WITHIN THE BELT TRANSECT
AT MONITORING STATION P3, INNER TOWN CREEK
FIGURE 8.41-1
CAPE FEAR RIVER ESTUARY, WILMINGTON HARBOR MONITORING PROJECT, NORTH CAROLINA
FILE NAMES: 13ben.shp 13ben.dbf 13ben.shx DESCRIPTION OF LAYER: Point depicting concrete benchmark
SOURCE: Trimble PRO XRS GPS Unit DATA TYPE: Point SOFTWARE: Pathfinder Office 2.1 and Arcview version 3.2 DATUM: North American Datum (NAD) 1983 COORDINATE SYSTEM: U.S. State Plane 1983 REGION: North Carolina 3200 UNITS OF MEASURE: Feet DATA COLLECTION: 20 December 2000
SOURCE: CZR Incorporated SOURCE CONTACT: Samuel Cooper SOURCE ADDRESS: 4709 College Acres, Suite 2 Wilmington, NC 28403 SOURCE PHONE: 910/392-9253 SOURCE FAX: 910/392-9139
FILE NAMES: 13pil.shp 13pil.dbf 13pil.shx DESCRIPTION OF LAYER: Point depicting data collect platform piling
SOURCE: Trimble PRO XRS GPS Unit DATA TYPE: Point SOFTWARE: Pathfinder Office 2.1 and Arcview version 3.2 DATUM: North American Datum (NAD) 1983 COORDINATE SYSTEM: U.S. State Plane 1983 REGION: North Carolina 3200 UNITS OF MEASURE: Feet DATA COLLECTION: 20 December 2000
SOURCE: CZR Incorporated SOURCE CONTACT: Samuel Cooper SOURCE ADDRESS: 4709 College Acres, Suite 2 Wilmington, NC 28403 SOURCE PHONE: 910/392-9253 SOURCE FAX: 910/392-9139
432

Appendix E. (continued)
METADATA
POSITIONS OF MONITORING STATION COMPONENTS AND SENSITIVE HERBACEOUS PLANT SPECIES POLYGONS WITHIN THE BELT TRANSECT
AT MONITORING STATION P3, INNER TOWN CREEK
FIGURE 8.41-1
CAPE FEAR RIVER ESTUARY, WILMINGTON HARBOR MONITORING PROJECT, NORTH CAROLINA
FILE NAMES: 13poly.shp 13poly.dbf 13poly.shx DESCRIPTION OF LAYER: Polygon depicting sensitive herbaceous plants, 2000
(13poly.ssf GPS file from CZR Incorporated) SOURCE: Trimble PRO XRS GPS Unit DATA TYPE: Polygon SOFTWARE: Pathfinder Office 2.1 and Arcview version 3.2 DATUM: North American Datum (NAD) 1983 COORDINATE SYSTEM: U.S. State Plane 1983 REGION: North Carolina 3200 UNITS OF MEASURE: Feet DATA COLLECTION: 20 December 2000
SOURCE: CZR Incorporated SOURCE CONTACT: Samuel Cooper SOURCE ADDRESS: 4709 College Acres, Suite 2 Wilmington, NC 28403 SOURCE PHONE: 910/392-9253 SOURCE FAX: 910/392-9139
FILE NAMES: 13sub.shp 13sub.dbf 13sub.shx DESCRIPTION OF LAYER: Points depicting substation survey points
SOURCE: Trimble PRO XRS GPS Unit DATA TYPE: Points SOFTWARE: Pathfinder Office 2.1 and Arcview version 3.2 DATUM: North American Datum (NAD) 1983 COORDINATE SYSTEM: U.S. State Plane 1983 REGION: North Carolina 3200 UNITS OF MEASURE: Feet DATA COLLECTION: 20 December 2000
SOURCE: CZR Incorporated SOURCE CONTACT: Samuel Cooper SOURCE ADDRESS: 4709 College Acres, Suite 2 Wilmington, NC 28403 SOURCE PHONE: 910/392-9253 SOURCE FAX: 910/392-9139
433

Appendix E. (continued)
METADATA
POSITIONS OF MONITORING STATION COMPONENTS AND SENSITIVE HERBACEOUS PLANT SPECIES POLYGONS WITHIN THE BELT TRANSECT
AT MONITORING STATION P3, INNER TOWN CREEK
FIGURE 8.41-1
CAPE FEAR RIVER ESTUARY, WILMINGTON HARBOR MONITORING PROJECT, NORTH CAROLINA
FILE NAMES: site9.tif DESCRIPTION OF LAYER: True color aerial photography was flown on
March 25, 2000 at an altitude of 1500 feet.
SOURCE: Wild RC20 Aerial Mapping Camera Scale: 1” = 250’ Resolution: 1100 DPI (23.1 microns) DATA TYPE: The image source consisted of color contact prints and
diapositives were created and the negative film then digitally scanned on a Vexcell 4000 to create raw digital images to be rectified and produce digital orthophotos. This produced an original raw pixel size of .2272’ based on the scale of the negative film.
SOFTWARE: Tif/Tfw file format DATUM: North American Datum (NAD) 1983 COORDINATE SYSTEM: U.S. State Plane 1983 REGION: North Carolina 3200 UNITS OF MEASURE: Feet DATA COLLECTION: 25 March 2000
SOURCE: 3Di, LLC Wilmington NC, Office SOURCE CONTACT: Scott C. Williams, PLS SOURCE ADDRESS: 2704-A Exchange Drive Wilmington, NC 28405 SOURCE PHONE: 910/392-1496 SOURCE FAX: 910/392-7326
434

Appendix E. (continued)
METADATA
POSITIONS OF MONITORING STATION COMPONENTS AND SENSITIVE HERBACEOUS PLANT SPECIES POLYGONS WITHIN THE BELT TRANSECT
AT MONITORING STATION P3, TOWN CREEK
FIGURE 8.41-1
CAPE FEAR RIVER ESTUARY, WILMINGTON HARBOR MONITORING PROJECT, NORTH CAROLINA
FILE NAMES: 13tra.shp 13tra.dbf 13tra.shx DESCRIPTION OF LAYER: Points depicting belt transect markers
SOURCE: Trimble PRO XRS GPS Unit DATA TYPE: Points SOFTWARE: Pathfinder Office 2.1 and Arcview version 3.2 DATUM: North American Datum (NAD) 1983 COORDINATE SYSTEM: U.S. State Plane 1983 REGION: North Carolina 3200 UNITS OF MEASURE: Feet DATA COLLECTION: 20 December 2000
SOURCE: CZR Incorporated SOURCE CONTACT: Samuel Cooper SOURCE ADDRESS: 4709 College Acres, Suite 2 Wilmington, NC 28403 SOURCE PHONE: 910/392-9253 SOURCE FAX: 910/392-9139
FILE NAMES: itcpol05 .shp, .dbf, .shx DESCRIPTION OF LAYER: Polygon depicting sensitive herbaceous plants, 2005
SOURCE: Trimble PRO XRS GPS Unit DATA TYPE: Polygon from points SOFTWARE: Pathfinder Office 2.9 and Arcview 3.3 DATUM: North American Datum (NAD) 1983 COORDINATE SYSTEM: U.S. State Plane 1983 REGION: North Carolina 3200 UNITS OF MEASURE: Feet DATA COLLECTION: 10 Jan 2005
SOURCE: David M. DuMond SOURCE CONTACT: David M. DuMond SOURCE ADDRESS: 225 Cheyenne Trail Wilmington, NC 28409 SOURCE PHONE: 910/799-0363
435
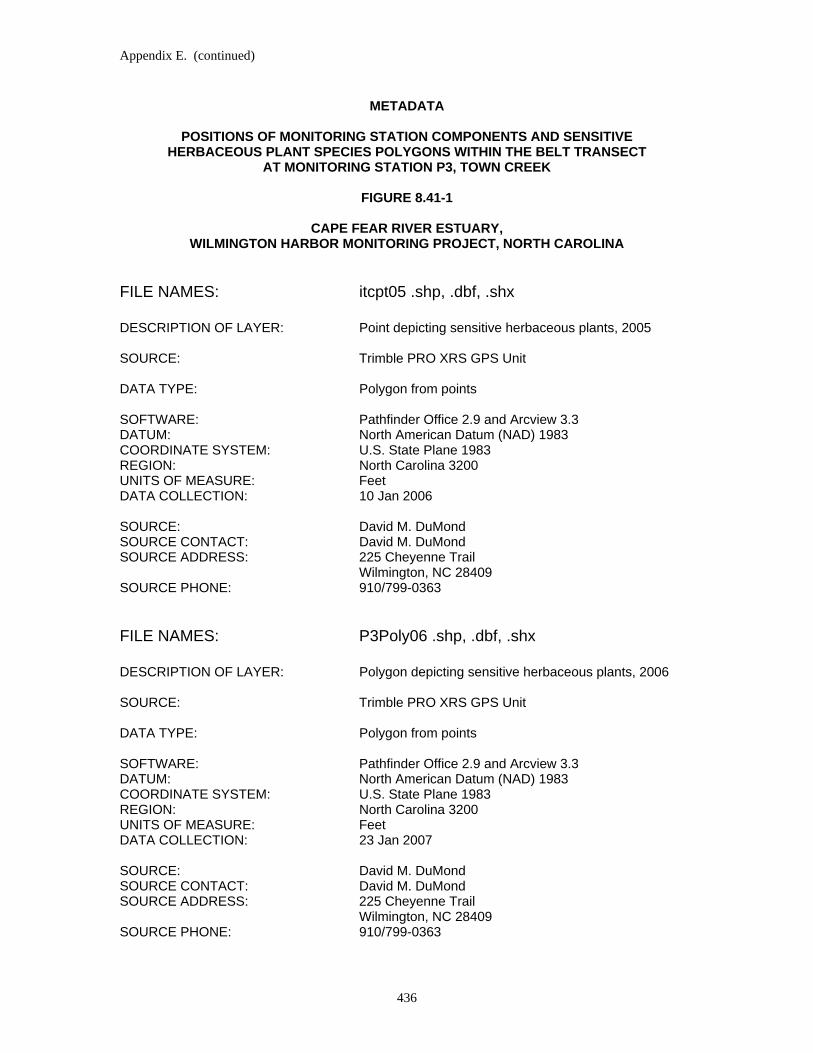
Appendix E. (continued)
METADATA
POSITIONS OF MONITORING STATION COMPONENTS AND SENSITIVE HERBACEOUS PLANT SPECIES POLYGONS WITHIN THE BELT TRANSECT
AT MONITORING STATION P3, TOWN CREEK
FIGURE 8.41-1
CAPE FEAR RIVER ESTUARY, WILMINGTON HARBOR MONITORING PROJECT, NORTH CAROLINA
FILE NAMES: itcpt05 .shp, .dbf, .shx
DESCRIPTION OF LAYER: Point depicting sensitive herbaceous plants, 2005
SOURCE: Trimble PRO XRS GPS Unit DATA TYPE: Polygon from points SOFTWARE: Pathfinder Office 2.9 and Arcview 3.3 DATUM: North American Datum (NAD) 1983 COORDINATE SYSTEM: U.S. State Plane 1983 REGION: North Carolina 3200 UNITS OF MEASURE: Feet DATA COLLECTION: 10 Jan 2006
SOURCE: David M. DuMond SOURCE CONTACT: David M. DuMond SOURCE ADDRESS: 225 Cheyenne Trail Wilmington, NC 28409 SOURCE PHONE: 910/799-0363
FILE NAMES: P3Poly06 .shp, .dbf, .shx
DESCRIPTION OF LAYER: Polygon depicting sensitive herbaceous plants, 2006
SOURCE: Trimble PRO XRS GPS Unit DATA TYPE: Polygon from points SOFTWARE: Pathfinder Office 2.9 and Arcview 3.3 DATUM: North American Datum (NAD) 1983 COORDINATE SYSTEM: U.S. State Plane 1983 REGION: North Carolina 3200 UNITS OF MEASURE: Feet DATA COLLECTION: 23 Jan 2007
SOURCE: David M. DuMond SOURCE CONTACT: David M. DuMond SOURCE ADDRESS: 225 Cheyenne Trail Wilmington, NC 28409 SOURCE PHONE: 910/799-0363
436

Appendix E. (continued)
METADATA
POSITIONS OF MONITORING STATION COMPONENTS AND SENSITIVE HERBACEOUS PLANT SPECIES POLYGONS WITHIN THE BELT TRANSECT
AT MONITORING STATION P7, INDIAN CREEK
FIGURE 8.42-1
CAPE FEAR RIVER ESTUARY, WILMINGTON HARBOR MONITORING PROJECT, NORTH CAROLINA
FILE NAMES: 15ben.shp 15ben.dbf 15ben.shx DESCRIPTION OF LAYER: Point depicting concrete benchmark
SOURCE: Trimble PRO XRS GPS Unit DATA TYPE: Point SOFTWARE: Pathfinder Office 2.1 and Arcview version 3.2 DATUM: North American Datum (NAD) 1983 COORDINATE SYSTEM: U.S. State Plane 1983 REGION: North Carolina 3200 UNITS OF MEASURE: Feet DATA COLLECTION: 20 December 2000
SOURCE: CZR Incorporated SOURCE CONTACT: Samuel Cooper SOURCE ADDRESS: 4709 College Acres, Suite 2 Wilmington, NC 28403 SOURCE PHONE: 910/392-9253 SOURCE FAX: 910/392-9139
FILE NAMES: 15pil.shp 15pil.dbf 15pil.shx DESCRIPTION OF LAYER: Point depicting data collect platform piling
SOURCE: Trimble PRO XRS GPS Unit DATA TYPE: Point SOFTWARE: Pathfinder Office 2.1 and Arcview version 3.2 DATUM: North American Datum (NAD) 1983 COORDINATE SYSTEM: U.S. State Plane 1983 REGION: North Carolina 3200 UNITS OF MEASURE: Feet DATA COLLECTION: 20 December 2000
SOURCE: CZR Incorporated SOURCE CONTACT: Samuel Cooper SOURCE ADDRESS: 4709 College Acres, Suite 2 Wilmington, NC 28403 SOURCE PHONE: 910/392-9253 SOURCE FAX: 910/392-9139
437

Appendix E. (continued)
METADATA
POSITIONS OF MONITORING STATION COMPONENTS AND SENSITIVE HERBACEOUS PLANT SPECIES POLYGONS WITHIN THE BELT TRANSECT
AT MONITORING STATION P7, INDIAN CREEK
FIGURE 8.42-1
CAPE FEAR RIVER ESTUARY, WILMINGTON HARBOR MONITORING PROJECT, NORTH CAROLINA
FILE NAMES: 15sub.shp 15sub.dbf 15sub.shx DESCRIPTION OF LAYER: Points depicting substation survey points
SOURCE: Trimble PRO XRS GPS Unit DATA TYPE: Points SOFTWARE: Pathfinder Office 2.1 and Arcview version 3.2 DATUM: North American Datum (NAD) 1983 COORDINATE SYSTEM: U.S. State Plane 1983 REGION: North Carolina 3200 UNITS OF MEASURE: Feet DATA COLLECTION: 20 December 2000
SOURCE: CZR Incorporated SOURCE CONTACT: Samuel Cooper SOURCE ADDRESS: 4709 College Acres, Suite 2 Wilmington, NC 28403 SOURCE PHONE: 910/392-9253 SOURCE FAX: 910/392-9139
438

Appendix E. (continued)
METADATA
POSITIONS OF MONITORING STATION COMPONENTS AND SENSITIVE HERBACEOUS PLANT SPECIES POLYGONS WITHIN THE BELT TRANSECT
AT MONITORING STATION P7, INDIAN CREEK
FIGURE 8.42-1
CAPE FEAR RIVER ESTUARY, WILMINGTON HARBOR MONITORING PROJECT, NORTH CAROLINA
FILE NAMES: site8.tif DESCRIPTION OF LAYER: True color aerial photography was flown on
March 25, 2000 at an altitude of 1500 feet.
SOURCE: Wild RC20 Aerial Mapping Camera Scale: 1” = 250’ Resolution: 1100 DPI (23.1 microns) DATA TYPE: The image source consisted of color contact prints and
diapositives were created and the negative film then digitally scanned on a Vexcell 4000 to create raw digital images to be rectified and produce digital orthophotos. This produced an original raw pixel size of .2272’ based on the scale of the negative film.
SOFTWARE: Tif/Tfw file format DATUM: North American Datum (NAD) 1983 COORDINATE SYSTEM: U.S. State Plane 1983 REGION: North Carolina 3200 UNITS OF MEASURE: Feet DATA COLLECTION: 25 March 2000
SOURCE: 3Di, LLC Wilmington NC, Office SOURCE CONTACT: Scott C. Williams, PLS SOURCE ADDRESS: 2704-A Exchange Drive Wilmington, NC 28405 SOURCE PHONE: 910/392-1496 SOURCE FAX: 910/392-7326
439

Appendix E. (continued)
METADATA
POSITIONS OF MONITORING STATION COMPONENTS AND SENSITIVE HERBACEOUS PLANT SPECIES POLYGONS WITHIN THE BELT TRANSECT
AT MONITORING STATION P7, INDIAN CREEK
FIGURE 8.42-1
CAPE FEAR RIVER ESTUARY, WILMINGTON HARBOR MONITORING PROJECT, NORTH CAROLINA
FILE NAMES: 15tra.shp 15tra.dbf 15tra.shx DESCRIPTION OF LAYER: Points depicting belt transect markers
SOURCE: Trimble PRO XRS GPS Unit DATA TYPE: Points SOFTWARE: Pathfinder Office 2.1 and Arcview version 3.2 DATUM: North American Datum (NAD) 1983 COORDINATE SYSTEM: U.S. State Plane 1983 REGION: North Carolina 3200 UNITS OF MEASURE: Feet DATA COLLECTION: 20 December 2000
SOURCE: CZR Incorporated SOURCE CONTACT: Samuel Cooper SOURCE ADDRESS: 4709 College Acres, Suite 2 Wilmington, NC 28403 SOURCE PHONE: 910/392-9253 SOURCE FAX: 910/392-9139
440

Appendix E. (continued)
METADATA
POSITIONS OF MONITORING STATION COMPONENTS AND SENSITIVE HERBACEOUS PLANT SPECIES POLYGONS WITHIN THE BELT TRANSECT
AT MONITORING STATION P8, DOLLISONS LANDING
FIGURE 8.43-1
CAPE FEAR RIVER ESTUARY, WILMINGTON HARBOR MONITORING PROJECT, NORTH CAROLINA
FILE NAMES: 16ben.shp 16ben.dbf 16ben.shx DESCRIPTION OF LAYER: Point depicting concrete benchmark
SOURCE: Trimble PRO XRS GPS Unit DATA TYPE: Point SOFTWARE: Pathfinder Office 2.1 and Arcview version 3.2 DATUM: North American Datum (NAD) 1983 COORDINATE SYSTEM: U.S. State Plane 1983 REGION: North Carolina 3200 UNITS OF MEASURE: Feet DATA COLLECTION: 20 December 2000
SOURCE: CZR Incorporated SOURCE CONTACT: Samuel Cooper SOURCE ADDRESS: 4709 College Acres, Suite 2 Wilmington, NC 28403 SOURCE PHONE: 910/392-9253 SOURCE FAX: 910/392-9139
FILE NAMES: 16pil.shp 16pil.dbf 16pil.shx DESCRIPTION OF LAYER: Point depicting data collect platform piling
SOURCE: Trimble PRO XRS GPS Unit DATA TYPE: Point SOFTWARE: Pathfinder Office 2.1 and Arcview version 3.2 DATUM: North American Datum (NAD) 1983 COORDINATE SYSTEM: U.S. State Plane 1983 REGION: North Carolina 3200 UNITS OF MEASURE: Feet DATA COLLECTION: 20 December 2000
SOURCE: CZR Incorporated SOURCE CONTACT: Samuel Cooper SOURCE ADDRESS: 4709 College Acres, Suite 2 Wilmington, NC 28403 SOURCE PHONE: 910/392-9253 SOURCE FAX: 910/392-9139
441

Appendix E. (continued)
METADATA
POSITIONS OF MONITORING STATION COMPONENTS AND SENSITIVE HERBACEOUS PLANT SPECIES POLYGONS WITHIN THE BELT TRANSECT
AT MONITORING STATION P8, DOLLISONS LANDING
FIGURE 8.43-1
CAPE FEAR RIVER ESTUARY, WILMINGTON HARBOR MONITORING PROJECT, NORTH CAROLINA
FILE NAMES: Area-gen.shp, .dbf .shx DESCRIPTION OF LAYER: Polygon depicting sensitive herbaceous plants, 2002 SOURCE: Trimble PRO XRS GPS Unit DATA TYPE: Polygon SOFTWARE: Pathfinder Office 2.1 and Arcview version 3.2 DATUM: North American Datum (NAD) 1983 COORDINATE SYSTEM: U.S. State Plane 1983 REGION: North Carolina 3200 UNITS OF MEASURE: Feet DATA COLLECTION: 6 January 2003
SOURCE: David M. DuMond SOURCE CONTACT: David M. DuMond SOURCE ADDRESS: 225 Cheyenne Trail Wilmington, NC 28409 SOURCE PHONE: 910/799-0363
FILE NAMES: 16sub.shp 16sub.dbf 16sub.shx DESCRIPTION OF LAYER: Points depicting substation survey points
SOURCE: Trimble PRO XRS GPS Unit DATA TYPE: Points SOFTWARE: Pathfinder Office 2.1 and Arcview version 3.2 DATUM: North American Datum (NAD) 1983 COORDINATE SYSTEM: U.S. State Plane 1983 REGION: North Carolina 3200 UNITS OF MEASURE: Feet DATA COLLECTION: 20 December 2000
SOURCE: CZR Incorporated SOURCE CONTACT: Samuel Cooper SOURCE ADDRESS: 4709 College Acres, Suite 2 Wilmington, NC 28403 SOURCE PHONE: 910/392-9253 SOURCE FAX: 910/392-9139
442

Appendix E. (continued)
METADATA
POSITIONS OF MONITORING STATION COMPONENTS AND SENSITIVE HERBACEOUS PLANT SPECIES POLYGONS WITHIN THE BELT TRANSECT
AT MONITORING STATION P8, DOLLISONS LANDING
FIGURE 8.43-1
CAPE FEAR RIVER ESTUARY, WILMINGTON HARBOR MONITORING PROJECT, NORTH CAROLINA
FILE NAMES: site3.tif DESCRIPTION OF LAYER: True color aerial photography was flown on
March 25, 2000 at an altitude of 1500 feet.
SOURCE: Wild RC20 Aerial Mapping Camera Scale: 1” = 250’ Resolution: 1100 DPI (23.1 microns): DATA TYPE: The image source consisted of color contact prints and
diapositives were created and the negative film then digitally scanned on a Vexcell 4000 to create raw digital images to be rectified and produce digital orthophotos. This produced an original raw pixel size of .2272’ based on the scale of the negative film.
SOFTWARE: Tif/Tfw file format DATUM: North American Datum (NAD) 1983 COORDINATE SYSTEM: U.S. State Plane 1983 REGION: North Carolina 3200 UNITS OF MEASURE: Feet DATA COLLECTION: 25 March 2000
SOURCE: 3Di, LLC Wilmington NC, Office SOURCE CONTACT: Scott C. Williams, PLS SOURCE ADDRESS: 2704-A Exchange Drive Wilmington, NC 28405 SOURCE PHONE: 910/392-1496 SOURCE FAX: 910/392-7326
443

Appendix E. (continued)
METADATA
POSITIONS OF MONITORING STATION COMPONENTS AND SENSITIVE HERBACEOUS PLANT SPECIES POLYGONS WITHIN THE BELT TRANSECT
AT MONITORING STATION P8, DOLLISONS LANDING
FIGURE 8.43-1
CAPE FEAR RIVER ESTUARY, WILMINGTON HARBOR MONITORING PROJECT, NORTH CAROLINA
FILE NAMES: 16tra.shp 16tra.dbf 16tra.shx DESCRIPTION OF LAYER: Points depicting belt transect markers
SOURCE: Trimble PRO XRS GPS Unit DATA TYPE: Points SOFTWARE: Pathfinder Office 2.1 and Arcview version 3.2 DATUM: North American Datum (NAD) 1983 COORDINATE SYSTEM: U.S. State Plane 1983 REGION: North Carolina 3200 UNITS OF MEASURE: Feet DATA COLLECTION: 20 December 2000
SOURCE: CZR Incorporated SOURCE CONTACT: Samuel Cooper SOURCE ADDRESS: 4709 College Acres, Suite 2 Wilmington, NC 28403 SOURCE PHONE: 910/392-9253 SOURCE FAX: 910/392-9139
444

Appendix E. (continued)
METADATA
POSITIONS OF MONITORING STATION COMPONENTS AND SENSITIVE HERBACEOUS PLANT SPECIES POLYGONS WITHIN THE BELT TRANSECT
AT MONITORING STATION P9, BLACK RIVER
FIGURE 8.44-1
CAPE FEAR RIVER ESTUARY, WILMINGTON HARBOR MONITORING PROJECT, NORTH CAROLINA
FILE NAMES: 17ben.shp 17ben.dbf 17ben.shx DESCRIPTION OF LAYER: Point depicting concrete benchmark
SOURCE: Trimble PRO XRS GPS Unit DATA TYPE: Point SOFTWARE: Pathfinder Office 2.1 and Arcview version 3.2 DATUM: North American Datum (NAD) 1983 COORDINATE SYSTEM: U.S. State Plane 1983 REGION: North Carolina 3200 UNITS OF MEASURE: Feet DATA COLLECTION: 20 December 2000
SOURCE: CZR Incorporated SOURCE CONTACT: Samuel Cooper SOURCE ADDRESS: 4709 College Acres, Suite 2 Wilmington, NC 28403 SOURCE PHONE: 910/392-9253 SOURCE FAX: 910/392-9139
FILE NAMES: 17pil.shp 17pil.dbf 17pil.shx DESCRIPTION OF LAYER: Point depicting data collect platform piling
SOURCE: Trimble PRO XRS GPS Unit DATA TYPE: Point SOFTWARE: Pathfinder Office 2.1 and Arcview version 3.2 DATUM: North American Datum (NAD) 1983 COORDINATE SYSTEM: U.S. State Plane 1983 REGION: North Carolina 3200 UNITS OF MEASURE: Feet DATA COLLECTION: 20 December 2000
SOURCE: CZR Incorporated SOURCE CONTACT: Samuel Cooper SOURCE ADDRESS: 4709 College Acres, Suite 2 Wilmington, NC 28403 SOURCE PHONE: 910/392-9253 SOURCE FAX: 910/392-9139
445

Appendix E. (continued)
METADATA
POSITIONS OF MONITORING STATION COMPONENTS AND SENSITIVE HERBACEOUS PLANT SPECIES POLYGONS WITHIN THE BELT TRANSECT
AT MONITORING STATION P9, BLACK RIVER
FIGURE 8.44-1
CAPE FEAR RIVER ESTUARY, WILMINGTON HARBOR MONITORING PROJECT, NORTH CAROLINA
FILE NAMES: 17poly.shp 17poly.dbf 17poly.shx
DESCRIPTION OF LAYER: Polygon depicting sensitive herbaceous plants, 2000 (17poly.ssf GPS file from CZR Incorporated)
SOURCE: Trimble PRO XRS GPS Unit DATA TYPE: Polygon SOFTWARE: Pathfinder Office 2.1 and Arcview version 3.2 DATUM: North American Datum (NAD) 1983 COORDINATE SYSTEM: U.S. State Plane 1983 REGION: North Carolina 3200 UNITS OF MEASURE: Feet DATA COLLECTION: 20 December 2000
SOURCE: CZR Incorporated SOURCE CONTACT: Samuel Cooper SOURCE ADDRESS: 4709 College Acres, Suite 2 Wilmington, NC 28403 SOURCE PHONE: 910/392-9253 SOURCE FAX: 910/392-9139
FILE NAMES: 17sub.shp 17sub.dbf 17sub.shx DESCRIPTION OF LAYER: Points depicting substation survey points
SOURCE: Trimble PRO XRS GPS Unit DATA TYPE: Points SOFTWARE: Pathfinder Office 2.1 and Arcview version 3.2 DATUM: North American Datum (NAD) 1983 COORDINATE SYSTEM: U.S. State Plane 1983 REGION: North Carolina 3200 UNITS OF MEASURE: Feet DATA COLLECTION: 20 December 2000
SOURCE: CZR Incorporated SOURCE CONTACT: Samuel Cooper SOURCE ADDRESS: 4709 College Acres, Suite 2 Wilmington, NC 28403 SOURCE PHONE: 910/392-9253 SOURCE FAX: 910/392-9139
446

Appendix E. (continued)
METADATA
POSITIONS OF MONITORING STATION COMPONENTS AND SENSITIVE HERBACEOUS PLANT SPECIES POLYGONS WITHIN THE BELT TRANSECT
AT MONITORING STATION P9, BLACK RIVER
FIGURE 8.44-1
CAPE FEAR RIVER ESTUARY, WILMINGTON HARBOR MONITORING PROJECT, NORTH CAROLINA
FILE NAMES: site4.tif DESCRIPTION OF LAYER: True color aerial photography was flown on
March 25, 2000 at an altitude of 1500 feet.
SOURCE: Wild RC20 Aerial Mapping Camera Scale: 1” = 250’ Resolution: 1100 DPI (23.1 microns) DATA TYPE: The image source consisted of color contact prints and
diapositives were created and the negative film then digitally scanned on a Vexcell 4000 to create raw digital images to be rectified and produce digital orthophotos. This produced an original raw pixel size of .2272’ based on the scale of the negative film.
SOFTWARE: Tif/Tfw file format DATUM: North American Datum (NAD) 1983 COORDINATE SYSTEM: U.S. State Plane 1983 REGION: North Carolina 3200 UNITS OF MEASURE: Feet DATA COLLECTION: 25 March 2000
SOURCE: 3Di, LLC Wilmington NC, Office SOURCE CONTACT: Scott C. Williams, PLS SOURCE ADDRESS: 2704-A Exchange Drive Wilmington, NC 28405 SOURCE PHONE: 910/392-1496 SOURCE FAX: 910/392-7326
447

Appendix E. (continued)
METADATA
POSITIONS OF MONITORING STATION COMPONENTS AND SENSITIVE HERBACEOUS PLANT SPECIES POLYGONS WITHIN THE BELT TRANSECT
AT MONITORING STATION P9, BLACK RIVER
FIGURE 8.44-1
CAPE FEAR RIVER ESTUARY, WILMINGTON HARBOR MONITORING PROJECT, NORTH CAROLINA
FILE NAMES: 17tra.shp, .dbf, .shx DESCRIPTION OF LAYER: Points depicting belt transect markers
SOURCE: Trimble PRO XRS GPS Unit DATA TYPE: Points SOFTWARE: Pathfinder Office 2.1 and Arcview version 3.2 DATUM: North American Datum (NAD) 1983 COORDINATE SYSTEM: U.S. State Plane 1983 REGION: North Carolina 3200 UNITS OF MEASURE: Feet DATA COLLECTION: 20 December 2000
SOURCE: CZR Incorporated SOURCE CONTACT: Samuel Cooper SOURCE ADDRESS: 4709 College Acres, Suite 2 Wilmington, NC 28403 SOURCE PHONE: 910/392-9253 SOURCE FAX: 910/392-9139
FILE NAMES: briv.shp, .dbf, .shx DESCRIPTION OF LAYER: Polygon depicting sensitive herbaceous plants, 2005
SOURCE: Trimble PRO XRS GPS Unit DATA TYPE: Polygon SOFTWARE: Pathfinder Office 2.9, ArcView 3.3 DATUM: North American Datum (NAD) 1983 COORDINATE SYSTEM: U.S. State Plane 1983 REGION: North Carolina 3200 UNITS OF MEASURE: Feet DATA COLLECTION: 21 January, 2006
SOURCE: David M. DuMond SOURCE CONTACT: David M. DuMond SOURCE ADDRESS: 225 Cheyenne Trail Wilmington, NC 28409 SOURCE PHONE: 910/799-0363
448

Appendix E. (continued)
METADATA
POSITIONS OF MONITORING STATION COMPONENTS AND SENSITIVE HERBACEOUS PLANT SPECIES POLYGONS WITHIN THE BELT TRANSECT
AT MONITORING STATION P12, RAT ISLAND
FIGURE 8.45-1
CAPE FEAR RIVER ESTUARY, WILMINGTON HARBOR MONITORING PROJECT, NORTH CAROLINA
FILE NAMES: Cam2.shp Came2.dbf Cam2.shx DESCRIPTION OF LAYER: Point depicting concrete benchmark
SOURCE: Trimble PRO XRS GPS Unit DATA TYPE: Point SOFTWARE: Pathfinder Office 2.1 and Arcview version 3.2 DATUM: North American Datum (NAD) 1983 COORDINATE SYSTEM: U.S. State Plane 1983 REGION: North Carolina 3200 UNITS OF MEASURE: Feet DATA COLLECTION: 20 December 2000
SOURCE: CZR Incorporated SOURCE CONTACT: Samuel Cooper SOURCE ADDRESS: 4709 College Acres, Suite 2 Wilmington, NC 28403 SOURCE PHONE: 910/392-9253 SOURCE FAX: 910/392-9139
FILE NAMES: Ratpil2.shp, .dbf, .shx DESCRIPTION OF LAYER: Point depicting new location of piling, 2002
SOURCE: Trimble PRO XRS GPS Unit DATA TYPE: Polygon from points SOFTWARE: Pathfinder Office 2.8 and Arcview 3.2 DATUM: North American Datum (NAD) 1983 COORDINATE SYSTEM: U.S. State Plane 1983 REGION: North Carolina 3200 UNITS OF MEASURE: Feet DATA COLLECTION: 5 August 2002
SOURCE: David M. DuMond SOURCE CONTACT: David M. DuMond SOURCE ADDRESS: 225 Cheyenne Trail Wilmington, NC 28409 SOURCE PHONE: 910/799-0363
449

Appendix E. (continued)
METADATA
POSITIONS OF MONITORING STATION COMPONENTS AND SENSITIVE HERBACEOUS PLANT SPECIES POLYGONS WITHIN THE BELT TRANSECT
AT MONITORING STATION P12, RAT ISLAND
FIGURE 8.45-1
CAPE FEAR RIVER ESTUARY, WILMINGTON HARBOR MONITORING PROJECT, NORTH CAROLINA
FILE NAMES: 19poly.shp 19poly.dbf 19poly.shx DESCRIPTION OF LAYER: Polygon depicting sensitive herbaceous plants, 2000
(19poly.ssf GPS file from CZR Incorporated) SOURCE: Trimble PRO XRS GPS Unit DATA TYPE: Polygon SOFTWARE: Pathfinder Office 2.1 and Arcview version 3.2 DATUM: North American Datum (NAD) 1983 COORDINATE SYSTEM: U.S. State Plane 1983 REGION: North Carolina 3200 UNITS OF MEASURE: Feet DATA COLLECTION: 20 December 2000
SOURCE: CZR Incorporated SOURCE CONTACT: Samuel Cooper SOURCE ADDRESS: 4709 College Acres, Suite 2 Wilmington, NC 28403 SOURCE PHONE: 910/392-9253 SOURCE FAX: 910/392-9139
FILE NAMES: 19sub.shp 19sub.dbf 19sub.shx DESCRIPTION OF LAYER: Points depicting substation survey points
SOURCE: Trimble PRO XRS GPS Unit DATA TYPE: Points SOFTWARE: Pathfinder Office 2.1 and Arcview version 3.2 DATUM: North American Datum (NAD) 1983 COORDINATE SYSTEM: U.S. State Plane 1983 REGION: North Carolina 3200 UNITS OF MEASURE: Feet DATA COLLECTION: 20 December 2000
SOURCE: CZR Incorporated SOURCE CONTACT: Samuel Cooper SOURCE ADDRESS: 4709 College Acres, Suite 2 Wilmington, NC 28403 SOURCE PHONE: 910/392-9253 SOURCE FAX: 910/392-9139
450

Appendix E. (continued)
METADATA
POSITIONS OF MONITORING STATION COMPONENTS AND SENSITIVE HERBACEOUS PLANT SPECIES POLYGONS WITHIN THE BELT TRANSECT
AT MONITORING STATION P12, RAT ISLAND
FIGURE 8.45-1
CAPE FEAR RIVER ESTUARY, WILMINGTON HARBOR MONITORING PROJECT, NORTH CAROLINA
FILE NAMES: site5.tif DESCRIPTION OF LAYER: True color aerial photography was flown on
March 25, 2000 at an altitude of 1500 feet.
SOURCE: Wild RC20 Aerial Mapping Camera Scale: 1” = 250’ Resolution: 1100 DPI (23.1 microns) DATA TYPE: The image source consisted of color contact prints and
diapositives were created and the negative film then digitally scanned on a Vexcell 4000 to create raw digital images to be rectified and produce digital orthophotos. This produced an original raw pixel size of .2272’ based on the scale of the negative film.
SOFTWARE: Tif/Tfw file format DATUM: North American Datum (NAD) 1983 COORDINATE SYSTEM: U.S. State Plane 1983 REGION: North Carolina 3200 UNITS OF MEASURE: Feet DATA COLLECTION: 25 March 2000
SOURCE: 3Di, LLC Wilmington NC, Office SOURCE CONTACT: Scott C. Williams, PLS SOURCE ADDRESS: 2704-A Exchange Drive Wilmington, NC 28405 SOURCE PHONE: 910/392-1496 SOURCE FAX: 910/392-7326
451

Appendix E. (continued)
METADATA
POSITIONS OF MONITORING STATION COMPONENTS AND SENSITIVE HERBACEOUS PLANT SPECIES POLYGONS WITHIN THE BELT TRANSECT
AT MONITORING STATION P12, RAT ISLAND
FIGURE 8.45-1
CAPE FEAR RIVER ESTUARY, WILMINGTON HARBOR MONITORING PROJECT, NORTH CAROLINA
FILE NAMES: 19tra.shp 19tra.dbf 19tra.shx DESCRIPTION OF LAYER: Points depicting belt transect markers
SOURCE: Trimble PRO XRS GPS Unit DATA TYPE: Points SOFTWARE: Pathfinder Office 2.1 and Arcview version 3.2 DATUM: North American Datum (NAD) 1983 COORDINATE SYSTEM: U.S. State Plane 1983 REGION: North Carolina 3200 UNITS OF MEASURE: Feet DATA COLLECTION: 20 December 2000
SOURCE: CZR Incorporated SOURCE CONTACT: Samuel Cooper SOURCE ADDRESS: 4709 College Acres, Suite 2 Wilmington, NC 28403 SOURCE PHONE: 910/392-9253 SOURCE FAX: 910/392-9139
452

Appendix E. (continued)
METADATA
POSITIONS OF MONITORING STATION COMPONENTS AND SENSITIVE HERBACEOUS PLANT SPECIES POLYGONS WITHIN THE BELT TRANSECT
AT MONITORING STATION P13, FISHING CREEK
FIGURE 8.46-1
CAPE FEAR RIVER ESTUARY, WILMINGTON HARBOR MONITORING PROJECT, NORTH CAROLINA
FILE NAMES: 20ben.shp 20ben.dbf 20ben.shx DESCRIPTION OF LAYER: Point depicting concrete benchmark
SOURCE: Trimble PRO XRS GPS Unit DATA TYPE: Point SOFTWARE: Pathfinder Office 2.1 and Arcview version 3.2 DATUM: North American Datum (NAD) 1983 COORDINATE SYSTEM: U.S. State Plane 1983 REGION: North Carolina 3200 UNITS OF MEASURE: Feet DATA COLLECTION: 20 December 2000
SOURCE: CZR Incorporated SOURCE CONTACT: Samuel Cooper SOURCE ADDRESS: 4709 College Acres, Suite 2 Wilmington, NC 28403 SOURCE PHONE: 910/392-9253 SOURCE FAX: 910/392-9139
FILE NAMES: 20pil.shp 20pil.dbf 20pil.shx DESCRIPTION OF LAYER: Point depicting data collect platform piling
SOURCE: Trimble PRO XRS GPS Unit DATA TYPE: Point SOFTWARE: Pathfinder Office 2.1 and Arcview version 3.2 DATUM: North American Datum (NAD) 1983 COORDINATE SYSTEM: U.S. State Plane 1983 REGION: North Carolina 3200 UNITS OF MEASURE: Feet DATA COLLECTION: 20 December 2000
SOURCE: CZR Incorporated SOURCE CONTACT: Samuel Cooper SOURCE ADDRESS: 4709 College Acres, Suite 2 Wilmington, NC 28403 SOURCE PHONE: 910/392-9253 SOURCE FAX: 910/392-9139
453

Appendix E. (continued)
METADATA
POSITIONS OF MONITORING STATION COMPONENTS AND SENSITIVE HERBACEOUS PLANT SPECIES POLYGONS WITHIN THE BELT TRANSECT
AT MONITORING STATION P13, FISHING CREEK
FIGURE 8.46-1
CAPE FEAR RIVER ESTUARY, WILMINGTON HARBOR MONITORING PROJECT, NORTH CAROLINA
FILE NAMES: 20poly.shp 20poly.dbf 20poly.shx DESCRIPTION OF LAYER: Polygon depicting sensitive herbaceous plants, 2000
(20poly.ssf GPS file from CZR Incorporated) SOURCE: Trimble PRO XRS GPS Unit DATA TYPE: Polygon SOFTWARE: Pathfinder Office 2.1 and Arcview version 3.2 DATUM: North American Datum (NAD) 1983 COORDINATE SYSTEM: U.S. State Plane 1983 REGION: North Carolina 3200 UNITS OF MEASURE: Feet DATA COLLECTION: 20 December 2000
SOURCE: CZR Incorporated SOURCE CONTACT: Samuel Cooper SOURCE ADDRESS: 4709 College Acres, Suite 2 Wilmington, NC 28403 SOURCE PHONE: 910/392-9253 SOURCE FAX: 910/392-9139
FILE NAMES: 20sub.shp 20sub.dbf 20sub.shx DESCRIPTION OF LAYER: Points depicting substation survey points
SOURCE: Trimble PRO XRS GPS Unit DATA TYPE: Points SOFTWARE: Pathfinder Office 2.1 and Arcview version 3.2 DATUM: North American Datum (NAD) 1983 COORDINATE SYSTEM: U.S. State Plane 1983 REGION: North Carolina 3200 UNITS OF MEASURE: Feet DATA COLLECTION: 20 December 2000
SOURCE: CZR Incorporated SOURCE CONTACT: Samuel Cooper SOURCE ADDRESS: 4709 College Acres, Suite 2 Wilmington, NC 28403 SOURCE PHONE: 910/392-9253 SOURCE FAX: 910/392-9139
454

Appendix E. (continued)
METADATA
POSITIONS OF MONITORING STATION COMPONENTS AND SENSITIVE HERBACEOUS PLANT SPECIES POLYGONS WITHIN THE BELT TRANSECT
AT MONITORING STATION P13, FISHING CREEK
FIGURE 8.46-1
CAPE FEAR RIVER ESTUARY, WILMINGTON HARBOR MONITORING PROJECT, NORTH CAROLINA
FILE NAMES: site2b.tif DESCRIPTION OF LAYER: True color aerial photography was flown on
March 25, 2000 at an altitude of 1500 feet.
SOURCE: Wild RC20 Aerial Mapping Camera Scale: 1” = 250’ Resolution: 1100 DPI (23.1 microns) DATA TYPE: The image source consisted of color contact prints and
diapositives were created and the negative film then digitally scanned on a Vexcell 4000 to create raw digital images to be rectified and produce digital orthophotos. This produced an original raw pixel size of .2272’ based on the scale of the negative film.
SOFTWARE: Tif/Tfw file format DATUM: North American Datum (NAD) 1983 COORDINATE SYSTEM: U.S. State Plane 1983 REGION: North Carolina 3200 UNITS OF MEASURE: Feet DATA COLLECTION: 25 March 2000
SOURCE: 3Di, LLC Wilmington NC, Office SOURCE CONTACT: Scott C. Williams, PLS SOURCE ADDRESS: 2704-A Exchange Drive Wilmington, NC 28405 SOURCE PHONE: 910/392-1496 SOURCE FAX: 910/392-7326
455
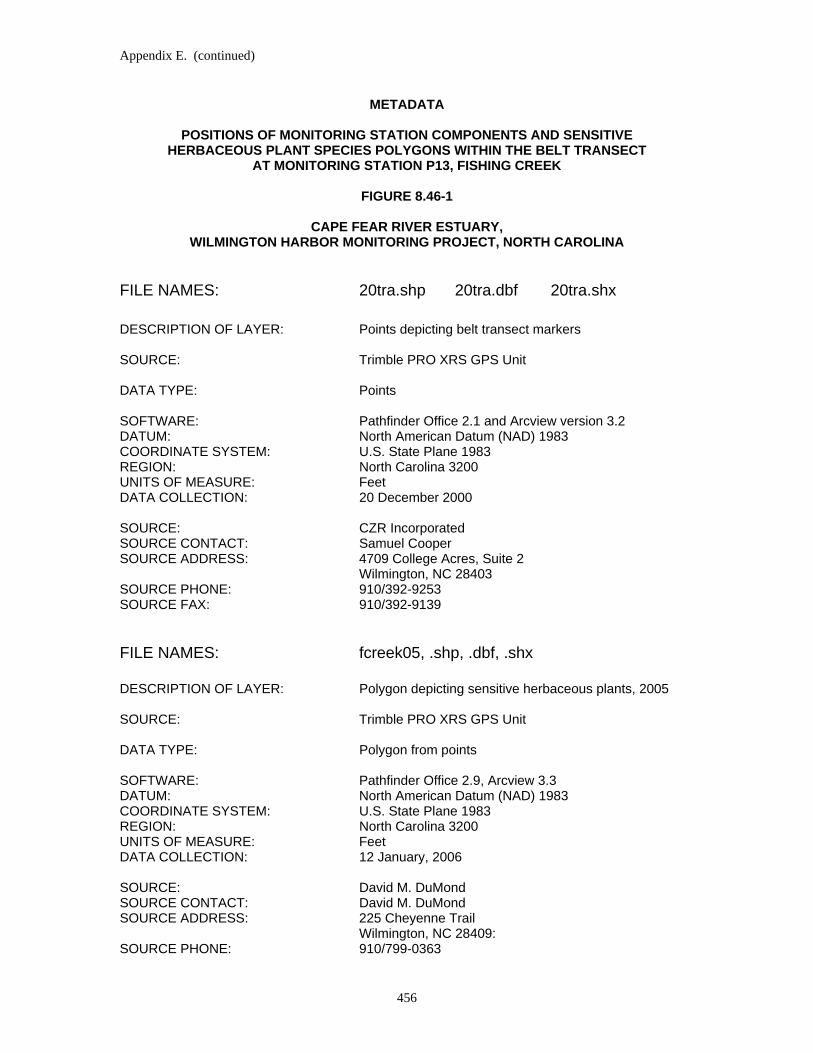
Appendix E. (continued)
METADATA
POSITIONS OF MONITORING STATION COMPONENTS AND SENSITIVE HERBACEOUS PLANT SPECIES POLYGONS WITHIN THE BELT TRANSECT
AT MONITORING STATION P13, FISHING CREEK
FIGURE 8.46-1
CAPE FEAR RIVER ESTUARY, WILMINGTON HARBOR MONITORING PROJECT, NORTH CAROLINA
FILE NAMES: 20tra.shp 20tra.dbf 20tra.shx DESCRIPTION OF LAYER: Points depicting belt transect markers
SOURCE: Trimble PRO XRS GPS Unit DATA TYPE: Points SOFTWARE: Pathfinder Office 2.1 and Arcview version 3.2 DATUM: North American Datum (NAD) 1983 COORDINATE SYSTEM: U.S. State Plane 1983 REGION: North Carolina 3200 UNITS OF MEASURE: Feet DATA COLLECTION: 20 December 2000
SOURCE: CZR Incorporated SOURCE CONTACT: Samuel Cooper SOURCE ADDRESS: 4709 College Acres, Suite 2 Wilmington, NC 28403 SOURCE PHONE: 910/392-9253 SOURCE FAX: 910/392-9139
FILE NAMES: fcreek05, .shp, .dbf, .shx DESCRIPTION OF LAYER: Polygon depicting sensitive herbaceous plants, 2005
SOURCE: Trimble PRO XRS GPS Unit DATA TYPE: Polygon from points SOFTWARE: Pathfinder Office 2.9, Arcview 3.3 DATUM: North American Datum (NAD) 1983 COORDINATE SYSTEM: U.S. State Plane 1983 REGION: North Carolina 3200 UNITS OF MEASURE: Feet DATA COLLECTION: 12 January, 2006
SOURCE: David M. DuMond SOURCE CONTACT: David M. DuMond SOURCE ADDRESS: 225 Cheyenne Trail Wilmington, NC 28409: SOURCE PHONE: 910/799-0363
456

Appendix E. (continued)
METADATA
POSITIONS OF MONITORING STATION COMPONENTS AND SENSITIVE HERBACEOUS PLANT SPECIES POLYGONS WITHIN THE BELT TRANSECT
AT MONITORING STATION P13, FISHING CREEK
FIGURE 8.46-1
CAPE FEAR RIVER ESTUARY, WILMINGTON HARBOR MONITORING PROJECT, NORTH CAROLINA
FILE NAMES: Fishcr06, .shp, .dbf, .shx DESCRIPTION OF LAYER: Polygon depicting sensitive herbaceous plants, 2006
SOURCE: Trimble PRO XRS GPS Unit DATA TYPE: Polygon from points SOFTWARE: Pathfinder Office 2.9, Arcview 3.3 DATUM: North American Datum (NAD) 1983 COORDINATE SYSTEM: U.S. State Plane 1983 REGION: North Carolina 3200 UNITS OF MEASURE: Feet DATA COLLECTION: 23 January, 2007
SOURCE: David M. DuMond SOURCE CONTACT: David M. DuMond SOURCE ADDRESS: 225 Cheyenne Trail Wilmington, NC 28409: SOURCE PHONE: 910/799-0363
457

Appendix E. (continued)
METADATA
POSITIONS OF MONITORING STATION COMPONENTS AND SENSITIVE HERBACEOUS PLANT SPECIES POLYGONS WITHIN THE BELT TRANSECT
AT MONITORING STATION P14, PRINCE GEORGE CREEK
FIGURE 8.47-1
CAPE FEAR RIVER ESTUARY, WILMINGTON HARBOR MONITORING PROJECT, NORTH CAROLINA
FILE NAMES: 21ben.shp 21ben.dbf 21ben.shx DESCRIPTION OF LAYER: Point depicting concrete benchmark
SOURCE: Trimble PRO XRS GPS Unit DATA TYPE: Point SOFTWARE: Pathfinder Office 2.1 and Arcview version 3.2 DATUM: North American Datum (NAD) 1983 COORDINATE SYSTEM: U.S. State Plane 1983 REGION: North Carolina 3200 UNITS OF MEASURE: Feet DATA COLLECTION: 20 December 2000
SOURCE: CZR Incorporated SOURCE CONTACT: Samuel Cooper SOURCE ADDRESS: 4709 College Acres, Suite 2 Wilmington, NC 28403 SOURCE PHONE: 910/392-9253 SOURCE FAX: 910/392-9139
FILE NAMES: 21pil.shp 21pil.dbf 21pil.shx DESCRIPTION OF LAYER: Point depicting data collect platform piling
SOURCE: Trimble PRO XRS GPS Unit DATA TYPE: Point SOFTWARE: Pathfinder Office 2.1 and Arcview version 3.2 DATUM: North American Datum (NAD) 1983 COORDINATE SYSTEM: U.S. State Plane 1983 REGION: North Carolina 3200 UNITS OF MEASURE: Feet DATA COLLECTION: 20 December 2000
SOURCE: CZR Incorporated SOURCE CONTACT: Samuel Cooper SOURCE ADDRESS: 4709 College Acres, Suite 2 Wilmington, NC 28403 SOURCE PHONE: 910/392-9253 SOURCE FAX: 910/392-9139
458

Appendix E. (continued)
METADATA
POSITIONS OF MONITORING STATION COMPONENTS AND SENSITIVE HERBACEOUS PLANT SPECIES POLYGONS WITHIN THE BELT TRANSECT
AT MONITORING STATION P14, PRINCE GEORGE CREEK
FIGURE 8.47-1
CAPE FEAR RIVER ESTUARY, WILMINGTON HARBOR MONITORING PROJECT, NORTH CAROLINA
FILE NAMES: 21poly.shp 21poly.dbf 21poly.shx DESCRIPTION OF LAYER: Polygon depicting sensitive herbaceous plants, 2000
(21poly.ssf GPS file from CZR Incorporated) SOURCE: Trimble PRO XRS GPS Unit DATA TYPE: Polygon SOFTWARE: Pathfinder Office 2.1 and Arcview version 3.2 DATUM: North American Datum (NAD) 1983 COORDINATE SYSTEM: U.S. State Plane 1983 REGION: North Carolina 3200 UNITS OF MEASURE: Feet DATA COLLECTION: 20 December 2000
SOURCE: CZR Incorporated SOURCE CONTACT: Samuel Cooper SOURCE ADDRESS: 4709 College Acres, Suite 2 Wilmington, NC 28403 SOURCE PHONE: 910/392-9253 SOURCE FAX: 910/392-9139
FILE NAMES: 21sub.shp 21sub.dbf 21sub.shx DESCRIPTION OF LAYER: Points depicting substation survey points
SOURCE: Trimble PRO XRS GPS Unit DATA TYPE: Points SOFTWARE: Pathfinder Office 2.1 and Arcview version 3.2 DATUM: North American Datum (NAD) 1983 COORDINATE SYSTEM: U.S. State Plane 1983 REGION: North Carolina 3200 UNITS OF MEASURE: Feet DATA COLLECTION: 20 December 2000
SOURCE: CZR Incorporated SOURCE CONTACT: Samuel Cooper SOURCE ADDRESS: 4709 College Acres, Suite 2 Wilmington, NC 28403 SOURCE PHONE: 910/392-9253 SOURCE FAX: 910/392-9139
459

Appendix E. (continued)
METADATA
POSITIONS OF MONITORING STATION COMPONENTS AND SENSITIVE HERBACEOUS PLANT SPECIES POLYGONS WITHIN THE BELT TRANSECT
AT MONITORING STATION P14, PRINCE GEORGE CREEK
FIGURE 8.47-1
CAPE FEAR RIVER ESTUARY, WILMINGTON HARBOR MONITORING PROJECT, NORTH CAROLINA
FILE NAMES: site1.tif DESCRIPTION OF LAYER: True color aerial photography was flown on
March 25, 2000 at an altitude of 1500 feet.
SOURCE: Wild RC20 Aerial Mapping Camera Scale: 1” = 250’ Resolution: 1100 DPI (23.1 microns) DATA TYPE: The image source consisted of color contact prints and
diapositives were created and the negative film then digitally scanned on a Vexcell 4000 to create raw digital images to be rectified and produce digital orthophotos. This produced an original raw pixel size of .2272’ based on the scale of the negative film.
SOFTWARE: Tif/Tfw file format DATUM: North American Datum (NAD) 1983 COORDINATE SYSTEM: U.S. State Plane 1983 REGION: North Carolina 3200 UNITS OF MEASURE: Feet DATA COLLECTION: 25 March 2000
SOURCE: 3Di, LLC Wilmington NC, Office SOURCE CONTACT: Scott C. Williams, PLS SOURCE ADDRESS: 2704-A Exchange Drive Wilmington, NC 28405 SOURCE PHONE: 910/392-1496 SOURCE FAX: 910/392-7326
460

Appendix E. (continued)
METADATA
POSITIONS OF MONITORING STATION COMPONENTS AND SENSITIVE HERBACEOUS PLANT SPECIES POLYGONS WITHIN THE BELT TRANSECT
AT MONITORING STATION P14, PRINCE GEORGE CREEK
FIGURE 8.47-1
CAPE FEAR RIVER ESTUARY, WILMINGTON HARBOR MONITORING PROJECT, NORTH CAROLINA
FILE NAMES: 21tra.shp 21tra.dbf 21tra.shx DESCRIPTION OF LAYER: Points depicting belt transect markers
SOURCE: Trimble PRO XRS GPS Unit DATA TYPE: Points SOFTWARE: Pathfinder Office 2.1 and Arcview version 3.2 DATUM: North American Datum (NAD) 1983 COORDINATE SYSTEM: U.S. State Plane 1983 REGION: North Carolina 3200 UNITS OF MEASURE: Feet DATA COLLECTION: 20 December 2000
SOURCE: CZR Incorporated SOURCE CONTACT: Samuel Cooper SOURCE ADDRESS: 4709 College Acres, Suite 2 Wilmington, NC 28403 SOURCE PHONE: 910/392-9253 SOURCE FAX: 910/392-9139
FILE NAMES: pgc05.shp, .dbf, .shx DESCRIPTION OF LAYER: Polygon depicting sensitive herbaceous plants, 2005
SOURCE: Trimble PRO XRS GPS Unit DATA TYPE: Polygon from points SOFTWARE: Pathfinder Office 2.9, Arcview 3.3 DATUM: North American Datum (NAD) 1983 COORDINATE SYSTEM: U.S. State Plane 1983 REGION: North Carolina 3200 UNITS OF MEASURE: Feet DATA COLLECTION: 12 January, 2006
SOURCE: David M. DuMond SOURCE CONTACT: David M. DuMond SOURCE ADDRESS: 225 Cheyenne Trail Wilmington, NC 28409 SOURCE PHONE: 910/799-0363
461

Appendix E. (continued)
METADATA
POSITIONS OF MONITORING STATION COMPONENTS AND SENSITIVE HERBACEOUS PLANT SPECIES POLYGONS WITHIN THE BELT TRANSECT
AT MONITORING STATION P14, PRINCE GEORGE CREEK
FIGURE 8.47-1
CAPE FEAR RIVER ESTUARY, WILMINGTON HARBOR MONITORING PROJECT, NORTH CAROLINA
FILE NAMES: Prgeo06.shp, .dbf, .shx DESCRIPTION OF LAYER: Polygon depicting sensitive herbaceous plants, 2006
SOURCE: Trimble PRO XRS GPS Unit DATA TYPE: Polygon from points SOFTWARE: Pathfinder Office 2.9, Arcview 3.3 DATUM: North American Datum (NAD) 1983 COORDINATE SYSTEM: U.S. State Plane 1983 REGION: North Carolina 3200 UNITS OF MEASURE: Feet DATA COLLECTION: 24 January, 2007
SOURCE: David M. DuMond SOURCE CONTACT: David M. DuMond SOURCE ADDRESS: 225 Cheyenne Trail Wilmington, NC 28409 SOURCE PHONE: 910/799-0363
462

APPENDIX F
AREAS AND LOCATIONS OF NEW YEAR 2006 SENSITIVE HERBACEOUS SPECIES POLYGONS AT SAMPLING STATIONS IN THE CAPE FEAR RIVER ESTUARY, WILMINGTON HARBOR MONITORING
PROJECT, NORTH CAROLINA
463

464
Appendix F. Areas and locations of year 2006 sensitive herbaceous species polygons at sampling stations in the Cape Fear River Estuary, Wilmington Harbor Monitoring Project, North Carolina. Station Name/Number
Polygon Area (ft2)
Point Number
Northing* (ft)
Easting* (ft)
Town Creek/ P3 6,084.53 (Larger-outer) 1 140321.525 2304213.490 2 140317.146 2304196.454 3 140288.938 2304186.740 4 140261.076 2304167.636 5 140252.607 2304179.883 6 140244.929 2304180.148 7 140233.154 2304178.647 8 140223.507 2304170.777 9 140202.159 2304188.911 10 140184.878 2304229.544 11 140191.199 2304228.044 12 140194.678 2304217.586 13 140203.754 2304213.263 14 140217.817 2304219.008 15 140237.667 2304217.875 16 140256.128 2304222.170 17 140263.265 2304236.491 18 140281.737 2304242.985 19 140294.556 2304255.712 20 140310.799 2304238.115 21 140326.113 2304225.572 489.15 (Smaller-inner exclusion) 1 140309.910 2304223.889 2 140288.351 2304206.672 3 140269.109 2304195.101 4 140264.040 2304210.054 SHV 5,595.38 5 140300.055 2304223.981 Fishing Creek P13 2,305.25 1 215488.258 2303579.337 2 215477.957 2303573.547 3 215460.894 2303577.797 4 215462.618 2303580.661 5 215459.321 2303588.410 6 215454.031 2303589.906 7 215440.722 2303601.881 8 215441.058 2303588.009 9 215444.086 2303570.767 10 215449.537 2303569.833 11 215462.874 2303562.776 12 215471.319 2303561.060 13 215484.991 2303554.457 14 215490.240 2303559.210 15 215512.084 2303552.944 16 215515.847 2303544.156 17 215534.395 2303532.742 18 215541.905 2303521.272 19 215557.480 2303535.837 20 215539.168 2303556.427 21 214528.129 2303555.210 22 215515.587 2303563.859 23 215499.374 2303578.647

Appendix F. (continued)
Station Name/Number
Polygon Area Point Number
Northing* Easting* (ft2) (ft) (ft)
24 215496.352 2303584.049 25 215492.110 2303579.827 26 215492.295 2303576.125 Prince George 4,654.27 1 227249.382 2320207.407 Creek./P14 3 227239.422 2320220.613 4 227228.147 2320219.541 5 227223.333 2320227.802 6 227222.761 2320226.481 7 227216.395 2320237.856 8 227205.979 2320246.828 9 227219.109 2320255.928 10 227212.191 2320264.090 11 227200.192 2320267.484 12 227212.408 2320280.374 13 227204.615 2320281.100 14 227197.910 2320294.990 15 227212.928 2320308.345 16 227224.513 2320295.858 17 227224.402 2320287.504 18 227230.925 2320275.025 19 227245.152 2320284.439 20 227254.087 2320277.377 21 227266.556 2320276.958 22 227283.959 2320282.841 24 227293.668 2320299.085 25 227300.016 2320282.207 *North Carolina State Coordinate System, Region 3200, North American Datum, 1983.
465