Embed Size (px)
Citation preview
Borough Profile 2018
7. EducationTower Hamlets is a young borough, with good schools and improving
educational attainment.
Key findings
There are an estimated 74,400 children and young people aged 0 to 19 living in
the borough.
There are 137 languages spoken in our schools. The top 3 first languages spoken
by pupils are Bengali (54 per cent), English (27 per cent), and Somali (4 per
cent).
There are 37,800 pupils recorded in primary and secondary schools in Tower
Hamlets. Bangladeshi pupils account for the highest proportion of pupils in the
borough (63 per cent).
Tower Hamlets has 6 nursery schools, 70 primary schools, 17 secondary schools, 1
all through school, 7 special schools, 1 post-16 school, 1 further education
provider, and 7 higher education providers located in the borough.
Ofsted rates 37 schools in Tower Hamlets ‘Outstanding’, 60 schools ‘Good’, and
3 schools 'Requires Improvement’. No school in Tower Hamlets is rated
‘Inadequate’. 100 per cent of our primary schools rated by Ofsted are rated
outstanding and good, compared to 81 per cent of our secondary schools.
The majority of children and young people hold positive views about the
support and feedback they receive from their school (91 per cent of primary
pupils and 73 per cent of secondary pupils).
74 per cent of primary pupils said that they think they will attend university
compared with 63 per cent of secondary students.
The proportion of early years pupils achieving a good level of development has
increased from 46 per cent in 2013 to 68 per cent in 2017, a 22 percentage
point increase compared with London (20 percentage points) and England (19
percentage points) during this period.
In 2017, compared with the national average, Key Stage 1 pupils’ attainment in
Tower Hamlets was higher with the exception of reading, which was the same
as the national average, and science, where the borough average (81 per
cent) was two percentage points below the national average. But compared
with London, attainment in the borough was lower with the exception of writing,
where the borough average was the same as the London average (both 72 per
cent).
Borough Profile 2018: Education 2
Key Stage 2 attainment in Tower Hamlets was higher than England in all
subjects.
Key Stage 4 pupils in Tower Hamlets have higher attainment outcomes than
their national peers with similar prior attainment.
Key Stage 4 attainment is higher than the national average for strong pass
(grades 9_5) in English and Maths (44 per cent in Tower Hamlets vs. 42 per cent
in England), standard pass (grades 9_4) in English and Maths (65 per cent in
Tower Hamlets vs. 64 per cent in England), and Average Attainment 8 scores (47
points in Tower Hamlets vs. 46 points in England).
On average, girls have higher attainment levels in schools in the borough than
boys, White pupils have lower attainment levels than BME pupils, pupils whose
first language is not English have higher attainment levels than those whose first
language is English, and pupils eligible for free school meals have lower levels of
attainment than pupils not eligible for free school meals.
There are 12,800 students from the UK and abroad in higher education with a
term-time address in Tower Hamlets, 78 per cent are undergraduates, 22 per
cent are postgraduates.
The proportion of first and upper second class degrees achieved by students
resident in Tower Hamlets has steadily risen from 49 per cent in 2008 to 63 per
cent in 2015.
Six months after graduation in 2014, the majority of graduates resident in Tower
Hamlets were in full-time employment (48 per cent), followed by part-time
employment (19 per cent).
At the end of 2016, 6 per cent of 16-17 year olds in Tower Hamlets were NEET
(including those whose activity is unknown), which is line with the national
average (6 per cent) and slightly higher than the London average (5 per cent).
This is a 0.5 percentage point decrease from the previous year.
Borough Profile 2018: Education 3
Introduction Tower Hamlets is a young borough, with a quarter of the whole population aged 0
to 19 years old.1 There are an estimated 74,400 children and young people aged 0
to 19 living in the borough. It is also a diverse borough, 137 languages spoken in our
schools. The top 3 languages spoken by pupils are Bengali (54 per cent), English (27
per cent), and Somali (4 per cent).2
In this chapter, data on education and attainment levels of children and young
people living in Tower Hamlets are addressed to offer insight into education in the
borough.
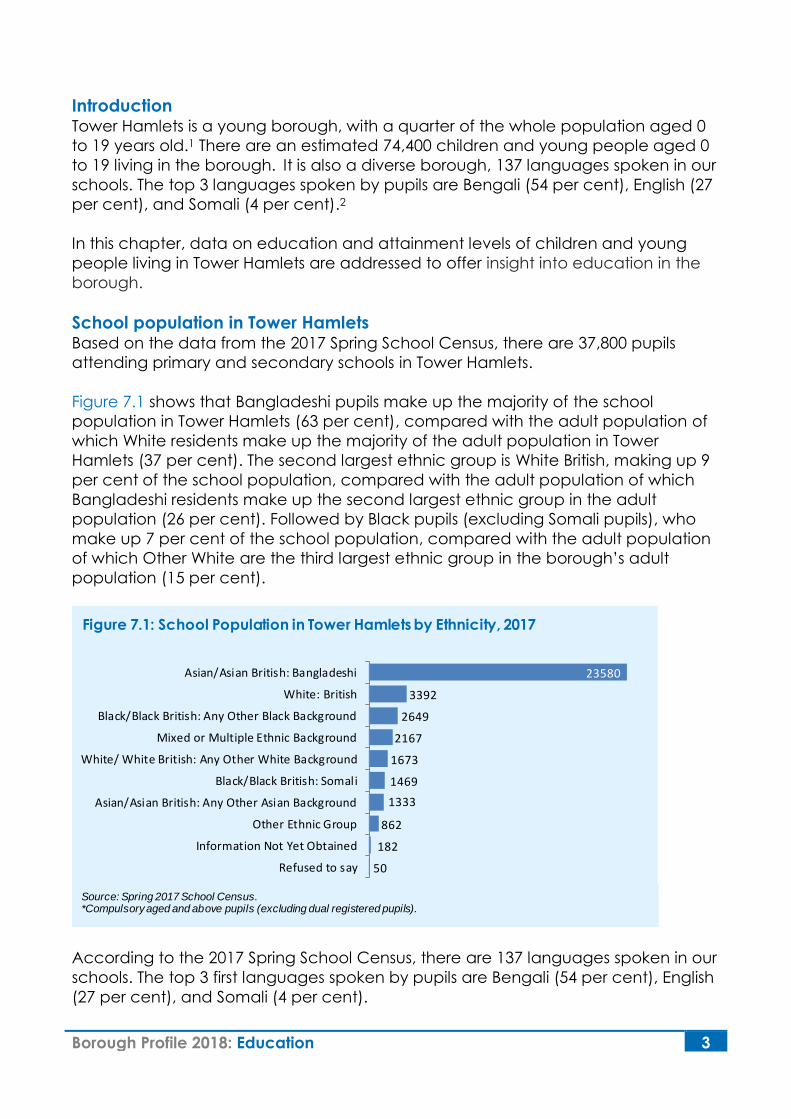
School population in Tower Hamlets Based on the data from the 2017 Spring School Census, there are 37,800 pupils
attending primary and secondary schools in Tower Hamlets.
Figure 7.1 shows that Bangladeshi pupils make up the majority of the school
population in Tower Hamlets (63 per cent), compared with the adult population of
which White residents make up the majority of the adult population in Tower
Hamlets (37 per cent). The second largest ethnic group is White British, making up 9
per cent of the school population, compared with the adult population of which
Bangladeshi residents make up the second largest ethnic group in the adult
population (26 per cent). Followed by Black pupils (excluding Somali pupils), who
make up 7 per cent of the school population, compared with the adult population
of which Other White are the third largest ethnic group in the borough’s adult
population (15 per cent).
According to the 2017 Spring School Census, there are 137 languages spoken in our
schools. The top 3 first languages spoken by pupils are Bengali (54 per cent), English
(27 per cent), and Somali (4 per cent).
50
182
862
1333
1469
1673
2167
2649
3392
23580
Refused to say
Information Not Yet Obtained
Other Ethnic Group
Asian/Asian British: Any Other Asian Background
Black/Black British: Somali
White/ White British: Any Other White Background
Mixed or Multiple Ethnic Background
Black/Black British: Any Other Black Background
White: British
Asian/Asian British: Bangladeshi
Figure 7.1: School Population in Tower Hamlets by Ethnicity, 2017
Source: Spring 2017 School Census.*Compulsory aged and above pupils (excluding dual registered pupils).
Borough Profile 2018: Education 4
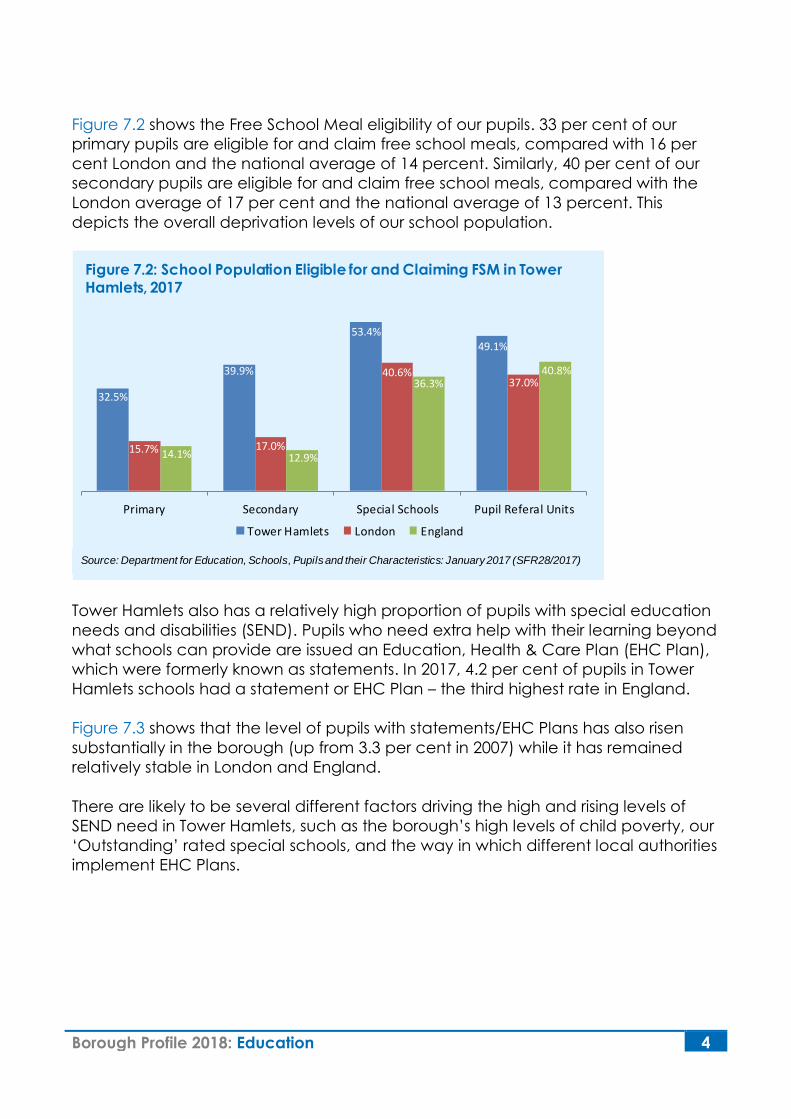
Figure 7.2 shows the Free School Meal eligibility of our pupils. 33 per cent of our
primary pupils are eligible for and claim free school meals, compared with 16 per
cent London and the national average of 14 percent. Similarly, 40 per cent of our
secondary pupils are eligible for and claim free school meals, compared with the
London average of 17 per cent and the national average of 13 percent. This
depicts the overall deprivation levels of our school population.
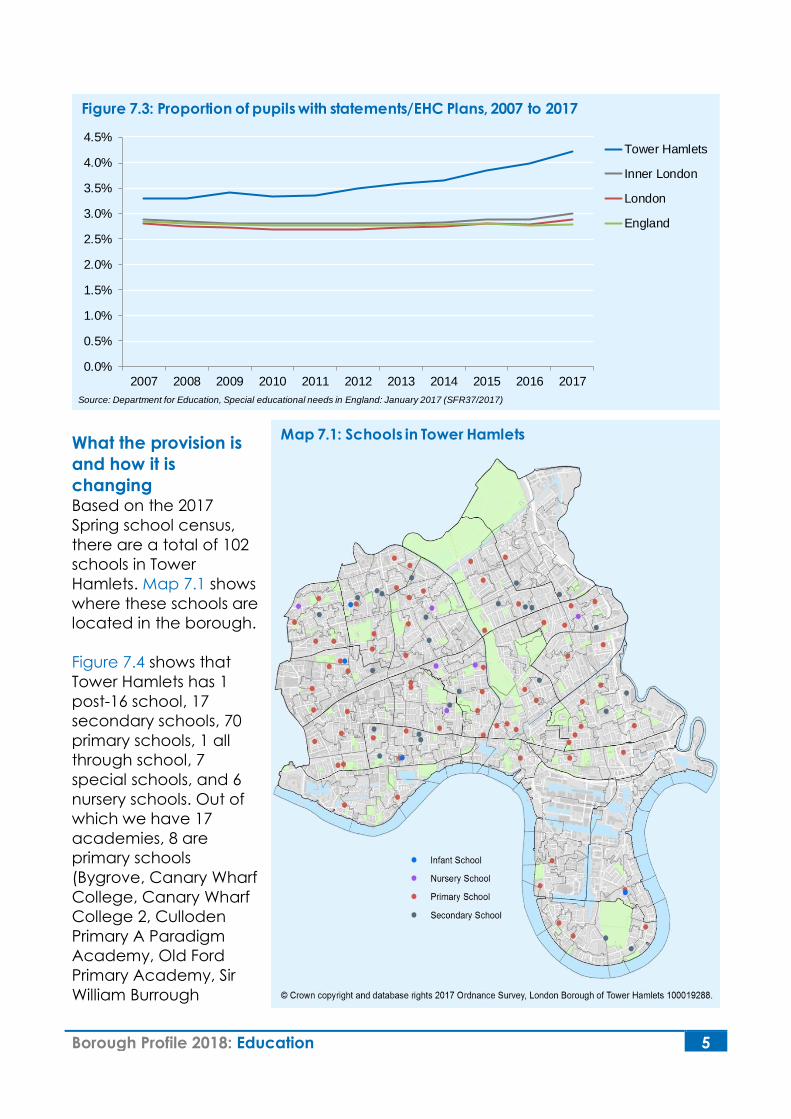
Tower Hamlets also has a relatively high proportion of pupils with special education
needs and disabilities (SEND). Pupils who need extra help with their learning beyond
what schools can provide are issued an Education, Health & Care Plan (EHC Plan),
which were formerly known as statements. In 2017, 4.2 per cent of pupils in Tower
Hamlets schools had a statement or EHC Plan – the third highest rate in England.
Figure 7.3 shows that the level of pupils with statements/EHC Plans has also risen
substantially in the borough (up from 3.3 per cent in 2007) while it has remained
relatively stable in London and England.
There are likely to be several different factors driving the high and rising levels of
SEND need in Tower Hamlets, such as the borough’s high levels of child poverty, our
‘Outstanding’ rated special schools, and the way in which different local authorities
implement EHC Plans.
32.5%
39.9%
53.4%49.1%
15.7% 17.0%
40.6%37.0%
14.1% 12.9%
36.3%40.8%
Primary Secondary Special Schools Pupil Referal Units
Tower Hamlets London England
Figure 7.2: School Population Eligible for and Claiming FSM in Tower
Hamlets, 2017
Source: Department for Education, Schools, Pupils and their Characteristics: January 2017 (SFR28/2017)
Borough Profile 2018: Education 5
Map 7.1: Schools in Tower Hamlets
What the provision is
and how it is
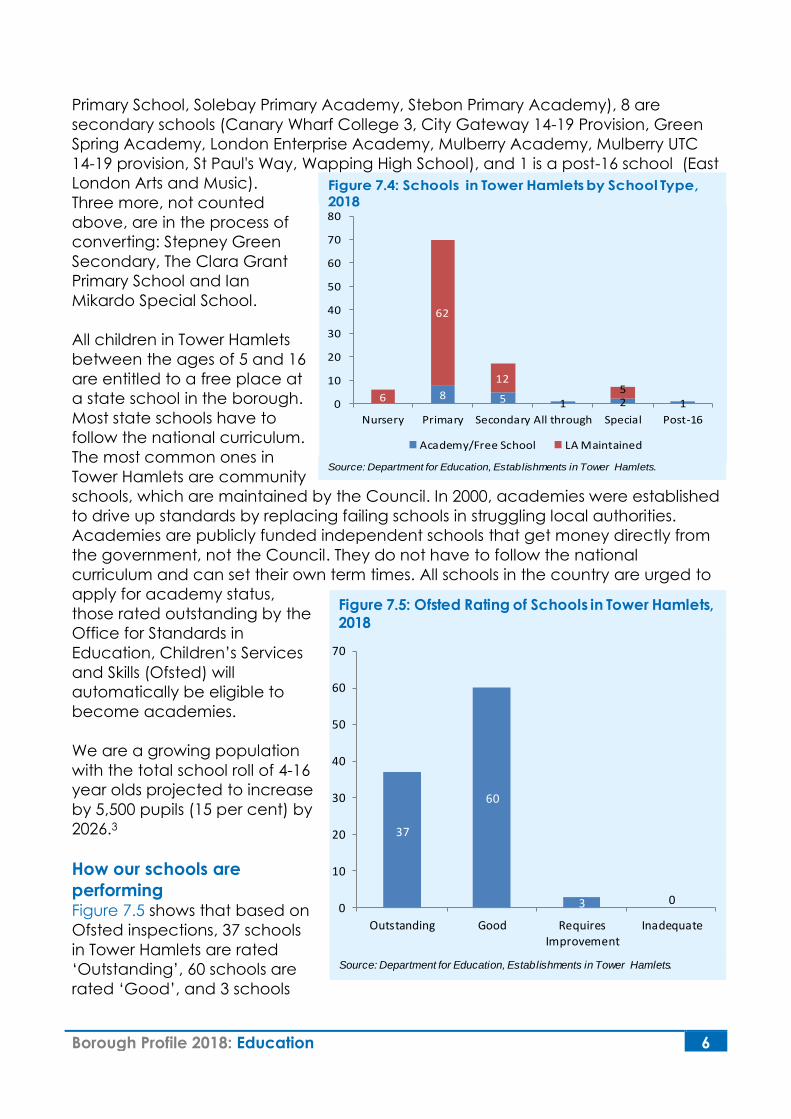
changing Based on the 2017
Spring school census,
there are a total of 102
schools in Tower
Hamlets. Map 7.1 shows
where these schools are
located in the borough.
Figure 7.4 shows that
Tower Hamlets has 1
post-16 school, 17
secondary schools, 70
primary schools, 1 all
through school, 7
special schools, and 6
nursery schools. Out of
which we have 17
academies, 8 are
primary schools
(Bygrove, Canary Wharf
College, Canary Wharf
College 2, Culloden
Primary A Paradigm
Academy, Old Ford
Primary Academy, Sir
William Burrough
0.0%
0.5%
1.0%
1.5%
2.0%
2.5%
3.0%
3.5%
4.0%
4.5%
2007 2008 2009 2010 2011 2012 2013 2014 2015 2016 2017
Tower Hamlets
Inner London
London
England
Source: Department for Education, Special educational needs in England: January 2017 (SFR37/2017)
Figure 7.3: Proportion of pupils with statements/EHC Plans, 2007 to 2017
Borough Profile 2018: Education 6
8 5 1 2 16
62
125
0
10
20
30
40
50
60
70
80
Nursery Primary Secondary All through Special Post-16
Academy/Free School LA Maintained
Figure 7.4: Schools in Tower Hamlets by School Type,
2018
Source: Department for Education, Establishments in Tower Hamlets.
37
60
3 00
10
20
30
40
50
60
70
Outstanding Good RequiresImprovement
Inadequate
Figure 7.5: Ofsted Rating of Schools in Tower Hamlets, 2018
Source: Department for Education, Establishments in Tower Hamlets.
Primary School, Solebay Primary Academy, Stebon Primary Academy), 8 are
secondary schools (Canary Wharf College 3, City Gateway 14-19 Provision, Green
Spring Academy, London Enterprise Academy, Mulberry Academy, Mulberry UTC
14-19 provision, St Paul's Way, Wapping High School), and 1 is a post-16 school (East
London Arts and Music).
Three more, not counted
above, are in the process of
converting: Stepney Green
Secondary, The Clara Grant
Primary School and Ian
Mikardo Special School.
All children in Tower Hamlets
between the ages of 5 and 16
are entitled to a free place at
a state school in the borough.
Most state schools have to
follow the national curriculum.
The most common ones in
Tower Hamlets are community
schools, which are maintained by the Council. In 2000, academies were established
to drive up standards by replacing failing schools in struggling local authorities.
Academies are publicly funded independent schools that get money directly from
the government, not the Council. They do not have to follow the national
curriculum and can set their own term times. All schools in the country are urged to
apply for academy status,
those rated outstanding by the
Office for Standards in
Education, Children’s Services
and Skills (Ofsted) will
automatically be eligible to
become academies.
We are a growing population
with the total school roll of 4-16
year olds projected to increase
by 5,500 pupils (15 per cent) by
2026.3
How our schools are
performing Figure 7.5 shows that based on
Ofsted inspections, 37 schools
in Tower Hamlets are rated
‘Outstanding’, 60 schools are
rated ‘Good’, and 3 schools
Borough Profile 2018: Education 7
Table 7.1: Ofsted rating by school type, 2018
Type Outstanding Good Requires Improvement
Inadequate Data N/A
Primary 19 51 0 0 0
Secondary 6 7 3 0 1
All through 1 0 0 0 0
Nursery 6 0 0 0 0
Special 4 2 0 0 0
16 plus 1 0 0 0 0
Total 37 60 3 0
Source: Department for Education, Establishments in Tower Hamlets.
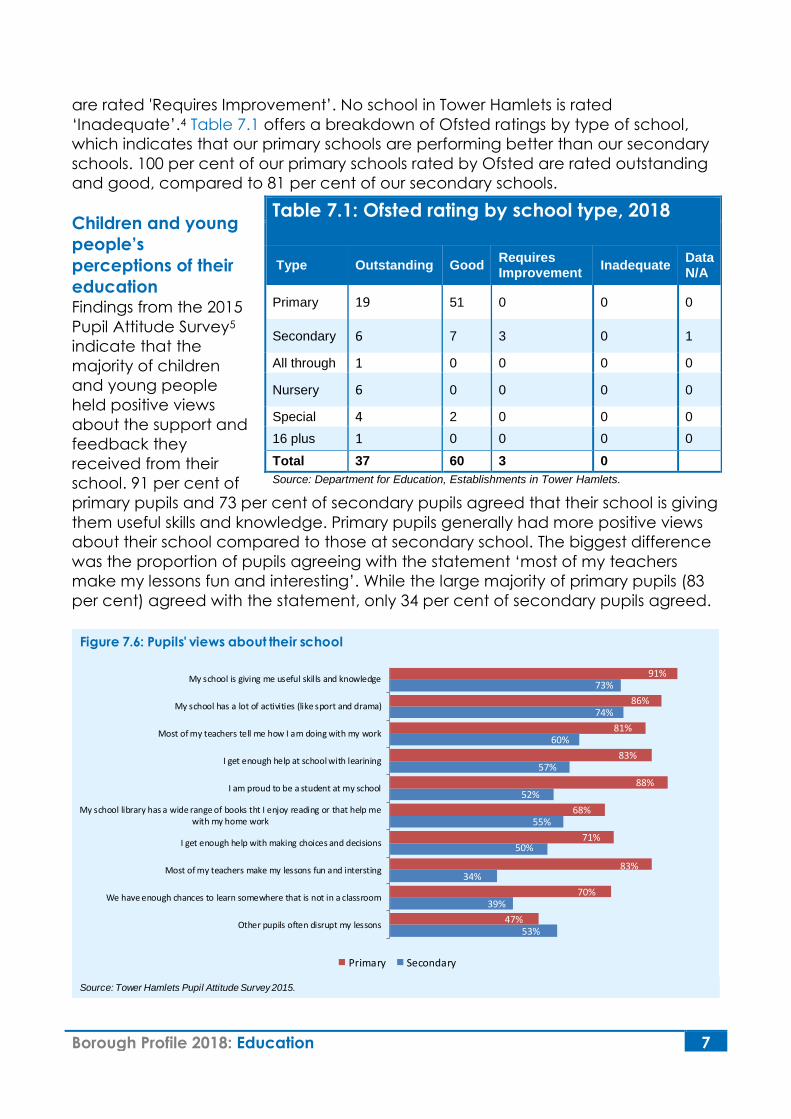
are rated 'Requires Improvement’. No school in Tower Hamlets is rated
‘Inadequate’.4 Table 7.1 offers a breakdown of Ofsted ratings by type of school,
which indicates that our primary schools are performing better than our secondary
schools. 100 per cent of our primary schools rated by Ofsted are rated outstanding
and good, compared to 81 per cent of our secondary schools.
Children and young
people’s
perceptions of their
education Findings from the 2015
Pupil Attitude Survey5
indicate that the
majority of children
and young people
held positive views
about the support and
feedback they
received from their
school. 91 per cent of
primary pupils and 73 per cent of secondary pupils agreed that their school is giving
them useful skills and knowledge. Primary pupils generally had more positive views
about their school compared to those at secondary school. The biggest difference
was the proportion of pupils agreeing with the statement ‘most of my teachers
make my lessons fun and interesting’. While the large majority of primary pupils (83
per cent) agreed with the statement, only 34 per cent of secondary pupils agreed.
53%
39%
34%
50%
55%
52%
57%
60%
74%
73%
47%
70%
83%
71%
68%
88%
83%
81%
86%
91%
Other pupils often disrupt my lessons
We have enough chances to learn somewhere that is not in a classroom
Most of my teachers make my lessons fun and intersting
I get enough help with making choices and decisions
My school library has a wide range of books tht I enjoy reading or that help mewith my home work
I am proud to be a student at my school
I get enough help at school with learining
Most of my teachers tell me how I am doing with my work
My school has a lot of activities (like sport and drama)
My school is giving me useful skills and knowledge
Primary Secondary
Figure 7.6: Pupils' views about their school
Source: Tower Hamlets Pupil Attitude Survey 2015.
Borough Profile 2018: Education 8
6%
20%
21%
59%
Don’t know
Other
Cost
Not interested
Figure 7.8: Reasons for not wanting to go to
university or higher education
Source: Tower Hamlets Pupil Attitude Survey 2015.
28%
9%
63%
23%
3%
74%
Don'tknow
No
Yes
Primary Secondary
Figure 7.7: Pupils' plans to attend university
Source: Tower Hamlets Pupil Attitude Survey 2015.
School absences Based on data from the Department for Education6, at 4 per cent, our primary
school absences are average, in line with the national average of 4 per cent. Our
secondary school absences are below average at 4 per cent, compared to the
national average of 5 per cent.
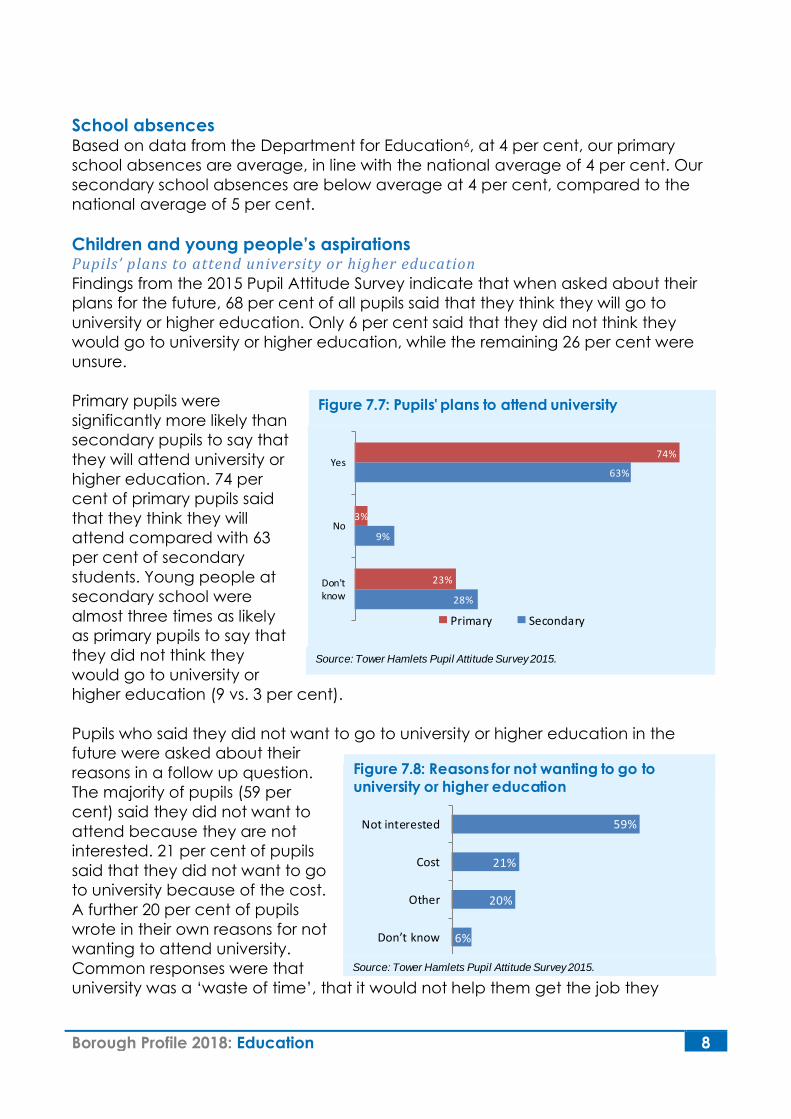
Children and young people’s aspirations Pupils’ plans to attend university or higher education Findings from the 2015 Pupil Attitude Survey indicate that when asked about their
plans for the future, 68 per cent of all pupils said that they think they will go to
university or higher education. Only 6 per cent said that they did not think they
would go to university or higher education, while the remaining 26 per cent were
unsure.
Primary pupils were
significantly more likely than
secondary pupils to say that
they will attend university or
higher education. 74 per
cent of primary pupils said
that they think they will
attend compared with 63
per cent of secondary
students. Young people at
secondary school were
almost three times as likely
as primary pupils to say that
they did not think they
would go to university or
higher education (9 vs. 3 per cent).
Pupils who said they did not want to go to university or higher education in the
future were asked about their
reasons in a follow up question.
The majority of pupils (59 per
cent) said they did not want to
attend because they are not
interested. 21 per cent of pupils
said that they did not want to go
to university because of the cost.
A further 20 per cent of pupils
wrote in their own reasons for not
wanting to attend university.
Common responses were that
university was a ‘waste of time’, that it would not help them get the job they
Borough Profile 2018: Education 9
Figure 7.10: Pupils achieving a good level of development, 2013-2017
0%
10%
20%
30%
40%
50%
60%
70%
80%
2013 2014 2015 2016 2017
Tower Hamlets
London
England
* A pupil achieving at least the expected level in Early Learning Goals within the three prime areas of learning (communication & lanaguage, physical development, and personal , social & emotional development) and within literacy and numeracy is classified as having a 'good level of development'.Source: Department for Education, Early years foundation stage profile (EYFSP) results: 2017 (SFR60/2017).
3%
5%
7%
11%
8%
21%
45%
4%
3%
14%
9%
5%
14%
17%
35%
I want to work in a shop, restaurant or similar
I want to work in an office
I don't know yet *
I want to work in the arts (e.g. fashion, music, creative)
I want to have my own business
I want a job related to sport
Other
I want a top professional job (e.g. doctor, lawyer,manager, teacher)
Primary Secondary
Figure 7.9: Pupils' career aspirations
Source: Tower Hamlets Pupil Attitude Survey 2015.*Onlyprimary pupils were given this option.
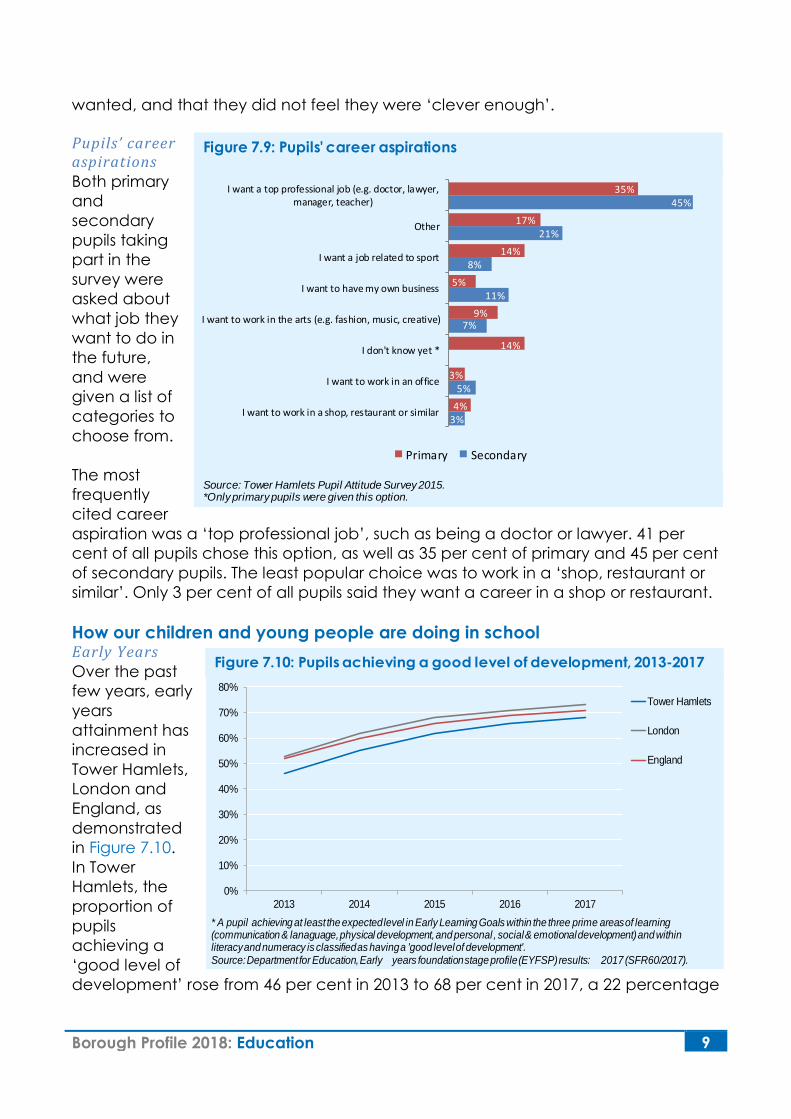
wanted, and that they did not feel they were ‘clever enough’.
Pupils’ career aspirations Both primary
and
secondary
pupils taking
part in the
survey were
asked about
what job they
want to do in
the future,
and were
given a list of
categories to
choose from.
The most
frequently
cited career
aspiration was a ‘top professional job’, such as being a doctor or lawyer. 41 per
cent of all pupils chose this option, as well as 35 per cent of primary and 45 per cent
of secondary pupils. The least popular choice was to work in a ‘shop, restaurant or
similar’. Only 3 per cent of all pupils said they want a career in a shop or restaurant.
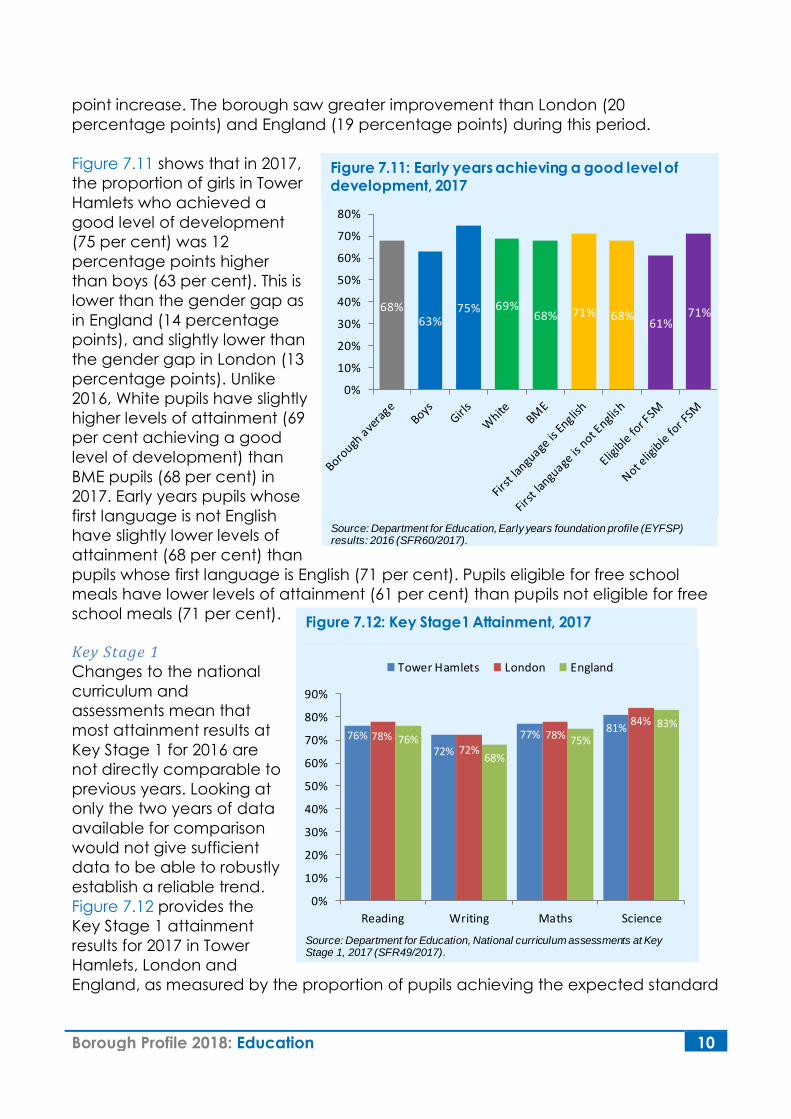
How our children and young people are doing in school Early Years Over the past
few years, early
years
attainment has
increased in
Tower Hamlets,
London and
England, as
demonstrated
in Figure 7.10.
In Tower
Hamlets, the
proportion of
pupils
achieving a
‘good level of
development’ rose from 46 per cent in 2013 to 68 per cent in 2017, a 22 percentage
Borough Profile 2018: Education 10
68%63%
75% 69%68% 71% 68%
61%71%
0%
10%
20%
30%
40%
50%
60%
70%
80%
Figure 7.11: Early years achieving a good level ofdevelopment, 2017
Source: Department for Education,Early years foundation profile (EYFSP)results: 2016 (SFR60/2017).
Figure 7.12: Key Stage1 Attainment, 2017
Source: Department for Education, National curriculum assessments at Key Stage 1, 2017 (SFR49/2017).
76%
72%
77%81%
78%72%
78%84%
76%
68%
75%
83%
0%
10%
20%
30%
40%
50%
60%
70%
80%
90%
Reading Writing Maths Science
Tower Hamlets London England
point increase. The borough saw greater improvement than London (20
percentage points) and England (19 percentage points) during this period.
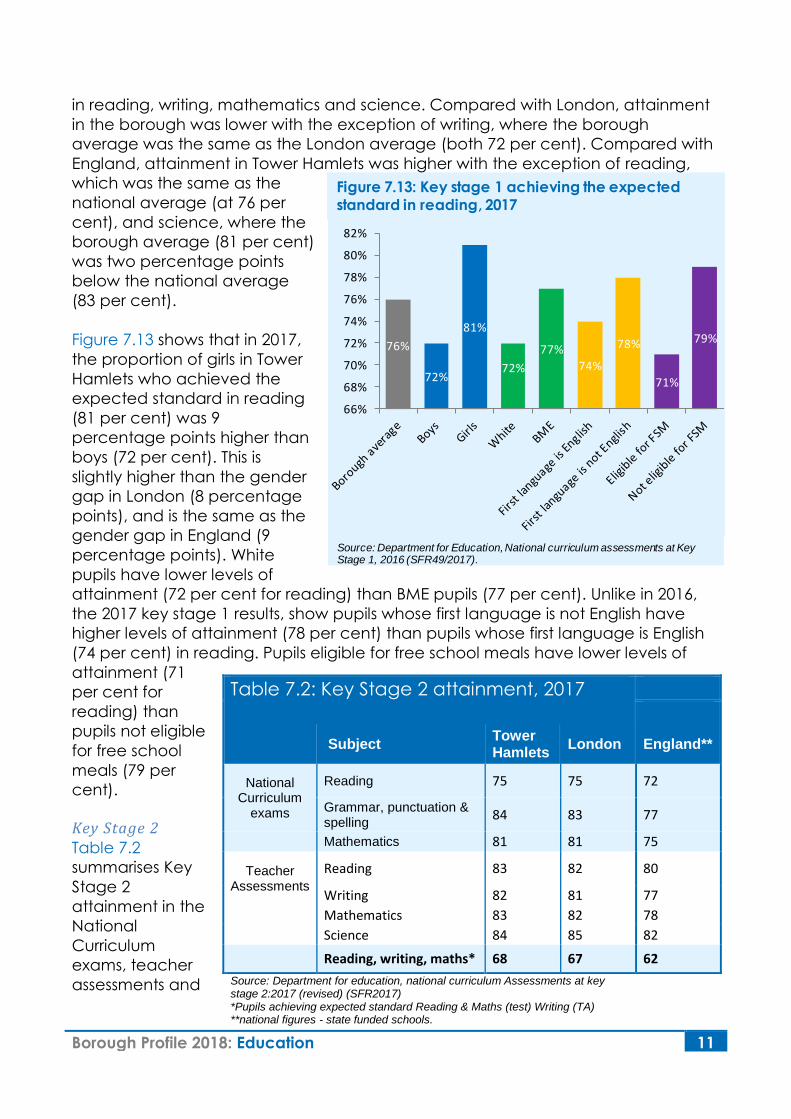
Figure 7.11 shows that in 2017,
the proportion of girls in Tower
Hamlets who achieved a
good level of development
(75 per cent) was 12
percentage points higher
than boys (63 per cent). This is
lower than the gender gap as
in England (14 percentage
points), and slightly lower than
the gender gap in London (13
percentage points). Unlike
2016, White pupils have slightly
higher levels of attainment (69
per cent achieving a good
level of development) than
BME pupils (68 per cent) in
2017. Early years pupils whose
first language is not English
have slightly lower levels of
attainment (68 per cent) than
pupils whose first language is English (71 per cent). Pupils eligible for free school
meals have lower levels of attainment (61 per cent) than pupils not eligible for free
school meals (71 per cent).
Key Stage 1 Changes to the national
curriculum and
assessments mean that
most attainment results at
Key Stage 1 for 2016 are
not directly comparable to
previous years. Looking at
only the two years of data
available for comparison
would not give sufficient
data to be able to robustly
establish a reliable trend.
Figure 7.12 provides the
Key Stage 1 attainment
results for 2017 in Tower
Hamlets, London and
England, as measured by the proportion of pupils achieving the expected standard
Borough Profile 2018: Education 11
76%
72%
81%
72%
77%
74%
78%
71%
79%
66%
68%
70%
72%
74%
76%
78%
80%
82%
Figure 7.13: Key stage 1 achieving the expected standard in reading, 2017
Source: Department for Education,National curriculum assessments at Key Stage 1, 2016 (SFR49/2017).
Table 7.2: Key Stage 2 attainment, 2017
Subject Tower Hamlets
London England**
National Curriculum
exams
Reading 75 75 72
Grammar, punctuation & spelling
84 83 77
Mathematics 81 81 75
Teacher Assessments
Reading 83 82 80
Writing 82 81 77
Mathematics 83 82 78
Science 84 85 82
Reading, writing, maths* 68 67 62
Source: Department for education, national curriculum Assessments at key stage 2:2017 (revised) (SFR2017)
*Pupils achieving expected standard Reading & Maths (test) Writing (TA) **national figures - state funded schools.
in reading, writing, mathematics and science. Compared with London, attainment
in the borough was lower with the exception of writing, where the borough
average was the same as the London average (both 72 per cent). Compared with
England, attainment in Tower Hamlets was higher with the exception of reading,
which was the same as the
national average (at 76 per
cent), and science, where the
borough average (81 per cent)
was two percentage points
below the national average
(83 per cent).
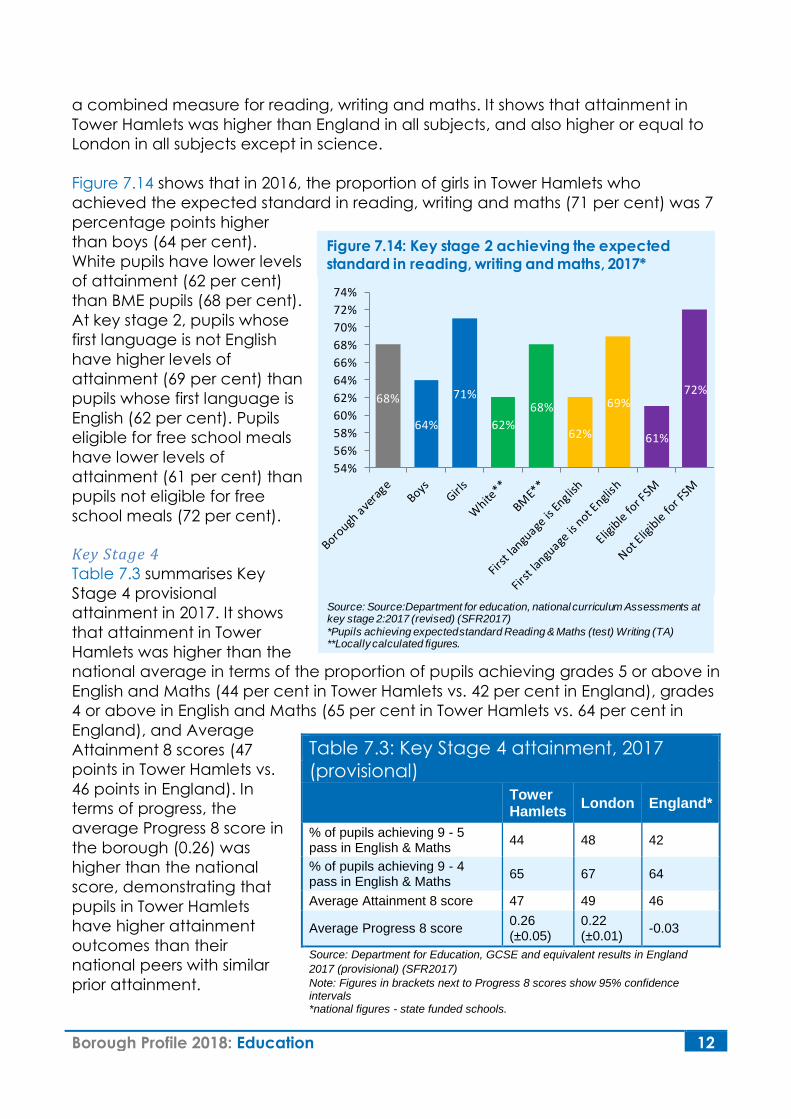
Figure 7.13 shows that in 2017,
the proportion of girls in Tower
Hamlets who achieved the
expected standard in reading
(81 per cent) was 9
percentage points higher than
boys (72 per cent). This is
slightly higher than the gender
gap in London (8 percentage
points), and is the same as the
gender gap in England (9
percentage points). White
pupils have lower levels of
attainment (72 per cent for reading) than BME pupils (77 per cent). Unlike in 2016,
the 2017 key stage 1 results, show pupils whose first language is not English have
higher levels of attainment (78 per cent) than pupils whose first language is English
(74 per cent) in reading. Pupils eligible for free school meals have lower levels of
attainment (71
per cent for
reading) than
pupils not eligible
for free school
meals (79 per
cent).
Key Stage 2 Table 7.2
summarises Key
Stage 2
attainment in the
National
Curriculum
exams, teacher
assessments and
Borough Profile 2018: Education 12
68%
64%
71%
62%
68%
62%
69%
61%
72%
54%
56%
58%
60%
62%
64%
66%
68%
70%
72%
74%
Figure 7.14: Key stage 2 achieving the expected
standard in reading, writing and maths, 2017*
Source: Source:Department for education, national curriculum Assessments atkey stage 2:2017 (revised) (SFR2017)
*Pupils achieving expected standard Reading & Maths (test) Writing (TA)**Locally calculated figures.
Table 7.3: Key Stage 4 attainment, 2017
(provisional)
Tower Hamlets
London England*
% of pupils achieving 9 - 5pass in English & Maths
44 48 42
% of pupils achieving 9 - 4 pass in English & Maths
65 67 64
Average Attainment 8 score 47 49 46
Average Progress 8 score 0.26(±0.05)
0.22(±0.01)
-0.03
Source: Department for Education, GCSE and equivalent results in England
2017 (provisional) (SFR2017)
Note: Figures in brackets next to Progress 8 scores show 95% confidence intervals *national figures - state funded schools.
a combined measure for reading, writing and maths. It shows that attainment in
Tower Hamlets was higher than England in all subjects, and also higher or equal to
London in all subjects except in science.
Figure 7.14 shows that in 2016, the proportion of girls in Tower Hamlets who
achieved the expected standard in reading, writing and maths (71 per cent) was 7
percentage points higher
than boys (64 per cent).
White pupils have lower levels
of attainment (62 per cent)
than BME pupils (68 per cent).
At key stage 2, pupils whose
first language is not English
have higher levels of
attainment (69 per cent) than
pupils whose first language is
English (62 per cent). Pupils
eligible for free school meals
have lower levels of
attainment (61 per cent) than
pupils not eligible for free
school meals (72 per cent).
Key Stage 4 Table 7.3 summarises Key
Stage 4 provisional
attainment in 2017. It shows
that attainment in Tower
Hamlets was higher than the
national average in terms of the proportion of pupils achieving grades 5 or above in
English and Maths (44 per cent in Tower Hamlets vs. 42 per cent in England), grades
4 or above in English and Maths (65 per cent in Tower Hamlets vs. 64 per cent in
England), and Average
Attainment 8 scores (47
points in Tower Hamlets vs.
46 points in England). In
terms of progress, the
average Progress 8 score in
the borough (0.26) was
higher than the national
score, demonstrating that
pupils in Tower Hamlets
have higher attainment
outcomes than their
national peers with similar
prior attainment.
Borough Profile 2018: Education 13
44%41%
47% 37% 46%41%
47%39%
48%
0%
10%
20%
30%
40%
50%
60%
Figure 7.15: Key stage 4 achieving strong pass 9_5 in
english and maths, 2017 (provisional)
Source: Department for education, GCSE & equivalent results in England:2017 (provisional) (SFR2017 except * contextual figures locally calculated) .
Note: Figures in brackets next to Progress 8 scores show 95% confidence intervals**national figures - state funded schools.
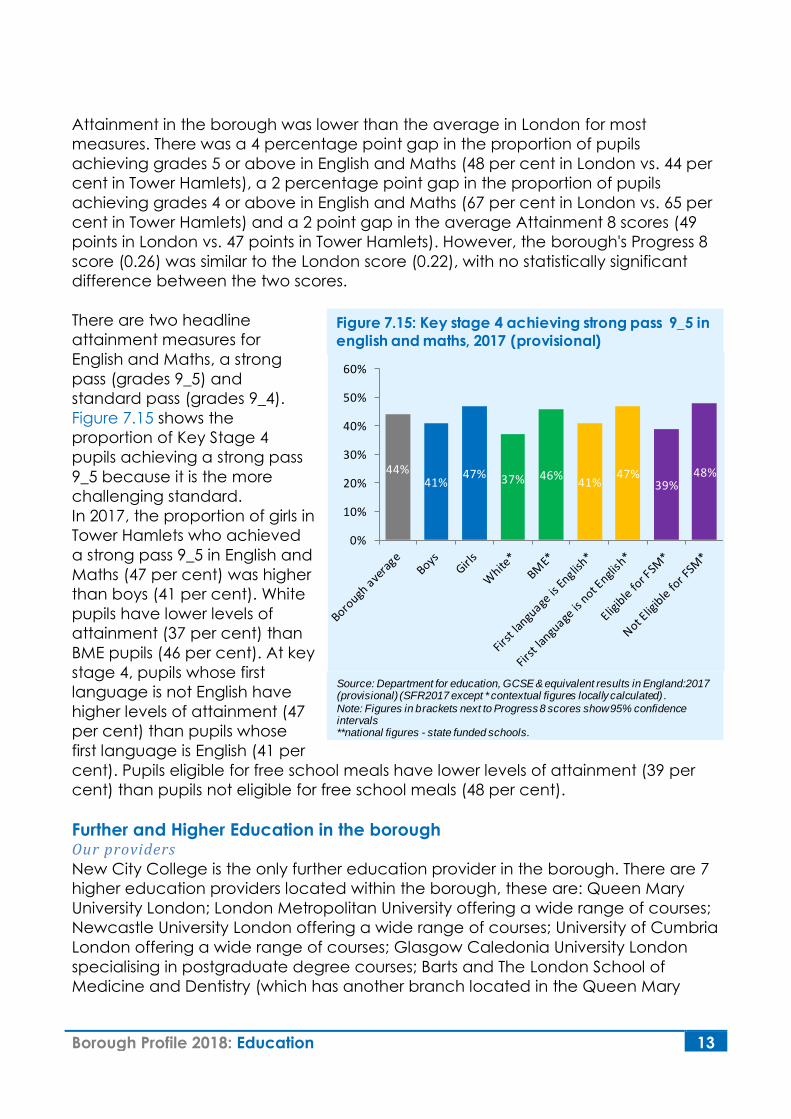
Attainment in the borough was lower than the average in London for most
measures. There was a 4 percentage point gap in the proportion of pupils
achieving grades 5 or above in English and Maths (48 per cent in London vs. 44 per
cent in Tower Hamlets), a 2 percentage point gap in the proportion of pupils
achieving grades 4 or above in English and Maths (67 per cent in London vs. 65 per
cent in Tower Hamlets) and a 2 point gap in the average Attainment 8 scores (49
points in London vs. 47 points in Tower Hamlets). However, the borough's Progress 8
score (0.26) was similar to the London score (0.22), with no statistically significant
difference between the two scores.
There are two headline
attainment measures for
English and Maths, a strong
pass (grades 9_5) and
standard pass (grades 9_4).
Figure 7.15 shows the
proportion of Key Stage 4
pupils achieving a strong pass
9_5 because it is the more
challenging standard.
In 2017, the proportion of girls in
Tower Hamlets who achieved
a strong pass 9_5 in English and
Maths (47 per cent) was higher
than boys (41 per cent). White
pupils have lower levels of
attainment (37 per cent) than
BME pupils (46 per cent). At key
stage 4, pupils whose first
language is not English have
higher levels of attainment (47
per cent) than pupils whose
first language is English (41 per
cent). Pupils eligible for free school meals have lower levels of attainment (39 per
cent) than pupils not eligible for free school meals (48 per cent).
Further and Higher Education in the borough Our providers New City College is the only further education provider in the borough. There are 7
higher education providers located within the borough, these are: Queen Mary
University London; London Metropolitan University offering a wide range of courses;
Newcastle University London offering a wide range of courses; University of Cumbria
London offering a wide range of courses; Glasgow Caledonia University London
specialising in postgraduate degree courses; Barts and The London School of
Medicine and Dentistry (which has another branch located in the Queen Mary
Borough Profile 2018: Education 14
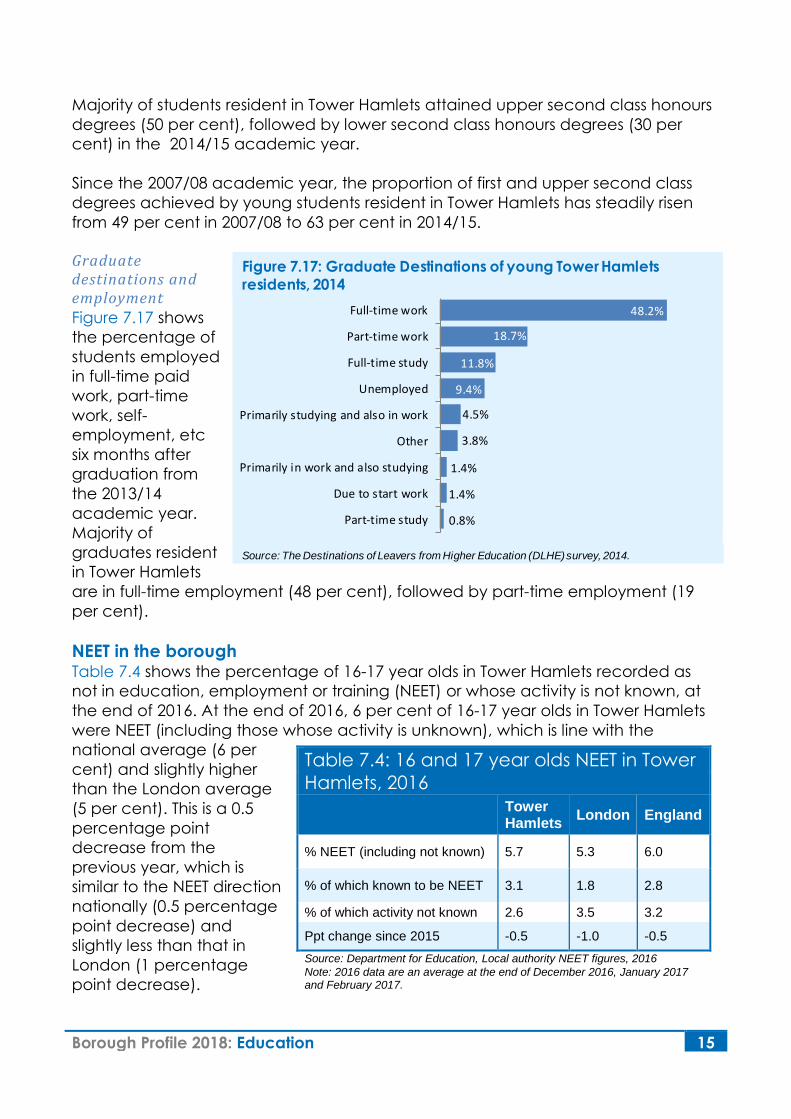
6.7%
30.2%
49.5%
13.6%
Third classhonours/Pass
Lower second classhonours
Upper second classhonours
First class honours
Figure 7.16: Graduate Attainment in Tower Hamlets, 2015
Source: The HE journey of young Tower Hamlets residents 2016.
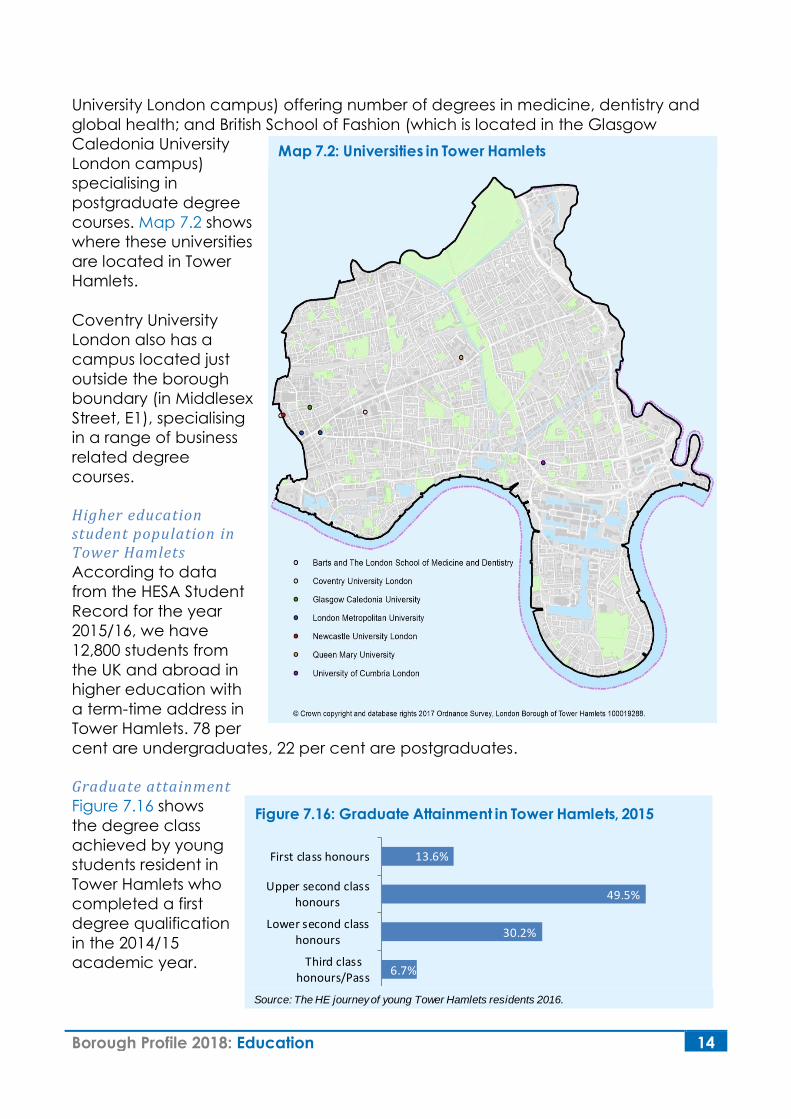
Map 7.2: Universities in Tower Hamlets
University London campus) offering number of degrees in medicine, dentistry and
global health; and British School of Fashion (which is located in the Glasgow
Caledonia University
London campus)
specialising in
postgraduate degree
courses. Map 7.2 shows
where these universities
are located in Tower
Hamlets.
Coventry University
London also has a
campus located just
outside the borough
boundary (in Middlesex
Street, E1), specialising
in a range of business
related degree
courses.
Higher education student population in Tower Hamlets According to data
from the HESA Student
Record for the year
2015/16, we have
12,800 students from
the UK and abroad in
higher education with
a term-time address in
Tower Hamlets. 78 per
cent are undergraduates, 22 per cent are postgraduates.
Graduate attainment Figure 7.16 shows
the degree class
achieved by young
students resident in
Tower Hamlets who
completed a first
degree qualification
in the 2014/15
academic year.
Borough Profile 2018: Education 15
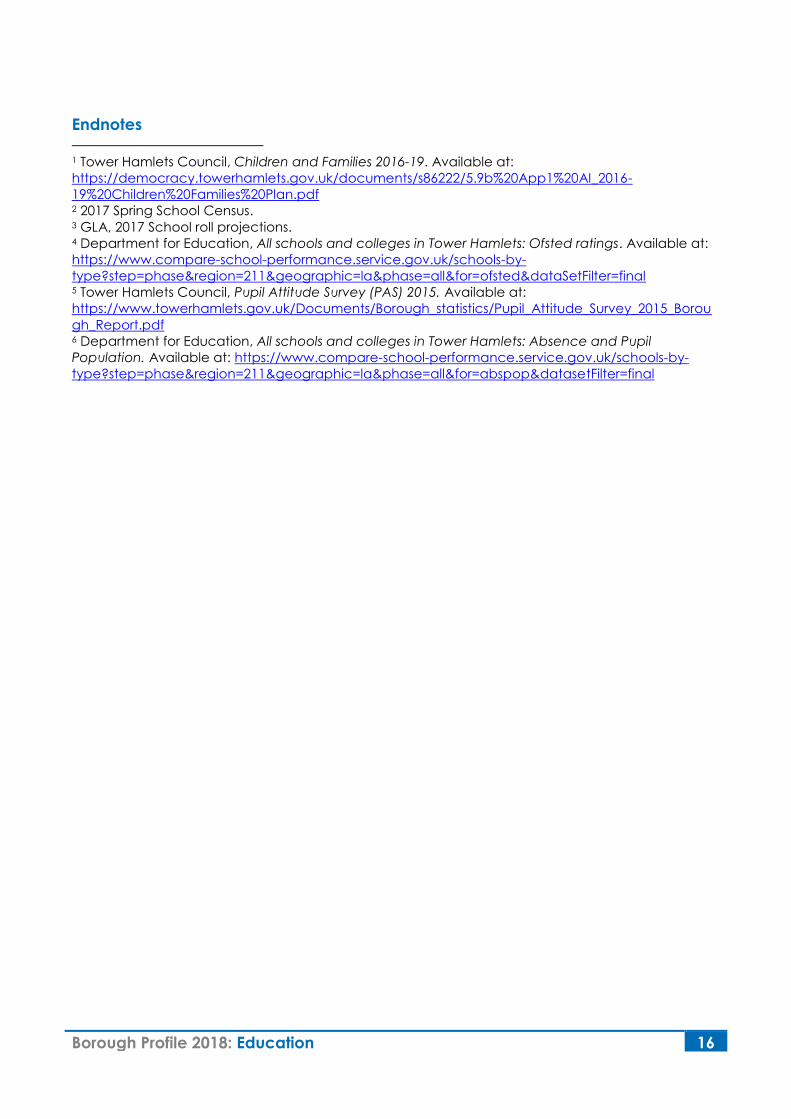
Table 7.4: 16 and 17 year olds NEET in Tower
Hamlets, 2016
Tower Hamlets
London England
% NEET (including not known) 5.7 5.3 6.0
% of which known to be NEET 3.1 1.8 2.8
% of which activity not known 2.6 3.5 3.2
Ppt change since 2015 -0.5 -1.0 -0.5
Source: Department for Education, Local authority NEET figures, 2016
Note: 2016 data are an average at the end of December 2016, January 2017 and February 2017.
0.8%
1.4%
1.4%
3.8%
4.5%
9.4%
11.8%
18.7%
48.2%
Part-time study
Due to start work
Primarily in work and also studying
Other
Primarily studying and also in work
Unemployed
Full-time study
Part-time work
Full-time work
Figure 7.17: Graduate Destinations of young Tower Hamlets
residents, 2014
Source: The Destinations of Leavers from Higher Education (DLHE) survey, 2014.
Majority of students resident in Tower Hamlets attained upper second class honours
degrees (50 per cent), followed by lower second class honours degrees (30 per
cent) in the 2014/15 academic year.
Since the 2007/08 academic year, the proportion of first and upper second class
degrees achieved by young students resident in Tower Hamlets has steadily risen
from 49 per cent in 2007/08 to 63 per cent in 2014/15.
Graduate destinations and employment
Figure 7.17 shows
the percentage of
students employed
in full-time paid
work, part-time
work, self-
employment, etc
six months after
graduation from
the 2013/14
academic year.
Majority of
graduates resident
in Tower Hamlets
are in full-time employment (48 per cent), followed by part-time employment (19
per cent).
NEET in the borough Table 7.4 shows the percentage of 16-17 year olds in Tower Hamlets recorded as
not in education, employment or training (NEET) or whose activity is not known, at
the end of 2016. At the end of 2016, 6 per cent of 16-17 year olds in Tower Hamlets
were NEET (including those whose activity is unknown), which is line with the
national average (6 per
cent) and slightly higher
than the London average
(5 per cent). This is a 0.5
percentage point
decrease from the
previous year, which is
similar to the NEET direction
nationally (0.5 percentage
point decrease) and
slightly less than that in
London (1 percentage
point decrease).
Borough Profile 2018: Education 16
Endnotes
1 Tower Hamlets Council, Children and Families 2016-19. Available at:
https://democracy.towerhamlets.gov.uk/documents/s86222/5.9b%20App1%20AI_2016-
19%20Children%20Families%20Plan.pdf 2 2017 Spring School Census. 3 GLA, 2017 School roll projections. 4 Department for Education, All schools and colleges in Tower Hamlets: Ofsted ratings. Available at:
https://www.compare-school-performance.service.gov.uk/schools-by-
type?step=phase®ion=211&geographic=la&phase=all&for=ofsted&dataSetFilter=final 5 Tower Hamlets Council, Pupil Attitude Survey (PAS) 2015. Available at:
https://www.towerhamlets.gov.uk/Documents/Borough_statistics/Pupil_Attitude_Survey_2015_Borou
gh_Report.pdf 6 Department for Education, All schools and colleges in Tower Hamlets: Absence and Pupil
Population. Available at: https://www.compare-school-performance.service.gov.uk/schools-by-
type?step=phase®ion=211&geographic=la&phase=all&for=abspop&datasetFilter=final