Embed Size (px)
Citation preview

© 2
009 C
arn
eg
ie L
earn
ing
, In
c.
Chapter 7 ● Data Analysis 303
7
7.1 To New Heights!
Variance in Subjective
and Random Samples ● p. 305
7.2 Size
How Sample Size Affects
Results ● p. 313
7.3 Sampling
Comparing Sampling
Techniques ● p. 317
7.4 It’s the Ladies’ Turn!
Designing an Experiment
and Bias ● p. 323
7.5 On Your Own!
Designing, Implementing,
Analyzing, and Reporting a
Data Experiment ● p. 327
A person’s height is determined by various factors, including genetics, diet, and environment.
Adult males are on average taller than adult females, though females reach their full height at an
earlier age. You will use sampling methods to collect, and data analysis to understand, the heights
of the student body at a typical high school.
7C HA PT E R
Data Analysis

304 Chapter 7 ● Data Analysis
© 2
009 C
arn
eg
ie L
earn
ing
, In
c.
7

© 2
009 C
arn
eg
ie L
earn
ing
, In
c.
Lesson 7.1 ● Variance in Subjective and Random Samples 305
7
Large data sets are used to predict the outcomes of elections, summarize public
opinion of political decisions, or measure fuel efficiency of SUVs versus cars. Large
data sets, while extremely useful, can be very difficult to collect and analyze.
For example, the most accurate prediction about an election would involve asking
every voter which candidate they plan on voting for. This may be practical for a class
election involving 25 students but is not possible for a presidential election.
There are many techniques that can be used when collecting data. The technique
used will affect whether the data is representative of the population and the accuracy
of predictions based on the data.
Problem 1 The heights of 100 male students at Lincoln High School are shown in the table at the
end of this lesson.
1. What are the minimum and maximum heights of the male students at Lincoln High
School? What is the range of heights?
ObjectivesIn this lesson, you will:
● Calculate the means of samples of a
population.
● Calculate the means of random
samples of a population.
● Understand a simple random sample.
● Calculate the mean, variance, and
standard deviation of samples.
● Understand the variability of
subjective and random samples.
Key Terms● subjective samples
● random samples
● random number generator
7.1 To New Heights!Variance in Subjective and Random Samples
306 Chapter 7 ● Data Analysis
© 2
009 C
arn
eg
ie L
earn
ing
, In
c.
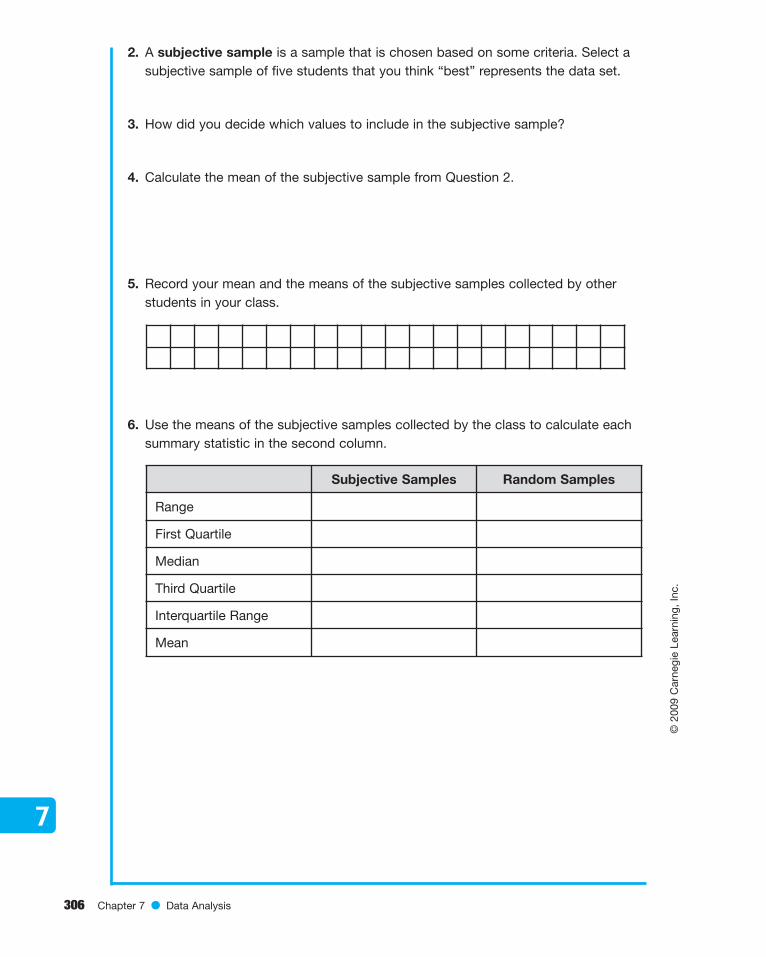
2. A subjective sample is a sample that is chosen based on some criteria. Select a
subjective sample of five students that you think “best” represents the data set.
3. How did you decide which values to include in the subjective sample?
4. Calculate the mean of the subjective sample from Question 2.
5. Record your mean and the means of the subjective samples collected by other
students in your class.
6. Use the means of the subjective samples collected by the class to calculate each
summary statistic in the second column.
7
Subjective Samples Random Samples
Range
First Quartile
Median
Third Quartile
Interquartile Range
Mean

© 2
009 C
arn
eg
ie L
earn
ing
, In
c.
Lesson 7.1 ● Variance in Subjective and Random Samples 307
7. Create a box-and-whisker plot for the subjective samples using the summary
statistics in the second column.
8. Based on the summary statistics and the box-and-whisker plot, what
observations can you make about the subjective samples collected by the class?
9. A random sample is a sample that is produced by randomly selecting data
points. How could you randomly generate numbers between 101 and 200?
10. A random number generator is a machine or program that will generate random
numbers. Many graphing calculators include a random number generator function
that generates a random number between 0 and 1. How could you use a random
number between 0 and 1 to generate random numbers between 101 and 200?
7
676662 63 64 6560 68 7069 71 72 73 74 7561

308 Chapter 7 ● Data Analysis
© 2
009 C
arn
eg
ie L
earn
ing
, In
c.
11. Generate five random numbers from 101 to 200. Enter each random number as a
student ID in the table.
12. Calculate the mean of the random sample from Question 11.
13. Record your mean from Question 12 and all the other means in your class.
14. Use the means of the random samples collected by the class to calculate each
summary statistic in the third column of the table from Question 6.
15. Create a box-and-whisker plot for the random samples using the summary
statistics in the third column. Draw the box-and-whisker plot on the number line
from Question 7.
16. Based on the summary statistics and the box-and-whisker plot, what
observations can you make about the random samples collected by the class?
17. What can you conclude about subjective sampling and random sampling?
Be prepared to share you methods and solutions.
7
Random Student ID#
Height of Student

© 2
009 C
arn
eg
ie L
earn
ing
, In
c.
Lesson 7.1 ● Variance in Subjective and Random Samples 309
Problem 2 The distribution of a set of data can be measured using the population distribution or
a sample distribution. The population distribution is categorized by the mean and
standard deviation. For the male students at Lincoln High School, the mean height is
69.02 inches.
Remember that the variance is the average squared distance between the mean and
each data point. The standard deviation is the square root of the variance. For the
heights of male students at Lincoln High School, the variance is approximately 13.18
and the standard deviation is approximately 3.63.
For large data sets, calculating the mean, variance, and standard deviation of the
entire data set can be difficult and time consuming. The mean, variance, and standard
deviation of a sample of the data are often used to estimate the statistics for the entire
data set.
1. Calculate the standard deviation for the random samples collected by the class, as
shown in the table from Problem 1 Question 13, by performing the following steps.
a. Identify the mean of the random samples.
b. Calculate the difference between each random sample mean and the mean of all
the random sample means.
c. Square each difference. Then sum the squares.
d. Divide the sum of the squares by the number of sample means minus one. This
is the sample variance.
e. Take the square root of the quotient. This is the sample standard deviation.
7

310 Chapter 7 ● Data Analysis
© 2
009 C
arn
eg
ie L
earn
ing
, In
c.
2. Compare the actual standard deviation to the standard deviation of the random
samples. How close are these values?
3. Explain why you saw the results that you did in Question 2.
4. Calculate the variance of the entire data set divided by the size of each random
sample population, which is 5.
5. Calculated the standard deviation using this calculated variance.
6. Compare this calculated standard deviation to the standard deviation of the ran-
dom samples. How close are these values?
7. Explain why you saw the results that you did in Question 6.
7

© 2
009 C
arn
eg
ie L
earn
ing
, In
c.
Lesson 7.1 ● Variance in Subjective and Random Samples 311
The Heights of the One Hundred Male Students at Lincoln High School
Be prepared to share your methods and solutions.
7
118 71 143 68 168 74 193 68
119 69 144 66 169 73 194 70
120 68 145 69 170 75 195 71
121 70 146 67 171 72 196 67
122 71 147 70 172 74 197 67
123 66 148 68 173 74 198 64
124 70 149 71 174 73 199 70
125 69 150 66 175 65 200 69
Student Height in Student Height in Student Height in Student Height in
ID# Inches ID# Inches ID# Inches ID# Inches
101 67 126 66 151 70 176 63
102 71 127 67 152 70 177 63
103 66 128 71 153 67 178 64
104 70 129 66 154 68 179 64
105 68 130 64 155 70 180 65
106 70 131 59 156 71 181 65
107 72 132 67 157 71 182 73
108 69 133 63 158 69 183 73
109 70 134 63 159 72 184 74
110 71 135 63 160 69 185 68
111 63 136 65 161 72 186 67
112 78 137 67 162 73 187 67
113 76 138 71 163 73 188 71
114 77 139 72 164 73 189 70
115 75 140 67 165 63 190 68
116 61 141 70 166 73 191 72
117 68 142 72 167 73 192 68

312 Chapter 7 ● Data Analysis
© 2
009 C
arn
eg
ie L
earn
ing
, In
c.
7

© 2
009 C
arn
eg
ie L
earn
ing
, In
c.
Lesson 7.2 ● How Sample Size Affects Results 313
7
Problem 1 In the last activity you used random samples of 5 elements to characterize a larger
population. In this lesson you will explore the effects of changing the size of the
random sample.
1. Generate 10 random numbers from 101 to 200. Enter each random number as a
student ID in the table.
2. Calculate each summary statistic for your random sample of size 10.
ObjectivesIn this lesson, you will:
● Understand how sample size affects the sample distribution.
7.2 SizeHow Sample Size Affects Results
Student ID#
Student Height
Individual Sample
of Size 10
All Samples
of Size 10
All Samples
of Size 5
Range
First Quartile
Median
Third Quartile
Interquartile Range
Mean

314 Chapter 7 ● Data Analysis
© 2
009 C
arn
eg
ie L
earn
ing
, In
c.
3. Record your mean and all the other means in your class for a sample size of 10.
4. Use the means of the random samples collected by the class to calculate each
summary statistic in the second column of the table from Question 2.
5. You calculated the summary statistics for the random samples of size 5 in
Problem 1 Question 14. Copy these values into the third column of the table from
Question 2.
6. Create box-and-whisker plots for the random samples of size 5 and 10 using the
summary statistics in the second and third columns.
7. What differences do you notice about the box-and-whisker plots for the different
sample sizes? What can you conclude from these differences?
8. Estimate the standard deviation of the sampling distribution of size 10 by
calculating .
9. How does the estimated standard deviation of the sampling distribution of
size 10 compare with the estimated standard deviation of the sampling distribution
of size 5?
3.63
�10
7

© 2
009 C
arn
eg
ie L
earn
ing
, In
c.
Lesson 7.2 ● How Sample Size Affects Results 315
10. What would you expect to see if the size of the random sample was
increased to 20?
11. How does the size of the random sample affect how well the random sample
represents the entire data set?
12. Why is it not always possible to use large-sized random samples?
Be prepared to share your methods and solutions.
7

316 Chapter 7 ● Data Analysis
© 2
009 C
arn
eg
ie L
earn
ing
, In
c.
7

© 2
009 C
arn
eg
ie L
earn
ing
, In
c.
Lesson 7.3 ● Comparing Sampling Techniques 317
7
Problem 1Previously you examined two sampling techniques, subjective sampling and random
sampling. In this lesson, you will explore two additional sampling techniques, stratified
random sampling and clustered sampling.
A stratified random sample is a random sample where the population is divided into
two or more groups according to some criteria (called strata) such as grade level or
geographic location.
For the 100 male students at Lincoln High School, students numbered 101 to 145 are
juniors and seniors. Students numbered 146 to 200 are freshmen and sophomores.
1. Randomly select 5 juniors and seniors. Record their student IDs and heights in the
table.
2. Calculate the mean of the random sample from Question 1.
3. Randomly select 5 freshmen and sophomores. Record their student IDs and
heights in the table.
ObjectivesIn this lesson, you will:
● Use different sampling techniques.
● Understand how other sampling
techniques compare.
Key Terms● stratified random sampling
● cluster sampling
7.3 SamplingComparing Sampling Techniques
Student ID#
Student Height
Student ID#
Student Height

318 Chapter 7 ● Data Analysis
© 2
009 C
arn
eg
ie L
earn
ing
, In
c.
4. Calculate the mean of the random sample in Question 3.
5. What is the ratio of male juniors and seniors to total male students? What is the
ratio of male freshmen and sophomores to total male students?
6. Calculate the mean of the entire sample by multiplying each sample mean by
the ratio of each group and adding the result.
7. Record your mean and all the other means for the stratified random samples of
size 10 in your class.
8. You calculated the summary statistics for the random samples of size 10 in Lesson 9.2
Problem 1 Question 4. Copy these values into the second column of the table.
9. Calculate each summary statistic for the stratified random samples of size 10 to
complete the third column of the table in Question 8.
7
Random Sample
of Size 10
Stratified Random
Sample of Size 10
Range
First Quartile
Median
Third Quartile
Interquartile Range
Mean
© 2
009 C
arn
eg
ie L
earn
ing
, In
c.
Lesson 7.3 ● Comparing Sampling Techniques 319
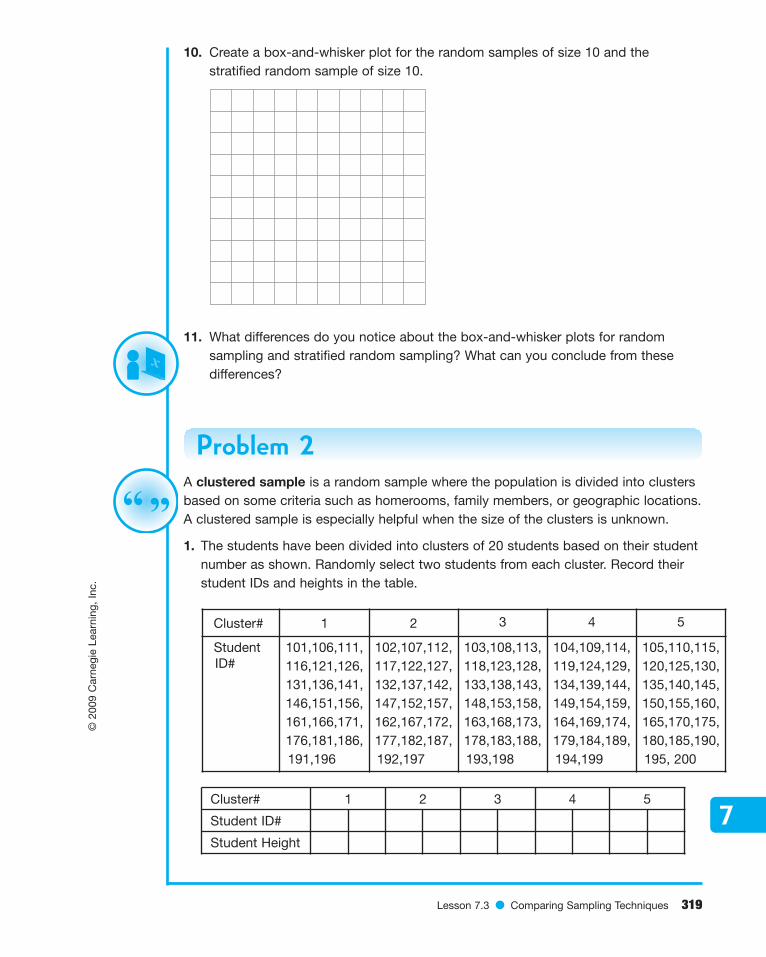
10. Create a box-and-whisker plot for the random samples of size 10 and the
stratified random sample of size 10.
11. What differences do you notice about the box-and-whisker plots for random
sampling and stratified random sampling? What can you conclude from these
differences?
Problem 2A clustered sample is a random sample where the population is divided into clusters
based on some criteria such as homerooms, family members, or geographic locations.
A clustered sample is especially helpful when the size of the clusters is unknown.
1. The students have been divided into clusters of 20 students based on their student
number as shown. Randomly select two students from each cluster. Record their
student IDs and heights in the table.
7
Cluster# 1 2 3 4 5
Student
ID#
101,106,111,
116,121,126,
131,136,141,
146,151,156,
161,166,171,
176,181,186,
191,196
102,107,112,
117,122,127,
132,137,142,
147,152,157,
162,167,172,
177,182,187,
192,197
103,108,113,
118,123,128,
133,138,143,
148,153,158,
163,168,173,
178,183,188,
193,198
104,109,114,
119,124,129,
134,139,144,
149,154,159,
164,169,174,
179,184,189,
194,199
105,110,115,
120,125,130,
135,140,145,
150,155,160,
165,170,175,
180,185,190,
195, 200
Cluster# 1 2 3 4 5
Student ID#
Student Height

320 Chapter 7 ● Data Analysis
© 2
009 C
arn
eg
ie L
earn
ing
, In
c.
2. Calculate the mean of the clustered sample from Question 1.
3. Record the mean of the clustered samples collected by other students in your
class.
4. Copy the values from Problem 1 Question 8 into the first and second columns of
the table. Calculate each summary statistic for the clustered samples of size 10 to
complete the third column of the table.
5. Create a box-and-whisker plot for each sampling technique using the summary
statistics in the table.
7
Random Sample
of Size 10
Stratified Random
Sample of Size 10
Clustered Samples
of Size 10
Range
First Quartile
Median
Third Quartile
Interquartile Range
Mean

© 2
009 C
arn
eg
ie L
earn
ing
, In
c.
Lesson 7.3 ● Comparing Sampling Techniques 321
6. Compare the summary statistics and box-and-whisker plots for the three sampling
techniques.
Each sampling technique is used for different reasons. Finding truly random
samples is often difficult and very costly because of the time and effort involved in
choosing and accessing an appropriate sample population. Stratified random
sampling can be less costly and can provide information about each group.
For example, stratified random sampling provides information about the average
height of senior boys at Lincoln High School. Clustering is often least expensive
when the clusters are clearly defined.
The goal of each sampling technique is to reduce variability and ensure that the
results reflect simple, representative statistics of the whole population.
Be prepared to share your methods and solutions.
7

322 Chapter 7 ● Data Analysis
© 2
009 C
arn
eg
ie L
earn
ing
, In
c.
7

© 2
009 C
arn
eg
ie L
earn
ing
, In
c.
Lesson 7.4 ● Designing an Experiment and Bias 323
7
Problem 1The heights of 100 female students at Lincoln High School are shown in the table at
the end of this lesson. The student ID number indicates grade level as follows.
• Students numbered 171 to 200 are freshmen.
• Students numbered 148 to 170 are sophomores.
• Students numbered 124 to 147 are juniors.
• Students numbered 101 to 123 are seniors.
The Lincoln School District covers four communities: Shady, Willow Hills, Colliers, and
Davis. Some students attending Lincoln High School live outside the school district.
A summary of students from each community is as follows.
• Shady: 102, 107, 111, 113, 119, 120, 135, 138, 147, 153, 161, 167, 168, 171, 178,
180, 189, 191, 194, 197, 199
• Willow Hills: 101, 108, 112, 116, 118, 124, 126, 131, 133, 140, 145, 148, 151, 155,
157, 162, 166, 173, 177, 184, 193, 200
• Colliers: 103, 106, 110, 115, 117, 121, 122, 127, 129, 132, 141, 143, 144, 149, 154,
156, 158, 163, 169, 172, 175, 179, 181, 185, 188, 190, 192, 196
• Davis: 104, 109, 114, 123, 125, 134, 136, 137, 139, 142, 146, 150, 152, 159, 160,
164, 165, 170, 174, 176, 182, 186, 187
• Outside School District: 105, 128, 130, 183, 195, 198
ObjectivesIn this lesson, you will:
● Design an experiment to characterize
a population distribution.
● Analyze the experimental design for
bias.
Key Term● bias
7.4 It’s the Ladies’ Turn!Designing an Experiment and Bias

324 Chapter 7 ● Data Analysis
© 2
009 C
arn
eg
ie L
earn
ing
, In
c.
1. Design an experiment to examine the distribution of the female students of Lincoln
High School. The experiment design should include the following:
a. The sampling technique used: random sampling, stratified random sampling, or
clustered sampling
b. The size of each sample
c. The number of samples to be gathered
d. The method that will be used to analyze the means of the samples
e. An explanation of why each design decision was made
2. Perform the experiment. The experiment results should include the following:
a. A record of all data used
b. All calculations on the data
3. Analyze the experiment. The experiment analysis should include the following:
a. Conclusions about distribution
b. Any tables or graphs to display the data
c. A summary of how bias was accounted for. In statistics, bias is defined as
including too many data points that share a similar trait, not representative of
the data.
4. Report on the experiment. Prepare a presentation to summarize the experiment
design, results, and analysis.
7

© 2
009 C
arn
eg
ie L
earn
ing
, In
c.
Lesson 7.4 ● Designing an Experiment and Bias 325
The Heights of the One Hundred Female Students at Lincoln High School
Be prepared to share your methods and solutions.
7
Student Height in Student Height in Student Height in Student Height in
ID# Inches ID# Inches ID# Inches ID# Inches
101 65 126 64 151 68 176 61
102 69 127 65 152 68 177 61
103 64 128 69 153 65 178 62
104 68 129 64 154 66 179 62
105 66 130 62 155 68 180 63
106 68 131 57 156 69 181 63
107 70 132 65 157 69 182 71
108 67 133 61 158 67 183 71
109 68 134 61 159 70 184 72
110 69 135 61 160 67 185 66
111 61 136 63 161 70 186 65
112 76 137 65 162 71 187 65
113 74 138 69 163 71 188 69
114 75 139 70 164 71 189 68
115 73 140 65 165 61 190 66
116 59 141 68 166 71 191 70
117 66 142 70 167 71 192 66
118 69 143 66 168 72 193 66
119 67 144 64 169 71 194 68
120 66 145 67 170 73 195 69
121 68 146 65 171 70 196 65
122 69 147 68 172 72 197 65
123 64 148 66 173 72 198 62
124 68 149 69 174 71 199 68
125 67 150 62 175 63 200 67

326 Chapter 7 ● Data Analysis
© 2
009 C
arn
eg
ie L
earn
ing
, In
c.
7

© 2
009 C
arn
eg
ie L
earn
ing
, In
c.
Lesson 7.5 ● Designing, Implementing, Analyzing, and Reporting a Data Experiment 327
7
Problem 1Many experiments pose a specific question that can be answered with a numerical
answer. For instance:
• What is the average height of all the students in a school?
• What is the average number of buildings on a block in a town or city?
• What is the average household income in a school district, county, or state?
Now, it’s your turn to design your own experiment!
Think of a question that you would like to answer that has a numerical answer. Be sure
to think about the availability of data, any difficulties that may arise in collecting the
data, the size of the population, and any other challenges that may make answering
your question difficult.
After you have decided upon the question that you want to answer, design and carry
out your experiment. Then, analyze the results and prepare a report.
1. Design the experiment. The experiment design should include the following:
a. The sampling technique used: random sampling, stratified random sampling, or
clustered sampling
b. The size of each sample
c. The number of samples to be gathered
d. The method that will be used to analyze the means of the samples
e. An explanation for why each design decision was made
ObjectivesIn this lesson, you will:
● Design an experiment to characterize a population distribution.
● Implement an experiment to characterize a population distribution.
● Analyze an experiment to characterize a population distribution.
● Report the results of an experiment to characterize a population distribution.
7.5 On Your Own!Designing, Implementing, Analyzing, andReporting a Data Experiment

328 Chapter 7 ● Data Analysis
© 2
009 C
arn
eg
ie L
earn
ing
, In
c.
2. Perform the experiment. The experiment results should include the following:
a. A record of all data used
b. All calculations on the data
3. Analyze the experiment. The experiment analysis should include the following:
a. Conclusions about distribution
b. Any tables or graphs to display the data
c. A summary of how bias was accounted for
4. Report on the experiment. Prepare a presentation to summarize the experiment
design, results, and analysis.
Be prepared to share your methods and solutions.
7