Embed Size (px)
Citation preview
129
7. Conclusion and Recommendation
The motivation for carrying out this study was to test a methodology proposed by the
Monitoring Task Force of RiME (1) to measure if and how the objectives of the authorisation
under REACH have been achieved.
The Monitoring Task Force has been initiated in RiME with the intention to shed more light
on the rather controversial discussion about the impacts of authorisation policy under
REACH. While some parties consider this new element of the REACH legislation as a new
and efficient instrument to motivate substitution measures by industry other parties reckon
that authorisation is an additional burden for companies which causes high costs and
competitive disadvantages in the world market but no significant positive effects in terms of
risk reduction and safety.
The monitoring methodology proposed by the Monitoring Task Force of RiME is based on
the idea of deriving a number of relative simple, quantitative indicators based on information
from REACH registration data and other information sources, supplemented with additional,
more qualitative and case-by-case background information, which in combination should
allow to monitor the progress made by the authorisation policy in relation to its major
objectives.
More specifically, the indicators together with the other information were considered to
support answering the main policy questions concerning the achievement of the goals of
authorisation under REACH such as:
7. Has the objective of substitution worked?
8. Are there less articles containing SVHCs on the market or has production and uses of
SVHCs just been shifted outside Europe?
9. What are the major substitutes for SVHCs and are these alternates safer?
10. Have authorisation decisions led to better control of risks?
11. Is the authorisation as such or parts thereof a cost-effective policy for protecting man and
environment?
12. Does authorisation work better for certain types of substances than for others and would
this help to make more appropriate choices on SVHC candidates?
For the details on the concept behind the proposed methodology the reader is referred to the
final document developed by the Monitoring Task Force of RiME (1).
Table 20 gives an overview of the proposed indicators and other types of information studied
in this project.

130
Table 21 summarises the SVHCs for which these indicators and information have been
collected in this project.

131
Table 20: Summary of the proposed indicators from IUCLID and other types of
information collected for this study
Name Abbreviation Description
Data from the IUCLID - Database
Registrations
Number of active
registrations
Nr. of active
reg.
Total number of active registrations at the specific
milestones
Number of
registrations
Nr. of reg. Total number of registrations at the specific
milestones
Number of
registrations
revoked/ceased
Nr. of reg.
revoked/ceased
Total number of registrations revoked/ceased/
inactivated at the specific milestones
Spontaneously updated
registrations
- Update of Registrations at a given Milestones, were
the reason was declared as “spontaneous”.
Average frequency of
update
Average freq.
of update
The frequency of dossier updates is defined as the
average number of updates within the period of two
subsequent milestones, related to those dossiers
which were updated within this period. Example: if
there are ten registration dossiers of which three
were updated between the milestones “Annex XIV”
and “LAD” and one was updated 5 times, the other
one 3 times and the last one 1 times (total of 9
updates) the frequency of dossier updates is 9/3 = 3.
The frequency of dossier updates is always
attributed to the second of the two milestones under
consideration.
Tonnage
Total Volume - Total volume consisting of manufactured and
imported volumes per year for all registrants
Volume for
Intermediate and on
site isolated
intermediate
Total Inter.
And OSII
Total volume of Inter. And OSII per year and for all
registrants
Uses – Profile
Life cycle stages LCS List of all uses for the different milestones and the
different LCS: Manufacture, Formulation,
Industrial, Professional, Consumer, Article Service
Life (ASL)
Use-Descriptor-Profile UDP List of all uses for the different milestones and the
different categories: Article category (AC);
Environmental release category (ERC); Product
category (PC); Process category (PROC); Sector of
End-use (SU); Technical Functions (TF)
Uses applied for AfA List of all uses which have been “applied for an
authorisation” (AfA = Application for
Authorisation)
Ceased Manufactured Registrations which have been classified as “ceased
manufactured” at a specified time point
Uses advised against UAA Uses which the industry advises against.

132
Name Abbreviation Description
Other types of information:
Monitoring data
European Pollutant
Release and Transfer
Register
E-PRTR This register is operated by the European
Environment Agency (EEA) and comprises the
environmental emission data reported by industrial
facilities in the EU, including Iceland,
Liechtenstein, Norway, Serbia and Switzerland
which are governed by the regime of the Industrial
Emissions Directive (IED) 2010/75/EU.
European Environment
Information and
Observation Network
EIONET Partnership network of the European Environment
Agency (EEA) and its member and cooperating
countries involving approximately 1000 experts and
more than 350 national institutions. The network
supports the collection and organisation of data and
the development and dissemination of information
concerning Europe’s environment.
Water Framework
Directive
INERIS Aquatic monitoring information collected by the
institute INERIS between 2000 and 2008 for the
purpose of the first revision of the list of priority
substances (list has been established in 2000)
JRC The project of the Joint Research Centre in ISPRA
was started in 2014 and is aimed to be finished in
2019. Under this project, aquatic monitoring data
have been collected for the period 2006-2015.
Volume related data European statistics Eurostat The Statistical Office of the European Union,
located in Luxembourg, collates and provides high
quality statistical information for the whole of
Europe. This includes production data such as
production volumes for a number of sectors and
industries.
Substances in
Preparations in Nordic
Countries
SPIN Denmark, Finland, Norway and Sweden have
established national product registers which contain
information concerning the downstream uses of
chemical substances in products on the national
markets.
Ceresana (Market
Intelligence
Consulting)
This commercial market study contains a brief
introduction to the main field of usage of the
phthalates in the plasticizing of brittle material to
soft and flexible ones. The market report covers all
relevant data and facts regarding the plasticizers
market, market trends, - size and – growth on a
global, international level.
133
Name Abbreviation Description
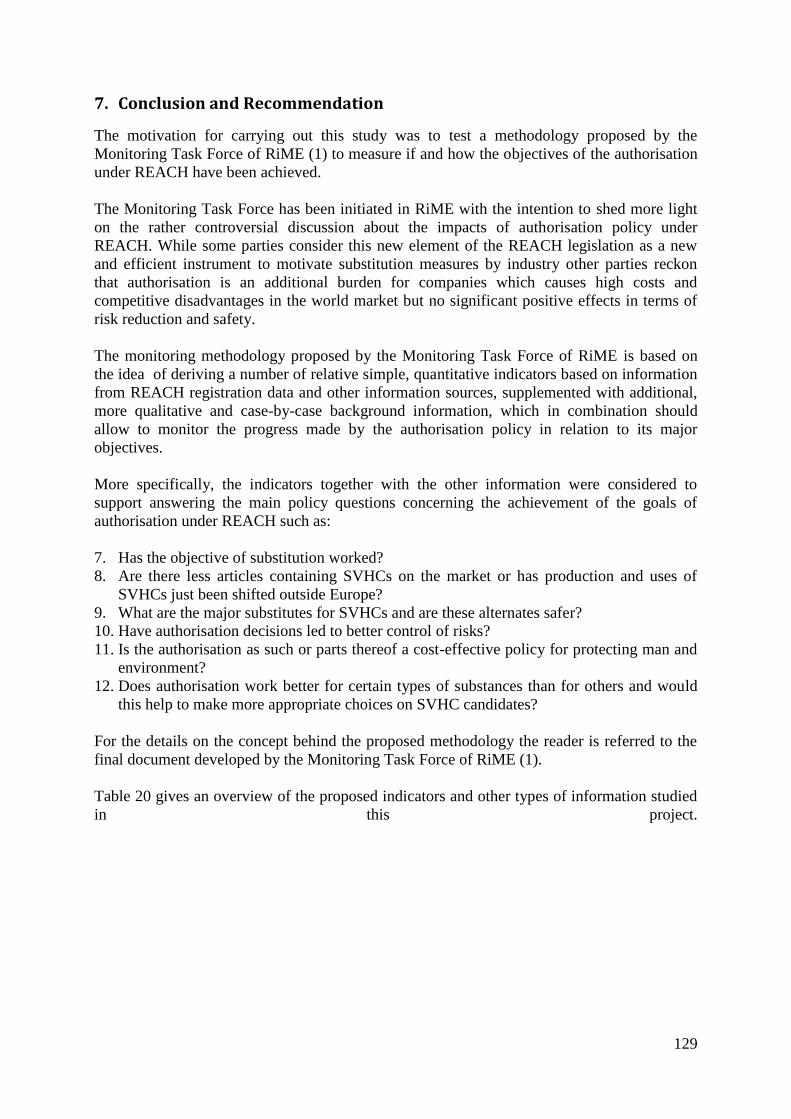
Questionnaire distributed for the purpose of this project
Survey to the industry A brief outline of the structure of the electronic
questionnaire is provided in Figure 7. Details can be
found in Annex II.
Survey to authorisation
holders
Four authorisation holders agreed to participate in a
follow-up questionnaire – one responded to the
follow-up
Substitution related information Substitution Support
Portal
Subs-Port Free-of-charge, multilingual platform for
information exchange on alternative substances and
technologies, as well as tools and guidance for
substance evaluation and substitution management.
The web portal aims to be the first entry point for
anyone interested in substituting hazardous
chemicals, to support companies in fulfilling
substitution requirements within EU legislation.
Analysis of
Alternatives
AoA For the purpose of this project, the AoAs carried out
by applications for authorisations for the SVHCs
under consideration have been assessed for possible
alternative substances/technologies of a specific use
and substance

134
Table 21: Summary of the available data from the different databases for the selected
SVHC’s – Some of the databases are not listed in this summary as the data for the
selected substances were not adequate enough (see Chapter 5. Data for this study). X
indicates that information for the substance is available from the respective data source/
or has been provided in the survey.
Name EC Nr. IUCLID EIONET E-PRTR Eurostat SPIN Sur-
vey
1,2-Bis(2-
methoxyethoxy)
ethane (TEGDME)
203-
977-3 X - - - X -
1,2-
Dimethoxyethane;
ethylene glycol
dimethyl ether
(EGDME)
203-
794-9 X - - - X -
2-Ethoxyethanol
(EGEE)
203-
804-1 X - - - X X
2-Methoxyethanol
(EGME)
203-
713-7 X - - - X -
Lead monoxide
(lead oxide)
215-
267-0
X
Total Pb
Pb-
compounds - X -
Orange lead
(lead tetroxide)
215-
235-6 X Total Pb
Pb-
compounds - X -
Pentalead
tetraoxide sulphate
235-
067-7 X Total Pb
Pb-
compounds - X -
Tetralead trioxide
sulphate
235-
380-9 X Total Pb
Pb-
compounds - X -
Trixylyl phosphate 246-
677-8 X -
Total
Phosphorus - X X
Diazene-1,2-
dicarboxamide
(ADCA)
204-
650-8 X - - - X X
Diisopentyl
phthalate (DPP)
210-
088-4 X - - - - -
1,2-Dichloroethane
(EDC)
203-
458-1 X X X X X X
2,2'-Dichloro-4,4'-
methylenedianiline
(MOCA)
202-
918-9 X - Total Cl - X X
Bis(2-
methoxyethyl)
ether (Diglyme)
203-
924-4 X - - - X -
Formaldehyde,
oligomeric reaction
products with
aniline
500-
036-1 X - - - X X
Trichloroethylene
(TCE)
201-
167-4 X - X X X X

135
Name EC Nr. IUCLID EIONET E-PRTR Eurostat SPIN Sur-
vey
4,4'- Diaminodi-
phenylmethane
(MDA)
202-
974-4 X - - - X -
Benzyl butyl
phthalate (BBP)
201-
622-7 X X - - - -
Bis (2-ethylhexyl)
phthalate (DEHP)
204-
211-0 X X X X X X
Diarsenic trioxide 215-
481-4 X
As-
Compoun
ds
As-
Compound
s
- X -
Dibutyl phthalate
(DBP)
201-
557-4 X - - - X X
Diisobutyl
phthalate (DIBP)
201-
553-2 X - - - X X
Tris(2-chloroethyl)
phosphate
204-
118-5 X -
Total-Cl
and phos. - X -
1,2-Benzenedi
carboxylic acid, di-
C6-10-alkyl esters
271-
094-0
272-
013-1
X - - - - -
1,2-Benzenedi
carboxylic acid,
dihexylester,
branched and linear
271-
093-5 X - - - - -
1,2-Diethoxyethane 211-
076-1 X - - - - -
Dihexyl phthalate 201-
559-5 X - - - - -
1,2-Benzenedi
carboxylic acid, di-
C6-8-branched
alkyl esters,
C7-rich
276-
158-1 X - - - X -
1,2-Benzenedi
carboxylic acid, di-
C7-11-branched
and linear alkyl
esters
271-
084-6 X - - - - -
1,2-Benzenedi
carboxylic acid,
dipentylester,
branched and linear
284-
032-2 X - - - - -
Bis(2-
methoxyethyl)
phthalate
204-
212-6 X - - - X -
Dipentyl phthalate
(DPP)
205-
017-9 X X - - - X

136
The obtained results have been discussed in detail in section 6. In this chapter a summary of
the results and specific as well as general recommendations are provided.
It is important to note that the proposed approach by the Monitoring Task Force of RiME was
largely based on the assumption that relative simple indicators, mainly derived from
registration information, would provide quantitative figures which allow for a more or less
informed answer to the policy questions cited above. During the preparation of the
methodology a number of parties already envisaged that the proposed indicators would as
such be difficult to interpret and thus it was proposed to supplement the data by other relevant
information which would help to better understand the indicators. As an overall result from
the discussion in section 6 it must be concluded that the proposed indicators together with the
level of detail of other information gathered in this project were clearly insufficient to provide
an informed answer to the policy questions cited above.
As has been discussed in section 6 a shortcoming for most of the proposed indicators is that
the relevant registration data available electronically in ECHA´s data-base are flawed for a
number of possible reasons such as:
- incomplete updates by registrants (e.g. of tonnages)
- misinterpretations of certain requirements under REACH by registrants
- lack of understanding of the required information, e.g. use descriptors, by registrants
- limitations of the detail of information in the electronically stored data, e.g. on the uses
- possible errors in data connected with IUCLID migration issues
ECHA in cooperation with registrants and Member State authorities make continuous efforts
to improve the quality of registration information stored in the data base but it remains
doubtful if a level of quality and detail of information in the data-base will realistically be
achievable in the future which will allow the derivation of more consistent and meaningful
figures for the proposed indicators. This leads to the first recommendation.
Recommendation 1: Even if joined efforts may lead to a significant increase of the quality of
registration information in ECHA´s database, the indicators studied in this project may, in
principle, be too simple to provide a sufficiently detailed measure for the achievement of
authorisation objectives. It will thus be necessary to consider alternative approaches.
One option would be the establishing of a set of more detailed and complex
indicators/parameters which would allow for a more precise mapping of the existing
information in registration dossiers to the policy questions quoted above. For example: An in-
depth case-by-case analysis of the use-profiles and categories for each individual substance
may be carried out, leading to a new set of quantitative measurable indicators which provide a
more detailed information with respect to the policy questions.
Name EC Nr. IUCLID EIONET E-PRTR Eurostat SPIN Sur-
vey
Diarsenic
pentaoxide
215-
116-9 X Total As
As-
compounds - X -
Lead chromate 231-
846-0 X
Total Cr
Total Pb
Cr (VI)
Cr&Pb-
compounds
Cr, Mn,
Pb & Cu
oxides
&hydro-
xides
X -

137
Another option would be to move the focus of the assessment from the registration
information and the authorisation procedures to success stories of substitution. Companies
who have successfully achieved the substitution of a SVHC should be generally expected to
be interested in sharing their experiences. Studying the reasons, the detailed steps and the
efforts needed for implementing alternatives would provide, inter alia, concrete information
about the barriers for substitution. Such an approach may also provide a new set of indicators
which may allow for a quantitative or semi-quantitative description of degree to which
substitution has been achieved.
It is recommended that ECHA could play a key role in the assessment of substitution and in
the development of reliable indicators describing the progress of substitution, and the barriers
to it.
Given that the methodology proposed by the Monitoring Task Force of RiME (1) has
generally shown to be unable to provide informed answers to the main political questions
quoted above, the following summary highlights, for each of these questions, the major
difficulties encountered with the proposed indicators. Where possible, specific
recommendations are provided how the quality of the indicators may still be improved to
become useful. Where this does not seem possible, more general recommendations are given
on possible actions to improve the efficiency of authorisation with respect to the aspects
addressed by those policy questions.
7.1. Question I: Has the objective of substitution worked?
According to Table 4 there are four substances (diisobutyl phthalate= DIBP, benzyl butyl
phthalate = BBP, tris(2-chloroethyl)phosphate = Tris and 4,4-diaminodiphenylmethhane =
MDA) for which the sunset date has already been reached before the deadline of this project
(end of 2015) and for which no applications for authorisations (AfAs) have been submitted to
ECHA. Strictly speaking, uses which fall within the scope of authorisation are not any more
allowed in Europe. The fact that no AFAs have been received by ECHA is a clear indication
that these substances have been successfully replaced either by applying alternative
techniques or alternative substances (or that uses have been moved outside Europe). The
question is whether the success in substitution may be attributed to the authorisation policy
under REACH?
A consistent picture cannot be provided and thus no satisfactory answer can be given to this
question. For MDA, the major use of the substance is as an intermediate in chemical industrial
manufacturing, which as such falls outside of the scope of authorisation. Therefore, only little
effects from authorisation can be envisaged, and are, indeed, not observed. For DIBP and
TCE, Figure 13 to Figure 16, a relative clear decrease of the unique uses of the different life
cycle stages and use categories following the latest date of application can be observed. This
could be taken as an indication that for a number of life cycle stages and use categories
substitution of these compounds have been successfully implemented. It must be noted,
however, that e.g. the IUCLID-based volume for DIBP has decreased after the first
registration date until the project deadline by about 40% but is still reported in IUCLID at
tonnage level significantly above zero. Given that the sunset date has already passed and uses
within the scope of authorisation are not any more legal, this is a surprising discrepancy. It
remains to be examined whether the remaining uses of DIBP still reported in IUCLID are
actually legal uses (outside of authorisation) or rather artefacts because of a lack of updating.
Even more problematic is the behaviour for BBP. As can be seen from Figure 12 the chemical
product category and the article category increase after the latest application date (LAD), and
the same occurs for consumer use in the life cycle stages (see Figure 14). A closer

138
investigation showed that these changes after the LAD relate to wide dispersive use and use in
coatings by consumers which both indicate an increase rather than a decrease in terms of
risks.
For illustration Box 1 depicts the behaviour of use-category based indicators and IUCLID
volumes for the two phthalates DIBP and BBP.
Box 1: Substitution?
Recommendation 2: For SVHCs which have already reached the sunset date, the analysis of
the indicators based on registered tonnages and use descriptors over the time line should be
used for a consistency check. If there are indications of continuing uses following the sunset
date, it should be examined as to whether these uses are legal (i.e. either outside of the scope
of authorisation or already authorised), artefacts due to lack of dossier updates or illegal
activities which need enforcement actions. For this purpose, ECHA could send letters to the
registrants for uses that are no longer allowed. This information could at the same time be
transmitted to the Forum to be used for the design of future enforcement programmes on
authorisation.
For the remaining substances for which the LAD has already passed and for which
applications for authorisations have been submitted to ECHA (group R_AXIV_LADP_AfA
in Table 4) the industry has an obvious interest in continuing at least some uses, so significant
changes of use-descriptors over time are not really expected, and, indeed with one exception,
have not occurred. This exception is trichloroethylene (TCE) for which a significant decrease
in some use descriptors can be observed (see for example the reduction in the product
categories depicted in Figure 12).

139
TCE is a chlorinated solvent which has been widely used in the past but was continuously
substituted by other solvents because of its health and environmental impacts. This is
illustrated in Box 1. Especially in the Scandinavian countries a significant decrease to almost
zero tonnages can be observed. Also, the number of marketed TCE containing mixtures has
decreased in the Nordic countries. A certain decrease in tonnages is also reflected in Eurostat
data.
Box 2: Trichloroethylene
This result is in quite puzzling contrast to the TCE volumes reported in IUCLID which are
drastically lower than the Eurostat data and also do not indicate any decrease over the last
years. In this project it was not possible to explain these discrepancies. It is, however,
important to note that there is no obligation by registrants to continuously update their volume
information. Updates of tonnages are only legally required if the tonnages increase up to the
next tonnage band (REACH Article 22 (1c). If tonnages do not reach the next tonnage band or
even decrease, registrants are not required to update the information. In this report strong
indications were found (see Table 10 and the explanatory text in chapter 6) that some if not
most of the registrants do not regularly update their volume information in IUCLID. While
this is not necessarily a breach of REACH, this obviously causes systematic errors in IUCLID
volumes because of lack of updating.
Box 3 reflects some further results with respect to updating activities by registrants

140
Box 3: Updated or not updated – this is the question?
These results enable the conclusion to give recommendation 3.
Recommendation 3: The project has found strong indications that volume information is not
regularly updated by registrants. While this is not necessarily a breach of REACH, it creates
systematic errors in the IUCLID volume information which would otherwise be a very
valuable indicator for measuring e.g. substitution progresses. Given that REACH does not
require regular (annual) updates (REACH Article 22 (1c)), it is recommended that ECHA and
Member States authorities continue to make strong efforts in motivating industry to carry out
regular dossier updates on a voluntary basis. If this turns out to be finally not successful, the
Commission needs to consider an adequate change of the existing legislation under REACH.
For substances for which applications for authorisations have been submitted to ECHA, there
is a bulk of information available about the applied uses. A comparison of these uses with the
uses descriptions reported in IUCLID is quite inspiring as shown in Tables 12 and 13. For the
phthalate DEHP, for example, some mismatches have been observed. The observed
discrepancies may be partially explained by the fact that some uses reported in IUCLID are
outside of the scope of authorisation. Another reason for the differences may be due to an
incomplete update of the registration dossiers. A clarification of these questions was not
possible in this project, but as a general conclusion it is recommended that a comparison of
registered uses with AfAs should be systematically carried out as a consistency check.
Regular updates of registration dossiers are not formally required by REACH, but are a
necessary pre-condition for using registration data for the derivation of quantitative
indicators on substitution progress. In this project it became obvious that even for SVHCs at
milestones which can be expected to require intensified updating, the average number of
updates per dossier is rather low. This is exemplified by the following table (which is the
same as Table 10).
Substance No. of spontaneous
updates n at LAD
No. of dossiers M
at LAD
n/M
Tris 2 2 1,0
Ditri 2 2 1,0
DEHP 7 21 0,7
DIBP 1 2 0,5
DBP 2 6 0,2
MDA 2 8 0,3
TCE 1 6 0,2
BBP 0 1 0,0
What one can see in the table is the number of spontaneous updates n of the registration
dossiers and the number of active dossiers M at the latest application date (LAD) for those
SVHCs which have reached the LAD before the deadline of this study. Even though the
LAD was the milestone with the relative highest updating frequency the average number of
updates per dossier is for most substances less or equal 0,5. This means that only every
second dossier was updated on average. Given the key role of registration data in an exercise
as the one carried out in this project, it is obvious that such a low updating frequency will
inevitably lead to data of low actuality and thus to data of little use.

141
Recommendation 4: For SVHCs for which ECHA has received an application for
authorisation (AfA) it is recommended that a systematic comparison between the applied
(category of) uses with the uses reported in IUCLID should be carried out during the
authorisation procedure. Applicants should be inquired to explain differences where they
exist. If inconsistencies are substantiated the responsible registrants should be requested by
ECHA to properly update the registration dossier. Where a breach of REACH Article 22 is
identified, enforcement actions must be considered.
Information on the volumes of substances and mixtures in Nordic countries in the SPIN
database show for a number of SVHCs a significant decrease over the last years. As Box 4
illustrates, volume information over time provides an excellent indicator for substitution
progresses for the three selected SVHCs. The situation in Scandinavian countries is, however,
not representative for the entire of Europe. Also, the most significant substitution effects in
the Nordic region can be observed long before REACH came into force, so in those countries
REACH policy has clearly not been the trigger for substitution.
Box 4: Nordic substitution success stories – but not by REACH
As shown in section 6, the milestone “inclusion of a substance in the candidate list” has
had no visible impact on any of the indicators for all substances considered in this study
with the exception of the four lead compounds which is further discussed in Box 5. This result
challenges the frequent criticism raised by industry that candidate listing would have a
significant negative impact on companies because of the so called “black listing effect”. On
the basis of the indicators considered in this report no “black listing effect” has been
observed.

142
Box 5: Substitution progress on lead compounds? Be aware of misleading indicators
While the answer to the question I cannot be given on the basis of the indicators analysed in
this project, one can safely conclude that the authorisation process does contribute to the
improvement of dossier quality as it gives a strong incentive for industry to reconsider
their database and bring more consistency to their registration data. For example,
clarifications made in the registered use descriptors and potentially in exposure scenarios
certainly contribute to the quality of information passed through the supply chain and in this
sense, contribute to risk management improvements. However, it should be noted that
improving quality of registrations is not the main aim of the authorisation process and the
same objective may be reached with other less costly measures such as enforcement actions.

143
7.2. Question II: Are there less articles containing SVHCs on the market or has production and uses of SVHCs just been shifted outside Europe?
While the use of a SVHC (included in Annex XIV) for incorporation into an article is covered
by authorisation the use of an article containing an SVHC is not. This fact has led to major
criticism of authorisation by European manufacturers arguing that the import of such articles
to Europe would not be affected by the authorisation but the manufacturing of the same
articles within the EU would be subjected to authorisation and thus put European article
producers in a disadvantaged position. This must be kept in mind when the results of this
project are considered.
The most direct use-related indicator connected with the manufacturing of articles is the
article category of use. If a registrant reports in his dossier the use of a substance for a certain
article category and also describes the corresponding use scenario(s) this is an indication for
the fact that such articles are actually manufactured in Europe. Thus the number of article
categories of use should ideally be an indicator for the intensity of use of the substance in
article manufacturing. Box 6 illustrates the results for the respective substances studied in this
project.

144
Box 6: Less article categories for only two phthalates!
As Box 6 and the discussion in section 6 shows, the indicator based on article categories has
significant limitations.
145
One more principal aspect to be considered in relation to the usability and meaning of the
indicator based on the number of article categories is the fact that a reduction in the number of
articles does not necessarily reflect a decrease of the potential exposure of customers to
articles containing SVHCs as it is not linked to the tonnages of SVHCs. Hence, the reduction
in the number of articles may have marginal or significant effects depending on the total
tonnages of SVHC used for the production of the abandoned article category.
Furthermore, reductions of the indicator over time may not even be regarded as a positive
substitution effect. For example, the public consultation before the inclusion of a substance in
the candidate list or before the final recommendation for inclusion in Annex XIV may reveal
further information about downstream uses, based on which registrants update their dossiers
for being more complete. This may result in an increase of the number of article categories in
the registration dossier but in this case this effect could be considered as a positive one as it
improves dossier quality. Only under the assumption that registrants would report adequate
article categories a decrease in the number of article categories after the latest application date
may be interpreted as an indication for a reduction of the diversity of articles containing the
SVHC.
The first part of question II cannot be answered satisfactorily by the proposed indicator based
on article categories. On principle grounds, the second part of the question concerning the
possible import of articles containing a SVHC cannot be answered by any simple indicator.
The present knowledge about the occurrence of SVHCs in imported articles in Europe is quite
limited. In principle, REACH offers a way to obtain information on such imported articles.
Article 7 (2) of REACH requires manufacturers and importers of articles to notify ECHA
about imported articles which contain an SVHC if the concentration in the article is above
0,1% w/w and the total annual amount of the SVHC exceeds 1 tonne. ECHA publishes a list
of notifications under article 7(2) (6). For the purpose of this project this source was not
further explored as there are strong reasons to assume that there is significant underreporting.
For example, for DEHP only 132 notifications have been reported to ECHA. DEHP can be
found in a considerable number of articles in product monitoring so that the number of
notifications for the whole of Europe seems significantly too low.
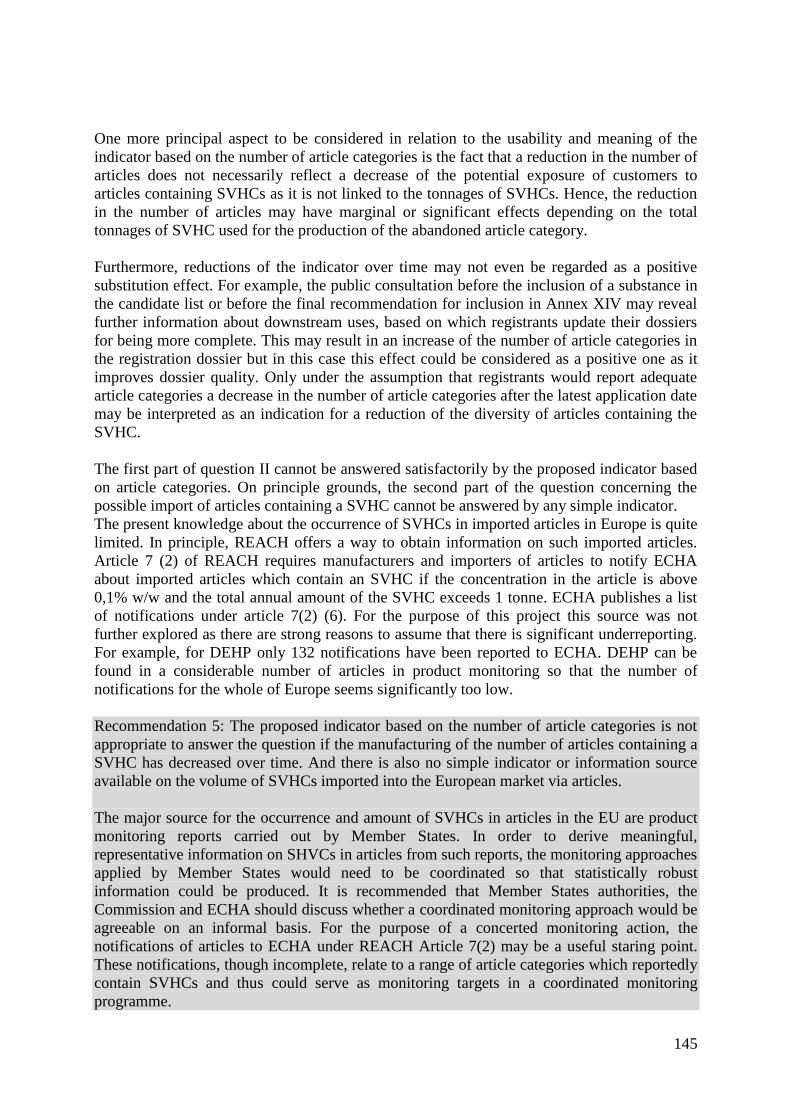
Recommendation 5: The proposed indicator based on the number of article categories is not
appropriate to answer the question if the manufacturing of the number of articles containing a
SVHC has decreased over time. And there is also no simple indicator or information source
available on the volume of SVHCs imported into the European market via articles.
The major source for the occurrence and amount of SVHCs in articles in the EU are product
monitoring reports carried out by Member States. In order to derive meaningful,
representative information on SHVCs in articles from such reports, the monitoring approaches
applied by Member States would need to be coordinated so that statistically robust
information could be produced. It is recommended that Member States authorities, the
Commission and ECHA should discuss whether a coordinated monitoring approach would be
agreeable on an informal basis. For the purpose of a concerted monitoring action, the
notifications of articles to ECHA under REACH Article 7(2) may be a useful staring point.
These notifications, though incomplete, relate to a range of article categories which reportedly
contain SVHCs and thus could serve as monitoring targets in a coordinated monitoring
programme.

146
Question III: What are the major substituent’s for SVHCs and are these alternates safer?
Only substance-specific answers to this question are meaningful. This was attempted for the
SVHCs considered in this project. However, within the given capacity and in view of the
unrepresentativeness of the results of the industry survey carried out, the question cannot be
answered for any of the SVHCs considered in this project.
In the survey of the industry carried out for this project a few responses confirmed that
substitution of one of the SVHCs considered in this project have actually been replaced. For
example, four respondents stated that they have at least partially substituted DEHP by an
alternative such as diisononyl phthalate or dipropylheptyl phthalate, two respondents have
replaced DIBP fully or partially (alternates remained confident). Phthalates seem to be mainly
replaced by other, long chain phthalates. Given the low response rate to the questionnaire this
information can at best be seen as an anecdotal reference and definitely does not allow to
answer question III.
On the basis of available information from the Subsport database as well as from the
applications for authorisations a number of proposed alternatives for the substitution of
SVHCs considered in this project have been identified. Table 22 summarises the available
alternatives for the substances and the current classification of the alternate(s). A simplified
comparative hazard assessment gives a first order answer to the question on the safety of the
alterative. For some substances in the table it appears that the alternates are indeed less
hazardous.
A deeper comparative assessment would require significant additional resources and expertise
on chemical alternatives and comparative hazard and risk assessment which was not available
for this project. .

147
Table 22: Examples for alternatives replacing a SVHC and its specific use in producing
articles or as processing aid. Sources: (5), (6).
USED in Alternates Alternates Classified as:
Diisobutylphthalate (DIBP, CAS 84-69-5)
Electronic products Trioctyl trimellitate (TOM) Not classified
CLP notification: Repr.2; Eye
Irrit.2; Skin Irrit.2; STOT
SE3; Aquatic Chronic 4
Dioctylterephthalate (DOCP) No harmonised classification
Benzylbutylphthalate (BBP, CAS 85-68-7)
PVC floorings Linseed oil No harmonised classification
CLP notification: Skin sens. 1;
Eye Irrit. 2, Acture Tox. 4;
STOT SE 3; Pyr. Liq.; Flam.
Liq.2
Carpet backing Ethene-1-octene copolymer Not classified
Electronic products Trioctyl trimellitate (TOM) Not classified
CLP notification: Repr.2; Eye
Irrit.2; Skin Irrit.2; STOT
SE3; Aquatic Chronic 4
Dioctylterephthalate (DOCP) Not classified
Childrens wear prints Polyurethane, polyacrylate -
(toxicity originates usually
only from unreacted
monomers)
Textile print applications Tributyl O-acetylcitrate
Not classified
CLP notification: Aquatic
Chronic 3; Flam. Gas 1; Muta
1B; Car. 1B; Eye Irrit. 2; Skin
Irrit. 2
Bis(2-ethylhexyl)adipat
(DEHA)
Not classified
CLP notification: Aquatic
Acute and Chronic 1; Skin
Irrit. 2; Eye Irrit.2; Acute Tox.
4
1,2-Cyclohexanedicarboxylic
acid, 1,2-diisononyl ester
Not classified
Trioctyltrimellitat (TOM) Not classified
CLP notification: Repr.2; Eye
Irrit.2; Skin Irrit.2; STOT
SE3; Aquatic Chronic 4
Bis(2-ethylhexyl)terephthalat Not classified
Dibutyl phthalate (DBP, CAS 84-74-2)
Electronic products Trioctylttrimellitate (TOM) Not classified
CLP notification: Repr.2; Eye
Irrit.2; Skin Irrit.2; STOT
SE3; Aquatic Chronic 4
Dioctylterephthalate (DOCP) Not classified

148
USED in Alternates Alternates Classified as:
Bis(2-ethylhexyl) phthalates (DEHP, CAS 117-81-7)
Electronic products Trioctylttrimellitate (TOM) Not classified
CLP notification: Repr.2; Eye
Irrit.2; Skin Irrit.2; STOT
SE3; Aquatic Chronic 4
Dioctylterephthalate (DOCP) Not classified
Diarsenic trioxide (Ditri, CAS 1327-53-3)
Glass production Technology: thermal
desorption of gas
Trichloroethylene ( TCE, CAS 79-01-6)
Cleaning of electrical
equipment
Acetone Classification: Flam. Liq. 2;
Eye Irrit. 2; STOT SE 3
Carbon dioxide CLP notification: Press. Gas;
Acute Tox. 4; STOT SE 3
Soybean oil
Not classified
Water Not classified
Cleaning of car steering
components
Potassium hydroxide Classified: Skin Corr. 1A;
Acute Tox. 4;
CLP notification: Eye Dam.1;
Acute Tox.4; Met. Corr.1;
Acute Tox. 3
2-Aminoethanol Classified: Skin Corr 1B,
Acute Tox 4 (all routes)
CLP notification: STOT SE 3;
Eye Dam. 1; Met Corr. 1;
Aquatic Chronic 3
Determine the amount of
bitumen in asphalt
Muffle furnace
Adhesives and coating, inks
and cleaning products
Ethyl L-lactate Classified: Flam. Liq. 3; Eye
Da. 1; STOTE SE 3
Soybean methyl ether Not classified
Cleaning of stainless steel,
nickel-alloys and titan parts
Aqueous cleaner Not classified
Caffeine extraction Carbon dioxide CLP notification: Press. Gas;
Acute Tox. 4; STOT SE 3
Production of polyethylene Hexane Classified: Aquatic Chronic 2;
Flam.Liq.2; Repr. 2; Asp.
Tox. 1; Skin Irrit. 2; STOT RE
2; STOT SE 3;
CLP notification: Eye Irrit. 2
2-Methoxyethanol ( EGME, CAS 109-86-4)
Manufacture of chemical
products
Aliphatic alcohols -
Glycol ethers -

149
Recommendation 6: The answer to the question on suitable alternatives is key to
authorisation. It requires substance-specific expertise in a broad area of fields including
comparative hazard and risk assessment. There are numerous such assessment tools
available11
. Also ECHA has already taken up this issue and provides a specific Website
attributed to substitution12
.
It is recommended that the European Commission, ECHA and the Member States discuss
further steps and options to integrate the search for alternatives and the application of
alternative assessment tools into the existing European chemicals policy framework,
especially in the already existing tools for substitution under REACH. One option would be
the establishment of a kind of competence centre or focal point on substitution and
alternatives assessment. The European Commission, ECHA and the Member States
authorities are invited to discuss the possibility for the installation of such a focal point and
the specific tasks as well as the needs of personnel and financial resources.
11
See, for example, the overview of Alternative Assessment Tools by OECD:
http://www.oecdsaatoolbox.org/Home/Tools , http://www.oecd.org/chemicalsafety/risk-
assessment/theoecdqsartoolbox.htm, http://www.turi.org/; http://een.ec.europa.eu/; 12
https://echa.europa.eu/regulations/substituting-hazardous-chemicals

150
7.3. Question IV: Have authorisation decisions led to better control of risks?
Like for the previous question this question requires a substance specific consideration. The
following discussion focuses on three selected substances / groups of substances considered in
this project and summarises indications found for achieved risk reductions and the quite
limited use of simple indicators for answering the question.
Phthalates
DEHP can be considered as a positive example: the use categories “wide dispersive outdoor
and indoor”, “fabrics, textiles and apparel”, “ leather articles" or “industrial spraying” have
been removed from the registration dossier after the sunset date. As these activities are usually
associated with wide dispersive exposure, this update (at the milestone – deadline of this
project) could be considered as a measure leading effectively to a risk reduction with respect
to DEHP. The same also holds for DIBP for which most of the uses have been discontinued.
Counter-examples are DBP and BBP where this effect cannot be observed and even additional
uses have been added to the previously reported ones after the latest application date (LAD).
For some phthalates considered in this project the latest application date and the sunset date
have already passed. These substances have already gone through the authorisation procedure
and have been scrutinized by the risk assessment committee and the socio-economic
committee. This process includes the assessment of existing risk control measures and thus
should lead to the clarification and formalisation of risk management measures to be applied
by the applicants or, mutatis mutandis, by the downstream users which have the same uses in
accordance with article 60 (2) of REACH. With the introduction of succinct summaries of the
required management measures by applicants, possibly supplemented by additional measures
or by additional monitoring conditions required by the risk assessment committee, a clear
basis for enforcement action was introduced. Enforcement activities on authorisations which
are already planned in the Forum will explore the quality, efficiency and enforceability of the
granted authorisations.
As these activities are presently only at an early stage and no results are available yet, no data
can be provided in this report.
Lead compounds
For the four lead compounds considered in this study, ECHA has only very recently made the
recommendation for inclusion in Annex XIV. The Commission has not yet made a regulatory
proposal for inclusion in Annex XIV.
It is noteworthy that a certain reduction in IUCLID volumes can be observed for these
compounds (see Box 4). These findings are largely supported by the data of the SPIN
database (see Annex I). Insofar as a reduction in volumes will usually lead to decreased
exposure (either in exposure levels or in the number of exposure events) this change may be
interpreted a as risk reduction.
An important sector for the selected lead compounds is the manufacturing of rechargeable
batteries and accumulators. The lead emissions of this sector into water or air reported in the
E-PRTR data base is illustrated in Figure 26 and Figure 27. While emissions to water are
difficult to interpret, the lead emissions to air show a clear decrease as from 2011. This, in

151
principle, could also be regarded as a supporting evidence for the observed decline in
IUCLID-based tonnages, and thus for the reduction in terms of risks. However, it should be
noted that the E-PRTR data are based on reports from only few (four to eight) large European
installations and thus probably not fully representative for the whole sector. Furthermore,
reduction of lead emissions could equally well be the result of improvements in best available
techniques and/or purification measures and thus do not directly correlate with the extent of
use. Within the scope of this study it was not possible to clarify this rather complicated issue.
Recommendation 7: The European Pollution Release and Transfer Register (E-PRTR)
appears to be a useful source for a - quite limited - number of SVHCs. The download tool
(http://prtr.ec.europa.eu/#/pollutantreleases) allows for an extraction of information about
emissions into the air and into the water compartment in relation to specific sectors of
activities. This selective information enables a linkage between the total emissions of lead
and a specific activity. If the use of the concerned substance in this activity is well known, the
total emissions to air and water may be a good parameter for measuring the use intensity. As
an example in this project the use of the four lead compounds in the manufacturing of
rechargeable batteries and accumulators has been discussed. In order to interpret the observed
changes in emissions in terms of use intensity it is, however, important to know about the
local circumstances. It is, therefore, recommended to use emissions based on the E-PRTR
always in combination with a direct dialogue with the particular company that has reported to
the E-PRTR (an anylsis which has not been possible in this project). This would enable the
assessor to clarify whether the changes in emissions were caused by changes in the use
intensity or by other risk reduction measures such as waste water treatment or purification of
exhaust gases.
ADCA
For ADCA at the milestone “final A.XIV recommendation” a quite noticeable change in the
number of summed up as well as unique uses have been observed. At this milestone all the
uses in the life cycle stages of professional, consumer and article service life (ASL) uses are
discontinued and the registrant made an explicit advice against these uses (see Annex I Figure
78). A decrease in the number of unique uses can also be observed in the “Use-Desciptor-
Pofile” (UDP) for the uses in the category ERC and PROC (see Annex I Figure 80). It is
noted that the uses which have been discontinued are mostly wide dispersive, so that the
changes and/or clarifications regarding these uses in the registration dossiers can be taken as
improvements with regard to the risk to humans and the environment13
.
Even though these risk reductions cannot be expressed quantitatively, this example is
probably an illustrative case for the measuring of an implicit impact on risk reduction due to
clarifications and limitations of exposure scenarios supported by the registrant.
13
It is noted that in the particular case it remained unclear as to whether there were at any time uses of ADCA by
consumers and/or professionals. If so, the updates are still welcome but may not relate to an actual decrease in
exposure.

152
Box 7: Example of ADCA
Box 6: Indirect impacts of the authorisation process – the example of ADCA
As an overall conclusion, the question if authorisation decisions lead to better control of risks
can probably be positively answered. The uses which have been applied for in individual
authorisation procedures have been scrutinised by the ECHA committees and additional
safety measurement have been required in some cases. However, the effective risk reduction
may be small or even marginal, as it is impossible to quantify these impacts. It is also
important to remember generally that some entries in IUCLID may be incomplete or flawed
due to the lacking of updating by registrants.
ADCA is a low molecular weight amide. It is manufactured predominantly as a
yellow/orange powder with a particle size between 2 and 10 µm. The main use of ADCA is
as a blowing agent in the rubber and plastics industry. This blowing action is caused by the
gases (N2, CO, CO2, NH3) released during heat induced decomposition of ADCA at
temperatures between 190 and 230°C. It is used in a wide range of industrial applications
(27).
Already in the process of the identification of the substance as an SVHC because of its
respiratory sensitising properties in 2012, the concerned industry started to lobby against its
inclusion in the candidate list. A major argument was that there exist no appropriate
alternatives and the substance would only be used in industry and as the substance
decomposed during the manufacturing processes, consumers would not be exposed. After
inclusion in the candidate list, a similar and more intensified discussion took place during
the prioritisation decision by the Member State Committee (MSC) of ECHA in 2013.
Finally, in February 2016, the MSC decided to propose the substance for inclusion in
Annex XIV. So far, the Commission has not made a legislative proposal.
In this project it was found that at the milestone “final A.XIV recommendation” a quite
noticeable change in the number of summed up as well as unique uses reported in
registrations occurred. At the same milestone all the uses in the life cycle stages of
professional, consumer and after service life (ASL) have been discontinued and the
registrant made an explicit advice against these uses. A similar decrease in the number of
unique uses can also be observed in the “Use-Desciptor-Pofile” (UDP). The uses which
have been discontinued are usually wide dispersive, so that the delimiting of these uses can
be regarded as an improvements in terms of health risk as these uses are not any more
supported by the registrants upstream of their supply chains.
The quite intense discussions between registrants, downstream users, ECHA and Member
States authorities during the decision-taking process has, for ADCA, led to a desirable
clarification and quality improvement of the dossier and thus a risk-controlling step

153
7.4. Question V: Is the authorisation as such or parts thereof a cost-effective policy for protecting man and environment?
This question, while being of considerable importance, has not been targeted in this project as
economic impacts on both industry as well as authorities has not been taken in the focus.
Before the start of and during this project discussions with the Commission´s officials
revealed that they were planning a study which would consider in much more detail economic
aspects. In the meantime the Commission has contracted the Economic for the Environment
Consultancy Ltd (eftec) in association with Apeiron-Team, Peter Fisk Associates (PFA and
the Economics Interface Limited to carry out a project named “Impacts of REACH
Authorisation”, which has started at the end of 2016 and should be finalised by the end of
2017 (7).
It is noted that in the survey of the industry carried out in this project also very general
information about economic consequences of the authorisation policy have been requested.
The results of responses can be found in the Annex II to this report. As the data are not
statistically representative, no details of the results are provided in this summary.

154
7.5. Question VI: Does authorisation work better for certain types of substances than for others and would this help to make appropriate choices on SVHC candidates?
An answer to this question implies to have a profound understanding of the reasons of
companies for making the decision to continue the use of a SVHC on the basis of an
authorised use or to make efforts to replace the substance by a less problematic alternative
(alternative substance and/or techniques). In this project the concept was to query a broad
spectrum of potential users of SVHCs on their experiences about the incentives for and the
obstacles against substitution in order to obtain robust statistical information. Moreover, it
was planned to learn from more comprehensive interviews about the major substitution
barriers for those companies who decided to apply for an authorisation. The low response rate
of 7% (or 29 respondents in absolute figures) does not allow for drawing a statistically
relevant conclusion. Only one authorisation holder agreed to provide more detailed
information on his experiences. It is thus not possible to draw a conclusion on the reasons for
companies to either apply for an authorisation or else substitute the SVHC. Details of this
response are summarised in Table 19.
Even though the following conclusions are rather anecdotal evidences than firm results, the
following outcome can be drawn from the survey responses:
viii. REACH and, more particularly, the authorisation policy under REACH has triggered
the search for alternatives by the affected companies.
ix. According to the survey, already the inclusion of substances in the candidate list
(identification of SVHCs) has led companies to consider the possibility of alternatives.
There are a number of obstacles and barriers for implementing alternatives.
x. All companies who implemented alternatives faced negative cost implications. It
remained unclear if improvements as a net result of substitution would have finally
outweighed the additional costs.
xi. An important obstacle for substitution is that most of the alternatives are
toxicologically not well known and companies are hesitating to make efforts to
introduce these substitutes which may, at a later stage, become also stigmatised.
xii. Even though authorisation seems to provide some pressure towards substitution most
companies do not seem to feel that investments will actually pay and that the major
implication will be a discrimination against competitors outside the EU. This is
particularly the case for the use of SVHCs in articles: while EU users are bound by the
authorisation the importers of articles containing SVHCs are not.
xiii. The discussion on SVHCs applied for in authorisation procedures seems to have
triggered a scrutiny of the existing risk management measures in companies
potentially resulting in improvements for worker’s health and risk reduction measures
for downstream users (consumers and professionals).
xiv. Only few companies indicated that they have ongoing relocation plans to places
outside of the EU because of the costs for authorisation and/or the lack of an
alternative.
It is obvious that on the basis of the results obtained from the survey no well-informed answer
can be given to question VI. Based on the experience with the survey of authorisation holders,
it may be worth to consider also alternative strategies. Rather than focusing on those
companies that have applied for authorisation it may be more efficient to approach those
companies who have successfully moved to substitutes or alternative technologies. This idea
has already been mentioned in recommendation 1.

155
Bibliography
1. RIME. Monitoring and evaluation of the impacts of the authorisation process. Brussels :
Document 1 AP 3.2 a , 2015. The paper is attached to this report in Annex IV.
2. ECHA. Statistics on received applications. [Online] [Zitat vom: 29. 12 2016.]
https://echa.europa.eu/addressing-chemicals-of-concern/authorisation/applications-for-
authorisation/received-applications.
3. —. Adopted opinions and previous consultations on applications for authorisation. [Online]
[Zitat vom: 06. 12 2016.] https://www.echa.europa.eu/addressing-chemicals-of-
concern/authorisation/applications-for-authorisation-previous-consultations.
4. —. Applications for authorisation - current consultations. [Online] [Zitat vom: 06. 12
2016.] https://www.echa.europa.eu/addressing-chemicals-of-
concern/authorisation/applications-for-authorisation.
5. Subs Port. Substituution Support Portal. [Online] Kooperationsstelle Hamburg IFE GmbH.
[Zitat vom: 12. 12 2016.] http://www.subsport.eu/?lang=de.
6. ECHA. Information on Candidate List substances in articles. [Online] [Zitat vom: 03. 09
2017.] https://echa.europa.eu/information-on-chemicals/candidate-list-substances-in-articles-
table.
7. European Commission DG for Internal Maket, Industry, Entrepreneurship and
SMEs. Impact of REACH Authorisation. Invitation to Tender. Brussels :
GROW/D/CP/za.grow.ddgl.d.dir(2016)1612998, 2016.
8. ECHA. Guidance on Information Requirements and Chemical Safety Assessment.
Helsinki : ECHA, 2015.
9. —. ECHA-term. Multilingual Chemical Terminoligy by ECHA. [Online] [Zitat vom: 24. 10
2016.] https://echa-term.echa.europa.eu/ .
10. Candidate-List. ECHA. [Online] [Zitat vom: 26. 10 2016.]
https://echa.europa.eu/candidate-list-table.
11. PACT. Public Active Coordianation Tool (PACT). [Online] ECHA. [Zitat vom: 24. 10
2016.] https://echa.europa.eu/addressing-chemicals-of-concern/substances-of-potential-
concern/pact.
12. Support. ECHA. [Online] [Zitat vom: 24. 10 2016.] https://echa.europa.eu/support.
13. ECHA. Guidance on Information Requirements and Chemical Safety Assessment.
https://echa.europa.eu/documents/10162/13632/information_requirements_part_d_en.pdf/70d
a6d4b-5acf-40d9-8b75-1e1c311378df : ECHA, 2016.
14. Commission, European. Eurostat. Your key to European statistics. [Online]
http://ec.europa.eu/eurostat/portal/page/portal/prodcom/data/database.

156
15. Echa. Information on candidate List substances in articles. [Online] [Zitat vom: 16. 01
2017.] https://www.echa.europa.eu/information-on-chemicals/candidate-list-substances-in-
articles-table.
16. Burg, W.ter. Inventory of databases containing worker exposure data on non-threshold
carcinogens in Europe. s.l. : RIVM Letter report, 2014. 0083.
17. CAREX. Finnish Institute of Occupational Health: . CAREX (CARcinogen EXposure)
database. [Online] 16. 01 2017.
http://partner.ttl.fi/en/chemical_safety/carex/description_of_carex/pages/default.aspx .
18. European Pollutant release and Trasfer Register. E-PRTR. [Online] [Zitat vom: 16. 01
2017.] http://prtr.ec.europa.eu/#/home.
19. Commission, European. EU Wide Monitoring Survey on Waste Water Treatment Plant
Effluents. Ispra Italy : Institute for Environment and Sustainability of the Joint Research
Centre, 2012.
20. EEA - European Environment Agency. EIONET - Waterbase. [Online] [Zitat vom: 28. 12
2016.] http://www.eea.europa.eu/data-and-maps/data/waterbase-water-quality.
21. INERIS. Implementation of requirements on priority substances within the context of the
water framework directive. Brussels : International Office for Water, 2009.
22. Carvalho, R. N., et al., et al. Monitoring-based Exercise: Second Review of the Priority
Substances list under the Water Framework Directive. Ispra, Italy : JRC, 2016.
23. IKSR. Internationale Kommission zum Schutz des Rheins. [Online] [Zitat vom: 28. 12
2016.] http://maps.wasserblick.net:8080/iksr-zt.
24. SPIN. Gerneral Information. [Online] [Zitat vom: 17. 01 2017.]
http://spin2000.net/?p=275.
25. —. Uncerntainties. [Online] [Zitat vom: 17. 01 2017.] http://spin2000.net/?page_id=385.
26. Ceresana. Market Study: Plasticizers (3rd edition). [Online] Ceresana. [Zitat vom: 25. 01
2017.] http://www.ceresana.com/en/market-studies/chemicals/plasticizers/.
27. Austrian Environment Agency Austria on behalf of Competent Authority. ECHA.
Annex XV dossier, ADCA. [Online] [Zitat vom: 09. 03 2017.]
https://echa.europa.eu/documents/10162/d9e11c88-481a-47a9-8fff-915b48086ddb.

157
Figure 1: The process of REACH authorisation for SVHCs and the five milestones chosen as characteristic points in time for the assessment of impacts of authorisation ........................................................................................ 29 Figure 2: Grouping of selected SVHCs into different milestone stages of authorisation ....................................... 33 Figure 3: Illustration of the mean concentration frequency of TCE in the year 2005 ............................................ 65 Figure 4: Illustration of the mean concentration frequency of TCE in the year 2011 ............................................ 65 Figure 5: Monitoring stations in rivers from which monitoring data have been collected for the first review of the priority list under the Water Framework Directive(13) ......................................................................................... 66 Figure 6: Annual arithmetic mean values for the sampling station of Bimmen/Lobith at the Rhine River. For the calculation the convention was applied to set values below the quantification limit to half the quantification limit) ...................................................................................................................................................................... 68 Figure 7: Outline of the questionnaire used in the survey ..................................................................................... 74 Figure 8: Number of all active registrations for the substances included in Annex XIV. The graph on the left depicts DEHP = bis(2-ethylhexyl)phthalate,) DBP = dibutyl phthalate, DIBP = diisobutyl phthalate, Tris = tris(2-chloroethyl) phosphate ,Ditri = Diarsenic trioxide, MDA= 4,4'- diaminodiphenylmethane, TCE = trichloroethylene and BBP = Benzyl butyl phthalate. The Milestones A and B are for Ditri and TCE the FRD and the final A.XIV recom., respectively and for the other substances it is the other way around. The graph on the right side depicts Diglyme = bis(2-methoxyethyl)ether, Form = formaldehyde oligomeric reaction products with aniline, MOCA = 2,2'-dichloro-4,4'-methylenedianiline and EDC = 1,2-dichloroethane ................................................................... 82 Figure 9: Number of all active registrations for the substances included on the candidate list but not jet on Annex XIV. The Milestones A, B, C and D are the milestones FRD, RoI SVHC, Candidate List and Final A.XIV Recom. for the substances: DIPP = diisopentyl phtalate, Trix = trixylyl phosphate, PBO = lead monoxide, orange lead, PLTS = pentalead tetraoxide sulphate, TLS = tetralead trioxide sulphate, EGDME = 1,2-dimethoxyethane, TEGDME = tetraethylene glycol dimethyl ether, ADCA = diazene-1,2-dicarboxamide (C,C`-azodi(formamide)), BCA= 1,2-benzenedi-carboxylic acid, di-C6-10-alkyl esters. In case of the substances EGME = 2-Methoxyethanol and EGEE = 2-Ethoxyethanol the milestones stand for RoI SVHC, Candidate List and FRD, respectively. ............. 82 Figure 10: Number of spontaneous updates for the substances included in Annex XIV. ...................................... 83 Figure 11: Number of spontaneous updates for the substances included on the candidate list but not jet in Annex XIV. The Milestones A, B, C and D are the milestones FRD, RoI SVHC, Candidate List and Final A.XIV Recom. for the substances: Trix = trixylyl phosphate, PBO = lead monoxide, Orange Lead, PLTS = pentalead tetraoxide sulphate, TLS = tetralead trioxide sulphate, EGEE = 2-ethoxyethanol, ADCA = diazene-1,2-dicarboxamide (C,C`-azodi(formamide)) and BCA = 1,2-benzenedi-carboxylic acid, di-C6-10-alkyl esters. For the substance EGME = 2-Methoxyethanol, the Milestones are: RoI SVHC, Candidate List and FRD. For the other substances on CD there were no spontaneous updates. ....................................................................................... 84 Figure 12: shows the indicators for the sector of use category (SU), the product category (PC) and the article category (AC) for all selected substances over the time-line (applying the option of unique category counting). DEHP = bis(2-ethylhexyl)phthalate,), Tris = tris(2-chloroethyl) phosphate , Ditri = diarsenic trioxide, DIBP = diisobutyl phthalate, DBP = dibutyl phthalate, MDA= 4,4'- diaminodiphenylmethane, TCE = trichloroethylene, BBP = benzyl butyl phthalate................................................................................................................................. 87 Figure 13: Indicators describing the life-cycle stages manufacture, formulation and industrial use over the time-line (unique category counting). DEHP = bis(2-ethylhexyl)phthalate,), Ditri = diarsenic trioxide, DIBP = diisobutyl phthalate, DBP = dibutyl phthalate, MDA= 4,4'- diaminodiphenylmethane, TCE = trichloroethylene, BBP = benzyl butyl phthalate, Tris = tris(2-chloroethyl) phosphate ............................................................................................ 89 Figure 14: Indicators describing the life-cycle stages professional use, consumer use and article service life use over the time-line (unique category counting). DEHP = bis(2-ethylhexyl)phthalate,), DIBP = diisobutyl phthalate,

158
DBP = dibutyl phthalate, MDA= 4,4'- diaminodiphenylmethane, TCE = trichloroethylene, BBP = benzyl butyl phthalate, Tris = tris(2-chloroethyl) phosphate ..................................................................................................... 89 Figure 15: Shows the indicators for the process (PROC) and the technical function (TF) for all selected substances over the time-line (applying the option of unique category counting). DEHP = bis(2-ethylhexyl)phthalate,), Ditri = diarsenic trioxide, DIBP = diisobutyl phthalate, DBP = dibutyl phthalate, MDA= 4,4'- diaminodiphenylmethane, TCE = trichloroethylene, BBP = benzyl butyl phthalate, Tris = tris(2-chloroethyl) phosphate ............................... 90 Figure 16: Indicators for the process category (PROC) and the environmental release category (ERC) over the time-line (unique category counting). DEHP = bis(2-ethylhexyl)phthalate,), Ditri = diarsenic trioxide, DIBP = diisobutyl phthalate, DBP = dibutyl phthalate, MDA= 4,4'- diaminodiphenylmethane, TCE = trichloroethylene, BBP = benzyl butyl phthalate, Tris = tris(2-chloroethyl) phosphate ...................................................................... 91 Figure 17: Available volume data of 1,2-dichloroethane (1,2-EDC) as a function of the time-line). The volume index is to the highest reported volume (Eurostat for the year 2003) which is arbitrarily set at 100. The black lines correspond to the milestones (FRD = first registration deadline, CD = candidate listing, Annex XIV = inclusion in Annex XIV, LAD = latest application date.) ......................................................................................... 99 Figure 18: Available volume data of Di(1-ethylhexyl)phthalate (DEHP) as a function of the time-line and the comparison of the information from IUCLID and Eurostat (sum of dibutyl and dioctyl orthophthalates which predominantly consists of DEHP). The volume index is to the highest reported volume (Eurostat for the year 2003) which is arbitrarily set at 100. The black lines correspond to the milestones (FRD = first registration deadline, CD = candidate listing, Annex XIV = inclusion in Annex XIV, LAD = latest application date.) ................. 99 Figure 19: Available volume data of trichloroethylene (TCE) as a function of the time-line and comparison of information from IUCLID and Eurostat. The volume index is to the highest reported volume (Eurostat for the year 2003) which is arbitrarily set at 100. The black lines correspond to the milestones (FRD = first registration deadline, CD = candidate listing, Annex XIV = inclusion in Annex XIV, LAD = latest application date.) ............... 100 Figure 20: Volumes of 1,2-EDC and numbers of mixtures containing 1,2-EDC as reported to the SPIN data-base (sum from Sweden) as a function of the time line ............................................................................................... 101 Figure 21: Volumes of DEHP and numbers of mixtures containing DEHP as reported to the SPIN data-base (sum for Denmark, Finland, Norway and Sweden) as a function of the time line ........................................................ 101 Figure 22: Volumes of TCE and numbers of mixtures containing TCE as reported to the SPIN data-base (sum for Denmark, Finland, Norway and Sweden) as a function of the time line ............................................................. 102 Figure 23: Volumes for MDA along the time-line on the basis of IUCLID (dotted line) and the tonnage information from the SPIN data-base (solid line). The volumes are given as different measurement units so that the confidentiality agreements are not breached. .............................................................................................. 103 Figure 24: Volumes for DIBP along the time-line on the basis of IUCLID (dotted line) and the tonnage information from the SPIN data-base (solid line). The volumes are given as different measurement units so that the confidentiality agreements are not breached. .............................................................................................. 104 Figure 25: Volume-data from IUCLID for the four lead substances PBO = lead monoxide, Orange lead, PLTS = pentalead tetraoxide sulphate, TLS= tetralead trioxide sulphate. The volumes are illustrated in relation to the highest volume of TLS (2013=100%) and therefore comparable with each other. ............................................. 109 Figure 26: Emissions of lead from the battery and accumulator producing sector into surface waters reported in E-PRTR ................................................................................................................................................................. 110 Figure 27: Emissions of lead from the battery and accumulator producing sector into surface waters reported in E-PRTR ................................................................................................................................................................. 110 Figure 28: Illustration of the number of unique uses for TCE. ............................................................................. 111 Figure 29: E-PRTR emissions of the chemical industry to air reported for TCE and EDC between 2007 and 2014 ............................................................................................................................................................................ 112

159
Figure 30: E-PRTR emissions of the chemical industry to water reported for TCE and EDC between 2007 and 2014 .................................................................................................................................................................... 113 Figure 31: E-PRTR emissions of the metal sector air and water reported for TCE between 2007 and 2014 ....... 113 Figure 32: The number of unique uses for MOCA over the milestones for the LCS’s ........................................... 115 Figure 33: Comparison of the volumes reported for MDA in IUCLID with the sum of tonnages of MDA reported by the Nordic countries ....................................................................................................................................... 116 Figure 34: Emission of arsenic compounds from, the sector production and processing of metals into air and water from the E-PRTR database over the year’s 2007 to 2014 ......................................................................... 118 Figure 35: Emission of arsenic compounds from, the sector chemical industry – production of inorganic chemicals into air and water from the E-PRTR database over the years 2007 to 2014 ...................................... 119 Figure 36: Structures of proposed alternatives to phthalates in Table 18 (sources: wikipedia, Chemical Book, SigmaAldrich) ...................................................................................................................................................... 123

160
Table 1: summarises the key milestones defined in figure 1 ................................................................................. 30 Table 2: Registered substances selected for the MEIA project: name, EC number, CAS number and allocation to substance group .................................................................................................................................................... 31 Table 3: Non-registered substance selected for the MEIA project: name, EC number, CAS number and allocation to substance group ................................................................................................................................................ 32 Table 4: List of selected SVHCs with respect to the groups defined in Figure 2 .................................................... 34 Table 5: Relevant endpoints for the identification of the selected SVHCs (the symbols in column 3 have the following meaning: C = concerns of carcinogenicity, R = concern of reproduction toxicity, Endo = concern of adverse endocrine effects, Sens = concern for respiratory sensitising properties) and restrictions under REACH Annex XVII ............................................................................................................................................................. 40 Table 6: IUCLID information collected for the selected SVHCs as a basis for indicators ....................................... 61 Table 7: Collection of aquatic monitoring data for the second revision of the list of priority substances under the Water Framework Directive (source: (14)) ............................................................................................................ 67 Table 8: Summary of data from different sources which are available for additional information on SVHCs considered in the MEIA project. For the explanation of the data sources see text of this report, section 3. X indicates that information for the substance is available from the respective data source/ or has been provided in the survey. ......................................................................................................................................................... 69 Table 9: Listing of all the available substitution options or possibilities in the near future for the specific SVHC and uses. The information was gained either from Subs-Port or from the analysis of alternatives (AoA) ........... 77 Table 10: Number of spontaneous updates of dossiers by registrants between the inclusion in Annex XIV and the latest application date (LAD) ................................................................................................................................. 85 Table 11: Listing of all the SVHC’s which have an LAD before mid-December 2016. The nine substances in green are the SVHC considered in this study ................................................................................................................... 93 Table 12: Comparison of use-descriptors in IUCLID with applied use-descriptors for Di(2-ethylhexyl)phthalate (DEHP, status May 2016) ...................................................................................................................................... 94 Table 13: Comparison of use-descriptors in IUCLID with applied use-descriptors for Trichloroethylene (TCE, status May 2016) .................................................................................................................................................. 95 Table 14: Uses applied for DEHP in the applications for authorisations ............................................................... 95 Table 15: Uses applied for TCE in the applications of authorisations ................................................................... 96 Table 16: Typical conclusions in the Analyses of Alternatives for DEHP and TCE. ................................................. 97 Table 17: Typical arguments used by the applicants in their Socio-economic Analyses conclusions for DEHP and TCE. ....................................................................................................................................................................... 97 Table 18: Information on possible alternates for selected SVHCs in the SUBSPORT database (5) ...................... 122 Table 19: Summary of the follow-up questionnaire for the authorisation holders, which was only answered by one of the three authorisation holders/applicants which agreed to do a follow up questionnaire .................... 126 Table 20: Summary of the proposed indicators from IUCLID and other types of information collected for this study .................................................................................................................................................................... 131

161
Table 21: Summary of the available data from the different databases for the selected SVHC’s – Some of the databases are not listed in this summary as the data for the selected substances were not adequate enough (see Chapter 5. Data for this study). X indicates that information for the substance is available from the respective data source/ or has been provided in the survey. .............................................................................. 134 Table 22: Examples for alternatives replacing a SVHC and its specific use in producing articles or as processing aid. Sources: (5), (6)............................................................................................................................................. 147