Embed Size (px)
Citation preview
7. ANALYZING 7. ANALYZING REQUIREMENTS-REQUIREMENTS-
(Data Flow (Data Flow Diagrams)Diagrams)
System Analysis And Design
Program: BSCS II (Advent Semester – 2014)
Lecturer: Rebecca Asiimwe
Email: [email protected]
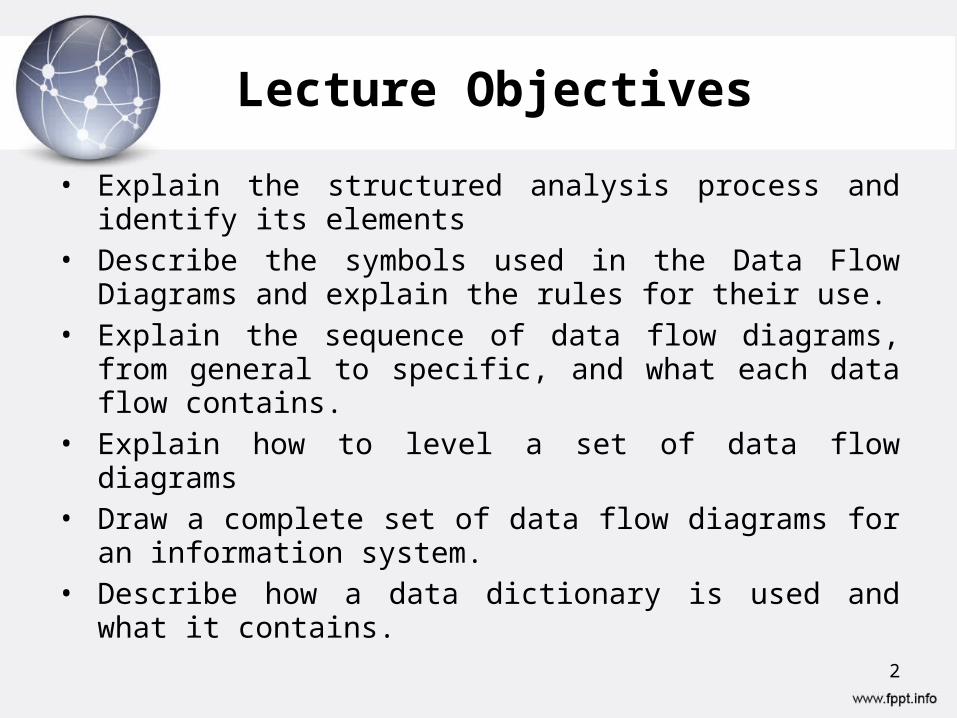
Lecture Objectives
• Explain the structured analysis process and identify its elements
• Describe the symbols used in the Data Flow Diagrams and explain the rules for their use.
• Explain the sequence of data flow diagrams, from general to specific, and what each data flow contains.
• Explain how to level a set of data flow diagrams• Draw a complete set of data flow diagrams for an
information system.• Describe how a data dictionary is used and what it
contains.
2
Requirements Analysis
• Requirements analysis is done after requirements have been collected. Collected information is analyzed to make sense of it.
• Requirements analysis enables the analyst identify the requirements of a client in order to design a solution.
3
Requirements Analysis
• This process is usually characterized by the following activities:
– What outputs will the system produce– What inputs will be needed– What processing steps will be necessary to
transform inputs into outputs– What data stores (files or databases) will
have to be maintained by the system.
4
Structured Analysis
• Structured Analysis (SA) in software engineering and its allied technique, Structured Design(SD), are methods for analyzing and converting business requirements into specifications and ultimately, a computer program, hardware configurations and related manual procedures.
• Structured analysis and design techniques are fundamental tools of system analysis
• Examines inputs, outputs, and processes of the system & uses three main tools to model processes, data and logic of the system.
5
Structured Analysis
• The three tools include;– Data Flow Diagrams (DFDs)– Data Dictionary– Process (Transformation) Descriptions
• Objective of structured Analysis– To document all the end user requirements for the
proposed information system and present these requirements in the systems requirement document.
6
Components of Structured Analysis
• Data dictionary; description of all data used in the system
• Graphical Symbols; icons and conventions for identifying and describing the components of a system and the relationship among components
• Procedures and process description; formal statements using techniques and languages that enable system analysts to describe important activities that make up the system
• Rules- Standards for describing and documenting the system correctly and completely
7
Process Modeling with DFDs
• Process modeling describes the business processes- activities that people do and can be used to describe both the as-is system (current system) and to-be system (proposed system)
• Process modeling is an activity of representing processes so that the current system may be analyzed and improved
• Data flow Diagram(DFD) is one the most commonly used process modeling Technique and will be discussed in the following slides.
8
Process modeling- Data Flow Diagrams(DFDs)
• DFD is a graphical tool that allows analysts (and users) to depict the flow of data in an information system.
• DFDs are the most commonly used way of documenting the processing of as-is and to-be system.
• It’s a pictorial way of showing the flow of data into, around and out of a system.
9
Data Flow Diagrams Cont’d
• Data Flow Diagram (DFD)– A graphical system model that shows all of the
main requirements for an information system: inputs, outputs, processes and data storage
– Everyone working on the project (and end users) can see all the aspects of the project in the diagram with minimal training (simple – only 5 symbols). Can be understood by users and are less prone to misinterpretation than textual description.
10
Data Flow Diagrams Cont’d
• Data Flow Diagrams (DFDs) are graphical aids that describe an information system.
• They represent a logical model that shows what a system does, not how it does it.
• A complete set of DFDs provides a compact top-bottom representation of a system, which makes it easier for users and analysts to envisage the system as a whole.
11
Elements of Data Flow Diagram
• The language of DFDs include a set of symbols and syntax rules.
• There are four elements in the DFD Language;
1. External entities
2. Data stores
3. Processes
4. Data flows• Each Element has a symbol and there are two
schools of thought for these symbols.12
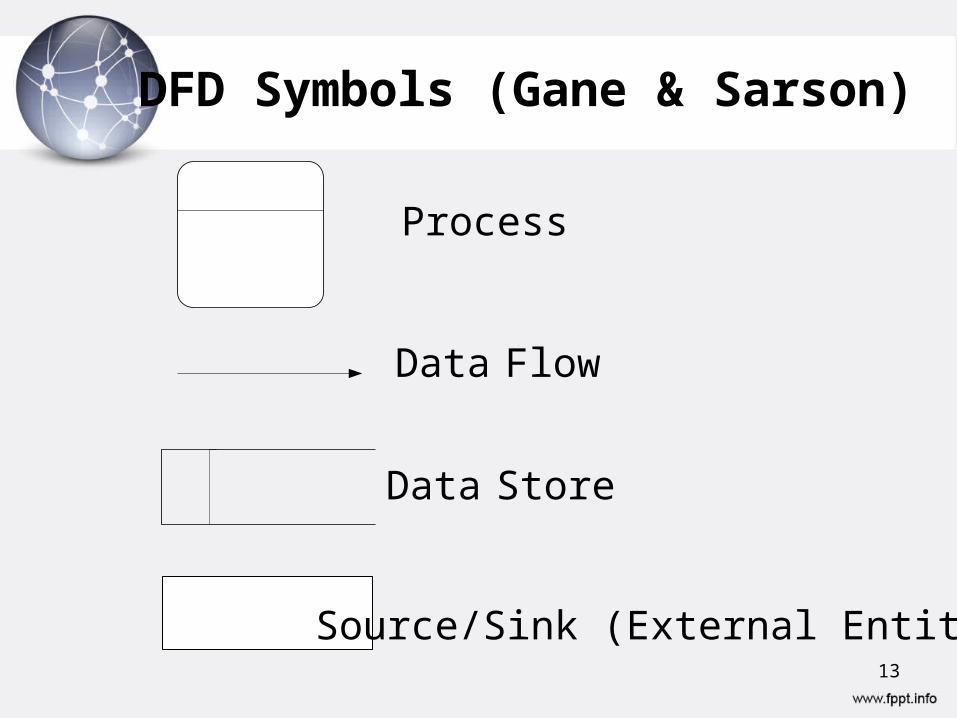
DFD Symbols (Gane & Sarson)
Process
Data Flow
Data Store
Source/Sink (External Entity)13
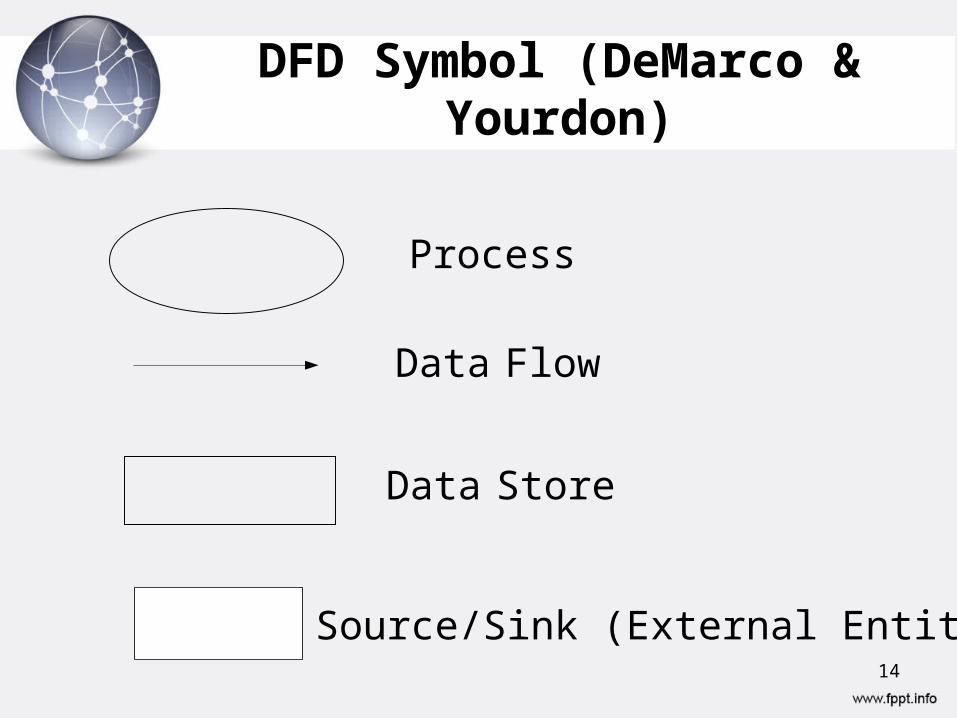
DFD Symbol (DeMarco & Yourdon)
Data Flow
Process
Source/Sink (External Entity)
Data Store
14
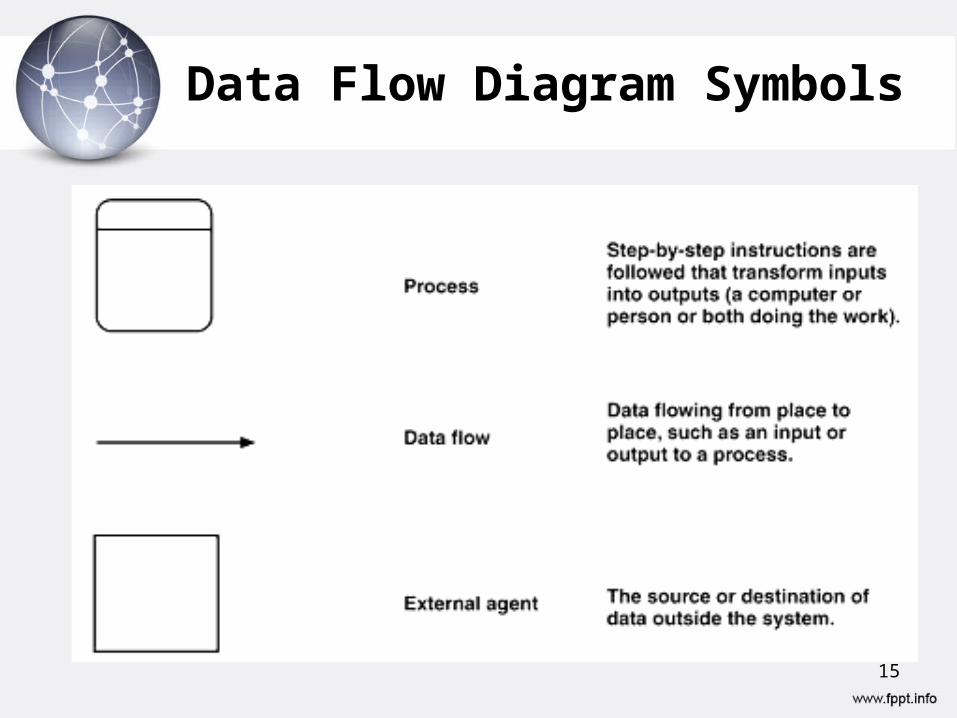
Data Flow Diagram Symbols
15
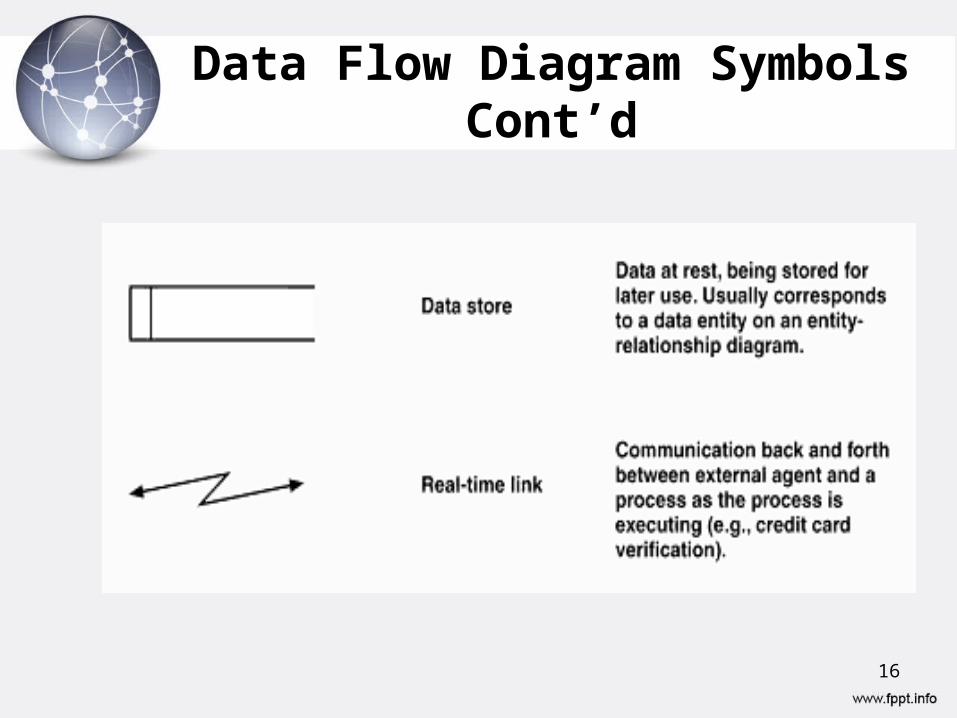
Data Flow Diagram Symbols Cont’d
16
DFD- ComponentsExternal Entities
• External Entities are sources of data that enter the system or recipients of data that leaves the system.– Outside the context of the system– Any class of people, organization or another system.– Function is to supply data or receive data– Also called source and sink (Origin and destination)– Are originators or receivers of information outside the
scope of the IS, portrayed in the data flowing.– Has a name and description
17
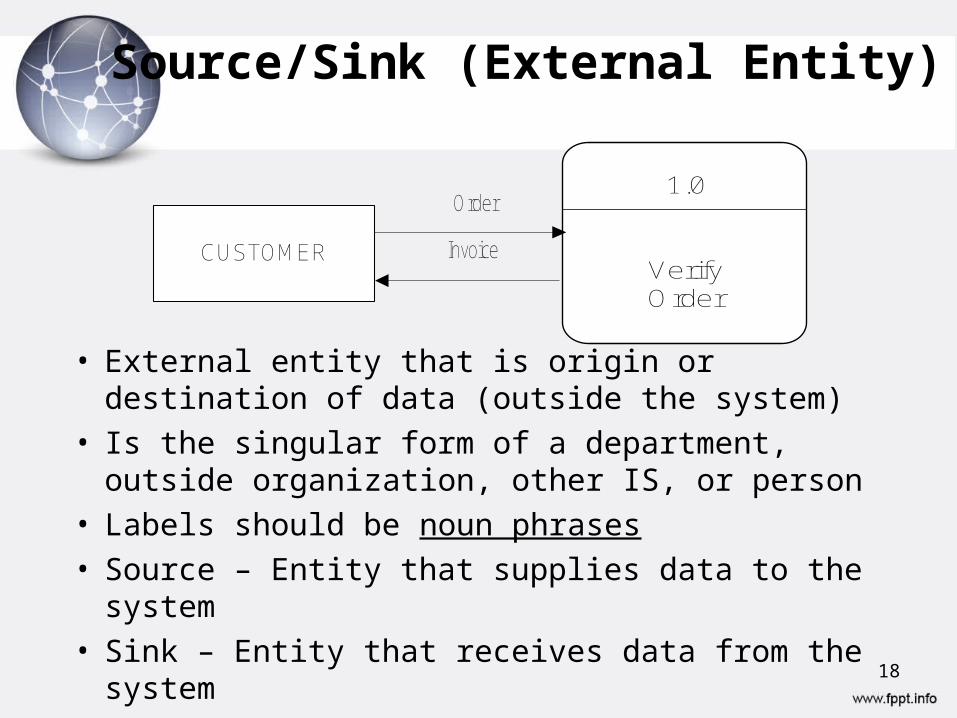
Source/Sink (External Entity)
• External entity that is origin or destination of data (outside the system)
• Is the singular form of a department, outside organization, other IS, or person
• Labels should be noun phrases
• Source – Entity that supplies data to the system
• Sink – Entity that receives data from the system
CUSTOMER
1.0
VerifyOrder
Order
Invoice
18
• External people/ systems• Reside outside the system, but interact with
system• Either a) receive information from system, b)
trigger system into motion, or c) provide new information to system
• e.g. Customers, managers• Not clerks or other staff who simply move
data
Rules for External Entities
19
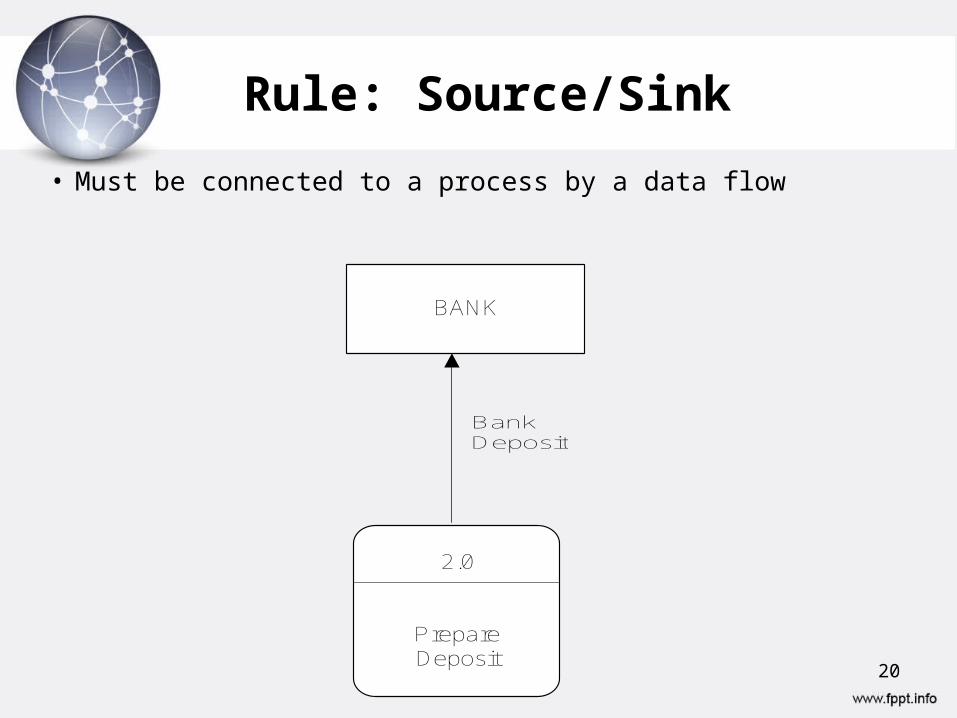
Rule: Source/Sink
• Must be connected to a process by a data flow
BANK
2.0
Prepare Deposit
BankDeposit
20
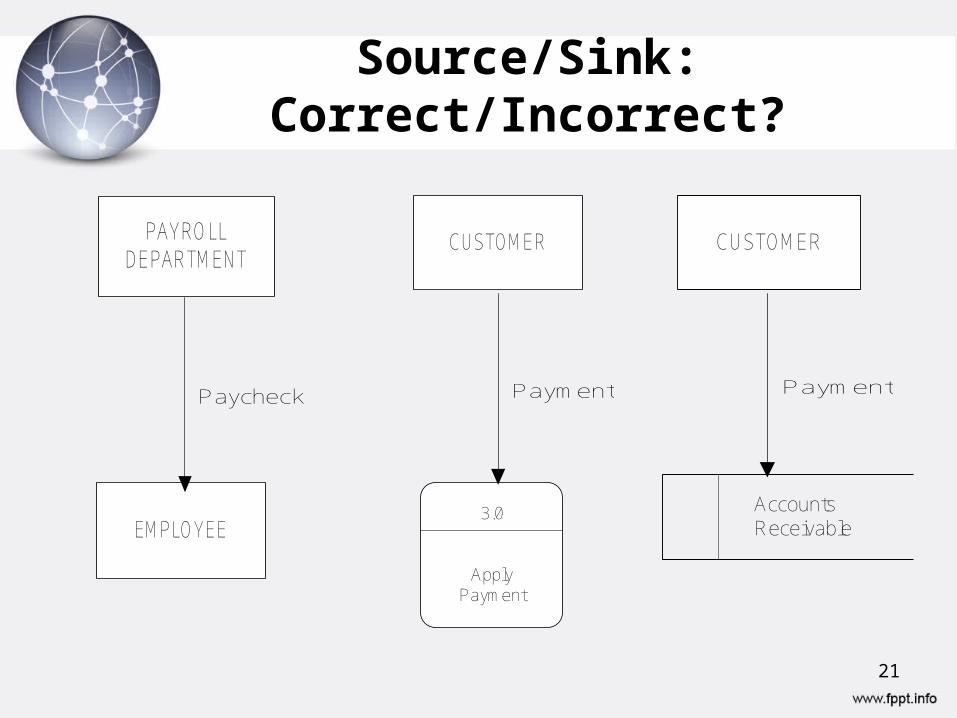
Source/Sink: Correct/Incorrect?
PAYROLLDEPARTMENT
EMPLOYEE
Paycheck
3.0
ApplyPayment
CUSTOMER
Payment
CUSTOMER
AccountsReceivable
Payment
21
Process
• A process is an activity or function that is performed for some specific business reason
• Every process has a name that starts with verb and ends with a noun
• Names should be short, yet contain enough information for users to understand
• Each process performs one activity
• They portray the transformation of input data flows to output data flows in DFDs.
22
Process
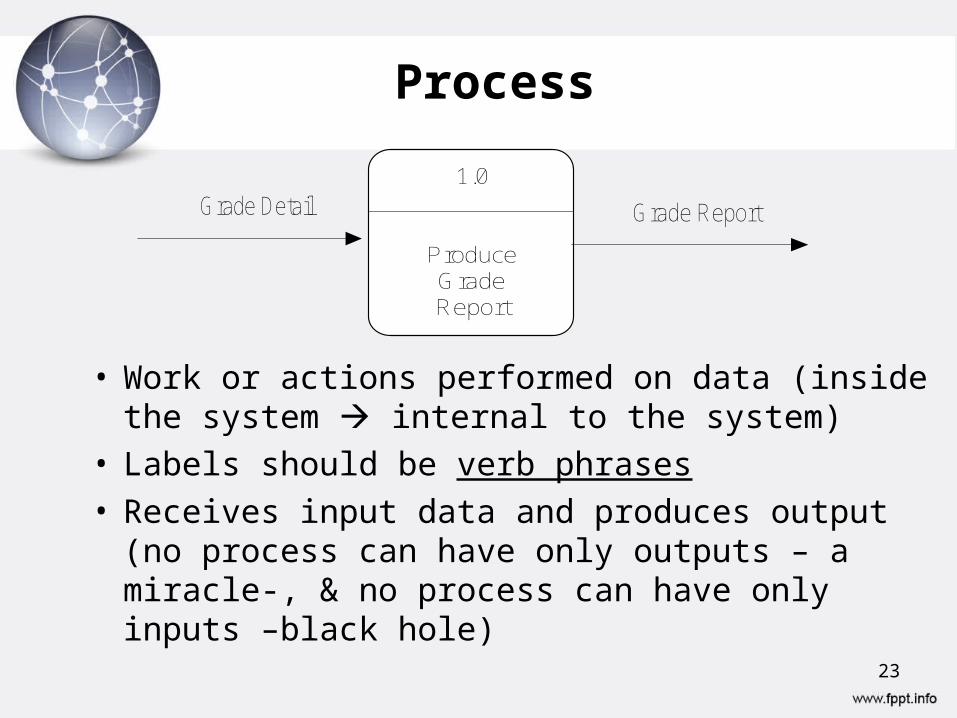
• Work or actions performed on data (inside the system internal to the system)
• Labels should be verb phrases• Receives input data and produces output (no
process can have only outputs – a miracle-, & no process can have only inputs –black hole)
1.0
ProduceGradeReport
Grade Detail Grade Report
23
Process
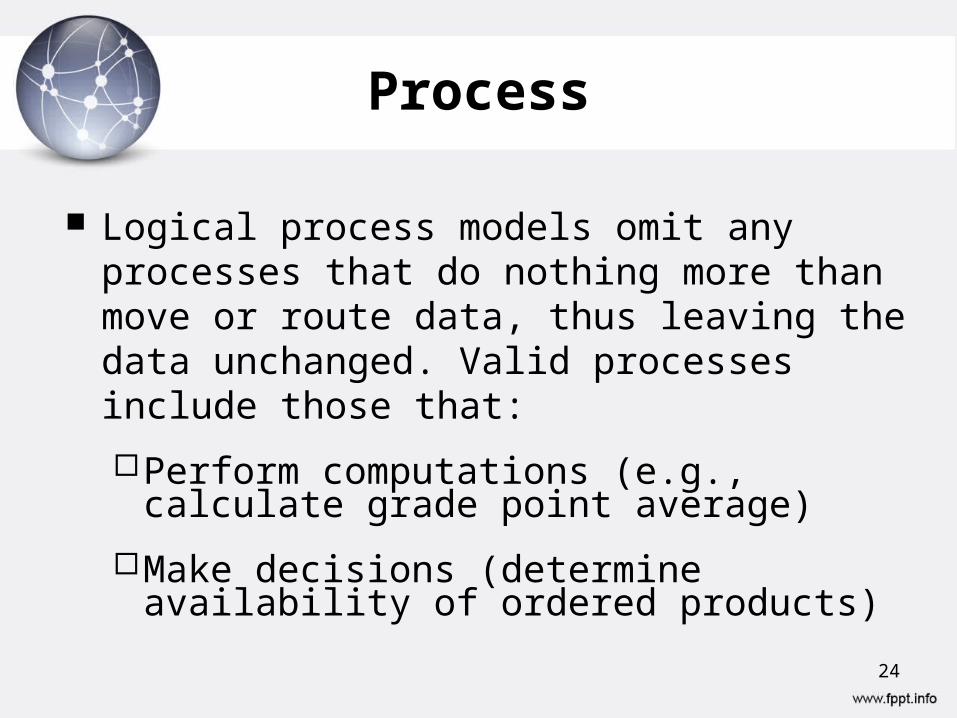
Logical process models omit any processes that do nothing more than move or route data, thus leaving the data unchanged. Valid processes include those that:
Perform computations (e.g., calculate grade point average)
Make decisions (determine availability of ordered products)
24
Process
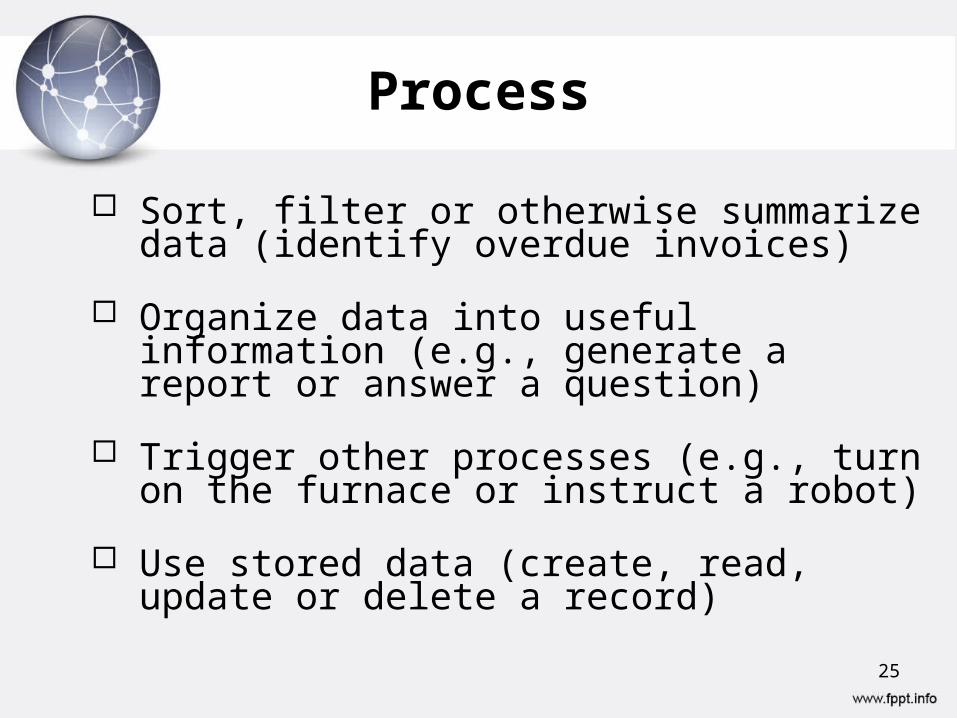
Sort, filter or otherwise summarize data (identify overdue invoices)
Organize data into useful information (e.g., generate a report or answer a question)
Trigger other processes (e.g., turn on the furnace or instruct a robot)
Use stored data (create, read, update or delete a record)
25
Rule 1: Process
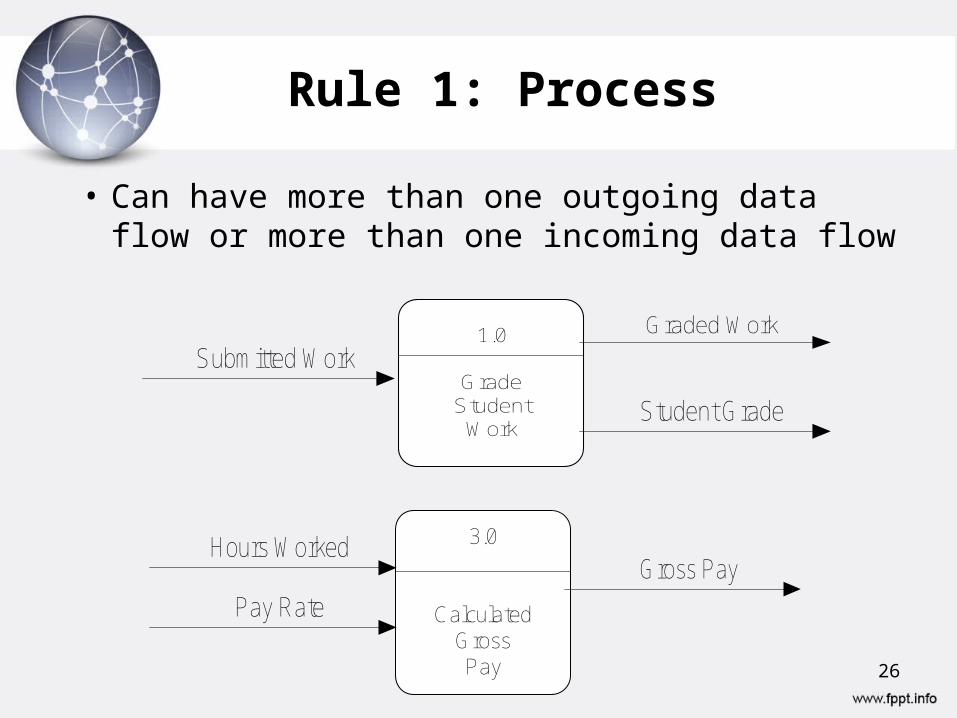
• Can have more than one outgoing data flow or more than one incoming data flow
1.0
GradeStudent
WorkStudent Grade
Submitted WorkGraded Work
3.0
Calculated Gross Pay
Hours Worked
Pay Rate
Gross Pay
26
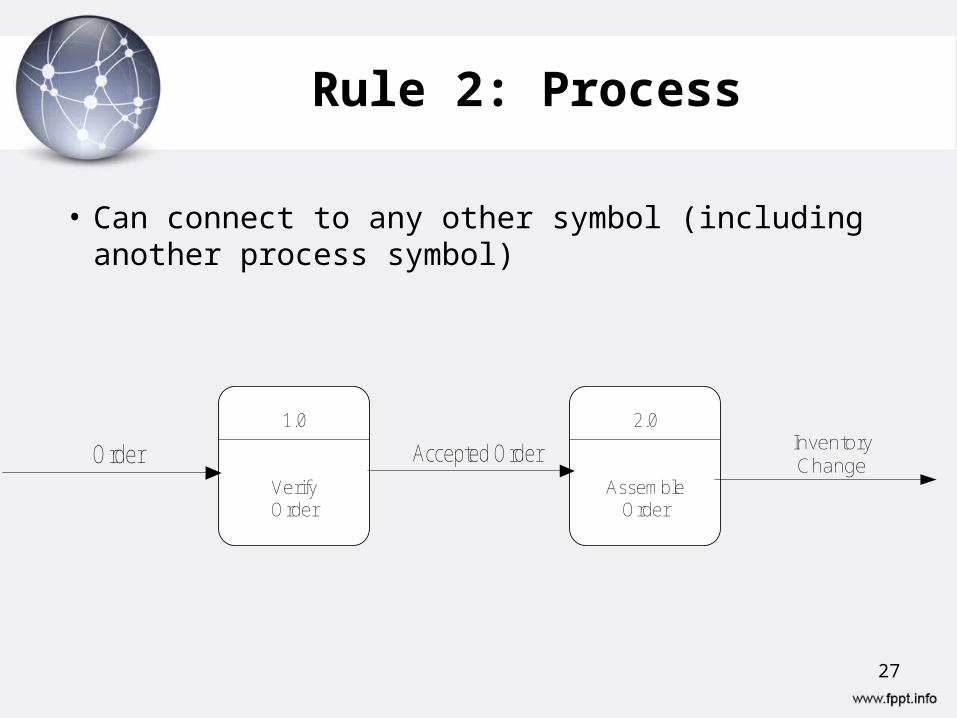
Rule 2: Process
• Can connect to any other symbol (including another process symbol)
1.0
VerifyOrder
2.0
Assemble Order
Order Accepted Order Inventory Change
27
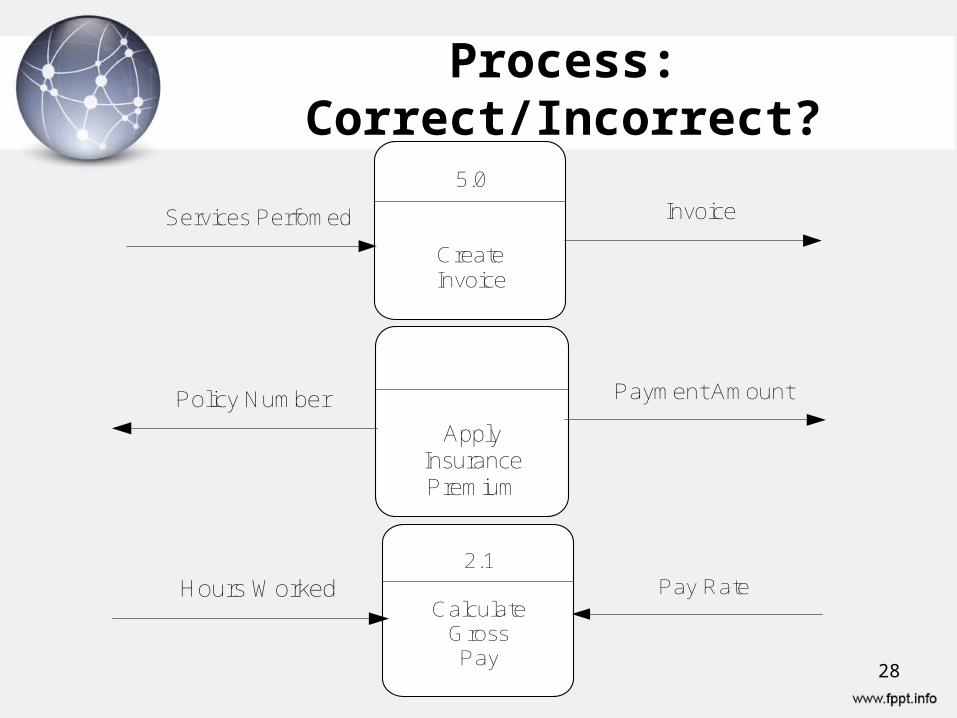
Process: Correct/Incorrect?
5.0
Create Invoice
Services Perfomed Invoice
Apply InsurancePremium
Payment AmountPolicy Number
2.1
Calculate Gross Pay
Hours Worked Pay Rate
28
Data flow
• Data flow; represents the movement of data. Can be a single piece of data or logical collection of several pieces of information
• Every data flow has a descriptive name that is a noun and description
• Data flows are generally shown as one-way only and those between external entities are shown as dotted lines
• At least one data flow must enter and exit each process
29
• Data in motion, moving from one place to another in the system
– From external entity (source) to system
– From system to external entity (sink)
– From internal symbol to internal symbol, but always either start or end at a process
Data Flow
30
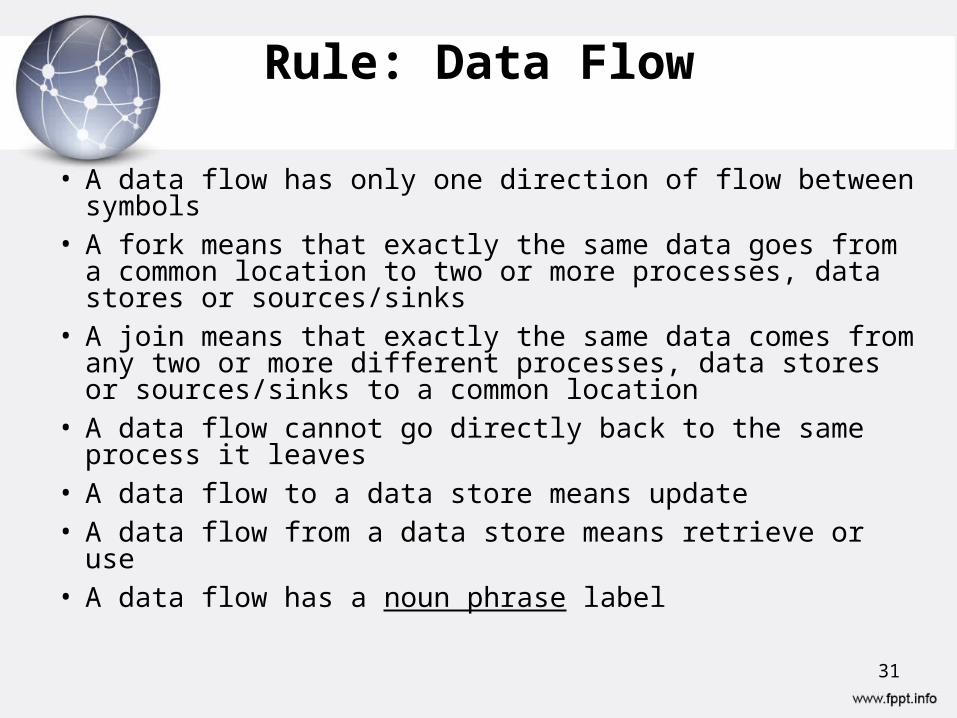
• A data flow has only one direction of flow between symbols• A fork means that exactly the same data goes from a
common location to two or more processes, data stores or sources/sinks
• A join means that exactly the same data comes from any two or more different processes, data stores or sources/sinks to a common location
• A data flow cannot go directly back to the same process it leaves
• A data flow to a data store means update• A data flow from a data store means retrieve or use• A data flow has a noun phrase label
Rule: Data Flow
31
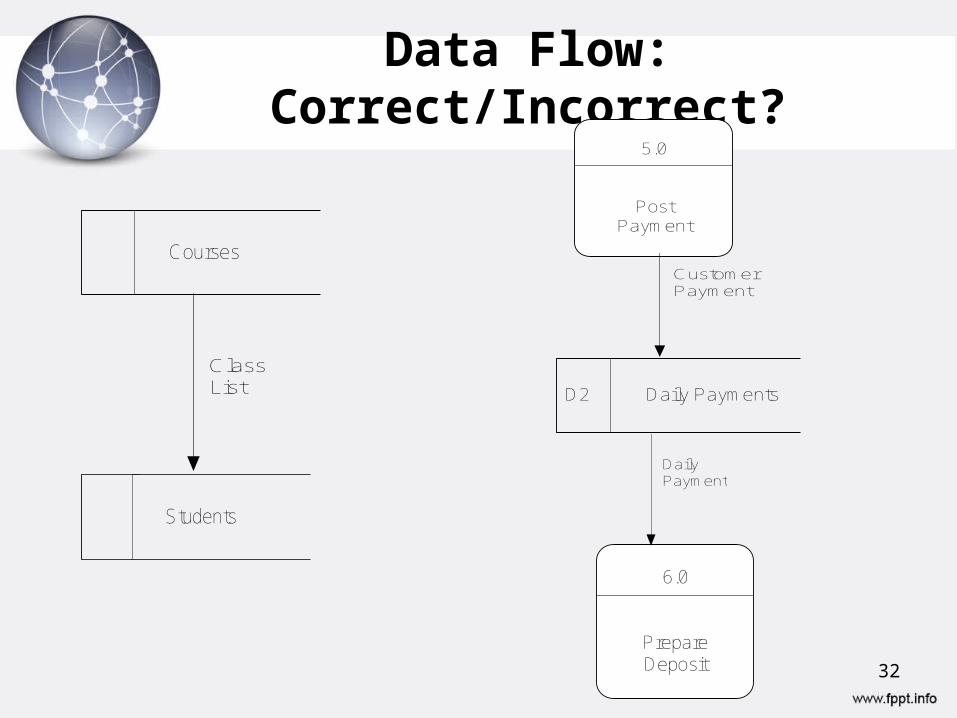
Data Flow: Correct/Incorrect?
Courses
Students
ClassList
5.0
PostPayment
Customer Payment
D2 Daily Payments
6.0
Prepare Deposit
DailyPayment
32
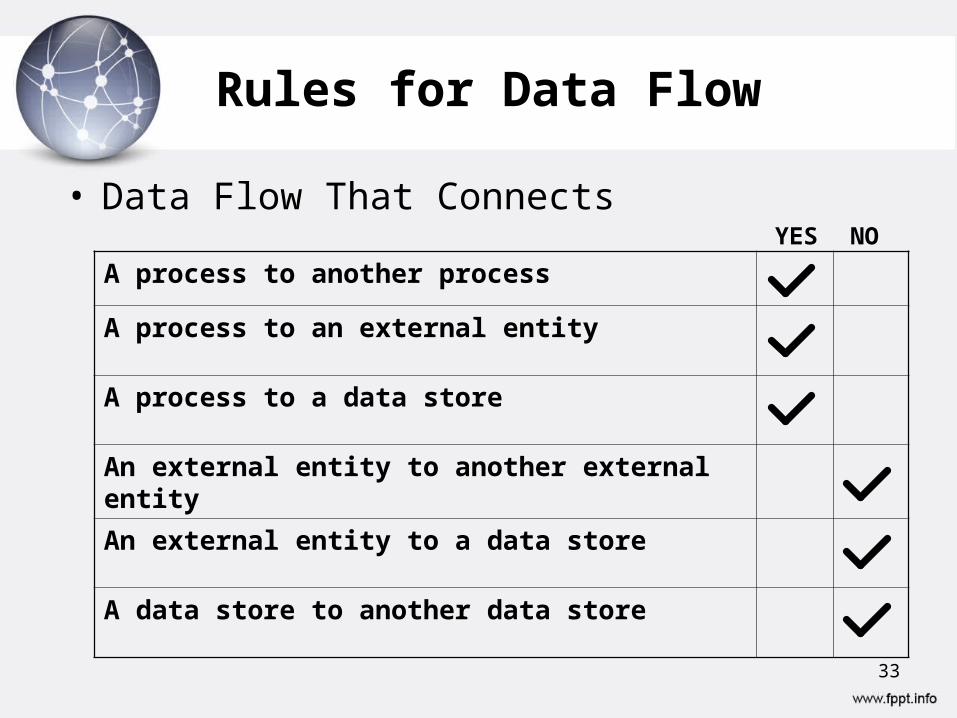
Rules for Data Flow
• Data Flow That ConnectsYES NO
A process to another process
A process to an external entity
A process to a data store
An external entity to another external entity
An external entity to a data store
A data store to another data store
33
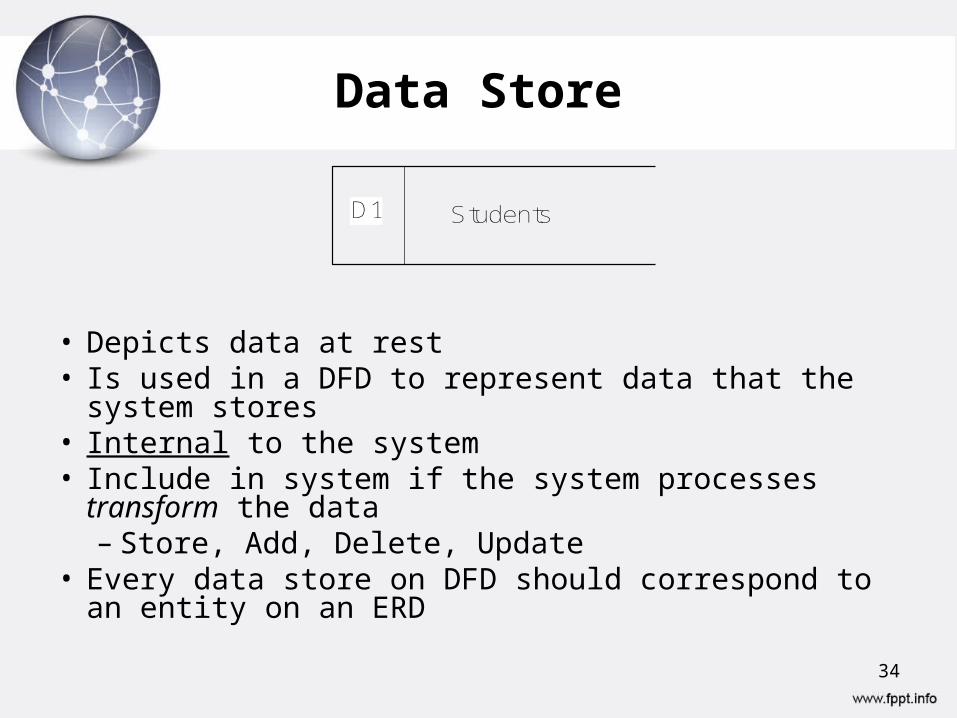
Data Store
• Depicts data at rest• Is used in a DFD to represent data that the system
stores• Internal to the system• Include in system if the system processes transform the
data– Store, Add, Delete, Update
• Every data store on DFD should correspond to an entity on an ERD
StudentsD1
34
Data Store Cont’d
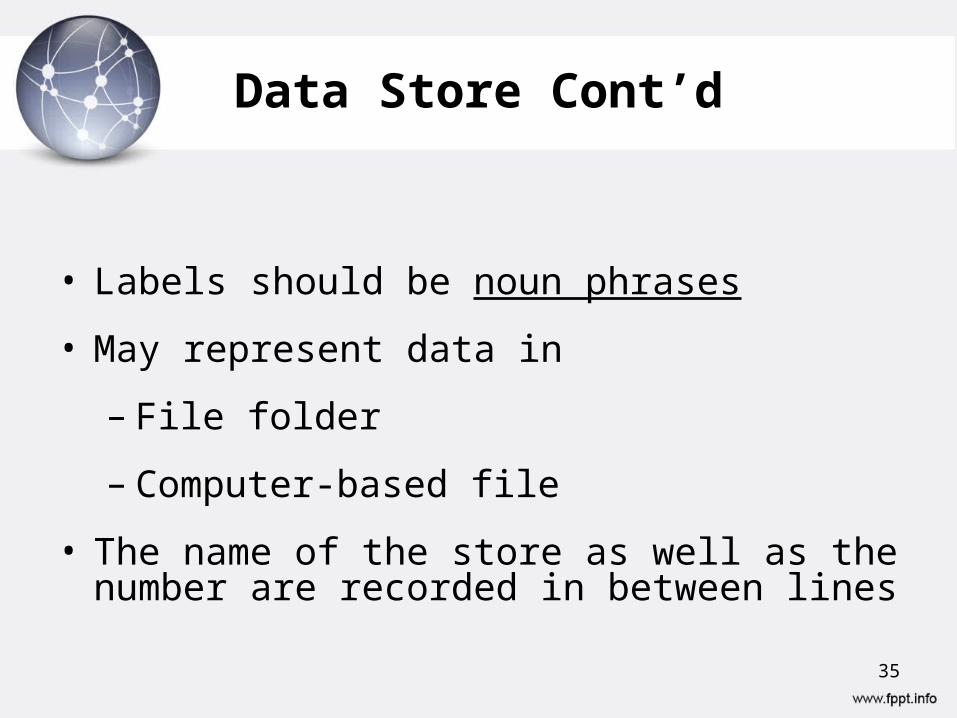
• Labels should be noun phrases
• May represent data in
– File folder
– Computer-based file
• The name of the store as well as the number are recorded in between lines
35
Data store
• Data store represents stores of data within the system
• A temporary or time delayed repository or collection of data
• Processes can add data to, or retrieve data from these stores
• Are either manual or automated inventories of data, e.g. computer files or database, file cabinets & card files.
36
Data store
• Data stores
Each store is given a reference letter
D - indicates a permanent computer file
M - indicates a manual file
T – indicates a transient (Temporary) store, one that is deleted after processing.
• To avoid complex flows, the same data store may be drawn several times on a diagram. Multiple instances of the same data store are indicated by a double vertical bar on their left hand edge.
37
Rule: Data Store
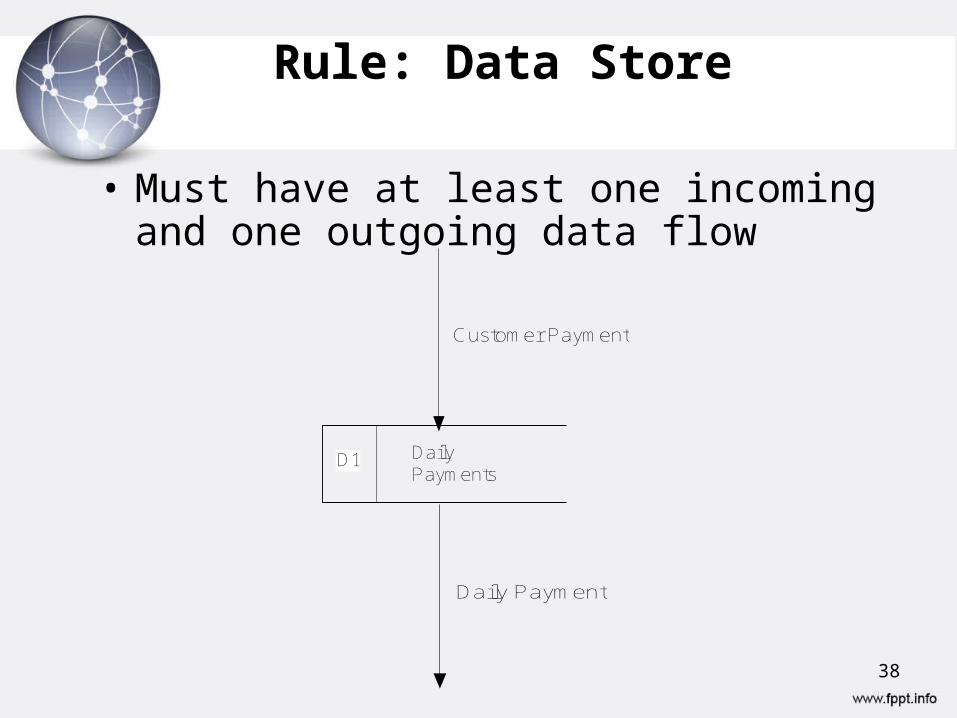
• Must have at least one incoming and one outgoing data flow
Daily Payments
D1
Customer Payment
Daily Payment
38
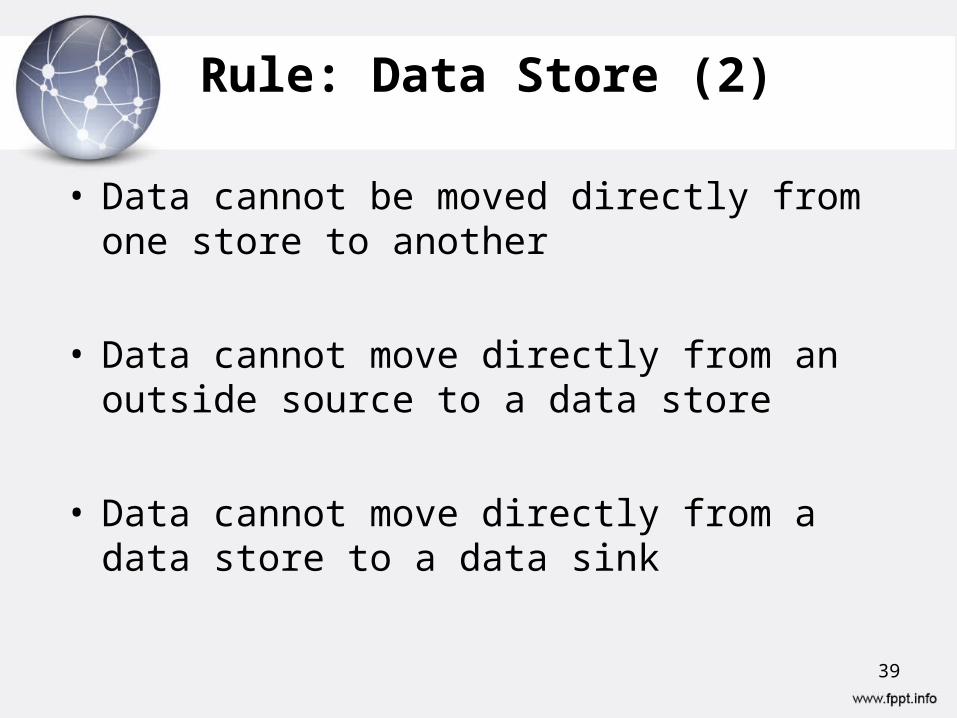
• Data cannot be moved directly from one store to another
• Data cannot move directly from an outside source to a data store
• Data cannot move directly from a data store to a data sink
Rule: Data Store (2)
39
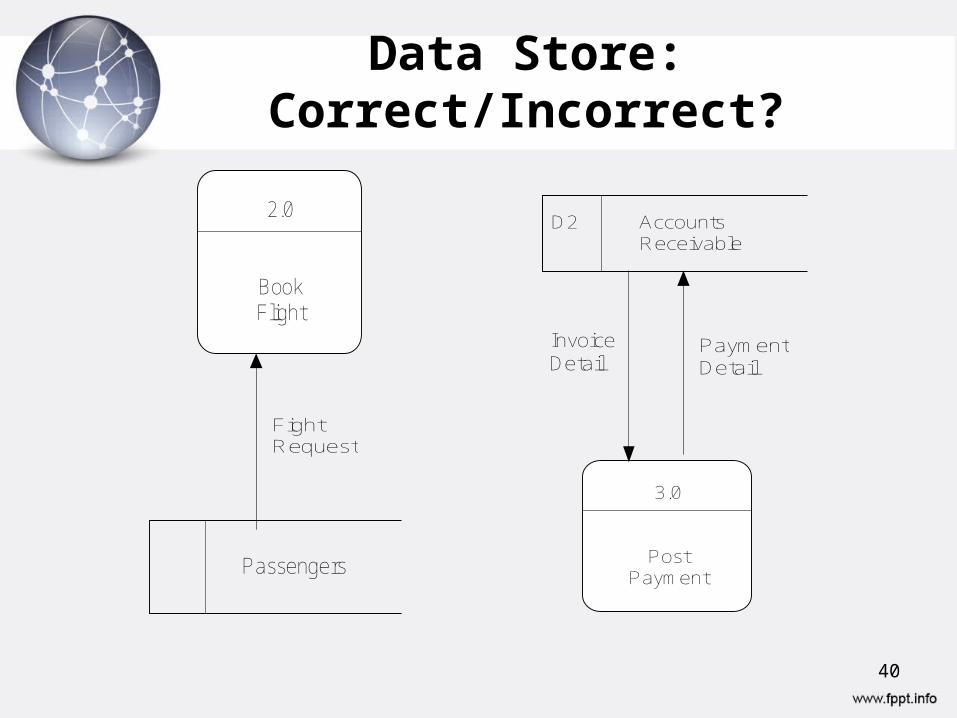
Data Store: Correct/Incorrect?
2.0
BookFlight
Passengers
FightRequest
D2 AccountsReceivable
PaymentDetail
3.0
PostPayment
InvoiceDetail
40
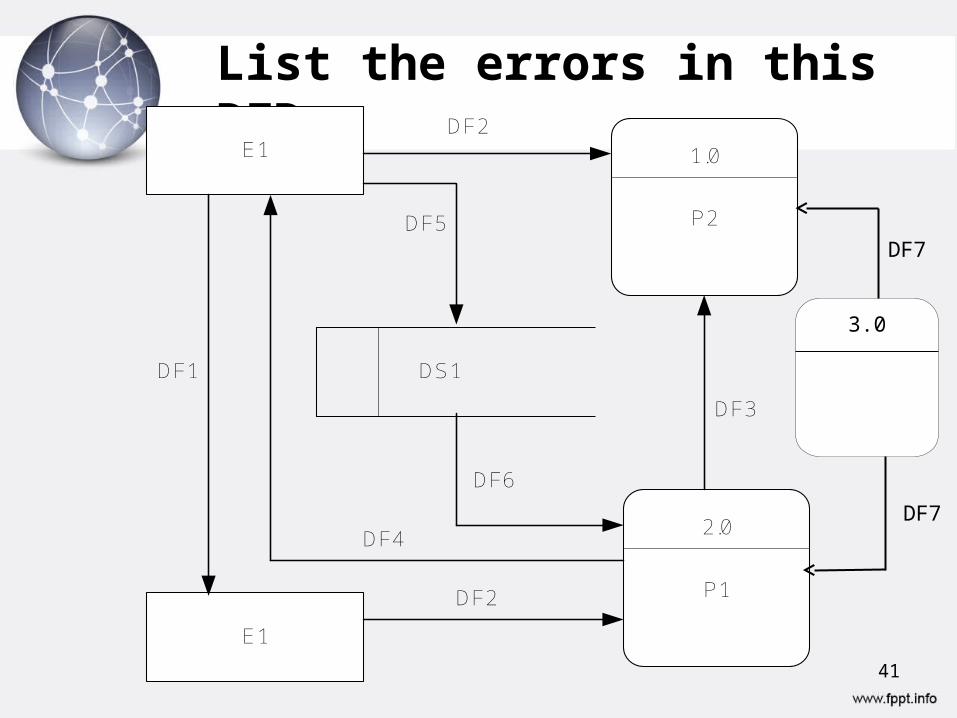
List the errors in this DFD
E1
E1
P2
P1
1.0
2.0
DS1
DF2
DF2
DF6
DF4
DF3
DF1
DF5
41
3.0
DF7
DF7
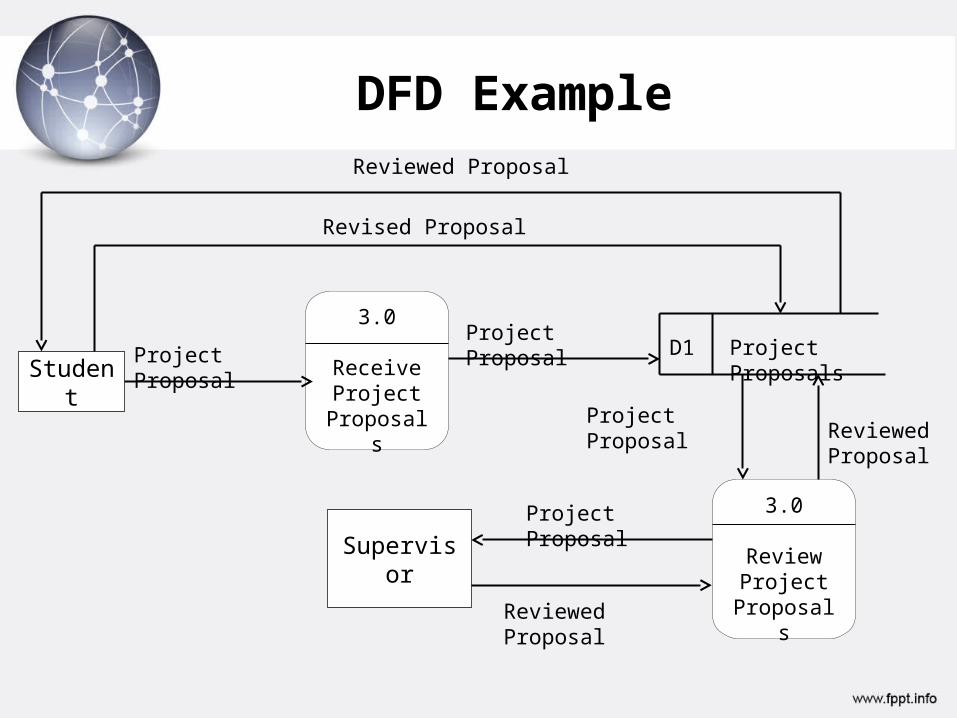
DFD Example
3.0
Receive Project
Proposals
Project ProposalStudent
Supervisor
3.0
Review Project
Proposals
Project ProposalProject ProposalsD1
Project ProposalReviewedProposal
Reviewed Proposal
Project Proposal
Reviewed Proposal
Revised Proposal
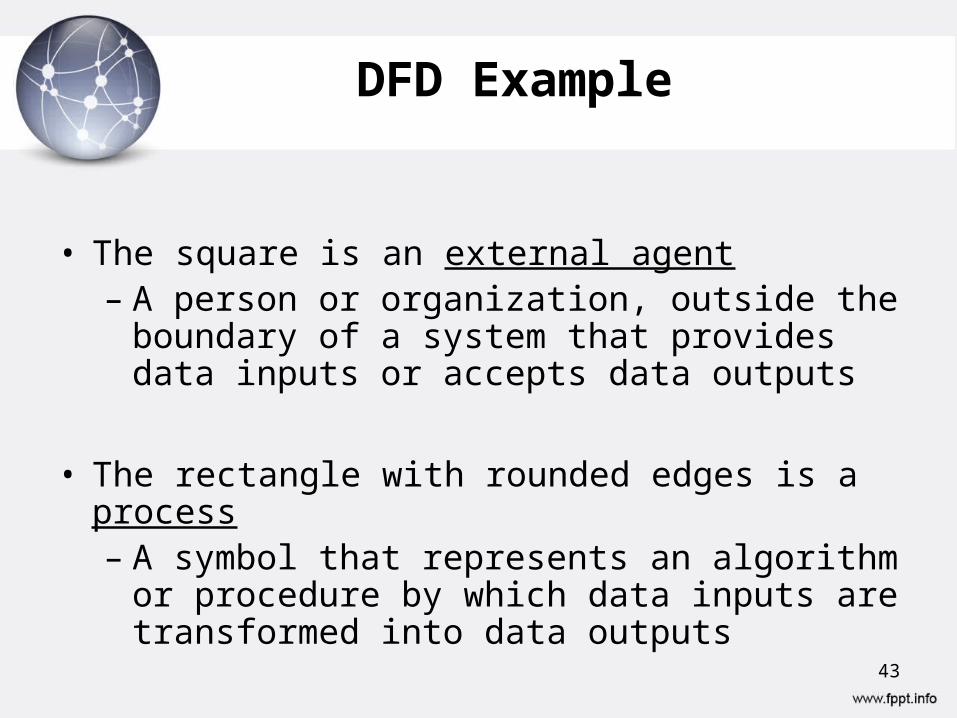
DFD Example
• The square is an external agent– A person or organization, outside the boundary of
a system that provides data inputs or accepts data outputs
• The rectangle with rounded edges is a process– A symbol that represents an algorithm or
procedure by which data inputs are transformed into data outputs
43
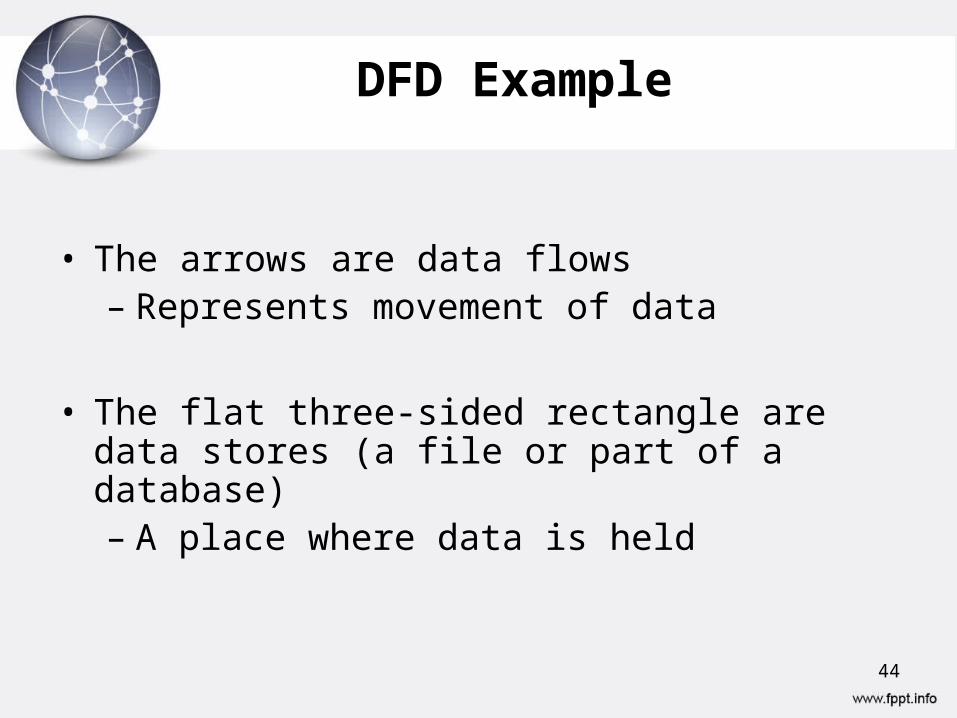
DFD Example
• The arrows are data flows – Represents movement of data
• The flat three-sided rectangle are data stores (a file or part of a database)– A place where data is held
44
DFD Decomposition (Levels of Abstraction)
• Most business processes are too complex to be explained in one DFD. Process models are therefore composed of a set of DFDs, this is referred to as decomposition– Other diagrams show the processing at a higher level
(more general) or lower level (a more detailed view of one process)
– Higher level processes in a DFD can be decomposed into separate lower level DFD
• DFD is decomposed into other DFDs each representing a lower level of detail. Decomposition starts with context diagram, level 0, level 1 , level 2 etc
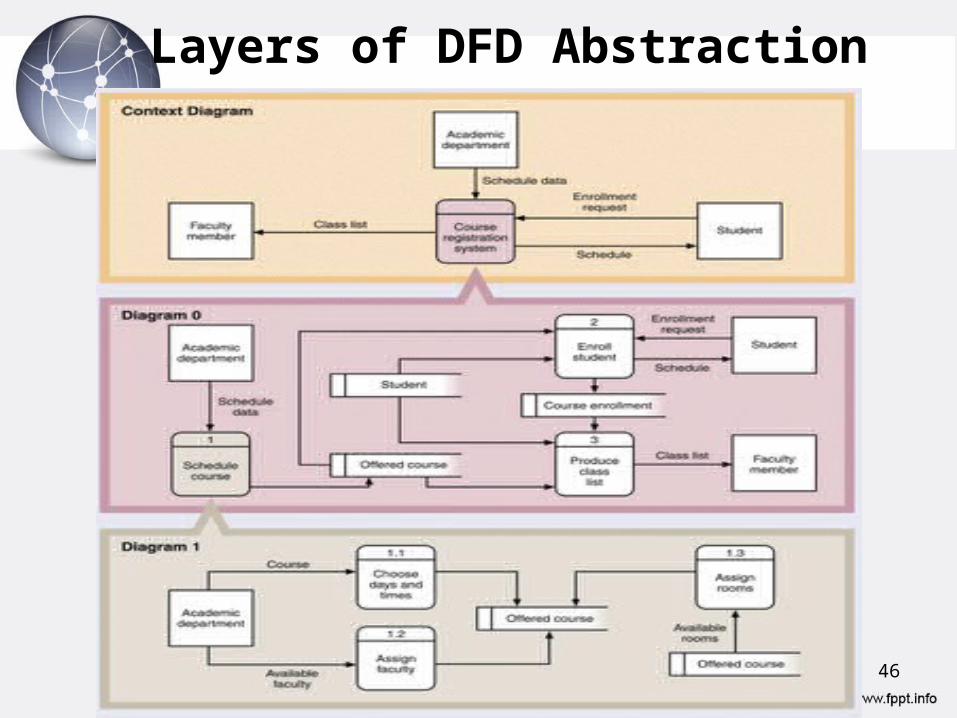
Layers of DFD Abstraction
46
Context Diagrams
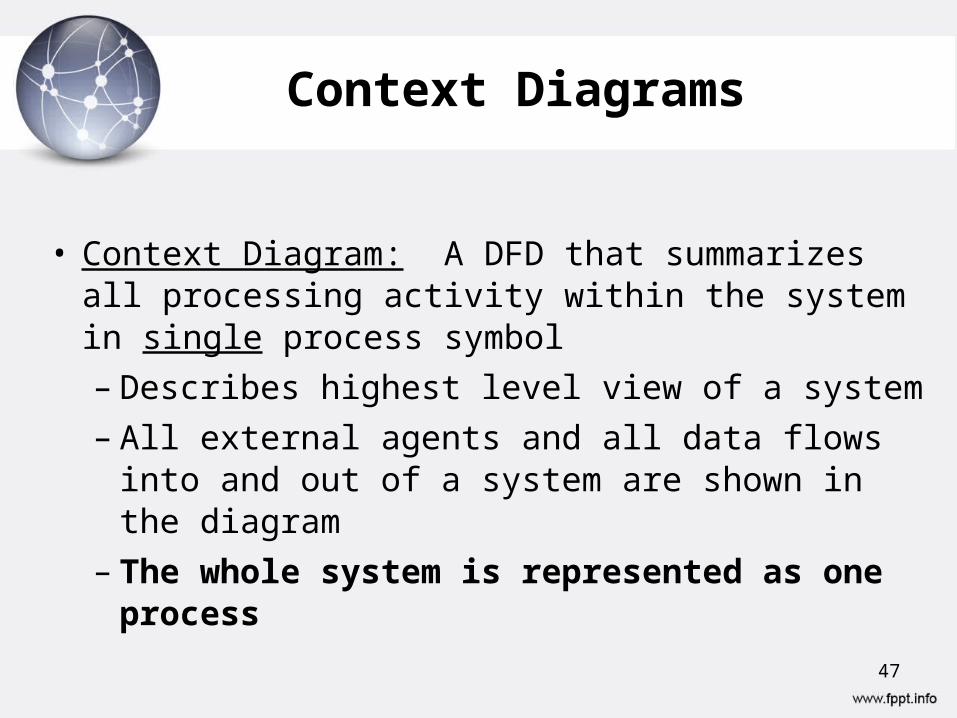
• Context Diagram: A DFD that summarizes all processing activity within the system in single process symbol
– Describes highest level view of a system
– All external agents and all data flows into and out of a system are shown in the diagram
– The whole system is represented as one process
47
Context Diagram
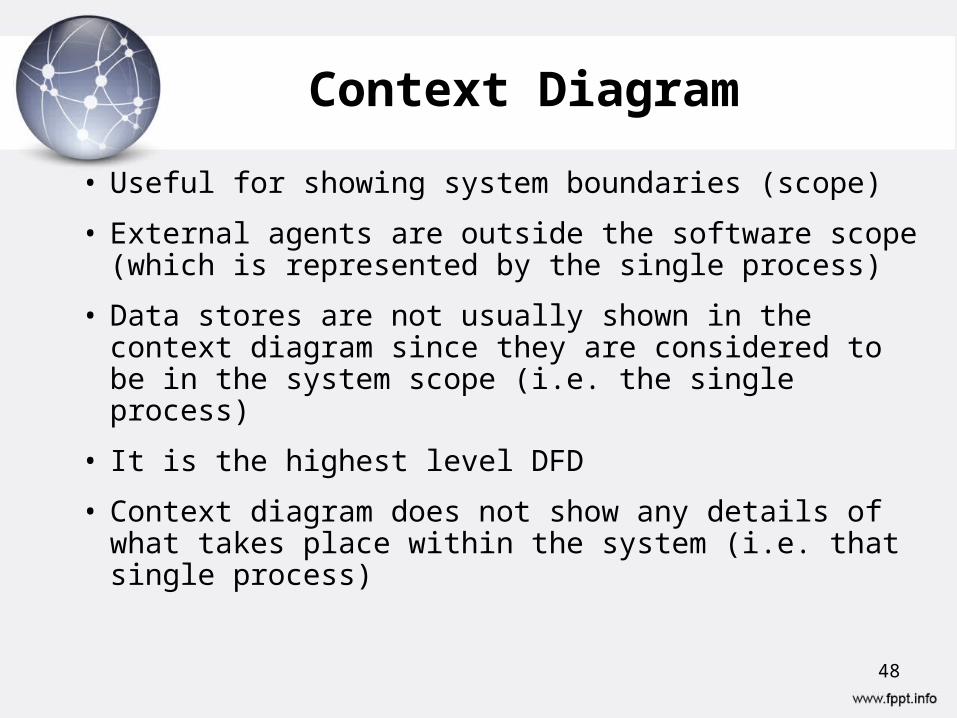
• Useful for showing system boundaries (scope)
• External agents are outside the software scope (which is represented by the single process)
• Data stores are not usually shown in the context diagram since they are considered to be in the system scope (i.e. the single process)
• It is the highest level DFD
• Context diagram does not show any details of what takes place within the system (i.e. that single process)
48
Context Diagram
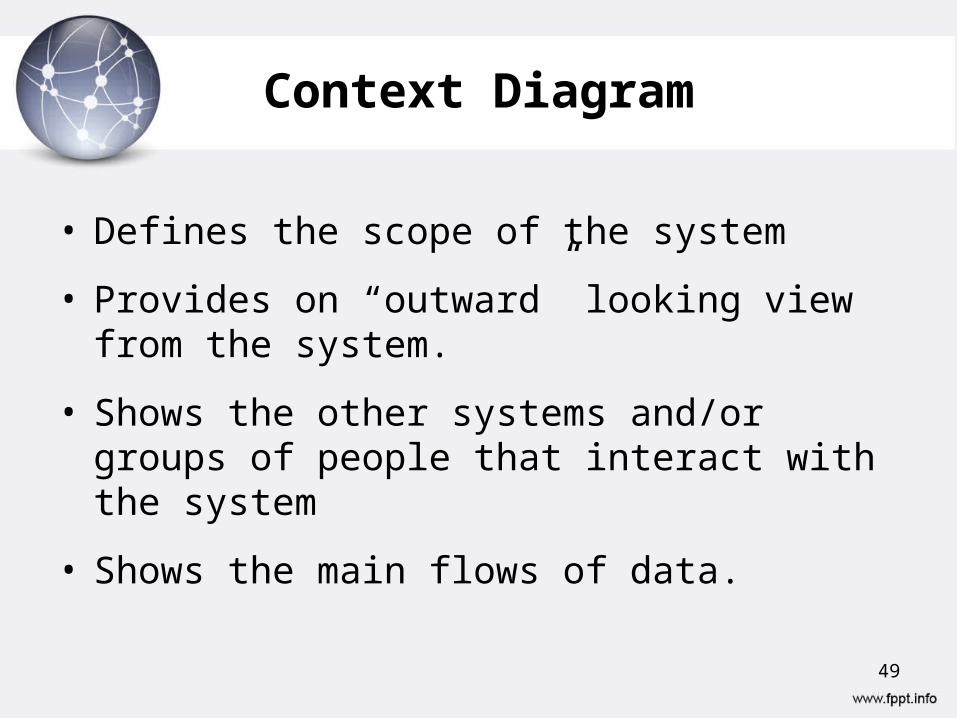
• Defines the scope of the system
• Provides on “outward” looking view from the system.
• Shows the other systems and/or groups of people that interact with the system
• Shows the main flows of data.
49
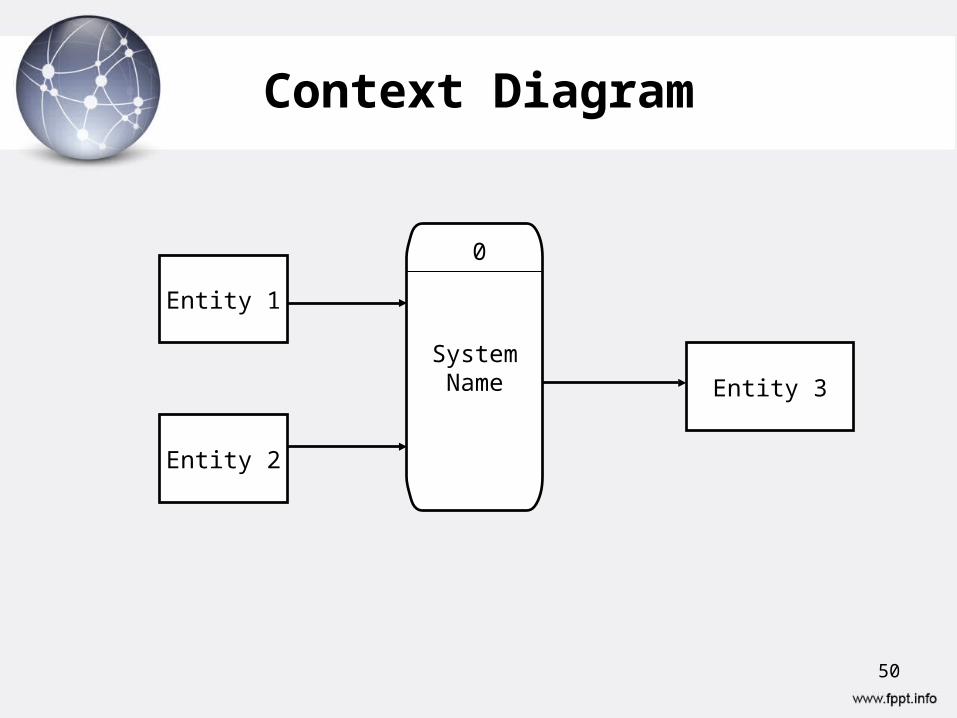
Context Diagram
SystemName
Entity 1
Entity 3
Entity 2
0
50
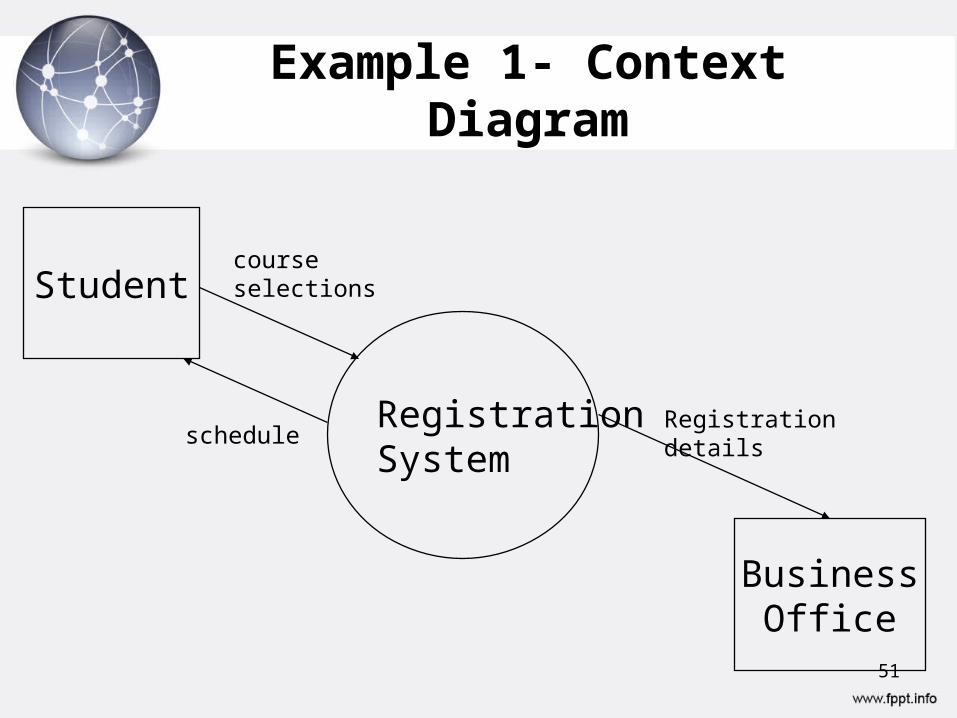
Example 1- Context Diagram
RegistrationSystem
Studentcourse selections
BusinessOffice
Registration detailsschedule
51
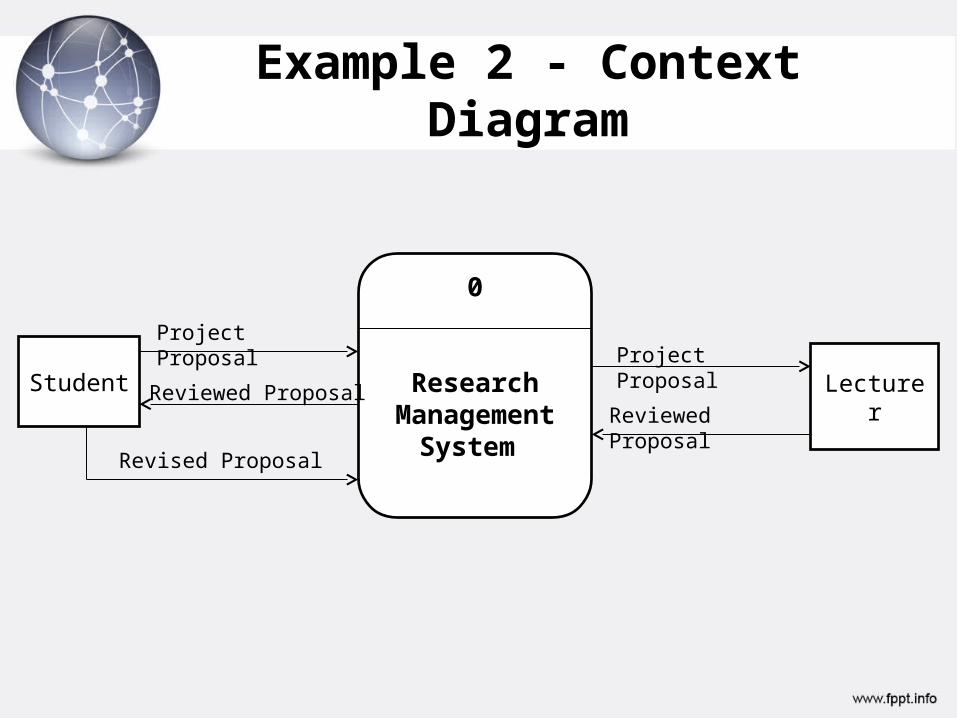
Example 2 - Context Diagram
0
Research Management
System
StudentLecturer
Project Proposal
Reviewed Proposal
Project Proposal
Reviewed Proposal
Revised Proposal
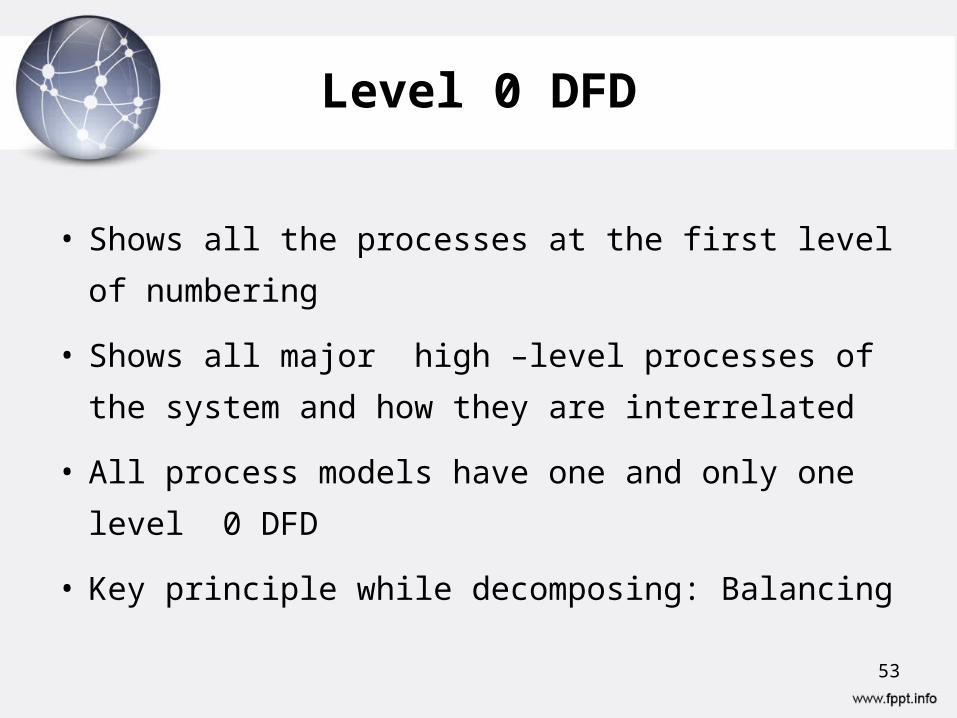
Level 0 DFD
• Shows all the processes at the first level of
numbering
• Shows all major high –level processes of the
system and how they are interrelated
• All process models have one and only one level 0
DFD
• Key principle while decomposing: Balancing53
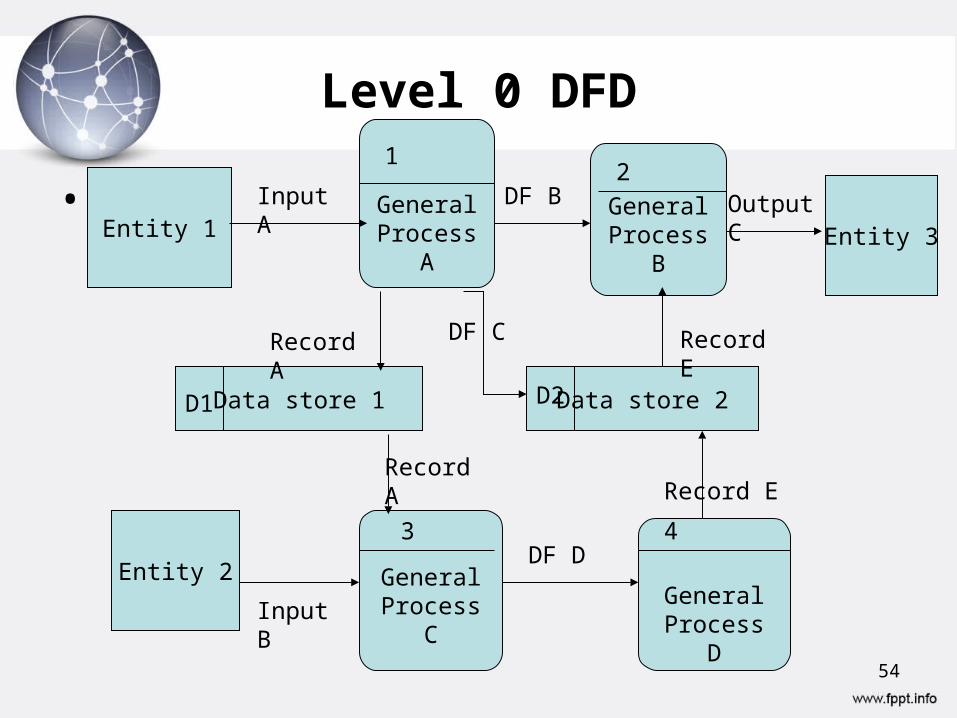
Level 0 DFD
• . GeneralProcess
A
Entity 1 Entity 3
Entity 2
GeneralProcess
B
GeneralProcess
C
GeneralProcess
D
Data store 1 Data store 2
Input A DF B Output C
Record A
Record A
Input B
DF C
DF D
Record E
Record E
D1 D2
12
3 4
54
Level 1 DFD
• Level 0 hides some of the system complexity just like a context diagram does
• Each process on the level 0 DFD can be decomposed into a more explicit DFD
• Shows how a process operates in greater detail
55
Creating Data Flow Diagrams
Creating DFDs is a highly iterative process of gradual refinement.General steps:1. Create a preliminary Context Diagram2. Identify Use Cases, i.e. the ways in which users most commonly use the system3. Create DFD fragments for each use case4. Create a Level 0 diagram from fragments5. Decompose to Level 1,2,…6. Go to step 1 and revise as necessary7. Validate DFDs with users.
56
General Rules for Drawing DFDs
1. Any data flow leaving a process must be based on
data that is input to the process (outputs must be
derivable from inputs)
2. All data flows are named and names reflects the
data flowing between the processes, sources, and
data stores (All elements must be named).
3. All processes have both inputs and outputs.
4. No physical items57
General Rules for Drawing DFDs
5. All data needed to perform the process should
be input to that process.
6. The process should be independent of any
other in the system- each process has its own
input and output.
7. Data must move through a process.
8. Different data flows may not merge.
58
More on DFD Guidelines
• All DFD diagrams must have a Heading with– Name and Diagram No. (except for context
diagram)• All process bubbles must have name and no.• Conservation of data flow
Flow Out = Flow In + Amount Stored
applies to transform bubbles and data stores.
59
More on DFD guidelines
• Avoid infinite sinks i.e. a process with no outgoing data flows
• Avoid spontaneous generation bubbles i.e. a process without any incoming data flows
• Beware of read-only or write- only data stores.
60

Q & A
61


![Multi-sectoral Response Rwanda Anita Asiimwe, MD,MPH Treatment and Research AIDS Centre [TRAC] Rwanda](https://img.pdfslide.us/doc/110x75/551bf8ab550346a34f8b47d6/multi-sectoral-response-rwanda-anita-asiimwe-mdmph-treatment-and-research-aids-centre-trac-rwanda.jpg)