Embed Size (px)
Citation preview

7 Ab-A095 18 ARMY ENGINEER TOPOGRAPHIC LAOS FORT BELVOIR VA FIG 15/4TERRAIN ANALYSIS PROCEDURAL GUIDE FOR CLIMATE.(U)SEP 80 R J FROUIGH
UNCLASSIFIED ETL-0247 NL
mimmommomumumflflflllllllllllhhhmhlhhhlhuIEEIIIIIIIIEEEElhllEElllEllEEEEEEEEEEEEIIElll//hEEEEE//E

~; TP~LEV LWTerrain aayi
a'lssproceduralguide for climate,
~ Ro~and J.JFrodigh
0<~ SEP~~8
o uS ARMY CORPS OF ENGINEERS
~fENGINEER TOPOGRAPHIC LABORATORIES
FORT BELVOIP VIRGINI 2206

IA
Destroy this report when no longer needed.Do not return it to the originator.
The findings in this report are not to be construed as an officialDepartment of the Army position unless so designated by otherauthorized documents.
The citation in this report of trade names of commercially availableproducts does not constitute official endorsement or approval of theuse of such products.
Ii 4g~~~-

UNCLASSIFIEDSECURITY CLASSIFICATION OF THIS PAGE (U, Data Entered)
REOTDCMNAINPAGE READ INSTRUCTIONSREPOR DOCMENTTIONBEFORE COMPLTN. FORM
I. REPORT NUMB3ER 12. GOVT ACCESSION NO. 3. RECIPIENT'S CATALOG NUMBER
ETL -0247 A _____________
4. TITLE (nd SobtilI.) S. TYPE OF REPORT & PERIOD COVERED
Terrain Analysis Procedural Guide forClimate (Rpt. No. 5 in the ETL Series onGuides for Army Terrain Analysts) S. PERFORMING ORG. REPORT NUMBER
7. AUTHOR(AJ 8. CONTRACT OR GRANT NUMBER?*)
Roland J. Frodigh
9. PERFOjdIN.. 171I..AMNZATION NAME AND ADDRESS 10. PROGRAM ELEMENT. PROJIECT, TASKMG! Data P rocessing and Prod Ucts Division AREA6 WORK UNIT NUMBERS
U.S. Army Engineer Topographic Laborat orie 4720A5Fort Belvoir, VA 22060 4720A5
I1I. CONTROLLING OFFiCE NAME AND ADDRESS 12. F,. -1 DATE
U.S. Army Engineer Topographic Laboratories 13. NUMBER OF PAGES
Fort Belvoir, VA 22060 14214. MONITORING AGENCY NAME & ADORESS(if different from Controlling Office) IS, SECURITY CLASS. (of this report)
NA UnclassifiedIS&. DECLASSIFICATION/DOWNGRAOING
SCHEDULE
16. DISTRIBUTION STATEMENT (of this Report)
Approved for Public Release; Distribution Unlimited
17. DISTRIBUTION STATEMENT (of the abstract entered In Block 20. It different fro. Report)
IS. SUPPLEMENTARY NOTES
IS. KEY WORDS (Coni..~. oI, -.'... ad. If nec..eery wnd identify by block -~ob.')
Terrain Analysis Factor MappingClimatic Analysis Thematic MappingP oto Interpretation Military Geographic Information
2"9ST7ACT (Cth* - rainrs ft if riecm sd IdentIty by block n-,ber)This procedural guide provides the Army Terrain Analyst with the methodsand procedures necessary to generate a thematic or factor overlay withsupportive tables for portraying climate. Seven potential sources ofinformation are considered: climatik summaries; climatic studies andclimatic atlases; geographic studies and atlases; maps (climatic);technical literature; aerial photography; and maps (topographic).Procedures for extracting climatic information (data elements) from thesesources are presented. Appendices Provide the-aayt ihadtoa
D JAN7 43 EIiNOP1
O6IOSLT UNCLASSIFIEDSECURITY CLASSIFICATION OF THIS PAGE (Wlhelt, Pate EnIO d)(

.5 A
UNCLASSIFIED51JIITy CLASSIFICATION OF THIS PAGE(fh a Dole EW..Md)
sources of information.
UNCLASSIFIED
SECURITY CLASSIFICATION OF THIS PAGE("-,. Dole Emt.d)

PRE FACE
This Procedural Guide for Climate, produced under authority containedin Project 4A762707A855, Task C, "Military Geographic Analysis Technology",is the fifth in a series of terrain analysis guides that will be producedin the next 2 years in support of the Military Geographic Information (MGI)subsystem of the Topographic Support System (TSS). Because these guidesare intended to be published as Department of Defense Technical Manuals,critical comment and suggestions are requested by the author. This workwas conducted under the supervision of Mr. Alexander R. Pedrson, Chief,Topographic Products Design and Development Group, Mr. A. C. Elser, Chief,MGI Data Processing and Products Division, and Mr. Kent T. Yoritomo, Director,Geographic Sciences Laboratory, US Army Engineer Topoqrdpnic Laboratories(ETL), Fort Belvoir, Virginia.
COL Daniel L. Lycan, CE, was Commander and Director dnd Mr. Robert P.Macchia was Technical Director of the Engineer Topoqraphic Laboratoriesduring the study and report preparation.
AcCC"" ! c
By-
1-- - , '. i , i o
D r
12

..
TABLE OF CONTENTS
TITLE PAGE
PREFACE I
ILLUSTRATIONS 4
I INTRODUCTION 5
A. Purpose 5
B. Background 5
C. Climate 8
1. Introduction 82. Climatic Types and Their Distribution 9
D. Data Elements 13
E. Source Materials 31
1. 1:250,000-Scale Topographic Maps 312. Climatic Summaries 313. Climatic Studies and Climatic Atlases 334. Geographic Studies and Atlases 335. Climatic Maps 336. Technical Literature 337. Aerial Photography 338. Large-Scale Topographic Maps 34
F. Reliability and Accuracy of Source Materials 34
II PROCEDURAL OUTLINE 34
III ANALYSIS 42
A. General 42
B. Acquisition of Source Materials 42
C. Factor Overlay Preparation 42
D. Data Tables Preparation 43
E. Analysis Procedures 43
1. 1:250,000-Scale Topographic Maps 43
2

TITLE PAGE
2. Climatic Summaries 463. Climatic Studies and Climatic Atlases 464. Geographic Studies and Atlases 475. Climatic Maps 476, Technical Literature 477. Aerial Photography 488. Large-Scale Topographic Maps 51
IV BIBLIOGRAPHY 52
V APPENDICES 54
A. Specifications for Preparing'Factor Overlays 54
B. Climatic Types and Their Distribution 64
C. Climatic Summaries 75
fJ. Climatic Narratives 1
E. Government and Other Sources 113
F. Imagery Sources 114
G. Conversions and Equivalents 120
H. Equipment List 123
VI GLOSSARY 124
3

ILLUSTRAT IONS
FIGURE TITLE PAGE
1 Production and Use of Factor Overlays and 6Data Tables
2 Western Hemisphere - Climatic Classifications 10
3 Eastern Hemisphere - Climatic Classifications 11
4 Comparison of Annual Climatic Regimes 12
5 Format for Climate Factor Overlay 14
6 Format for Climate Data Table No. 1 15
7 Format for Climate Data Table No. 2 16
8 Climatic Summary 32
9 Map - Normal Daily Maximum Temperatures 44for July
A-i Format for Factor Overlays with Long Axis E-W 55
A-2 Format for Factor Overlays with Long Axis N-S 56
A-3 Format for Climate Factor Overlay 61
A-4 Climate Data Table No. 1 62
A-5 Climate Data Table No. 2 63
Full Size Climate Table No. 1 Pocket
Full Size Climate Table No. 2 Pocket
4

TERRAIN ANALYSIS PROCEDURAL GUIDE FOR CLIMATE
1. INTRODUCTION
A. Purpose.
The purpose of this report is to provide terrain analysts with step-by-step procedures for collecting and analyzing climatic information andrecording the results in the form of factor overlays. Procedures areprovided for using eight types of sources: 1:250,000 scale topographicmaps; climatic summaries; climatic studies and climatic atlases; geographicstudies and atlases; climatic maps; technical literature; imagery; andlarge-scale topographic maps.
B. Background.
The first step in generating terrain intelligence and preparing specialpurpose products is to extract the data contained in a variety of sourcematerials and reduce it to a uniform format. This first step of extractingdata from available sources, then reducing and recording it in the desiredform, is the most laborious and time-consuming step in the production cycle.If the extraction process is delayed until a production requirement isimposed, the response time would be increased. However, if the extracting,reducing, and recording is performed in advance and the preformatted resultsmaintained in the data base, the time required to respond to a productionrequirement can be greatly reduced. One practical method of producing thisinformation is the factor overlay concept, which records the results of theclimate analysis for the data base.
In figure 1, the factor overlay concept for preformatting data is shownin the form of factor overlays registered to standard military topographicmaps. Under this concept, data are extracted from various source materialsand recorded on factor overlays and/or supporting data tables. Separateoverlays and tables are prepared for each major terrain subject or datafield, e.g. surface materials, surface configuration, vegetation, drainage,roads, and climate. Factor overlays and tables are intermediate data baseproducts intended primarily as tools for the terrain analyst and are notcustomarily distributed outside of the topographic and intelligence community.
Factor overlays are used in various combinations to generate factor-complex maps that become, in effect, the manuscripts for special purposeproducts, such as cross-country movement, fields of fire, IPB (IntelligencePreparation of the Battlefield) graphics, etc. The data elements appearingon complex maps become inputs for analytical performance prediction models.For example, preparing a cross-country movement (CCM) map would beginby combining the overlays for surface configuration, surface materials, andvegetation into a complex map. Those data elements affecting CCM, i.e. slope,stem spacing, stem diameter, soil strength, etc., are then recorded in thecomplexed areas of the map. When processed by analytical models, these
5

On Site DatDat CoasecStorA e raimgyMp
SuFactor
R o u h n s s a n f o r V g e at i n a t c a M o d e l
Intelligenelate Prprto oClittleielPtructute
Daase Storagetio
Figur 1. rodtion aind s of fcorOvrly
ande Data Tableso6ilsofFr
Co ce -m Cmuicto

elements are transformed into vehicle speed predictions for each complexedarea.
The climate product, as envisioned by this guide, is a tabulation ofclimatic data, with a factor map overlay showing the location of weatherstations documented in the tables. The climatic data will become part ofthe data base described above. However, the complexing, or stacking, offactor overlays will not apply to the climate product. There are two reasonsfor this. Firstly, unlike most factor maps, climate overlays are registeredto 1:250,000 scale topographic maps. Secondly, .ecause of the universalpractice of recording climatic data on a month-by-month basis, it would beimpractical to plot such data on factor overlays. It would entail preparing12 separate sheets for each climatic element, involving hundreds of overlays.Therefore, information on the factor map for the climate data field will belimited to locating and identifying weather stations. However, pertinentclimatic data will be recorded in the data tables. Although not a tool inthe normal overlay complexing system, information describing the climate ofa mapped area will be used in preparing battlefield graphics by identifyingsignificant seasonal and monthly variations in such natural terrain elementsas precipitation-soil moisture, stream levels, ice thickness, snow cover,obstructions to visibility, sky cover, etc.
The source materials used in preparing the factor overlay for climatewill include those given in figure 1. The amount and type of data collectedwill depend on the analyst's training, amount of reference literature, avail-ability of climatic data, geographic region, and the type and scale of theaerial imagery that can be obtained.
It is recommended that the analyst be familiar with the contents of thefollowing training manuals, field manuals, and texts:
TM 5-1, Specifications for Military Maps, Department of the Army, Corps
of Engineers, Army Map Service, Vol. I and Vol. II, 1973.
TM 5-248, Foreign Maps, Headquarters, Dept of the Army, 1963.
TM 30-245, Image Interpretation Handbook, Vol. I, Department of theArmy, Navy, and Air Force, 1967.
FM 21-26, Map Reading, Headquarters, Department of the Army, 1969.
FM 21-31, Topographic Symbols, Headquarters, Department of the Army, 1961.
FM 30-5, Combat Intelligence, Headquarters, Department of the Army, 1973.
FM 30-10, Military Geographic Intelligence, Headquarters, Department ofthe Army, 1972.
7

FM 31-3 ATM 105-4, Weather Support for Field Arniy Tacticdl 0perations,Department of the Army and t he Air Force.
AR 115-10, AFR 105-3, Envi ronmental Services Meteoroloqical Support ForThe U.S. Army, Departments of the Army and the Air Force, June 1970.
AR 115-2, U.S. Army Requi rements for Air Weather Servi ce.
Interpretation of AerialPhotogrphs, 2nd Edition, Avery, T.E., BurgessPublishing Co., Minneapolis, Minnesota, 1968.
C. Climate (Overview)
1. Introduction. The terms 'weather" and "climate" are oftenused interchangeably. It is not uncommon to find climatic data, as well asclimatic studies, listed as cate~ories under the broad heading of "weatherinformation." Generally speaking, the same inforniation (basic data) is usedin predicting current weather conditions and in predicting future climaticpatterns. In the former, current werather data (temperature, precipitation,winds, pressure, etc.) occurring at a specific time and at a specificlocation are used to make assessments of weather conditions, up to about 5days beyond the time of the basic observations. In this use of weatherinformation, the time factor is very critical. The information is shortlived from the point fo view of its value for predicting day-by-day weather.However, ;uch data, recorded and averaged cver a period of years, becomethe raw material used in climatology. From the data, long term averagesare formulated, enabling the user to establish what the climatic regime willbe within a particular region, monthly and seasonally. Thus, because of thevery limited time span associated with current weather-forecasting capabil-ities, the methods of climatology must be used in long range military planning.
Although it does not enable the analyst to predict whether rain willfall or a storm system will pass, climatic information will provide the bestdata for predicting general weather patterns during a specific future period.
Temperature, precipitation, humidity, winds, and air pressure areprimary elements of weather and climate, and they in turn are the productsof one or more climatic controls; (1) sun (latitude), (2) land and watermasses, (3) semipermanent high and low pressure cells, (4) prevailing winds,(5) air masses, (6) altitude, (7) mountain barriers, (8) ocean currents,
i r and (9) jet stream locations.
The accuracy of weather predictions, based on climatic records,will vary greatly from place to place. Certain areas along the equatorexperience daily weather that is so constanit throughout the year thatweather and climate are virtually the same. In other regions, particularly
8

in continental midlatitude areas (the belt of prevailing westerlies), themeeting of contrasting air masses spawn rapid and frequent weather changesthat may be predicted only on the basis of estimated frequency of occurrencewithin each month.
2. Climatic Types and Their Distribution. Although global climateis made up of innumerable regional climates, climatologists have developedgeneralized systems that they have applied to world classifications. Infigures 2 and 3 a worldwide classification is shown, with delineatingboundaries of climatic regions,basedon long term climatological averagesof tenperature and precipitation.
In collecting and tabulating climatic elements, the terrain analystmust acquire an understanding of the distribution and characteristics ofmajor climatic types. In appendi B, each of the climatic regimes mappedin figures 2 and 3are discussed briefly, with individual graphs depictingthe temperature-precipitation regimes upon which the classifications arebased. All of the climographs are for northern hemisphere stations. Inthis regard, it should be realized that the annual temperature at a southern
location will be opposite that of a nor'hern hemisphere location. Also,similar differences will be apparent in the precipitation data. Figure 4depicts temperature and precipitation in identical climatic types, onelocation in the northern hemisphere and the other in the southern hemisphere.
Appendix B provides the analyst with information required toidentify the climatic type for each station entered in the data tables.
9

HUMID MESO [I MEDIERRNEA
0".
r I
CLIMATIC TYPES I *
TROPICAL f= U RAIN FOREST
CLIMATES WSAVESN T 0
CLIMATES DESERT
HUMID MESO- - MEDIT ERRANEANTATHERMAL - HUMID SUBTROPICAL
CLIMATES I
P 1HUMID CONTINENTAL N 3
PMAR 30-ME0
THERMAL (COOL SUMMER )CLIMATESSUBARCTIC"
CLIMATES ICE CAP
HIGHLAND 50 50
"lO 00 90 so 70 0 0 40 30 2§_
FM 30-10
Figure 2. Western Hemisphere - Climatic Classifications.
10

30 20 f
0 20 30 40 0 I 9
CLIMATES SAVAN NA HUMID MICRO- ______ TERMALHUMID CONTINENTAL{ l TERA (COOL SUMMER)DRY STEPPE CLIMATES __ UACICLIMATES DESERTSUACI
THERMAL HUMID SUBTROPICAL CLIMATES l ICE CAPCLIMATE S MARINE WEST HIGHLAND ICOAST
FM 30-10
Figure 3. Eastern Hemisphere - Climatic Classifications.
11
10.

Mediterranean Climate Mediterranean ClimateIN Athens, Greece P N, Santiago, ChileP
24 - -70 24 - -- - -- 70
22-- -60 22 6 ---- -0
20C------- -q 50 2 0 --- 50
18----------- 40 18-- -- - 40
16------------------- 3016 -3
14 - 20 14 2
12 ---- -- 10 8---- -- 10
2 - - -40 2 .40i
0 Em m E50 0 -5s01F M AM J J A ON D J F A J jJ A s n) N D)
Northern Hemisphere Southern Hemisphere
Figure 4. Comparison of Annual Climatic Regimes.
12

D. Data Elements.
The following list of data elements has been extracted from standardclimatic summaries (appendix C) and represents most of the climatic datacategories that the terrain analyst will encounter in a search for worldwidedata. These elements make up the content of Data Tables 1 and 2 (figures 6and 7) in a format providing for the entry of monthly and annual values foreach data element. Wording, numerical values, and units of measurement havebeen retained as they appear in the summaries from which they have beenextracted to facilitate the task of retrieving and entering climatic datain the tables.
Because this list of data elements includes items from many summariesthat differ in the type and amount of climatic information recorded, theretrieved data for any single station will make up only a small percentageof the total possible entries listed in the data tables.
Figures 5, 6, and 7 illustrate the format of the Factor Overlay and thetwo Data Tables for Climate. For more detailed information on the overlayand data tables, see appendix A.
13
Ad

kA WASHINGTONCLIMATE
co Ceie Rw..
7.A0-r Sf AMb
* ).,c.~.4.J *7499As
7%%~,c
* Q~o..A~ 'M7Z404
* C~,I*&
LEGENDf
Fi gure 5. Format for Climatic Factor Overlays.
14

IHIM
1h II "Odd
ITT TMT I 4
11 1 1 1 fi ll [[ il fi l (a
I if i l - - - - - - - -4
Im-
1! .. 01. - I
.. ..... ..
15-

- -
II
.. ........~ ...... ...... . ..
.... ....... ....... ........ . ....
"""'' t v.16

REPORTING STATION/AREA
A. Name/numberB. Climatic ClassiftcationC. Location: Actual or Contrived
1. Latitude2. Longitude3. UTM Coordinates
D. Years of recordE. ElevationF. Control
1. Country2. State/Provi nce3. Type of Station
a. Automatedb. Observerc. Status (permanent, seasonal, other)
G. Data source(s)
II TEMPERATURE
A. Mean daily maximumB. MeanC. Mean daily minimumD. Mean range:
1. Maximum2. Minimum
E. Mean number of days with maximum1. > 900F.2. > 800 F.3. > 750F.4. < 320 F.
F. Mean number of days with minimum1. < 450F.2. < 32uF.3. < OF.
G. Mean dew pointH. Cumulative percent frequency of occurrence.
1. Mean daily maximumIncrements (0F.)
17

2. Mean dailyIncrements (uF.) _______
3. Mean dailyMinimum ("F.)_________
III RELATIVE HUMIDITY
A. Mean dailyB. Mean hourly:
030004000600073009001200130014301500180021002400
IV STATION PRESSURE
A. Mean dailyB. Mean hourly:
030006000900a12001500
18

180021002400AllI
V. DEGREE DAYS
A. HeatingB. Cooling
VI PRECIPITATION
A. Mean maximumB. MeanC. Mean minimumD. Maximum 24 hourE. Mean range
1. Maximum2. Minimum
F. Mean number of days with:1. --.01 inch2. > .04 inch3. > .5 inch4. >1. inch5. > .1 mm
G. Mean djaily amountsIncrements - inches .01
.02 - .05
.06 - .10
.11 - .25
.26 - .50
.51 - 1.001.01 - 2.502.51 - 5.005.01 - 10.00
10.01 - 20.00> 20.00
H. Mean number of days with measurable precipitation1. Mean number of days with amounts > .004 inch (trace)J. Percent frequency of occurrence of rain and/or drizzle by monthK. Percent frequency of occurrence of rain and/or drizzle
Hourly groups: 00 - 0203 - 0506 - 0809 - 1112 - 1415 - 1718 - 2021 - 23
19

L. Percent frequency of occurrence of freezing rain and/or drizzleby month
M. Percent frequency of occurrence of freezing rain and/or drizzleby hourly groups: 00 - 02
03 - 0506 - 0809 - 1112 - 1415 - 1718 - 2021 - 23
N. Mean number of days with amounts:* .004 inch* .004 inch* .39 inch* .99 inch
0. Number of days with liquid precipitationP. Snowfall
1. Mean maximum2. Mean3. Mean minimum4. 24 hour maximum5. Amount
a. > 0.1 inchb. > 1.0 inchc. > 1.5 inch
6. Mean date of first snowfall7. Mean date of last snowfallB. Mean number of days with measurable snowfall9. Percent frequency of occurrence of snow and/or sleet by month10. Percent frequency of occurrence of snow and/or sleet by
hourly groups. 00 - 0203 - 0506 - 0809 - 1112 - 1415 - 1718 - 2021 - 23
20
moil

11 ecn rqec focrec fboic nwb ot
11. Percent frequency of occurrence of blowing snow by hontly
groups: 00 - 0203 - 0506 - 0809 - 1112 - 1415 - 1718 - 2021 - 23
13. Mean daily amounts: NoneTrace.1 - .4 inch.5 - 1.4 inch
1.5 - 2.4 inch2.5 - 3.4 inch3.5 - 4.4 inch4.5 - 6.4 inch6.5 - 10.4 inch10.5 - 15.4 inch15.5 - 25.4 inch25.5 - 50.4 inch
> 50.4 inch
Q. Snow depth (snow cover)1. Mean date of first measurable snow cover2. Mean date of last measurable snow cover3. Mean depth at end of month4. Number of days with snow cover (ground more than half covered)5. Mean number of days wvith measurable snow depth by classes
(inches). 12
4-67 -12
13 -24
25 -36
37 -48
49 -60
61 -120
>1206. Mean number of days with
* 1.0 inch* 6.0 inch>10.0 inch
R. Hail1. Percent frequency of occurrence by month2. Percent frequency of occurrence by hourly groups
00 - 0203 - 05
21

06 - 0809 - 1112 - 1415 - 1718 - 2021 - 23
3. Mean number of days occurrence
VII THUNDERSTORMS
A. Mean number of days with thunderstormsB. Percent frequency of occurrence by month
C. Percent frequency of occurrence by hourly groups:00 - 0203 - 0506 - 0809 - 1112 - 1415 - 1718 - 2021 - 23
VIII WIND
A. Prevailing directionB. Speed
1. Mean maximum2. Mean3. Mean peak gust4. Mean fastest mile5. Percent frequency of occurrence > 17 knots6. Percent frequency of occurrence > 28 knots7. Mean number of days with gale winds (> Be. ufort 8 at any
time during the day)8. Days with surface wind > 27 knots (4-8 obs./day)
iX SKY CONDITIONS (sky cover)
A. Mean cloudiness (percent/oktas)B. Number of days occurrence of sky cover (sunrise to sunset)
1. Clear2. Partly cloudy3. Cloudy
C. Bright Sunshine1. Mean monthly duration (hours)2. Mean percent of possible3. Maximum duration in one day (hours)4. Mean number of days with no sun
22
__________________________________

D. Percent frequency of mean cloudiness at specified hours:0306091215182124
E. Percent frequency of occurrence by groups:0 tenths
1 - 2 tenths3 tenths
4 - 5 tenths6 - 7 tenths8 - 9 tenths10 tenths
F. Mean number of days with sky cover (oktas)0 - 1/80 - 2/83 -5/86 - 8/8
G. Mean number of days with low clouds (oktas)0 - 1/80 - 2/83 - 5/86 - 8/8
H. Mean cloudiness at specified hours
1. Mean number of days with total cloud cover <2/8 at specifiedhours
23

X VISIBILITY
A. Mean number of days with fogB. Mean number of days with fog or visibility less than 7 milesC. Mean number of days with heavy fog with visibility 1/2 mile
or lessD. Mean number of days with fog with visibility < 5/8 mile
5/8 - 2 1/4 miles> 2 1/4 miles
E. Percent frequency of occurrence of fog by monthF. Percent frequency of occurrence of fog by hourly groups:
00 - 0203 - 0506 - 0809 - 1112- 1415 - 1718 - 2021 - 23
G. Percent frequency of occurrence of visibility < 6 miles atspecified hours:
H. Percent frequency of occurrence of visibility < 2 1/2 miles atspecified hours:
I. Percent frequency of occurrence by visibility groups:
0, 1/16, 1/8 mile3/16, 1/45/16, 3/8, 1/25/8, 3/4
24

1 - 2 1/42 1/23-67-9
> 10J. Mean number of days with smoke or hazeK. Percent frequency of occurrence of smoke and haze by monthL. Percent frequency of occurrence of smoke and haze by hourly
groups: 00 - 0203 - 0506 - 0809 - 1112 - 1415 - 1718 - 2021 - 23
M. Mean number of days with dust (sand)N. Percent frequency of occurrence of dust (sand) by month0. Percent frequency of occurrence of dust (sand) by hourly
groups: 00 - 0203 - 0506 - 0809 - 1112 - 1415 - 1718 - 2021 - 23
P. Frequency of observations with visibility < I mile caused by:FogSmoke/hazeBlowing snow and/or dustPrecipitationCause unknownTotal obs. 1 mile
XI FROST
A. Mean date of first frostB. Mean date of last frost
XII ICE
A. Mean date of first total ice cover on lakes and riversB. Mean date of last total ice cover on lakes and rivers (beginning
of break-up).C. Mean thickness
25
L J . .; ... ...... , .......... ,. .. -p, , m - '

XIII CEILING - CEILING AND VISIBILITY
A. Percent frequency of ceiling 1000 feet at specified hours(ceiling > 5/8 covered)
B. Percent frequency of ceiling < 3,300 feet at specified hours(ceiling > 5/8 covered)
C. Percent frequency of ceiling less than 5000 feet and/or visibilityless than 5 miles by hourly groups: 00 - 02
03 - 0506 - 0809 - 1112 - 1415 - 1718 - 2021 - 23All hours
D. Percent frequency of ceiling less than 3000 feet and/orvisibility less than 3 miles by hourly groups:
00 - 0203 - 0506 - 0809 - 1112 - 1415 - 1718 - 2021 - 23All hours
26

E. Percent frequency of ceiling less than 1500 feet and/orvisibility less than 3 miles by hourly groups:
00 - 0203 - 0506 - 0809 - 1112 - 1415 - 1718 - 2021 - 23All hours
F. Percent frequency of ceiling less than 1000 feet and/orvisibility less than 3 miles by hourly groups:
00 - 0203 - 0506 - 0809 - 1112 - 1415 - 1718 - 2021 - 23All hours
G. Percent frequency of ceiling less than 1000 feet and/orvisibility less than 2 miles by hourly groups:
00 - 0203 - 0506 - 0809 - 1112- 1415 - 1718 - 2021 - 23All hours
H. Percent frequency of ceiling less than 1000 feet and/orvisibility less than I mile by hourly groups:
00 - 0203 - 0506 - 0809 - 1112 - 1415 - 1718 - 2021 - 23All hours
27
7

1. Percent frequency of ceiling less than 200 feet and/or visibilityless than 1/2 mile by hourly groups: 00 - 02
03 - 0506 - 0809 - 1112 - 1415 - 1718 - 2021 - 23All hours
J. Percent frequency of ceiling less than 100 feet and/or visibilityless than 1/4 mile by hourly groups: 00 - 02
03 - 0506 - 0809 - 1112 - 1415 - 1718 - 2021 - 23All hours
K. Mean number of days with ceiling greater than 10,000 feet andvisibility greater than 3 miles
Hours: 06121824
L. Mean number of days with ceiling greater than 6,000 feet andvisibility greater than 3 miles
Hours: 06121824
M. Mean number of days with ceiling greater than 2,500 feet andvisibility greater than 3 miles
Hours: 06121824
N. Mean-number of days with ceiling greater than 1,000 feet andvisibility greater than 3 miles
Hours: 06121824
28

XIV DATA ELEMENT COMBINA .NS
A. Mean number of days with ceiling greater than 2,000 feet andvisibility greater than 3 miles, with surface wind less than 10 knots
Hours: 06121824
B. Mean number of days with sky cover less than 3/10 and visibilitygreater than 3 miles
Hours: 06121824
C. Mean number of days with surface wind greater than 17 knots andno precipitation
Hours: 06121824
0. Mean number of days with surface wind 4 - 10 knots, andtemperature 33 - 89'F., and no precipitation
Hours: 06121824
E. Mean number of days with low cloud amount 0 - 4/8 or ceiling1000 feet or greater, visibility 2 1/2 miles or greater, and surface windspeed 10 knots or less at specified hours
Hours:
F. Mean number of days with surface wind speed greater than 16knots, no precipitation, and snow depth less than 6.1 inches, at specifiedhours Hours:
29
* -Y-

G. Mean number of days with surface wind speed 4 - 10 knots,temperature more than 301F., but less than 90'F. and no precipitation, atspecified hours
Hours:
H. Mean number of days per month favorable for indicated militaryoperations :*
1. Flying condition A2. Incendiary bombing3. Parachute operations4. Chemical warfare5. Visual high level bombing
*Description:Flying condition A: Low cloud amount 0 - 4/8, or IF 5 - 8/8.
Height must be 984 feet or greater, and visibility 2 1/2 miles or greater
Incendiary bombin: Surface wind 17 knots or greater with noprecipitation occurring
Parachute operations: Flying condition "A" with surface windspeed 10 knots or less
Chemical warfare: Surface wind speed 4 - 10 knots, temperature33 - 890F. and no precipitation occurring
Visual high level bombing: Total sky cover 2/8 or less withvisibility 2 1/2 miles or greater
XV NARRATIVE SUMMARY
30

E. Source Materials.
In the following paragraphs, the type of information from sourcesavailable to the analyst will be described, which will provide data essentialto preparing factor overli s and data tables. Generally, the eight typesof sources are listed in order of their probable importance in contributingto the end products of this guide. That is, for most areas, the analystwill be able to locate ne-essary climatic information in the types of sourcematerials described in 2 '.hrough 5 (the 1:250,000-scale topographic map islisted first because it is essential to establishing the cartographic baseand in the distribution cf climatic stations).
1. 1:250,000-Scale Topographic Maps. The 1:250,000-scale topographicmap series wiTl be used as the cartographic base over which the climatefactor overlays will be developed. They will serve as locators for plotting
weather stations and wit, aerial photography and large-scale topographicmaps, will provide terr'a n information for judging probable climatic contrastswithin a region.
2. Clim ic Sjmmaries. Climatic summaries represent the primarysource of climat': in,ormation for the terrain analyst. They are statisticalexpressions of weather elements in terms of averages, extremes, and frequenciesof occurrence over a jiven period of time. The published records aregenerally in tabul1 form (figure 8), providing climatic data for eachmonth and/or season oF the year for specific station locations. Frequentlyincluded are brief na-rative accounts of local weather conditions that canbe expected during an average month.
Summaries v. ,y greatly in the amount of information provided, in thenumber of stations " cluded, and in the extent of geographical coverage.Some summaries cont in data for selected stations worldwide; whereas otherscontain data for c nLinents, countries, or lesser subregions. The dataelements listed in the data tables (appendix A) have been extracted, forthe most part, frr n 27 standard, readily available climatic summaries.The elements differ in the amount of information presented, length of records,units of measurerent, and the geographical regions covered. In many cases,available data can not be converted to a uniform system; therefore, in thelist of data eleiients, a rather lengthy tabulation of entries from manydifferent climatic summaries must be included. Weather stations exist forwhich the analyst will be able to find only monthly averages for temperatureand precipitation. Because climatic data consists of averages based onmany years of record, numerical values cannot be determined by on-sitecollection efforts or by map and/or aerial photo analysis alone. As aresult, interpolation techniques will have to be used to predict climat.for areas without reporting stations. Methods for accomplishing this processare presented in the discussion on Aerial Photography (III, E, 7).
31

PATUXENT RIVER NAS, MARYLAND
STA NO. 72404 (IN AREA NUMBER 161 LATITUDE 1617N LONGITUDE 0761$W ELEVATIDN(FT) 00030
POR NO.
PARAMETER DESCRIPTION JAN FED MAR APR MAY JUN JUL AUG SEP OCT NOV DEC ANN IYRS G$
ABE MAX TMP IF) 78 76 82 91 93 99 100 97 93 93 02 74 too 12 4380
MEAN MAX TMP (F) 45 47 52 64 73 61 06 04 75 Al 06 46 6s 12 4350
MEAN HIN TAP (F) 31 at 36 47 ST 60 71 To 64 $0 40 32 s0 12 4J80
ABS MIN TMP (F) 7 7 1o 20 42 48 55 30 46 32 16 t0 7 12 4380
MEAN NO DY) TMP C IA GTR 90(F) 0.0 0.0 0.0 0.1 0.2 4.7 7.0 4.9 1.1 0.2 0.0 0.0 19.) 1 4080
MEAN NO DYE TMP * OR LES 3Z(F) 1.& 14.6 9.$ 0.0 0.0 0.0 0.0 0.0 0.0 0.1 4.0 16.0 608 1E 4380MEAN NO 0Y1 TAP * OR LES O(F) 0.0 0.0 0.0 0.0 0.0 0.0 0.0 0.0 0.0 0.0 0.0 0.0 0.0 12 4380
MEAN DEW PT TNP (F1 29 30 04 A5 35 63 60 67 62 52 09 91 40 1s 10480MEAN REL HUM |PCT) 73 73 70 99 72 72 72 76 73 74 71 74 7) 12 L04801
MEAN PRESS ALT (FT) -142 -113 .70 -56 -60 -53 -77 -66 .67 -114 -137 -117 -92 0 -0
MEAN PRECIP (IN) 2.86 0.09 0.89 3.62 0.33 2.52 4.31 0.64 Z.37 2.86 0.91 3.10 41.9 10 3643
MEAN $NOW PALL (IN) 2.9 1.2 0.2 0.0 0.0 0.0 0.0 0.0 0.0 0.0 0.2 1.4 8.9 EO 3605
MEAN NO OYS PRCP * OR GTR 0.1 IN 6.4 5,7 0.1 7.9 7.2 4.8 6.9 8 5.6 3.0 3.9 6.4 76.7 10 0640
MNAN NO 001 SNPL * OR GTE 1.0 IN 0.9 0.4 0.3 0.0 0.0 0.0 0,0 0.0 0.0 0.0 0.0 0.4 2.2 10 3605
MEAN NO 0Y W/OCUR VSOY LES 1/1 AI 0, 4.1 3.3 1.8 L,4 0.6 0.4 0.6 0.0 1.8 2.9 0.7 23.0 10 481
MEAN NO 0Y TSTMS 0.2 0.4 0.9 Z. 4.0 3.4 7.9 6.4 3.1 1.0 0.6 0.2 03.7 1Z 4380
P FREQ WG PU O R GTO 17 KTS 18.1 16.9 19.1 13.) 6.1 4.1 2.0 3.0 0.3 8.3 12.1 12.1 10.1 10 105021
P P8EQ 542 SPDO OR STR 20 TS 1.2 1.0 1.4 0.0 0.1 0.1 0.1 0.0 0.3 0.4 0.9 0.9 0.6 2 100031
P PEO LEO 5000 PT 6/0 LE$ 3 SI 03. 25,6 00.3 25.4 0 a.9 02.6 15.0 24.0 3..8 00.0 269 06,4 10 103009
P FEG LFS 1500 FT A/0 LES 0 At
FOE 00-02 LST 16.0 17,4 16.2 14.1 16.7 10.4 5.7 10.2 13.0 12.5 12.9 14.9 3.4 10 13132
03-05 LST 17.5 18.1 18.6 17.3 18.4 13.) 7.9 14.0 14.6 17.5 10.4 14.0 13.6 It 13136
06-08 LOT 18.7 19,8 19.7 10.8 19.9 14.6 11.0 16.3 16.0 21.0 16.6 14.8 17.0 10 13129
09-11 LST 16. 11.6 18.3 14.0 15.1 11.4 9.0 14.6 13.7 06.0 13.4 00.3 14.9 it IS116
12-14 LOT 13.3 14.9 10.8 10.3 10.9 8.1 3.6 5.6 9.4 11.7 1112 10.1 1I.3 1 1319
I-IT LST 14.9 14.8 14.2 9,1 1,3 7.6 3.8 5.7 9.4 1o. 10.7 23.2 10.4 10 1310
18-20 LST 14.1 14.8 14.4 9.7 10.6 7.1 0)3 0.7 9.7 0.7 10.2 14.4 10.I 12 10130
21-23 LOT 15. 16.0 16.1 11.3 12.9 8.3 4.9 6.3 00.9 9.6 11.4 14.3 11.6 1 1M120
P FREQ LES 300 FT A/0 LES I M
FOPL 00-02 LST 5.5 7.6 3.3 3.2 4.7 0.9 0.1 0.4 0. 1.3 S,& 4, 31. it 10132
03-0 LST 0.9 .0 6.0 3.4 4.i 1.3 0.2 0.9 0.7 2.9 6,4 6.0 4.0 12 13106
06-08 LST 6.0 8,6 3.1 3.2 3.) 1.6 0.4 0.3 1.) 3.2 6.2 3.1 3.0 12 131Z
09-11 LET 4,3 S,4 4.0 1,2 0.6 0.0 0.2 0.1 0. 1.3 3.1 4.8 2.2 00 13126
12-14 LOT 3.9 4.2 3.1 0.6 0,4 0.1 0.2 0.3 0.0 0.8 1,1 4.3 1.6 10 131029
15-17 LOT 4.4 5.0 3.0 0.5 0,6 0.2 0.4 0.4 0.2 0.3 1.9 4.0 1-. 12 13133
18-00 LIT 3.6 4.5 4.1 0.9 0,7 0.3 0.4 0.4 0.3 0.1 2.6 4.4 2.0 12 1310
21-13 LIT 4.4 6.2 4.0 2.2 2,0 0.2 0.2 0.0 0.4 1.2 3,2 4.5 2.0 12 13121
0124
Figure 8. Climatic Summary.
32
Illl II III.. .. . . . . .... . .. .. .. . . II. .. . . 1 .. . .. . . ' g,. .. ... .. .

In conducting a search for climatic summaries, the analyst shouldattempt to locate records that may be available from local jurisdictions(state, county, provincial, etc.) and from educational institutions. Thegoal of the analyst should be to establish as dense a network of weatherstations as possible within each l:250,O00-scale map. This approach willbe the quickest way to assess climatic conditions and if successful, maysignificantly reduce the time required to complete the analysis of a region.
3. Climatic Studies and Climatic Atlases. These are consideredtogether because often there is no clear distinction between the two.Although they primarily contain maps, climatic studies are not designatedas atlases, and publications that are designated as atlases may containmuch textual information. Climatic studies often duplicate informationfound in summaries, but they are generally more comprehensive in theirinterpretation of climatic elements. Whatever the nomenclature, thesepublications should be reviewed for pertinent climatic data, which may bepresented in the form of graphs, tables, and maps. Like summaries, climaticstudies and atlases may provide coverage 'arying from relatively smallgeographic areas to worldwide coverage.
4. Geographic Studies and Atlases. Much that has been said aboutclimatic studies and climatic atlases relates to these publications. Theym,-y treat aparticular.geographic parameter or they may consider the totalgeographic complex of a region, including climate. They should not beoverlooked as important source materials. These too will vary greatly inthe extent of their aerial coverage.
5. Climatic Maps. This source consists of individual maps thatdiffer from atlas maps only in that they are available as separate items(sheets), apart from any publication. Like other referenced sources, thesemaps are varied in their areal coverage and may be obtained from many dif-ferent sources, such as libraries, government agencies, schools, etc. Suchmaps may be used for interpolating missing data in areas where no climaticstations exist.
6. Technical Literature. Although publications of this type maycontain some pertinent climatic data, most applicable material will befound in the previous sources. Technical literature in the areas of weatherand climate generally pertain to highly specialized analyses of specificmeteorological or climatic parameters beyond the concern of this guide.However, in reviewing literature sources, the analyst should attempt toidentify and retrieve technical literature that appears to describe the arealand annual distribution of those elements listed in the data tables.
7. Aerial Photography. No numerical climatic data can be extractedfrom aerial photography. However, in the absence of climatic data in aparticular area, analogies can be made by comparing the area lackingclimatic data with areas with known data and with similar terrain features(vegetation, drainage, culture, etc.).
33
I

8. Large-scale Topographic Maps. Large-scale topographic mapsmay be used, ideally in conjunction with aerial photographs, for comparingterrain features in regions lacking climatic data with terrain featuresin regions with known climatic data. As in number 7 above, this procedurewill enable the analyst to use climatic "indicators" to make an assessmentof climate.
F. Reliability and Accuracy of Source Materials.
Climatic data are averages (means) derived from meteorological obser-vations recorded over a period of time. Their reliability and accuracyare directly related to the length of record -- a period of years duringwhich meteorological phenomena have been observed and recorded. Forexample, averages derived from 20 years of observations would be consideredto be "good data," whereas, averages based on 3 years of record or lesswould be rated as only "fair."
II PROCEDURAL OUTLINE
This section provides an overview of the step-by-step proceduresrequired to perform a climatic analysis. The outline is presented in theform of a schematic flow diagram, showing what steps are required and thesequence in which they are normally performed. The diagram indicates whatis to be done. How it is to be done is explained in the Analysis ProceduresSection.
When adequate climatic information for an area is available in summaries,it will be unnecessary to proceed beyond step no. 5.
34
7,I

1. Obtain 1:250,000 scale topographicmaps of area of interest.
H. 0. PUBl. NO. 532
"--. 'WEATHER SUMMARY
, oI .... 'MEXICO
2.. FOR USE WITH NAVAL AIR PILOT
summaries coveringarea of interest.
3. Prepare factor overlays foreach 1:250,000 scale sheet.
35
lI

4. Plot location of allLOAweather stations listedin summaries onto thefactor overlays.
CLIMATE DATA TABLE NO. 2
CLIMATE DATA TABLE NO.1I
5. Prepare work copiesof Data Tables 1 and 2for each station plot-ted, including narrativediscussions.
HUTRLCElMILITARY RtESERVATION
JLOCALWFORNIA CLIMATE REPORT
1964-1970
IL d'*t.Ib.tA ..
..................
36 mosphopic
6._ _ _ _ _ _ _ _ Se e t c i a i.tu i s-cet0

7. Plot additional stationslisted in climaticstudies and atlases.
L /
CIMATE DATA TABLE NO.2
CLIMATE DATA TABLE NO. 1
8. Prepare work copiesof Data Tables 1 and 2for additional stations.
9. Compare data for__same stations listedin summ~aries, atlases,and studies. Add orrevise Data Tablesas needed.
37
:-- I .. . -- - :

10. Repeat steps 6 through 9 for geographic studiesand atlases.
11. Select climatic maps of the area of interest. Examine
maps to determine if they can be used to interpolate
data needed, but not available from other sources.
12. From climatic maps,plot selected loca-tions on the factoroverlays, and enterinterpolated climaticvalues in the appro-
JAN . .. . . . .
priate data tables. a
38
.1 .

13. Review overlays and tables. Identify overlays
with insufficient density of stations.
14. Locate "off-maD" stations that appear to have similar
features for the area that does not have a station.
"Off-map" station
Area needing
station coverage
39

15. Compare terrainfeatures on large-scale topographicmaps, and compareaerial photographsof the two areas.
16. If the areas are analogous, locate a "fictitious" stationin the area of interest, and enter climatic data in thedata tables from the actual (off-map) station records.
Actual (off-map) Station
"Fictitious" station
40
....... ..... .......

17. Recheck the factor overlays and data tables foraccuracy and adequacy of coverage. Clean upthe overlays and add necessary marginal information.
t) TP.X6 e 9. 2-
DATA1
41

III ANALYSIS
A. General. This section provides the detailed instructions forextracting the climatic data from each of the principal sources.
Because climatic analysis is dependent upon existing information --data that cannot be derived from field reconnaissance -- the analyst Rmustestablish a knowledge of the network of weather stations in the region to bestudied. Then, it will be possible to identify which 1:250,000-scalemaps contain stations and pertinent data. First, factor overlays and datatables should be prepared for those sheets, followed by analysis of mapsthat do not have weather stations. This sequence is necessary so thatclimate for areas (maps) lacking stations may be predicted by comparativeanalysis (See III, E, 7). Although the analysis methods are listed in alogical sequence, much of the work described under separate headings willbe developed concurrently.
B. Acquisition of Source Materials. In general, all materials thatprovide the analyst with information on climate of the area of interestare source materials. In addition to sources listed in the appendixes,climate information may be found by reviewing the data base file indices.
Review the materials obtained, and determine whether they are adequateto generate the climate factor overlays and the data tables. If they donot provide sufficient area coverage, initiate action to collect additionalmaterials. However, start the analysis with materials on hand.
As indicated in the previous section, climatic summaries may provideall of the information required to document the climatic regime of aparticular area. In this event, the analyst does not need to retrieveother sources of data.
C. Factor Overlay Preparation.
1. Fasten a clean, translucent sheet of Mylar or other transparentmaterial to a printed copy of the 1:250,000-scale map. If no 1:250,000-scale map is available, select a map with a scale as near to 1:250,000 aspossible. Where only very large or very small-scale maps are available,the base map may have to be photographically enlarged or reduced to thedesired scale. Place registration ticks on the overlay at each of thefour map sheet corners. Although it is not essential, it may be helpfulat later stages if the map sheet neatlines and 10,000-meter grid lines aretraced lightly in pencil.
2. Add the map sheet name and number and other marginal informationas required by appendix A.
42
4 -
45
D. Data Tables Preparation. Pre-printed reproducible data tablesare included in an envelope attached to the back cover of this publication.Additional copies may be prepared from these sheets, using the Diazoreproduction process.
E. Analysis Procedures.
1. 1:250,000-Scale Topographic Maps. The 1:250,000-scaletopographic map has been selected as the basic map product for developmentof the factor overlays for climate. The arbitrary grid that is formed bythe 1:250,000 series (1 degree of latitude by 2 degrees of longitude) hasno relationship to climatic classifications. However, as the unit of areafor this study, it is required that each 1:250,000-scale map be analyzedindividually, and its climate described. Ideally it is desirable to locateat least one weather station (data source) for each map. In reality, theanalyst will find many world regions where this will be impossible,necessitating climatic assessment based on comparisons of terrain featuresand the extrapolation o' climatic data from adjacent regions.
In general, the effort required to estimate climatic conditionswill be proportional to the number of distinct topographic featuresoccurring on a map. Figure 9 illustrates how large, relatively featurelesscontinental areas reflect little contrast in climate over wide areas; whereas,in mountainous regions, significant differences exist over relatively shortdistances. The illustration below represents nine 1:250,000-scale maps,containing three weather stations. If this were a section of a continentalarea with no significant variation in landforms, climatic data for the threestations would be similar. Assessment of climate in the shaded areas(without stations) would then be relatively simple. Conversely, if thesame coverage were in the Rocky Mountains, climatic analysis would requirefar more attention to significant changes occurring over relatively shortdistances.
43
43 , 2 J

0
MN,,
44.

The following example illustrates the possible effects of a mountainrange (X-Y) on local climate. Considering only the center map and assumingprevailing winds from the west, climate at station No. 2 would probably betypical of only the northwestern half of this sheet; whereas, station No. 3would probably be more representative of conditions in the southeast portion.
03
Below is another nine-sheet area depicting the relationship of a largewater body to regional climate. If southwest winds prevail, climate atstations I and 2 would vary considerably from the climate at stations 3and 4 because of the modifying effect of the waters of the lake. However,if the lake were to freeze and become totally ice covered, this effectwould be negated for that month or months.
45

The foregoing examples should be remembered by the analyst whenpredicting climate, particularly in regions where the distribution ofstations and station data are sparse.
2. Climatic Summaries.
Step 1: Review the climatic summaries listed in appendix C,and retrieve those relating to the area being analyzed.
Step 2: As indicated earlier in this guide, climaticsummaries differ in respect to the amount and type of data presented. Toenter as much information as possible in the data tables, the analyst shouldstudy all summaries available for a region, including those offeringmultiple coverage for individual stations. As data are extracted fromsummaries, record this information in the appropriate data tables. Also,record the geographic location of each weather station on the factor over-lay, using a black dot with the name and number of the station, forexample:
Springfield201
Step 3: Enter station area information listed under I in thedata table. Most of this information will be found in the climatic
summaies. The climatic classification will be determined by referringto appendix B. If it is uncertain from the maps in this appendix as towhich climatic type is applicable, the related text and graphs will aidthe analyst in making this decision. These are broad climatic classifications.
Because the nomenclature, units of measure, time periods,and other variables differ from summary to summary, the climatic tablesfor this guide have been designed to reflect these variations. This hasbeen done so that information can be more readily extracted and enteredin the tables under the climatic elements listed. For example, forRelative Humidity in the data tables, there are listed 12 possible recordingtimes during the day (24-hours), which covers all hourly occurrences tabu-lated in the standard summaries. However, it is unlikely that values willbe found for all of these hours for any one station.
Step 4: When a narrative account of climate is part of asummary, it shoiu-d be entered in section XV of the Data Tables. Examples
of such accounts are included in appendix D.
3. Climatic Studies and Climatic Atlases.
Step 1: These publications often contain summarized climaticdata that can be entered in the data tables. They may provide informationnot listed in standard summaries, and they may include data for stations
46

not appearing in other climatic records. Extract and enter such data inthe appropriate data tables.
Step 2: Maps may be found in which isolines are used todepict onthlydifferences in selected climatic parameters (temperature,rainfall, snow depth, degree days, etc.). Such maps, in the absence ofsummaries, can be used for estimating numerical values for a specificlocation by interpolating between isolines, as shown in this example.
1..
PRECIPITATION7 (/November
On the above map segmerA, the city of Springfield falls midway between the3- and 4-inch isohyet (lines f equal rainfall); therefore, it can be saidto have an average rainfall amount of 3.5 inches for the month of November.This value can then be entered in the precipitation column in the datatables, as indicated below.
VI PRECIPITATION JAN FEB MAR APR MAY JUN JUL AUG SEP OCT NOV DEC YR
A Mean rn-ffffl
B Me. .3.IC Mean mnimwm
D Ma.-,rrlm 24 hoUr
Step 3: Narrative descriptions of climate should be extractedfrom the source material and entered in section XV of the Data Tables.
4. Geographic Studies and Atlases. The same instructionspertaining to Cimatic Studies and Climatic Atlases apply to these sources.
5. Climatic Maps. Maps in this category may be used forderiving estimated values for certain climatic elements. (see 3, Step 2,above). Determine the numerical value from the map for the location beingassessed, and enter it in the appropriate data table.
6. Technical Literature. When the aboe five sources fail tosupply the required data, the technical literiturs may provide some input.This may be in the form of tables, graphs, and maps. Extract the data
47
*2

from the source material, and enter it in the appropriate tables.
7. Aerial Photography. When climatic data is unavailable foran area, aerial photography may be used as an aid in predicting climate.If a vegetation analysis has oeen completed for the area being analyzed,it should be used with the photography in establishing climatic analogies.
Vertical aerial photography is one of the more important sourcesfor the Terrain Analyst. Photography is readily available for many areas,and it may be the most complete source of information available whenacquired at a scale of 1:20,000 or larger. There are four types of aerialphotography that are generally available through the Department of Defense,the Department of Army, and private industry. These include: color,color infrared, black and white infrared, and panchromatic photography.
During aerial acquisition flights, these films are exposed insuch a manner that each exposure overlaps the preceeding exposure by 50to 60 percent, with adjacent flight lines overlapping by 15 to 20 percent.This method of exposure enables the analyst to have complete coverage ofan area and to view the photography under stereo conditions. Since theseason of the year, sun angle, weather conditions, and film-filter typecan affect not only the quality of the photography but also the tonal andcolor renditions of the image, the analyst should be aware of thesecharacteristics if a correct analysis is to be produced. For example, theimage tonal quality or color of soil and vegetation will vary with soilmoisture and the type of film and film-filter combination. When usingaerial photography to obtain climatic comparisions, the analyst must beaware of these film and environmental characteristics to produce anaccurate analysis.
Stereo Overlap: This use of "stereo pairs" permits viewing thephotography in such a manner that the terrain appears in three dimensions,with exaggeration of the vertical dimension. Viewing aerial photographyin stereo enables the analyst to compare not only the density of vegetationbut the relative height as well.
Step 1: Remembering the introductory information in thissection, the analyst should study the 1:250,000-scale topographic map beingevaluated and determine whether or not the mapped area is representative ofmore than one climatic regime. Generally, this can be done by identifyingdominant terrain features such as mountain barriers, sheltered valleys,or large water bodies. If the total map area is relatively homogeneous inregard to terrain features and elevations and if climatic data is availablefor at least one station on the map, there will be no need to consideraerial photography as a research tool for estimating climatic conditionsHowever, if the terrain varies greatly and climatic data are not availablefor each landform unit, the analyst must describe climatically contrastingmap segments.
48
Nor

.!
Step 2: The illustration below is an example of contrastinglandforms that could indicate significant climatic differences between avalley environment and adjacent uplands.
WATERBURY
,00
r 0
Assuming that such variations exist in this sample area, the analyst shouldlook for climatic data for a station representative of the upland portionof the map. Such a station, or stations, may be found on adjacent ornearby 1:250,000 sheets. These should be analyzed to determine whether ornot there is a similarity in terrain features. This should be done usingaerial photographs and large-scale topographic maps.
The following illustration shows the Waterbury sheet and threeadjacent 1:250,000 sheets. Assume that it has been determined that adistant climatic station, "Summit", is climatically analogous to the uplandregion on the Waterbury Map.
49

Step3: Locate a fictitious station in the upland regionof the Waterbury sheet as depicted. Identify the station, using an opencircle symbol, and label it with the name and number of the actual station.Draw an arrow in the direction of the actual station and indicate thedistance in miles over the arrow.
WATERBURY
50
. i... ...._ , ,U

Step 4: Prepare data tables for the "contrived" station,identifying it as such in Part I of the data tables. Enter all climaticdata in the same manner as for the actual station. On the factor overlay,as on the above example, it will be apparent to the user that the twoclimatic zones have been established from analysis of a valley station(Maplewood), located on the map, and a "contrived" upland station (Summit),having data applicable to its plotted position, but in reality, situated65 miles to the northeast.
8. Large-Scale Topographic Maps. When climatic data areunavailable for a particular area, large-scale topographic maps, such asaerial photography, may be used for establishing climatic analogies (seeIII, E, 7). These maps can provide terrain information that will enablethe analyst to interpolate, with considerable accuracy, the climate for1:250,000-scale factor overlays. The procedural steps for using large-scale topographic maps are the same as those for aerial photography, asdescribed in III, E, 7.
51
iwI

IV. BIBLIOGRAPHY
Blair, Thomas, Climatology, Prentice Hall, New York, 1942.
Blumenstock, David I., The Ocean of Air, Rutgers University Press, NewBrunswick, New Jersey, 1959.
Brahan, Roscoe, R., The Tunderstorm, U.S. Department of Commerce -Weather Bureau, 1947.
Budyko, M.I., Climate and Life, Academic Press, New York and London, 1974.
Conrad, V., Fundamentals of Climatology, Harvard University Press,Cambridge, MA, 1942.
Crewe, P.R., Concepts in Climatology, Longman Group Ltd, London, 1971.
Finch, Trewartha, Robinson, and Hammond, Physical Elements of Geography,McGraw Hill Book Co. Inc., New York, 1957.
Gentilli, J., A Geography of Climate, University of Western Australia, 1952.
Haurwitz and Austin, Climatology, McGraw Hill Inc., London and New York,1944.
Kendrew, W.G. ,Climatesof the Continents, Oxford University Press, 1953.
_ Climatology, Oxford University Press, 1957.
Landsberg, H.E., et al., World Survey of Climatology, 15 Volumes, ElsevierPublishing Co. Amersterdam-London-New York, 1969.
Miller, A. Austin, Climatology, E.P. Dutton & Co., New York, 1953.
Monahan, H.H., and Cionco, R.M., An Interpretative Review of ExistinqCapabilities for Measuring and Forecasting Selected Weather Variables(Emphasizing Remote Means), U.S. Army Electronics Research andDevelopment Command, Atmospheric Sciences Laboratory, White SandsMissile Range, N.M. 88002, 1978.
National Intelligence Surveys (NIS), FOUO, Section 23, Weather and Climate.
Trewartha, Glenn T., The Earth's Problem Climates, University of WisconsinPress, Madison, 1961.
52

U.S. Air Force, Technical Note 71-7, Glossary of Spanish, French, Gernan,English Selected Climatological and Meteorological Terms, USAFEnvironmental Technical Applications Center, 1971.
U.S. Army Corps of Engineers, Atlas of Depth of Snow Cover in The NorthernHemisphere, Arctic Construction and Frost Effects Laboratory, NewEngland Division, Boston, Mass., 1954.
U.S. Army Corps of Engineers, Snow Cover, Its Formation and Properties,Snow Ice and Permafrost Research Establishment, 1956.
U.S. Department of Agriculture, Climate and Man, U.S. Government PrintingOffice, Washington, D.C. 20402.
U.S. Department of Commerce, National Oceanic and Atmospheric Administration,Selective Guide to Published Climatic Data Sources, Key to MeteorologicalRecords Documentation No. 4.11, U.S. Government Printing Office,Washington, D.C. 20402.
53

V. APPENDIXES
APPENDIX A. SPECIFICATIONS FOR THE PREPARATION OF FACTOR OVERLAYS
I. Objectives and Design Elements Common to All Factor Overlays
A. Objectives. The objectives of this section are to establish theoperational concepts for the production of factor overlays and to prescribethe design and formats for those elements and components common to allfactor overlays.
B. Operational Concepts.
1. Factor overlays are intended primarily for use within themapping and intelligence community, and in addition as quick reactionterrain products for distribution to the user.
2. Factor overlays provide formatted geographic data that can bereadily retrieved and used in various combinations for terrain analysis andfor production of special terrain products.
3. Factor overlays will be prepared in the form of stable baseoverlays that will accept photographic reduction to 70 by 105 mm and retaintheir legibility when enlarged back.
4. Normally each data field will require several factor overlaysfor each area. Data elements to be portrayed on each factor overlay, thesymbology to be employed, and unique formats are specified separately foreach data field.
5. These specifications do not treat methods of collecting orreducing data. Their purpose is to specify the manner of graphicallyrecording collected and reduced data.
C. Format.
1. General format specifications are indicated in Figures A-1and A-2.
2. No single factor overlay will exceed 660 by 860 mm (26 by 34inches), including titles, legends, and other marginal data. Where use ofa base map exceeding these dimensions is desired, the base will be sub-divided and separate factor overlays prepared for each part. When an over-sized base is subdivided, each subdivision will be assigned an identificationand an index of parts prepared as per Figure A-1 and A-2.
3. Whenever possible, factor overlays will be registered to astandard scale U.S. military map. Base maps other than U.S. military mapswill be clearly identified in the upper right corner of the factor overlay.
4. Each factor overlay will be punch registered to the base map.
54
.]a1*

so +
. - .I
i~ ~ ~ ~ vok til Aa i '
V O, .3n@ J4;t-1.f
C73 zSj LAs
M 80 >
:E E ~ 84
4-3)
+
4w S%nA
-
55L

N4 j17j3wNT 8-1N .7la-z f N718-4-01:5.0 WASHINGTON N7~ !~i- j7-6 V~5OI1
USAETL. 0'CLIMATE fr 17-92NT!1871.7U8-1 I 1979 0
I lacto inapt will be dean on Stable base tehnuoeef file. basei 004 to. 007" thick,hot e-seedig b60 , 960cm 1260 34 arches,
5)2 0,1I, bMack ink will be used Al) line, nost bes... bea t t I 008l wide Ncchtactel wnil be St% bhan ilete hight
clts sI atle,," T w'd "I be allowed n dIlsig No lees lerdaebl.o t a alewel be placed in these olear 8,1.1
4 Tht -. t of Itb. tict. mar -ill he placed we Ihe oppet telef corne adtiaice.t In theclout ale. Letiess well e 4mm high0w - The dta file identification code ill be placed 2mm below lhe aeleseleets will be4-m high The data foeld subtitle if appropritet wel be Placid an paenthesis to Dthe stgit of this I D code
6 foe idth ation of thet organizatioe psepete the oaetlat will be placed 2mm belowthe dta. fib cdt
7 Title of the base map to which the factor -fel., -se 1a1te Wllb cenlsed at thetop of the hleet Lsettets will be bme.io high with the top of the lettetiat least 16-mmshtole the ecalt-
9 AieSidetI tadiloing, Shie- will be pLati'l" tie uippet right cornet Letters mll bet3-m high iepaied tht a 3.m wetfI dste
Ill A I-e we tO attow 16mm long wsill be placd jwst to the rtegh of the adle, to adjoining
I Ie hee eumbe r o f the bSer mar will be placd us the uppt righ cnte t1 toe ihtothe north a no aid to , lice with Lt ..ale -Lire wl be 4m= high" Tho' wols oe.nu ltwlbeolited If the bate map rtwed aed ha', been subdliiddthe 0d-ilict1ot of the pail wi be placd so Paretesi s to the tight Of the theet
12 The setie nu.bet of the hate map wil be plaed 2m. beeeth the Sheet mbetleftet'1itn high The wod, --eelemeCwl be owettied
If the motied "n. of th ptptm i -or tawor of ' t -e fort. wa til ..o p 6c 1.-beneath the sesos .umbet in letters 4mmns high
14 The tiip realline of the meap wIl be positioned aipprotlatl, 20mrm beneath he top cleatat- Sheet, withbe Ionieti dime... eotts-h will be ceetetd Sheet, wih Iholongti dimeeson est-west will be powitoed so the lef weathe fallIt hnie hclat area
Ill Tck matkt wil be Plced on tbe fomit owuternost pad llttersectiorr or al to formtsctangl Lach log of toe Ink matk well be 6mm long
lb A mettc hat Scale wil be centered beneath tbse botfom wettnei Nwmbett weill be 2mmhigh
-t~1 An A iee of the ttattt of the uabdosided sltee m01 be placed in the Ilght fi onet of0~pt Toasod enwecinors e~ie o ed and otbeetsafl-
miifildtwll be kept _nosmall rqie o lgnadI
IS A iestg ortlialiti diagram swill be Placed to tbse left Of the ords wsheneoioeio r ue- are used a tbe quliti of the dat sti
19 Altelac wel b 1e porch teptoeted to tbse ha. map and to each ithet llhor iththe long at- northouith well be tegttfeted to left clea se llheett wirth the longain -s w.s. wil be ,eg.tetd in the tOp clat oea
20 itrat mth a peieti dimension lest than 2mm tthe Scale of the map Will not bedelineat Areat witha.geatest dmsonless li tar 8mmn will be ideeftfnd hi lead
meto eurigleed
21 dat . mal .,easae identifirethr..Cw I hepepe glgdttail tmptltu d eta t'eode Ata . seed 11 before C fend sesa C listf meD
COVERAGE (0-7 INOEK
DIAGRAM OF PRTS
Figure A-2 Format for Factor Overlays with Long Axis N-Sa
56

5. A neat line 0.5 mm wide will be placed on each factor overlay.This neat line will normally coincide with the neat line of the base map.
6. Legend information will be placed on the areas identified asA, B, C, and D on Figures A-1 and A-2 in that sequence. Area A will be usedfirst, B second, etc. Where the. legend is too large to be accommodated inthe areas provided, it will be placed on a second piece of overlay material.This legend overlay will be prepared in the same format as the factor over-lay and will bear the same identification data.
D. Symbolization. Symbols are specified separately for each datafield. However, the following general guidelines will be followed:
1. All lines will be at least 0.09 mm (0.004") wide with aminimum spacing of 0.18 mm (0.008") between lines. When adjacent linearfeatures would overlap if symbolized in their true position, the leastsignificant feature will be displaced to provide the 0.18 mm clearance.
2. All letters will be at least 3.2 ran (0.125") high (Elitetypewriter type).
3. All letters, numbers, and symbols will be positioned so as tobe readable from the bottom or right side of the sheet.
4. All symbols, letters, and numbers will be drawn in black(plastic for Mylar sheets) ink or black "Prisma" pencil.
5. Areas with a greatest dimension less than 2 mm will not bedelineated. Areas with a greatest dimension less than 8 mm (.32") will beidentified by lead lines.
6. Tick marks will be placed on the four outermost grid inter-sections so as to form a rectangle. Each leg of the tick marks will extend3 mm from the intersection. These ticks are required to permit addition ofthe grid during the reproduction process.
II. Specifications for the Preparation of Factor Overlays for Climate
A. Introduction.
1. This section prescribes the format and symbols to be used toprepare factor overlays for the data firld Climate.
2. It is not anticipated that all data required by these specif-ications will be available during the initial preparation of a factor map.Lack of complete data, however, should not preclude preparation of thefactor overlay. The factor overlay concept envisions the systematicrecording of data as it is acquired, periodic revision of the overlays,and the accumulation of data over a period of time.
57

B. General Description. The climate factor overlays will consist oftwo parts as follows:
1. An overlay registered to a 1:250,000 scale map with climaticstations located and identified by name and number.
2. Accompanying data tables in which climatic conditions atdesignated locales will be documented by numerical values (generallymonthly averages), and by narrative descriptions.
C. Data Elements. Data elements are listed in I-D, and in the data
tables, Figures A-4 and A-5.
D. Format.
1. Factor Overlay (Figure A-l): The general format for the factoroverlay will be as prescribed in Section I of this appendix.
2. Data Tables (Figure A-4 and A-5):
a. The general format for the data tables will be as prescribedin Section I of this Appendix.
b. Figures A-4 and A-5 are reduced copies of Climatic DataTables I and 2. Full size tables are located in an envelope inside theback cover of this guide.
E. Symbolization.
1. Factor Overlay (Figure A-l)
a. Station actually located on the map.
e Fort Belvoir T5 mm.
b. Station located off-map.4 mm.I high
Arrow and circle
20 mm. long Warsaw line width: .4 mm.
2. Data Tables 5 MM.
a. Data Table No. 1. Section I (See following illustration)
requires entry of station location information. Explanation of items A - Gin this section follows:
58

A. Name/number: extract from source material.
B. Climatic Classification: determine from Appendix B.
C. Location: Actual - a site appearing on the map being analyzed.Contrived - (fictitious) a site which has a climate analogous to an "actual"location off the map.
1. Latitude Extracted from the source2. Longitude information, or determined3. UTM coordinates from the base map.
D. Years of record: Period station has been operating. Whenindividual climatic elements have periods of record differing from that ofthe station, enter this information in the appropriate column to the rightof the element category.
E. Elevation: Usually included in the source information. Itmay be determined from the base map contour plate.
F. Control: Information from source material.
G. Data source(s): Originating agency or publication. When astation is represented by multiple sources, enter each source here andidentify each one numerically: 1, 2, 3, etc. Enter identifying numbers tothe right of the data tables, opposite the appropriate data element(s).
I REPORTING STATION/AREA
A N.., .. I -
B Chmnathc Clav$1tIcatIof
C Location ACt-I of Cont-d
2 LOfltivde
3 UTM Co dt-tns
D Years 0, record
E Elevation
F Contrto
1 C Iutr2 Stalty Province
3 Type StationAutomnated
S At. oorcelb Observer
c Status lpetmaneft, seasonal orlht I
II TEMPERATURE JAN FEB MAR AP OCT NOV DEC YR
A Mean daily tinimumn
C Me4tMe. daily nt,n.Mo.t-
59
_1l

/-7=
k
Sections II through IX: These sections provide space for entering monthlyand/or annual numerical values for designated climatic elements.
b. Data Table No. 2. Section X through XIV: These sectionsprovide space for entering monthly and/or annual numerical values fordesignated climatic elements. Section XV (illustrated below): Space isprovided for entering narrative climatic descriptions.
3 .. .. ... ... I 1 I 1 I I ,.. ,... I IIII IIIIIII
33 09- p,,p,atl, . ccfrn
. . W.. 1................ .. . .
2 2 ,. JAN FEB MAR APR MAY JUN JUL AUG SEP OCT NOV DEC YR
XV NARRATIVE SUMMARY
60
p A. --

CL ATt' J 'WASHINGTONv 1, 4
CLIMATE wsf~oUSAETL CLIMATE JUNE 19'9
* Vl t.s.
" "--,, AR
0 A-
Figure A-3 Format for Climate Factor Overlay.
61
1Wi~i

-7F -T
I til II II H
I- I I
4t
a4-
I ft
II ITT It
-T.
4 lt
62

-1 L
i, ~~'I 1
L4
........ .....
' " I, 11 I
ii ; i I i I
. ... ...
.'. .. . . ....
.'.:. ~ ~ ~ ~ ~ ~ ~ ~ ~ .. ... ;.... :. •, .: ;:•:: : , . ... . .. .. .. . •. .. r
633
itr ........ . rr-+ - -
. . . *{+ .. .++ . ++ ++ t' -+ + . + + ++ + 0++. . .
I ... . .+ . .. ................... ...: .. .....
> 1 1 2 2 . L . .. ............... .......-.. .....
...: :::; :. 7 : : ::U2 ...... '4 +t
~ i:;
i!!" :: i" !'63
- -

APPENDIX B. CLIMATIC TYPES AND THEIR DISTRIBUj-iON
DRY JEZI STEPPE
CLMTS DSR
HUMI M5O E J ME I E R N A
HUMI MIfiri__ _30
CLMAESIMA COOLPESUMMER
TRPL I= RAI TUNRSCLIMATES SAVCENCA
M0 30-0
THERMESTER HEMISPHEREPICA
CLIMA E S AR64
WES CO_--22

30 o 30
70 90
o 30 30 o 3o 4 9
ROICAL RAIN FOREST HUMID CONTINENTAL
CLIMATES SAVANNA HUMID MICRO - (A S
THERMAL = __HUMID CONTINENTALDRY_1 STEPPE CLIMATES 1 (COOL SUMMER)
CLIMATES DESERT SUBARCTIC
HUMID MESO- [ MEDITERRANEAN POLAR fr TUNDRATHERMAL HUMID SUBTROPICAL CLIMATES ICE CAPCLIMATE S MARINE HIGHLAND
WEST COASTF% 30-10
EASTERN HEMISPHERE
65

A. TROPICAL RAINY CLIMATES
1. Rain Forest Climate. The tropical rain forest climate occurs ina belt generally extending from 50 to 80 on either side of the Equator.
In some regions, such as the AmazonTropical Rain Forest Basin and the Congo Basin, the air is
IN Singapore F always hot and damp, there are fre-30------------------ - ay0dmp
2----- 90 quent torrential rains of short26 90 duration, and the winds are feeble or26- . - -- - -. absent for long periods of time. This24 70 climatic type is also found on wind-22 0------ ward coasts, where, between latitudes20 - - of 50 and 250, easterly trade winds18 -- - 40 blow almost constantly over hills or
1 0 mountains. The cooling of these windsas they rise over the barriers produces
14 - - - - - 20 an extremely heavy rainfall. This12 1o occurs, for example, in portions of10 -- - -Hawaii, the Philippines, the eastern
8 -o coasts of Central America, Brazil,Madagascar (Malagasy), and most of the-20, islands in the southern Pacific Ocean.
In this type of climate, the rays of2 4o the sun are nearly vertical most of the
-50 time, so that days and nights areJ F M A M t J A S N practically equal in length through-
out the year. Night temperatures usually are a few degrees lower thandaytime temperatures. There are no clearly marked seasons. Relativehumidity is high at all times, and cloudy weather may prevail at times.There are heavy rains on at least 4 or 5 days each week during the rainiestmonths, with the greatest amounts during the periods when the sun is mostdirectly overhead. The rains are torrential, often accompanied by thunderand lightning. Ordinarily the rain begins in the afternoon, when the heatedair is rising most rapidly, and ends before nightfall, although occasionallya light rain will continue into the night.
2. Savanna Climate. The tropical savanna climate occurs generallyin the regions from 51 to i5o on either side of the Equator, between thedry climates and the tropical rain forest regions. Instead of the denseforest typical of the tropical rain forest climate, the savanna regionshave more open forests and large areas covered with tall grasses. Savannaregions have high temperatures, with annual ranges (difference betweenmean temperature of the warmest and coldest months of the year) varyingbetween 50 and 150F. The total amount of rainfall is less than that ofthe tropical rain forest climate. There are distinct wet and dry seasons,and usuallythe rainy season begins and ends with squally and violentthunderstorms. During the rainy season, periods of intensely hot sunshine
66
.

Tropical Savanna also alternate with brief, violentIN Champoton,_Mexico deluges of rain. The amount of rain-30 - - -_ Campoton, Mi fall varies considerably, so that28 90 there are years of drought and years
2 - - of flood. In the dry season the24 8- _ weather resembles that of desert24 - 70 regions, with very little rainfall.22 Trees lose their leaves, many small20 5 streams are dry, and the soil becomes
8- - - - hard and cracked. Visibility is16 - - - 30 greatly reduced by dust and the smoke14 -20 from grass fires.
12 -- -- ---- 10
10 _ _ __ 0
6 20
4 30
2 40
0L i 50J F M A M J J A SON D
3. Monsoon Climates. Monsoonal condition. are particulary welldeveloped in Asia, and to a lesser extent in Australia, where intense
Tropical Monsoon summer heating and winter cooling ofCochin, India F1 the continental land masses cause an
3 l -oc inflow of moisture bearing air from28-- 90 over adjacent seas during the summer
80- months, and an outflow of dry con-tinental air during the winter period.This distinct and predictable contrast
60 in wind patterns accounts for marked
50 seasonal differences in temperature,40 and extreme differences in rainfall.30 Some of the world's highest annual
rainfall totals have been recorded inthese regions, in spite of wintermonths with desert-like precipitation
0 regimes.10
20
30
40
I' ~l0
A -1' _A 0 _N
B. DRY CLIMATES. A dry climate is one in which the potential evaporationfrom the soil and vegetation exceeds the precipitation. There are twosubtypes within this category; the semiarid or steppe, and the arid or
67

desert. In general, the steppe is a transitional region surrounding thedesert and separating it from the humid regions. Although the boundarybetween the two subtypes is not rigidly defined, it is generally recognizedas one-half the mean annual precipitation which forms the dividing linebetween steppe and humid climates. That is, if a mean annual precipitationamount of 20 inches represents the separation between the dry and humidclimates in a region, then 10 inches would be considered as the boundarybetween steppe and desert. Dry climates are characterized by extremeseasonal temperatures, with large annual ranges. Daily ranges also arehigh. Humidity is relatively low, averaging from 12 to 30 percent aroundthe middle of the day. Skies are usually clear and cloudless, causingrapid and intense heating of the barren surfaces. Nighttime cooling isequally rapid, contributing to great contrasts in both air and groundsurface temperatures. Windy conditions are characteristic of regions withdry climates, and because of sparse vegetation, there is little to impedethe flow of surface winds.
1. Low-latitude Steppes. These are semiarid, having a short periodof rain-bearing winds and storms each year. Precipitation, however, ismeager and erratic. Steppe regions on the poleward sides of deserts havealmost all their annual rainfall in the cool season. Those adjoiningsavannas on the equatorward sides of deserts generally have a brief periodof relatively heavy 'rains during the time when the sun is highest.
2. Low-latitude Desert. These occur in the vicinity of 200 to 250north or south, with the averagepositions of their extreme margins at
Low-latitude Desert approximately 150 and 300. TheIN Aswan. Egypt F° Sahara and Australian Deserts are30 - - 10
C typical examples of this type of
28-- .. 90 climate. In these desert regions,26- -- 80,- -o rainfall is not only small in amount,24 -- 70 but erratic and uncertain. However,
22- -.a - infrequent heavy showers may turn drystreambeds into raging torrents. Often
1 there is no rainfall for several18 -40 years, and the skies are almost always
16 30 clear and cloudless.14 - 20
12-- 10
10 ~ ~ -- - 0
8 . . .10
6 . . . . . 204 . . .. .. 30
2 - 40
0 -- 50,I F M A M J J A S 0 N D
68

3. Middle-latitude Steppes. These climatic regimes occur principallyin the interior of the North American
Mid-latitude Steppe and Asiatic land masses. MountainIN Laramee. Wyoming F ranges effectively block the influx of30-7 10 maritime air, contributing to the
90 aridity of both middle-latitude steppe8o and desert regions. Although having
4 -. ...... 70 greater precipitation than desert areas,--- ,middle-latitude steppes experience years
50 with marked departures from normal
40- amounts. In North America rapid changes6-- 30 in temperatures are characteristic of
1 .8 steppe lands, and mean winter temper-4 * 20 atures often vary greatly from year to
11 . .. o year.10 -0
8 __10
8- 20
41 30
04
M A rl A - 1
4. Middle-latitude Desert. This climate is characterized by lowertemperatures and precipitation than low-latitude desert climates. Theyoccur in the basinlike, low-altitude areas, surrounded by high-land rims,that exist in some continental interiors. The Great Basin of the U.S. andthe Turkestan Basin of Asia have this type of climate. Summer temperaturesare high. Middle-latitude steppes occupy intermediate locations betweendeserts and humid climates. They have small amounts of rainfall, which areusually unpredictable in amount or time of occurrence.
C. HUMID MESOTHERMAL CLIMATES. These climates are characterized bymoderate temperatures that occur in a seasonal rhythm. They are divided intothree general categories - Mediterranean climate, humid subtropical climateand marine west coast climate.
1. Mediterranean Climate. This climate has hot, dry summers andmild winters, during which most of the annual precipitation occurs. Annualrainfall usually ranges from 38 to 64 centimeters (15 to 25 inches). Inthe winter months, the average temperature is usually between 400 and 500F.;in the summer, it ranges generally from 700 to 800F. This type of climateoccurs in five regions - the borderlands of the Mediterranean Sea, centraland coastal Southern California, central Chile, the southern tip of SouthAfrica, and parts of southern Australia. Coastal areas often have a modi-fied type of Mediterranean climate, with cool summers accentuated in some
69

R
i
Mediterranean areas by the cool ocean currents off-IN Athens, Greece F shore. There is apt to be a cool30 o - 0 daily breeze along the seacoast and
28- 90 for a short distance inland. Relative2 -- o -80 humidity is high. Fogs are frequent,
4 7 but usually are dissipated by the heat2 2 - - 70 of the sun in the early morning hours.22 -60 Winters are mild and frost infrequent,
20 - -- - 50 and the annual change in temperature18 40 at some locations is uncommonly small.
16 -30 Summer days in Mediterranean climates14- 20 are warm to hot, with bright sunshine,
low relative humidity, and nearly1- -10 cloudless skies. Daily weather becomes
1I0 - - , , , ,- 0 erratic and unpredictable in autumn.8 0-- i The winds are less regular and there6 20 is occasional rain. Temperatures4 --- 30 remain relatively high. Winters are2 -- -40 mild and warm, with occasional frosts
0 M5 and relatively abundant rainfall.J F M A M J J A S O N D0
2. Humid Subtropical Climate. This climate occurs in regions locatedon the eastern sides of continents, generally from about 250 poleward (north
or south) to 350 or 400. This typeHumid Subtropical of climate is found, for example, in
I3N TokyoJapan F- the American Gulf States. Temperatures
28 90 are similar to those of the Mediter-ranean climate, with less contrast
26 -- - - 80 - between regions on the coast and those24- 70 located inland. Rainfall ranges from
22 60 75 to 165 centimeters (30 to 65 inches)20- - 50 a year at most locations. In the18- 40_- 4o summerhumidity is high, temperatures
average from about 75 to 800F. in the16 _30 hottest month, and there are frequent14 ' 20 thundershowers. Nights are hot and12 10 sultry. There is no drought season,o 0 but normally there is less rain in8 -10 winter than in summer. Severe tropical6 -20 cyclones occur most frequently in the4 30 late summer and early fall. Winters
are relatively mild in this typeclimate. Temperatures in the cool
S0 -50 months usually average between 450 toJ F M A M J J A S 0 N 0 550 F. with the midday temperature
around 550 to 600F. and the night temperature from 350 to 450 F. The hiqhhumidity, however, makes the nights chilly and uncomfortable. Snow may
70
• . -- _..

fall occasionally, but it does not remain for more than 2 or 3 days. Day-time temperatures may be raised above 600 or 700F. by the arrival of atropical air mass, then be reduced by a subsequent polar wind as much as300 F. in 24 hours, resulting in a severe freeze.
3. Marine West Coast Climate. This climate occurs on the western orwindward sides of continents, poleward from about 400 latitude, and results
from onshore westerly winds that blowMarine West Coast over the land from adjoining oceans.
N Dublin. Ireland P It borders the Mediterranean type on30 - 10 its equatorward margins, extends into28 90 the higher middle latitudes and ends26-- 80 at the subarctic or tundra climate.
Where mountains are closely parallel
to the west coast, as in Scandinavia,this type of climate is confined to a
2C- - so relatively narrow region on seaward18_1-1-140 side of the highlands. In parts of6 -30 western Europe, where there are4 - ------- 2 extensive lowland, the effects of the
ocean conditions have an influence on1- 10 the climate for many miles inland.
oo 0 Summers are cool with occasional hot8 - - - 10 days but no severe or prolonged heat6- 20 waves. Rainfall is fairly abundant.4 - - - - - - - - 3C Winters are mild particularly in2 -40 western Europe, where a great mass of
o*'50 warm water known as the North AtlanticJ F M A M J J A S 0 N D Drift lies offshore. Cloudy skies and
a humid atmosphere are prevalent.There are frequent severe frosts. The midday temperatures of most winterdays are relatively high. During unusually cold periods, temperaturesmay remain below freezing for several days. The winter season is markedby severe storms, fogs, and mist. Where the western coasts are bordered.by mountain ranges, as in Norway and Chile, precipitation may reach a totalof 250 to 380 centimeters (100 to 150 inches) a year. In areas consistingpredominantly of lowland, rainfall usually averages from 50 to 90 centi-meters (20 to 35 inches) a year and may fall steadily for several days ata time. In mountainous regions, such as the Cascade Range or the Scand-inavian Highlands, snowfall is very heavy. The marine west coast climateis cloudy and has mist or fog for at least 40 days a year at many locations.
D. HUMID MICROTHERMAL CLIMATES. The humid microthermal climate occursin the Northern Hemisphere northward from the subtropical climatic regionsand in leeward interior locations. Latitudinal spread is from about 40uNto 600N. It has colder winters than the mesothermal type, with largerannual changes of temperature, longer frost seasons and snow cover thatlasts for considerable periods. Humid continental and subarctic are theprincipal types of microthermal climate.
71

1. Humid Continental Climates. These climates border the marinewest coast climatic regions. Where there are mountain barriers, as in NorthArnerica, the change between the two types of climate is abrupt, but it isvery gradual where there are no barriers, as in the lowlands of westernEurope. Seasonal differences are extreme, with very cold winters and warmto hot summers. Along the seaboard, the summer heat isoppressiveand sultrybecause of the higher humidity, and the winter cold is more raw andpenetrating than in the drier interior regions. Along the interior margins,humid continental climates border upon the dry climates and have subhumidcharacteristics. The prairies of North America and interior Eurasia areexamples of such climatic regions. In these areas, the maximum rainfallusually occurs in late spring and early summer, rather than at the time ofgreatest heat. In winter, regions with a humid continental type of climatenormally have a permanent snow cover that lasts a few weeks to severalmonths. Summer rains usually occur in sharp showers accompanied by thunderand lightning. Winter in the prairie regions is characterized by frequentchanges in weather conditions, with occasional blizzards, known as burans.
Humid Continental - Warm Summer Humid Continental - Cool Summer
IN Peoria. ill. F IN, Montreal. Canada F30 - 100 3 C----------------00
28 -90- 28 -- 90
26 8026- 80
2=- 70 24 70
2 CIO6 22 "- 60
20-.---~50 20--- -- 50
18 -40 8 40
IF 30 1O--------- 30
14 20 14 2012 - 10 12 10 Il
10 0 10--- 0
8 10 8 - - - - 1
6 20 62
-1 ~ - - - j j30, 4 -30240 2 -40
0),0 0 -50'N , M I I . J F M A M J J A S 0 N D
A blizzard is marked by violent gales, drifting snow, and extreme cold.Although there may be no precipitation falling, the air is filled to aheight of several hundred feet by swirling masses of dry, finely pulverizedsnow. Afternoon thunderstorms frequently occur during summer in prairieregions. Regions on the southern margin of microthermal climates have long,hot and humid summers lasting from 150 to 200 days between the periods offrost. Winters are cold, with frequent intervals of mild, rainy weather.Winter is the dominant season on the poleward side of regions with thistype of climate. Surmmers are relatively short, usually comprising aperiod of about 5 months. Temperature chnges of as much as 400F. in 24hours are common in spring and autumn.
72

2. Subarctic Climate. This climate occurs in latitudes of 500 to 600in the Nor~thern Hemisph-ere. The Eurasian region extends from Finland and
Sweden to the Pacific coast ofSubarctic - Siberia, and in North America, the
IN moose Factory, Can. F Subarctic stretches from Alaska to30 10C Labrador and Newfoundland. Long,
28---- 90 extremely cold winters and very brief26---- -- 80 summers characterize this type of
24 -- - - -70 climate. Winter quickly follows22- - -- 60 summer, with only a short period of20 50 autumn intervening. A large part18 - - - -- 40 of these regions are frozen to a
1630 considerable depth, with only a few16 - - -- - - -feet of the upper part thawing out
14 - - - 20 in the summer. There is little pre-12 - - 0-- i cipitation in subarctic regions.10- -- 0 No more than 40 centimeters (15
8 10 inches) annually. Precipitation68 20 exceeds 50 centimeters (20 inches)
430 chiefly along the oceanic margins of2 40 -- Eurasia and North America.
1i F M A MiJ J A S O N D0
E. POLAR CLIMATES. The poleward limit of forest growth usually is consid-ered the dividing line between polar climates and those of intermediatelatitudes coinciding with a line (isotherm) connecting points having atemperature of 500F. for the warmest month. A mean annual temperature of320F. or below is also a distinguishing feature of polar climates. In theSouthern Hemisphere, the only large land area with a Polar climate is theAntarctic continent. In the Northern Hemisphere, this climatic regionincludes the Arctic Sea, the borderlands of Eurasia and North America, withthe island groups that are north of these continents, and ice-coveredGreenland. The Arctic is almost a landlocked sea and the Antarctic is aseagirt land with important climatic differences between them. The climatehas fewer wide variations in the Antarctic because it is a single land masssurrounded by oceans with a uniform temperature. Polar climates have thelowest mean annual and summer temperatures, and although summer days haveup to 24 hours of sunshine, the rays are too oblique to raise the tempera-ture significantly. Much of the energy from the sun is reflected by snowand ice, and is consumed in melting the snow cover and evaporating thewater. As a result neither the land surface or the air adjacent to itbecomes warm. Precipitation averages less than 25 centimeters (10 inches)a year over large parts of the Polar land areas. Because of the lowevaporation and small amount of melting, permanent ice fields severalthousand feet thick have accumulated on Greenland and the Antarctic conti-nent. Polar climates usually are divided into two types -Tundra and Icecap.
-I 73

1. Tundra. When one or more months in the warm season have an averagetemperature above 320F. , but below 50 0F. , the ground is free from snow fora short period, and low sparse vegetation is possible, the climate isdesignated tundra. It is less rigorous than that of the icecap regions.The warmest month isotherms of 50o on the equatorward side and 320F. on thepoleward side are considered to be the boundaries. Over land areas, tundraclimate is confined largely to the Northern Hemisphere. Ocean prevails inthose Antarctic areas where the tundra climate normally would be found.Summers warm enough to develop a tundra climate occur only in the mostnortherly fringes of the Antarctic and on certain small islands of theregion. The most extensive tundra areas are on the Arctic Sea margins ofEurasia and North America. Long, cold winters and brief, cool summers
Tundra characterize the tundra climate. Av-IN Barrow. Alaska Fo erage temperatures usually are above3- 0C freezing for 2 to 4 months of the year,28 90 and killing frosts may occur at any
80 time. Fog is prevalent along the coast,70 frequently lasting for days at a time.
22 60 Snow cover disappears for 1 or 2 months2260 during the summer season, and the lakes2o 50 usually are free from ice. Drainage
8- 40 is poor because of the permafrost,1 - - - 30 resulting in many bogs and swamps.14 - - 20 Summer temperatures do not differ
0 greatly in the various tundra regions.12- 10 There is, however, a considerable10 / variation in winter temperatures.8 - - - . ... -10 Average temperatures in the Arctic6 - - - -- - 20 coastal areas of Siberia average about4 -3- -350 to -400F. in January and February,2 -40 with even lower temperatures inland.
S , , I - 50 Along the Arctic borders of NorthJ F M A M J J A S 0 N D America, the temperature for compar-
able periods is higher, and wintersare less severe. Annual precipitation normally does not exceed 25 to 30centimeters (10 to 12 inches) in the tundra region, although larger amountsare received in parts of eastern Canada, particularly in Labrador. Usuallythe most precipitation occurs in summer and autumn, the warmest seasons.Most of it is in the form of rain, with occasional snow. The winter snowis dry and powdery, forming a compact cover. Often it is accompanied bystrong blizzard winds which pile up the snow on the lee sides of hills andin depressions, sweeping exposed surfaces bare. There is no vegetation tobreak the force of the wind and to hold the snow cover.
2. Icecap. Icecap climates are those where the average temperatureof all months is below 320 F., vegetation will not grow, and a permanentsnow-and-ice cover prevails. This climate characterizes the permanentcontinental ice sheets of Greenland and Antarctica and the ocean in thevicinity of the North Pole. The average winter-month temperatures rangefrom -350 to -450 F. Storms or violent winds do not occur as frequently inthe inner portions of the icecaps as in other climatic regions, but insome marginal areas there are extreme gales caused by the precipitousdescent of cold air from the continental ice plateau.
74
.. . . .t

APPENDIX C. CLIMATIC SUIMMARIES
TITLE
1 LOCAL CLIMATOLOGICAL DATA (Monthly Summary)
2 LOCAL CLIMATOLOGICAL DATA (Monthly Supplement)
3 LOCAL CLIMATOLOGICAL DATA (Annual Summary with ComparativeData)
4 CLIMATOLOGICAL DATA (Monthly)
5 CLIMATOLOGICAL DATA (Annual Summary)
6 CLIMATOLOGICAL SUMMARIES (Substations)
7 CLIMATOLOGICAL DATA (National Summary, monthly)
8 CLIMATOLOGICAL DATA (National Summary, annual)
9 MONTHLY CLIMATIC DATA FOR THE WORLD
10 CLIMATIC SUMMARY OF THE UNITED STATES (Supplement for195 1-1960)
11 CLIATES OF THE STATES
12 CLIMATIC SUMMARY OF THE UNITED STATES (Supplement for193 1-1952)
L13 DAILY NORMALS OF TEMPERATURE AND HEATING DEGREE DAYS
14 STORM DATA
15 HOURLY PRECIPITATION DATA (Monthly)
16 HOURLY PRECIPITATION DATA (Annual Summary)
17 SUMMARY OF HOURLY OBSERVATIONS-PRECIPITATION
18 MAXIMUM STATION PRECIPITATION for 1, 2, 3, 6, 12, and24 Hours
19 MONTHLY NORMALS OF TEMPERATURE AND HEATING DEGREE DAYS
75

20 MONTHLY AVERAGES FOR STATE CLIMATIC DIVISIONS (1931-1960)
21 CLIMATIC SUMMARY OF THE UNITED STATES (pre-1931)
22 UNIFORM SUMMARY OF SURFACE OBSERVATIONS (Parts A - E)
23 SPECIAL SUMMARIES
24 WORLD-WIDE AIRFIELD SUMMARIES
25 WORLD WEATHER RECORDS
26 TABLES OF TEMPERATURE, RELATIVE HUMIDITY ANDPRECIPITATION
27 WORLD SURVEY OF CLIMATOLOGY
76
. . . .. .. . .

NUMBER: 1
TITLE: LOCAL CLIMATOLOGICAL DATA (MONTHLY SUMMARY)
PUBLICATION INFORMATION: Monthly, by station
GEOGRAPHIC COVERAGE: UNITED STATES (50 states), Puerto Rico, andPacific Islands
REPORTING STATIONS: 290 (approximate total)
TYPES OF DATA:
A. Daily values and averages, and monthly values and averages for:temperature (average, max., min., departure from normal), heating/coolingdegree days, dew point, precipitation (amounts - liquid equivalent), snow/ice amounts and amount on ground, wind (resultant dir./speed, average speed,fastest mile (speed/dir.), sunshine, sky cover, pressure, weather types,ceiling, visibility.
B. Three-hour observations for each day of the month and monthly summationof all three hourly observations.
C. Hourly precipitation data for month, on a daily basis for each hourof the day.
77
A

NUMBER: 2
TITLE: LOCAL CLIMATOLOGICAL DATA (SUPPLEMENT)
PUBLICATION INFORMATION: NO LONGER PUBLISHED- Discontinued with 12/64 issue.
GEOGRAPHIC COVERAGE: UNITED STATES (50 states), Puerto Rico, and PacificIslands.
REPORTING STATIONS: 290 (approximate total)
TYPES OF DATA.
A. Hourly observations for each day of the month. Data includes: skycover, ceiling, visibility, current weather, pressure, dry bulb, wet bulb,R.H., dew point, wind (speed & direction); daily averages for theseobservations and averages by hours also included.
B. Six (6) additional matrices are included:
1. Temperature and wind speed and R.H. occurrences (hourly obs.).2. Wind direction and speed occurrences (hourly obs.).3. Hourly and daily occurrences of precipitation amounts (frequency
of occurrence for each hour of the day).4. Ceiling-visibility occurrences (hourly obs.).5. Occurrences of weather by hour of the day.6. Occurrences of weather by wind direction.
78
Ai
Lz:

NUMBER: 3
TITLE: LOCAL CLIMATOLOGICAL DATA (Annual Summary with Comparative Cata)
PUBLICATION INFORMATION: Annual, by station
GEOGRAPHIC COVERAGE: Same as NUMBER 1
REPORTING STATIONS: Same as NUMBER I
TYPES OF DATA:
A. A narrative climatological summary which presents information on thestation's location, topography, general climatic situation, and some of themore notable weather extremes.
B. Meteorological Data for the year on a monthly basis, as well as corres-ponding Normals, Means, and Extremes for comparative purposes.
C. Average temperature, precipitation, snowfall, and heating/cooling degreedays are presented on a monthly basis (with annual totals) for variousnumbers of years for up to periods of about 50 years depending on theoriginal length of the station record.
79

NUMBER: 4
TITLE: CLIMATOLOGICAL DATA
PUBLICATION INFORMATION: Monthly, by state
GEOGRAPHIC COVERAGE: Same as NUMBER 1
REPORTING STATIONS: All precipitation and temperature gathering stationsin the state (Ist and 2d order, substations, andcooperative stations)
TYPES OF DATA:
A. Statewide temperature and precipitation extremes for the month.
B. Supplemental wind, R.H., precipitation, sunshine, and sky cover datafor all first-order reporting stations within the state for the month.
C. For all stations within the state: monthly summarized temperature andprecipitation data; on a daily basis - precipitation and max/min tempera-tures and monthly summaries, totals, and averages.
D. For specialized stations only - daily soil temperatures and evaporationand wind data.
E. A station index, which gives data on station location, times and typesof observations made, and the name of the observer.
80

NUMBER: 5
TITLE: CLIMATOLOGICAL DATA (Annual Summary)
PUBLICATION INFORMATION: Annually, by state
GEOGRAPHIC COVERAGE: Same as NUMBER 1
REPORTING STATIONS: Same as NUMBER 4
TYPES OF DATA:
A. Average temperature and departure from normal and total precipitationand departure from normal for each month and for the year for all stations.
B. Temperature extremes and Freeze Data for all stations.
C. Soil temperatures and Total Evaporation and Wind Movement on a monthlybasis for selected stations.
D. .Station Index-station location, times and types of observations, andname of observer.
81

Fl -
NUMBER: 6
TITLE: CLIMATOLOGICAL SUMMARIES (Substations)
PUBLICATION INFORMATION: Data sheet published for each substation in theU.S. Dates of publications vary. Informationwas collected as part of the Climatography ofthe United States program.
GEOGRAPHIC COVERAGE: United States (50 states)
REPORTING STATIONS: 3ll substations
TYPES OF DATA:
A. Climatological Summary - presents means and extremes for various numbersof years on a monthly basis. Thirty-year periods are used if available.Data presented: temperature, precipitation, and degree days.
B. Narrative Climatological Summary - a description of the substation'sclimate written by the state climatologist.
C. Station History - a narrative history of the substation, incorporatingsite changes, instrumentation used and instrument relocation, and a listof the observers and/or organizations that have taken observations through-out the stations existence.
D. Monthly and yearly totals of average temperature and precipitationtotals cn a yearly basis for various numbers of years (from less than 5 toover 30) depending on the substation record.
82

NUMBER: 7
TITLE: CLIMATOLOGICAL DATA (National Summary)
PUBLICATION INFORMATION: Monthly, one issue
GEOGRAPHIC COVERAGE: Same as NUMBER 1
REPORTING STATIONS: All 1st-order stations (approximately 290)
TYPES OF DATA:
A. Temperature extremes and precipitation extremes for the month by state.
B. Monthly summaries of temperature, precipitation, dew point, R.H., wind,sky cover, and possible sunshine for all first-order stations in the U.S.,Puerto Rico, and the Pacific Islands. (Metric Units)
C. Heating and Cooling Degree Days for above stations.
D. Storm Summary for month (tornadoes, hailstones, windstorms, lightning,heavy snowstorms, ice storms).
E. Monthly summary of National Flood Events.
F. Rawinsonde Data - monthly averages.
G. Solar Radiation Data
83
- - 7

NUMBER: 8
TITLE: CLIMATOLOGICAL DATA (National Summary)
PUBLICATION INFORMATION: Annual, one volume
GEOGRAPHIC COVERAGE: Same as NUMBER 1
REPORTING STATIONS: All first-order stations, same as NUMBER 1.
TYPES OF DATA:
A. Maximum short duration precipitation (from 5 through 180 minutes) forall first order stations on a monthly basis.
B. Sunshine amount and percent of possible sunshine for the month.
C. Annual Climatological Data for all first order stations. Includes:annual summary of temperature (max/min, extremes), heating/cooling degreedays, total liquid precipitation and snowfall, greatest liquid precipitationand snowfall in 24 hours and dates of occurrences, average R.H. at 6-hourintervals, wind (average, resultant, and fastest mile), average sky cover.
0. Tie Normals, Means and Extremes for the above mentioned elements (C).
E. Tornado, cyclone, hurricane, and Flood Summary.
84

NUMBER: 9
TITLE: MONTHLY CLIMATIC DATA FOR THE WORLD
PUBLICATION INFORMATION: monthly, one issue
GEOGRAPHIC COVERAGE: worldwide
REPORTING STATIONS: over 1200 surface observation reporting stations,over 400 upper air reporting stations
TYPES OF DATA: (ALL DATA EXPRESSED IN METRIC UNITS)
A. SURFACE DATA: summary for month, includes: station's longitude andlatitude, elevation, pressure (mean station and mean sea level), temper-ature (mean & departure from normal), vapor pressure (mean & departurefrom normal), precipitation (total & departure from normal), percentpossible sunshine (% of long term average).
B. UPPER AIR DATA: monthly averages at standard pressure surfaces (sur-face: 850, 700, 500, 300, 200, 150, 100, 50, and 30 mbs) of temperature,dew point depression, and wind vectors.
85

NUMBER: 10
TITLE: CLIMATIC SUMMARY OF THE UNITED STATES - Supplement for 1951-1960
PUBLICATION INFORMATION: published in 1964, one copy per state, part ofClimatography of the United States, Series No. 86
GEOGRAPHIC COVERAGE: 50 U.S. states, Pacific Islands, and Caribbean
REPORTING STATIONS: all stations
TYPES OF DATA:
A. Total Precipitation - exact values for 1951-1960 period for each monthwith annual totals. Average precipitation for 10-year period for each month.Record monthly precipitation for entire station history.
B. Total snowfall (same presentation as in A.)
C. Mean number of days with precipitation >0.10" or <0.50" with pre-sentation same as A.
D. Mean temperature and normals (by month and year), with presentationsame as A.
E. Mean daily max/min temperatures - extreme values for each month andfor year - for individual station's entire period of record.
F. Mean number of days with temperatures >90°F or <32°F - by month andyear for 1951-1960 period.
G. Mean Evaporation - by month and year for station's entire history.
H. Station Index
86
_ _ _ _

NUMBER: 11
TITLE: CLIMATES OF THE STATES
PUBLICATION INFORMATION: Part of Climatography of the United States, SeriesNo. 60, published in 1959 and 1960. One publicationper state.
GEOGRAPHIC COVERAGE: 48 contiguous states, and Alaska. Hawaii omitted
REPORTING STATIONS: all stations within states
TYPES OF DATA:
A. A Narrative Climatological Summary of the state.
B. Freeze Data - mean dates of first fall and last spring freezes andmean number of days between the two.
C. Mean temperature and precipitation - for 20-30 year periods, for eachmonth and year.
D. Normals, Means, and Extremes - for only Ist-order stations within thestate (as of 1959 or 1960), this is the same data as is presented inNUMBER 3.
87
--- -r

NUMBER: 12
TITLE: CLIMATIC SUMMARY OF THE UNITED STATES - Supplement for 1931-1952
PUBLICATION INFORMATION: part of Climatography of the United States,Series No. 11, by state and/or region
GEOGRAPHIC COVERAGE: 48 contiguous United States
REPORTING STATIONS: all stations
TYPES OF DATA:
A. Total Precipitation - by month and year for 1931-52, and mean valuesfor same.
B. Mean Snowfall - mean and extreme values for month and year for entire1931-52 period.
C. Mean temperature, max/min temperature for each month and year forentire station's period of operation.
D. Absolute max/min temperatures for each month for entire period of the
station's operation.
E. Station Index and Station History
NUMBER: 13
TITLE: DAILY NORMALS OF TEMPERATURE AND HEATING DEGREE DAYS (1931-1960)
PUBLICATION INFORMATION: part of Climatography of the United States,Series No. 84, 1963
GEOGRAPHIC COVERAGE: 50 U.S. States, Caribbean, and Pacific Islands
REPORTING STATIONS: 1st-order stations only
TYPES OF DATA:
A. Temperature (max/min, average) and degree days by day for each monthfor all months. Normals based on 1931-1960 data base.
88
. . . .. .. l i I 1
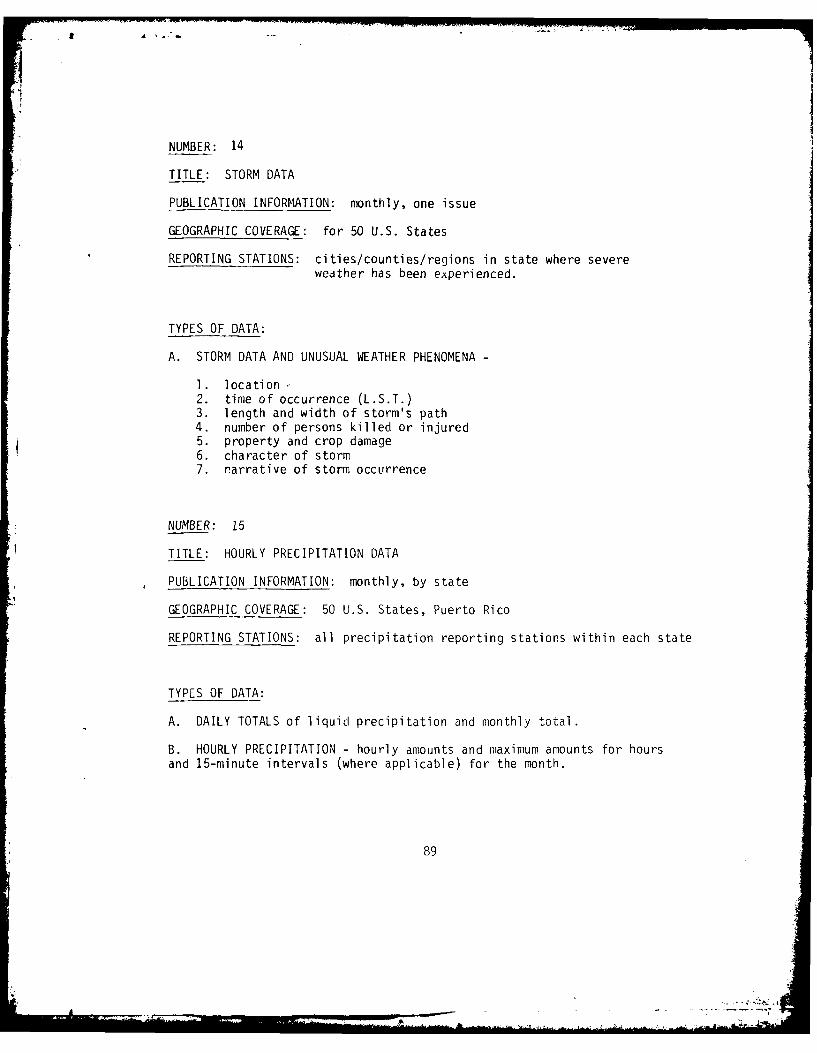
NUMBER: 14
TITLE: STORM DATA
PUBLICATION INFORMATION: monthly, one issue
GEOGRAPHIC COVERAGE: for 50 U.S. States
REPORTING STATIONS: cities/counties/regions in state where severeweather has been experienced.
TYPES OF DATA:
A. STORM DATA AND UNUSUAL WEATHER PHENOMENA -
1. location -2. time of occurrence (L.S.T.)3. length and width of storm's path4. number of persons killed or injured5. property and crop damage6. character of storm7. narrative of storm occurrence
NUMBER: 15
TITLE: HOURLY PRECIPITATION DATA
PUBLICATION INFORMATION: monthly, by state
GEOGRAPHIC COVERAGE: 50 U.S. States, Puerto Rico
REPORTING STATIONS: all precipitation reporting stations within each state
TYPES OF DATA:
A. DAILY TOTALS of liquid precipitation and monthly total.
B. HOURLY PRECIPITATION - hourly amounts and maximum amounts for hoursand 15-minute intervals (where applicable) for the month.
89
... ....

NUMBER: 16
TITLE: HOURLY PRECIPITATION DATA (Annual Summary)
PUBLICATION INFORMATION: annual, by state
GEOGRAPHIC COVERAGE: U.S. States (Alaska omitted) & Puerto Rico
REPORTING STATIONS: all precipitation reporting stations in each state
TYPES OF DATA:
A. Monthly Precipitation Totals and Yearly Totals
B. Annual Maximum Precipitation - hourly and minute maximums and dates ofoccurrence.
NUMBER: 17
TITLE: SUMMARY OF HOURLY OBSERVATIONS
PUBLICATION INFORMATION: part of Climatography of the United States,Series No. 30 & 82
GEOGRAPHIC COVERAGE: 152, 1st-order stations in the United States, all50 states included, Puerto Rico, and Pacific Island
REPORTING STATIONS: 152, 1st-order stations in the United States, PuertoRico, and Pacific Islands
TYPES OF DATA:
A. For each month and annually, the following summarized data matricesare presented:
1. Temperature, wind speed, and R.H. occurrences.2. Percentage frequencies of wind direction and speed.3. Occurrences of precipitation amounts (hour of day vs. intensity).4. Percentage frequencies of ceiling vs. visibility.5. Percentage frequencies of sky cover, wind, and R.H. for each hourcf the day.
9O

NUMBER: 18
TITLE: MAXIMUM STATION PRECIPITATION FOR 1, 2, 3, 6, 12, and 24 HOURS
PUBLICATION INFORMATION: Technical Paper #15, 1955. One copy for eachstate or region in contiguous United States
GEOGRAPHIC COVERAGE: The 48 contiguous United States
REPORTING STATIONS: All precipitations reporting stations in each state
TYPES OF DATA:
A. Maximum Monthly Precipitation Amounts for each month for the station'speriod of record - includes: date of occurrence, amount and duration (1, 2,3, 6, 12, and 24 hour periods).
B. Statewide Extremes - same presentation as in A.
C. Maps of Maximum Recorded Precipitation for state for 1, 2, 3, 6, 12,and 24 hour periods.
D. Summary of Precipitation Extremes - for each reporting station in thestate for 1, 2, 3, 6, 12, 24 hour periods for each month and annually forthe entire period of record of each reporting station.
91

NUMBER: 19
TITLE: Monthly Normals of Temperature, Precipitation, and HeatingDegree Days
PUBLICATION INFORMATION: part of Climatography of the United States,Series No. 81, 1962. Published for eachstate and/or region
GEOGRAPHIC COVERAGE: 50 U.S. States, Pacific Islands, and Caribbean
REPORTING STATIONS: all stations
TYPES OF DATA:
A. Normals for Ist-order stations - based on 1931-1960 data base - bymonth and for year including: max/min temperatures, average temperature,degree days, and liquid precipitation amounts.
B. Normals for all stations - based on 1931-1960 data base - by month andfor year for average temperature and average precipitation. This data isarranged by state climatological division.
NUMBER: 20
TITLE: MONTHLY AVERAGES FOR STATE CLIMATIC DIVISIONS
PUBLICATION INFORMATION: part of Climatography of the United States,Series No. 85, 1963
GEOGRAPHIC COVERAGE: United States (less Hawaii), Puerto Rico
REPORTING STATIONS: individual state climatological divisions
TYPES OF DATA:
A. Monthly and Annual Division Averages, arranged by State ClimatologicalDivisions - for each year in the 1931-1960 period, for temperature(average) and precipitation.
92
4somj

AD-A095 158 ARMY ENGINEER TOPOGNAPHIC LASS FORT BELVOIR VAF/154TERRAIN ANALYSIS PROCEDURAL GUIDE FOR CLIMATE,(U)
SEP 80 R J FROUIGHUNCLAsSIV EO ETL-0247 NL2,2uuhuuuuImIIIIIIIIIIIIII~fl.flElElllEEE~lEEE

NUMBER: 21
TITLE: CLIMATIC SUMMARY OF THE UNITED STATES
PUBLICATION INFORMATION: publication date unknown (post 1930),106 summaries
GEOGRAPHIC COVERAGE: the 50 United States
TYPES OF DATA: 106 summaries cover sections of the United States determined
by topography, climate, and state boundaries.
A. Topographic Features of sections
B. Climatic Characteristics of sections (temperature and precipitation)
C. For selected stations in the sections - for entire length of recordfor month and annual summary:
1. Temperature - avg., avg. max/min, absolute max/min, highest andlowest monthly average.
2. Precipitation - avg., total amts. driest and wettest years, snow
(avg. and greatest in 24 hours).
3. Relative Humidity - avg. at 8 a.m., noon, and 8 p.m.
4. Sunshine - average no. of hours, and percent of possible.
5. Prevailing wind direction.
D. For each month for the entire period of the station's record, thefollowing:
1. average temperature, average maximum temperature, average minimumtemperature, highest temperature and lowest temperature.
E. Excessive precipitation - for selected stations by dates of occurrencein 5 minute intervals for 5 minutes to 120 minutes.
F. Precipitation - average, annual and monthly amounts for one or morestations in each county within the section, and for the same stations,average monthly and annual snowfall, average number of days with 0.01 ormore of precipitation, average temperature, avg, max/min temperature,absolute max/min, prevailing wind direction, average hourly wind speed,max. wind velocity, dates of first and last frosts and length of growingseason.
93

NUMBER: 22
TITLE: UNIFORM SUMMARY OF SURFACE OBSERVATIONS (PARTS A thru E)
PUBLICATION INFORMATION: Published by Air Weather Service, Ashville, NC
GEOGRAPHIC COVERAGE: worldwide
TYPES OF DATA: Part A Summary - the period of record of the A Summary isnormally 10 years, however, this is not uniform for all stations in thedata collection -- many stations present data summaries for 5 years of data.
PART A IS DERIVED FROM HOURLY OBSERVATIONS - % frequencies - year, month,hour
1. SURFACE WINDS - percentage frequency of occurrence for year, by monthand by hour for each month.
A. Directions by Speed Groups1. mean speeds by 16 points of the compass.
2. FLYING WEATHER -A.Weather classification1. Closed-ceiling less than 500' and/or visibility less than 1 mi.2. Instrument-ceiling 500-900', vsby greater than 1 mi., and/or
vsby 1-2%, mi. with ceiling greater than 500'.3. Contact-ceiling greater than 1000' with visibility greater
than 3 mi.B. Observations with visibilities less than 1 mi. caused by:
1. fogI2. smoke and/or haze3. blowing snow and/or dust4. cause unknown5. total % of observations with visibilities less than 1 mile.
3. CEILING HEIGHT-A. % frequency of observations with ceiling height:
1. 0-400'2. 500-900'3. 1000-2000'4. 2100-3000'5. 3100-5000'6. 5500-9000'7. +10000 and above and unlimited
94

4. VISIBILITY (vsby)A.%frequencies of observations with visibilities:1. 0, 1/16, 1/8 mi.2. 3/16, 3/4 mi.3. 5/16, 3/8, 1/2 mi.4. 5/8, 3/4 mi.5. 1-24 mi.6. 211mi.7. 3-6 mi.8. 7-9 mi.9. 10 and above
5. WEATHER CONDITIONS -A. % frequencies and actual amounts of the following weather
conditions:1. thunderstorms2. rain and drizzle3. freezing rain4. snow and/or sleet5. hail6. total observations with precipitation
6. SKY CONDITIONS -A. % frequencies and actual amounts of the following sky conditions:
1. clear2. scattered3. high broken or high overcast with scattered or no low clouds4. low broken5. low overcast
7. SKY COVER-A. % frequencies and actual occurrences of amounts of sky cover in
tenths:1. 02. 1-23. 34. 4-55. 6-76. 8-97. 10
B. Mean tenths of sky cover
B. EXTREME WIND DATA - by monthA. direction and speed of maximum winds based on hourly observationsB. direction and speed of peak gust based on hourly observations
TYPES OF DATA: Part B Summary - the period of record for the B Summary isnormally 10 years, however this is not uniform for all the stations in thedata collection -- many stations present data summaries for 5 years ofdata
95

II
PART B IS DERIVED FROM DAILY OBSERVATIONS -
1. DAILY TEMPERATURE -A. frequency of daily temperatures by 20F increments, by month, for
entire data collection period for maximum temperature, minimumtemperature, and mean temperature.
2. PRECIPITATION -A. Summary of Daily Amounts for Months, frequency of occurrence:
1. none2. trace3. .01"4. .02" - .05"5. .06" - .10"6. .11" - .25"7. .26" - .50"8. .51" - 1.00"9. 1.01" - 2.50"
10. 2.51" - 5.00"11. 5.01" - 10.00"12. 10.01" - 20.00"13. over 20.00"
B. Mean Monthly PrecipitationC. Mean Number of Days with Measurable Precipitation
3. SNOW DEPTH (at 0800 L.S.T.)A. Frequency of occurrence of snow depth on ground, by month, for
depths:1. none2. trace3. .1" to .5"4. .6" to 1.0"5. 1.1" to 2.0"6. 2.1" to 6.0"7. 6.1" to 12.0"8. 1.1' to 2.0'9. 2.1' to 3.0'10. 3.1' to 4.0'11. 4.1' to 5.0'12. 5.1' to 10.0'13. over 10 feet
B. mean number of days with measurable snow depth by month
4. SNOW DEPTH (at 0300 GCT)A. Frequency and summary of daily amounts, by month, for amounts:
1. none2. trace3. 1"4. 2"
96
'I

5. 3"6. 4" to 6"7. 7" to 12"8. 13" to 24"9. 25" to 36"10. 37" to 48"11. 49" to 60"12. 61" to 120"13. over 120"
B. Mean Monthly Snow DepthC. Mean Number of Days with Measurable Snow Depth
5. SNOWFALL -A. Frequency and summary of daily amounts, by month, for amounts:
1. none2. trace3. .1" to .4"4. .5" to 1.4"5. 1.5" to 2.4"6. 2.5" to 3.4"7. 3.5" to 4.4"8. 4.5" to 6.4"9. 6.5" to 10.4"10. 10.5" to 15.4"11. 15.5" to 25.4"12. 25.5" to 50.4"13. over 50.4"
B. Mean Monthly SnowfallC. Mean Number of Days with Measurable Snowfall
TYPES OF DATA: Part C - this summary presents Flying Weather Wind Roses,showing the percentage frequency of observations of various wind speedsfrom the 16 points of the compass, by month (knots or mph):
A. Wind speed groupings1. 1-3 knots (1-3 mph)2. 4-10 knots (4-12 mph)3. 11-21 knots (13-24 mph)4. 22-27 knots (25-31 mph)5. 28-40 knots (32-46 mph)6. 41 knots and over (47 mph and over)
B. Mean Wind Speed (knots or mph)
TYPES OF DATA: Part D - this summary presents Frequency of Occurrence ofCeiling vs Visibility. The data matrix is composed of percentagefrequencies of ceiling vs visibility data.
A. Ceiling increments: all readings prefixed by "greater than orequal to...":
97
...I

1. 0' 14. 1800'2. 100' 15. 2000'3. 200' 16. 2500'4. 300' 17. 3000'5. 400' 18. 3500'6. 500' 19. 4000'7. 600' 20. 4500'8. 700' 21. 5000'9. 800' 22. 6000'10. 900' 23. 7000'11. 1000' 24. 8000'12. 1200' 25. 9000'13. 1500' 26. 10000'
B. Visibility increments are given in -.>tute miles. All readingsare prefixed by "greater than or equal to...":
1. 0 9. 1 mi.2. 1/4 mi. 10. 2 mi.3. 5/16 mi. 11. 2 mi.4. 1/2 mi. 12. 3 mi.5. 5/8 mi. 13. 4 mi.6. 3/4 mi. 14. 5 mi.7. 1 mi. 15. 6 mi.8. 14 mi. 16. 10 mi.
The data is presented by month for every 2-, 3-, or 6-hour increments,depending on the station record, for each month, with a summary of allhours for each month, and a summary for all months.
TYPES OF DATA: Part E - this summary presents a Psychrometric Summary
A. A tabulation of wet bulb depressions versus dry bulb temperatures.In this tabulation, occurrences of the wet bulb depression are spreadhorizontally in 17 classes and vertically in 20F intervals of dry bulbtemperature. Row and column totals are provided. Tabulations for 3-hourgroups, by month, are provided as raw frequencies; tabulations for allmonths, all hours combined, and for individual months, all hours combined,are shown as percentage frequencies.
B. A tabulation of occurrences of dry bulb, wet bulb, and dew pointtemperatures, separately, in 20F intervals, presented in raw frequencyand percentage frequency form as described above.
C. Statistical data for the individual elements of R.H., dry bulb,wet bulb, and dew point temperatures, consisting of sum of squares, sumsof values, means, and standard deviations. The number of observationsused in the computation of each element is also shown.
98

D. Mean numbers of hours of occurrence of six ranges of dry bulb,wet bulb and dew point temperatures, and total mean number of hourspossible in the period represented by months and hours contained in thatsummary. Mean hours are shown to tenths in all instances; however thedecimal point is omitted in all tabulation for all months, all hourscombined.
99
o 1

NUMBER: 23
TITLE: SPECIAL SUMMARIES
PUBLICATION INFORMATION: published by AWS, Ashville, NC
GEOGRAPHIC COVERAGE: worldwide
TYPES OF DATA: Special Summaries may present up to 24 different categoriesof data. However, no station in the file holdings has data in all twenty-four categories. In the data category list below, the categories with anasterisk (*) appear the most frequently. Periods of record range from 5years to over 20 years. Data is summarized by 3-hour observations (moststations have gaps in record)
Data Category List (ACTUAL NUMBERS OF CATEGORIES VARY FROM STATION TO STATION)
*1. Surface winds by months*2. Surface winds by seasons*3. Precipitation*4. Wet and dry spells5. Frequency of hot and cold spells*6. Mean frequency of daily max., mean max., and extreme max. temperature*7. Mean frequency of daily min., mean min., and extreme min temperature8. Temperature vs dew point group distribution9. Mean hourly temperature10. Mean frequency of obstructions to vision, sky conditions
*11. Daily snow depth12. Ceiling and visibility by months
*13. Mean freq. of days available for indicated military operations*14. Miscellaneous data
15. Winds aloft by seasons16. Percentage freqs. of temperatures and relative humidity
**17. Total and low cloud amounts*18. Percentage freqs. of obs, with low cloud amounts and visibility reported
19. Mean frequency of the state of the ground in days20. Mean frequency of diurnal temperature range
*21. Mean cloudiness*22. Percentage frequencies of surface winds*23. Sea level pressure*24. Visibility and various atmospheric phenomena
Note: more categories may exist, but a random sample of the data holdingscould only find the 24 listed above.
100
Nor

NUMBER: 24
TITLE: WORLD-WIDE AIRFIELD SUMMARIES
PUBLICATION INFORMATION: U.S. Naval Weather Service 1967-1971
GEOGRAPHIC COVERAGE: worldwide, less USSR, Eastern European countrips,and China
TYPES OF DATA: see following pages
Published volumes of World-wide Airfield Summaries are available for the following areas:
NTISVolume Name Accession Number
Volume I Southeast Asia (Revised) AD-706-355
Volume II (Parts 1 & 2) Middle East AD-662-425 & AD-662-427Volume III Far East AD-662-h26Volume IV Canada-Greenland-Iceland AD-662-424Volume V Aastralia-Antarctica AD-662-648
(including So. Pacific Is.)Volume VI (Parts 1 & 2) South America AD-664-828 & AD-664-829Volume VII Central America AD-671-845Volume VIII United States of America
Part 1 West Coast,Western Mtna. and Great Basin AD-688-72Part 2 Rocky Mtns. and Northwest Basin AD-689-792Part 3 Central Plains AD-693-491Part 4 Great Lakes AD-696-971Part 5 Mississippi Valley AD-699-917Part 6 Southeastern Region AD-701-719Part 7 East Coast and Appalachian Region AD-703-606Part 8 Alaska and Hawaii AD-704-607
Volume IX AfricaPart 1 Northern Half AD-682-915Part 2 Southern Half AD-682-915
Volume X EuropePart 1 Scandinavia & Northern EuropePart 2 Low Countries & British IslesPart 3 Alps & Southwest EuropePart 4 Mediterranean
101

INTRODUCTION
This volume provides climatological summaries for airfields and climatic areas in theMediterranean. Summnaries are arranged according to numbered climatic areas, and by increasingWMO Station Index Numbers within the climatic areas. An arbitrary station number (indicated by'vn) is used where WMO Index Numbers are not assigned. Maps are included to delineate areasand station locations.
Climatic areas have been selected as being nearly homogeneous climatologically, but con-siderable variation may exist between locations in an area at a specific time because oftopography and other factors. Climatological summaries for these areas follow those for theincluded airfields.
The latitudes and longitudes of the approximate centers of the climatic areas are indicatedin the summnary headings. The climatic areas are delineated by straight line segments and thepositions of the end points are listed.
Blank values in the tables indicate that no data are available, and "0" indicates recordis unknown. Local Standard Time is that of the standard time zone, and no adjustment has beenmade where local deviations exist. Data sources are listed in detail by means of a numbersystem described on the following pages.
The first page of each station summnary provides data for the station, and the second pagecontains information for the airfield area. The values are in mean number of days. Whenobservations were not available, the information consists of climatological estimates based ondata for surrounding stations. In some instances tables may be based on relatively few observa-tions or on somewhat doubtful data, and these should be used with caution.
GLOSSARY OF GENERAL TERM!
AIRFIELD DATA AND AIRFIELD AREA DATA
Climatological data applicable only to a specified mirfield. The data consistsof' statistical parameters based on actual weather observations made at the air-field. If actual weather observations are qot available the data consist ofestimates of the statistical parameters, prepared by a climatologist, based onactual meteorological data from surrounding weather stations.
CLIMATIC AREA DATA
Climatological data representative of a nearly homogeneous climatic area. Thedata are average (or representative) values based on a sample of climatologicaldata available from weather stations wiLthin the area. The area data do not im-ply that the specific condition simultaneously exists at all locations within acountry or large climatic area. In rolling and mountainous terrain there maybe considerable variation in the data from one location to another within theclimatic area.
LOCAL STANDARD TIME
Standard time applicable to a 15 deg. meridional zone. (Zones proceed east andwest from the zone centered on the prime meridian and extending from 00730E to00730W.) No consideration is given to local deviations from the 15 deg. zoneboundaries.
AIRFIELD PARAMETERS
ABSOLUTE MAXIMM (MINIMM) TMERATURE-DEG. F.
The highest (lowest) temperature observed in the specified month during the
whole period for which observations are available.
102

MEAN DAILY MAXIMUM (MINIMUM) TEMPERATURE-DEGREE F.The average of all the daily iaxi-t-9 (minimum) temperatures observed in the specified month.
MEAN NO. DAYS WITH MAXIMUM TEMPERATURE GREATER THAN 90 DEGREE F.The average of the number of days in the specified month on which the maximum temperaturewas observed to be equal to or 'greater than 90 degree F.
MEAN NO. DAYS WITH MINIMUM TEMPERATURE LESS THAN 32 DEGREE F. (LESS THAN 0 DEGREE C.).The average of the number of days in the specified month on which the minimum temperaturewas observed to be equal to or less than 32 degree F. (0 degree C.).
MEAN DEW POINT TEMPERATURE -DEGREE F.The average of all hourly dew point temperatures observed in the specified month.
MEAN RELATIVE HUMIDITY-PERCENTThe average of all hourly relative humidity values observed in a specified month.
MEAN PRESSURE ALTITUDE-FEETThe average station pressure observed at the airfield in the specified month convertedto an altitude by using the U.S. Standard Atmosphere.
MEAN MONTHLY PRECIPITATION-INCHESThe average of the monthly total amount of all forms of precipitation, reduced to itsliquid equivalent, observed in the specified month.
MEAN MONTHLY SNOWFALL-INCHESThe average of the monthly total amount of snowfall observed in the specified month.
MEAN NO. DAYS WITH PRECIPITATION GREATER THAN 0.1 INCH (SNOWFALL GREATER THAN 1.5 INCHES)The average of the number of days in the specified month on which the daily amount ofprecipitation (snowfall) was observed to be equal to cr greater than 0.1 inch (1.5 inches).
MEAN NO. DAYS WITH AN OCCURRENCE OF VISIBILITY LESS THAN 0.5 MILEThe average of the number of days in the specified month on which there was at least oneobsprvation of visibility less than 0.5 mile.
MEAN NO. DAYS WITH THUNDERSTORMSThe average of the number of days in the specified month on which the weather observerheard thunder.
PERCENT FREQUENCY SURFACE WIND SPEED G1.EATER THAN 16 KNOTS (GREATER THAN 27 ft/sec).The frequency, expressed as a percent of the total number of hourly weather observationsconsidered, during the specified month, in which the surface wind speed was observed t-'be greater than 16 knots (greater than 27 ft/sec).
PERCENT FREQUENCY CEILINGS LESS THAN 5,000 FEET DR VISIBILITY LESS THAN 5 MILESThe frequency, expressed as a percent of the total number of hourly weather observationsconsidered, during the specified month, in which the ceiling was observed to be less than5,000 feet and/or the visibility was observed to be less than 5 miles.
PERCENT FREQUENCY CEILING LESS THAN 1,500 FEET (LESS THAN 300 FEET) OR VISIBILITY LESS THAN3 MILES (LESS THAN 1 MILE)
The frequency, expressed as a percent of all the hourly weather observations considered,in a specified three-hourly period during the day for a specified month in which theceiling was observed to be less than 1,500 feet (300 feet) and/or the visibility wasobserved to be less than three miles (one mile).
103

PARAMETERS FOR AIRFIELD AREA AND CLIMATIC AREA
MEAN NO. DAYS WITH CEILING EQUAL TO OR. GREATER THAN 1,000 FEET (EQUAL TO ORGREATER THAN 2,500 FEET, EQUAL TO OR GREATER THAN 6,000 FEET, EQUAL TO ORGREATER THAN 10,000 FEET) AND VISIBILITY EQUAL TO OR GREATER THAN 3 MILES
The average of the number of days when, at a specified hour during the dayin the specified month, the ceiling was observed to be equal to or greaterthan 1,000 feet (2,500 feet, 6,000 feet, 10,000 feet) and the visibilitywas observed to be equal to or greater than three miles.
MEAN NO. DAYS WITH CEILING EQUAL TO OR GREATER THAN 2,000 FEET AND VISIBILITYEQUAL TO OR GREATER THAN 3 MILES AND SURFACE WIND LESS THAN 10 KNOTS
The average of the number of days when, at a specified hour during the dayin the specified month, the ceiling was observed to be equal to or greaterthan 2,000 feet, the visibility was observed to be equal to or greater thanthree miles, and the surface wind speed less than ten knots.
MEAN NO. DAYS WITH .'URFACE WIND EQUAL TO OR GREATER THAN 17 KNOTS AND NOPRECIPITATION
The average of the number of days when, at a specified hour during the dayin the specified month, the surface wind speed was observed to be equal toor greater than 17 knots, and there was no precipitation.
MEAN NO. DAYS WITH SURFACE WIND 4-lO KNOTS AND TEMPERATURE 33-89 DEG. F ANDNO PRECIPITATION
The average of the number of days when, at a specified hour during the dayin the specified month, the surface wind speed was equal to or greater thanfour knots, but not greater than ten knots, the temperature was equal to orgreater than 33 deg. F. but not greater than 89 deg. F. and there was noprecipitation.
MEAN NO. DAYS WITH SKY COVER LESS THAN 0.3 AND VISIBILITY EQUAL TO OR GREATERTHAN 3 MILES
The average of the numbe: of days when, at a specified hour during the dayin the specified month, the portion of the sky covered with clouds was ob-served to be less than 0.3 and the visibility was observed to be equal toor greater than three miles.
AREA PARAMETERS (CLIMATIC AREA ONLY)
MEAN DAILY TEMPERATURE RANGE-D1G. F.
Two temperatures for the specified month: (1) a representative mean dailymaximum temperature observed in the area; (2) a representative mean dailyminimum temperature observed in the area.
RANGE OF MEAN MONTHLY PRECIPITATION-INC TES
Two mean monthly precipitation amounts for the specified month- (1) thelargest mean amount observed in the a-ea; (2) the smallest mean amount ob-served in the area.
104
iI

DATA SOURCES
The source from whic". values were taken can be determined from the columnlabeled "No. Obs."
(1) If the number in that column is positive, the data for that line werecomputer-summarized, and the number given is the number of observations used in
t the summsarization.
(2) If the number is negative and of three digits or less, the data werehand-copied or estimated as indicated in the following source list.
(3) If the number is less than minus 500, part of the data are derivedfrom computer-susmarized data, and part from the source list number plus 500.For example, if the number is "-528," the source is the extreme of the computer-summnarized data compared to source "1-28."1
(4i) If the number is minus and a four or five digit number, the data weresubstituted from a representative station nearby and this number is the numberof the source station.
(5) Statistical methods or metecr'mlogical relationships were used wheneverpossible to provide data not available a, the National Weather Records Center orin yearbooks and summnaries.
105

ao
NUMBER: 25
TITLE: WORLD WEATHER RECORDS (1951-1960)
PUBLICATION INFORMATION: 1965 by U.S. Weather Bureau
GEOGRAPHIC COVERAGE: worldwide (selected WMO stations)
"World Weather Records"This publication contains tables of mean temperatures, mean
pressures and precipitation at all stations throughout the worldfor which complete data for the 10-year period are available.There are earlier issues covering every 10-year period back toabout 1900.
TYPES OF DATA:
A. For each reporting station, the following information is given (whereavailable):station namelocation (latitude and longitude)number of years of data and yearsheight above sea levelheight of barometer above sea levelheight of thermometer above sea levelheight of rim of precipitation gathering device above groundinformation as to whether data was estimated due to incompleteness of data
base
B. Data presented for each station: by month and year for the entire 1951-1960 period (if available):
monthly means (and yearly means) of:
1. temperature (°C)2. station pressure (mb)3. sea level pressure (mb)4. precipitation (actual amounts in mm)
* Normals are also provided for temperature and precipitation by month andyear where available.
106
.4.

Title of the 6 volumes:Vol. 1 --- North AmericaVol. 2 --- EuropeVol. 3 --- South America, Central America, West Indies, The Caribbean
and BermudaVol. 4 --- AsiaVol. 5 --- AfricaVol. 6 --- Antarctica, Australia, Oceanic Islands, and Ocean Weather
Stations
Note: Volumes are also available for 10-year periods prior to the 1951-1960period going back to 1921. Another volume is available for theperiod prior to 1921.
107
Akdowawom -1

NUMBER: 26
TITLE: TABLES OF TEMPERATURE, RELATIVE HUMIDITY AND PRECIPITATION FORTHE WORLD
PUBLICATION INFORMATION: 1958 and 1960, by Meteorological Office, AirMinistry, London
GEOGRAPHIC COVERAGE: worldwide (selected WMO stations)
TYPES OF DATA:
A. For each reporting station, the following information is presented:
1. station name2. location (latitude and longitude)3. elevation above mean sea level4. number of years of record for each of the measured elements
B. Actual data: monthly values and yearly totals for station's entireperiod of record for all of the following elements:
1. average daily max/min temperature ( 0F)2. temperature - average of highest each month and average of lowesteach month (OF)3. absolute max and min temperature4. Relative Humidity - average of observations selected hours or allhours5. Precipitation - average monthly fall (inches), maximum fall in 24hours, and average number of days with 0.01" or more. (some stationsgive information on precipitation for average number of days witheither 0.04 or 0.004 inches or more.)
Titles of the 6 parts are:Part 1 --- North America, Greenland and the North Pacific OceanPart 2 --- Central and South America, the West Indies and BermudaPart 3-- Europe and the Atlantic Ocean north of 35 0NPart 4 Africa, the Atlantic Ocean south of 350N and the Indian OceanPart 5 --- AsiaPart 6 -- Australasia and the Southern Pacific Ocean, including the
corresponding sectors of Antarctica
""*Note: see next page for summary of revised and reprinted handbooksin this series
108
****REVISED BRITISH HANDBOOKS
TITLE: TABLES OF TEMPERATURE, RELATIVE HUMIDITY AND PRECIPITATION FORTHE WORLD
PUBLICATION INFORMATION: 1975 thru 1977 by Meteorological Office, AirMinistry, London
GEOGRAPHIC COVERAGE: worldwide (selected WMO stations)
TYPES OF DATA: In general , the above documents are either revisions orreprints of the 1958-1960 versions. The format of data presentationremains unaltered. The exact nature of any revisions will be stated below:
Parts 1, 2, 5, and 6 --- NO CHANGES (REPRINTS ONLY)
Part 3 - Title changed to Europe and the AzoresMore recent data used in the summariesStations added and some stations deletedMetric units used throughout the workWhere possible, data base is for the period 1931-1960New data category added: Bright Sunshine, the subdivision ofwhich are:
average monthly durationaverage of percent of possiblemaximum duration in one dayaverage number of days with no sun
Part 4 -Some stations added, whereas others deletedStations grouped by grid zones (Note: this practice will be
discontinued in later revisions, and the original practice ofgrouping stations by country will be continued)
Publication dates for latest documents in this series:
Part 1 --- 1975Part 2 --- 1977Part 3 --- 1973Part 4 --- 1975Part 5 --- 1976Part 6 --- 1976
109

NUMBER: 27
TITLE: WORLD SURVEY OF CLIMATOLOGY
PUBLICATION INFORMATION: Elsevier Publishing Co. Amsterdam. 1970
GEOGRAPHIC COVERAGE: World-wide, 15 volumes
TYPES OF DATA: *Extensive textual discussion of weather and climate, withmany tables, maps, and summnaries. Among climatic elements presented are:
A. MONTHLY CLIMATIC SUMM~ARIES FOR SELECTED STATIONSMean daily temperaturesMean daily temperature rangeMean daily precipitationMaximum 24-hour precipitationNumber of days with precipitationMean station pressureMean cloudinessMean wind speedPrevailing wind direction
B. TABLESMean monthly and annual hours of bright sunshineAverage daily maximum and minimum temperatureFrequency of days with snow or sleetFrequency of days with snow lying on the groundAverage amount of cloud cover at selected hoursFrequency of fogFrequency of cloudy days in winter
C. MAPSNormal date of beginning of the vegetative periodLength of vegetative periodNormal date of end of vegetative periodMean duration of frost-free periodMean annual rainfall
*Varies from country to country
110

APPENDIX D. CLIMATIC NARRATIVES
BIRMINGHAM, ALABAMA
Narrative Climatological Summary
For the period of record, Birmingham's monthly temperatures show a range from a Januarymean of near 440 to a July mean of near 800. This 36* annual range reflects the effectof the station's location with respect to the warm body of water to the south and theinvasions of relatively cold air from the continental north and west. The occurrenceof very low temperatures, although quite rare, effectively prevents the growth ofvegetation normally indigenous to subtropical climates.
Precipitation, with a minimum occurring during October, has two maxima each year, oneduring the winter months and another, slightly lower, in July. Summer precipitation ischiefly in the form of thunderstorms. Snowfall is seldom heavy enough to be important.Heavy falls occur occasionally, however, and when in excess of about 2 inches, theyproduce a real traffic problem. Very low temperatures in this area almost invariablyoccur under radiation conditions involving a particularly persistent snow cover.
Droughts are infrequent. One of the worst on record occurred in 1924 wheai no rain fellbetween September 29 and December 4 with the exception of 0.01 inch on November 21.
Birmingham's location nearly 300 miles from the Gulf of Mexico keeps it safe from thedestructive winds of hurricanes passing Inland from the Gulf of Mexico. Some veryheavy rains have occurred in connection with these storms, however - for example, thethree-day fall of 9.71 inches on July 6-8, 1916.
The length of the growing season averages 228 days, but has been as short as 192. Theaverage date of the last minimum temperature of 320 or lower in spring is March 23, butit has occurred as late as April 17, and the first in autumn, averaging November 8, hasoccurred as early as October 17.
The topography of Birmingham is hilly. The City proper is located in a valley betweena ridge of hills, extending from the northeast to the west, and the Red Mountain Range,which extends from the east to the southwest. This valley is approximately 8 mileslong and 2 to 4 miles wide. The Red Mountain Range approaches a height of 600 feetabove the valley level. Another ridge, The Shades Mrountain Ridge, parallels the RedMountain Range several miles to the southeast. Rolling terrain extends to the south-wes t and the west.- The hills in the Birmingham area, which extend to the northeast andthe north, are the foothills o f the Appalachian Mountains and the Cumiberland Plateau.The main climatic effect of the topography of Birmingham is that during the wintermonths, Ideal radiqtion and pronounced cold air drainage produce extreme temperatureinversions and rather low minimum temperatures.
a NATIONAL OCEANIC ANn ENVIRONMENTAL /NATIONAL CLIMATIC CENTE Rnoaa ATMOSPHERI ADMINISTRATION/ DATA SE RVIC[ /ASHE VI LLIN C.
Bob11

Climatic Brief on Southeast Asia
The climate of Southeast Asia is characterized as low latitude monsoon chiefly becauseof its tropical temperature regime and a well -established cycle of wet and dry seasons. Ingeneral, the southwest or wet monsoon prevails from mid-May to mid-September, and thenortheast or dry monsoon predominates from mid-October to mid-March. Short transitionperiods in spring and fail separate the two principal monsoon seasons. The intensity andtiming of the rainy season, however, varies considerably with location, so that localvariations of climate are numerous and in some instances sharp. Topography is the chiefcause for climatic modification, with the Annam Mountain Range, paralleling the Vietnamesecoast on the east, and the peninsular ranges of Burma and Thailand on the west, beingparticularly significant relief features. Windward slopes of these ranges arecharacteristically cloudy and rainy, whereas leeward slopes are relatively cloud-free andrainless.
The southwest monsoon is typified by airflow from the subtropical high pressure cells ofthe southern hemisphere to a low pressure cell centered over interior Asia. The airtransported into the region is warm, moist, and unstable, causing heavy local showers andthunderstorms in most sections of the region. For the most part, the showers occur duringthe afternoon hours, caused chiefly by the combined effects of orography and convection, andare especially heavy on the western and southwestern slopes of the major mountain ranges.Owing to the protection afforded by the Annam Mountain Range, the eastern coastal districtsof Vietnam frequently experience periods of weather that are clear and dry. The heavy rainsof summer may cause extensive flooding of low lying areas, particularly the flood plains ofthe major rivers in Cambodia, Thailand, Burma, and South Vietnam. Temperatures duringthe summer monsoon are not exceptionally high on the average, ranging from the higheighties or low nineties durinig the hottest part of the day to the high seventies or low eightiesduring the coolest part of the night in most sections of the region. In the mountains,temperatures are lower, decreasing at a rate of about 3 degrees Fahrenheit for every 1, 000feet increase in elevation.
The northeast or winter monsoon season is characterized by easterly or northeasterlyairflow that brings comparatively cool and dry air into Southeast Asia, particularly thenorthernmost sections of the region. Temperatures during winter are not extreme,generally reaching into the high sixties or low seventies during the afternoon hours, anddropping to the mid-fifties at night in northern sections. In the south and in the peninsularportions of the region, temperatures are some 5 to 10 degrees higher both day and night.Occasional frosts have been experienced in the upland districts of the north, the coldestsection in general. Snowfall is all but unknown throughout the region except perhaps at thehigher elevations In the north. During the winter monsoon, precipitation is heavier and morefrequent along the east coast of Vietnam and in the peninsular portions of Thailand andMalaysia than in other districts. In both these areas, the winter rains are caused bymoisture-laden air arriving at the coasts after lengthy trajectories over relatively largeand warm bodies of water. As the air ascends the slopes of the mountain ranges inland fromthe coasts, condensation takes place, and much cloudiness and rainy weather of the showerytype results. Highest temperatures for the region in general occur during April, a transitionmonth when skies are clear and the air dry. During April, daily max~imum temperaturesfrequently exceed 1000F, and on some occasions 110OF at locations well removed from thecoasts, particularly In Burma and Thailand. Extremes above 1000F are practicallyunknown at coastal sites where the maritime influence prevents undue heating of theatmosphere.
112

APPENDIX E. GOVERNMENT AND OTHER SOURCES
DEPARTMENT OF COM4MERCE
Climatic National Oceanic and Atmospheric Adznin-Data Administration
Environmental Data ServiceWashington, D.C. 20235
Climatic National weather Records CenterData Federal Building
Ashville, N.C.28801
LIBRARY OF CONGRESS
Misc. Maps Chief, Photo Duplications ServiceLibrary of Congress10 First Street, S. E.Washington, DC 20540
Misc. Maps Geography and Maps DivisionLibrary of CongressWashington, DC 20540
Telephone: (202) 370-1261
NATIONAL ARCHIVES AND RECORDS SERVICES
Maps & Carto- Cartographic Archives Divisiongraphic Records National Archives and Records Services
Washington, DC 20408Telephone: (202) 523-3062
U. S. GEOLOGICAL SURVEY
Current & National Cartographic Information CenterHistorical U. S. Geological SurveyTopographic 507 National CenterMaps Reston, VA 22092
Telephone: (703) 860-6045
(Topographic masps, historical topographic maps)
113

APPENDIX F. IMAGERY SOURCES
AERIAL IMAGERY
U.S. GOVERNMENT AGENCIES
Aerial Photography Field Office
Agricultural Stabilization and Conservation ServiceDepartment of AgricultureWestern Laboratory2505 Parleys WaySalt Lake City, Utah 84109 (Source for all states)
Defense Intelligence AgencyATTN: DIAAP-1OWashington, D. C. 20315
World wide survey photography held by DMA11C6500 Brooks LaneWashington, D.C. 20335
Bureau of Land ManagementDepartment of InteriorWashington, D.C. 20240
Cartographic Archives DivisionNational Archives (GSA)Washington, D.C. 20408
EROS Data CenterU.S. Geological SurveySioux Falls, South Dakota 57198
National Cartographic Information Center (Headquarters)Geological SurveyDepartment of InteriorReston, VA 22090
NCIC-Mid-Conti nentUSGS, 1400 Independence Rd.Rolla, Missouri 65401
NCIC-Rocky MountainUSGS, Topographic DivisionStop 510, Box 25046Denver Federal CenterDenver, Colorado 80225
114
NCI C-WesternUSGS, 345 Middlefield Rd.Menlo Park, California 94025
National Ocean SurveyDepartment of CommerceWashington Science CenterRockville, Maryland 20852
Soil Conservation ServiceDepartment of AgricultureFederal Center BuildingEast-West Highway and Belcrest Rd.Hyattsville, Maryland 20781
Tennessee Valley AuthorityMaps and Surveys Branch210 Haney BuildingChattanooga, Tennessee 37401
EASTERN US FOREST SERVICE PHOTOGRAPHY
Chief Forest ServiceU.S. Department of AgricultureWashington, D.C. 20250
WESTERN U.S. FOREST SERVICE PHOTOGRAPHY
Region1 Federal Building, Missoula, MT 598012 Federal Center, Building 85, Denver, CO 800253 Federal Building, 517 Gold Ave. SW, Albuquerque, NM 871014 Forest Service Building, Ogden, UT 844035 630 Sansome St., San Francisco, CA 941116 P.O. Box 8623, Portland, OR 9720810 Regional Forester, U.S. Forest Service, P.O. Box 1628,
Juneau, AK 99801
Technology Application CenterThe University of New Mexico, Code 11Albuquerque, New Mexico 87131
115

STATE AGENCIES
Arizona Highway Department State of WashingtonAdministrative Services Division Department of Natural Resources206 South 17th Avenue 600 North Capitol WayPhoenix, Arizona 85007 Olympia, Washington 98501
State of Arkansas Highway Department Southeast MichiganSurveys, 9500 New Denton Highway Coqncil of GovernmentsP.O. Box 2261 1249 Washington Blvd.Little Rock, Arkansas Detroit, Michigan 48226
State of Nebraska Illinois Department of TransportationDepartment of Roads 2300 South - 31st Street14th & Burnham Streets Springfield, Illinois 62734Lincoln, Nebraska
Southeastern WisconsinState of Ohio Regional Planning CommissionDepartment of Highways 916 North East AvenueColumbus, Ohio 43216 Waukesha, Wisconsin 53186
Oregon State Highway Division Wisconsin Department of TransportationSalem, Oregon 97310 Engineering Services
4802 Sheboygan AvenueVirginia Department of Highways Madison, Wisconsin 53702Location and Design Engineer1401 East Broad Street Indiana Highway DepartmentRichmond, Virginia 23219 608 State Office Building
Indianapolis, Indiana 46204
116

COMMERCIAL FIRMS
Aerial Data Services H. G. Chickering, Jr.
10338 East 21st Street Consulting Photogrammetrist, Inc
Tulsa, Oklahoma 74129 P.O. Box 27671190 West 7th Avenue
Aero Service Corporation Eugene, Oregon 97402
4219 Van Kirk StreetPhiladelphia, Pennsylvania 19135 Fairchild Aeromaps Inc.
14437 North 73rd Street
Air Photographics Inc. Scottsdale, Arizonr 85254
P.O. Box 786Purcellville, Virginia 23132 Grumman Ecosystems Corp.
Bethpage, New York 11714
Alster and Associates, Inc.6135 Kanses Avenue, NE Henderson Aerial Surveys Inc.
Washington, D.C. 20011 5125 West Broad StreetColumbus, Ohio 43228
Ammann International Base Mapand Air Photo Library Walker and Associates Inc.
223 Tenth Street 310 Prefontaine Building
San Antonio, Texas 78215 Seattle, Washington 98104
Burlington Northern Inc. Western Aerial Contractors Inc.
650 Central Building Mahlon Sweet Airport
Seattle, Washington 98104 Route 1, Box 740Eugene, Oregon 97401
Cartwright Aerial Surveys Inc.Executive Airport Murry - McCormick
6151 Freeport Boulevard Aerial Surveys Inc
Sacramento, California 95822 6220 24th StreetSacremento, California 95822
L. Robert Kimball615 West Highland Avenue Photographic Interpretation Corp.
Ebensburg, Pennsylvania 15931 Box 868Hanover, New Hampshire 03755
Lockwood, Kessler & Bartlett, Inc.One Aerial Way Quinn and Associates
Syosset, New York 11791 460 Caredean DriveHorsham, Pennsylvania 13044
Mark Hurd Aerial Surveys, Inc.345 Pennsylvania Avenue South Sanborn Map Company, Inc.
Minneapolis, Minnesota 55426 P.O. Box 61629 Fifth Avenue
Merrick and Company Pelham, New York 10803
Consulting Engineers2700 West Evans The Sidwell Company
Denver, Colorado 80219 Sidwell Park28 W 240 North AvenueWest Chicago, Illinois 60185
117
f ti

Surdex Corporation United Aerial Mapping25 Mercury Boulevard 5411 Jackwood DriveChesterfield, Missouri 63017 San Antonio, Texas 78238
Teledyne Geotronics725 East Third StreetLong Beach, California 90812
CANADA
National Air Photo LibrarySurveys and Mapping Building615 Booth St.Ottawa, Canada KIA OE9
118

GROUND IMAGERY SOURCES
U.S. Army Imagery Interpretation GroupBuilding 213Washington Navy YardWashington, D.C.
Defense Intelligence AgencyATTN: RPP-3Washington, D.C. 20301
U.S. Army DARCOM Service Support ActivityAudio-Visual Presentations DivisionRoom 1C13, PentagonWashington, D.C.
119
'I
I II 11111

APPENDIX G. CONVERSIONS AND EQUIVAL.ENTS
LENGTH*
English1 inch =1,000 mils
I hand =4 inches (In.)1 Gunter's or surveyor's link =0.66 feet = 7.92 inches
1 foot = 12 inchesI yard =3 feet (ML)
1 fathom =6 feetI rod. pole, or perch =5.5 yards (yd.)
1 chain = 4 rods =22 yards = 100 links1 furlong = 10 chains =220 yards
I mile = $furlongs =1.760 yards= S,280 feet
1 international nautical =1,150,779,45 milesmile a 6.076.115.49 feet
Metric1 J.Iimicron =10 ingstr8mas (A)
I micron = 1,000 millamicrons (mVt.)1 millimetre =1,000 Microns (p.)I centimetre = 10 millimetres (mm.)I decimetre =10 centimetres (cm.)
I metre = 10 decimetres (dzz6)I decametre = 10 metres (in.)
1 hectometre =10 decametres (dam.)1 kilometre =10 hectometresa (hm.)
=1,000 metres1 myriametre (mant.) = 10 kilometres (km.)
Conversios -
Basicrelaionsip: 1 inch = 2.54 centimetres, (exactly)1 international nautical mile = 1.852 kilometres (exactly)
1 inch = 2.54 centimetres (exactly)1 centimnetre = 0.393,700,8 inches
1 hand = 10.L16 centimetres (exactly)I link = 206116,8 centimnetres
(exactly)1 centimetre =0.049,709,70 links
I toot = 30. 48 centimetres (exactly)1 metre =3.280.840 feet1 yard 00.914,4 metres (exactly)
I metre 01.093,613 yards1 fathom =1.828,8 metres (exactly)
I me tre CL 0546.806,6 fathoms1 rod, pole, or perch S .029.2 metres (exactly)
1 metre = 0. 198,838, 8 rods, poles, orperches
1 chain = 20.116.8 metres (exactly)1 metre =0.049,709,70 chains
1 furlong = 201.168 metres (exactly)I metre =06004.97%.970 furlongs
1. mile =1.609.344 kilometres(ex actly)
1 kilometre =0.621.371,2 milesI international nautical mile =1.852 kilometres (exactly)
1 kilometre = 0.539.956.8 nautical miles
*Rennie, P. J. ",Meatire for Measure," Canada Dept. of Forestry andRural Development, Publication No. 1195, 196?.
120
S -- _

AREA
EnglishI square link = 0.435,6 square feet
= 62.726.4 square inchesI square foot = 144 square inchesI square yard = 9 square feet
= 1.296 square inchesI mil-aCre = 4.84 square yards
a 100 square links1 square rod. pole, or perch = 30.25 square yards
= 625 square linksI square chain = 16 square rods
z 484 square yards= 10.000 square links
I rood = 40 square rodsI acre = 4 roods = 10 square chains
= 160 square rodsI acre = 4,840 square yards
= 43,560 square feet= 100.000 square links
1 square mile = 640 acres= 3,097,600 squnre yards= 27.878,400 square feet
Metric
I square centimetre = 100 square millimetres1 square metre (centiare) = 10.000 square centimetresI square decametre (are) = 100 square metres
1 hectare = 1O0ares (a.)= 10.000 square metres
I square kiJometre = 100 hectares (ha.)= 1,000.000 square metres
Conversions
Basic relationship:
I inch = 2.54 centimetres (exactly)
1 sq" we inch = 6.451,6 square centimetres
(exactly)I square centimetre = 0.155,000,3 square inches
I square link = 404.685.642.24 squarecentimetres (exactly)
I square centimetre = 0.002,471,054 square links
1 square foot = 0.092,903.04 square metres(exactly)
I square mere= 10.763,910 square feet
I square yard = 0.836.127,36 square metres(exactly)
I square metre = 1.195.990 square yards1 mil-acre = 4.046,856,422,4 square
metres (exactly)I square metre = 0.247,105,4 mil-acres
I square rod, pole, or perch .5.292.852.64 square metretl(exactly)
I square metre = 0.039.536, 86 square rodsI square chain = 404.685,642.24 square
metres (exactly)
I square metre = 0.002.471,054 square chainsI acre = 0.404,685.642,24 hectares
(exactly).I hectare = 2.471.054 acres
I square mile = 2.589,988.110.336 squareRilometres (exactly)
I square kilometre = 0.386.102,2 square miles
121
-7-

t -
laes :per Milesquare inches Square Mikn
1: 500 41.667 24.00 126.72 0.008 12.700 0.0399 25.091 0.000061: 600 50.00 20. 00 105. 60 .009 15.240 .0574 17.424 .000091: 1,000 83.333 12.00 63.36 .016 25.400 .1594 6.273 .000251: 1,200 100.00 100.0 52.80 .019 30.480 .2296 4.356 .000361: 1,500 125.00 80 00 42.24 .024 38.100 .3587 2.788 .000561: 2,000 166.667 6.00 31.68 .032 50.800 .6377 1.568 .001001: 2,400 200.00 5.00 26.40 .038 60.960 .9183 1.089 .00141: 2,500 208 333 4. 80 25.344 .039 63.500 .9964 1.004 .00161: 3, 000 250.00 4.00 21.12 .047 76.200 1.4348 1 697 .00221: 3,600 300.00 3.333 17.60 .057 91. 440 2.0661 484 .00321: 4,000 333.333 3.00 15.84 .063 101.600 2.5508 .392 .00401: 4,800 400.00 2.50 13.20. .076 121.920 3.6731 .272 .00571: 5,000 416. 667 2.40 12.672 .079 127.000 3.9856 .251 .00621: 6. 000 500.00 2.00 10.56 .093 152. 400 5.7392 .174 .00901: 7,000 583.333 1.714 9.051 .110 177.800 7.8117 .128 .01221: 7,200 600.00 1 667 8.80 .114 182.880 8.2645 .121 .01291: 7,920 660.00 1.515 8.00 .125 201. 168 10.00 .100 .01561: 8,000 666.667 1 500 7.92 .126 203.200 10.203 .098 .01591: 8,400 700.00 1.429 7.543 .133 213.360 11.249 .089 .01761: 9,000 750.00 1. 333 7.041 .142 228.600 12.913 .077 .02021: 9,600 800.00 .1.250 6.60 .152 243.840 14.692 .068 .02301: 10,000 833.333 1.200 6.336 .158 1 254.000 15.942 .063 .02491: 10,800 90.00 1.111 5.867 .170 274. 321 18.595 .054 .02911: 12,000 1,000 00 1.0 5. 280 .189 304.801 22.957 .044 .03591 13,200 1,100.00 .909 4.800 .208 335.281 27.778 .036 .04341: 1
4,400 1,200.00 .833 4.400 .227 365.761 33.058 .030 .0517
1: 15,000 1,250.00 .80 4.224 .237 381. 001 35.870 .028 .05601: 15, 600 1,300.00 .769 4.062 .246 396. 241 38.797 .026 .06061: 15, 840 1,320.00 .758 4.00 .250 402.337 40.000 .025 .06251: 16,000 1,333.333 .750 3.96 .253 406. 400 40.812 .024 .06381: 16, 800 1,400.00 .714 3.771 .265 426. 721 44.995 .022 07031: 18.000 1,500.00 .667 3.52 .284 457.201 51.653 .019 .08071: 19,200 1,600.00 .625 3.30 .303 487.68S1 58.770 .017 .09181: 20,000 1,666. 667 .60 3.168 .316 508. 002 63.769 .016 .09961 20,400 1,70000 .588 3.106 .32*2 518. 161 66. 345 .015 10371: 21.120 1,760. 00 .568 3.00 .333 536.449 71.111 .014 .11111: 21,600 1,800.00 556 2.933 .341 548. 641 74,380 .013 .11621: 22,800 1,900.00 .526 2.779 .360 579.121 82.874 .012 .12951: 24,000 2,000.00 .50 2.640 .379 609.601 91.827 .011 .14351: 25,000 O 2,083.333 .480 2.534 .395 635.001 99.639 .010 .15571: 31,680 2,640.00 .379 2.000 .500 804.674 160.000 .006 .25001: 48 000 4 000 00 .250 1.320 .758 1,219.202 367.309 .003 .57391: 62,500. 5: 208.333 .192 1.014 .986 1,587.503 622.744 .0016 .97301: 63,360 5,280.00 .189 1.000 1.000 1,609.347 640.00 .0016 1.00001: 96,000 8,000.00 .125 .660 1.515 2,438.405 1,469.24 .0007 2.29571: .125,000 10,416.667 .096 .507 1.973 3,175.006 2,490.98 .0004 3.89221: 126,720 10, 560. 0 .095 1 500 2. 00 3,218.694 2,560.00 .0004 4.001: 250,000 20 833 333 .048 253 3.946 6,350.012 9,963.907 .0001 15 56861: 253,440 21:120100 .047 .250 4.00 6, 437.389 110 244.202 .0001 16.0
1: 500,000 41,666.667 .024 .127 7.891 12,700.025 39, 855.627 .000025 62.2744I: 1,000,000 83,333.333 .012 .063 15.783 25, 400.050 159,422.507 .0000062 249.0977
*Soil Conservation Service, Aerial-Photo Interpretation in Classifyingand Mapping Soils, USDA Handbook 294, 1966
122

APPENDIX H. EQUIPMENT LIST
Stereoscope, folding pocket type
Masking tape
Mylar, roll 4 ft. wide
Magnification tube
Stapler
Prisma color pencils
Felt tip pens
Ink solvent
Writing pads
Erasers
Pencil s
Light table
Reflecting projector
Large copy camera
Paper cutter
Pre-printed forms (data tables)
123

VI. GLOSSARY
Entries in this section have been selected from MIL-STD-1165, GLOSSARYOF ENVIRONMENTAL TERMS (TERRESTkIAL). Abbreviations, such as (AMS),following the definition of a term, identify the organization providing theauthoritative definition. Definitions for which no source is cited arebased on the draft ENVIRONMENTAL TERMINOLOGY PREPARED by the Department ofthe Navy in 1963, or on comments submitted by military agencies that reviewedvarious drafts on MZL-STD-1165.
Abbreviations appearing in this glossary are as follows:
AD-Department of the Army. Diction- JD-Joint Chiefs of Staff, Dictionarl Ofary of United States Army Terms, United States Military Torw. forArmy Regulation 320-4, Washing- Joint Usage, JCS Pub. 1, G.P.O.,ton, D.C., April 1965. Washington. D.C., I Jan 1966.
ADT-Arctic, Desert, Tropic Information MH-Geological Survey, U.S. Depart-Centr, eseach tudis Istittement of the Interior. General Intro-
CernverRsearc. Glsusr InAtice duction and Hydrologic Definitions,air univrstitc GTe r ofI Pub. by W. B. Langbein and Kathleen T.
A-105 Saxwtic TAr, AT., Spb Iseri, in: Manual of Hydroloy:
1-9,5a5e.AEAl. Sp Part 1. General Surface-Water1955.Techniques, Geological Survey Wa-
AF-Department of the Air Force. Air ter-Supply Paper 1541-A, G.P.O.,Force Glossary of Standardized Washington, 1960.Term and Definition., Air ForceManual No. 11-1, Washington, NASA-National Aeronautics and SpaceD.C., 1 May 1965. Agency. Aeronautical Dictionary,
by Frank D. Adamns, G.P.O., Wash-AFD-Air University, Research Studies ington, D.C., 1959.
institute- The U.S. Air Force Dic-ND-Department of the Navy. N~vsgct-
tholuary, edited by W. A. Heflin, Air gaio Ditoay H-0. Pub. 2X.University Press, 1956. Washington, D.C., 1956.
AMS-Anierican Meteorological Society. NOO-Department of the Navy. GlossaryGlossary of Meteorology, edited by of Oceanographic Terms, NavalR. B. Huschke, Boston, Mass., 1959 ocearpic Oflfe, SP45, 2d ed.,
GS-Geological Survey, U.S. Depart-WainoD..16.ment of the Interior. Glossary of WMO-World Meteorological Organization.Names for Topographic Forms, in: internsational Cloud Atlas, vol. 1.Topographic Instructions, Book 6. Gene-va, 1956.Part 6A, Washington, August 1964.
*Definition paraphrased, or source not quoted entirely.
124

ABSOLUTE MAXIMUM (MINIMUM) AIR-MASS CLASSIFICATION -A systemTEMPERATURE-The highest (low- used to identify and to characterize theest) temperature recorded during the pe- different air masses according to a basicriod of record at a station, scheme. A number of systems have been
ABSOLUTE RANGE OF TEMPERATURE proposed, but the Bergeron classification
- The difference between the highest and has been the most widely accepted. In
lowest temperatures on record at a station. this system, air masses are designated ac-cording to tne thermal properties of theirsource regions: tropical (T); polar (P);
ADVECTION FOG-Fog resulting from the and less frequently, arctic or antarcticmovement of moist air over a cold surface (A). For characterizing the moisture dis-and the consequent cooline of this air to tribution, air masses are distinguished asbelow its dew point. See Sea Fog to continental (c) and maritime (n) source(AMS). regions. Further classification according to
AIR, n. - The mixture of gases comprising the whether the air is cold (k) or warm (w)earth's atmosphere. Since the composition relative to the surface over which it isof the atmosphere is slightly variable with moving indicates the low-level stabilityrespect to certain components, the term conditions of the air, the type of mod-"pure air" has no precise meaning, but it is ification from below, and is also re-commonly used to imply freedom from lated to the weather occurring within thenon-gaseous suspensoids (dust, hydro- air mass. This outline of classificationmeteors) and also freedom from such yields the following identifiers for airgaseous contaminants as industrial masses: cTk, cTw, mTk, mTw, cPk, cPw,effluents. (AMS)* mPk, mPw, cAk, cAw, mAk, mAw; the last
of which is never used. (AMS)*AIRBORNE DUST - Particles of mineral
and other substances, usually of silt size, AIR, MOIST- 1. In atmospheric thermo-suspended in the air, such as those raised dynamics, air that is a mixture of dry airby operation of equipment over dry, loes- and any amount of water vapor. (AMS)sial terrain, or those resulting from dust 2. Generally, air with a high relative hu-storms. midity. (AMS) 3. In environmental engi-
neering, a mixture of air and condensedAIR MASS - A widespread body of air that or entrained beads of airborne water, spe-
is pproximtely homogeneous in its hori- cifically air containing water in the liquidzonta extent, particularly with reference state.to temperature and moisture distribution; AIR PRESSURE -The static pressure ex-in addition, the vertical temperature and erted by air. Although this is a very gen-moisture variations are approximately the eral term, it is best used in cases where asame over its horizontal extent. (AMS)* limited volume of air is concerned, as
within an enclosed space. This term shouldnever be used to denote a dynamic effectsuch as wind pressure. (AMS)
AMBIENT TEMPERATURE - The tem-perature of the air or other medium sur-rounding an object. (NOO)
125

ANEMOMETER, n. - The general name for ARCTIC REGIONS - That portion of theinstruments designed to measure the speed northern hemisphere which is character-(or force) of the wind. These instruments ized by having an average temperature formay be classified according to the means the warmest month of between 32 degreesof transduction employed: those used in Fahrenheit and 50 degrees Fahrenheit.meteorology include the rotation anemnom- These areas generally correspond witheter, pressure-plate anemometer, pressure- those seasonally frozen lands which do nottube anemometer, bridled-cup anemometer, support forest vegetation and include thecontact anemometer, cooling-power ane- adjacent lakes, seas or oceans. (AD)mometer, and sonic anemometer. (AMS)
ARIDITY, n. - The degree to which a cli-ANNUAL RANGE OF TEMPERATURE mate lacks effective, life-promoting mois-
- The difference between the highest and ture; the opposite of humidity, in the cli-lowest temperatures recorded at a station matic sense of the term. (AMS)in any given year.
ATMOSPHERE, STANDARD -A hypo-APPLIED CLIMATOLOGY - The scientific thetical vertical distribution of atmospheric
analysis of climatic data in the light of a temperature, pressure, and density which,useful application for an operational pur- by international agreement, is taken to bepose. "Operational" is interpreted as any representative of the atmosphere for pur-specialized endeavor, within such as inl- poses of pressure altimeter calibrations,dustrial, manufacturing, agricultural or aircraft performance calculations, aircrafttechnical pursuits. This is the general term and missile design, ballistic tables, etc. Thefor all such work and includes agricultural current standard atmosphere is that whichclimatology, aviation climatology, bio- was adopted on 15 March 1962 by theclimatology, industrial climatology, and United States Committee on Extension toprobably others. (AMS) the Standard Atmosphere (COESA). The
U. S. Standard Atmosphere, 1962, up to 32APPLIED METEOROLOGY - The applica- km, has been adopted by the International
tion of current weather data, analyses, and Civil Aeronautical Organization (ICAO).forecasts to specific practical problems. It (AMS)is distinguished from applied climatology,which deals with the similar application of ATMOSPHERE, n. - 1. Meteorol. The en-long-period, statistically treated weather velope of air surrounding the earth anddata. (AMS) bound to it more or less permanently by
virtue of the earth's gravitational attrac-ARCTIC AIR - A type of air whose charac- tion. The earth's atmosphere extends from
teristics are developed mostly in winter the solid or liquid surface of the earth toover arctic surfaces of ice and snow. Arctic an indefinite height, its density asymptotic-air is cold aloft and it extends to great ally approaching that of interplanetaryheights, but the surface temperatures are space. (AMS) * 2. Phy#sics. A unit of pres-often higher than those of polar air. For sure equal to 101,325 newtons per squaretwo or three months in summer arctic air meter (14.70 pounds per square inch), rep-masses are shallow and rapidly lose their resenting the atmospheric pressure of meancharacteristics as they move southward, sea level under standard conditions.(AMS)
126
-a

ATMOSPHERIC DENSITY - The ratio of BLACK-BULB THERMOMETER - Athe mass of the atmosphere (or any part of thermometer whose sensitive element hasit) to the volume occupied by it. This ratio been made to approximate a black body byis greatest at sea level and decreases with covering it with lamp black. The thermom-increasing altitude; it also may vary hori- eter is placed in an evacuated transparentzontally depending on conditions of AT- chamber which is maintained at constantMOSPHERIC TEMPERATURE and AT- temperature. The instrument respondls toMOSPHERIC PRESSURE. It is usually insolation, modified by the transmissionexpressed in grams per cubic meter, al- characteristics of its container. (AMS)though any other unit system may be used. BLC FRS -1.Adyfezwtr-
(AMS) 0spect to its effects upon vegetation, that is,ATMOSPHERIC PRESSURE - The pres- the internal freezing of vegetation unac-
sure exerted by the atmosphere as a Con1- companied by the protective formation ofsequence of gravitational attraction ex- hoarfrost. A black frost is always a killingerted upon the "column" of air lying di- frost, and its name derives from the result-rectly above the point in question. (AMS) * ing blackened appearance of affected vege-Pressure is usually given in millibars tation. (AMS)(mba), inches of mercury, pounds persquare inch, or pounds per square foot. Its BLIZZARD, n, - A severe weather conditionstandard value at sea level is about 14.7 characterized by low temperatures and bypounds per square inch (101,325 newtons strong winds bearing a great amount ofper sq. in.) . snow (mostly fine, dry snow picked up
ATMOPHEIC EMPEATUE -The from the ground). The U.S. Weather Bu-ATMOPHEIC EMPEATUE -The reau specifies, for blizzard, a wind of 32
degree of heat or cold in the envelope of mph or higher, low temperatures, and suf-air surrounding the earth as measured on ficient snow in the air to reduce visibilitysome definite temperature scale (usually to less than 500 ft; and for severe blizzard,CELSIUS or FAHRENHEIT) by means wind speeds exceeding 45 mph, tempera-of any of various types of thermometers. ture near or below 10'F, and visibility re-(AMS) * duced by snow to near zero. (AMS)
BAROMETRIC PRESSURE-Atmospheric BLOWING DUST -Dust picked up locallypressure as indicated by a barometer. This from the surface of the earth and blownatmospheric pressure is the pressure eU- about in clouds or sheets. It may completelyerted by the atmosphere as a consequence obscure the sky; in its extreme form it is aof gravitational attraction exerted upon the dust storm. (AMS)"column" of air lying directly above thepoint in question. (AMS) *BLOWING SAND-Sand picked up from the
surface of the earth by the wind and blown
BEAUFORT WIND SCALE - A system of about in clouds or sheets. In its extremeestimating and reporting wind speeds, in. form, blowing sand constitutes a sandvented in the early nineteenth century by storm. (AMS)Admiral Beaufort of the British Navy. In BLOWING SNOW - Snow lifted from theits present form for international meteor- surface of the earth by the wind to a heightological use it equates (a) Beaufort force of six feet or more above the surface (high-(or Beaufort number), (b) wind speed, er than drifting snow), and blown about in(c) descriptive term, and (d) visible ef- such quantities that horizontal visibility isfects upon land objects or sea surface. As restricted at and above that height. Blow-originally given, Beaufort numbers ranged ing snow is one of the classic requirementsfrom 0, calm, to 12, hurricane. They have for a blizzard. (AMS)now been extended to 17. (AMS)
127

BREEZE, n. - 1. Wind of force 2 to 6 (4-31 CELSIUS TEMPERATURE SCALE-Same
miles per hour or 4-27 knots) on the Beau- as CENTIGRADE TEMPERATURE
fort scale. Wind of force 2 (4-7 miles per SCALE, by recent convention. The Ninth
hour or 4-6 knots) is classified as a light General Conference on Weights and Meas-
breeze; wind of force 3 (8-12 miles per urea (1948) replaced the designation "de-
hour or 7-10 knots), a gentle breeze; wind gree centigrade" by "degree Celsius."
of force 4 (13-18 miles per hour or 11-16 (Originally, Celsius took the boiling point
knots), a moderate breeze; wind of force 5 a" 0 degrees and the ice point as 100 de-
(19-24 miles per hour or 17-21 knots) a grees.) (AMS)
fresh breeze; and wind of force 6 (25-31 CENTIGRADE TEMPERATURE SCALEmiles per hour or 22-27 knots), a strong -A temperature scale with the ice pointbreeze. 2. Any light wind. A land breeze at 0 degrees and the boiling point of water
flows from the land to the sea, and usually at 100 degrees. Conversion to the Fahren-alternates with a sea breeze blowing in the heit temperature scale is according to theopposite direction. A mountain breeze blows formuladown a mountain slope due to gravity flow ° .A- . (-F - 32). (AMS)of cooled air, and a valley breeze blows up 9a valley or mountain slope because of thewarming of the mountainside and valleyfloor by the sun. A puff of wind, or light CLIMATE, n. - The long-term manifesta-
breeze affecting a small area, may be called tions of WEATHER, however they may be
a cat's paw. Absence of wind is sometimes expressed. More rigorously, the climate of
called ash breeze. (ND) a specified area is represented by the sta-tistical collective of its weather conditionsduring a specified interval of time (usuallyCALM, a. - The absence of apparent motion several decades). (AMS)*
of the air. In the Beaufort wind scale, this
condition is reported when smoke is ob- CLIMATIC SNOW LINE - The altitudeserved to rise vertically, or the surface of above which snow accumulates in excess ofthe sea is smooth and mirror-like. In United wastage. Also called regional snow line, andStates weather observing practice, the wind flrn line when referable to a glider or ice
is reported as calm if it is determined to cap. The climatic snow line snecifically ap-have a speed of less than one mile per hour plies to flat surfaces fully exposed to sun(or one knot). (AMS) and wind; however, most glaciologists con-
sider the precise application as theoretical,
CEILING, n. -The height above the earth's rarely observable in nature. (ADT).surface of the lowest layer of the cloudsor obscuring phenomena that is reported CLIMATOLOGY, n. - The scientific study ofas broken, overcast, or obscuration, and climate. In addition to the presentation ofnot classified as thin or partial. (ND) climatic data (climatography), it includes
CEILING LIGHT - A type of cloud-height the analysis of the causes of differences of
indicator which uses a searchlight to pro- climate (physical climatology), and the ap-
ject vertically a narrow beam of light ontoa cloud base. The height of the cloud base CLOUD, n. - 1. A hydrometeor consisting ofis determined by using a clinometer, 1o. a visible aggregate of minute water and/orcated at a known distance from the ceiling ice particles in the atmosphere above thelight, to measure the angle included by the earth's surface. Cloud differs from FOGilluminated spot on the cloud, the observer, only in that the latter is, by definition, inand the ceiling light. (AMS) contact with the earth's surface. (AMS)*
2. Any collection of particulate matter in
the atmosphere dense enough to be percepti-ble to the eye, as a dust cloud or a smoke
cloud. (AMS)128

CLOUD BANK - Generally, a fairly well de- CONDUCTION, n. - The transfer of energyfined mass of cloud observed at a distance; within and through a conductor by meansit covers an appreciable portion of the hori- of internal particle or molecular activity,zon sky, but does not extend overhead, and without any net external motion. Con-(AMS) duction is to be distinguished from convec-
CLOUDBURST, n. - A sudden and extreme- tion (of heat) and radiation (or all electro-lhevdonorof rain. (ND) magnetic energy). Heat is conducted by mo-
ly havydownourlecular motion within a few centimeters of
COLDDRY- I miitar clmatlog. athe heat source (e.g., the earth's surface).
weather condition in which cold, or very soure disraccoomplihet by oveton tadcold temperatures are unaccompanied by (inrc analoc o mlsecular conduction) bydwet precipitation or wetness on the ground, eddy heaoto eua conduction. (AM)yexcept that dry snow may be falling or dryedyhacoutin AS*
snow or ice may be underfoot. (ADT) * CONTINENTAL AIR - A type of air whose
COLD SOAK - The effect of exposing equip-. characteristics are developed over a largement to low temperatures for an extended land area and which, therefore, has theperiod of time. Cold soak of engines some_ basic continental characteristic of relative-times necessitates preheating before their ly low moisture content. (AMS)use, as lubricants have thickened, metal has CONTINENTAL CLIMATE - The climatebecome brittle, and tolerances have dimin- that is characteristic of the interior of aished. (ADT) * land mass of continental size. It is marked
COLDWET- 1.Miltarycliatol A ea- by large annual, daily, and day-to-dayCOLD WEndtio in wiiar clmtold, Ar ver- ranges of temperature, low relative humid-
cold temperatures are acompanied by rain, itand rr erraall. Th annuleteresmeslfog, or wet snow in the air and by the pres- ofd teperare occurll sonafeThe aol-xreeence of water, wind, slush, or wet snow on Oftiempraur ocursonMS)rth'sthe ground. (ADT) * 2. Physiol. An envi- ftcs A Sronmental condition in which clothing is es- CONVECTION, n. - 1. Mass motions withinsential to prevent the loss of body heat from
excedin th proucton f meaboic eat a fluid resulting in transport and mixing ofwexedng the producion cofmiaetaboli hea the properties of that fluid. Convection,wheencte poblte is compicae by udrot along with conduction and radiation, is apresecet ofloturein thecary ounfootr principal means of energy transfer.whih ts ltig secal o er (AMS) * 2. Meteorol. Atmospheric motions
(ADT)*that are predominantly vertical, resulting
CONDENSATION, n.-The physical process mn vertical transport and mixing of atmo-by which a vapor becomes a liquid or solid; spheric properties; distinguished from ad-the opposite of evaporation. In meteorologi- vection. (AMS) *3. Atmospheric Electric-cal usage, this term is applied only to the ity. A process of vertical charge transfertransformation from vapor to liquid; any by transport of air containing a net spaceprocess in which a solid forms directly from charge, or by motion of other media (e.g.its vapor is termed sublimation, as is the rain) carrying net charge. Eddy diffusionreverse process. In meteorology, condensa. of air containing a net charge gradient maytion is considered almost exclusively with also yield a convection current. (AMS)reference to water vapor which changes todew, fog, or cloud. It is indispensable toavoid confusing condensation with precipi-tationi, for the former is by no means equiv-alent to the latter, though it must alwaysprecede the latter. (AMS)*
129
Nor

COOLING PROCESSES, MAJOR - Air temperature DAILY MEAN-i. The average value of ais decreased by all or any of the fol- meteorological element over a period oflowing processes: twenty-four hours. The "true daily mean"
(1) nocturnal cooling. The earth continuously is usually taken as the mean of twenty-fourradiates it heat outward toward space. During the hourly values between midnight and mid-night (or at any time when outgoing radiation from night, either as continuous values takenthe earth exceeds incoming solar radiation) the loss from an autographic record or as pointof radiant energy lowers the temperature of the readings at hourly intervals. When hourlyearth's surface. The air temperature is thereafter values are not available, approximationsreduced by conduction. must be made from observations at fixed
(2) advective cooling. hours. (AMS) 2. The long-period meana. When the windflow is such that cold air value of a climatic element on a given day
moves into an area previously occupied by warmer of the year. (AMS)air, the temperature of the air over the area is de-creased. With a strong, cold wind prevailing, the DAY WITH PRECIPITATION -A day inadvective cooling may be sufficient to cause a tem- which the total precipitation received equalsperature decrease in an area even though the sur- or exceeds a specified amount (in U.S., wa.face is absorbing solar radiation. ter equivalency - .01 in.).
b. Warm air advection over a colder surfacewill result in conductive cooling of the lower air DEGREE DAY - 1. Generally, a measure oflayers. the departure of the mean daily tempera-
(3) evaporative cooling. When rain or drizzle ture from a given standard: one degree dayfalls from clouds, the evaporation of the waterdrops cools the air through which these drops are DEGREE HOUR -As used by the U. S.falling. Similar evaporative cooling occurs when- orp of us, the ureever liquid water is changing to vapor, thereby Army Corps of Engineers, the departuretaking latent heat energy from the environment. (in 0 F) of the hourly temperature from a
(4) adiabatic cooling. The process by which air standard of 320F, positive if above and neg-cools due to decrease in pressure. If air is forced ative if below. Degree hours may be accum-upward in the atmosphere, the resulting decrease ulated (summed) over any period of time,in atmospheric pressure surrounding the rising air depending upon the use to which they areallows the air to expand and cool adiabatically. applied. (AMS)Weather produced by lifting processes is the result DEGREES OF FROST - The number of de.of adiabatic cooling, e.g., frontal weather, convec- grees that the temperature falls below 32°Ftive, and orographic thunderstorms, and upslope or 0°C, the freezing point. (ADT)fog.
CYC LONE, n.- A closed system of low at- DENSITY ALTITUDE - The height abovemospheric pressure around which the winds sea level at which the existing density ofblow counterclockwise in the northern hemi- the atmosphere would be duplicated in theblowre, cnteclockwise in the sorthern hemi- standard atmosphere; atmospheric densitysphere, and clockwise in the southern hemi- ~hih codn oasadr
sphere. Because cyclones nearly always are scre. (ND)
accompanied by inclement weather, they are
frequently referred to simply as storms.(AMS)*
130

DIRECTION OF WIND - The directionDEPRESSION, n- I. Meteorol. An area of from which a wind is blowing. (ND)
low pressure; a low or a trough. This is us-
ually applied to a certain stage in the devel-
opment of a tropical cyclone, to migratory DIURNAL, adj. - Daily, especially pertain-
lows, and troughs, and to upper-level lows ing to actions which are completed within
and troughs that are only weakly developed, twenty-four hours and which recur every
(AMS) " 2. Geomorph. A low place of any twenty-four hours; thus, most reference is
size on a plain surface, with drainage un- made to diurnal cycles, variations, ranges,
derground or by evaporation; a hollow corn- maxima, etc. (AMS)*
pletely surrounded by higher ground andhaving no natural outlet for surface drain- DOWNWIND, adi. & adv. - In the directionage. (GS) toward which the wind is blowing. The term
applies particularly to the situation of mov-
DESERT, n. - A region where precipitation ing in this direction, whether desired or
is insufficient to support any plant life ex- not. Before the wind implies assistance
cept xerophilous vegetation; a region of from the wind in making progress in a de-
extreme aridity. W. Koeppen, in his climatic sired direction. Leeward applies to the dl-
classification, defines a desert CLIMATE rection toward which the wind blows, with-
(designated BW) by assigning maximum out implying motion. The opposite is up-
values of annual precipitation as follows: wind. (ND)for precipitation mainly in cold season,
p - 0.22 (t-32) ; DRIFTING SAND-An ensemble of parti-
for evenly distributed precipitation, des of dust or sand raised from the ground
p - 0.22 (t-19.4) ; to small or moderate height by a sufficiently
for precipitation mainly in the hot season, strong and turbulent wind. (WMO)*
p - 0.22 (t-6.8) ; DRIFTING SNOW - Snow particles beingwhere p is the mean annual precipitation in blown about close to the ground (less than 6Inches, and t is the mean annual tempera- feet above the surface), differing fromture in OF. (AMS) * blowing snow in that vertical visibility is
not appreciably affected. (ADT)"
DEW, n. - Water condensed onto grass and
other objects near the ground, the tempera- DRIZZLE, n. - Fairly uniform precipitation
tures of which have fallen below the DEW composed exclusively of fine drops of water
POINT of the surface air due to radiational (diameter less than 0.5 mm or 0.02 in.),
cooling during the night, but are still above very close to one another. (WMO)"
freezing. If the temperature falls below DROPLET (or DROP) - A small sphericalfreezing after dew has formed, the frozen particle of any liquid; in meteorology, par-dew is known as white dew. (AMS) *ticularly a water droplet. There is no defined
DEW POINT - The temperature to which a size limit separating droplets from drops of
given weight of air must be cooled at con- water, but it is sometimes onvenient to de-
stant pressure and constant water-vapor note two disparate size ranjes, such as the
content in order for SATURATION to oc- oft-used distinction of liquiv cloud parti-
cur. When this temperature is below 0°C, cles (droplets) from liquid precipitation
it is sometimes called the frost point. (drops), thereby implying Uit a maximum
(AMS) diameter of 0.2 mm is the l.-nit for droplets.(AMS)
131

DUST, n. - 1. Solid materials suspended in FISHTAIL WIND - Wind that is constantlythe atmosphere in the form of small irregu- changing eiirection back and forth. (AD)lar particles, many of which are micro-scopic size. Dust is due to many natural and FLURRY, n. - A brief shower of snow ac-artificial sources: volcanic eruptions, salt companied by a gust of wind, or a sudden,spray from the seas, blowing solid particles, brief wind squall. (ND)plant pollen and bacteria, smoke and ashesof forest fires and industrial combustionprocesses, etc. (AMS) *2. Particles smaller FOEHN (or FOHN), n. - A warm, dry windthan 75 microns in diameter. on the lee side of a mountain range, the
warmth and dryness of the air being due toDUST STORM - An unusual, frequently se- adiabatic compression upon descending the
vere weather condition characterized by mountain slopes. The foehn is characteris-strong winds and dust-filled air over an ex- tic of nearly all mountain areas. It is as-tensive area. A thick mass of airborne -dust sociated with cyclonic-scale motions, beingmay obscure the atmosphere to the extent produced only when the circulation is suf-that it reduces visibility very considerably ficiently strong and deep to force air com-- sometimes practically to zero. (AMS) *pletely across a major mountain range in a
DUSTWHIL - raidlyrottin coumnshort period of time. In different mountainof air, usually about 100 to 300 feet in theginOOo the fenhsavrieky onais.aheight, carrying dust, straw, leaves, or thCHNO ofheRcyMuaisother light material. It has no direct rela- (AMS) *tionship to a dust storm, and usually de- FOG, n. - A hydrometeor consisting of a vis-velops on a calm, hot afternoon with clear ible aggregate of minute water dropletsskies, mostly in desert regions. (ND) * suspended in the atmosphere near theAlso called dust devil. earth's surface. According to international
definition, fog reduces visibility below oneEXTRMEn. -In limaoloy, te hgh-kilometer (0.62 mile). Fog differs from
etREM, in. so In climtog, the high-vlu o cloud only in that the base of fog is at theat ciadin soemen casevted lowest avaleno earth's surface while clouds are above theapciaic elmnosre during a givenm thoseon surface. When composed of ice crystals, itpod ora dring. af ghive mnth wore season is termed ice fog. (AMS) * See also AD-
of hatpeiod Ifths i th woleperodVECTION FOG, GROUND FOG, RADIA-for which observations are available, it is TION FOG.the absolute extreme, (AMS)
FRONT, n. -In meteorology, generally, theinterface or transition zone between two
FIRST-ORDER CLIMATOLOGICAL STA- AIR MASSES of different density. SinceTION - As defined by the World Meteoro- the temperature distribution is the most im-logical Organization (1956), a meteorologi- Portant regulator of atmospheric density, acal station at which autographic records or front almost invariably separates airhourly readings of atmospheric pressure, masses of different temperature. Alongtemperature, humidity, wind, sunshine, and with the basic density criterion and theprecipitation are made, together with common temperature criterion, many otherobservations at fixed hours of the amount features may distinguish a front, such as aand form of clouds and notes on the pressure trough, a change in wind direction,weather. (AMS) a moisture discontinuity, and certain char-
acteristic cloud and precipitation forms.(AMS)
132

FROST, n. - 1. A feathery deposit of minute GROUND FOG-According to United Statesice crystals or grains upon a surface or ob- weather observing practice, a fog thatject, formed directly from vapor in the air. hides less than 0.6 of the sky, and does not(AFD) 2. The process by which such ice extend to the base of any clouds that maycrystals are formed. (AFD) 3. Any teni- lie above it. (AMS)perature at which frost forms. Frost oftenforms when the close lying air is above 32*F, especially in calm, clear weather when GROUND FROST-A freezing condition in-radiation or evaporation reduces a surface jurious to vegetation, which is consideredtemperature to a point of freezing or below, to have occurred when a thermometer ex-(AFD) posed to the sky at a point just above a
grass surface records a minimum temper-FROST LINE -The mainum depth of ature (grass temperature) of 30.40 F. or
frozen ground during the winter. The term below. (AMS)may refer to an individual winter, to theaverage over a number of years, or to the GUST, n. - A sudden brief increase in thegreatest depth recorded since observations speed of the wind. It is of a more transientbegan. The frost line varies with the nature character than a SQUALL and is followedof the soil and the protection afforded by by a lull or slackening in the wind speed.vegetal ground cover and snow cover, ,a Generally, winds are least gusty over largewell as with the amount of seasonal cooling, water surfaces and most gusty over rough(AMS) land and near high buildings. According
to United States weather observing prac-GALE, n. - 1. In general, and in popular
use, an unusually strong wind. (AMS) HAIL, n. - Precipitation in the form of small2. In storm-warning terminology: moder- balls or pieces of ice (hailstones) with aate ga~le, 28 to 33 knots; fresh gale, 34 to diameter ranging from 5 to 50 mm (0.2 to40 knots; strong gale, 41 to 47 knots; and 2.0 in.) or sometimes more, falling eitherwhole gale, 48 to 55 knots. (AMS) *separately or agglomerated into irregular
lumps. Hail falls are generally observed
GLAZE, n.-A coating of ice, generally clear during heavy thunderstorms. (WMdO)
and smooth but usually containing some HAILSTONE, n. - A single unit of hail,air pockets, formed on exposed object& by ranging in size from that of a pea to that ofthe freezing of a film of supercooled water a grapefruit (i.e., from less than '/& inch todeposited by rain, drizzle, fog, or possibly more than 5 inches diameter). Hailstonescondensed from supercooled water vapor. may be spheroidal, conical, or generally ir-Glaze is denser, harder and more transpar- regular in shape. The spheroidal stones, theent than either RIME or HOARFROST. most common form, typically exhibit a lay-Its density may be as high as 0.8 or 0.9 gm ered interior structure resembling an onion,per cm$. Factors which favor glaze forma- with alternate layers composed of GLAZEtion are large drop size, rapid accretion, and RIME. (AMS)
133
HEAT WAVE-A period of abnormally and HYDROMETEOR, n. - Any product of con-uncomfortably hot and usually humid densation or sublimation of atmosphericweather. To be a "heat wave" such a per- water vapor, whether formed in the freeiod should last at least one day, but con- atmosphere or at the earth's surface; also,ventionally it lasts from several days to any water particles blown by the windseveral weeks. (AMS) from the earth's surface. (AMS)*
HIGH, n. - In meteorology, elliptical for ICE FOG - A type of fog, composed of sus-"area of high pressure" referring to a pended particles of ice, partly ice crystalsmaximum of atmospheric pressure in two 20 to 100 microns in diameter but chiefly,dimensions (closed isobars) in the synop- especially with dense, tiny ice particles 12tic surface chart, or a maximum of height to 20 microns in dianeter. It occurs at very(closed contours) in the constant-pressure low temperatures, and usually in clear,chart. Since a high is, on the synoptic calm weather in high latitudes. Also calledchart, always associated with anticyclonic frozen fog, pogonip, etc. (AMS)'circulation, the term is used interchange-ably with ANTICYCLONE. Compare ICE FROST -Specifically, a thickness ofLOW. (AMS) ice that gathers on the outside of a rocketvehicle over surfaces supercooled by liquid
oxygen inside the vehicle. This ice frost isHOARFROST, n. - b A deposit of interlock- quickly shaken loose and falls to the grounding ice crystals formed by direct SUBLI- once the vehicle begins its ascent. (AF)MATION on objects, usually those of smalldiameter freely exposed to the air, such astree branches, plant stems and leaf edges, ICE PELLETS - Precipitation of transpar.wires, poles, etc. Also, frost may form on ent or translucent pellets of ice, which arethe skin of an aircraft when a cold air- spherical or irregular, rarely conical, andcraft flies into the air which is warm and which have a diameter of 5 mm (0.2 in.)moist or when it passes through air that or less. Ice pellets include SLEET (U. S.is supersaturated with water vapor. The definition) and SMALL HAIL. (WMO)deposition of hoarfrost is similar to theprocess by which DEW is formed, except INSOLATION, n.-l. In general, solar radi-that the temperature of the befrosted ob- ation received at the earth's surface.ject must be below freezing. (AMS)* (AMS) 2. The rate at which direct solar
radiation is incident upon a unit horizontalHUMID TROPICS - Those areas in which surface at any point on or above the sur-
the average temperature of the coldest face of the earth. (AMS)month is above 64.4 degrees Fahrenheit INSTRUMENT SHELTER - A box-likeand the annual rainfall rate exceeds the structure designed to protect certain mele-annual evaporation rate. These lands are orological instruments from exposure tocharacterized by rainforest, jungle, and direct sunshine, precipitation, and conden-savanna vegetation. (AD) sation, while at the same time providing
adequate ventilation. Instrument sheltcrsHUMIDITY, n.-The amount of water vapor are painted white, have louvred sides,in the air. (ND) See ABSOLUTE HU- usually a double roof, and are mouited onMIDITY. RELATIVE HUMIDITY, and a stand several feet above the grourd withSPECIFIC HUMIDITY. the door side facing poleward. (AMS)*
134

INTERTROPICAL CONVERGENCE ZONE KNOT, n. - The unit of speed in the nautical-The axis, or a portion thereof, of the system; one nautical mile per hour. It isbroad trade-wind current of the tropics. equal to 1.1508 statute miles per hour orThis axis is the dividing line between the 0.51" meters per second. (AMS)southeast trades and the northeast trades(of the Southern and Northern Hemis-phere, respectively). (AMS) LAPSE RATE -The decrease of an atmo-
spheric variable with height, the variableISALLOBAR, n. - A line of equal change being temperature, unless otherwise sped-
in atmospheric pressure during a specified fned. (AMS)time interval; an isopleth of pressure ten-dency. (AMS) * LENGTH OF RECORD - The period during
ISOBAR, n. - A line of equal or constant which observations have been maintainedpressure; an isopleth of pressure. In mete- at a meteorological station, and whichorology, it most often refers to a line serves as the frame of reference for clina-drawn through all points of equal atmos- tic data at that station. The standard lengthpheric pressure along a given reference of record for the purpose of a normal hassurface, such as a constant-height surface been fixed by the World Meteorological Or-(notably mean-sea-level on surface charts). ganization as thirty years, which is a fair(AMS) * practical average for the length of a homo-
ISOHYET. n.- A line drawn through geo- geneous record desirable for most of thegraphical points recording equal amounts meteorological elements. (AMS)*of precipitation during a given time period MARITIME AIR - A type of air whoseor for a particular storm. (AMS) characteristics are developed over an ex-
tensive water surface and which, there-ISOPLETH, n. - 1. A line of equal or con- fore, has the basic maritime quality of
stant value of a given quantity, with re- high te c atit leait o
spect to either space or time. (AMS) * 2. leve s (n as)
A line drawn through points on a graphat which a given quantity has the same MEAN ANNUAL RANGE OF TEMPERA-numerical value (or occurs with the same TURE - The difference between the abso-frequency) as a function of the two co- lute maximum and minimum temperaturesordinate variables. (AMS) 3. A straight for a year, averaged over a given numberline along which lie corresponding values of years.of a dependent and independent variable.(Al(S) MEAN DAILY MAXIMUM (MINIMUM)
TEMPERATURE- Average of the max-imum (minimum) temperatures for each
ISOTHERM, n. - A line of equal or constant day within a given period, usually a month,temperature. (AMS) over a period of years.
MEAN HOURLY TEMPERATURE - Av-KATABATIC WIND - 1. Any wind blow- eroge of the daily temperatures at a given
ing down an incline; the opposite of ana- hour for an indicated period, generally abatic wind. If the wind is warm, it is called a month, averaged over a period of years.FOEHN; if cold, it may be a fal wind (such MEAN MONTHLY CLOUDINESS -Aver-
as the bora), or a gravity or drainage wind e o the m ver-(such as a mountain wind). (AMS)"* age of the mean cloud cover of each daywithin a month, averaged over a period ofyears.
135
-- - - - --
_ z .. _ : z - , , . .. . . . . . . ... ." . " '2S
MEAN MONTHLY DEWPOINT-Averag MIST, n. - . According to international def-of the mean dewpoints of each day (gen-erally computed from observations taken inition: a HYDROMETEOR consisting ofat equal time periods of 6 hours or less an aggregate of microscopic and more-or-at eualtim peiod of6 hursor ess less HYGROSCOPIC water droplets &u&-apart) within a month, averaged over aperiod of years. pended in the atmosphere. It produces, gen-
erally, a thin grayish veil over the land-MEAN MONTHLY MAXIMUM (MINI- scape. It reduces visibility to a lesser extent
MUM) TEMPERATURE - The highest than FOG. RELATIVE HUMIDITY with(lowest) temperature for a month, aver- mist is often less than 96 percent. Mist isaged over a period of years. intermediate in all respects between HAZE
MEAN MONTHLY RELATIVE HUMIDI- and fog. 2. In popular usage in the UnitedTY -Average of the mean relative hu- States, same as DRIZZLE. (AMS)midities for each day of the month, aver-aged over a period of years. MONSOON, n. - A name for seasonal winds
MEAN MONTHLY TEMPERATURE-Av- (derived from Arabic mausim, a season).e rase of the mean temperatures of each It was first applied to the winds over theday within e month, averaged over f per- Arabian Sea, which blow for six months
iod of years. Some weather services require from northeast and for six months fromthat a prescribed length of record be avail- southwest, but it has been extended to
able before "mean" is used. similar winds in other parts of the world.The primary cause is the much greaterannual variation of temperature over large
METEOROLOGICAL DATA - Meteorolog- land areas compared with neighboringical facts pertaining to the atmosphere, ocean surfaces, causing an excess of pres-such as wind, temperature, air density and sure over the continents in winter and aother phenomena which affect military deficit in summer, but other factors suchoperations. (JD) as the relief features of the land have a
METEOROLOGY, n. - The study dealing considerable effect. In India the term iswith the phenomena of the atmosphere. popularly applied chiefly to the southwestThis includes not only the physics, chem- monsoon and, by extension, to the rainsistry, and dynamics of the atmosphere, but which it brings. (AMS)*is extended to include many of the directeffects of the atmosphere upon the earth's MOUNTAIN AND VALLEY WINDS- Asurface, the oceans, and life In general. system of diurnal winds along the axis ofThe goals often ascribed to meteorology a valley, blowing uphill and upvalley byare the complete understanding, accurate day, and downhill and downvalley byprediction, and artificial control of atmos- night; they prevail mostly in calm, clearpheric phenomena. (AMS) weather. The upvalley component or valley
wind is due to the temperature differenceMILLIBAR, n. - A unit of pressure equal between tht air heated over the slopes and
to 1,000 dynes per square centimeter, or that at the same -height in the free air. The1/1,000 of a BAR. The millibar is used as downvalley component or mountain winda unit of measure of atmospheric pressure, at night is due to nocturnal cooling and isa standard pressure, a standard atmos- somewhat weaker, up to 9 mph. (AMS)*phere being equal to 1,018.25 millibars or22.92 inches of mercury. (ND)
136

OROGRAPHIC PRECIPITATION - Preci- RAINDROP, n.- A drop of water of diam-pitation which results from the lifting of eter greater than 0.5 mm falling throughmoist air over an orographic barrier such the atmosphere. In careful usage, fallingas a mountain range. Strictly, the amount drops with diameters lying in the intervalso designated should not include that part 0.2 to 0.5 mm are called drizzle drop rath-of the precipitation, which would be ex- er than raindrops. (AMS)pected from the dynamics of the associatedweather disturbance, were the disturbance RAINFALL FREQUENCY - The numberover flat terrain. (AMS) * of times, during a specified period of years,
that precipitation of a certain magnitude
POLAR REGIONS - Those parts of the or greater occurs or will occur at a station.
earth's surface which have an average tem- (AMS) *perature of the warmest month of less than32 degree Fahrenheit. (AD) RAIN, FREEZING - Rain that falls in liq-
uid form but freezes upon impact to forma coating of GLAZE upon the ground and
PREVAILING WIND DIRECTION - The on exposed objects. When encountered bywind direction most frequently observed an aircraft in flight, freezing rain canduring a given period. The periods most cause a dangerous accretion of CLEARfrequently used are the observational day, ICING. (AMS)*month, season, and year. (AMS)' *RAIN SHADOW - The region, on the lee
RADIATIONAL COOLING -In meteorolo- side of a mountain or mountain range,
gy, the cooling of the earth's surface and where the precipitation is noticeably less
adjacent air, accomplished (mainly at than on the windward side. (AMS)*
night) whenever the earth's surface suffersa net loss of heat due to TERRESTRIAL RELATIVE HUMIDITY- 1. The ratio, ex-RADIATION. (AMS) pressed in percent, of the amount of water
vapor in a given volume of air to theRADIATION FOG - A major type of FOG, amount the volume of air would contain if
produced over a land area when RADIA- saturated. (MIL-STD 210A) 2. The ratio,TIONAL COOLING reduces the air tern- expressed in percent, of the actual partialperature to or below its DEW POINT. pressure of the water vapor in a givenThus, a strict radiation fog is a nighttime mixture of air and water vapor to the sat-occurrence, although it may begin to form uration pressure of pure water at the sameby evening twilight and often does not temperature. (NASA)dissipate until after sunrise. (AMS)*
RESULTANT WIND -In climatology, theRAIN, n. - PRECIPITATION of liquid wa- vectorial average of all wind directions
ter particles, either in the form of drops and speeds for a given level at a given placeof more than 0.5 mm. (0.02 in.) diameter for a certain period, as a month. (AMS)or of smaller widely scattered drops. SeeHYDROMETEOR. (WMO) RIME, n. -A white or milky and opaque
granular deposit of ice formed by the rapidfreezing of supercooled water drops asthey impinge upon an exposed object(AMS)
137

RIME, HARD - Opaque, granular masses ofRIME deposited chiefly on vertical sur- Note: Smog, . term coined in 1905 byIDeeVoeux, originally meant a mixture of fog
faces by a dense supercooled fog. Hard ad smoke. Although the term has expe-rime is more compact and amorphous than renced a recent rise in acceptance, so farSOFT RIME, and may build out into the it has not been given precise definition.wind as glazed cones or feathers.(AMS)* (AMS)
RIME, SOFT - A white, opaque coating of SMOKE, n. - Foreign particulatefine RIME deposited chiefly on vertical matter in the atmospheresurfaces, especially on points and resulting from combustiondeges of objects, generally in super- processes; a type of LITHOMETEOR.cooled fog. (AMS)* When smoke is present, the disk
of the sun at sunrise and sunsetSEA BREEZE - A coastal local wind that appears very red, and during the
blows from sea to land, caused by daytime has a reddish tinge.the temperature difference when the (AMS)*sea surface is colder than the adjacentland. Therefore, it usually blows on SNOW, n. - PRECIPITATION composedrelatively calm, sunny days, and al- of white or translucent ICEternates with the oppositely directed, CRYSTALS, chiefly in complexa nighttime land breeze. (AMS)* branched hexagonal form and
often agglomerated into SNOW-SEA FOG - A type of ADVECTION FOG FLAKES. See HYDROMETEOR. (AMS)*
formed when air that has been lying
over a warm water surface is trans- SNOW ACCUMULATION (or SNOW DEPTH)ported over a colder water surface, The actual depth of snow on theresulting in cooling of the lower ground at any instant during alayer of air below its dew point, storm, or after any single snow-(AMS) storm or series of storms. (AMS)
SEA-LEVEL PRESSURE - The ATMOSPHERIC SNOW COVER - 1. The areal extentPRESSURE at MEAN SEA LEVEL, either of snow-covered ground, usuallydirectly measured or, most commonly, expressed as percent of totalempirically determined from the area in a given region. (AMS)observed station pressure. (AMS)* 2. In general, a layer of snow
on the ground surface. (AMS)SHOWER, n. - Precipitation from a con- 3. The depth of snow on the
vective cloud. Showers are charact- ground, usually expressed inerized by the suddenness with which inches or centimeters. (AMS)they start and stop, by the rapidchanges of intensity, and usually by SNOW DENSITY - The ratio betweenrapid changes in the appearance of the volume of melt water derivedthe sky. (AMS)* from a sample of snow and the
initial volume of the sample.SMOG, n. - A natural FOG contaminated This is numerically equal to the
by industrial or other pollutants, specific gravity of the snow.often occurring over urban areas See WATER EQUIVALENT OF SNOW.(MH)during the prevalence of TEMPERA-TURE INVERSIONS.
138
. . ... .

SNOW DRIFT, n. - Snow deposited behind particularly in the Northernor in front of obstacles or irreg- Hemisphere winter. (AMS)ularities of the surface, or col-lected in heaps by eddies in the SNOW PELLETS - Precipitation con-wind. (AMS)* sisting of white, opaque, approx-
imately round (sometimes conical)SNOWFIELD, n. - 1. Generally, an exten- ice particles having a snow-like
sive area of snow-covered ground or structure, and about 2 to 5 mm inice, relatively snooth and uniform diameter. Snow pellets are crispin appearance and composition. This and easily crushed, differing interm is often used to describe such this respect from SNOW GRAINS.an area in otherwise coarse, moun- (AMS)*tainous, or glacial terrain. (AMS)2. In glaciology, a region of per- SNOW, POWDER - A dry snow composedmanent snow cover, more specifical- of crystals or grains which liely applied to the ACCUMULATION AREA loosely, e.g., new powder snow,of glaciers. (AMS) settling powder snow, and settled
powder snow.SNOWFLAKE, n. - An ICE CRYSTAL or,
much more commonly, an aggregation SPOUT, n. - A phenomenon consistingof many crystals which falls from of an often violent whirlwind,a cloud. Simple snowflakes (single revealed by the presence of acrystals) exhibit beautiful variety cloud column or inverted cloudof form, but the symmetrical shapes cone (funnel cloud), protrudingreproduced so often in photomicro- from the base of a cumulonimbus,graphs are not actually found fre- and of a "bush" composed of waterquently in snowfalls. (AMS)* droplets raised from the surface of
the sea or of dust, sand or litter,SNOW GRAINS-PRECIPITATION in the form raised from the ground. (WMO)*
of very small, white opaque part- Spout includes both TORNADO andicles of ice; the solid equivalent WATERSPOUT.of DRIZZLE. They resemble SNOWPELLETS in external appearance, but SQUALL, n. - 1. A strong wind char-are more flattened and elongated, acterized by a sudden onset, aand generally have diameters of duration of the order of minutes,less than Imm; they neither shatter and a rather sudden decrease innor bounce when they hit a hard speed. (AMS)* 2. A severe localsurface. (AMS)* storm considered as a whole, that
is winds and cloud mass and (ifSNOW, HARD PACKED - Snow which has any) precipitation, thunder, and
been packed by vehicular or other lightning. (AMS)*traffic or possibly by the forcesof nature. SQUALL LINE - Any non-frontal line
or narrow band of active THUNDER-SNOW LINE - In general, the outer STORMS (with or without SQUALLS);
boundary of a snow-covered area. It a mature instability line. (AMS)*has at least two specific applica-tions: (a) the ever-changing equat-orward limit of SNOW COVER,
139

t
SUBARCTIC, n.- 1. A region of variable radiation cause the summer temp-width immediately south of the arctic. eratures to continue increasingWithin this area the mean temperature into July and August.of the warmest 4-month period is lessthan 50 degrees Fahrenheit. (AD) TORNADO, n. - A violent rotating2. Those land areas which extend column of air, pendant from asouth from the northern limit of cumulonimbus cloud, and nearlyforest to the northern limit of the always observable as a "funneldeveloped transportation net are cloud" or tuba. On a local scaleconsidered operationally to be sub- it is the most destructive of allarctic. Although treeless, such atmospheric phenomena. (AMS)*coastal areas as the Aleutiansare subarctic rather than arctic. TOWN FOG - An ICE FOG created by
extremely low temperatures (minusSYNOPTIC METEOROLOGY - The study and 50 to 65 degrees Fahrenheit),
analysis of synoptic weather infor- usually noticeable over more ormation (synoptic charts, synoptic less densely inhabited places,weather observations. (AMS) because of the conflict between
locally generated warm moist airSYNOPTIC WEATHER CHART - A chart of and the surrounding cold air.any extended portion of the earth's At extremely low temperaturessurface on which are delineated the such a fog may appear over aweather conditions at different body of troops, herd of cattle,points observed at the same moment gasoline powered vehicles, artil-of actual time. (AD) lery fire, etc. (AD)*
TEMPERATE CLIMATE - Very generally, TROPICAL CYCLONE - The general termthe climate of the "middle" latitudes; for a CYCLONE that originates overthe variable climate between the ex- the tropical oceans. By inter-tremes or tropical climate and polar national agreement, tropicalclimate. (AMS)* cyclones have been classified
according to their intensity, asN4t- Thin tur h no pa mwi TROPICAL DEPRESSIONS, TROPICALand cannot be ued to dlimt a PaticU STORMS, and HURRICANES or TYPHOONSang of ad e eondition. (AMS)*
TROPICAL DEPRESSIONS - A TROPICALTEMPERATURE LAG - 1. Although the sun CYCLONE in which the surfaceis directly overhead at noon, in- wind speed is less than 34 knotscoming radiation continues to exceed (38 miles per hour).reradiation from the earth untilafter 1400 hours local standard time. TROPICAL STORM - A TROPICAL CYCLONEThus, the diurnal surface temperature in which the surface wind speedincreases reaches a maximum in the is at least 34, but not more thanmidafternoon. 2. Seasonally, the 63 knots. (JD)sun is highest in the Northern Hemi-sphere at the summer solstice (June22), but the long hours of daylightand relatively direct incident
140

TWILIGHT, n. -The periods of incom- WEATHER INTELLIGENCE -Weather in-plete darkness following sunset formation interpreted in relation(evening twilight) or preceeding to its effects upon personnel,sunrise (morning twilight). Twi- materiel and the area of opera-light is designated as civil, nau- tions. (AD)tical , or astronomical , as thedarker limit occurs when the center WEATHER MAP - A map showing weatherof the sun is 60, 12u, or 1811 below conditions prevailing or predictedthe celestial horizon, respectively, over a considerable area. Usually,(ND) the map is based upon weather
observations taken at the same time*TYPHOON, n. - A severe TROPICAL CV- at a number of stations. (JD)
CLONE in the western Pacific. (seeHURRICANE) (AMS)* WEATHER STATION - An installation
or facility which provides met-UPSLOPE FOG - A type of FOG formed eorological observations and maywhen air flows upward over rising also provide medium range weatherterrain and is, consequently, ad- forecasts for limited geographicaliabatically cooled to or below its areas on a full or part timedewpoint. (AMS) schedule. (AD)
WATERSPOUT, n. - Usually, a TORNADO WET-BULB DEPRESSION - The differenceoccurring over water; rarely, a in degrees between the DRY-BULBlesser whirlwind over water, com- TEMPERATURE, and the WET-BULBparable in intensity to a DUST TEMPERATURE. (AMS)DEVIL over land. (AMS)*
WET-BULB TEMPERATURE - The lowestWBGT INDEX (Abbrev. for: WET BULB, temperature to which air can be
GLOBE TEMPERATURE INDEX) - A cooled at any given time byVmeasure of the severity of a hot evaporating water into it atclimate by taking into account constant pressure, when the heatrelative humidity and radiant heat required for evaporation isload as well as the dry-bulb temp- supplied by the cooling of theerature. The WBGT Index is made up air. This temperature is indi-by weighting the wet-bulb temper- cated by a well-ventilated WET-ature by 0.7 (for relative humidity) BULB THERMOMETER. (ND)the black globe temperature by 0.2(for radiant temperature), and the WET-BULB THERMOMETER - A thermometerdry bulb temperature by 0.1 (shade having the bulb covered with atemperature). cloth, usually muslin or cambric,
saturated with water. (ND)WEATHER, n. - 1. The state of the at-
mosphere, mainly with respect to its WET SNOW - In the Internationaleffects upon life and human activ- Snow Classification, snow whichities. (AMS)* 2. As used in the is saturated or almost saturatedmaking of surface weather observa- with water. If free water entirelytions, a category of individual fills the air spaces in the snowand combined atmospheric phenomena it is classified as "very wetwhich must be drawn upon to describe, snow". (ADT)the local atmospheric activity atthe time of observation. (AMS)*
141

WHITEOUT, n. - A weather conditionin the polar regions in which noobject casts a shadow, the horizonbecomes indistinguishable, and light-colored objects are very difficult tosee. Also called milky weather. Awhiteout occurs when there is cow-plete snow cover, and the cloudsare so thick and uniform that lightreflected by the snow is about thesame intensity as that from the sky.(ADT)*
WILLIWAW, n. - 1. A sudden violentgust of cold land air, common alongmountainous coasts of high latitudes(AD) 2. A very violent squall in theStraits of Magellan. They may occurin any month but are most frequentin winter. (AMS)
WIND, n. - Air in motion relative tothe surface of the earth. Sincevertical components of atmosphericmotion are relatively small especiallynear the surface of the earth, me-teorologists use the term to denotealmost exclusively the horizontalcomponent. (AMS)*
WINDCHILL, n. - The combined coolingeffect of wind and air temperatureon heated bodies. Windchill isexpressed in kilogram calories persquare meter per hour. (AD)
WIND ROSE - Any one of a class ofdiagrams designed to show the dis-tribution of wind direction exper-ienced at a given location over aconsiderable period; it thus showsthe prevailing wind direction.(AMS)*
142
1 34 98AI15- AG-Ft Belvoir A