Embed Size (px)
Citation preview
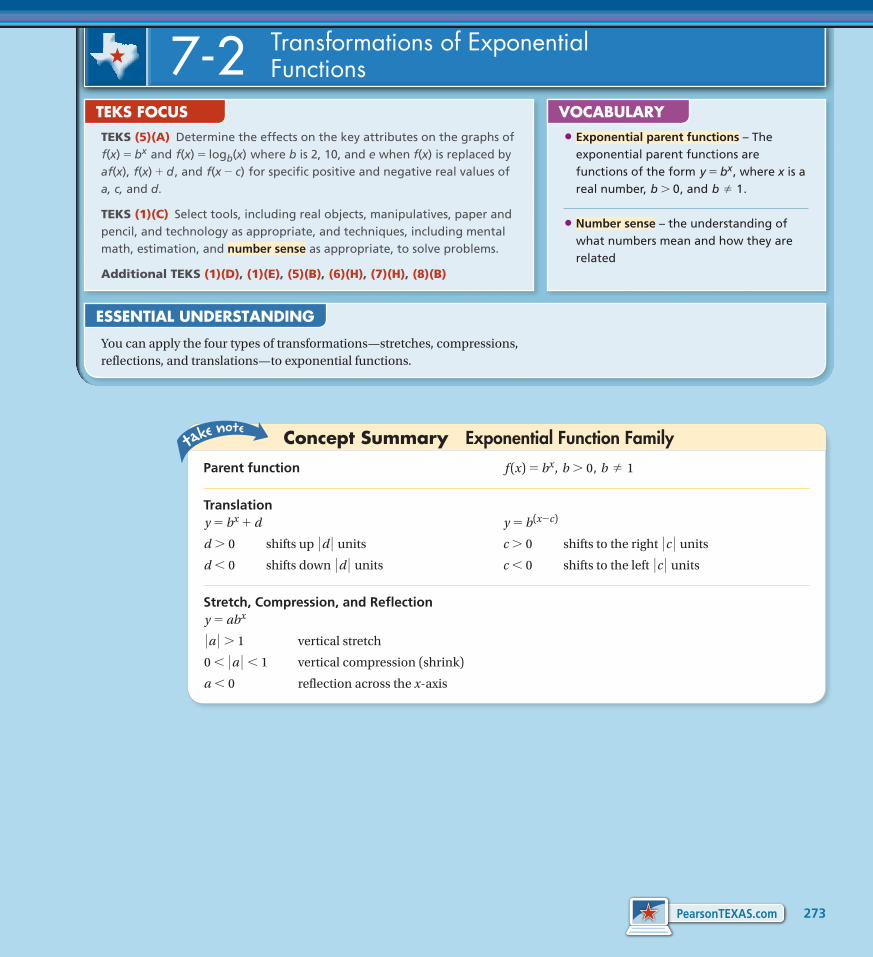
Parent function f (x) = bx, b 7 0, b ≠ 1
Translationy = bx + d y = b(x-c)
d 7 0 shifts up 0 d 0 units c 7 0 shifts to the right 0 c 0 units
d 6 0 shifts down 0 d 0 units c 6 0 shifts to the left 0 c 0 units
Stretch, Compression, and Reflectiony = abx
0 a 0 7 1 vertical stretch
0 6 0 a 0 6 1 vertical compression (shrink)
a 6 0 reflection across the x-axis
Concept Summary Exponential Function Family
You can apply the four types of transformations—stretches, compressions, reflections, and translations—to exponential functions.
ESSENTIAL UNDERSTANDING
TEKS (5)(A) Determine the effects on the key attributes on the graphs of f(x) = bx and f(x) = logb(x) where b is 2, 10, and e when f(x) is replaced by af(x), f(x) + d, and f(x - c) for specific positive and negative real values of a, c, and d.
TEKS (1)(C) Select tools, including real objects, manipulatives, paper and pencil, and technology as appropriate, and techniques, including mental math, estimation, and number sense as appropriate, to solve problems.
Additional TEKS (1)(D), (1)(E), (5)(B), (6)(H), (7)(H), (8)(B)
TEKS FOCUS
•Exponential parent functions – The exponential parent functions are functions of the form y = bx, where x is a real number, b 7 0, and b ≠ 1.
•Number sense – the understanding of what numbers mean and how they are related
VOCABULARY
7-2 Transformations of Exponential Functions
273PearsonTEXAS.com

Problem 2
Problem 1
Analyzing y = af (x) for f (x) = 2x
Graph each function on the same set of axes as the parent function f (x) = 2x. What is the effect of the transformation on the y-intercept?
A y = 3 ~ 2x
a = 3, so each y-value of y = 3 # 2x is 3 times the corresponding y-value of f (x). y = 3 # 2x stretches the graph of f (x) by the factor 3.
B y = −13 ~ 2x
a = -13. Since a 6 0, y = -1
3# 2x reflects
the graph of f (x) across the x-axis and compresses it by the factor 13.
The y-intercept is now (0, 3) instead of (0, 1). The y-intercept is now (0, -13) instead of
(0, 1).
TEKS Process Standard (1)(D)
xO-2-4 42
4
8
y = 2xy = 3 ∙ 2x
y
xO-2-4 42
2
-2
y = 2x
y
y = − ∙ 2x13
Analyzing y = af (x) for f (x) = 10x
Graph each function on the same set of axes as the parent function f (x) = 10x. What is the effect of the transformation on the range?
A y = 12 ~ 10x
a = 12, so each y-value of y = 1
2# 10x is
one-half the corresponding y-value off (x). y = 1
2# 10x compresses the graph of
f (x) by the factor 12.
B y = −2 ~ 10x
a = -2. Since a 6 0, y = -2 # 10x reflects the graph of f (x) across the x-axis and stretches it by the factor 2.
The range remains y 7 0. The range is now y 6 0 instead of y 7 0.
TEKS Process Standard (1)(D)
xO-2-4 42
20
40
60
80
y = 10x
y
y = ∙ 10x12
xO-2-4 42
40
-40
-80
80
y = 10x
y
y = −2 ∙ 10x
How can you use the parent function to graph y = 3 ~ 2x?Multiply each y-value of the parent function by a value of 3.
How do you know the graphs are reasonable?The graph of y = a # 10x should lie entirely above the x-axis when a 7 0 and entirely below the x-axis when a 6 0.
274 Lesson 7-2 Transformations of Exponential Functions

Problem 4
Problem 3
Analyzing y = f (x) + d for f (x) = 2x
Graph each function on the same set of axes as the parent function f (x) = 2x. What is the effect of the transformation on the y-intercept?
A y = 2x + 3
d = 3. Since d 7 0, each y-value of y = 2x + 3 is 3 greater than the corresponding y-value of f (x). So, y = 2x + 3 shifts the graph of f (x) up by 3 units.
B y = 2x − 2
d = -2. Since d 6 0, y = 2x - 2 shifts the graph of f (x) down by 2 units.
The y-intercept is now (0, 4) instead of (0, 1).
The y-intercept is now (0, -1) instead of (0, 1).
xO-2-4 42
2y = 2x
y
y = 2x + 3 4
6
8
xO-2-4 42
2y = 2x
y
y = 2x − 2
4
2
Analyzing y = f (x) + d for f (x) = 10x
Graph each function on the same set of axes as the parent function f (x) = 10x. What is the effect of the transformation on the asymptote?
A y = 10x + 20
Since d = 20, each y-value of y = 10x + 20 is 20 greater than the corresponding y-value of f (x). Because d 7 0, y = 10x + 20 shifts the graph of f (x) up by 20 units.
B y = 10x − 40
Since d = -40 and d 6 0, y = 10x - 40 shifts the graph of f (x) down by 40 units.
The horizontal asymptote is now y = 20 instead of y = 0.
The horizontal asymptote is now y = -40 instead of y = 0.
TEKS Process Standard (1)(D)
xO-2-4 42
20 y = 10x
y
y = 10x + 2040
60
xO-2-4 42
20
-20
-40
y = 10x
y
y = 10x − 40
40
How can you use estimation to help make the graph?For negative values of x, 10
x is close to 0. Therefore, to the left of the y-axis, the graph of y = 10
x + 20 should approach the line y = 20.
How do you know the graphs are the correct distance apart?For vertical translations, measure the distance between the graphs along a vertical line, such as the y-axis.
275PearsonTEXAS.com

Problem 6
Problem 5
Analyzing y = f (x − c) for f (x) = 2x
Graph each function on the same set of axes as the parent function f (x) = 2x. What is the effect of the transformation on the y-intercept?
A y = 2(x−4)
Since c = 4 and c 7 0, y = 2(x-4) shifts the graph of f (x) to the right by 4 units.
B y = 2(x+2)
Since c = -2 and c 6 0, y = 2(x+2) shifts the graph of f (x) to the left by 0 -2 0 or 2 units.
The y-intercept is now (0, 116) instead
of (0, 1). The y-intercept is now (0, 4) instead
of (0, 1).
xO-2 4 62
2
y = 2xy
y = 2(x − 4)
4
6
8
xO-2-4 42
2y = 2x
y
y = 2(x + 2)
4
6
8
Analyzing y = f (x − c) for f (x) = 10x
Graph each function on the same set of axes as the parent function f (x) = 10x. What is the effect of the transformation on the domain?
A y = 10(x−6)
Since c = 6 and c 7 0, y = 10(x-6) shifts the graph of f (x) to the right by 6 units.
B y = 10(x+5)
Since c = -5 and c 6 0, y = 10(x+5) shifts the graph of f (x) to the left by 0 -5 0 or 5 units.
The domain of the function remains {x 0 x is a real number}.
The domain of the function remains {x 0 x is a real number}.
xO 4 6 82
20
y = 10x
y
y = 10(x − 6)
40
60
xO-2-4-6 2
20 y = 10x
yy = 10(x + 5)
40
60
How can you check the graph?Choose a value of x that makes the exponent equal to 0. For x = 6, y = 100 or 1. Check that the graph passes through (6, 1).
How do you know the graphs are the correct distance apart?For horizontal translations, measure the distance between the graphs along a horizontal line, such as the line y = 1.
276 Lesson 7-2 Transformations of Exponential Functions

Problem 7
Using an Exponential Model
Physics The best temperature to brew coffee is between 195°F and 205°F. Coffee is cool enough to drink at 185°F. The table shows temperature readings from a sample cup of coffee. How long does it take for a cup of coffee to be cool enough to drink? Use an exponential model.
Step 1Plot the data to determine if an exponential model is realistic.
Step 2The graphing calculator exponential model assumes the asymptote is y = 0. Since room temperature is about 68°F, subtract 68 from each temperature value.Calculate the third list by letting L3 = L2 − 68.
Step 3Use the ExpReg L1, L3 function on the transformed data to find an exponential model.
Step 4Translate y = 134.5(0.956)x vertically by 68 units to model the original data. Use the model y = 134.5 # 0.956x + 68 to find how long it takes the coffee to cool to 185°F.
The coffee takes about 3.1 min to cool to 185°F.
TEKS Process Standard (1)(C)
STEM
Time (min) Temp (°F)
0
5
10
15
20
25
30
203
177
153
137
121
111
104
Use an exponential model to find the time it takes for coffee to reach 185°F.
Time it takes for a cup of coffee to become cool enough to drink
• Set of values• Best serving
temperature
The graphing calculatorexponential model assumesthe asymptote is y � 0.
ExpReg y = a*b^x a = 134.5169825 b = .956011669 r2= .9981659939 r = -.9990825761
X=3.1
2.62.72.82.933.13.2
X187.65187.11186.58186.05185.52184.99184.46
Y1
Why does it make sense that a graph of this data would have an asymptote?The temperature of the hot coffee will get closer and closer to room temperature as it cools, but it cannot cool below room temperature.
277PearsonTEXAS.com
PRACTICE and APPLICATION EXERCISES
ONLINE
HO
M E W O RK
For additional support whencompleting your homework, go to PearsonTEXAS.com.
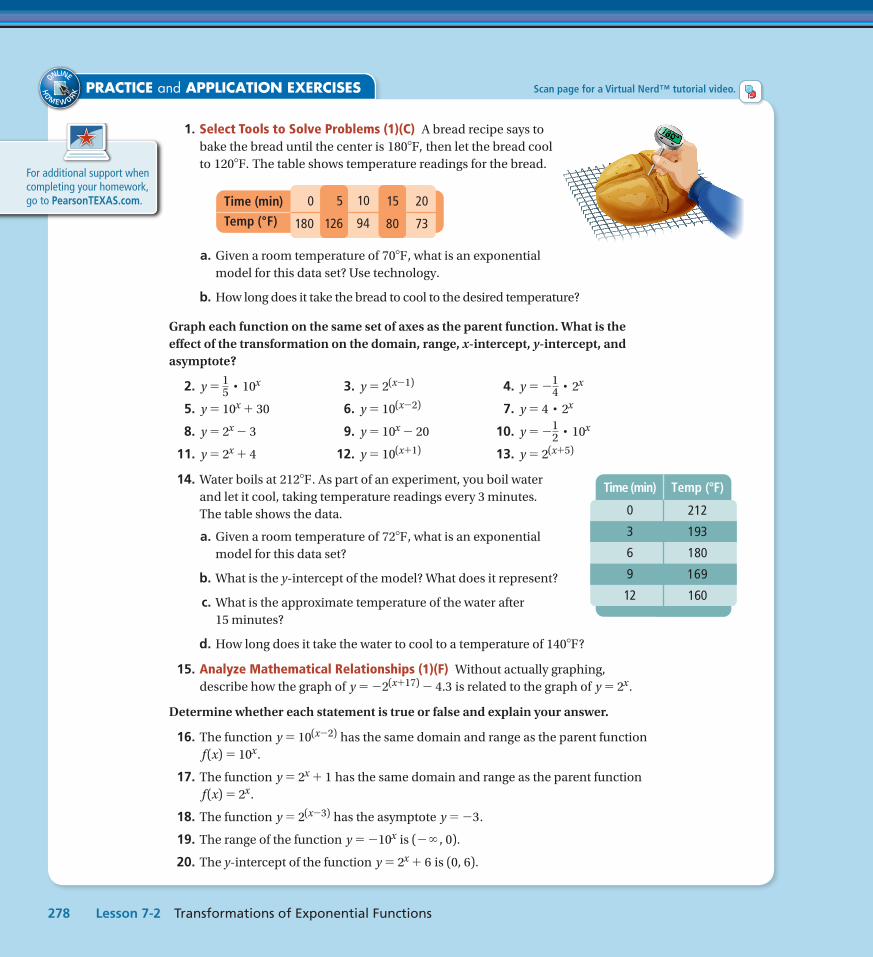
1. Select Tools to Solve Problems (1)(C) A bread recipe says to bake the bread until the center is 180°F, then let the bread cool to 120°F. The table shows temperature readings for the bread.
a. Given a room temperature of 70°F, what is an exponential model for this data set? Use technology.
b. How long does it take the bread to cool to the desired temperature?
Graph each function on the same set of axes as the parent function. What is the effect of the transformation on the domain, range, x-intercept, y-intercept, and asymptote?
2. y = 15# 10x 3. y = 2(x-1) 4. y = -1
4# 2x
5. y = 10x + 30 6. y = 10(x-2) 7. y = 4 # 2x
8. y = 2x - 3 9. y = 10x - 20 10. y = -12# 10x
11. y = 2x + 4 12. y = 10(x+1) 13. y = 2(x+5)
14. Water boils at 212°F. As part of an experiment, you boil water and let it cool, taking temperature readings every 3 minutes. The table shows the data.
a. Given a room temperature of 72°F, what is an exponential model for this data set?
b. What is the y-intercept of the model? What does it represent?
c. What is the approximate temperature of the water after 15 minutes?
d. How long does it take the water to cool to a temperature of 140°F?
15. Analyze Mathematical Relationships (1)(F) Without actually graphing, describe how the graph of y = -2(x+17) - 4.3 is related to the graph of y = 2x.
Determine whether each statement is true or false and explain your answer.
16. The function y = 10(x-2) has the same domain and range as the parent function f (x) = 10x.
17. The function y = 2x + 1 has the same domain and range as the parent function f (x) = 2x.
18. The function y = 2(x-3) has the asymptote y = -3.
19. The range of the function y = -10x is ( - ∞ , 0).
20. The y-intercept of the function y = 2x + 6 is (0, 6).
Time (min)
Temp (°F)
0
180
10
94
15
80
20
73
5
126
Temp (°F)Time (min)
0
3
6
9
12
212
193
180
169
160
Scan page for a Virtual Nerd™ tutorial video.
278 Lesson 7-2 Transformations of Exponential Functions

TEXAS Test Practice
26. Which function has a graph that lies entirely in the third and fourth quadrants?
A. y = 10x - 1 C. y = -10(x-1) - 1
B. y = -10x + 1 D. y = 10(x-1) - 1
27. A teacher graphed the parent function f (x) = 2x. Then she shifted the graph of the parent function 5 units left and 5 units up. Which function did she graph?
F. y = 2(x+5) + 5 H. y = 2(x+5) - 5
G. y = 2(x-5) + 5 J. y = 2(x-5) - 5
28. Explain how the graph of the function y = -0.2 # 2x is similar to and different from the graph of the function y = 0.2 # 2x.
21. Explain Mathematical Ideas (1)(G) A student says that the graph of y = 2(x+2) + 3 is a shift of the parent function 2 units to the right and 3 units up. Is the student correct? Explain.
Match each function with the correct graph.
22. y = 2(x-1) + 1 23. y = 2(x+1) - 1 24. y = 2(x-1) - 1
A. B. C.
25. A student graphed a function of the form y = 2(x-c) + d. She gave the following clues about the graph.
• The y-intercept is (0, 4).
• The asymptote is the x-axis.
• The graph passes through the point ( -1, 2).
Write a rule for the function and then graph the function.
xO-2 2 4
2
y
4
6
xO-2 2 4
2
y
4
6
xO-2 2 4
2
y
4
6
279PearsonTEXAS.com