Embed Size (px)
Citation preview
Exercises with
Worked Solutions6
Cambridge
University
Version MFA 09
M A T E R I A L I N S P I R A T I O N

© Granta Design, January 2009
Materials selection in mechanical design, 3rd edition
Exercises with worked solutions
Mike Ashby
Engineering Department,
Cambridge, CB2 1 PZ, UK
Version 1
Part 1
E1 Introduction to exercises
E2 Devising concepts
E3 Use of material selection charts
E4 Translation: constraints and objectives
E5 Deriving and using material indices
Part 2
E6 Selecting processes
E7 Multiple constraints and objectives
Part 3
E 8 Selecting material and shape
E9 Hybrid materials
© Granta Design, January 2009
E1 Introduction to exercises
These exercises are designed to develop facility in selecting materials,
processes and shape, and in devising hybrid materials when no monolithic
material completely meets the design requirements. Each exercise is
accompanied by a worked solution. They are organized into nine sections:
E1: Introduction to the exercises
E2: Devising concepts
E3: Use of materials selection charts
E4: Translation: constraints and objectives
E5: Deriving and using material indices
E6: Selecting processes
E7: Multiple constraints and objectives
E8: Selecting material and shape
E9: Hybrid materials
The early exercises are very easy. Those that follow lead the reader
through the use of property charts, translation, the derivation of indices,
screening and ranking, multi-objective optimization and choice of shape.
Difficulty, when it arises, is not caused by mathematical complexity – the
maths involved is simple throughout; it arises from the need to think clearly
about the constraints, the objectives and the free variables.
Three important points.
1. Selection problems are open-ended and, generally, under-specified; there
is seldom a single, correct answer. The proper answer is sensible
translation of the design requirements into material constraints and
objectives, applied to give a short-list of potential candidates with
commentary suggesting what supporting information would be needed to
narrow the choice further.
2. The positioning of selection-lines on charts is a matter of judgement.
The goal is to place the lines such that they leave an adequately large
"short list" of candidates (aim for 4 or so), drawn, if possible, from more
than one class of material.
3. A request for a selection based on one material index alone (such as
ρ/EM 2/1= ) is correctly answered by listing the subset of materials
that maximize this index. But a request for a selection of materials for a
component – a wing spar, for instance (which is a light, stiff beam, for
which the index is ρ/EM 2/1= ) – requires more: some materials
with high ρ/E 2/1 such as silicon carbide, are unsuitable for obvious
reasons. It is a poor answer that ignores common sense and experience
and fails to add further constraints to incorporate them. Students should
be encouraged to discuss the implications of their selection and to
suggest further selection stages.
The best way to use the charts that are a feature of the book is to make
clean copies (or down-load them from http://www.grantadesign.com ) on
which you can draw, try out alternative selection criteria, write comments and
so forth. Although the book itself is copyrighted, the reader is authorized to
make copies of the charts and to reproduce these, with proper reference to
their source, as he or she wishes.
All the materials selection problems can be solved using the CES
software, which is particularly effective when multiple criteria and unusual
indices are involved.
© Granta Design, January 2009
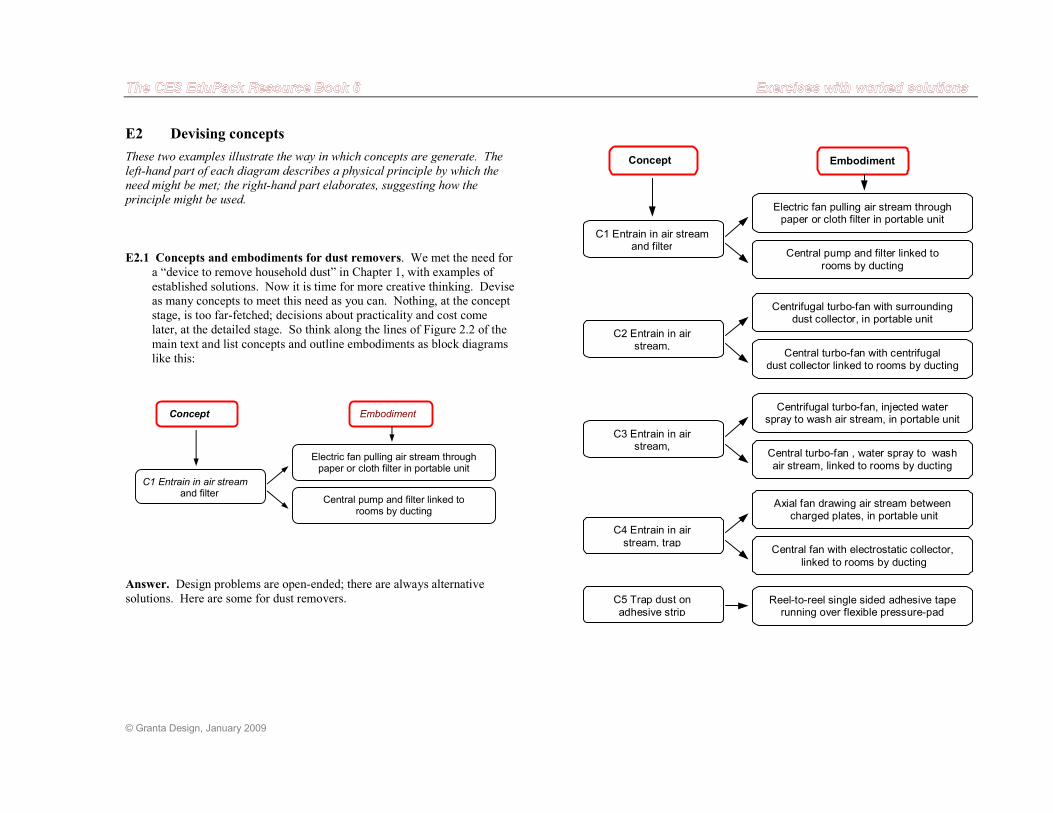
E2 Devising concepts
These two examples illustrate the way in which concepts are generate. The
left-hand part of each diagram describes a physical principle by which the
need might be met; the right-hand part elaborates, suggesting how the principle might be used.
E2.1 Concepts and embodiments for dust removers. We met the need for
a “device to remove household dust” in Chapter 1, with examples of
established solutions. Now it is time for more creative thinking. Devise
as many concepts to meet this need as you can. Nothing, at the concept
stage, is too far-fetched; decisions about practicality and cost come
later, at the detailed stage. So think along the lines of Figure 2.2 of the
main text and list concepts and outline embodiments as block diagrams
like this:
Answer. Design problems are open-ended; there are always alternative
solutions. Here are some for dust removers.
Concept Embodiment
C1 Entrain in air stream
and filter
Electric fan pulling air stream through paper or cloth filter in portable unit
Central pump and filter linked to rooms by ducting
Concept Embodiment
C1 Entrain in air streamand filter
Electric fan pulling air stream throughpaper or cloth filter in portable unit
Central pump and filter linked to
rooms by ducting
C4 Entrain in air
stream, trap
Axial fan drawing air stream between charged plates, in portable unit
Central fan with electrostatic collector,
linked to rooms by ducting
C3 Entrain in airstream,
Centrifugal turbo-fan, injected waterspray to wash air stream, in portable unit
Central turbo-fan , water spray to wash
air stream, linked to rooms by ducting
C2 Entrain in airstream,
Centrifugal turbo-fan with surroundingdust collector, in portable unit
Central turbo-fan with centrifugaldust collector linked to rooms by ducting
C5 Trap dust on
adhesive stripReel-to-reel single sided adhesive taperunning over flexible pressure-pad
© Granta Design, January 2009
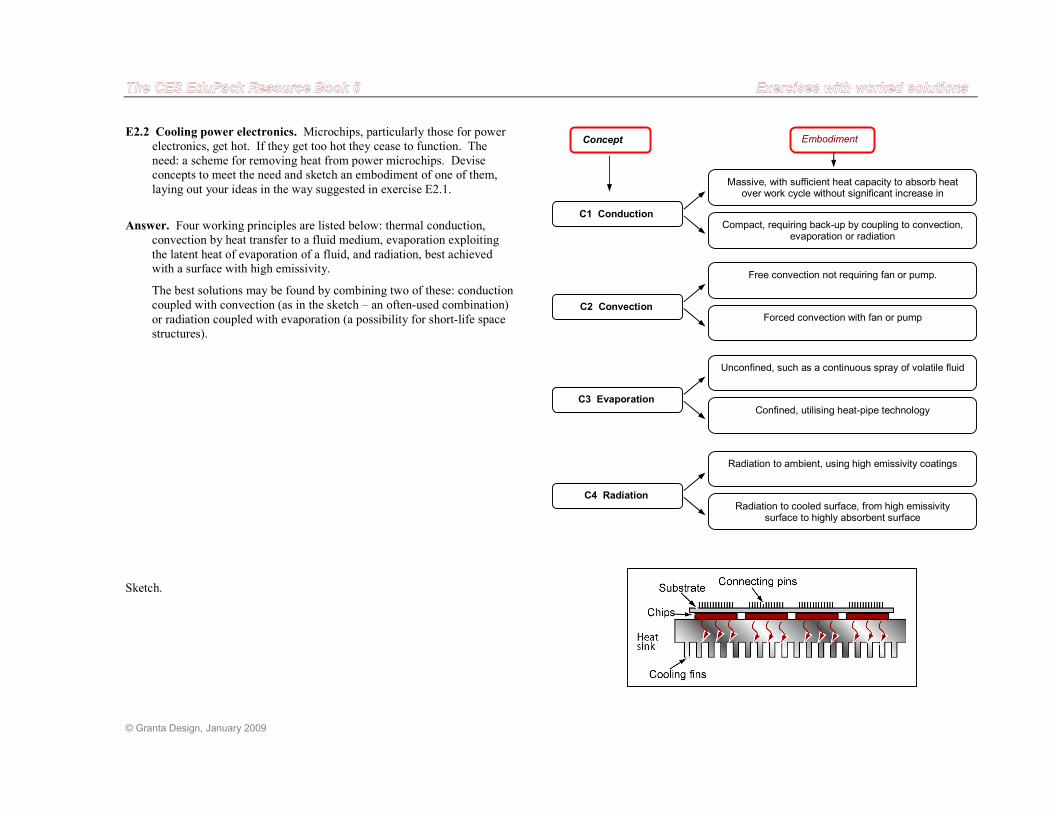
E2.2 Cooling power electronics. Microchips, particularly those for power
electronics, get hot. If they get too hot they cease to function. The
need: a scheme for removing heat from power microchips. Devise
concepts to meet the need and sketch an embodiment of one of them,
laying out your ideas in the way suggested in exercise E2.1.
Answer. Four working principles are listed below: thermal conduction,
convection by heat transfer to a fluid medium, evaporation exploiting
the latent heat of evaporation of a fluid, and radiation, best achieved
with a surface with high emissivity.
The best solutions may be found by combining two of these: conduction
coupled with convection (as in the sketch – an often-used combination)
or radiation coupled with evaporation (a possibility for short-life space
structures).
Sketch.
Concept Embodiment
C1 Conduction
Massive, with sufficient heat capacity to absorb heat over work cycle without significant increase in
Compact, requiring back-up by coupling to convection, evaporation or radiation
C2 Convection
Free convection not requiring fan or pump.
Forced convection with fan or pump
C3 Evaporation
Unconfined, such as a continuous spray of volatile fluid
Confined, utilising heat-pipe technology
C4 Radiation
Radiation to ambient, using high emissivity coatings
Radiation to cooled surface, from high emissivity surface to highly absorbent surface
© Granta Design, January 2009
E3. Use of material selection charts
The 21 exercises in this section involve the simple use of the charts of
Chapter 4 to find materials with give property profiles. They are answered by
placing selection lines on the appropriate chart and reading off the materials that lie on the appropriate side of the line. It is a good idea to present the
results as a table. All can be solved by using the printed charts.
If the CES EDU Materials Selection software is available the same exercises
can be solved by its use. This involves first creating the chart, then applying
the appropriate box or line selection. The results, at Level 1 or 2, are the
same as those read from the hard copy charts (which were made using the Level 2 database). The software offers links to processes, allows a wider
search by using the Level 3 database, and gives access to supporting
information via the “Search Web” function.
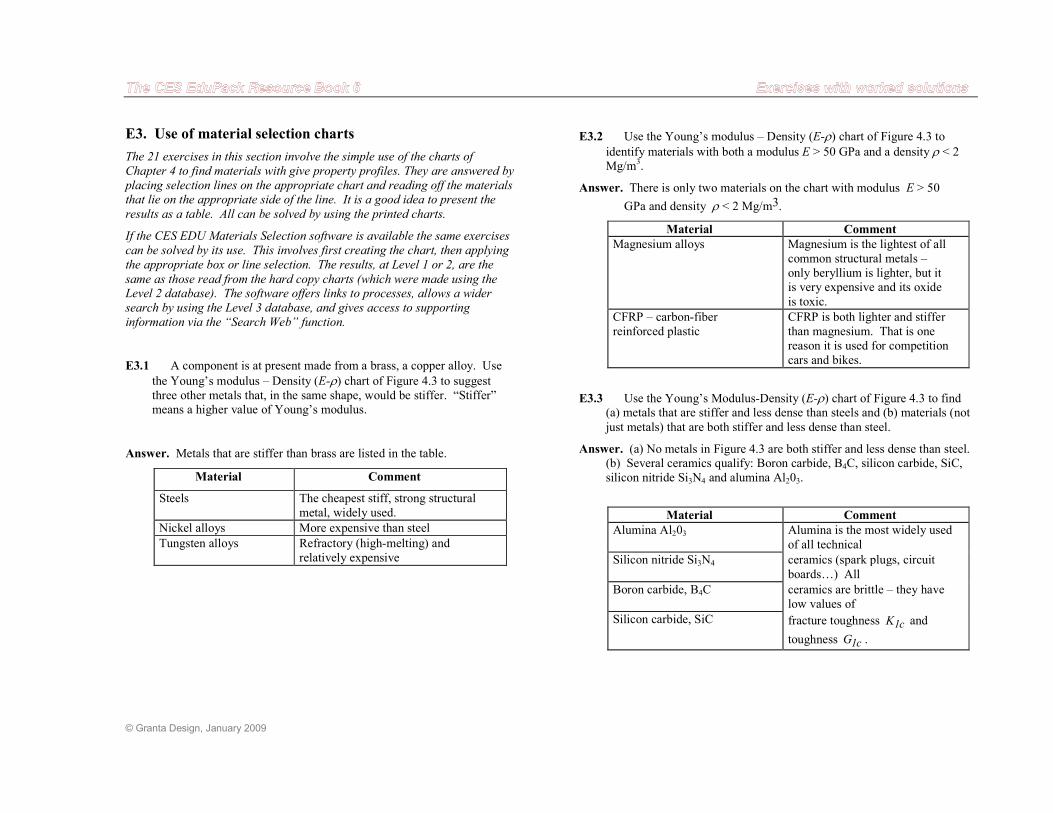
E3.1 A component is at present made from a brass, a copper alloy. Use
the Young’s modulus – Density (E-ρ) chart of Figure 4.3 to suggest three other metals that, in the same shape, would be stiffer. “Stiffer”
means a higher value of Young’s modulus.
Answer. Metals that are stiffer than brass are listed in the table.
Material Comment
Steels The cheapest stiff, strong structural
metal, widely used.
Nickel alloys More expensive than steel
Tungsten alloys Refractory (high-melting) and
relatively expensive
E3.2 Use the Young’s modulus – Density (E-ρ) chart of Figure 4.3 to identify materials with both a modulus E > 50 GPa and a density ρ < 2 Mg/m
3.
Answer. There is only two materials on the chart with modulus E > 50
GPa and density ρ < 2 Mg/m3.
Material Comment
Magnesium alloys Magnesium is the lightest of all
common structural metals –
only beryllium is lighter, but it
is very expensive and its oxide
is toxic.
CFRP – carbon-fiber
reinforced plastic
CFRP is both lighter and stiffer
than magnesium. That is one
reason it is used for competition
cars and bikes.
E3.3 Use the Young’s Modulus-Density (E-ρ) chart of Figure 4.3 to find (a) metals that are stiffer and less dense than steels and (b) materials (not
just metals) that are both stiffer and less dense than steel.
Answer. (a) No metals in Figure 4.3 are both stiffer and less dense than steel.
(b) Several ceramics qualify: Boron carbide, B4C, silicon carbide, SiC,
silicon nitride Si3N4 and alumina Al203.
Material Comment
Alumina Al203 Alumina is the most widely used
of all technical
Silicon nitride Si3N4 ceramics (spark plugs, circuit
boards…) All
Boron carbide, B4C ceramics are brittle – they have
low values of
Silicon carbide, SiC fracture toughness c1K and
toughness c1G .
© Granta Design, January 2009
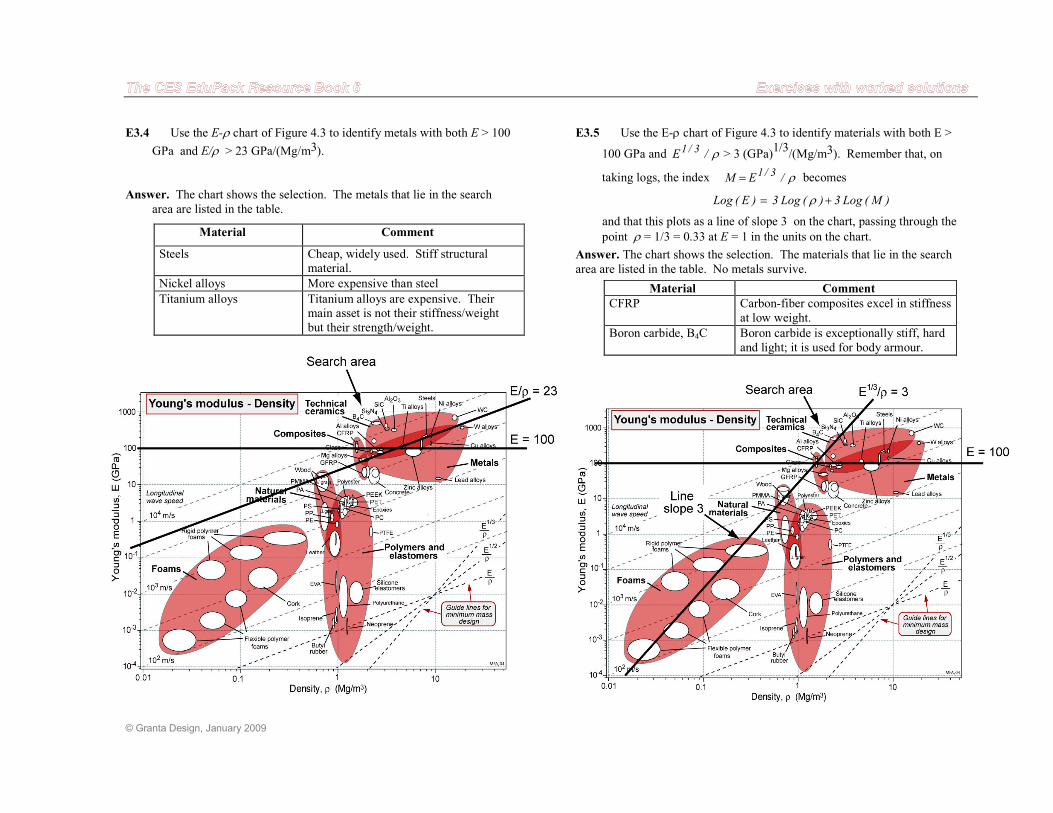
E3.4 Use the E-ρ chart of Figure 4.3 to identify metals with both E > 100
GPa and E/ρ > 23 GPa/(Mg/m3).
Answer. The chart shows the selection. The metals that lie in the search
area are listed in the table.
Material Comment
Steels Cheap, widely used. Stiff structural
material.
Nickel alloys More expensive than steel
Titanium alloys Titanium alloys are expensive. Their
main asset is not their stiffness/weight
but their strength/weight.
E3.5 Use the E-ρ chart of Figure 4.3 to identify materials with both E >
100 GPa and ρ/E 3/1 > 3 (GPa)1/3
/(Mg/m3). Remember that, on
taking logs, the index ρ/EM 3/1= becomes
)M(Log3)(Log3)E(Log += ρ
and that this plots as a line of slope 3 on the chart, passing through the
point ρ = 1/3 = 0.33 at E = 1 in the units on the chart. Answer. The chart shows the selection. The materials that lie in the search
area are listed in the table. No metals survive.
Material Comment
CFRP Carbon-fiber composites excel in stiffness
at low weight.
Boron carbide, B4C Boron carbide is exceptionally stiff, hard
and light; it is used for body armour.
© Granta Design, January 2009
E3.6 Use the E-ρ chart of Figure 4.3 to establish whether woods have a higher specific stiffness E/ρ than epoxies.
Answer. Parallel to the grain, woods have much higher specific stiffness
than epoxies. Perpendicular to the grain, woods have about the same
value as epoxies.
Material E/ρρρρ (GPa/(Mg/m3)
Woods parallel to the grain
Woods transverse to the grain
8 – 30
0.8 – 3.5
Epoxies 1.75 – 2.4
E3.7 Do titanium alloys have a higher or lower specific strength
(strength/density, ρσ /f ) than tungsten alloys? This is important
when you want strength at low weight (landing gear of aircraft,
mountain bikes). Use the ρσ /f chart of Figure 4.4 to decide.
Answer. The guide line for ρσ /f on the strength – density chart of
Figure 4.4, if drawn through titanium alloys shows that they have a
much the higher specific strength than tungsten, even though tungsten is
stronger.
Material σσσσf/ρρρρ (MPa/(Mg/m3))
Titanium alloys 60 - 250
Tungsten alloys 29 - 41
E 3.8 Use the modulus-strength fE σ− chart of Figure 4.5 to find
materials that have E > 10 GPa and ≥fσ 1000 MPa.
Answer. The strongest steels, titanium alloys (Ti-alloys) and carbon fiber
reinforced polymers (CFRP) meet these limits.
Material Comment
High strength steels
High strength nickel alloys All have fσ above 1000 MPa,
Titanium alloys a very large value
CFRP
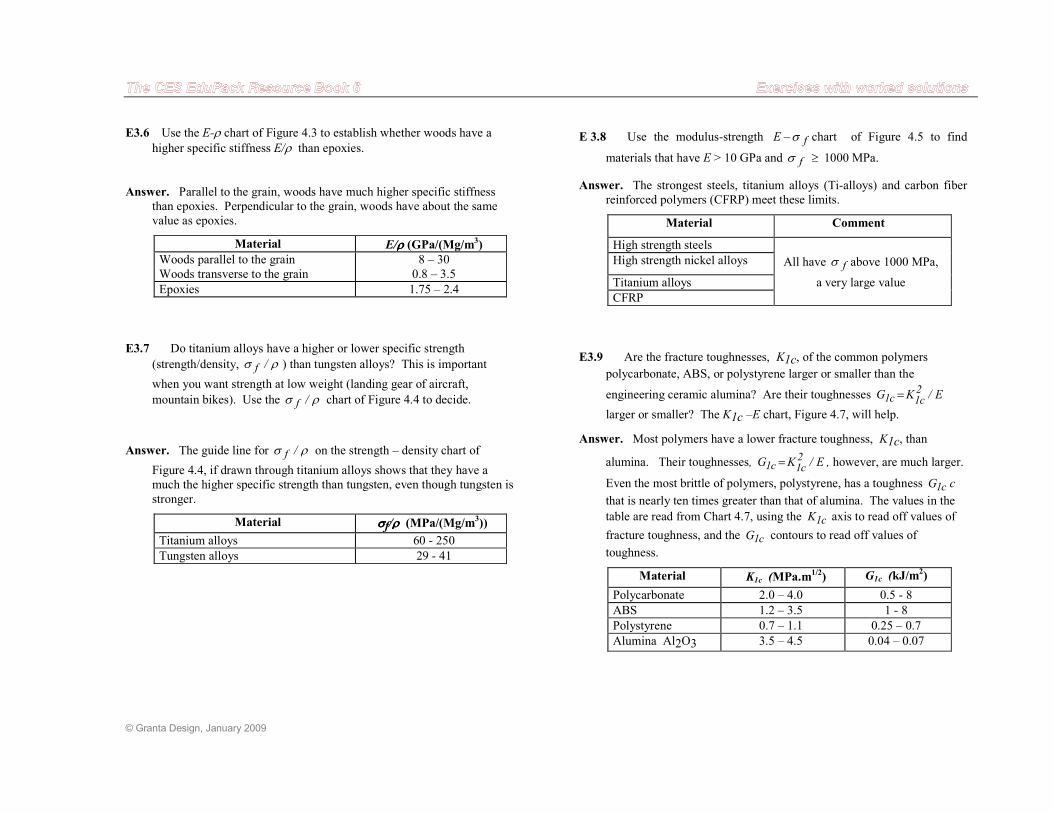
E3.9 Are the fracture toughnesses, K1c, of the common polymers
polycarbonate, ABS, or polystyrene larger or smaller than the
engineering ceramic alumina? Are their toughnesses E/KG 2c1c1 =
larger or smaller? The K1c –E chart, Figure 4.7, will help.
Answer. Most polymers have a lower fracture toughness, K1c, than
alumina. Their toughnesses, E/KG 2c1c1 = , however, are much larger.
Even the most brittle of polymers, polystyrene, has a toughness c1G c
that is nearly ten times greater than that of alumina. The values in the
table are read from Chart 4.7, using the c1K axis to read off values of
fracture toughness, and the c1G contours to read off values of
toughness.
Material K1c (MPa.m1/2) G1c (kJ/m
2)
Polycarbonate 2.0 – 4.0 0.5 - 8
ABS 1.2 – 3.5 1 - 8
Polystyrene 0.7 – 1.1 0.25 – 0.7
Alumina Al2O3 3.5 – 4.5 0.04 – 0.07
© Granta Design, January 2009
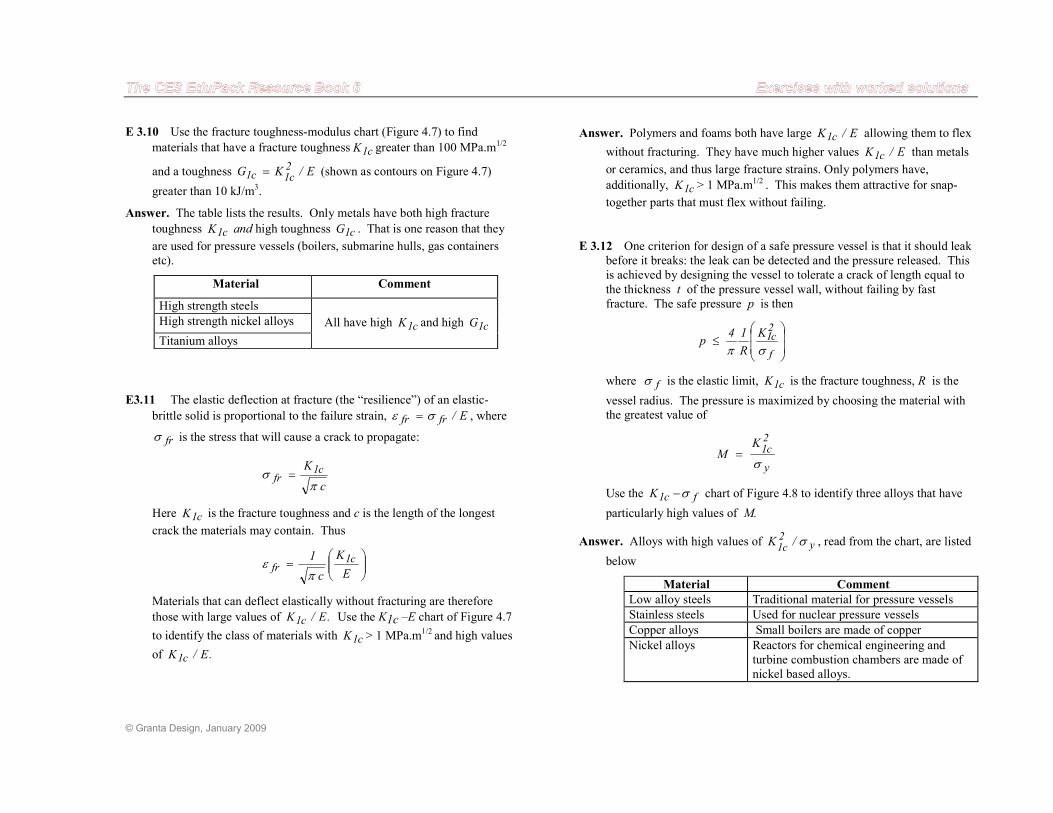
E 3.10 Use the fracture toughness-modulus chart (Figure 4.7) to find
materials that have a fracture toughness c1K greater than 100 MPa.m1/2
and a toughness E/KG 2c1c1 = (shown as contours on Figure 4.7)
greater than 10 kJ/m3.
Answer. The table lists the results. Only metals have both high fracture
toughness c1K and high toughness c1G . That is one reason that they
are used for pressure vessels (boilers, submarine hulls, gas containers
etc).
Material Comment
High strength steels
High strength nickel alloys All have high c1K and high c1G
Titanium alloys
E3.11 The elastic deflection at fracture (the “resilience”) of an elastic-
brittle solid is proportional to the failure strain, E/frfr σε = , where
frσ is the stress that will cause a crack to propagate:
c
K c1fr
πσ =
Here c1K is the fracture toughness and c is the length of the longest
crack the materials may contain. Thus
=
E
K
c
1 c1fr
πε
Materials that can deflect elastically without fracturing are therefore
those with large values of .E/K c1 Use the K1c –E chart of Figure 4.7
to identify the class of materials with c1K > 1 MPa.m1/2
and high values
of .E/K c1
Answer. Polymers and foams both have large E/K c1 allowing them to flex
without fracturing. They have much higher values E/K c1 than metals
or ceramics, and thus large fracture strains. Only polymers have,
additionally, c1K > 1 MPa.m1/2 . This makes them attractive for snap-
together parts that must flex without failing.
E 3.12 One criterion for design of a safe pressure vessel is that it should leak
before it breaks: the leak can be detected and the pressure released. This
is achieved by designing the vessel to tolerate a crack of length equal to
the thickness t of the pressure vessel wall, without failing by fast
fracture. The safe pressure p is then
≤
f
2IcK
R
14p
σπ
where fσ is the elastic limit, c1K is the fracture toughness, R is the
vessel radius. The pressure is maximized by choosing the material with
the greatest value of
y
2c1
KM
σ=
Use the fc1K σ− chart of Figure 4.8 to identify three alloys that have
particularly high values of M.
Answer. Alloys with high values of y2c1/K σ , read from the chart, are listed
below
Material Comment
Low alloy steels Traditional material for pressure vessels
Stainless steels Used for nuclear pressure vessels
Copper alloys Small boilers are made of copper
Nickel alloys Reactors for chemical engineering and
turbine combustion chambers are made of
nickel based alloys.
© Granta Design, January 2009
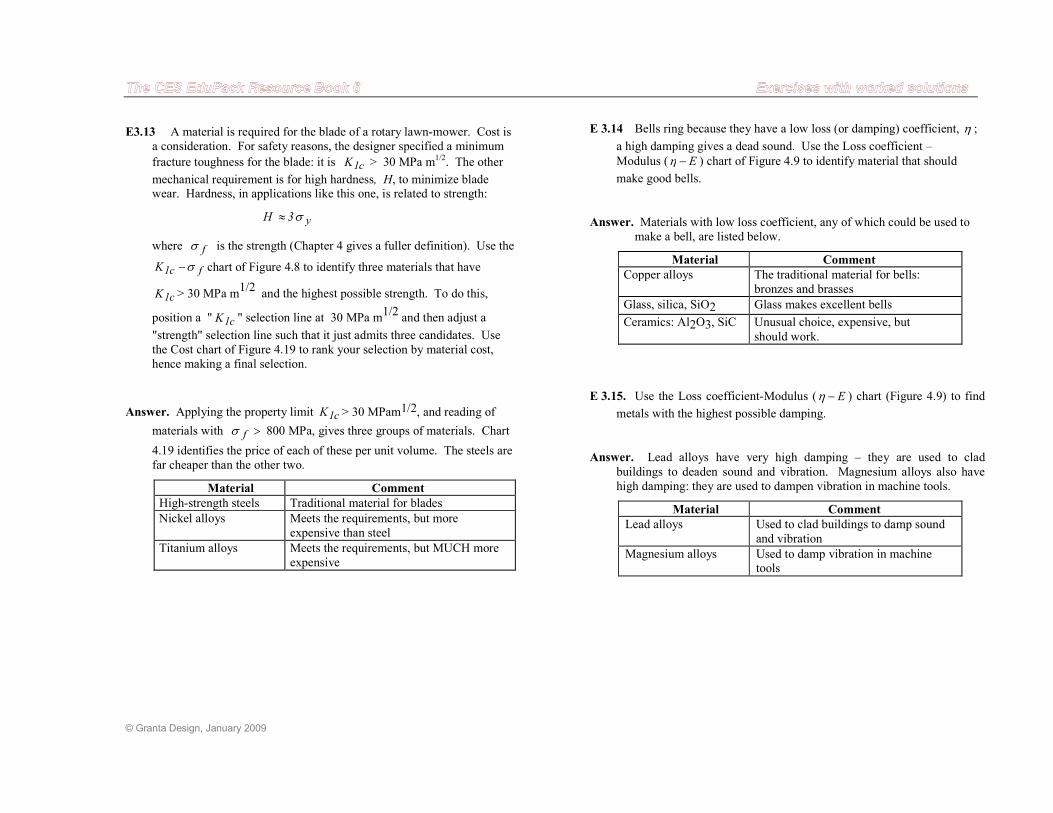
E3.13 A material is required for the blade of a rotary lawn-mower. Cost is
a consideration. For safety reasons, the designer specified a minimum
fracture toughness for the blade: it is c1K > 30 MPa m1/2. The other
mechanical requirement is for high hardness, H, to minimize blade
wear. Hardness, in applications like this one, is related to strength:
y3H σ≈
where fσ is the strength (Chapter 4 gives a fuller definition). Use the
fc1K σ− chart of Figure 4.8 to identify three materials that have
c1K > 30 MPa m1/2
and the highest possible strength. To do this,
position a " c1K " selection line at 30 MPa m1/2
and then adjust a
"strength" selection line such that it just admits three candidates. Use
the Cost chart of Figure 4.19 to rank your selection by material cost,
hence making a final selection.
Answer. Applying the property limit c1K > 30 MPam1/2, and reading of
materials with >fσ 800 MPa, gives three groups of materials. Chart
4.19 identifies the price of each of these per unit volume. The steels are
far cheaper than the other two.
Material Comment
High-strength steels Traditional material for blades
Nickel alloys Meets the requirements, but more
expensive than steel
Titanium alloys Meets the requirements, but MUCH more
expensive
E 3.14 Bells ring because they have a low loss (or damping) coefficient, η ;
a high damping gives a dead sound. Use the Loss coefficient –
Modulus ( E−η ) chart of Figure 4.9 to identify material that should
make good bells.
Answer. Materials with low loss coefficient, any of which could be used to
make a bell, are listed below.
Material Comment
Copper alloys The traditional material for bells:
bronzes and brasses
Glass, silica, SiO2 Glass makes excellent bells
Ceramics: Al2O3, SiC Unusual choice, expensive, but
should work.
E 3.15. Use the Loss coefficient-Modulus ( E−η ) chart (Figure 4.9) to find
metals with the highest possible damping.
Answer. Lead alloys have very high damping – they are used to clad
buildings to deaden sound and vibration. Magnesium alloys also have
high damping: they are used to dampen vibration in machine tools.
Material Comment
Lead alloys Used to clad buildings to damp sound
and vibration
Magnesium alloys Used to damp vibration in machine
tools
© Granta Design, January 2009
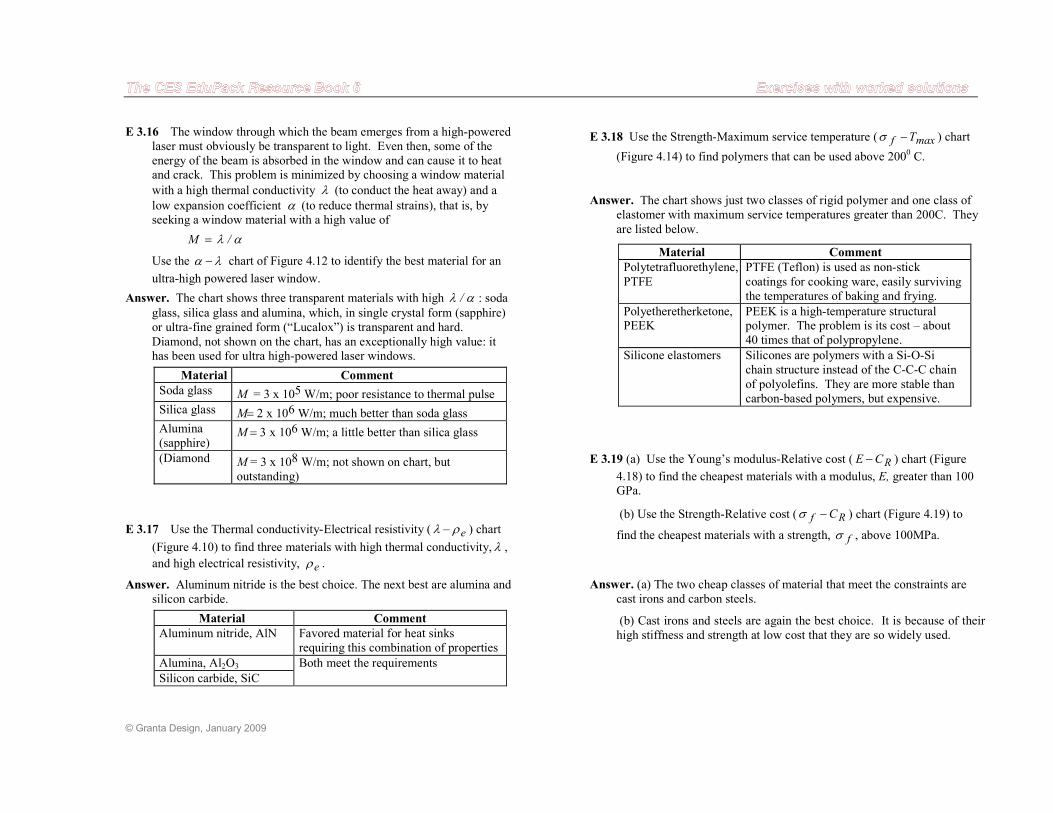
E 3.16 The window through which the beam emerges from a high-powered
laser must obviously be transparent to light. Even then, some of the
energy of the beam is absorbed in the window and can cause it to heat
and crack. This problem is minimized by choosing a window material
with a high thermal conductivity λ (to conduct the heat away) and a low expansion coefficient α (to reduce thermal strains), that is, by
seeking a window material with a high value of
αλ /M =
Use the λα − chart of Figure 4.12 to identify the best material for an
ultra-high powered laser window.
Answer. The chart shows three transparent materials with high αλ / : soda
glass, silica glass and alumina, which, in single crystal form (sapphire)
or ultra-fine grained form (“Lucalox”) is transparent and hard.
Diamond, not shown on the chart, has an exceptionally high value: it
has been used for ultra high-powered laser windows.
Material Comment
Soda glass M = 3 x 10⁵ W/m; poor resistance to thermal pulse
Silica glass M= 2 x 10⁶ W/m; much better than soda glass Alumina
(sapphire) M = 3 x 10⁶ W/m; a little better than silica glass
(Diamond M = 3 x 10⁸ W/m; not shown on chart, but
outstanding)
E 3.17 Use the Thermal conductivity-Electrical resistivity ( eρλ − ) chart
(Figure 4.10) to find three materials with high thermal conductivity, λ ,
and high electrical resistivity, eρ .
Answer. Aluminum nitride is the best choice. The next best are alumina and
silicon carbide.
Material Comment
Aluminum nitride, AlN Favored material for heat sinks
requiring this combination of properties
Alumina, Al2O3 Both meet the requirements
Silicon carbide, SiC
E 3.18 Use the Strength-Maximum service temperature ( maxf T−σ ) chart
(Figure 4.14) to find polymers that can be used above 2000 C.
Answer. The chart shows just two classes of rigid polymer and one class of
elastomer with maximum service temperatures greater than 200C. They
are listed below.
Material Comment
Polytetrafluorethylene,
PTFE
PTFE (Teflon) is used as non-stick
coatings for cooking ware, easily surviving
the temperatures of baking and frying.
Polyetheretherketone,
PEEK
PEEK is a high-temperature structural
polymer. The problem is its cost – about
40 times that of polypropylene.
Silicone elastomers Silicones are polymers with a Si-O-Si
chain structure instead of the C-C-C chain
of polyolefins. They are more stable than
carbon-based polymers, but expensive.
E 3.19 (a) Use the Young’s modulus-Relative cost ( RCE − ) chart (Figure
4.18) to find the cheapest materials with a modulus, E, greater than 100 GPa.
(b) Use the Strength-Relative cost ( Rf C−σ ) chart (Figure 4.19) to
find the cheapest materials with a strength, fσ , above 100MPa.
Answer. (a) The two cheap classes of material that meet the constraints are
cast irons and carbon steels.
(b) Cast irons and steels are again the best choice. It is because of their
high stiffness and strength at low cost that they are so widely used.
© Granta Design, January 2009
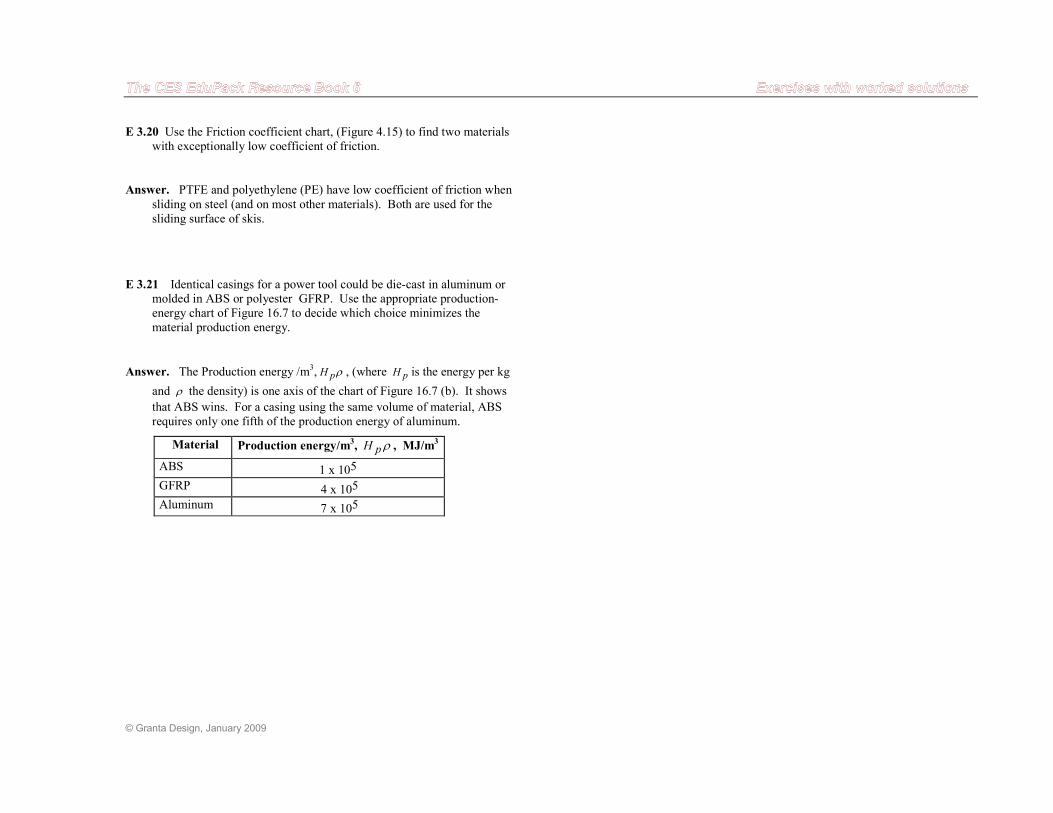
E 3.20 Use the Friction coefficient chart, (Figure 4.15) to find two materials
with exceptionally low coefficient of friction.
Answer. PTFE and polyethylene (PE) have low coefficient of friction when
sliding on steel (and on most other materials). Both are used for the
sliding surface of skis.
E 3.21 Identical casings for a power tool could be die-cast in aluminum or
molded in ABS or polyester GFRP. Use the appropriate production-
energy chart of Figure 16.7 to decide which choice minimizes the
material production energy.
Answer. The Production energy /m3, ρpH , (where pH is the energy per kg
and ρ the density) is one axis of the chart of Figure 16.7 (b). It shows
that ABS wins. For a casing using the same volume of material, ABS
requires only one fifth of the production energy of aluminum.
Material Production energy/m3, ρpH , MJ/m
3
ABS 1 x 10⁵
GFRP 4 x 10⁵ Aluminum 7 x 10⁵
© Granta Design, January 2009
E4. Translation: constraints and objectives
Translation is the task of re-expressing design requirements in terms that
enable material and process selection. Tackle the exercises by formulating
the answers to the questions in this table. Don’t try to model the behavior at this point (that comes in later exercises). Just think out what the component
does, and list the constraints that this imposes on material choice, including
processing requirements.
Function • What does component do?
Constraints • What essential conditions must be met?
Objective • What is to be maximized or minimized?
Free variables • What parameters of the problem is the
designer free to change?
Here it is important to recognize the distinction between constraints and
objectives. As the table says, a constraint is an essential condition that must
be met, usually expressed as a limit on a material or process attribute. An
objective is an quantity for which an extremum (a maximum or minimum) is
sought, frequently cost, mass or volume, but there are others, several of
which appear in the exercises below. Take the example of a bicycle frame. It
must have a certain stiffness and strength. If it is not stiff and strong enough
it will not work, but it is never required to have infinite stiffness or strength.
Stiffness and strength are therefore constraints that become limits on modulus, elastic limit and shape. If the bicycle is for sprint racing, it should
be as light as possible – if you could make it infinitely light, that would be
best of all. Minimizing mass, here, is the objective, perhaps with an upper
limit (a constraint) on cost. If instead it is a shopping bike to be sold through
supermarkets it should be as cheap as possible – the cheaper it is, the more
will be sold. This time minimizing cost is the objective, possible with an
upper limit (a constraint) on mass. For most bikes, of course, minimizing
mass and cost are both objectives, and then trade-off methods are needed.
They come later. For now use judgement to choose the single most important
objective and make all others into constraints.
Two rules-of-thumb, useful in many “translation” exercises. Many
applications require sufficient fracture toughness for the component can
survive mishandling and accidental impact during service; a totally brittle
material (like un-toughened glass) is unsuitable. Then a necessary constraint
is that of “adequate toughness”. This is achieved by requiring that the
fracture toughness 2/1c1 m.MPa15K > . Other applications require some
ductility, sufficient to allow stress redistribution under loading points, and
some ability to bend or shape the material plastically. This is achieved by
requiring that the (tensile) ductility %2f >ε .
(If the CES software is available it can be used to impose the constraints and
to rank the survivors using the objective.)
© Granta Design, January 2009
E4.1 A material is required for the windings of an electric air-furnace
capable of temperatures up to 1000oC. Think out what attributes a
material must have if it is to be made into windings and function
properly in a furnace. List the function and the constraints; set the
objective to “minimize cost” and the free variables to “choice of
material”.
Answer. If the material is to be used as windings it must be able to be drawn
to wire and wound to a coil, requiring ductility. It must conduct
electricity and be able to operate at 1000oC in air. The constraints are
tabulated below.
Function • High temperature furnace winding
Constraints • Maximum service temperature, Tmax > 1000 C
• Able to be rolled or drawn to wire
• Good electrical conductor
• Some ductility so that it can be wound,
%2f >ε
• Good resistance to oxidation at elevated
temperature
Objective • Minimize material cost
Free variables • Choice of material
E4.2 A material is required to manufacture office scissors. Paper is an
abrasive material, and scissors sometimes encounter hard obstacles like
staples. List function and constraints; set the objective to “minimize
cost” and the free variables to “choice of material”.
Answer. To resist abrasive wear the scissors must have blades of high
hardness. In cutting, they will sooner or later encounter a staple or other
hard obstruction that would chip a brittle blade – some toughness is
required. These two parameters help reduce wear, but there are other
factors that influence it, so it is sensible to specify good wear resistance.
Finally, the scissors must be formed – if the handles are integral with
the blades, they must be forged or stamped from sheet, requiring the
ability to be processed in this way.
Function • Scissors
Constraints • High hardness
• Adequate toughness: 2/1c1 m.MPa15K >
• Good wear resistance
• Able to be forged
Objective • Minimize material cost
Free variables • Choice of material
E4.3 A material is required for a heat exchanger to extract heat from
geo-thermally heated, saline, water at 120oC (and thus under pressure).
List function and constraints; set the objective to “minimize cost” and
the free variables to “choice of material”.
Answer. The obvious constraints here are those on service-temperature,
corrosion resistance, the ability to conduct heat well and strength.
There are manufacturing constraints too: if the heat exchanger is to be
made from tubes or folded sheet, the material must be available in
these forms, and have sufficient ductility to allow manufacture.
Function • Heat exchanger
Constraints • Maximum service temperature, Tmax > 120 C
• Good thermal conductor
• Resistance to corrosion in salt water:
good/excellent
• Sufficient strength to support the pressure of
the super-heated water
• Ability to be rolled to sheet or tube
• Adequate ductility to allow shaping,
%2f >ε
Objective • Minimize material cost
Free variables • Choice of material
© Granta Design, January 2009
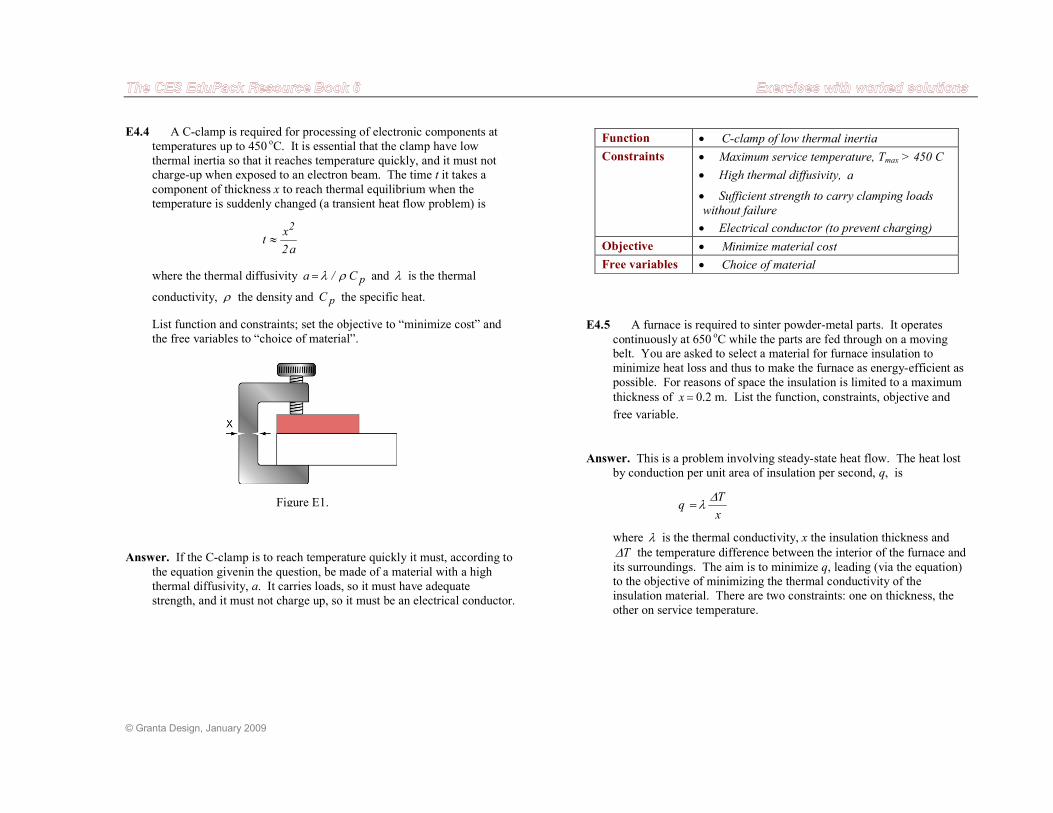
E4.4 A C-clamp is required for processing of electronic components at
temperatures up to 450 oC. It is essential that the clamp have low
thermal inertia so that it reaches temperature quickly, and it must not
charge-up when exposed to an electron beam. The time t it takes a
component of thickness x to reach thermal equilibrium when the
temperature is suddenly changed (a transient heat flow problem) is
a2
xt
2
≈
where the thermal diffusivity pC/a ρλ= and λ is the thermal
conductivity, ρ the density and pC the specific heat.
List function and constraints; set the objective to “minimize cost” and
the free variables to “choice of material”.
Answer. If the C-clamp is to reach temperature quickly it must, according to
the equation givenin the question, be made of a material with a high
thermal diffusivity, a. It carries loads, so it must have adequate
strength, and it must not charge up, so it must be an electrical conductor.
Figure E1.
Function • C-clamp of low thermal inertia
Constraints • Maximum service temperature, Tmax > 450 C
• High thermal diffusivity, a
• Sufficient strength to carry clamping loads
without failure
• Electrical conductor (to prevent charging)
Objective • Minimize material cost
Free variables • Choice of material
E4.5 A furnace is required to sinter powder-metal parts. It operates
continuously at 650 oC while the parts are fed through on a moving
belt. You are asked to select a material for furnace insulation to
minimize heat loss and thus to make the furnace as energy-efficient as
possible. For reasons of space the insulation is limited to a maximum
thickness of =x 0.2 m. List the function, constraints, objective and
free variable.
Answer. This is a problem involving steady-state heat flow. The heat lost
by conduction per unit area of insulation per second, q, is
x
Tq
∆λ=
where λ is the thermal conductivity, x the insulation thickness and
T∆ the temperature difference between the interior of the furnace and
its surroundings. The aim is to minimize q, leading (via the equation)
to the objective of minimizing the thermal conductivity of the
insulation material. There are two constraints: one on thickness, the
other on service temperature.
© Granta Design, January 2009
Function • Insulation for energy-efficient furnace
Constraints • Maximum service temperature, Tmax > 650 C
• Insulation thickness ≤x 0.2 m
Objective • Minimize thermal conductivity λ
Free variables • Choice of material
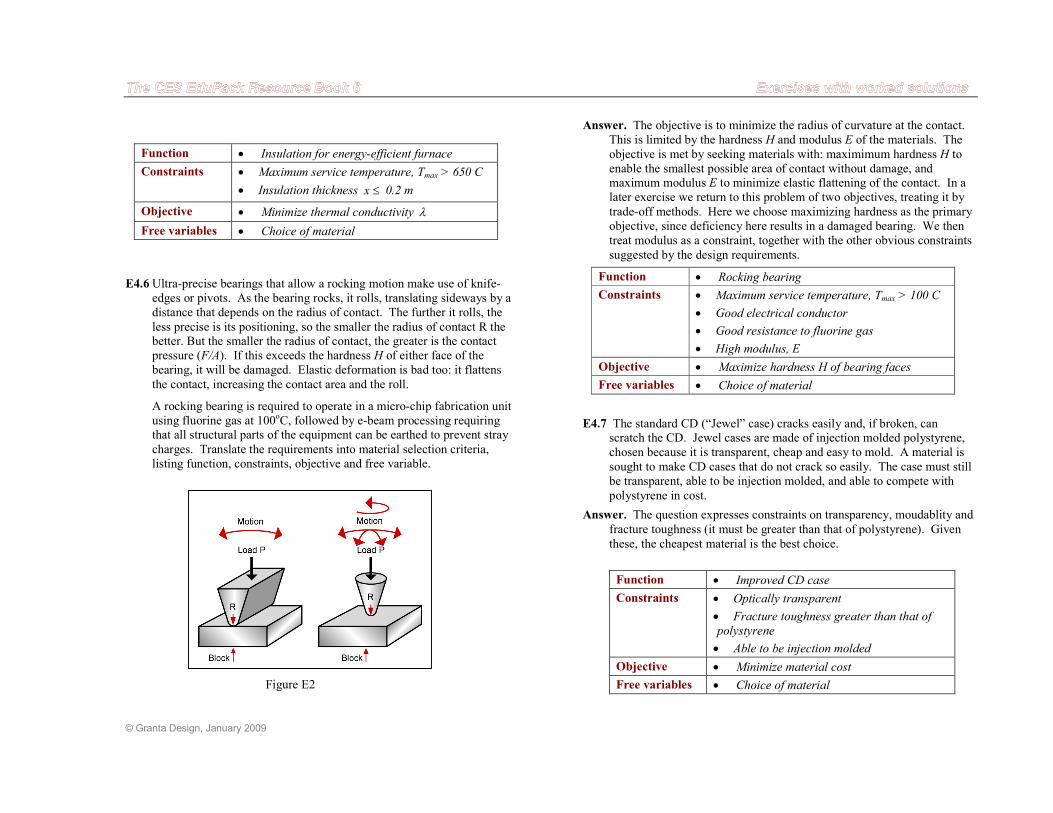
E4.6 Ultra-precise bearings that allow a rocking motion make use of knife-
edges or pivots. As the bearing rocks, it rolls, translating sideways by a
distance that depends on the radius of contact. The further it rolls, the
less precise is its positioning, so the smaller the radius of contact R the
better. But the smaller the radius of contact, the greater is the contact
pressure (F/A). If this exceeds the hardness H of either face of the
bearing, it will be damaged. Elastic deformation is bad too: it flattens
the contact, increasing the contact area and the roll.
A rocking bearing is required to operate in a micro-chip fabrication unit
using fluorine gas at 100oC, followed by e-beam processing requiring
that all structural parts of the equipment can be earthed to prevent stray
charges. Translate the requirements into material selection criteria,
listing function, constraints, objective and free variable.
Figure E2
Answer. The objective is to minimize the radius of curvature at the contact.
This is limited by the hardness H and modulus E of the materials. The
objective is met by seeking materials with: maximimum hardness H to
enable the smallest possible area of contact without damage, and
maximum modulus E to minimize elastic flattening of the contact. In a
later exercise we return to this problem of two objectives, treating it by
trade-off methods. Here we choose maximizing hardness as the primary
objective, since deficiency here results in a damaged bearing. We then
treat modulus as a constraint, together with the other obvious constraints
suggested by the design requirements.
Function • Rocking bearing
Constraints • Maximum service temperature, Tmax > 100 C
• Good electrical conductor
• Good resistance to fluorine gas
• High modulus, E
Objective • Maximize hardness H of bearing faces
Free variables • Choice of material
E4.7 The standard CD (“Jewel” case) cracks easily and, if broken, can
scratch the CD. Jewel cases are made of injection molded polystyrene,
chosen because it is transparent, cheap and easy to mold. A material is
sought to make CD cases that do not crack so easily. The case must still
be transparent, able to be injection molded, and able to compete with
polystyrene in cost.
Answer. The question expresses constraints on transparency, moudablity and
fracture toughness (it must be greater than that of polystyrene). Given
these, the cheapest material is the best choice.
Function • Improved CD case
Constraints • Optically transparent
• Fracture toughness greater than that of
polystyrene
• Able to be injection molded
Objective • Minimize material cost
Free variables • Choice of material
© Granta Design, January 2009
E4.8 A storage heater captures heat over a period of time, then releases it,
usually to an air stream, when required. Those for domestic heating
store solar energy or energy from cheap off-peak electricity and release
it slowly during the cold part of the day. Those for research release the
heat to a supersonic air stream to test system behavior in supersonic
flight. What is a good material for the core of a compact storage
material capable of temperatures up to 120oC?
Answer. When a material is heated from room temperature To to a working
temperature T, it absorbs heat Q per unit volume where
)TT(CQ op −= ρ
and p
C is the specific heat of the material of the core (in J/kg.C) and
ρ is its density (in kg/m3). Thus the most compact storage heater is
one made from a material with a high ρp
C . Even a small storage
heater contains a considerable quantity of core (that is why they are
heavy), so it is probable that an objective will be to minimize its cost
per unit volume. If, however, space were critical, maximizing ρp
C
might become the objective.
Function • Core for compact storage heater
Constraints • Maximum service temperature, Tmax > 120 C
• High heat capacity per unit volume ρp
C
Objective • Minimize material cost per unit volume
Free variables • Choice of material
© Granta Design, January 2009
E5. Deriving and using material indices
The exercises in this section give practice in deriving indices.
(a) Start each by listing function, constraints, objectives and free variables;
without having those straight, you will get in a mess. Then write down
an equation for the objective. Consider whether it contains a free
variable other than material choice; if it does, identify the constraint that
limits it, substitute, and read off the material index.
(b) If the CES Edu software is available, use it to apply the constraints and
rank the survivors using the index (start with the Level 2 database). Are
the results sensible? If not, what constraint has been overlooked or
incorrectly formulated?
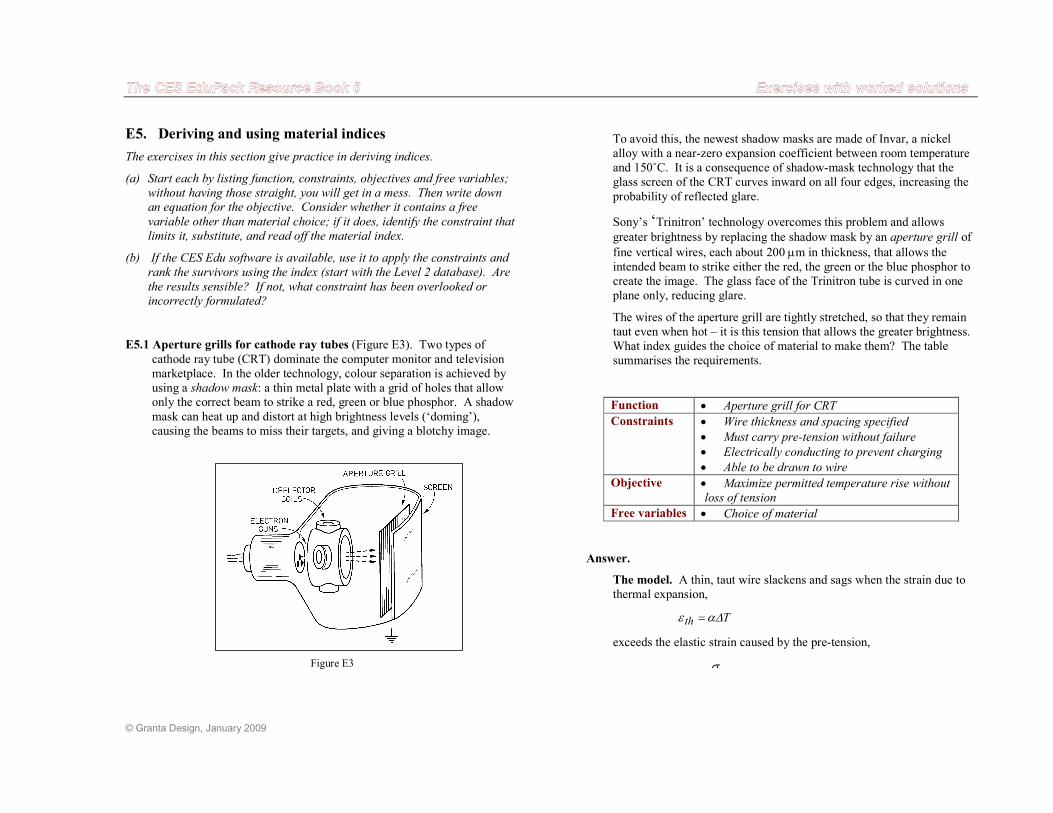
E5.1 Aperture grills for cathode ray tubes (Figure E3). Two types of
cathode ray tube (CRT) dominate the computer monitor and television
marketplace. In the older technology, colour separation is achieved by
using a shadow mask: a thin metal plate with a grid of holes that allow
only the correct beam to strike a red, green or blue phosphor. A shadow
mask can heat up and distort at high brightness levels (‘doming’),
causing the beams to miss their targets, and giving a blotchy image.
To avoid this, the newest shadow masks are made of Invar, a nickel
alloy with a near-zero expansion coefficient between room temperature
and 150˚C. It is a consequence of shadow-mask technology that the
glass screen of the CRT curves inward on all four edges, increasing the
probability of reflected glare.
Sony’s ‘Trinitron’ technology overcomes this problem and allows
greater brightness by replacing the shadow mask by an aperture grill of
fine vertical wires, each about 200 µm in thickness, that allows the
intended beam to strike either the red, the green or the blue phosphor to
create the image. The glass face of the Trinitron tube is curved in one
plane only, reducing glare.
The wires of the aperture grill are tightly stretched, so that they remain
taut even when hot – it is this tension that allows the greater brightness.
What index guides the choice of material to make them? The table
summarises the requirements.
Function • Aperture grill for CRT
Constraints • Wire thickness and spacing specified
• Must carry pre-tension without failure
• Electrically conducting to prevent charging
• Able to be drawn to wire
Objective • Maximize permitted temperature rise without
loss of tension
Free variables • Choice of material
Answer.
The model. A thin, taut wire slackens and sags when the strain due to
thermal expansion,
Tth ∆αε =
exceeds the elastic strain caused by the pre-tension,
σε = .
Figure E3
© Granta Design, January 2009
Here α is the thermal expansion coefficient of the wire, T∆ the
temperature rise caused by the electron beams that strike it, σ the
tensile pre-stress in the wire and E its modulus. We wish to maximize
the brightness, and thus T∆ .
The tension is limited by the elastic limit of the wire, fσ . Inserting
this and writing
thpt εε ≥
as the condition that the wire remains taut gives
α
σ∆
ET
f= .
The result could hardly be simpler. To maximize the brightness,
maximize
.E
Mf
α
σ=
There is a second requirement. The wires must conduct, otherwise they
would charge up, distorting the image. We therefore require, also, that
the material be a good electrical conductor and that it is capable of
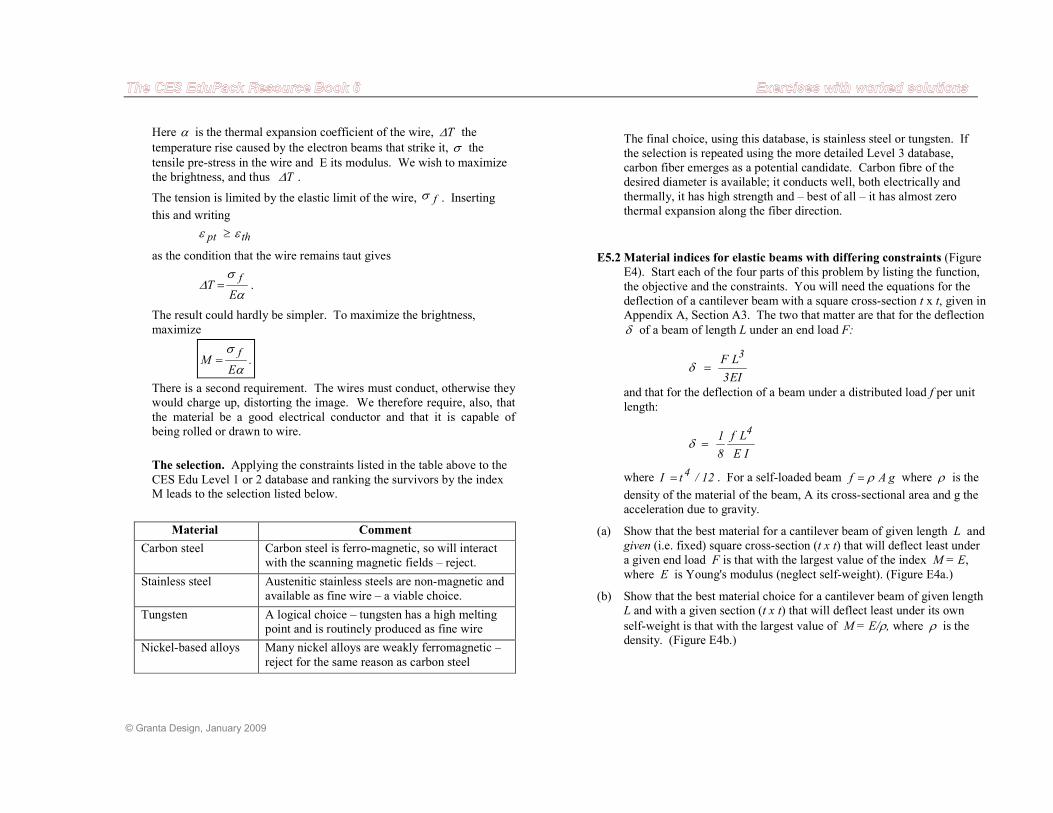
being rolled or drawn to wire.
The selection. Applying the constraints listed in the table above to the
CES Edu Level 1 or 2 database and ranking the survivors by the index
M leads to the selection listed below.
Material Comment
Carbon steel Carbon steel is ferro-magnetic, so will interact
with the scanning magnetic fields – reject.
Stainless steel Austenitic stainless steels are non-magnetic and
available as fine wire – a viable choice.
Tungsten A logical choice – tungsten has a high melting
point and is routinely produced as fine wire
Nickel-based alloys Many nickel alloys are weakly ferromagnetic –
reject for the same reason as carbon steel
The final choice, using this database, is stainless steel or tungsten. If
the selection is repeated using the more detailed Level 3 database,
carbon fiber emerges as a potential candidate. Carbon fibre of the
desired diameter is available; it conducts well, both electrically and
thermally, it has high strength and – best of all – it has almost zero
thermal expansion along the fiber direction.
E5.2 Material indices for elastic beams with differing constraints (Figure
E4). Start each of the four parts of this problem by listing the function,
the objective and the constraints. You will need the equations for the
deflection of a cantilever beam with a square cross-section t x t, given in
Appendix A, Section A3. The two that matter are that for the deflection
δ of a beam of length L under an end load F:
EI3
LF3
=δ
and that for the deflection of a beam under a distributed load f per unit
length:
IE
Lf
8
14
=δ
where 12/tI 4= . For a self-loaded beam gAf ρ= where ρ is the
density of the material of the beam, A its cross-sectional area and g the
acceleration due to gravity.
(a) Show that the best material for a cantilever beam of given length L and
given (i.e. fixed) square cross-section (t x t) that will deflect least under
a given end load F is that with the largest value of the index M = E,
where E is Young's modulus (neglect self-weight). (Figure E4a.)
(b) Show that the best material choice for a cantilever beam of given length
L and with a given section (t x t) that will deflect least under its own
self-weight is that with the largest value of M = E/ρ, where ρ is the density. (Figure E4b.)
© Granta Design, January 2009
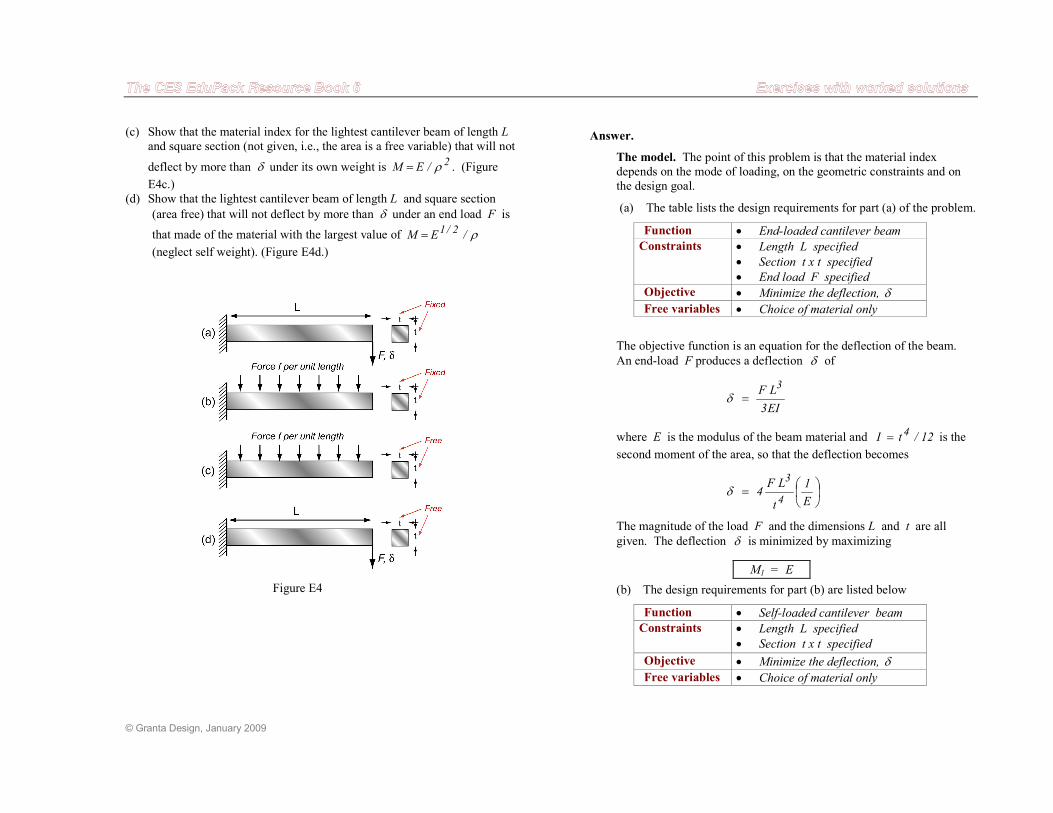
(c) Show that the material index for the lightest cantilever beam of length L
and square section (not given, i.e., the area is a free variable) that will not
deflect by more than δ under its own weight is 2/EM ρ= . (Figure
E4c.)
(d) Show that the lightest cantilever beam of length L and square section
(area free) that will not deflect by more than δ under an end load F is
that made of the material with the largest value of ρ/EM 2/1=
(neglect self weight). (Figure E4d.)
Figure E4
Answer.
The model. The point of this problem is that the material index
depends on the mode of loading, on the geometric constraints and on
the design goal.
(a) The table lists the design requirements for part (a) of the problem.
Function • End-loaded cantilever beam
Constraints
• Length L specified
• Section t x t specified
• End load F specified
Objective • Minimize the deflection, δ Free variables • Choice of material only
The objective function is an equation for the deflection of the beam.
An end-load F produces a deflection δ of
EI3
LF3
=δ
where E is the modulus of the beam material and 12/tI 4= is the
second moment of the area, so that the deflection becomes
=
E
1
t
LF4
4
3
δ
The magnitude of the load F and the dimensions L and t are all
given. The deflection δ is minimized by maximizing
M1 = E
(b) The design requirements for part (b) are listed below
Function • Self-loaded cantilever beam
Constraints
• Length L specified
• Section t x t specified
Objective • Minimize the deflection, δ Free variables • Choice of material only
© Granta Design, January 2009
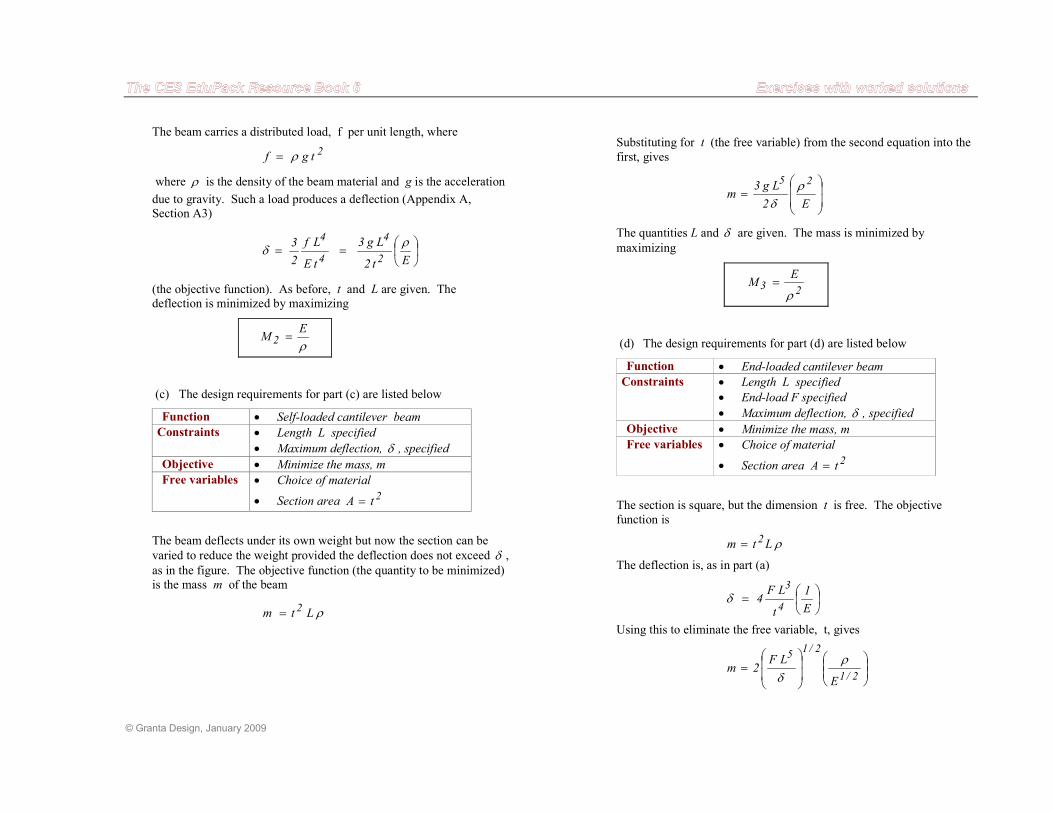
The beam carries a distributed load, f per unit length, where
2tgf ρ=
where ρ is the density of the beam material and g is the acceleration
due to gravity. Such a load produces a deflection (Appendix A,
Section A3)
==
Et2
Lg3
tE
Lf
2
3
2
4
4
4 ρδ
(the objective function). As before, t and L are given. The
deflection is minimized by maximizing
ρE
M 2 =
(c) The design requirements for part (c) are listed below
Function • Self-loaded cantilever beam
Constraints • Length L specified
• Maximum deflection, δ , specified Objective • Minimize the mass, m
Free variables • Choice of material
• Section area 2tA =
The beam deflects under its own weight but now the section can be
varied to reduce the weight provided the deflection does not exceed δ ,
as in the figure. The objective function (the quantity to be minimized)
is the mass m of the beam
ρLtm 2=
Substituting for t (the free variable) from the second equation into the
first, gives
=
E2
Lg3m
25 ρδ
The quantities L and δ are given. The mass is minimized by
maximizing
23E
Mρ
=
(d) The design requirements for part (d) are listed below
Function • End-loaded cantilever beam
Constraints • Length L specified
• End-load F specified
• Maximum deflection, δ , specified Objective • Minimize the mass, m
Free variables • Choice of material
• Section area 2tA =
The section is square, but the dimension t is free. The objective
function is
ρLtm 2=
The deflection is, as in part (a)
=
E
1
t
LF4
4
3
δ
Using this to eliminate the free variable, t, gives
=
2/1
2/15
E
LF2m
ρδ
© Granta Design, January 2009
The quantities F , δ and L are given. The mass is minimized by
maximizing
ρ
2/1
4E
M =
From a selection standpoint, M3 and M4 are equivalent.
The selection. Applying the three indices to the CES Edu Level 1 or 2
database gives the top-ranked candidates listed below.
Index Material choice
High M1 = E
Metals: tungsten alloys, steels.
Ceramics: SiC, Si3N4, B4C and AlN, but of
course all are brittle.
ρE
MHigh 2 =
Metals: aluminum, magnesium, titanium alloys
and steels all have almost the same value of
ρ/E
Composites: CFRP
Ceramics SiC, Si3N4, B4C and AlN
ρ
2/1
4E
MHigh =
Metals: aluminum and magnesium alloys
superior to all other metals.
Composites: CFRP excels
Ceramics: SiC, Si3N4, B4C and AlN
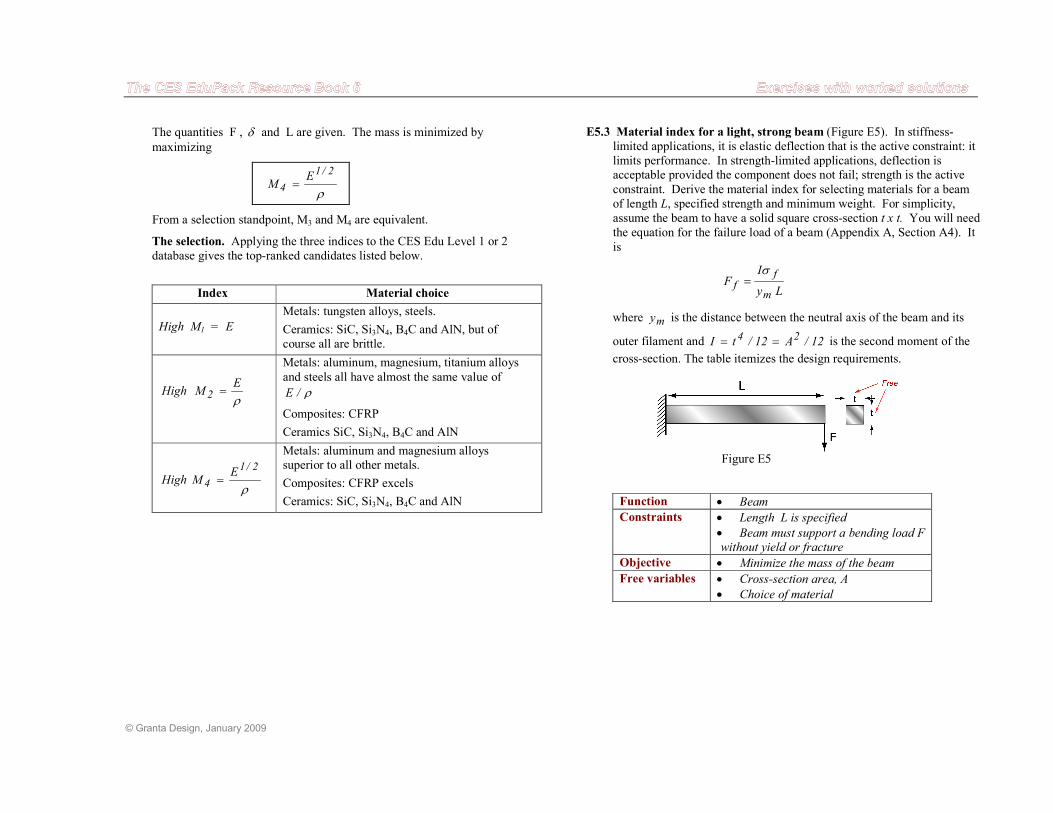
E5.3 Material index for a light, strong beam (Figure E5). In stiffness-
limited applications, it is elastic deflection that is the active constraint: it
limits performance. In strength-limited applications, deflection is
acceptable provided the component does not fail; strength is the active
constraint. Derive the material index for selecting materials for a beam
of length L, specified strength and minimum weight. For simplicity,
assume the beam to have a solid square cross-section t x t. You will need
the equation for the failure load of a beam (Appendix A, Section A4). It
is
Ly
IF
m
ff
σ=
where my is the distance between the neutral axis of the beam and its
outer filament and 12/A12/tI 24 == is the second moment of the
cross-section. The table itemizes the design requirements.
Figure E5
Function • Beam
Constraints • Length L is specified
• Beam must support a bending load F
without yield or fracture
Objective • Minimize the mass of the beam
Free variables • Cross-section area, A
• Choice of material
© Granta Design, January 2009
Answer.
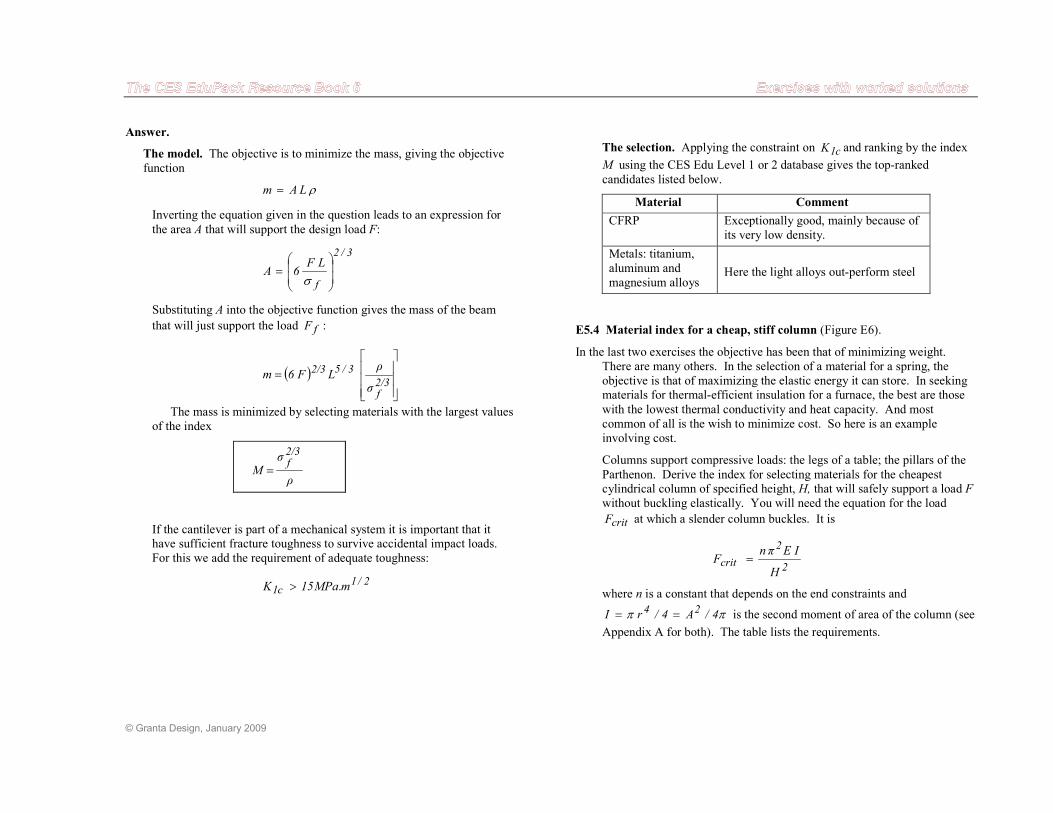
The model. The objective is to minimize the mass, giving the objective
function
ρLAm =
Inverting the equation given in the question leads to an expression for
the area A that will support the design load F:
3/2
f
LF6A
=
σ
Substituting A into the objective function gives the mass of the beam
that will just support the load fF :
( )
=
2/3f
3/52/3
σ
ρLF6m
The mass is minimized by selecting materials with the largest values
of the index
ρ
σ M
2/3f
=
If the cantilever is part of a mechanical system it is important that it
have sufficient fracture toughness to survive accidental impact loads.
For this we add the requirement of adequate toughness:
2/1c1 m.MPa15K >
The selection. Applying the constraint on c1K and ranking by the index
M using the CES Edu Level 1 or 2 database gives the top-ranked
candidates listed below.
Material Comment
CFRP Exceptionally good, mainly because of
its very low density.
Metals: titanium,
aluminum and
magnesium alloys
Here the light alloys out-perform steel
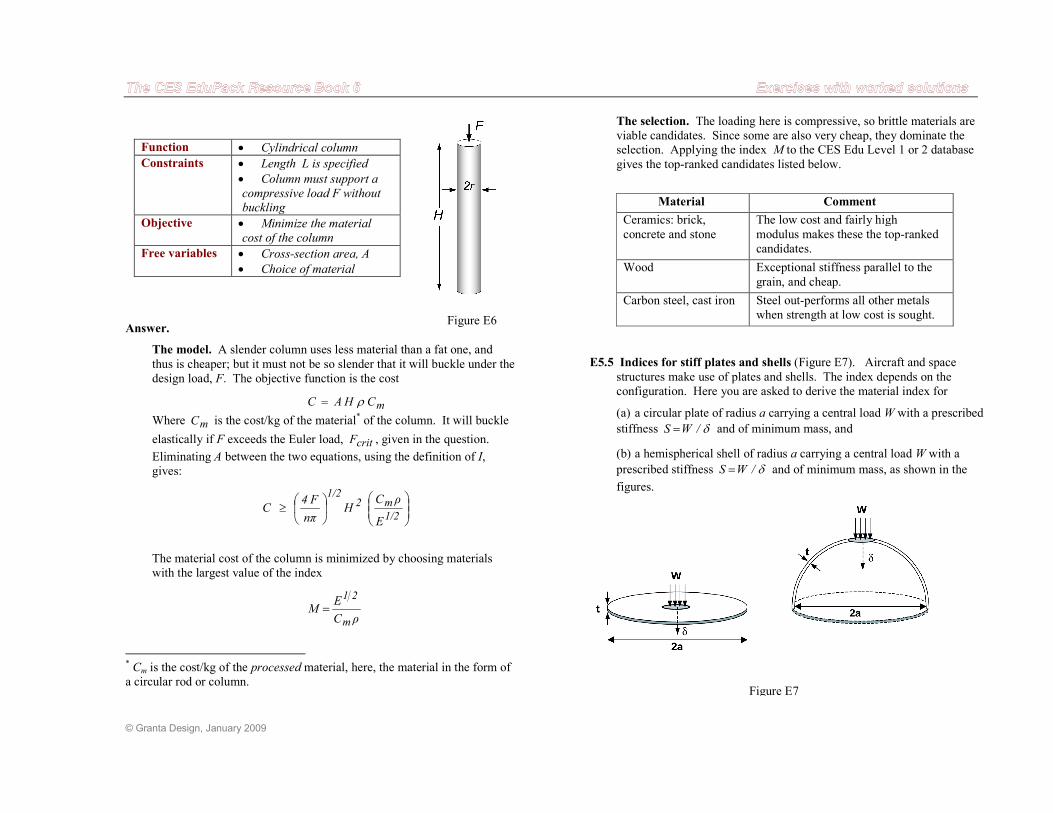
E5.4 Material index for a cheap, stiff column (Figure E6).
In the last two exercises the objective has been that of minimizing weight.
There are many others. In the selection of a material for a spring, the
objective is that of maximizing the elastic energy it can store. In seeking
materials for thermal-efficient insulation for a furnace, the best are those
with the lowest thermal conductivity and heat capacity. And most
common of all is the wish to minimize cost. So here is an example
involving cost.
Columns support compressive loads: the legs of a table; the pillars of the
Parthenon. Derive the index for selecting materials for the cheapest
cylindrical column of specified height, H, that will safely support a load F
without buckling elastically. You will need the equation for the load
critF at which a slender column buckles. It is
2
2
critH
I EπnF =
where n is a constant that depends on the end constraints and
ππ 4/A4/rI 24 == is the second moment of area of the column (see
Appendix A for both). The table lists the requirements.
© Granta Design, January 2009
Function • Cylindrical column
Constraints • Length L is specified
• Column must support a
compressive load F without
buckling
Objective • Minimize the material
cost of the column
Free variables • Cross-section area, A
• Choice of material
Answer.
The model. A slender column uses less material than a fat one, and
thus is cheaper; but it must not be so slender that it will buckle under the
design load, F. The objective function is the cost
mCHAC ρ=
Where mC is the cost/kg of the material* of the column. It will buckle
elastically if F exceeds the Euler load, critF , given in the question.
Eliminating A between the two equations, using the definition of I,
gives:
≥
1/2
m21/2
E
ρCH
nπ
F4 C
The material cost of the column is minimized by choosing materials
with the largest value of the index
ρC
E Mm
21
=
* Cm is the cost/kg of the processed material, here, the material in the form of
a circular rod or column.
Figure E6
The selection. The loading here is compressive, so brittle materials are
viable candidates. Since some are also very cheap, they dominate the
selection. Applying the index M to the CES Edu Level 1 or 2 database
gives the top-ranked candidates listed below.
Material Comment
Ceramics: brick,
concrete and stone
The low cost and fairly high
modulus makes these the top-ranked
candidates.
Wood Exceptional stiffness parallel to the
grain, and cheap.
Carbon steel, cast iron Steel out-performs all other metals
when strength at low cost is sought.
E5.5 Indices for stiff plates and shells (Figure E7). Aircraft and space
structures make use of plates and shells. The index depends on the
configuration. Here you are asked to derive the material index for
(a) a circular plate of radius a carrying a central load W with a prescribed
stiffness δ/WS = and of minimum mass, and
(b) a hemispherical shell of radius a carrying a central load W with a
prescribed stiffness δ/WS = and of minimum mass, as shown in the
figures.
Figure E7
© Granta Design, January 2009
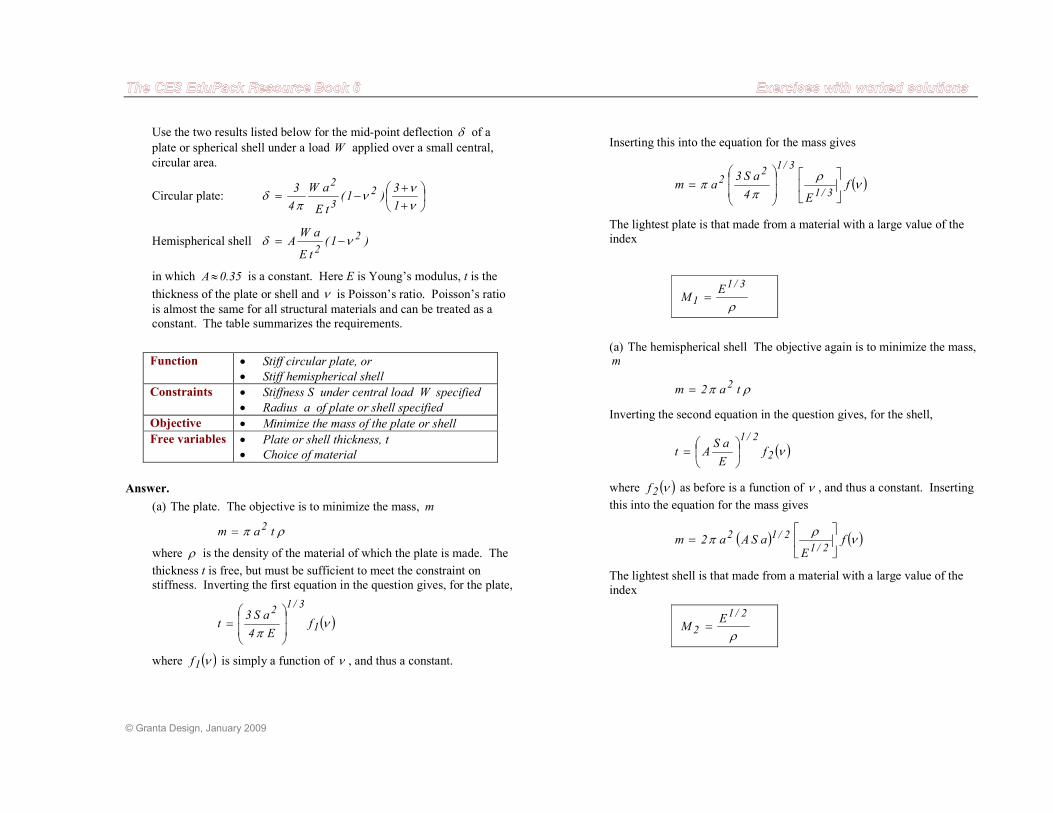
Use the two results listed below for the mid-point deflection δ of a
plate or spherical shell under a load W applied over a small central,
circular area.
Circular plate:
++
−=νν
νπ
δ1
3)1(
tE
aW
4
3 2
3
2
Hemispherical shell )1(tE
aWA 2
2νδ −=
in which 35.0A≈ is a constant. Here E is Young’s modulus, t is the
thickness of the plate or shell and ν is Poisson’s ratio. Poisson’s ratio
is almost the same for all structural materials and can be treated as a
constant. The table summarizes the requirements.
Function • Stiff circular plate, or
• Stiff hemispherical shell
Constraints • Stiffness S under central load W specified
• Radius a of plate or shell specified
Objective • Minimize the mass of the plate or shell
Free variables • Plate or shell thickness, t
• Choice of material
Answer.
(a) The plate. The objective is to minimize the mass, m
ρπ tam 2=
where ρ is the density of the material of which the plate is made. The
thickness t is free, but must be sufficient to meet the constraint on
stiffness. Inverting the first equation in the question gives, for the plate,
( )νπ 1
3/12
fE4
aS3t
=
where ( )ν1f is simply a function of ν , and thus a constant.
Inserting this into the equation for the mass gives
( )νρ
ππ f
E4
aS3am
3/1
3/12
2
=
The lightest plate is that made from a material with a large value of the
index
ρ
3/1
1E
M =
(a) The hemispherical shell The objective again is to minimize the mass, m
ρπ ta2m 2=
Inverting the second equation in the question gives, for the shell,
( )ν22/1
fE
aSAt
=
where ( )ν2f as before is a function of ν , and thus a constant. Inserting
this into the equation for the mass gives
( ) ( )νρ
π fE
aSAa2m2/1
2/12
=
The lightest shell is that made from a material with a large value of the
index
ρ
2/1
2E
M =
© Granta Design, January 2009
The index for the shell differs from that for the plate, requiring a
different choice of material. This is because the flat plate, when loaded,
deforms by bending. The hemispherical shell, by contrast, carries
membrane stresses (tension and compression in the plane of the shell
wall), and because of this is much stiffer. Singly-curved shells behave
like the plate, doubly-curved shells like the hemisphere.
The selection. Applying the three indices to the CES Edu Level 1 or 2
database gives the top-ranked candidates listed below.
Index Material choice
ρ
3/1
1E
MHigh =
Natural materials: wood and plywood
Composites: CFRP
ρ
2/1
2E
MHigh = Metals: aluminum and magnesium alloys
superior to all other metals.
Composites: CFRP
Ceramics: SiC, Si3N4, B4C and AlN
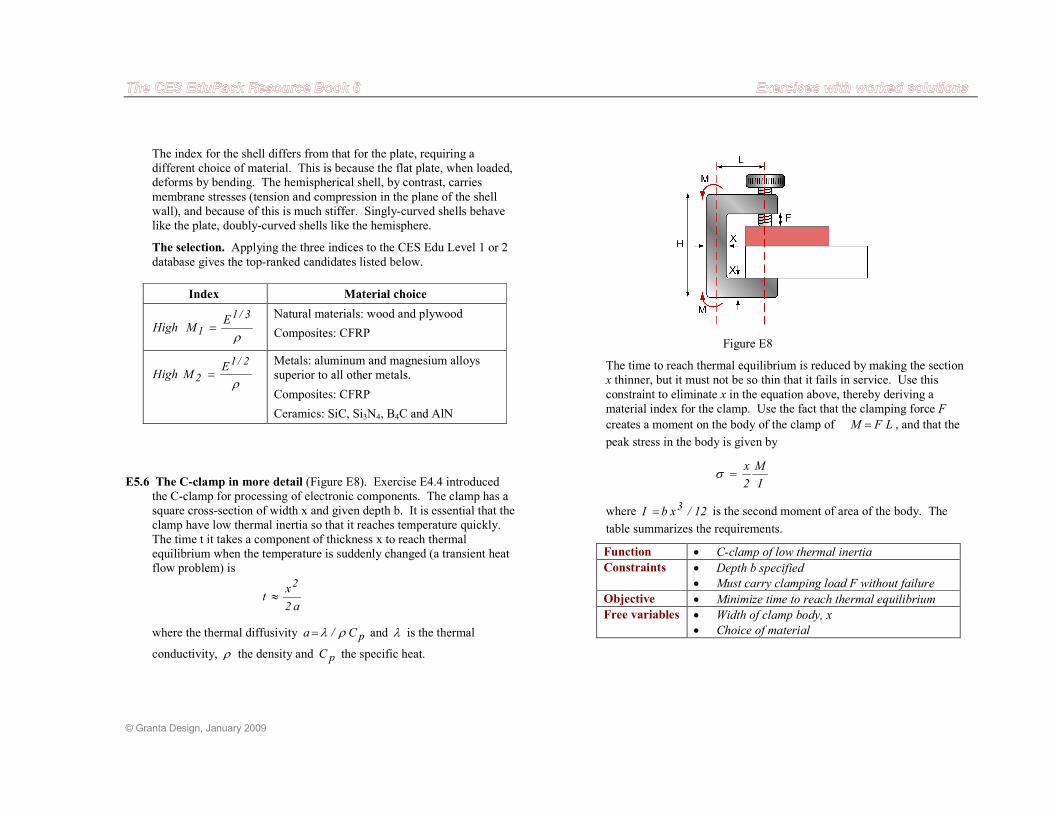
E5.6 The C-clamp in more detail (Figure E8). Exercise E4.4 introduced
the C-clamp for processing of electronic components. The clamp has a
square cross-section of width x and given depth b. It is essential that the
clamp have low thermal inertia so that it reaches temperature quickly.
The time t it takes a component of thickness x to reach thermal
equilibrium when the temperature is suddenly changed (a transient heat
flow problem) is
a2
xt
2
≈
where the thermal diffusivity pC/a ρλ= and λ is the thermal
conductivity, ρ the density and pC the specific heat.
Figure E8
The time to reach thermal equilibrium is reduced by making the section
x thinner, but it must not be so thin that it fails in service. Use this
constraint to eliminate x in the equation above, thereby deriving a
material index for the clamp. Use the fact that the clamping force F
creates a moment on the body of the clamp of LFM = , and that the
peak stress in the body is given by
I
M
2
x=σ
where 12/xbI 3= is the second moment of area of the body. The
table summarizes the requirements.
Function • C-clamp of low thermal inertia
Constraints • Depth b specified
• Must carry clamping load F without failure
Objective • Minimize time to reach thermal equilibrium
Free variables • Width of clamp body, x
• Choice of material
© Granta Design, January 2009
Answer. The clamp will fail if the stress in it exceeds its elastic limit
fσ . Equating the peak stress to fσ and solving for x gives
2/1
fb
LF6x
=
σ
Inserting this into the equation for the time to reach equilibrium gives
=
fa
1
b
LF3t
σ
The time is minimized by choosing materials with large values of the
index
.aM fσ=
Additional constraints on modulus E > 50 GPa (to ensure that the clamp
is sufficiently stiff) on fracture toughness 2/1c1 m.MPa18K > (to
guard against accidental impact) and on formability will, in practice, be
needed.
The selection. Applying the constraint on c1K and formability, and
ranking by the index M using the CES Edu Level 1 or 2 database gives
the top-ranked candidates listed below.
Material Comment
Aluminum alloys The obvious candidate – good thermal
conductor, adequately stiff and strong, and easy
to work.
Copper alloys Here the high thermal diffusivity of copper is
dominating the selection.
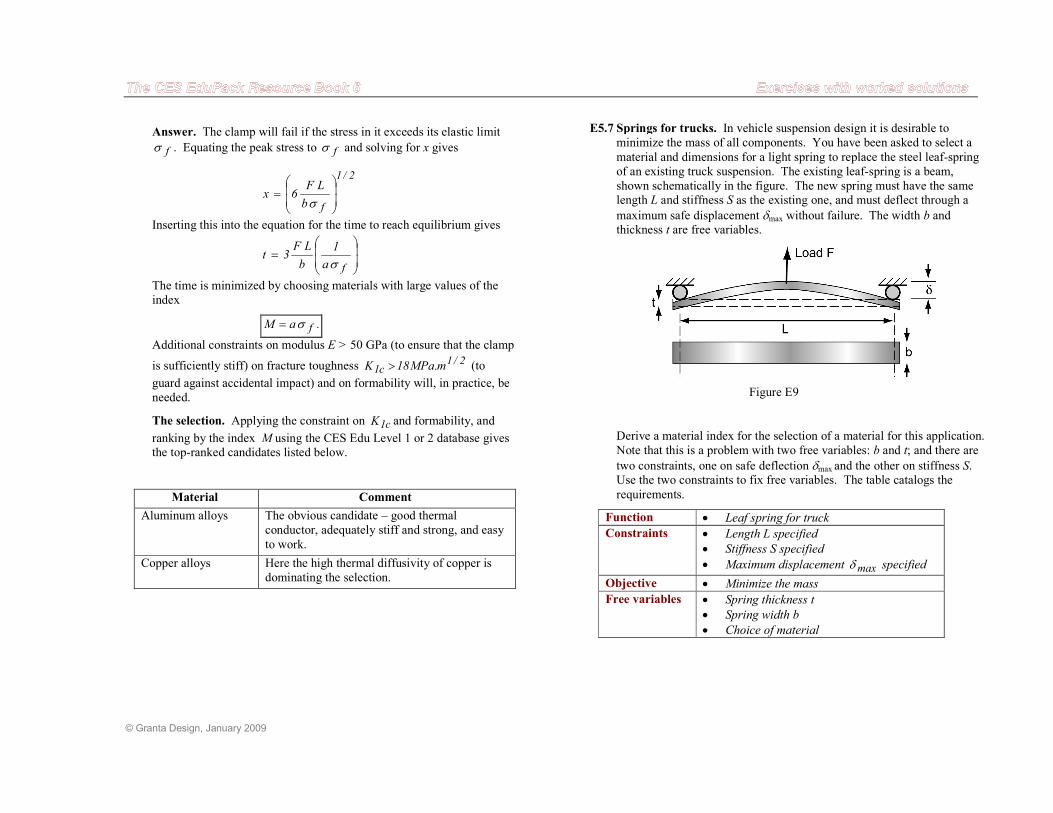
E5.7 Springs for trucks. In vehicle suspension design it is desirable to
minimize the mass of all components. You have been asked to select a
material and dimensions for a light spring to replace the steel leaf-spring
of an existing truck suspension. The existing leaf-spring is a beam,
shown schematically in the figure. The new spring must have the same
length L and stiffness S as the existing one, and must deflect through a
maximum safe displacement δmax without failure. The width b and thickness t are free variables.
Figure E9
Derive a material index for the selection of a material for this application.
Note that this is a problem with two free variables: b and t; and there are
two constraints, one on safe deflection δmax and the other on stiffness S. Use the two constraints to fix free variables. The table catalogs the
requirements.
Function • Leaf spring for truck
Constraints • Length L specified
• Stiffness S specified
• Maximum displacement maxδ specified
Objective • Minimize the mass
Free variables • Spring thickness t
• Spring width b
• Choice of material
© Granta Design, January 2009
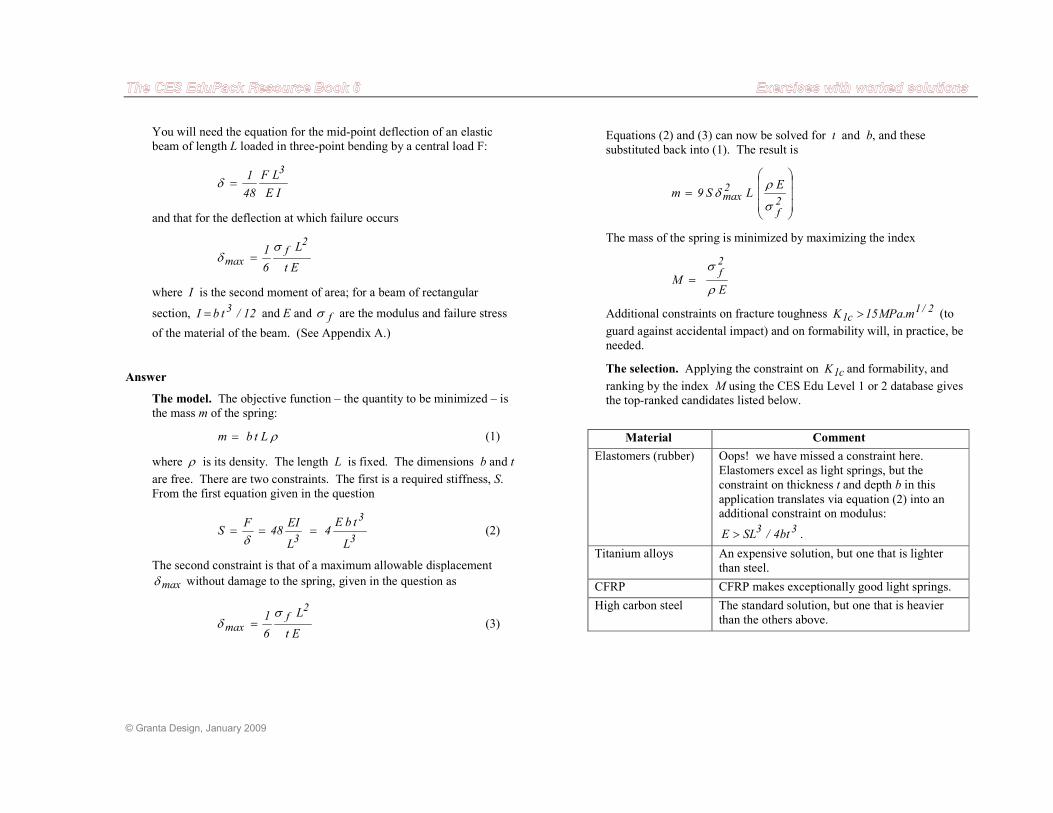
You will need the equation for the mid-point deflection of an elastic
beam of length L loaded in three-point bending by a central load F:
IE
LF
48
13
=δ
and that for the deflection at which failure occurs
Et
L
6
12
fmax
σδ =
where I is the second moment of area; for a beam of rectangular
section, 12/tbI 3= and E and fσ are the modulus and failure stress
of the material of the beam. (See Appendix A.)
Answer
The model. The objective function – the quantity to be minimized – is
the mass m of the spring:
ρLtbm = (1)
where ρ is its density. The length L is fixed. The dimensions b and t
are free. There are two constraints. The first is a required stiffness, S.
From the first equation given in the question
3
3
3 L
tbE4
L
EI48
FS ===
δ (2)
The second constraint is that of a maximum allowable displacement
maxδ without damage to the spring, given in the question as
Et
L
6
12
fmax
σδ = (3)
Equations (2) and (3) can now be solved for t and b, and these
substituted back into (1). The result is
=
2f
2max
ELS9m
σ
ρδ
The mass of the spring is minimized by maximizing the index
E
M
2f
ρ
σ=
Additional constraints on fracture toughness 2/1c1 m.MPa15K > (to
guard against accidental impact) and on formability will, in practice, be
needed.
The selection. Applying the constraint on c1K and formability, and
ranking by the index M using the CES Edu Level 1 or 2 database gives
the top-ranked candidates listed below.
Material Comment
Elastomers (rubber) Oops! we have missed a constraint here.
Elastomers excel as light springs, but the
constraint on thickness t and depth b in this
application translates via equation (2) into an
additional constraint on modulus:
33bt4/SLE > .
Titanium alloys An expensive solution, but one that is lighter
than steel.
CFRP CFRP makes exceptionally good light springs.
High carbon steel The standard solution, but one that is heavier
than the others above.
© Granta Design, January 2009
Figure E10
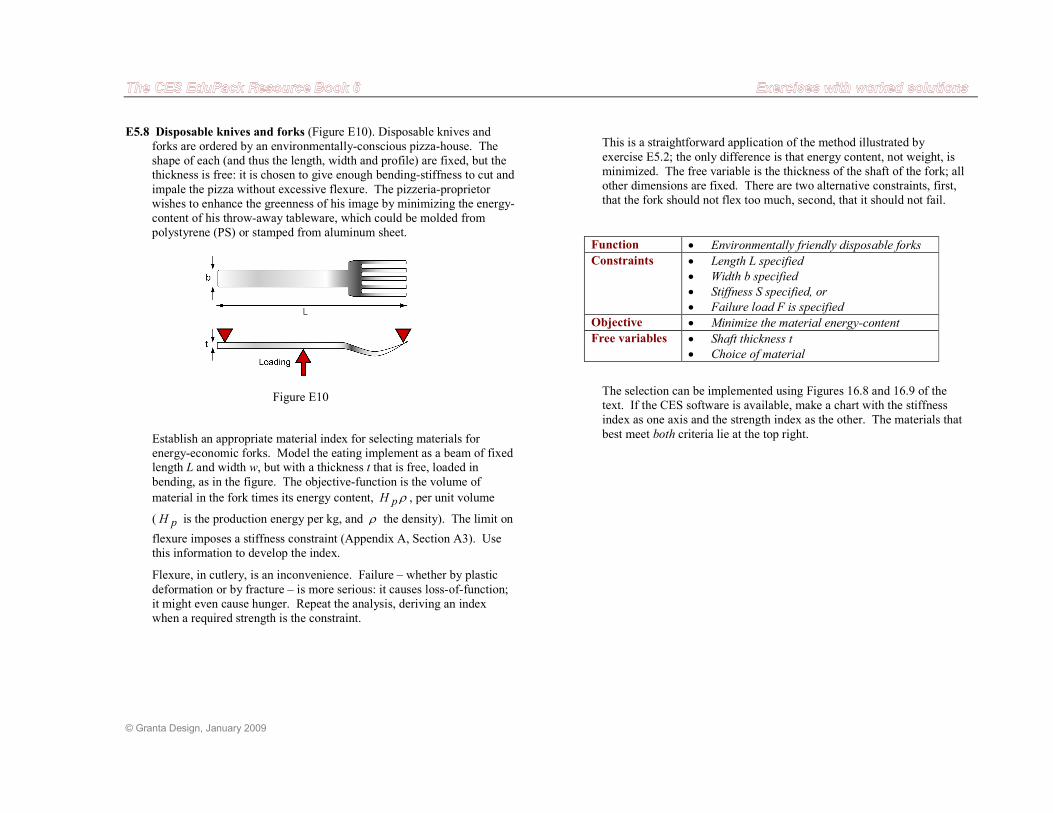
E5.8 Disposable knives and forks (Figure E10). Disposable knives and
forks are ordered by an environmentally-conscious pizza-house. The
shape of each (and thus the length, width and profile) are fixed, but the
thickness is free: it is chosen to give enough bending-stiffness to cut and
impale the pizza without excessive flexure. The pizzeria-proprietor
wishes to enhance the greenness of his image by minimizing the energy-
content of his throw-away tableware, which could be molded from
polystyrene (PS) or stamped from aluminum sheet.
Establish an appropriate material index for selecting materials for
energy-economic forks. Model the eating implement as a beam of fixed
length L and width w, but with a thickness t that is free, loaded in
bending, as in the figure. The objective-function is the volume of
material in the fork times its energy content, ρpH , per unit volume
( pH is the production energy per kg, and ρ the density). The limit on
flexure imposes a stiffness constraint (Appendix A, Section A3). Use
this information to develop the index.
Flexure, in cutlery, is an inconvenience. Failure – whether by plastic
deformation or by fracture – is more serious: it causes loss-of-function;
it might even cause hunger. Repeat the analysis, deriving an index
when a required strength is the constraint.
This is a straightforward application of the method illustrated by
exercise E5.2; the only difference is that energy content, not weight, is
minimized. The free variable is the thickness of the shaft of the fork; all
other dimensions are fixed. There are two alternative constraints, first,
that the fork should not flex too much, second, that it should not fail.
Function • Environmentally friendly disposable forks
Constraints • Length L specified
• Width b specified
• Stiffness S specified, or
• Failure load F is specified
Objective • Minimize the material energy-content
Free variables • Shaft thickness t
• Choice of material
The selection can be implemented using Figures 16.8 and 16.9 of the
text. If the CES software is available, make a chart with the stiffness
index as one axis and the strength index as the other. The materials that
best meet both criteria lie at the top right.
© Granta Design, January 2009
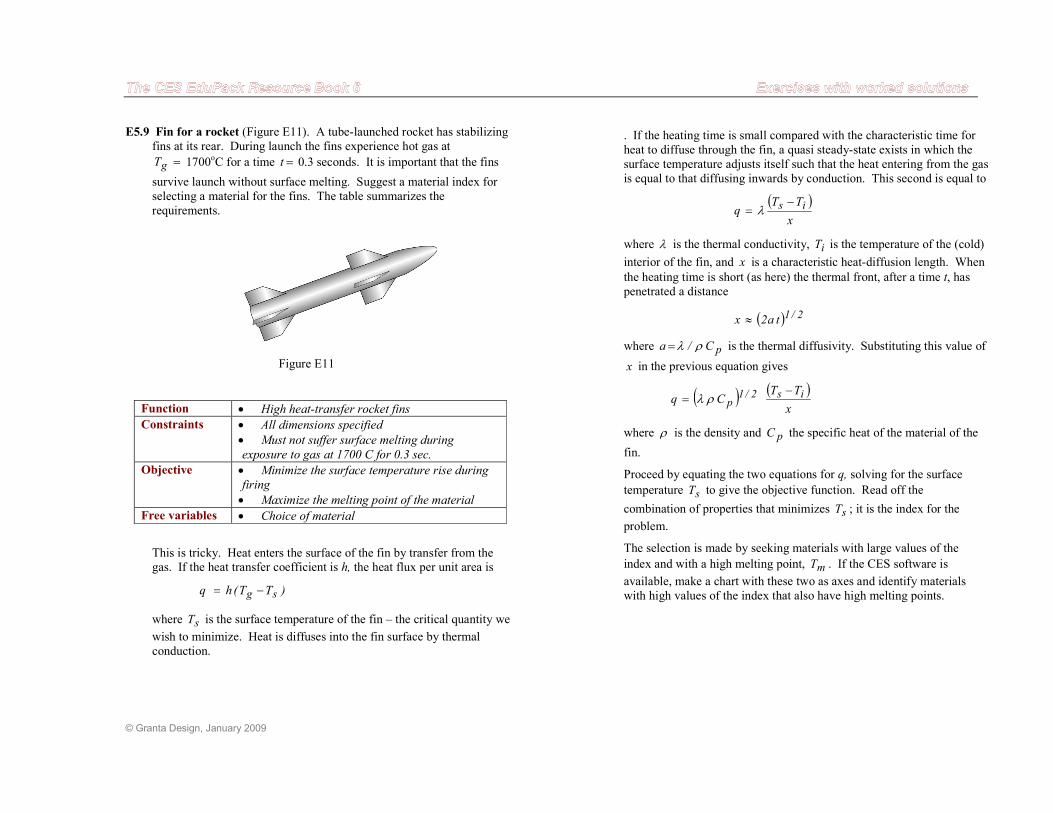
E5.9 Fin for a rocket (Figure E11). A tube-launched rocket has stabilizing
fins at its rear. During launch the fins experience hot gas at
=gT 1700oC for a time =t 0.3 seconds. It is important that the fins
survive launch without surface melting. Suggest a material index for
selecting a material for the fins. The table summarizes the
requirements.
Figure E11
Function • High heat-transfer rocket fins
Constraints • All dimensions specified
• Must not suffer surface melting during
exposure to gas at 1700 C for 0.3 sec.
Objective • Minimize the surface temperature rise during
firing
• Maximize the melting point of the material
Free variables • Choice of material
This is tricky. Heat enters the surface of the fin by transfer from the
gas. If the heat transfer coefficient is h, the heat flux per unit area is
)TT(hq sg −=
where sT is the surface temperature of the fin – the critical quantity we
wish to minimize. Heat is diffuses into the fin surface by thermal
conduction.
. If the heating time is small compared with the characteristic time for
heat to diffuse through the fin, a quasi steady-state exists in which the
surface temperature adjusts itself such that the heat entering from the gas
is equal to that diffusing inwards by conduction. This second is equal to
( )
x
TTq is −
= λ
where λ is the thermal conductivity, iT is the temperature of the (cold)
interior of the fin, and x is a characteristic heat-diffusion length. When
the heating time is short (as here) the thermal front, after a time t, has
penetrated a distance
( ) 2/1ta2x ≈
where pC/a ρλ= is the thermal diffusivity. Substituting this value of
x in the previous equation gives
( ) ( )x
TTCq is2/1p
−= ρλ
where ρ is the density and pC the specific heat of the material of the
fin.
Proceed by equating the two equations for q, solving for the surface
temperature sT to give the objective function. Read off the
combination of properties that minimizes sT ; it is the index for the
problem.
The selection is made by seeking materials with large values of the
index and with a high melting point, mT . If the CES software is
available, make a chart with these two as axes and identify materials
with high values of the index that also have high melting points.
© Granta Design, January 2009
Answer. Equating the equations and solving for sT gives
p
ipgs
Cth
TCtThT
ρλ
ρλ
+
+=
When t = 0 the surface temperature is TT = and the fin is completely
cold. When t is large, gs TT = and the surface temperature is equal to
the gas temperature. For a given t, sT is minimized by maximizing
pCρλ . The first index is therefore
p1 CM ρλ=
and index that often appears in problems involving transient heat flow.
Melting is also made less likely by choosing a material with a high
melting point mT . The second index is therefore
m2 TM =
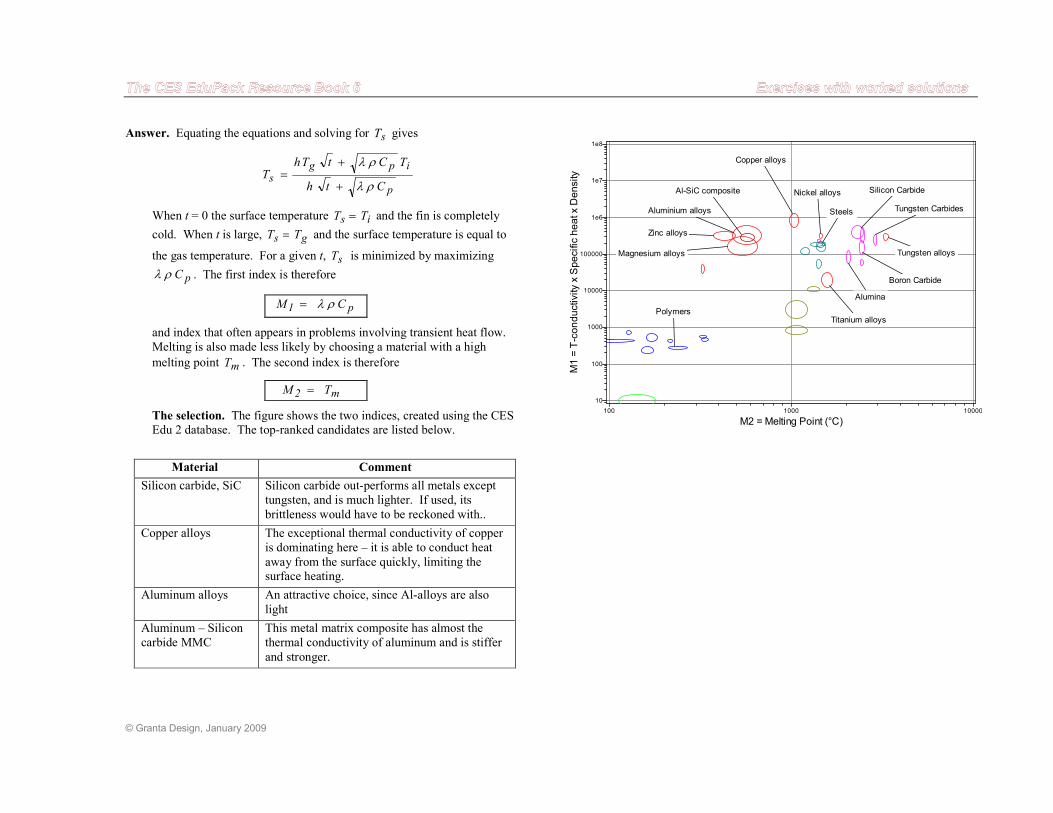
The selection. The figure shows the two indices, created using the CES
Edu 2 database. The top-ranked candidates are listed below.
Material Comment
Silicon carbide, SiC Silicon carbide out-performs all metals except
tungsten, and is much lighter. If used, its
brittleness would have to be reckoned with..
Copper alloys The exceptional thermal conductivity of copper
is dominating here – it is able to conduct heat
away from the surface quickly, limiting the
surface heating.
Aluminum alloys An attractive choice, since Al-alloys are also
light
Aluminum – Silicon
carbide MMC
This metal matrix composite has almost the
thermal conductivity of aluminum and is stiffer
and stronger.
M2 = Melting Point (°C)100 1000 10000
M1 = T-conductivity x Specific heat x Density
10
100
1000
10000
100000
1e6
1e7
1e8
Tungsten alloys
Silicon Carbide
Tungsten Carbides
Alumina
Aluminium alloys
Zinc alloys
Magnesium alloys
Titanium alloys
Al-SiC composite
Boron Carbide
Polymers
Copper alloys
Nickel alloys
Steels
© Granta Design, January 2009
E6. Selecting processes
The exercises of this section use the process selection charts of Chapters 7
and 8. They are useful in giving a feel for process attributes and the way in
which process choice depends on material and the shape. Here the CES
software offers greater advantages: what is cumbersome and of limited
resolution with the charts is easy with the software, which offers much
greater resolution.
Each exercise has three parts, labeled (a), (b) and (c). The first involves
translation. The second uses the selection charts of Chapter 7 (which you are
free to copy) in the way that was illustrated in Chapter 8. The third involves
the use of the CES software if available.
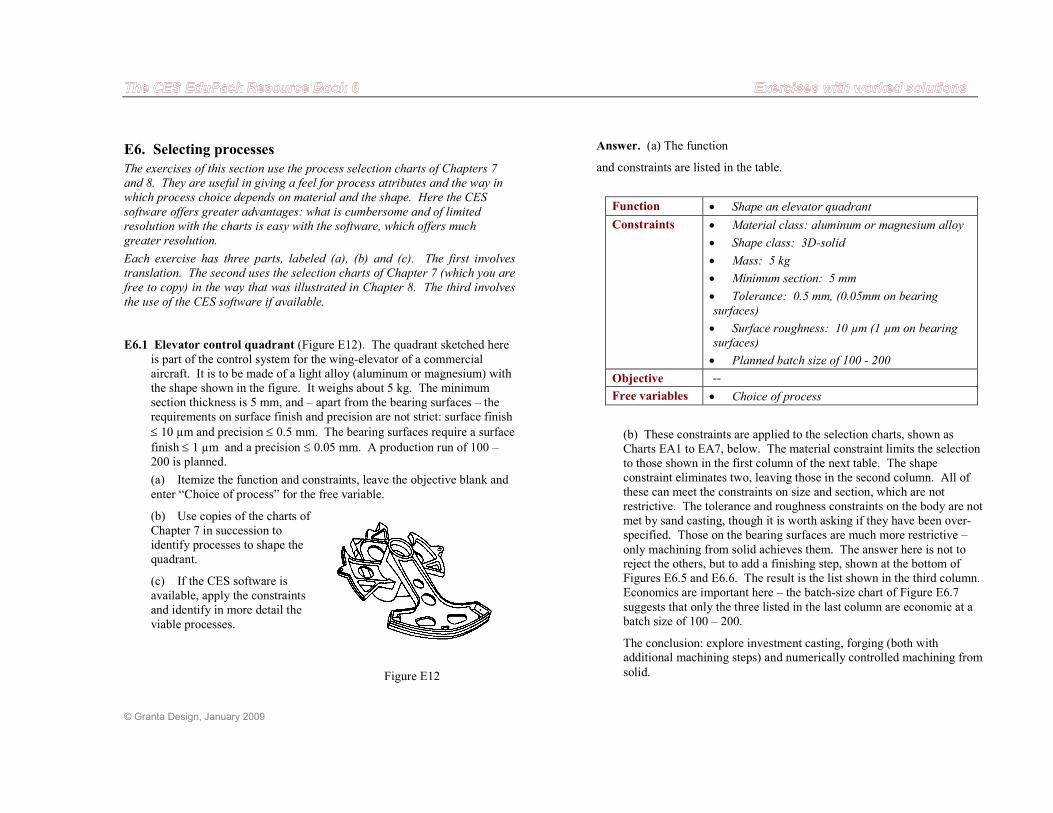
E6.1 Elevator control quadrant (Figure E12). The quadrant sketched here
is part of the control system for the wing-elevator of a commercial aircraft. It is to be made of a light alloy (aluminum or magnesium) with the shape shown in the figure. It weighs about 5 kg. The minimum section thickness is 5 mm, and – apart from the bearing surfaces – the requirements on surface finish and precision are not strict: surface finish
≤ 10 µm and precision ≤ 0.5 mm. The bearing surfaces require a surface
finish ≤ 1 µm and a precision ≤ 0.05 mm. A production run of 100 – 200 is planned.
(a) Itemize the function and constraints, leave the objective blank and
enter “Choice of process” for the free variable.
(b) Use copies of the charts of Chapter 7 in succession to identify processes to shape the quadrant.
(c) If the CES software is available, apply the constraints and identify in more detail the
viable processes.
Figure E12
Answer. (a) The function
and constraints are listed in the table.
Function • Shape an elevator quadrant
Constraints • Material class: aluminum or magnesium alloy
• Shape class: 3D-solid
• Mass: 5 kg
• Minimum section: 5 mm
• Tolerance: 0.5 mm, (0.05mm on bearing
surfaces)
• Surface roughness: 10 µm (1 µm on bearing
surfaces)
• Planned batch size of 100 - 200
Objective --
Free variables • Choice of process
(b) These constraints are applied to the selection charts, shown as Charts EA1 to EA7, below. The material constraint limits the selection to those shown in the first column of the next table. The shape constraint eliminates two, leaving those in the second column. All of these can meet the constraints on size and section, which are not restrictive. The tolerance and roughness constraints on the body are not met by sand casting, though it is worth asking if they have been over-specified. Those on the bearing surfaces are much more restrictive –
only machining from solid achieves them. The answer here is not to reject the others, but to add a finishing step, shown at the bottom of Figures E6.5 and E6.6. The result is the list shown in the third column. Economics are important here – the batch-size chart of Figure E6.7
suggests that only the three listed in the last column are economic at a batch size of 100 – 200.
The conclusion: explore investment casting, forging (both with additional machining steps) and numerically controlled machining from
solid.
© Granta Design, January 2009
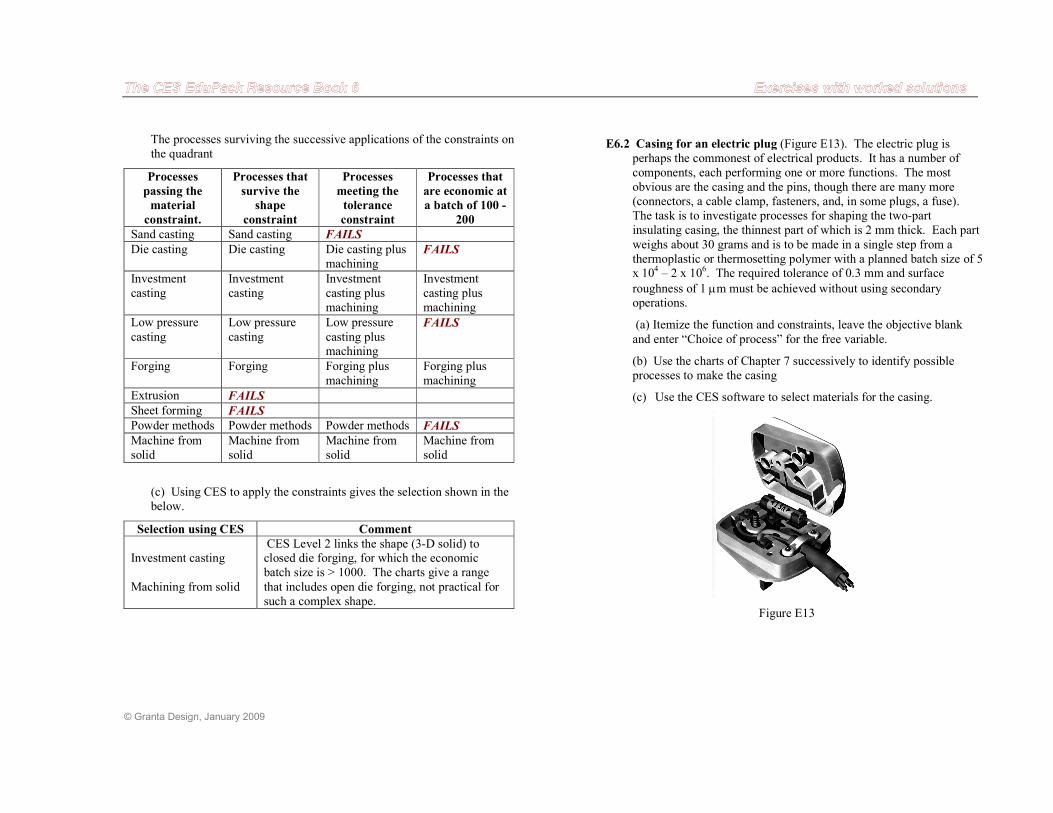
The processes surviving the successive applications of the constraints on the quadrant
Processes
passing the
material
constraint.
Processes that
survive the
shape
constraint
Processes
meeting the
tolerance
constraint
Processes that
are economic at
a batch of 100 -
200
Sand casting Sand casting FAILS
Die casting Die casting Die casting plus machining
FAILS
Investment casting
Investment casting
Investment casting plus machining
Investment casting plus machining
Low pressure
casting
Low pressure
casting
Low pressure
casting plus machining
FAILS
Forging Forging Forging plus machining
Forging plus machining
Extrusion FAILS
Sheet forming FAILS
Powder methods Powder methods Powder methods FAILS
Machine from solid
Machine from solid
Machine from solid
Machine from solid
(c) Using CES to apply the constraints gives the selection shown in the below.
Selection using CES Comment
Investment casting
Machining from solid
CES Level 2 links the shape (3-D solid) to closed die forging, for which the economic batch size is > 1000. The charts give a range
that includes open die forging, not practical for such a complex shape.
E6.2 Casing for an electric plug (Figure E13). The electric plug is perhaps the commonest of electrical products. It has a number of components, each performing one or more functions. The most obvious are the casing and the pins, though there are many more (connectors, a cable clamp, fasteners, and, in some plugs, a fuse). The task is to investigate processes for shaping the two-part insulating casing, the thinnest part of which is 2 mm thick. Each part
weighs about 30 grams and is to be made in a single step from a thermoplastic or thermosetting polymer with a planned batch size of 5 x 10⁴ – 2 x 10⁶. The required tolerance of 0.3 mm and surface
roughness of 1 µm must be achieved without using secondary operations.
(a) Itemize the function and constraints, leave the objective blank
and enter “Choice of process” for the free variable.
(b) Use the charts of Chapter 7 successively to identify possible processes to make the casing
(c) Use the CES software to select materials for the casing.
Figure E13
© Granta Design, January 2009
Answer. (a) The table lists the function and constraints.
Function • Shape an electric plug casing
Constraints • Material class: thermoplastic or thermosetting
polymer
• Shape class: 3D-solid
• Mass: 0.03 kg
• Minimum section: 2 mm
• Tolerance: 0.3 mm
• Surface roughness: 1µm
• Planned batch size of 5 x10⁴ – 2 x10
6
Objective --
Free variables • Choice of process
(b) Here we seek a net-shape process – the casing must be shaped in one
operation without the need for any further finishing. Applying the constraints as shown in Charts EA1 to EA7, below, eliminating processes that fail a constraint in the manner of the table shown in exercise E6.1, leaves two candidates: injection molding and
compression molding.
(c) Using CES to apply the constraints gives the selection shown in the below.
Selection using CES Comment
Injection molding
Compression molding
The selection is identical with that derived from the charts, but the software also delivers data files containing supporting
information for each process.
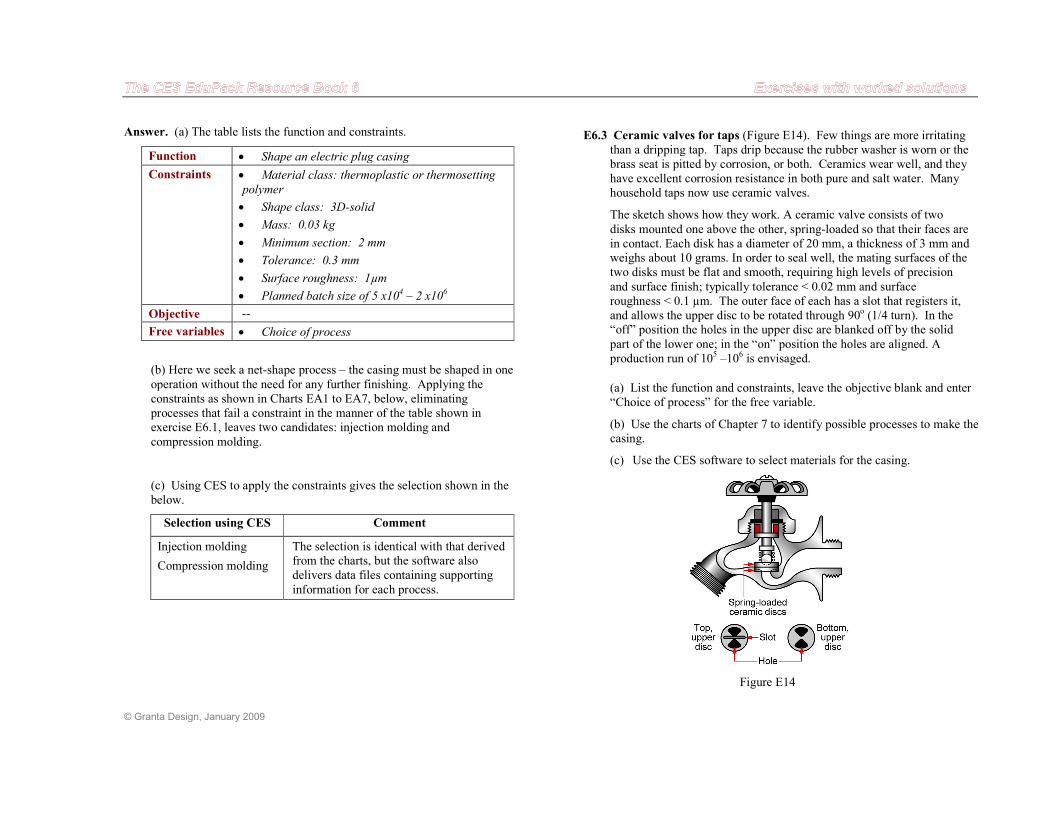
E6.3 Ceramic valves for taps (Figure E14). Few things are more irritating than a dripping tap. Taps drip because the rubber washer is worn or the brass seat is pitted by corrosion, or both. Ceramics wear well, and they have excellent corrosion resistance in both pure and salt water. Many household taps now use ceramic valves.
The sketch shows how they work. A ceramic valve consists of two
disks mounted one above the other, spring-loaded so that their faces are in contact. Each disk has a diameter of 20 mm, a thickness of 3 mm and weighs about 10 grams. In order to seal well, the mating surfaces of the two disks must be flat and smooth, requiring high levels of precision
and surface finish; typically tolerance < 0.02 mm and surface roughness < 0.1 µm. The outer face of each has a slot that registers it, and allows the upper disc to be rotated through 90o (1/4 turn). In the “off” position the holes in the upper disc are blanked off by the solid
part of the lower one; in the “on” position the holes are aligned. A production run of 105 –106 is envisaged.
(a) List the function and constraints, leave the objective blank and enter “Choice of process” for the free variable.
(b) Use the charts of Chapter 7 to identify possible processes to make the casing.
(c) Use the CES software to select materials for the casing.
Figure E14
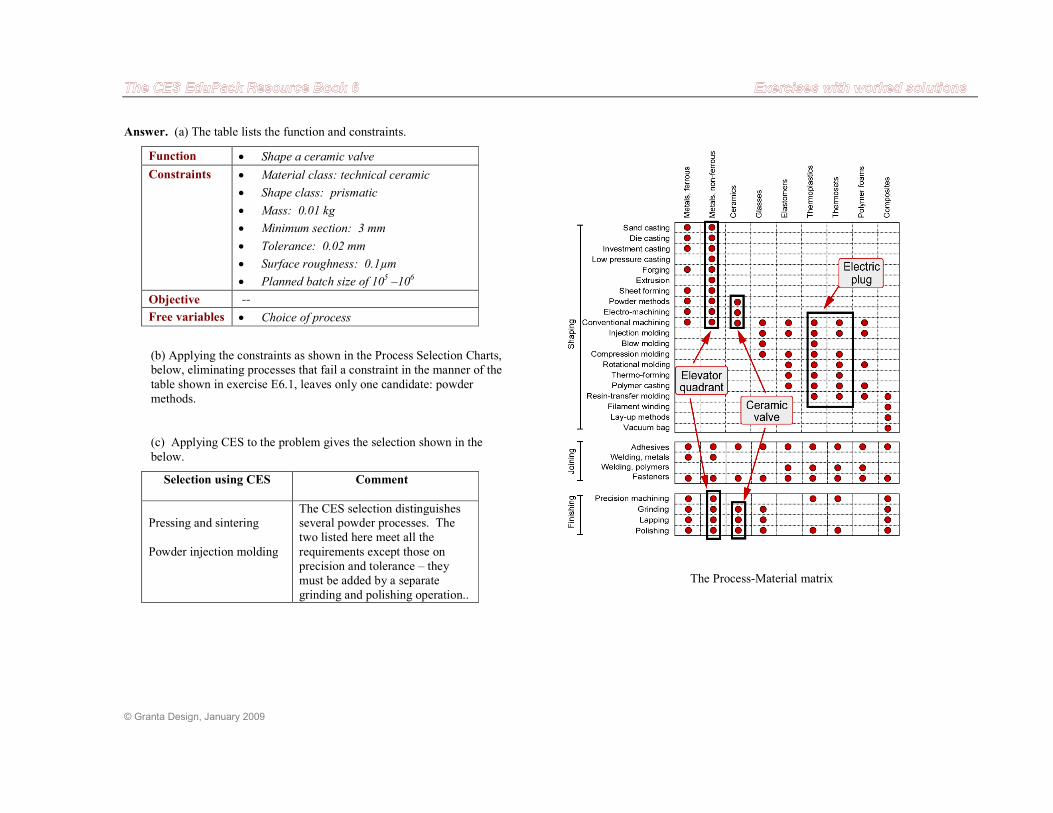
© Granta Design, January 2009
Answer. (a) The table lists the function and constraints.
Function • Shape a ceramic valve
Constraints • Material class: technical ceramic
• Shape class: prismatic
• Mass: 0.01 kg
• Minimum section: 3 mm
• Tolerance: 0.02 mm
• Surface roughness: 0.1µm
• Planned batch size of 105 –10
6
Objective --
Free variables • Choice of process
(b) Applying the constraints as shown in the Process Selection Charts, below, eliminating processes that fail a constraint in the manner of the
table shown in exercise E6.1, leaves only one candidate: powder methods.
(c) Applying CES to the problem gives the selection shown in the
below.
Selection using CES Comment
Pressing and sintering
Powder injection molding
The CES selection distinguishes several powder processes. The two listed here meet all the
requirements except those on precision and tolerance – they must be added by a separate grinding and polishing operation..
The Process-Material matrix
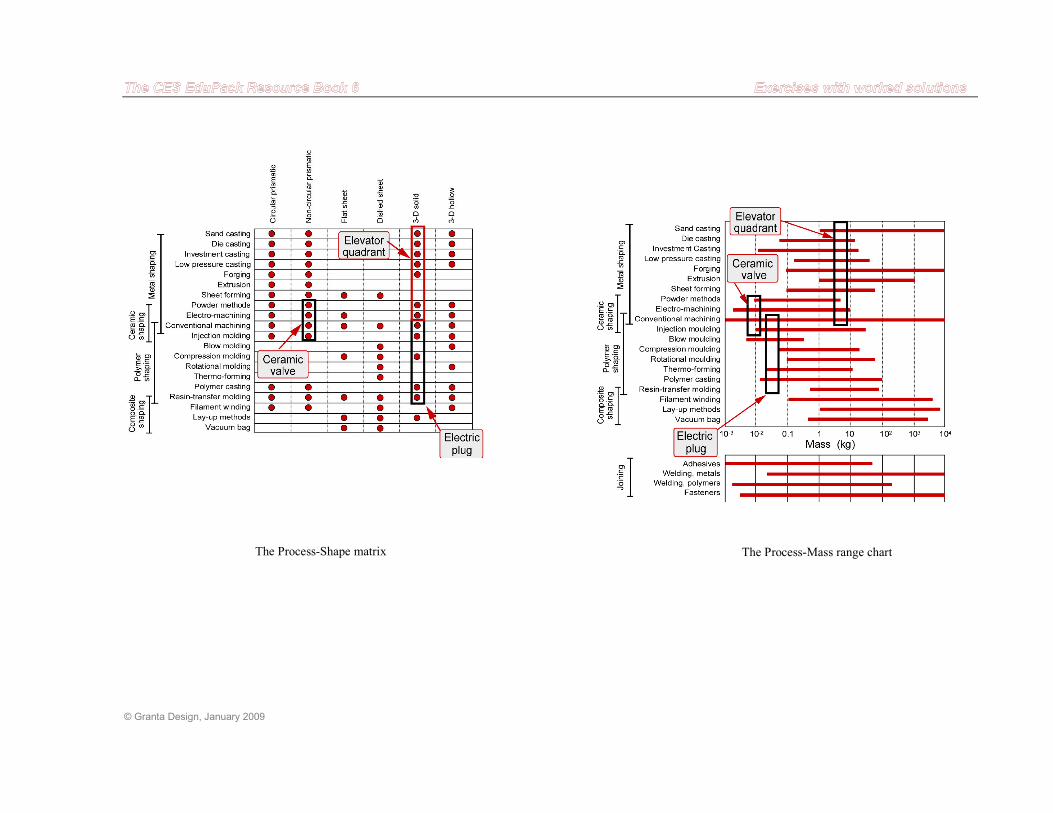
© Granta Design, January 2009
The Process-Shape matrix
The Process-Mass range chart
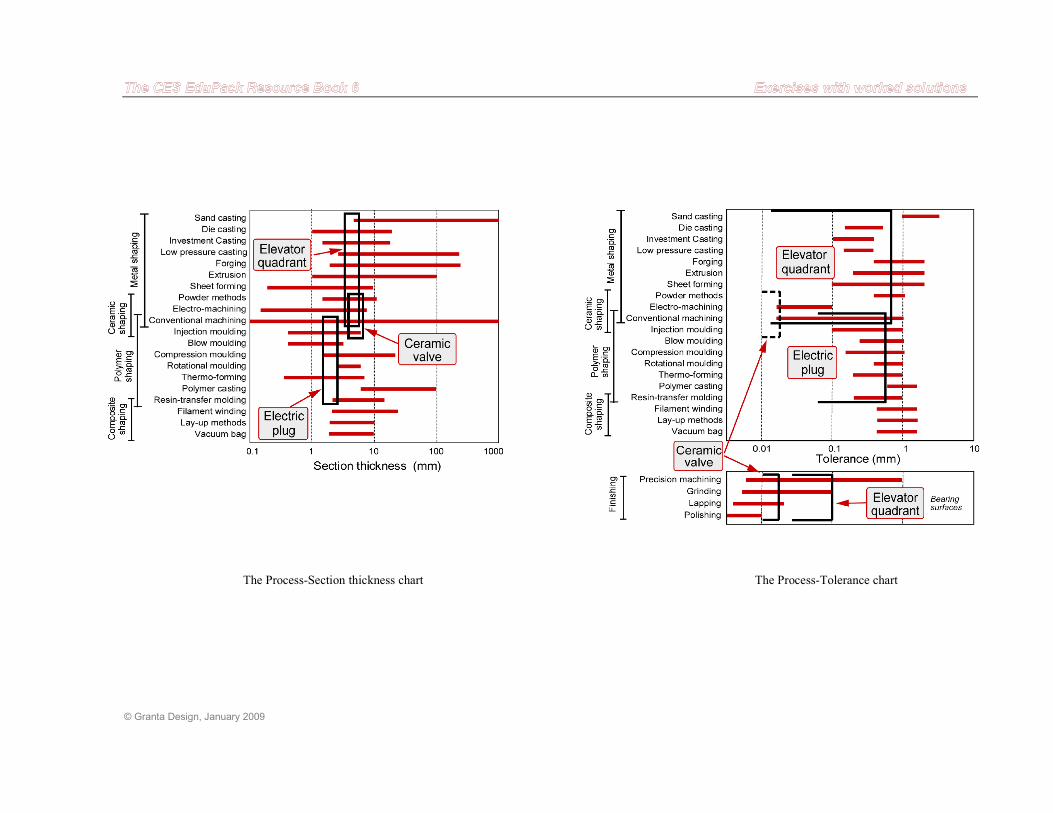
© Granta Design, January 2009
The Process-Section thickness chart
The Process-Tolerance chart
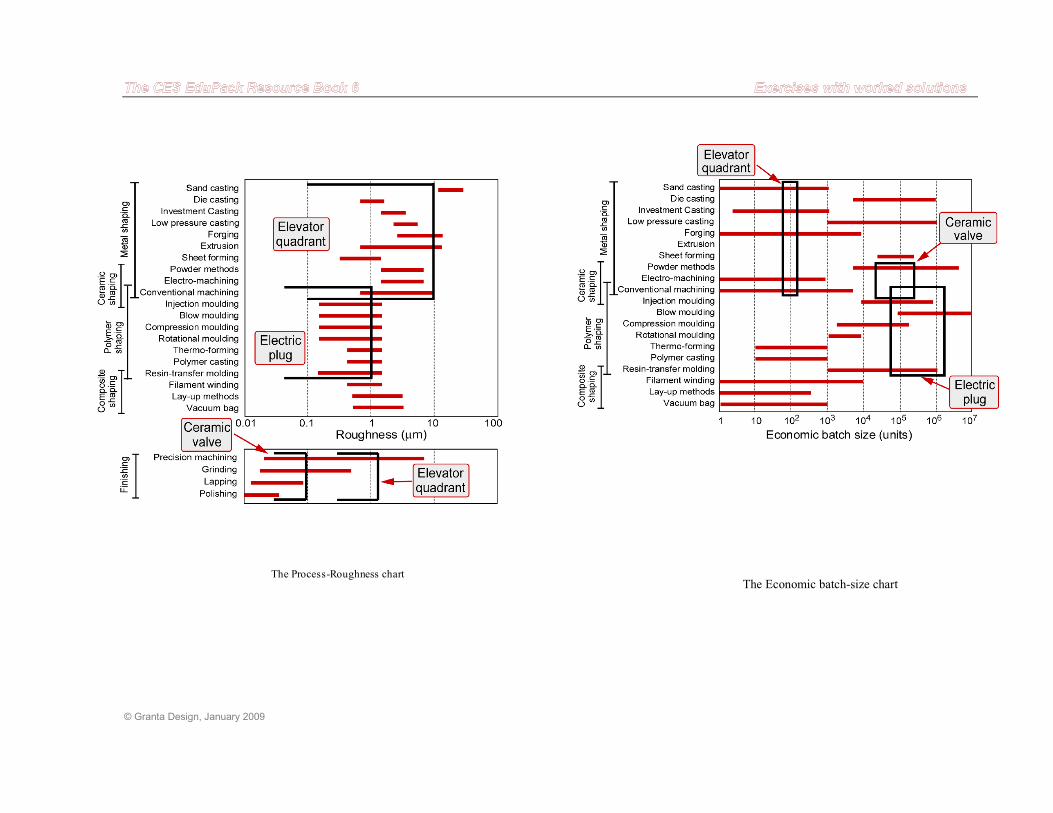
© Granta Design, January 2009
The Process-Roughness chart
The Economic batch-size chart
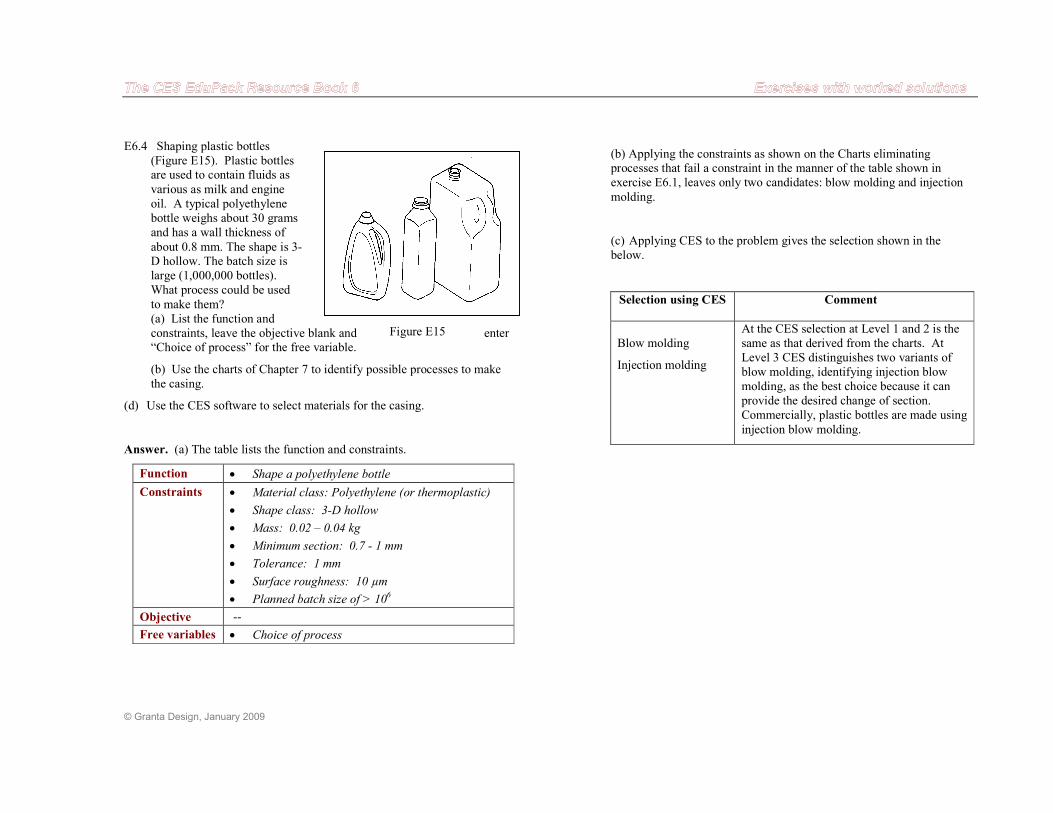
© Granta Design, January 2009
Figure E15
E6.4 Shaping plastic bottles
(Figure E15). Plastic bottles are used to contain fluids as
various as milk and engine oil. A typical polyethylene bottle weighs about 30 grams and has a wall thickness of
about 0.8 mm. The shape is 3-D hollow. The batch size is large (1,000,000 bottles). What process could be used
to make them? (a) List the function and constraints, leave the objective blank and enter “Choice of process” for the free variable.
(b) Use the charts of Chapter 7 to identify possible processes to make the casing.
(d) Use the CES software to select materials for the casing.
Answer. (a) The table lists the function and constraints.
Function • Shape a polyethylene bottle
Constraints • Material class: Polyethylene (or thermoplastic)
• Shape class: 3-D hollow
• Mass: 0.02 – 0.04 kg
• Minimum section: 0.7 - 1 mm
• Tolerance: 1 mm
• Surface roughness: 10 µm
• Planned batch size of > 106
Objective --
Free variables • Choice of process
(b) Applying the constraints as shown on the Charts eliminating processes that fail a constraint in the manner of the table shown in exercise E6.1, leaves only two candidates: blow molding and injection
molding.
(c) Applying CES to the problem gives the selection shown in the below.
Selection using CES Comment
Blow molding
Injection molding
At the CES selection at Level 1 and 2 is the same as that derived from the charts. At Level 3 CES distinguishes two variants of blow molding, identifying injection blow molding, as the best choice because it can provide the desired change of section. Commercially, plastic bottles are made using
injection blow molding.
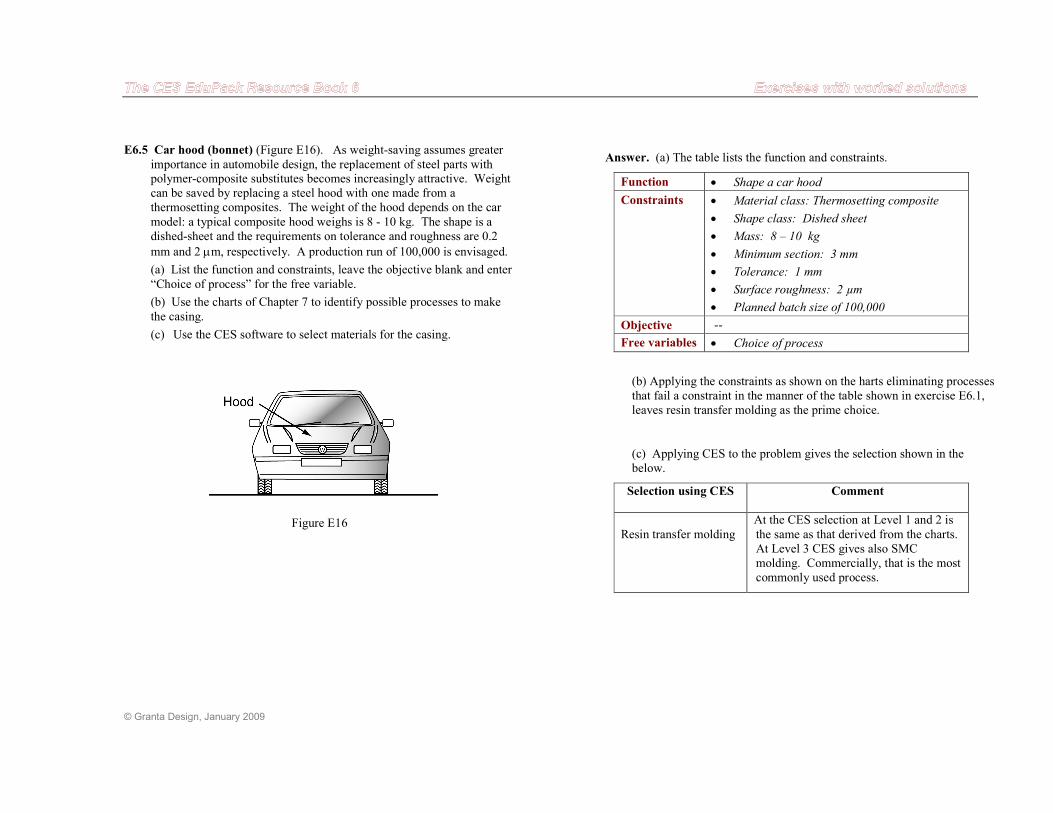
© Granta Design, January 2009
E6.5 Car hood (bonnet) (Figure E16). As weight-saving assumes greater
importance in automobile design, the replacement of steel parts with polymer-composite substitutes becomes increasingly attractive. Weight can be saved by replacing a steel hood with one made from a thermosetting composites. The weight of the hood depends on the car
model: a typical composite hood weighs is 8 - 10 kg. The shape is a dished-sheet and the requirements on tolerance and roughness are 0.2
mm and 2 µm, respectively. A production run of 100,000 is envisaged.
(a) List the function and constraints, leave the objective blank and enter
“Choice of process” for the free variable.
(b) Use the charts of Chapter 7 to identify possible processes to make
the casing.
(c) Use the CES software to select materials for the casing.
Figure E16
Answer. (a) The table lists the function and constraints.
Function • Shape a car hood
Constraints • Material class: Thermosetting composite
• Shape class: Dished sheet
• Mass: 8 – 10 kg
• Minimum section: 3 mm
• Tolerance: 1 mm
• Surface roughness: 2 µm
• Planned batch size of 100,000
Objective --
Free variables • Choice of process
(b) Applying the constraints as shown on the harts eliminating processes that fail a constraint in the manner of the table shown in exercise E6.1, leaves resin transfer molding as the prime choice.
(c) Applying CES to the problem gives the selection shown in the below.
Selection using CES Comment
Resin transfer molding
At the CES selection at Level 1 and 2 is
the same as that derived from the charts. At Level 3 CES gives also SMC molding. Commercially, that is the most commonly used process.
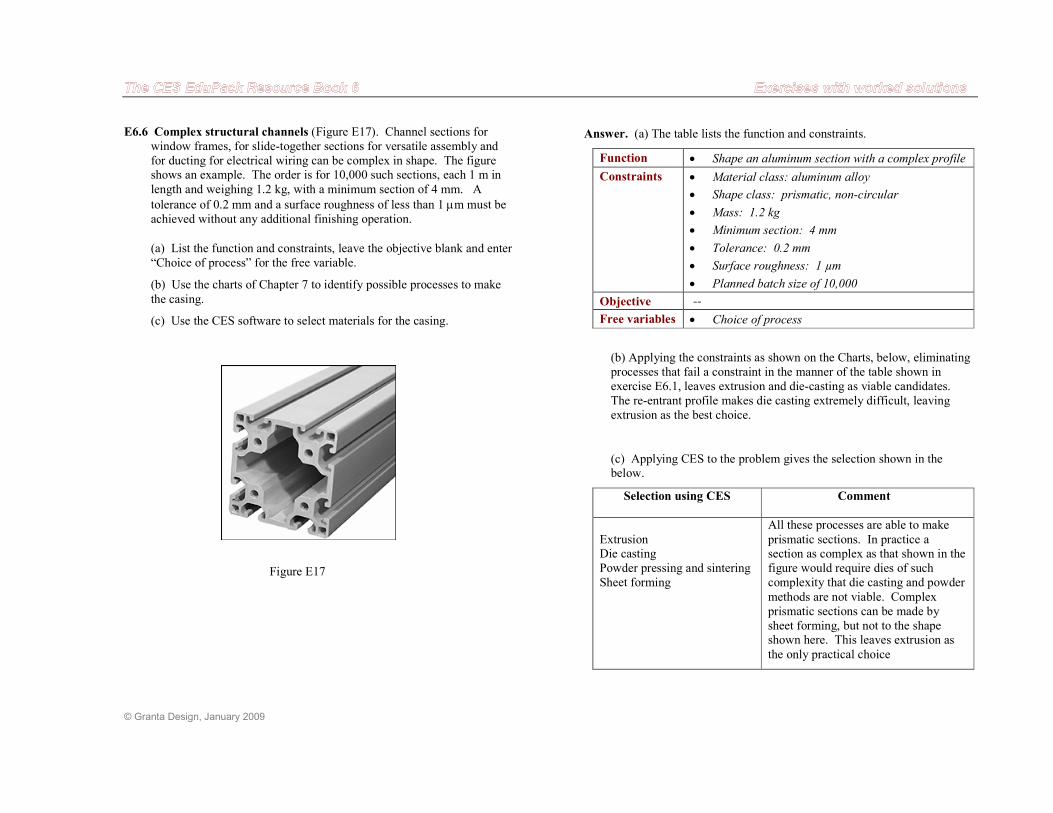
© Granta Design, January 2009
E6.6 Complex structural channels (Figure E17). Channel sections for window frames, for slide-together sections for versatile assembly and for ducting for electrical wiring can be complex in shape. The figure shows an example. The order is for 10,000 such sections, each 1 m in
length and weighing 1.2 kg, with a minimum section of 4 mm. A
tolerance of 0.2 mm and a surface roughness of less than 1 µm must be achieved without any additional finishing operation.
(a) List the function and constraints, leave the objective blank and enter “Choice of process” for the free variable.
(b) Use the charts of Chapter 7 to identify possible processes to make
the casing.
(c) Use the CES software to select materials for the casing.
Figure E17
Answer. (a) The table lists the function and constraints.
Function • Shape an aluminum section with a complex profile
Constraints • Material class: aluminum alloy
• Shape class: prismatic, non-circular
• Mass: 1.2 kg
• Minimum section: 4 mm
• Tolerance: 0.2 mm
• Surface roughness: 1 µm
• Planned batch size of 10,000
Objective --
Free variables • Choice of process
(b) Applying the constraints as shown on the Charts, below, eliminating processes that fail a constraint in the manner of the table shown in exercise E6.1, leaves extrusion and die-casting as viable candidates. The re-entrant profile makes die casting extremely difficult, leaving extrusion as the best choice.
(c) Applying CES to the problem gives the selection shown in the below.
Selection using CES Comment
Extrusion Die casting Powder pressing and sintering Sheet forming
All these processes are able to make
prismatic sections. In practice a section as complex as that shown in the figure would require dies of such complexity that die casting and powder
methods are not viable. Complex prismatic sections can be made by sheet forming, but not to the shape shown here. This leaves extrusion as
the only practical choice
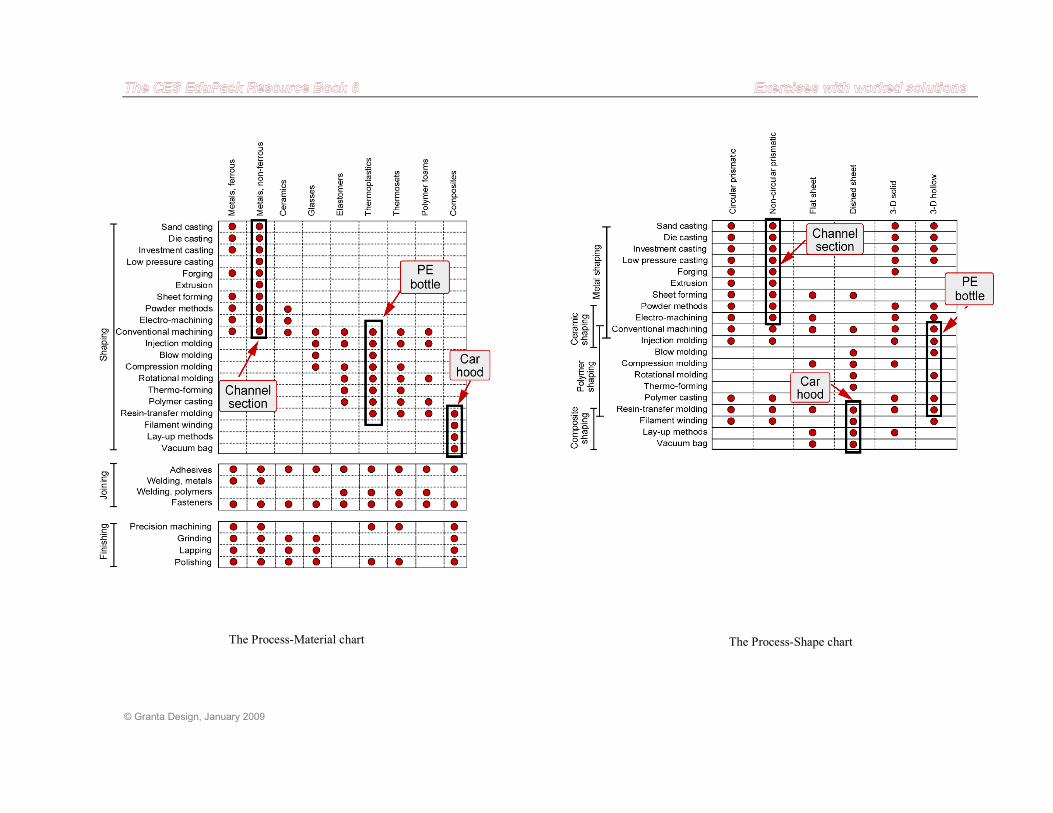
© Granta Design, January 2009
The Process-Material chart The Process-Shape chart
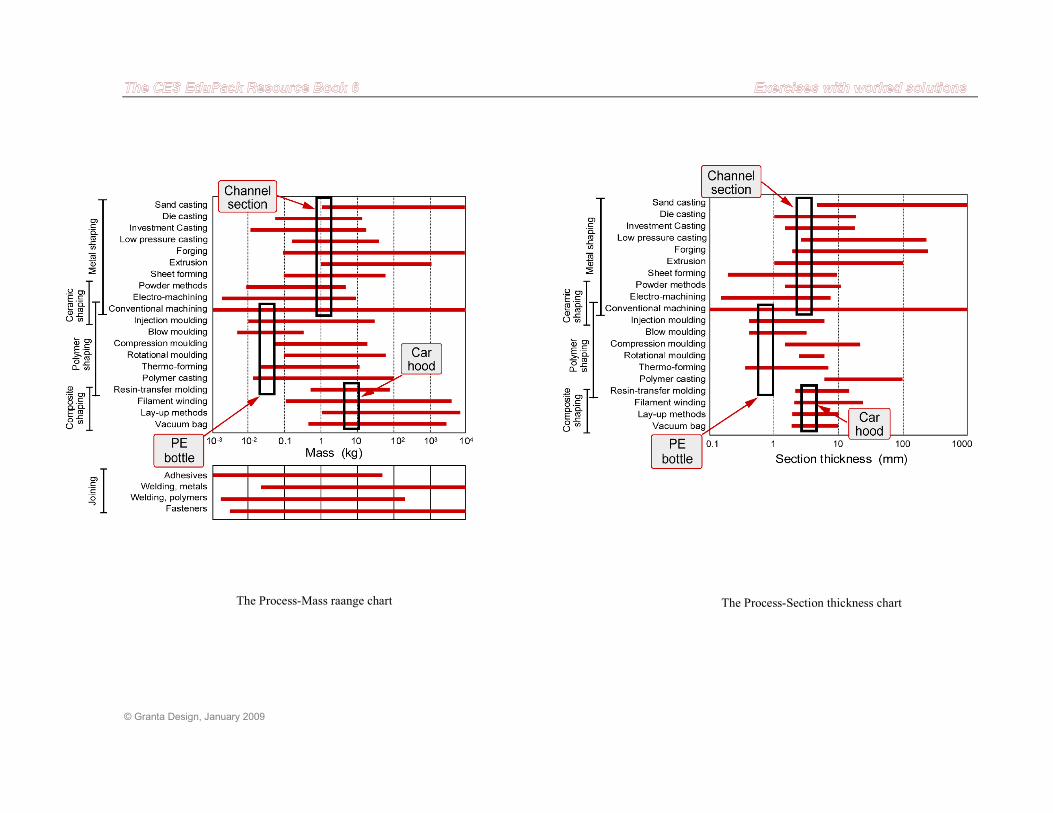
© Granta Design, January 2009
The Process-Mass raange chart The Process-Section thickness chart
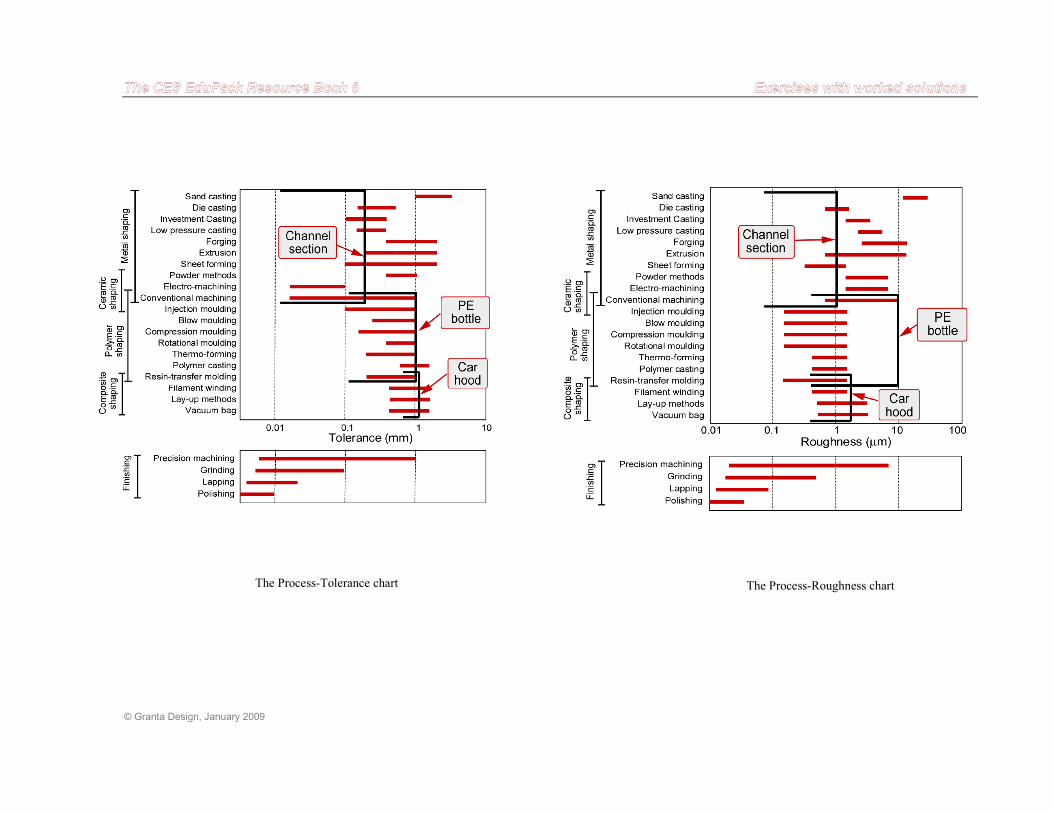
© Granta Design, January 2009
The Process-Tolerance chart The Process-Roughness chart
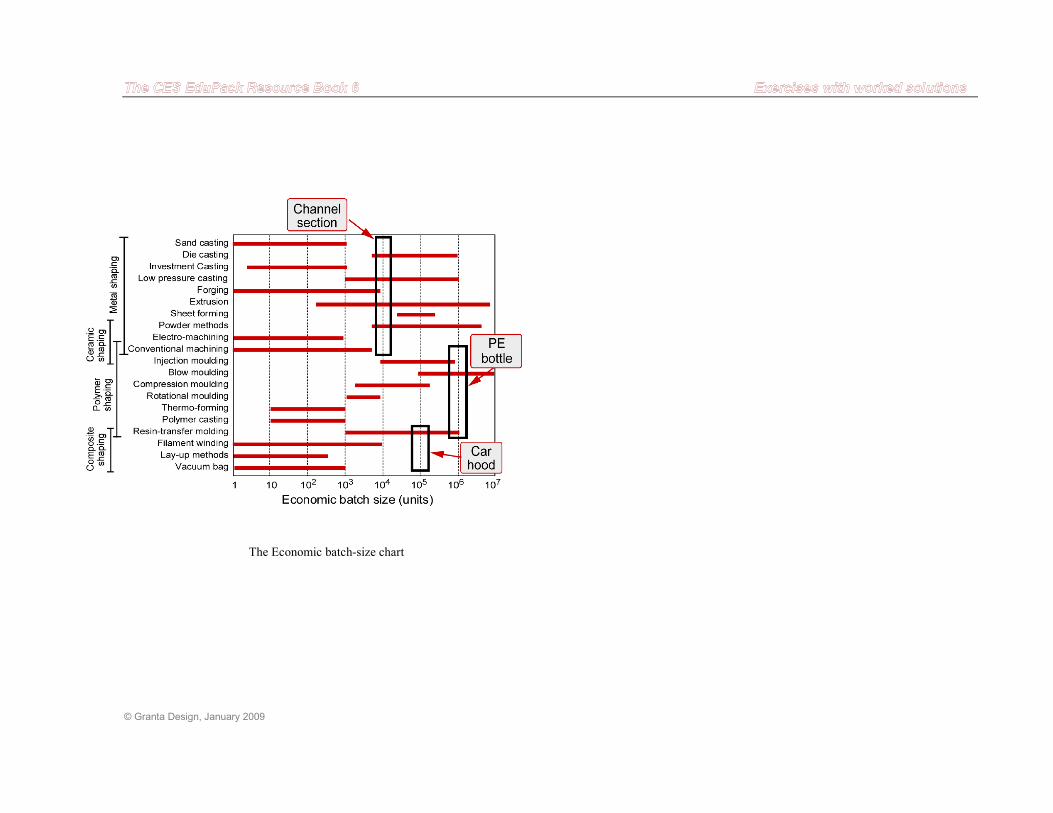
© Granta Design, January 2009
The Economic batch-size chart
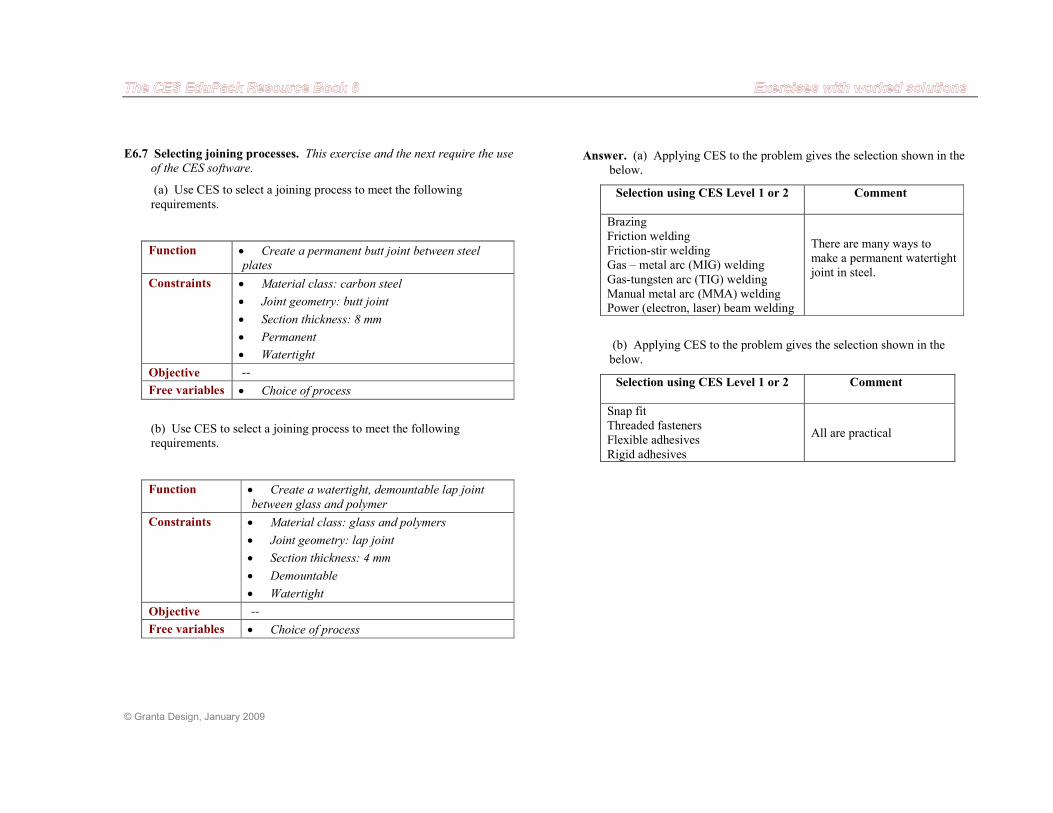
© Granta Design, January 2009
E6.7 Selecting joining processes. This exercise and the next require the use
of the CES software.
(a) Use CES to select a joining process to meet the following
requirements.
Function • Create a permanent butt joint between steel
plates
Constraints • Material class: carbon steel
• Joint geometry: butt joint
• Section thickness: 8 mm
• Permanent
• Watertight
Objective --
Free variables • Choice of process
(b) Use CES to select a joining process to meet the following requirements.
Function • Create a watertight, demountable lap joint
between glass and polymer
Constraints • Material class: glass and polymers
• Joint geometry: lap joint
• Section thickness: 4 mm
• Demountable
• Watertight
Objective --
Free variables • Choice of process
Answer. (a) Applying CES to the problem gives the selection shown in the below.
Selection using CES Level 1 or 2 Comment
Brazing Friction welding Friction-stir welding Gas – metal arc (MIG) welding
Gas-tungsten arc (TIG) welding Manual metal arc (MMA) welding Power (electron, laser) beam welding
There are many ways to make a permanent watertight joint in steel.
(b) Applying CES to the problem gives the selection shown in the
below.
Selection using CES Level 1 or 2 Comment
Snap fit Threaded fasteners Flexible adhesives
Rigid adhesives
All are practical
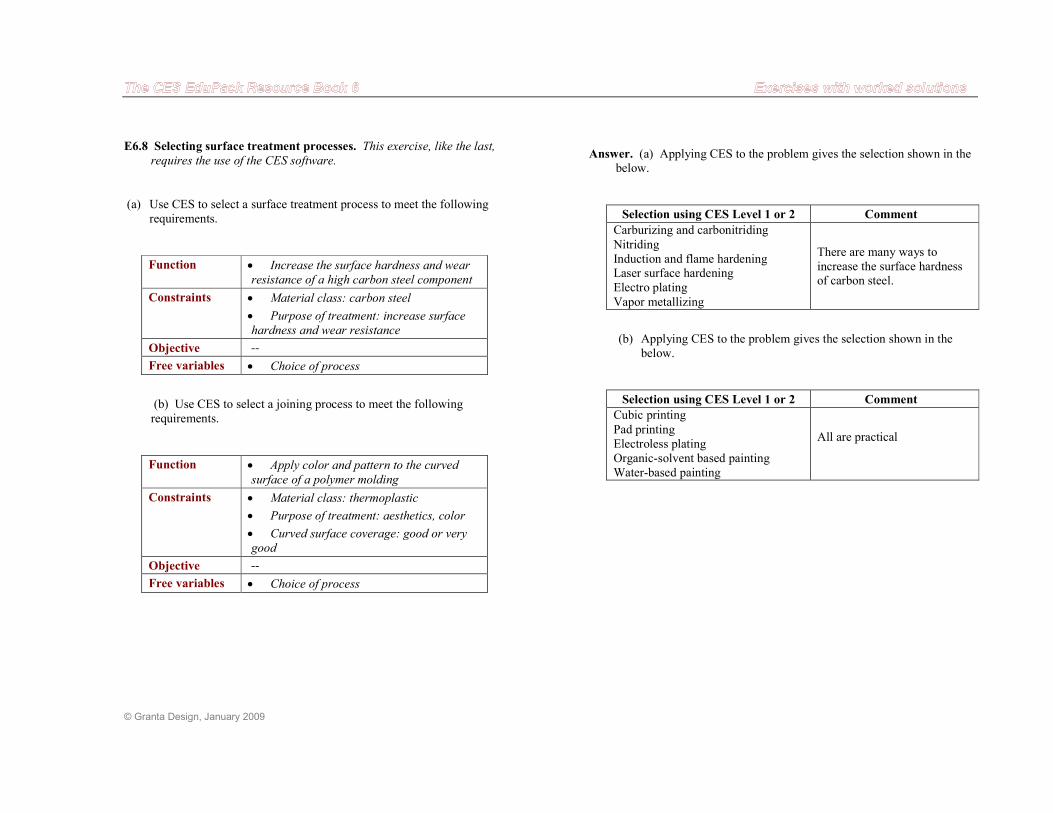
© Granta Design, January 2009
E6.8 Selecting surface treatment processes. This exercise, like the last,
requires the use of the CES software.
(a) Use CES to select a surface treatment process to meet the following requirements.
Function • Increase the surface hardness and wear
resistance of a high carbon steel component
Constraints • Material class: carbon steel
• Purpose of treatment: increase surface
hardness and wear resistance
Objective --
Free variables • Choice of process
(b) Use CES to select a joining process to meet the following requirements.
Function • Apply color and pattern to the curved
surface of a polymer molding
Constraints • Material class: thermoplastic
• Purpose of treatment: aesthetics, color
• Curved surface coverage: good or very
good
Objective --
Free variables • Choice of process
Answer. (a) Applying CES to the problem gives the selection shown in the below.
Selection using CES Level 1 or 2 Comment
Carburizing and carbonitriding
Nitriding Induction and flame hardening Laser surface hardening Electro plating
Vapor metallizing
There are many ways to increase the surface hardness of carbon steel.
(b) Applying CES to the problem gives the selection shown in the below.
Selection using CES Level 1 or 2 Comment
Cubic printing
Pad printing Electroless plating Organic-solvent based painting Water-based painting
All are practical
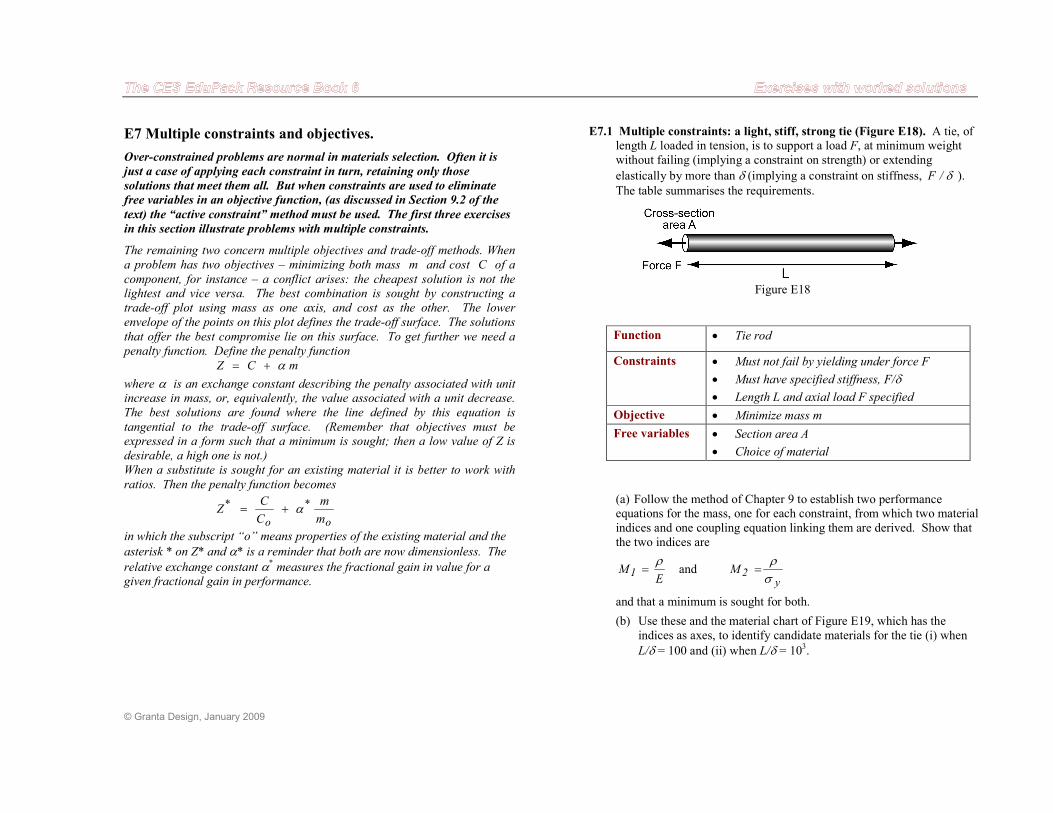
© Granta Design, January 2009
E7 Multiple constraints and objectives.
Over-constrained problems are normal in materials selection. Often it is
just a case of applying each constraint in turn, retaining only those
solutions that meet them all. But when constraints are used to eliminate
free variables in an objective function, (as discussed in Section 9.2 of the
text) the “active constraint” method must be used. The first three exercises
in this section illustrate problems with multiple constraints.
The remaining two concern multiple objectives and trade-off methods. When
a problem has two objectives – minimizing both mass m and cost C of a
component, for instance – a conflict arises: the cheapest solution is not the
lightest and vice versa. The best combination is sought by constructing a
trade-off plot using mass as one axis, and cost as the other. The lower
envelope of the points on this plot defines the trade-off surface. The solutions
that offer the best compromise lie on this surface. To get further we need a
penalty function. Define the penalty function
mCZ α+=
where α is an exchange constant describing the penalty associated with unit
increase in mass, or, equivalently, the value associated with a unit decrease.
The best solutions are found where the line defined by this equation is
tangential to the trade-off surface. (Remember that objectives must be
expressed in a form such that a minimum is sought; then a low value of Z is
desirable, a high one is not.)
When a substitute is sought for an existing material it is better to work with
ratios. Then the penalty function becomes
o
*
o
*
m
m
C
CZ α+=
in which the subscript “o” means properties of the existing material and the
asterisk * on Z* and α* is a reminder that both are now dimensionless. The
relative exchange constant α* measures the fractional gain in value for a
given fractional gain in performance.
E7.1 Multiple constraints: a light, stiff, strong tie (Figure E18). A tie, of length L loaded in tension, is to support a load F, at minimum weight without failing (implying a constraint on strength) or extending
elastically by more than δ (implying a constraint on stiffness, δ/F ).
The table summarises the requirements.
Figure E18
Function • Tie rod
Constraints • Must not fail by yielding under force F
• Must have specified stiffness, F/δ • Length L and axial load F specified
Objective • Minimize mass m
Free variables • Section area A
• Choice of material
(a) Follow the method of Chapter 9 to establish two performance equations for the mass, one for each constraint, from which two material indices and one coupling equation linking them are derived. Show that the two indices are
EM1
ρ= and
y2M
σρ
=
and that a minimum is sought for both.
(b) Use these and the material chart of Figure E19, which has the indices as axes, to identify candidate materials for the tie (i) when
L/δ = 100 and (ii) when L/δ = 103.
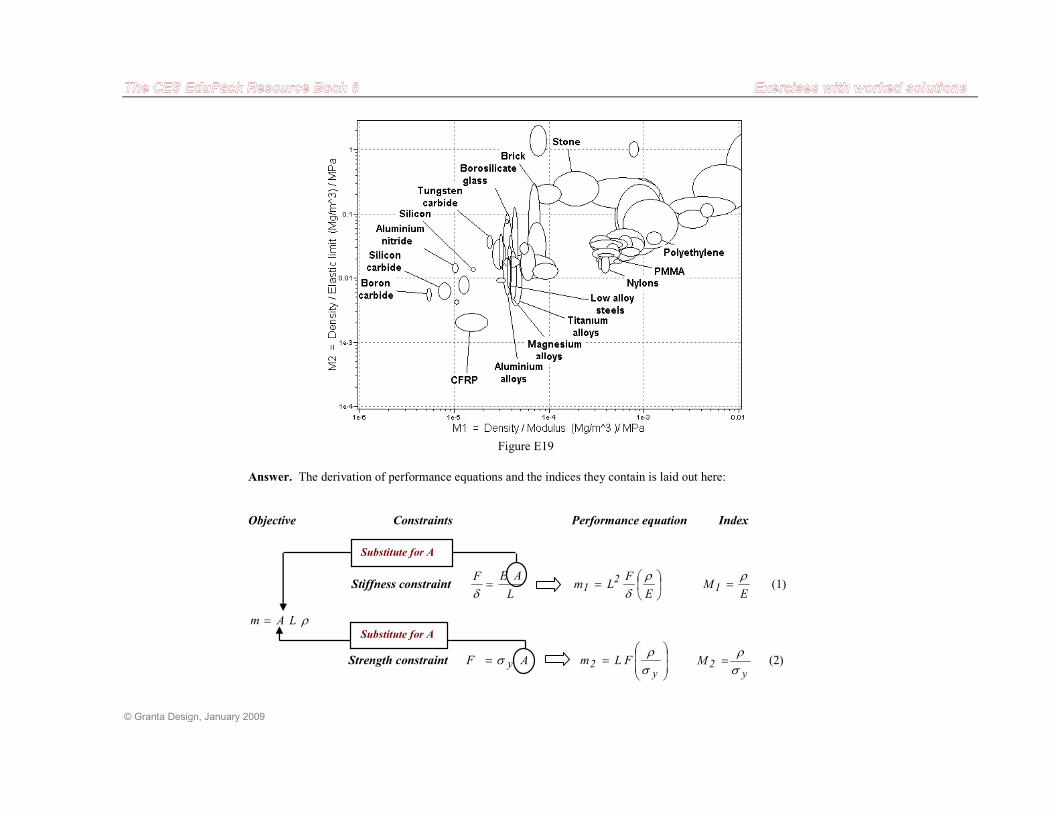
© Granta Design, January 2009
Answer. The derivation of performance equations and the indices they contain is laid out here:
Objective Constraints Performance equation Index
Stiffness constraint L
AEF=
δ
=
E
FLm2
1ρ
δ
EM1
ρ= (1)
ρLAm =
Strength constraint AF yσ=
=
y2 FLm
σρ
y
2Mσρ
= (2)
Figure E19
Substitute for A
Substitute for A
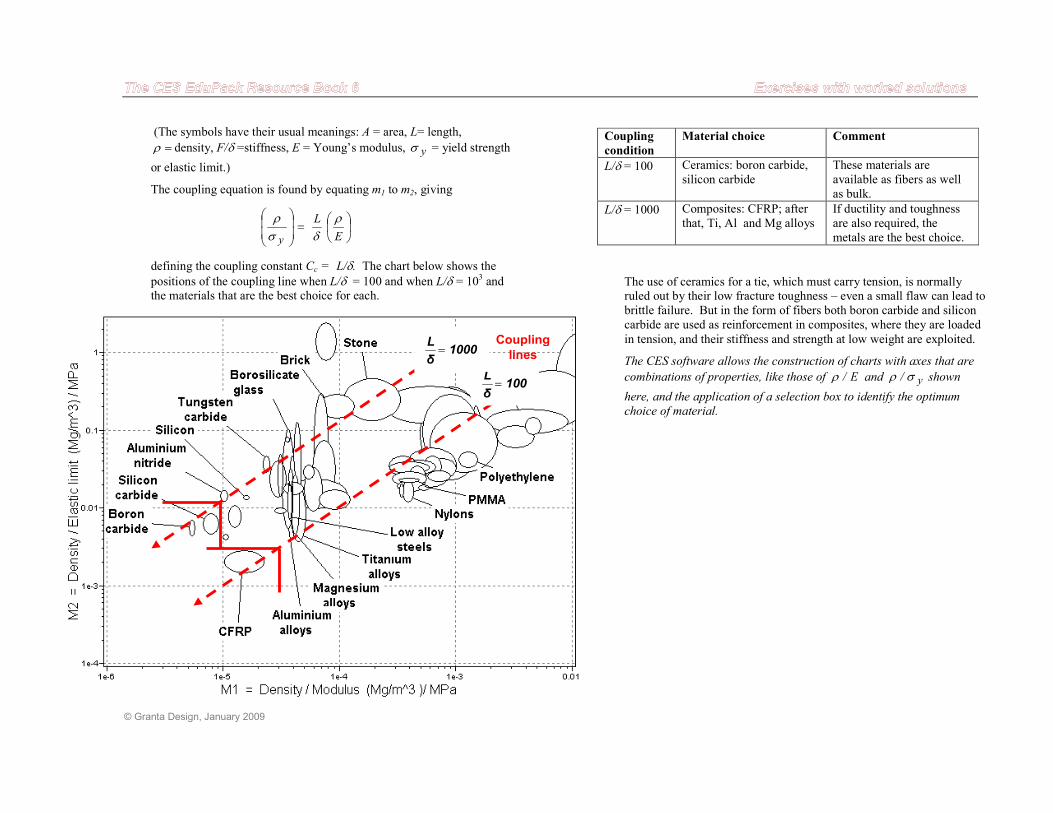
© Granta Design, January 2009
(The symbols have their usual meanings: A = area, L= length,
=ρ density, F/δ =stiffness, E = Young’s modulus, yσ = yield strength
or elastic limit.)
The coupling equation is found by equating m1 to m2, giving
=
E
L
y
ρδσ
ρ
defining the coupling constant Cc = L/δ. The chart below shows the positions of the coupling line when L/δ = 100 and when L/δ = 103 and the materials that are the best choice for each.
100δ
L=
1000δ
L=
Coupling
lines
Coupling
condition
Material choice Comment
L/δ = 100 Ceramics: boron carbide, silicon carbide
These materials are available as fibers as well as bulk.
L/δ = 1000 Composites: CFRP; after that, Ti, Al and Mg alloys
If ductility and toughness are also required, the metals are the best choice.
The use of ceramics for a tie, which must carry tension, is normally ruled out by their low fracture toughness – even a small flaw can lead to brittle failure. But in the form of fibers both boron carbide and silicon carbide are used as reinforcement in composites, where they are loaded
in tension, and their stiffness and strength at low weight are exploited.
The CES software allows the construction of charts with axes that are
combinations of properties, like those of E/ρ and y/ σρ shown
here, and the application of a selection box to identify the optimum
choice of material.
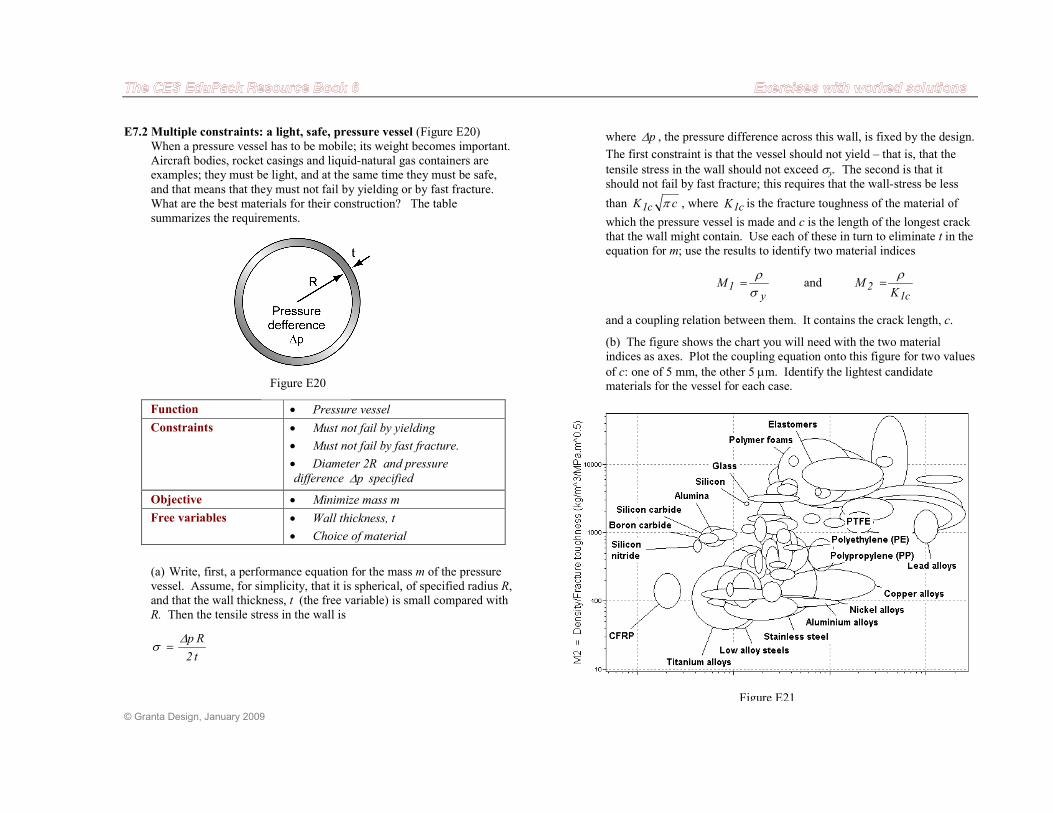
© Granta Design, January 2009
E7.2 Multiple constraints: a light, safe, pressure vessel (Figure E20) When a pressure vessel has to be mobile; its weight becomes important. Aircraft bodies, rocket casings and liquid-natural gas containers are examples; they must be light, and at the same time they must be safe,
and that means that they must not fail by yielding or by fast fracture. What are the best materials for their construction? The table summarizes the requirements.
Function • Pressure vessel
Constraints • Must not fail by yielding
• Must not fail by fast fracture.
• Diameter 2R and pressure
difference p∆ specified
Objective • Minimize mass m
Free variables • Wall thickness, t
• Choice of material
(a) Write, first, a performance equation for the mass m of the pressure vessel. Assume, for simplicity, that it is spherical, of specified radius R, and that the wall thickness, t (the free variable) is small compared with R. Then the tensile stress in the wall is
t2
Rp∆σ =
Figure E20
Figure E21
where p∆ , the pressure difference across this wall, is fixed by the design.
The first constraint is that the vessel should not yield – that is, that the
tensile stress in the wall should not exceed σy. The second is that it should not fail by fast fracture; this requires that the wall-stress be less
than cK c1 π , where c1K is the fracture toughness of the material of
which the pressure vessel is made and c is the length of the longest crack that the wall might contain. Use each of these in turn to eliminate t in the equation for m; use the results to identify two material indices
y1M
σρ
= and c1
2K
Mρ
=
and a coupling relation between them. It contains the crack length, c.
(b) The figure shows the chart you will need with the two material indices as axes. Plot the coupling equation onto this figure for two values
of c: one of 5 mm, the other 5 µm. Identify the lightest candidate materials for the vessel for each case.
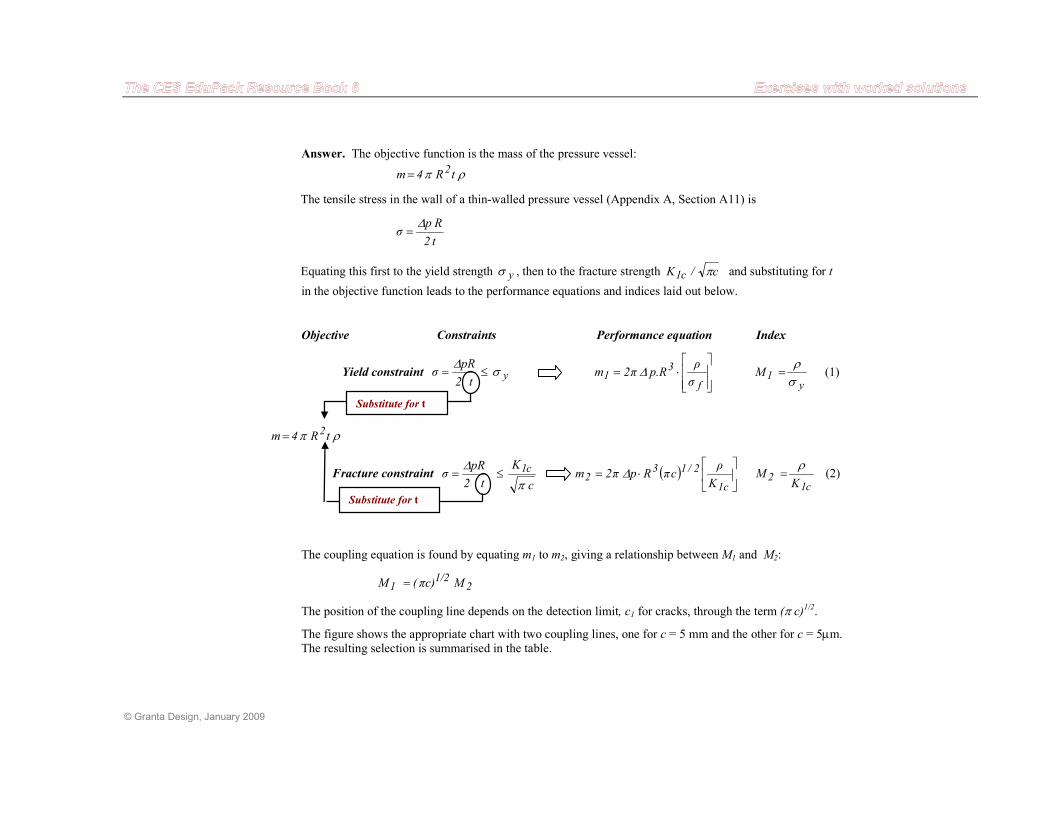
© Granta Design, January 2009
Answer. The objective function is the mass of the pressure vessel:
ρπ tR4m 2=
The tensile stress in the wall of a thin-walled pressure vessel (Appendix A, Section A11) is
t2
Rpσ
∆=
Equating this first to the yield strength yσ , then to the fracture strength c/K c1 π and substituting for t
in the objective function leads to the performance equations and indices laid out below.
Objective Constraints Performance equation Index
Yield constraint yt2
pRσ σ
∆≤=
⋅=
f
31
σ
ρp.Rπ2m ∆
y1M
σρ
= (1)
ρπ tR4m 2=
Fracture constraint c
K
t 2
pRσ c1
π
∆≤= ( )
⋅=
1c
2/132
K
ρcπRpπ2m ∆
c12
KM
ρ= (2)
The coupling equation is found by equating m1 to m2, giving a relationship between M1 and M2:
21/2
1 Mπc)(M =
The position of the coupling line depends on the detection limit, c1 for cracks, through the term (π c)1/2.
The figure shows the appropriate chart with two coupling lines, one for c = 5 mm and the other for c = 5µm. The resulting selection is summarised in the table.
Substitute for t
Substitute for t
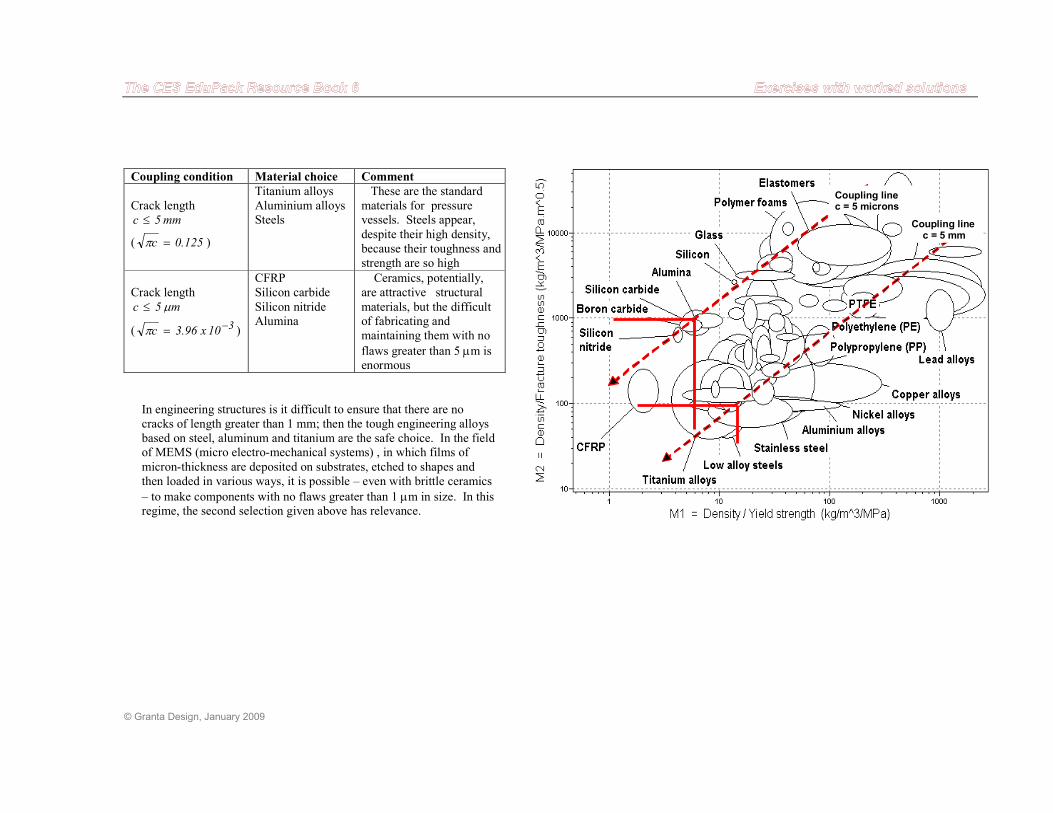
© Granta Design, January 2009
Coupling condition Material choice Comment
Crack length
mm5c ≤
( 125.0c =π )
Titanium alloys Aluminium alloys Steels
These are the standard materials for pressure vessels. Steels appear,
despite their high density, because their toughness and strength are so high
Crack length
m5c µ≤
( 310x96.3c −=π )
CFRP Silicon carbide
Silicon nitride Alumina
Ceramics, potentially, are attractive structural
materials, but the difficult of fabricating and maintaining them with no
flaws greater than 5 µm is enormous
In engineering structures is it difficult to ensure that there are no cracks of length greater than 1 mm; then the tough engineering alloys based on steel, aluminum and titanium are the safe choice. In the field of MEMS (micro electro-mechanical systems) , in which films of
micron-thickness are deposited on substrates, etched to shapes and then loaded in various ways, it is possible – even with brittle ceramics
– to make components with no flaws greater than 1 µm in size. In this regime, the second selection given above has relevance.
Coupling line c = 5 microns
Coupling line c = 5 mm
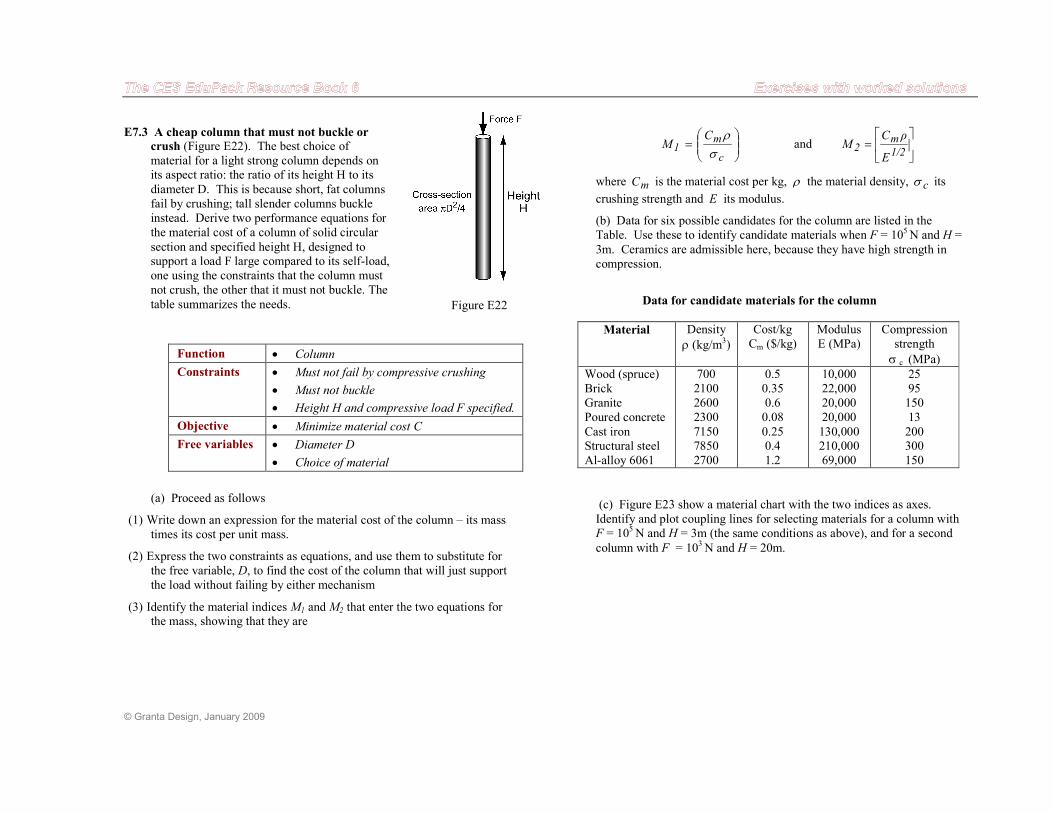
© Granta Design, January 2009
E7.3 A cheap column that must not buckle or
crush (Figure E22). The best choice of material for a light strong column depends on its aspect ratio: the ratio of its height H to its
diameter D. This is because short, fat columns fail by crushing; tall slender columns buckle instead. Derive two performance equations for the material cost of a column of solid circular
section and specified height H, designed to support a load F large compared to its self-load, one using the constraints that the column must not crush, the other that it must not buckle. The
table summarizes the needs.
Function • Column
Constraints • Must not fail by compressive crushing
• Must not buckle
• Height H and compressive load F specified.
Objective • Minimize material cost C
Free variables • Diameter D
• Choice of material
(a) Proceed as follows
(1) Write down an expression for the material cost of the column – its mass times its cost per unit mass.
(2) Express the two constraints as equations, and use them to substitute for the free variable, D, to find the cost of the column that will just support the load without failing by either mechanism
(3) Identify the material indices M1 and M2 that enter the two equations for the mass, showing that they are
Figure E22
=
c
m1
CM
σρ
and
=
1/2
m2
E
ρCM
where mC is the material cost per kg, ρ the material density, cσ its
crushing strength and E its modulus.
(b) Data for six possible candidates for the column are listed in the Table. Use these to identify candidate materials when F = 105 N and H =
3m. Ceramics are admissible here, because they have high strength in compression.
Data for candidate materials for the column
Material Density
ρ (kg/m3)
Cost/kg Cm ($/kg)
Modulus E (MPa)
Compression strength
σ c (MPa)
Wood (spruce) Brick Granite Poured concrete
Cast iron Structural steel Al-alloy 6061
700 2100 2600 2300
7150 7850 2700
0.5 0.35 0.6 0.08
0.25 0.4 1.2
10,000 22,000 20,000 20,000
130,000 210,000 69,000
25 95 150 13
200 300 150
(c) Figure E23 show a material chart with the two indices as axes. Identify and plot coupling lines for selecting materials for a column with F = 105 N and H = 3m (the same conditions as above), and for a second
column with F = 103 N and H = 20m.
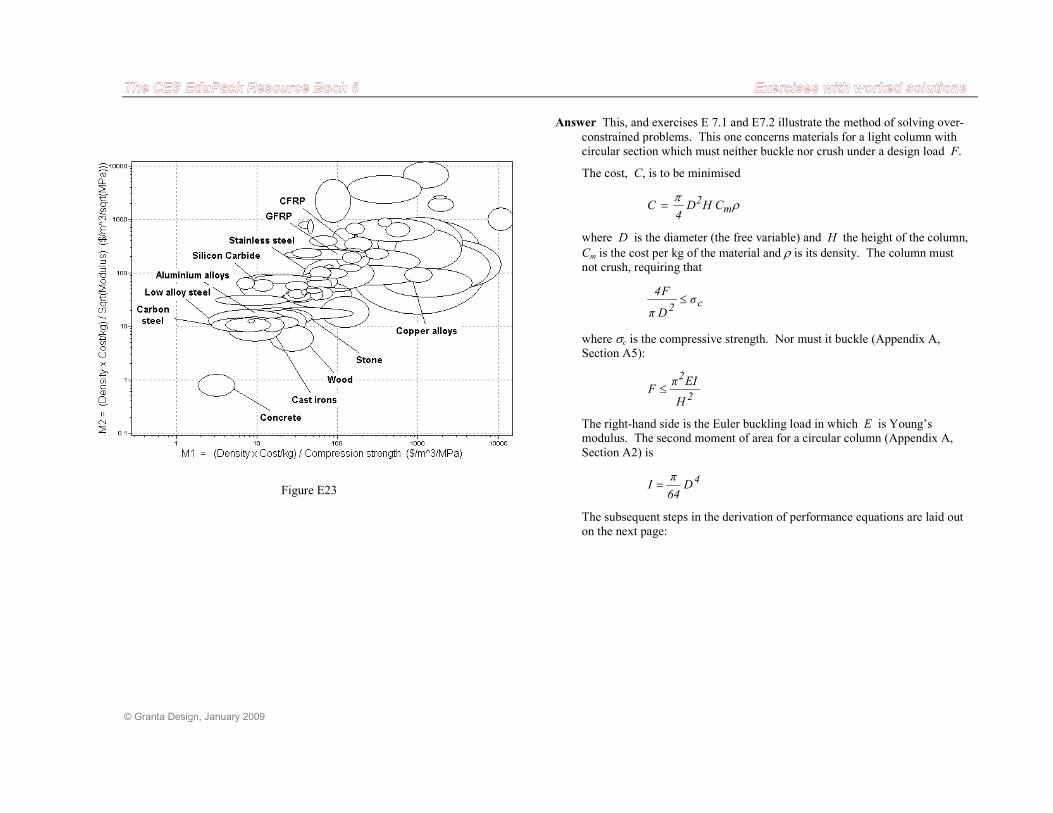
© Granta Design, January 2009
Figure E23
Answer This, and exercises E 7.1 and E7.2 illustrate the method of solving over-
constrained problems. This one concerns materials for a light column with circular section which must neither buckle nor crush under a design load F.
The cost, C, is to be minimised
ρπ
m2 CHD
4C =
where D is the diameter (the free variable) and H the height of the column,
Cm is the cost per kg of the material and ρ is its density. The column must not crush, requiring that
c2σ
Dπ
F4≤
where σc is the compressive strength. Nor must it buckle (Appendix A, Section A5):
2
2
H
EIπF ≤
The right-hand side is the Euler buckling load in which E is Young’s modulus. The second moment of area for a circular column (Appendix A, Section A2) is
4D64
πI =
The subsequent steps in the derivation of performance equations are laid out on the next page:
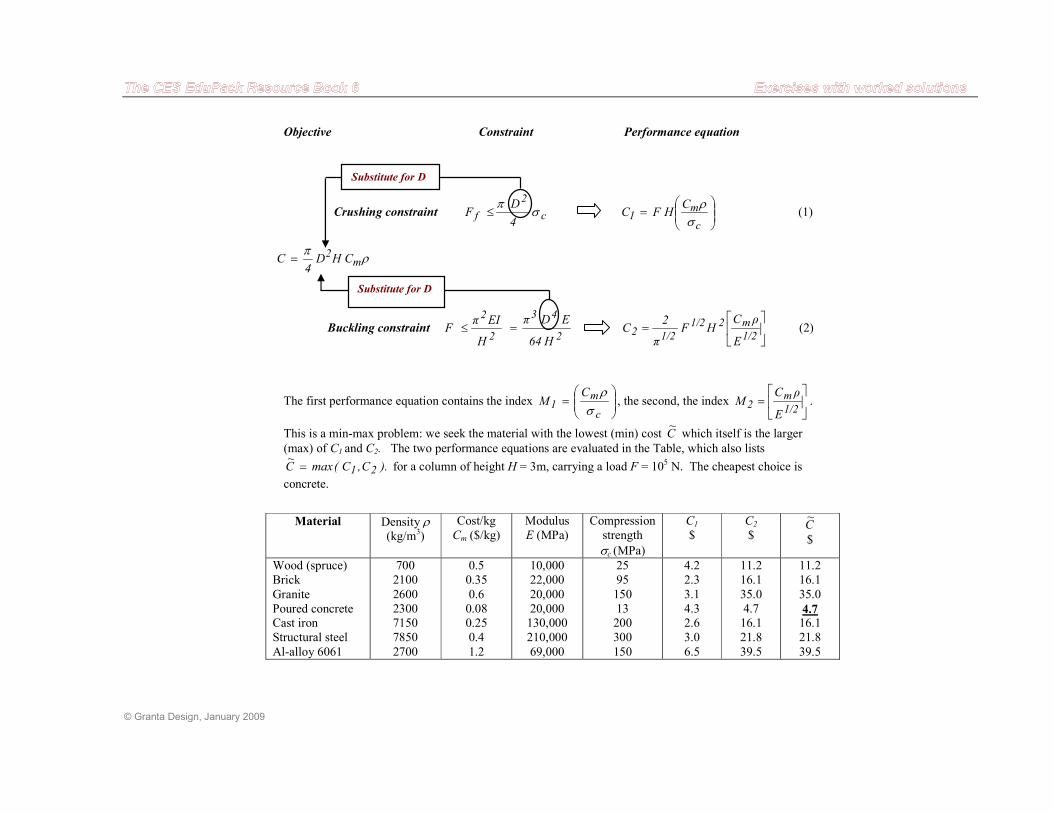
© Granta Design, January 2009
Objective Constraint Performance equation
Crushing constraint c
2
f4
DF σ
π≤
=
c
m1
CHFC
σρ
(1)
ρπ
m2 CHD
4C =
Buckling constraint 2
43
2
2
H64
EDπ
H
EIπF =≤
=
1/2
m21/2
1/22E
ρCHF
π
2C (2)
The first performance equation contains the index
=
c
m1
CM
σρ
, the second, the index
=
1/2
m2
E
ρCM .
This is a min-max problem: we seek the material with the lowest (min) cost C~ which itself is the larger
(max) of C1 and C2. The two performance equations are evaluated in the Table, which also lists
).C,C(maxC~
21= for a column of height H = 3m, carrying a load F = 105 N. The cheapest choice is
concrete.
Material Density ρ (kg/m3)
Cost/kg Cm ($/kg)
Modulus E (MPa)
Compression strength
σc (MPa)
C1
$ C2
$ C~
$
Wood (spruce) Brick
Granite Poured concrete Cast iron Structural steel
Al-alloy 6061
700 2100
2600 2300 7150 7850
2700
0.5 0.35
0.6 0.08 0.25 0.4
1.2
10,000 22,000
20,000 20,000 130,000 210,000
69,000
25 95
150 13 200 300
150
4.2 2.3
3.1 4.3 2.6 3.0
6.5
11.2 16.1
35.0 4.7 16.1 21.8
39.5
11.2 16.1
35.0
4.7 16.1 21.8
39.5
Substitute for D
Substitute for D
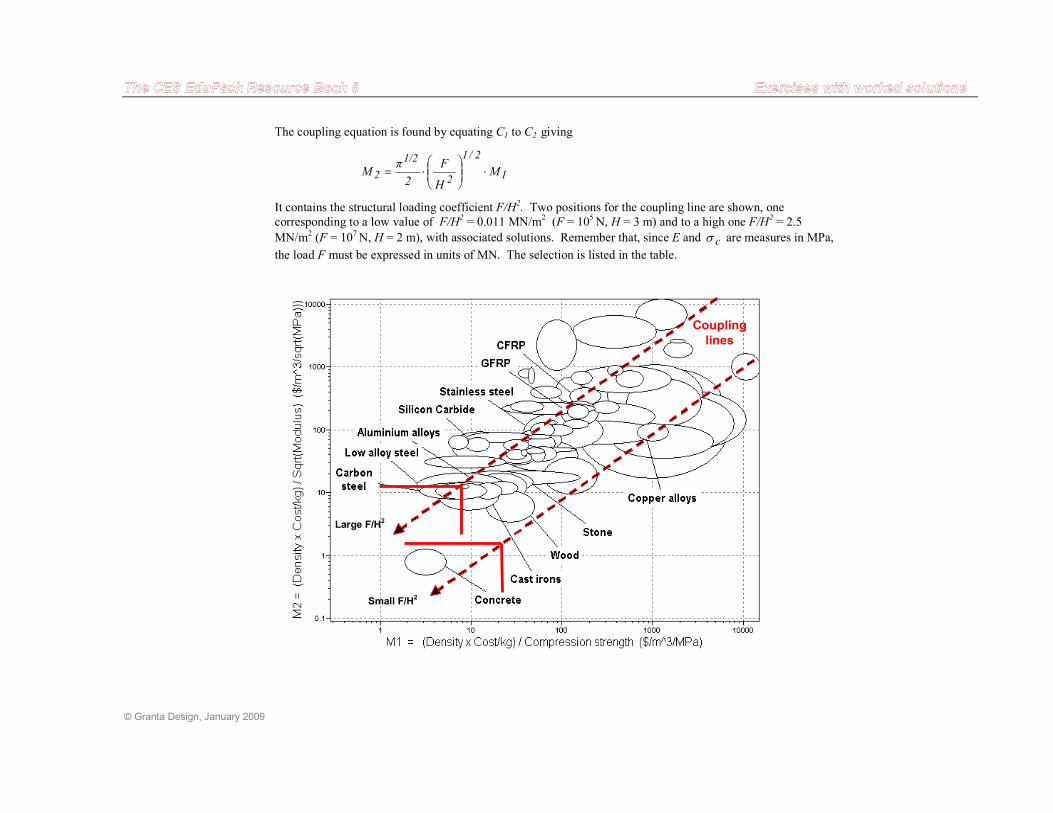
© Granta Design, January 2009
The coupling equation is found by equating C1 to C2 giving
1
2/1
2
1/2
2 MH
F
2
πM ⋅
⋅=
It contains the structural loading coefficient F/H2. Two positions for the coupling line are shown, one
corresponding to a low value of F/H2 = 0.011 MN/m2 (F = 105 N, H = 3 m) and to a high one F/H
2 = 2.5
MN/m2 (F = 107 N, H = 2 m), with associated solutions. Remember that, since E and cσ are measures in MPa,
the load F must be expressed in units of MN. The selection is listed in the table.
Large F/H2
Coupling
lines
Small F/H2
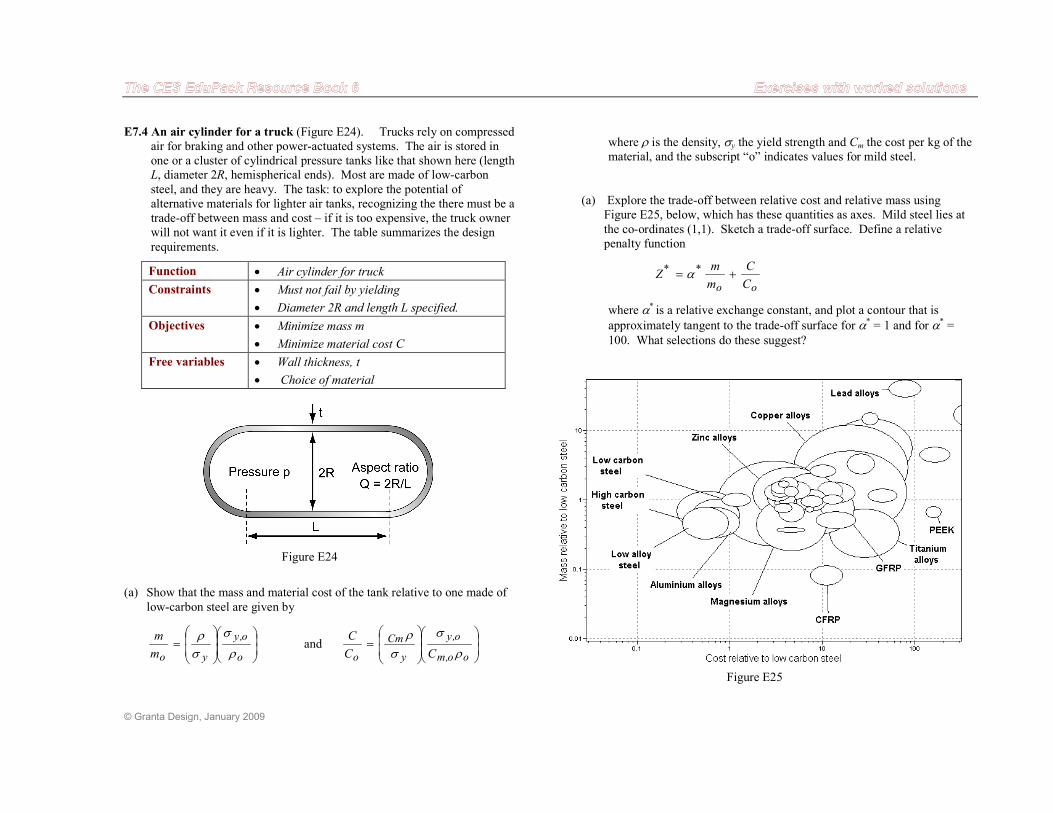
© Granta Design, January 2009
E7.4 An air cylinder for a truck (Figure E24). Trucks rely on compressed air for braking and other power-actuated systems. The air is stored in one or a cluster of cylindrical pressure tanks like that shown here (length L, diameter 2R, hemispherical ends). Most are made of low-carbon
steel, and they are heavy. The task: to explore the potential of alternative materials for lighter air tanks, recognizing the there must be a trade-off between mass and cost – if it is too expensive, the truck owner will not want it even if it is lighter. The table summarizes the design
requirements.
Function • Air cylinder for truck
Constraints • Must not fail by yielding
• Diameter 2R and length L specified.
Objectives • Minimize mass m
• Minimize material cost C
Free variables • Wall thickness, t
• Choice of material
(a) Show that the mass and material cost of the tank relative to one made of
low-carbon steel are given by
=
o
o,y
yom
m
ρ
σ
σρ
and
=
oo,m
o,y
y
Cm
o CC
C
ρ
σ
σρ
Figure E24
where ρ is the density, σy the yield strength and Cm the cost per kg of the material, and the subscript “o” indicates values for mild steel.
(a) Explore the trade-off between relative cost and relative mass using Figure E25, below, which has these quantities as axes. Mild steel lies at
the co-ordinates (1,1). Sketch a trade-off surface. Define a relative penalty function
oo
**
C
C
m
mZ += α
where α* is a relative exchange constant, and plot a contour that is
approximately tangent to the trade-off surface for α* = 1 and for α* =
100. What selections do these suggest?
Figure E25
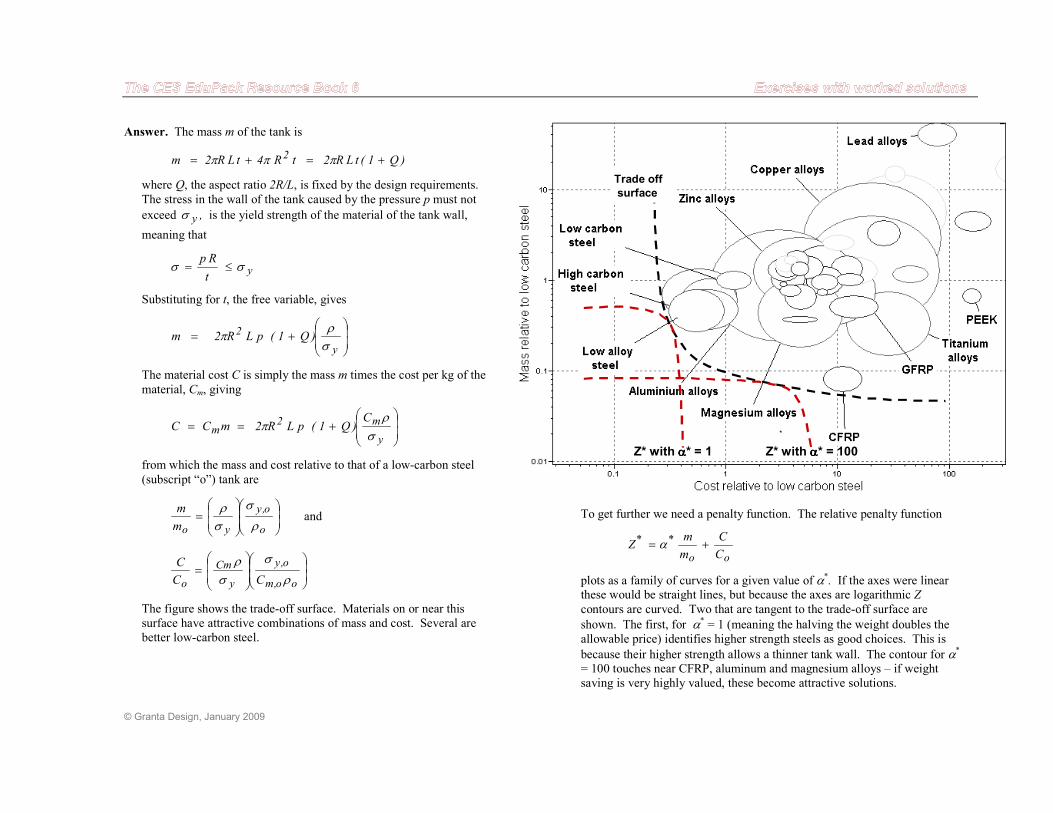
© Granta Design, January 2009
Answer. The mass m of the tank is
)Q1(tLR2tR4tLR2m 2 +=+= πππ
where Q, the aspect ratio 2R/L, is fixed by the design requirements.
The stress in the wall of the tank caused by the pressure p must not
exceed yσ , is the yield strength of the material of the tank wall,
meaning that
yt
Rpσσ ≤=
Substituting for t, the free variable, gives
+=
y
2 )Q1(pLR2mσρ
π
The material cost C is simply the mass m times the cost per kg of the
material, Cm, giving
+==
y
m2m
C)Q1(pLR2mCCσ
ρπ
from which the mass and cost relative to that of a low-carbon steel
(subscript “o”) tank are
=
o
o,y
yom
m
ρ
σ
σρ
and
=
oo,m
o,y
y
Cm
o CC
C
ρ
σ
σρ
The figure shows the trade-off surface. Materials on or near this surface have attractive combinations of mass and cost. Several are better low-carbon steel.
Trade off surface
*
Z* with αααα* = 1 Z* with αααα* = 100
To get further we need a penalty function. The relative penalty function
oo
**
C
C
m
mZ += α
plots as a family of curves for a given value of α*. If the axes were linear
these would be straight lines, but because the axes are logarithmic Z
contours are curved. Two that are tangent to the trade-off surface are
shown. The first, for α* = 1 (meaning the halving the weight doubles the allowable price) identifies higher strength steels as good choices. This is
because their higher strength allows a thinner tank wall. The contour for α* = 100 touches near CFRP, aluminum and magnesium alloys – if weight saving is very highly valued, these become attractive solutions.
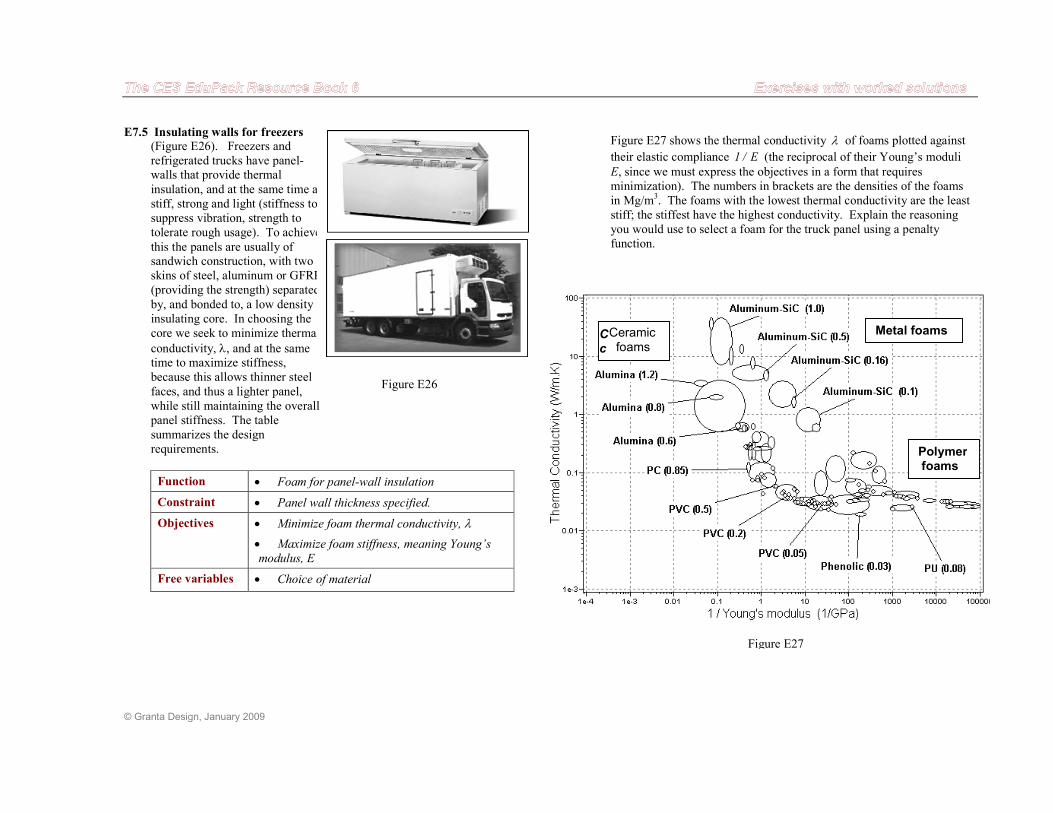
© Granta Design, January 2009
E7.5 Insulating walls for freezers
(Figure E26). Freezers and refrigerated trucks have panel-walls that provide thermal
insulation, and at the same time are stiff, strong and light (stiffness to suppress vibration, strength to tolerate rough usage). To achieve
this the panels are usually of sandwich construction, with two skins of steel, aluminum or GFRP (providing the strength) separated
by, and bonded to, a low density insulating core. In choosing the core we seek to minimize thermal
conductivity, λ, and at the same time to maximize stiffness, because this allows thinner steel
faces, and thus a lighter panel, while still maintaining the overall panel stiffness. The table summarizes the design requirements.
Function • Foam for panel-wall insulation
Constraint • Panel wall thickness specified.
Objectives • Minimize foam thermal conductivity, λ
• Maximize foam stiffness, meaning Young’s
modulus, E
Free variables • Choice of material
Figure E26
Figure E27 shows the thermal conductivity λ of foams plotted against
their elastic compliance E/1 (the reciprocal of their Young’s moduli
E, since we must express the objectives in a form that requires minimization). The numbers in brackets are the densities of the foams in Mg/m3. The foams with the lowest thermal conductivity are the least stiff; the stiffest have the highest conductivity. Explain the reasoning you would use to select a foam for the truck panel using a penalty function.
Metal foams
Polymer foams
C
c
Ceramic foams
Figure E27
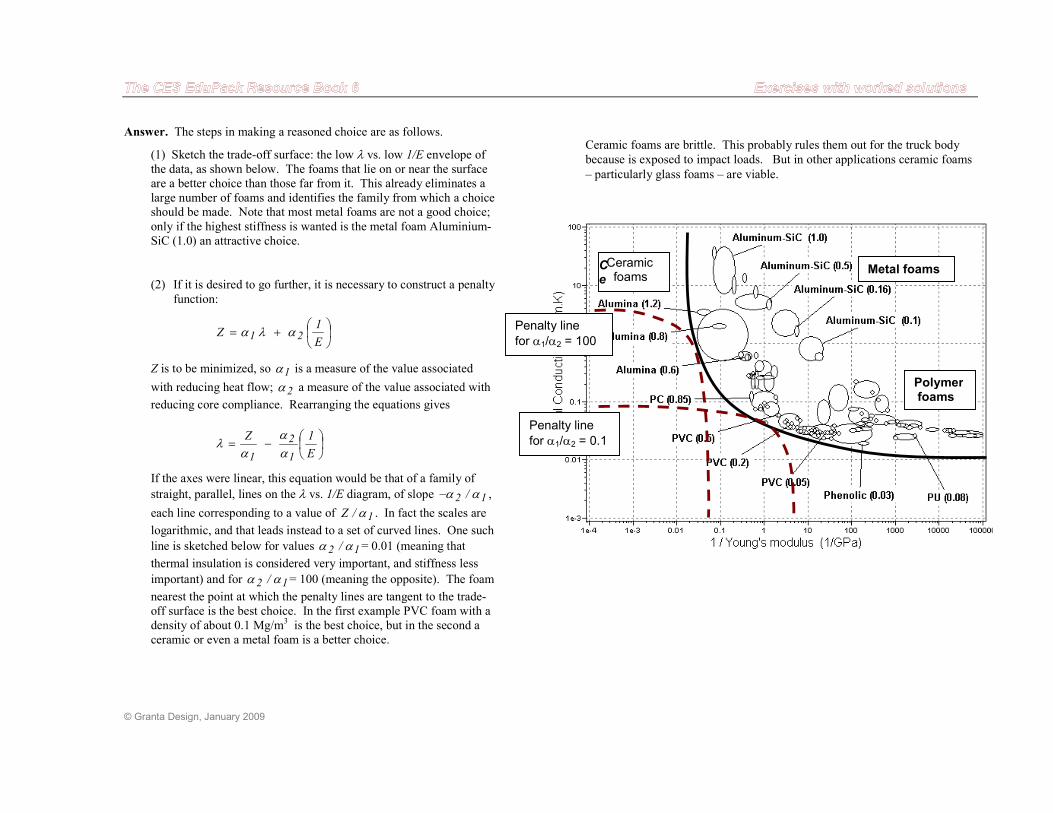
© Granta Design, January 2009
Answer. The steps in making a reasoned choice are as follows.
(1) Sketch the trade-off surface: the low λ vs. low 1/E envelope of the data, as shown below. The foams that lie on or near the surface are a better choice than those far from it. This already eliminates a large number of foams and identifies the family from which a choice should be made. Note that most metal foams are not a good choice;
only if the highest stiffness is wanted is the metal foam Aluminium-SiC (1.0) an attractive choice.
(2) If it is desired to go further, it is necessary to construct a penalty function:
+=
E
1Z 21 αλα
Z is to be minimized, so 1α is a measure of the value associated
with reducing heat flow; 2α a measure of the value associated with
reducing core compliance. Rearranging the equations gives
−=
E
1Z
1
2
1 αα
αλ
If the axes were linear, this equation would be that of a family of
straight, parallel, lines on the λ vs. 1/E diagram, of slope 12 / αα− ,
each line corresponding to a value of 1/Z α . In fact the scales are
logarithmic, and that leads instead to a set of curved lines. One such
line is sketched below for values 12 / αα = 0.01 (meaning that
thermal insulation is considered very important, and stiffness less
important) and for 12 / αα = 100 (meaning the opposite). The foam
nearest the point at which the penalty lines are tangent to the trade-off surface is the best choice. In the first example PVC foam with a density of about 0.1 Mg/m3 is the best choice, but in the second a ceramic or even a metal foam is a better choice.
Ceramic foams are brittle. This probably rules them out for the truck body
because is exposed to impact loads. But in other applications ceramic foams
– particularly glass foams – are viable.
Penalty line
for α1/α2 = 0.1
Penalty line
for α1/α2 = 100
Metal foams
Polymer foams
C
e
r
Ceramic foams
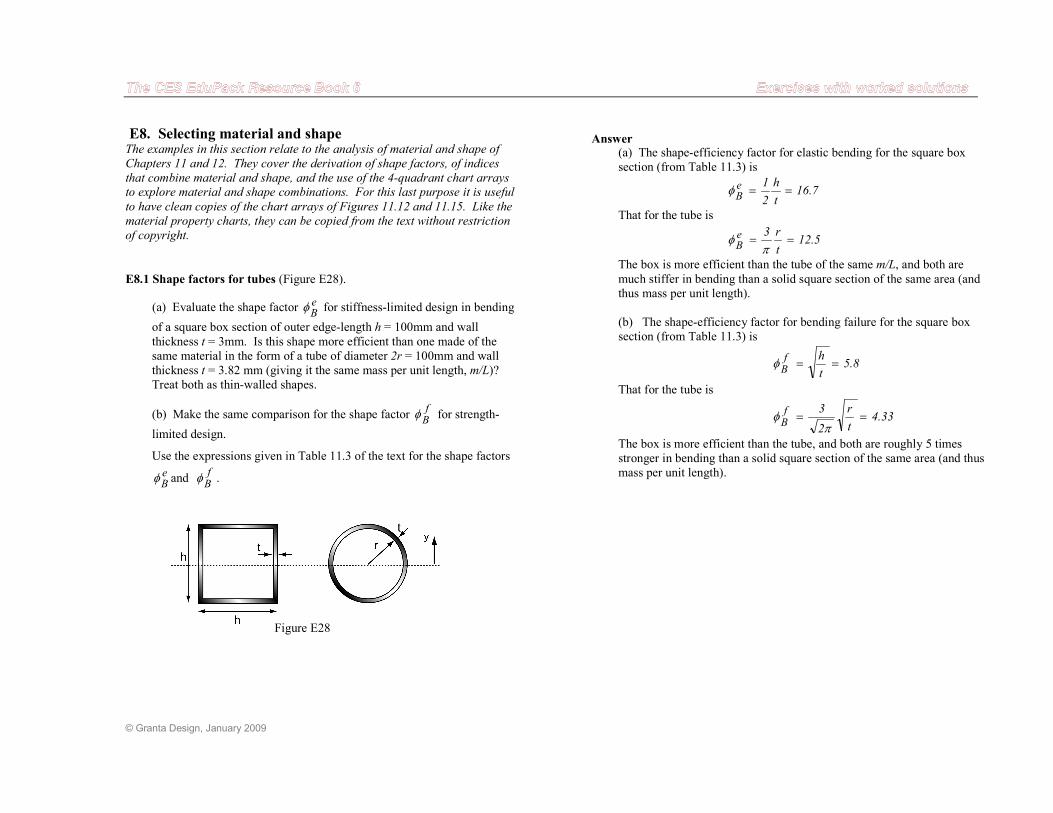
© Granta Design, January 2009
E8. Selecting material and shape The examples in this section relate to the analysis of material and shape of
Chapters 11 and 12. They cover the derivation of shape factors, of indices
that combine material and shape, and the use of the 4-quadrant chart arrays
to explore material and shape combinations. For this last purpose it is useful
to have clean copies of the chart arrays of Figures 11.12 and 11.15. Like the
material property charts, they can be copied from the text without restriction
of copyright.
E8.1 Shape factors for tubes (Figure E28).
(a) Evaluate the shape factor eB
φ for stiffness-limited design in bending
of a square box section of outer edge-length h = 100mm and wall
thickness t = 3mm. Is this shape more efficient than one made of the
same material in the form of a tube of diameter 2r = 100mm and wall
thickness t = 3.82 mm (giving it the same mass per unit length, m/L)?
Treat both as thin-walled shapes.
(b) Make the same comparison for the shape factor fB
φ for strength-
limited design.
Use the expressions given in Table 11.3 of the text for the shape factors
eB
φ and fB
φ .
Figure E28
Answer (a) The shape-efficiency factor for elastic bending for the square box
section (from Table 11.3) is
7.16t
h
2
1eB
==φ
That for the tube is
5.12t
r3eB
==π
φ
The box is more efficient than the tube of the same m/L, and both are
much stiffer in bending than a solid square section of the same area (and
thus mass per unit length).
(b) The shape-efficiency factor for bending failure for the square box
section (from Table 11.3) is
8.5t
hfB
==φ
That for the tube is
33.4t
r
2
3fB
==π
φ
The box is more efficient than the tube, and both are roughly 5 times
stronger in bending than a solid square section of the same area (and thus
mass per unit length).
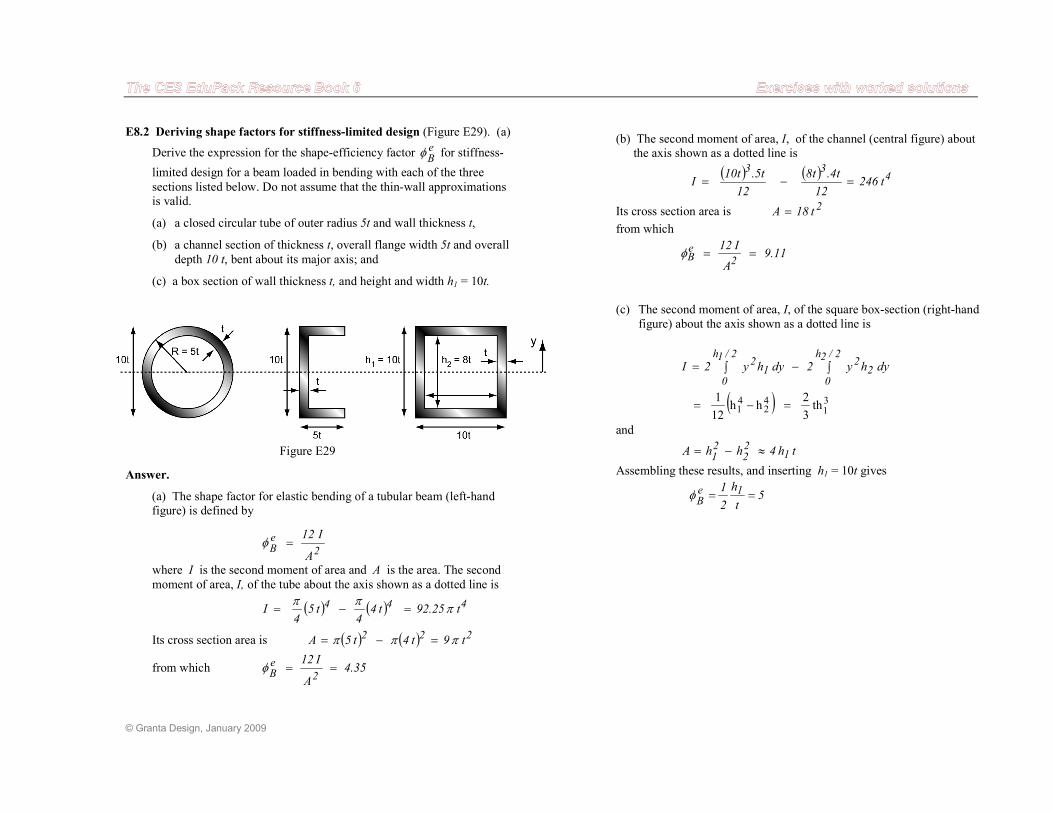
© Granta Design, January 2009
E8.2 Deriving shape factors for stiffness-limited design (Figure E29). (a)
Derive the expression for the shape-efficiency factor eB
φ for stiffness-
limited design for a beam loaded in bending with each of the three
sections listed below. Do not assume that the thin-wall approximations
is valid.
(a) a closed circular tube of outer radius 5t and wall thickness t,
(b) a channel section of thickness t, overall flange width 5t and overall depth 10 t, bent about its major axis; and
(c) a box section of wall thickness t, and height and width h1 = 10t.
Answer.
(a) The shape factor for elastic bending of a tubular beam (left-hand
figure) is defined by
2
eB
A
I12=φ
where I is the second moment of area and A is the area. The second
moment of area, I, of the tube about the axis shown as a dotted line is
( ) ( ) 444 t25.92t44
t54
I πππ
=−=
Its cross section area is ( ) ( ) 222 t9t4t5A πππ =−=
from which 35.4A
I12
2
eB
==φ
Figure E29
(b) The second moment of area, I, of the channel (central figure) about the axis shown as a dotted line is
( ) ( ) 4
33
t24612
t4.t8
12
t5.t10I =−=
Its cross section area is 2t18A =
from which
11.9A
I12
2eB ==φ
(c) The second moment of area, I, of the square box-section (right-hand
figure) about the axis shown as a dotted line is
dyhy2dyhy2I 2
2/2h
0
21
2/1h
0
2∫−∫=
( ) 31
42
41 th
3
2hh
12
1=−=
and
th4hhA 122
21
≈−=
Assembling these results, and inserting h1 = 10t gives
5t
h
2
1 1eB
==φ
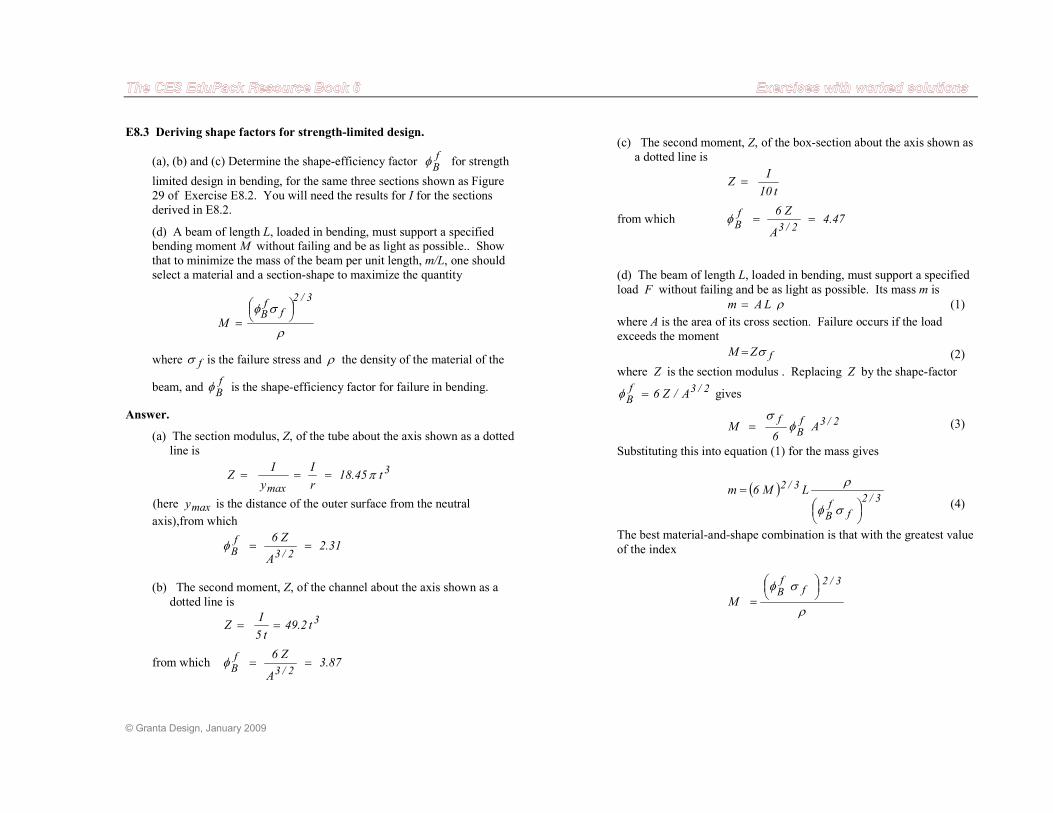
© Granta Design, January 2009
E8.3 Deriving shape factors for strength-limited design.
(a), (b) and (c) Determine the shape-efficiency factor fB
φ for strength
limited design in bending, for the same three sections shown as Figure
29 of Exercise E8.2. You will need the results for I for the sections
derived in E8.2.
(d) A beam of length L, loaded in bending, must support a specified
bending moment M without failing and be as light as possible.. Show
that to minimize the mass of the beam per unit length, m/L, one should
select a material and a section-shape to maximize the quantity
ρ
σφ3/2
ffB
M
=
where fσ is the failure stress and ρ the density of the material of the
beam, and fB
φ is the shape-efficiency factor for failure in bending.
Answer.
(a) The section modulus, Z, of the tube about the axis shown as a dotted
line is
3
max
t45.18r
I
y
IZ π===
(here maxy is the distance of the outer surface from the neutral
axis),from which
31.2A
Z6
2/3
fB
==φ
(b) The second moment, Z, of the channel about the axis shown as a
dotted line is
3t2.49t5
IZ ==
from which 87.3A
Z6
2/3
fB
==φ
(c) The second moment, Z, of the box-section about the axis shown as
a dotted line is
t10
IZ =
from which 47.4A
Z6
2/3
fB
==φ
(d) The beam of length L, loaded in bending, must support a specified
load F without failing and be as light as possible. Its mass m is
ρLAm = (1)
where A is the area of its cross section. Failure occurs if the load
exceeds the moment
fZM σ= (2)
where Z is the section modulus . Replacing Z by the shape-factor
2/3fB
A/Z6=φ gives
2/3fB
fA
6M φ
σ= (3)
Substituting this into equation (1) for the mass gives
( ) LM6m
3/2
ffB
3/2
=
σφ
ρ
(4)
The best material-and-shape combination is that with the greatest value
of the index
ρ
σφ 3/2f
fB
M
=
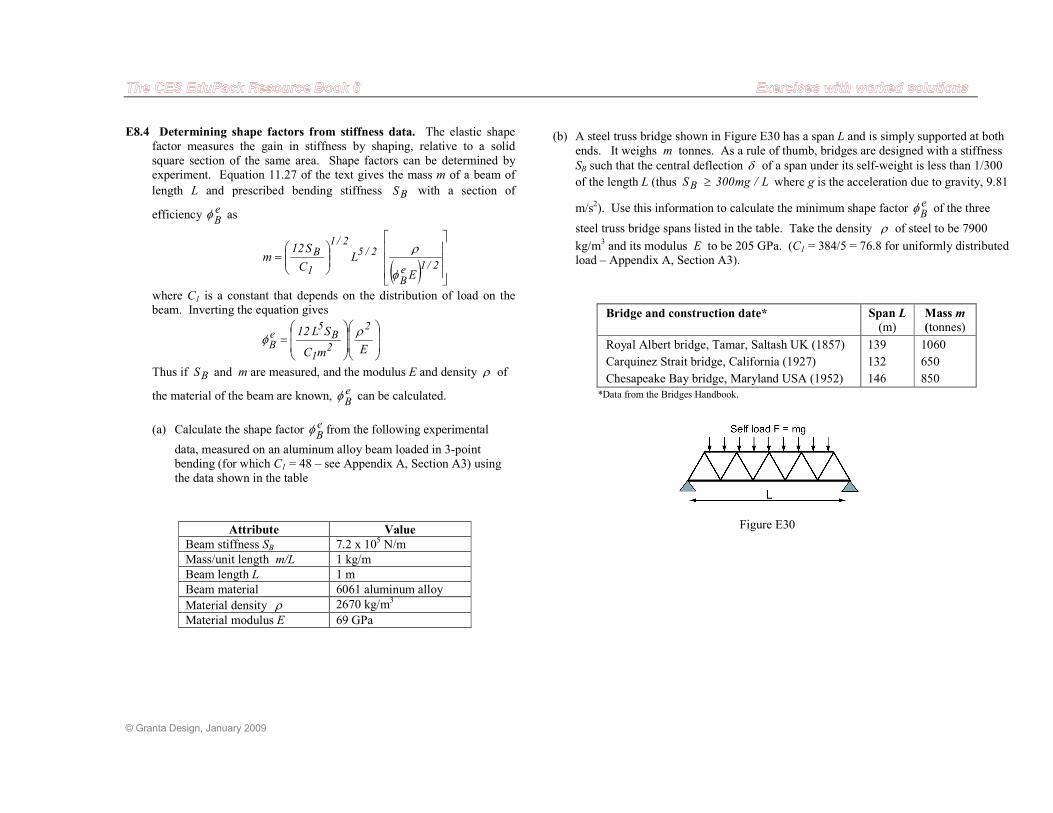
© Granta Design, January 2009
E8.4 Determining shape factors from stiffness data. The elastic shape
factor measures the gain in stiffness by shaping, relative to a solid
square section of the same area. Shape factors can be determined by
experiment. Equation 11.27 of the text gives the mass m of a beam of
length L and prescribed bending stiffness BS with a section of
efficiency eB
φ as
( )
=
2/1eB
2/52/1
1
B
E
LC
S12m
φ
ρ
where C1 is a constant that depends on the distribution of load on the
beam. Inverting the equation gives
=
EmC
SL122
21
B5
eB
ρφ
Thus if BS and m are measured, and the modulus E and density ρ of
the material of the beam are known, eB
φ can be calculated.
(a) Calculate the shape factor eB
φ from the following experimental
data, measured on an aluminum alloy beam loaded in 3-point
bending (for which C1 = 48 – see Appendix A, Section A3) using
the data shown in the table
Attribute Value
Beam stiffness SB 7.2 x 10⁵ N/m
Mass/unit length m/L 1 kg/m
Beam length L 1 m
Beam material 6061 aluminum alloy
Material density ρ 2670 kg/m3
Material modulus E 69 GPa
(b) A steel truss bridge shown in Figure E30 has a span L and is simply supported at both
ends. It weighs m tonnes. As a rule of thumb, bridges are designed with a stiffness
SB such that the central deflection δ of a span under its self-weight is less than 1/300
of the length L (thus L/mg300SB ≥ where g is the acceleration due to gravity, 9.81
m/s2). Use this information to calculate the minimum shape factor e
Bφ of the three
steel truss bridge spans listed in the table. Take the density ρ of steel to be 7900
kg/m3 and its modulus E to be 205 GPa. (C1 = 384/5 = 76.8 for uniformly distributed
load – Appendix A, Section A3).
Bridge and construction date* Span L
(m) Mass m
(tonnes)
Royal Albert bridge, Tamar, Saltash UK (1857)
Carquinez Strait bridge, California (1927)
Chesapeake Bay bridge, Maryland USA (1952)
139
132
146
1060
650
850
*Data from the Bridges Handbook.
Figure E30
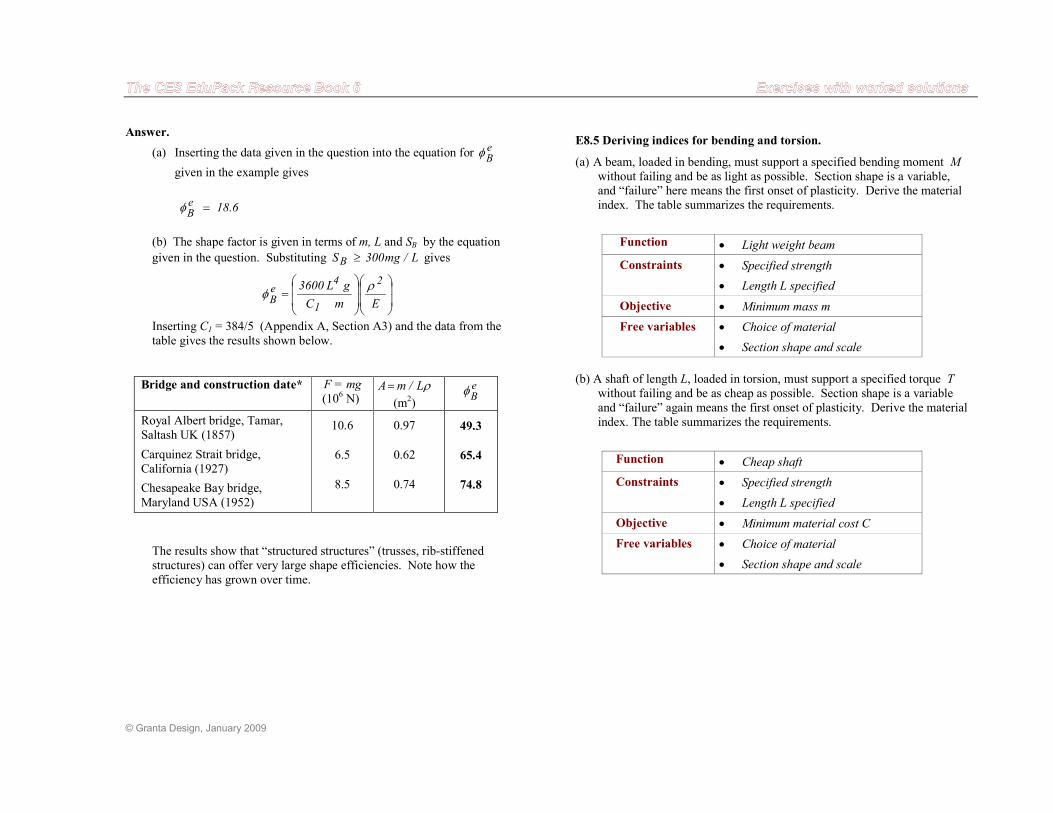
© Granta Design, January 2009
Answer.
(a) Inserting the data given in the question into the equation for eB
φ
given in the example gives
6.18eB
=φ
(b) The shape factor is given in terms of m, L and SB by the equation
given in the question. Substituting L/mg300SB ≥ gives
=
EmC
gL3600 2
1
4eB
ρφ
Inserting C1 = 384/5 (Appendix A, Section A3) and the data from the
table gives the results shown below.
Bridge and construction date* F = mg
(106 N)
ρL/mA=
(m2)
eB
φ
Royal Albert bridge, Tamar,
Saltash UK (1857)
Carquinez Strait bridge,
California (1927)
Chesapeake Bay bridge,
Maryland USA (1952)
10.6
6.5
8.5
0.97
0.62
0.74
49.3
65.4
74.8
The results show that “structured structures” (trusses, rib-stiffened
structures) can offer very large shape efficiencies. Note how the
efficiency has grown over time.
E8.5 Deriving indices for bending and torsion.
(a) A beam, loaded in bending, must support a specified bending moment M
without failing and be as light as possible. Section shape is a variable,
and “failure” here means the first onset of plasticity. Derive the material
index. The table summarizes the requirements.
Function • Light weight beam
Constraints
• Specified strength
• Length L specified
Objective • Minimum mass m
Free variables
• Choice of material
• Section shape and scale
(b) A shaft of length L, loaded in torsion, must support a specified torque T
without failing and be as cheap as possible. Section shape is a variable
and “failure” again means the first onset of plasticity. Derive the material
index. The table summarizes the requirements.
Function • Cheap shaft
Constraints
• Specified strength
• Length L specified
Objective • Minimum material cost C
Free variables
• Choice of material
• Section shape and scale
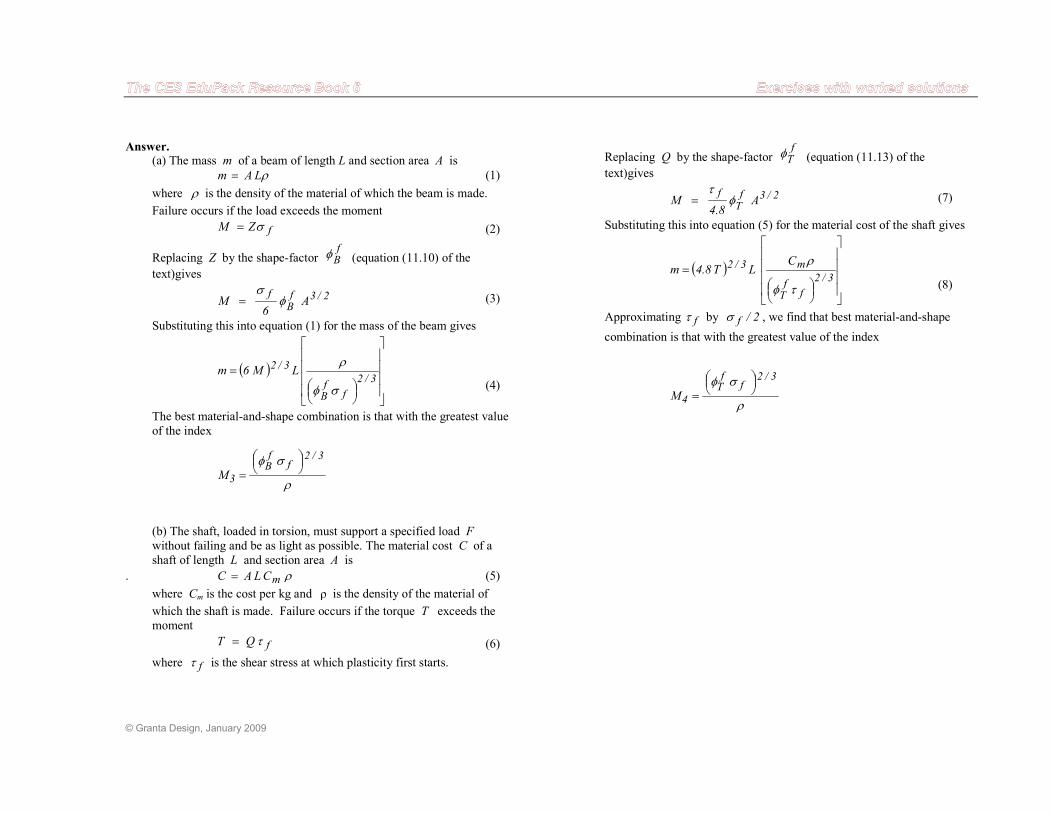
© Granta Design, January 2009
Answer. (a) The mass m of a beam of length L and section area A is
ρLAm = (1)
where ρ is the density of the material of which the beam is made.
Failure occurs if the load exceeds the moment
fZM σ= (2)
Replacing Z by the shape-factor fB
φ (equation (11.10) of the
text)gives
2/3fB
fA
6M φ
σ= (3)
Substituting this into equation (1) for the mass of the beam gives
( )
=3/2
ffB
3/2 LM6m
σφ
ρ
(4)
The best material-and-shape combination is that with the greatest value
of the index
ρ
σφ 3/2f
fB
3M
=
(b) The shaft, loaded in torsion, must support a specified load F
without failing and be as light as possible. The material cost C of a
shaft of length L and section area A is
. ρmCLAC = (5)
where Cm is the cost per kg and ρ is the density of the material of
which the shaft is made. Failure occurs if the torque T exceeds the
moment
fQT τ= (6)
where fτ is the shear stress at which plasticity first starts.
Replacing Q by the shape-factor fTφ (equation (11.13) of the
text)gives
2/3fT
fA
8.4M φ
τ= (7)
Substituting this into equation (5) for the material cost of the shaft gives
( )
=3/2
ffT
m3/2 C LT8.4m
τφ
ρ
(8)
Approximating fτ by 2/fσ , we find that best material-and-shape
combination is that with the greatest value of the index
ρ
σφ 3/2f
fT
4M
=
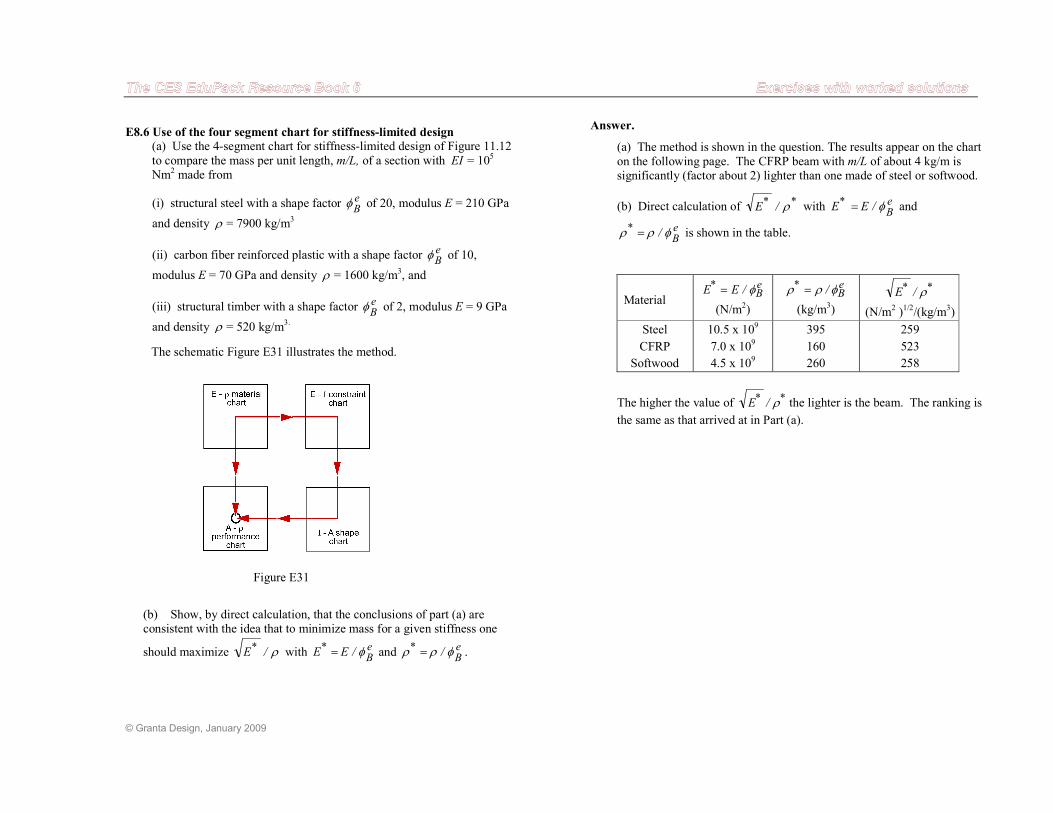
© Granta Design, January 2009
E8.6 Use of the four segment chart for stiffness-limited design
(a) Use the 4-segment chart for stiffness-limited design of Figure 11.12
to compare the mass per unit length, m/L, of a section with EI = 105
Nm2 made from
(i) structural steel with a shape factor eB
φ of 20, modulus E = 210 GPa
and density ρ = 7900 kg/m3
(ii) carbon fiber reinforced plastic with a shape factor eB
φ of 10,
modulus E = 70 GPa and density ρ = 1600 kg/m3, and
(iii) structural timber with a shape factor eB
φ of 2, modulus E = 9 GPa
and density ρ = 520 kg/m3.
The schematic Figure E31 illustrates the method.
(b) Show, by direct calculation, that the conclusions of part (a) are consistent with the idea that to minimize mass for a given stiffness one
should maximize ρ/E* with eB
* /EE φ= and eB
* / φρρ = .
Figure E31
Answer.
(a) The method is shown in the question. The results appear on the chart
on the following page. The CFRP beam with m/L of about 4 kg/m is significantly (factor about 2) lighter than one made of steel or softwood.
(b) Direct calculation of **/E ρ with e
B* /EE φ= and
eB
* / φρρ = is shown in the table.
Material
eB
* /EE φ=
(N/m2)
eB
* / φρρ =
(kg/m3)
** /E ρ
(N/m2 )1/2/(kg/m
3)
Steel
CFRP
Softwood
10.5 x 10⁹
7.0 x 10⁹
4.5 x 10⁹
395
160
260
259
523
258
The higher the value of ** /E ρ the lighter is the beam. The ranking is
the same as that arrived at in Part (a).
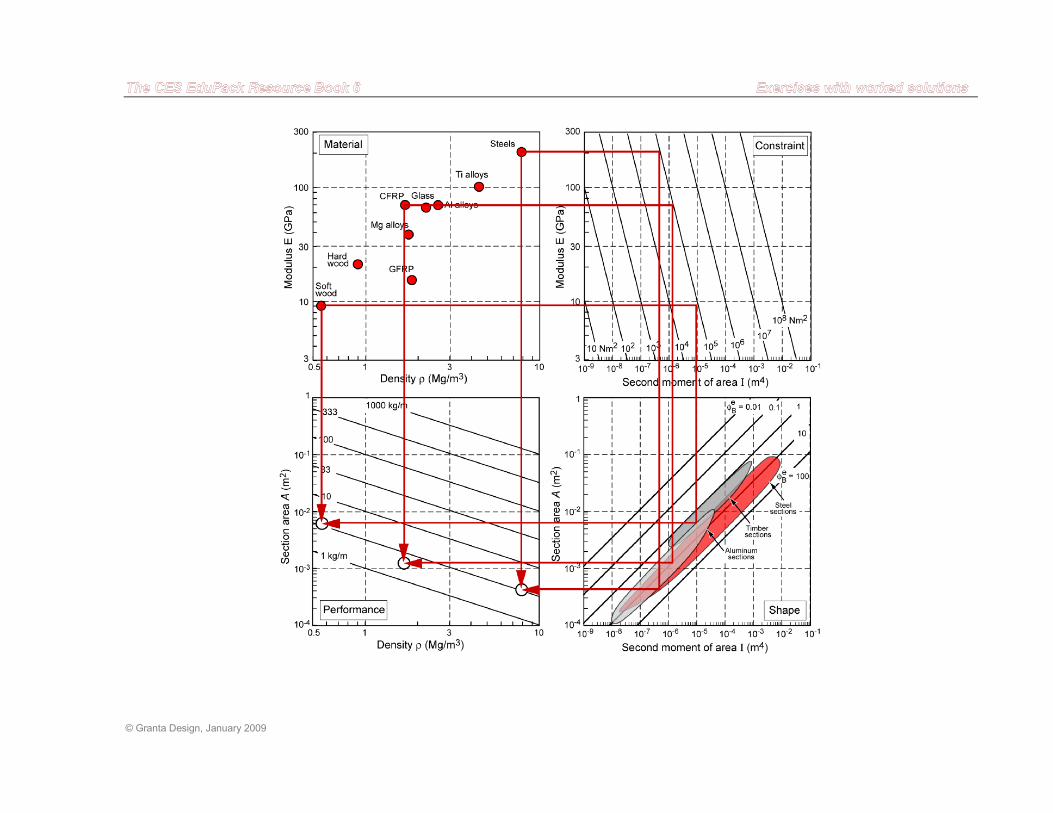
© Granta Design, January 2009
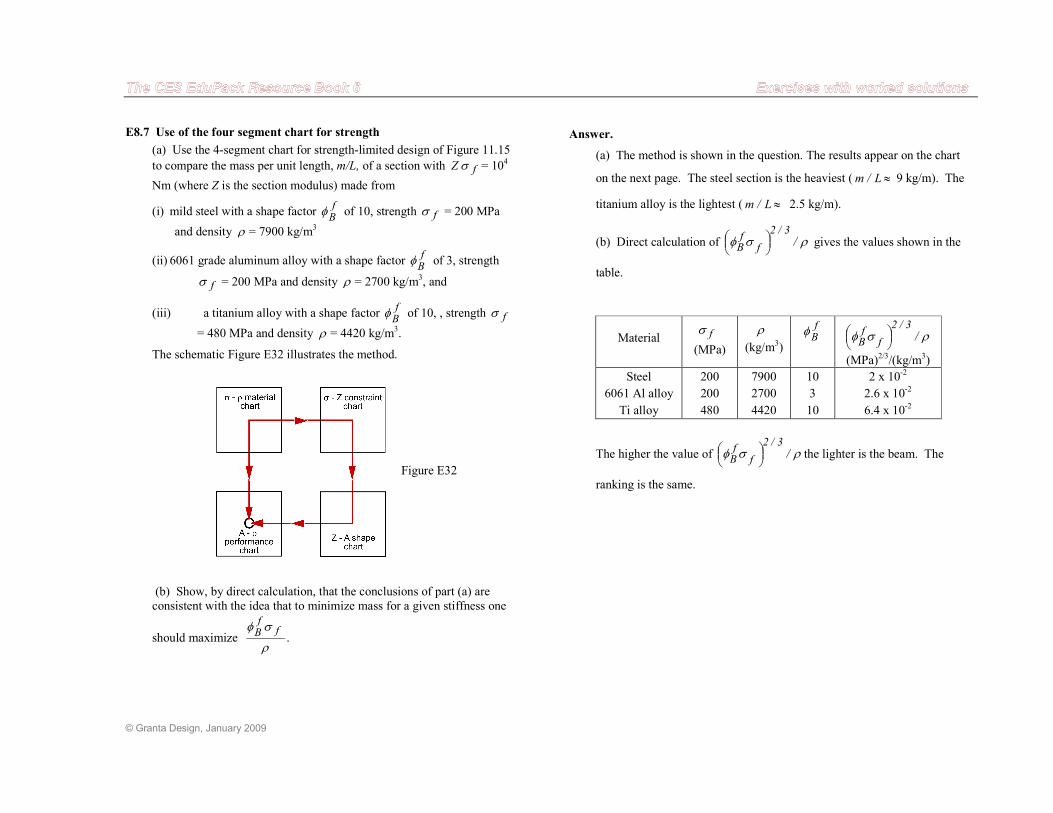
© Granta Design, January 2009
E8.7 Use of the four segment chart for strength
(a) Use the 4-segment chart for strength-limited design of Figure 11.15
to compare the mass per unit length, m/L, of a section with fZ σ = 104
Nm (where Z is the section modulus) made from
(i) mild steel with a shape factor fB
φ of 10, strength fσ = 200 MPa
and density ρ = 7900 kg/m3
(ii) 6061 grade aluminum alloy with a shape factor fB
φ of 3, strength
fσ = 200 MPa and density ρ = 2700 kg/m3, and
(iii) a titanium alloy with a shape factor fB
φ of 10, , strength fσ
= 480 MPa and density ρ = 4420 kg/m3.
The schematic Figure E32 illustrates the method.
(b) Show, by direct calculation, that the conclusions of part (a) are
consistent with the idea that to minimize mass for a given stiffness one
should maximize ρ
σφ ffB
.
Figure E32
Answer.
(a) The method is shown in the question. The results appear on the chart
on the next page. The steel section is the heaviest ( ≈L/m 9 kg/m). The
titanium alloy is the lightest ( ≈L/m 2.5 kg/m).
(b) Direct calculation of ρσφ /3/2
ffB
gives the values shown in the
table.
Material fσ
(MPa)
ρ
(kg/m3)
fB
φ ρσφ /3/2
ffB
(MPa)2/3/(kg/m
3)
Steel
6061 Al alloy
Ti alloy
200
200
480
7900
2700
4420
10
3
10
2 x 10⁻²
2.6 x 10⁻²
6.4 x 10⁻²
The higher the value of ρσφ /3/2
ffB
the lighter is the beam. The
ranking is the same.
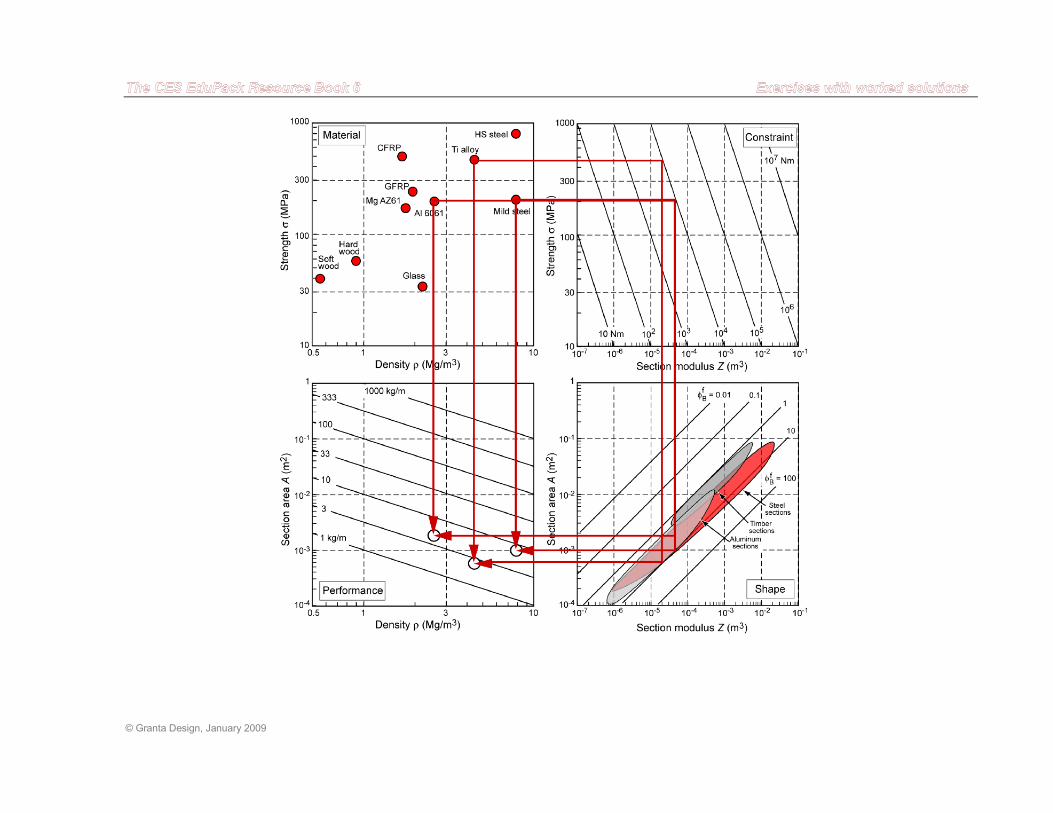
© Granta Design, January 2009
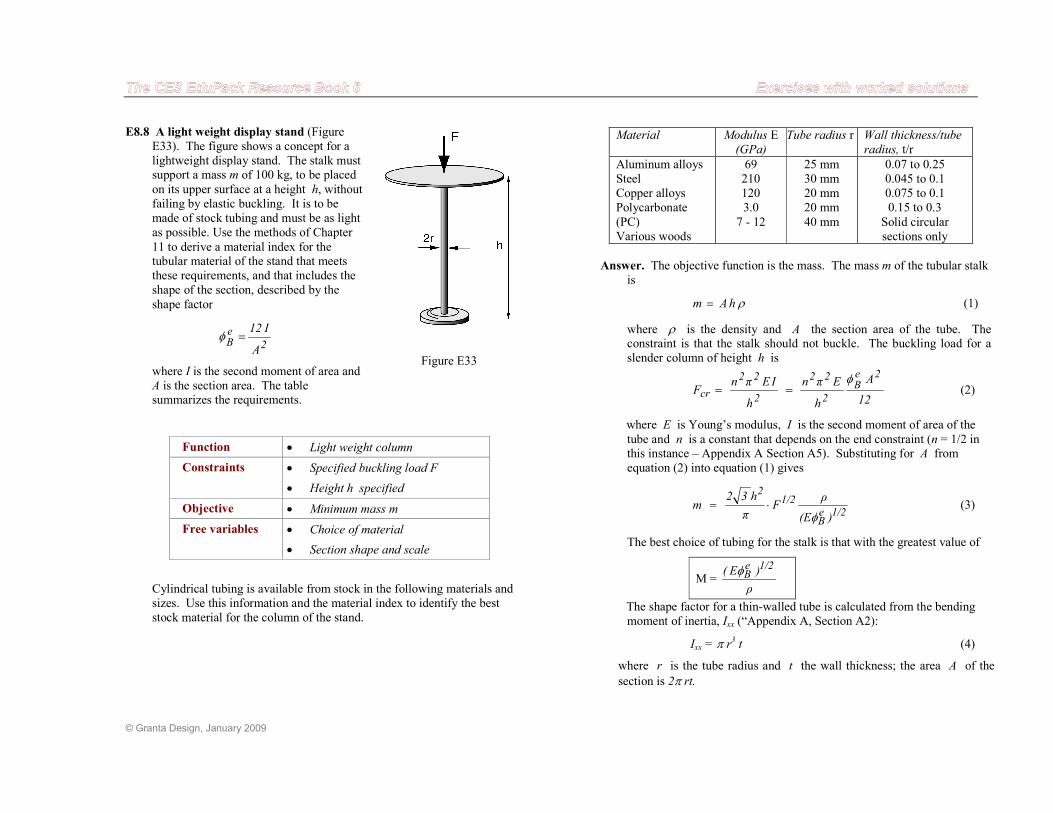
© Granta Design, January 2009
E8.8 A light weight display stand (Figure
E33). The figure shows a concept for a
lightweight display stand. The stalk must support a mass m of 100 kg, to be placed
on its upper surface at a height h, without
failing by elastic buckling. It is to be
made of stock tubing and must be as light
as possible. Use the methods of Chapter
11 to derive a material index for the tubular material of the stand that meets
these requirements, and that includes the
shape of the section, described by the
shape factor
2
eB
A
I12=φ
where I is the second moment of area and
A is the section area. The table summarizes the requirements.
Function • Light weight column
Constraints
• Specified buckling load F
• Height h specified
Objective • Minimum mass m
Free variables
• Choice of material
• Section shape and scale
Cylindrical tubing is available from stock in the following materials and
sizes. Use this information and the material index to identify the best
stock material for the column of the stand.
Figure E33
Material Modulus E
(GPa)
Tube radius r Wall thickness/tube
radius, t/r
Aluminum alloys
Steel
Copper alloys
Polycarbonate
(PC)
Various woods
69
210
120
3.0
7 - 12
25 mm
30 mm
20 mm
20 mm
40 mm
0.07 to 0.25
0.045 to 0.1
0.075 to 0.1
0.15 to 0.3
Solid circular
sections only
Answer. The objective function is the mass. The mass m of the tubular stalk
is
ρhAm = (1)
where ρ is the density and A the section area of the tube. The constraint is that the stalk should not buckle. The buckling load for a
slender column of height h is
12
A
h
Eπn
h
IEπnF
2eB
2
22
2
22
cr
φ== (2)
where E is Young’s modulus, I is the second moment of area of the
tube and n is a constant that depends on the end constraint (n = 1/2 in this instance – Appendix A Section A5). Substituting for A from
equation (2) into equation (1) gives
1/2e
B
1/22
)(E
ρF
π
h32m
φ⋅= (3)
The best choice of tubing for the stalk is that with the greatest value of
M = ρ
)E( 1/2eBφ
The shape factor for a thin-walled tube is calculated from the bending
moment of inertia, Ixx (“Appendix A, Section A2):
Ixx = π r3 t (4)
where r is the tube radius and t the wall thickness; the area A of the
section is 2π rt.
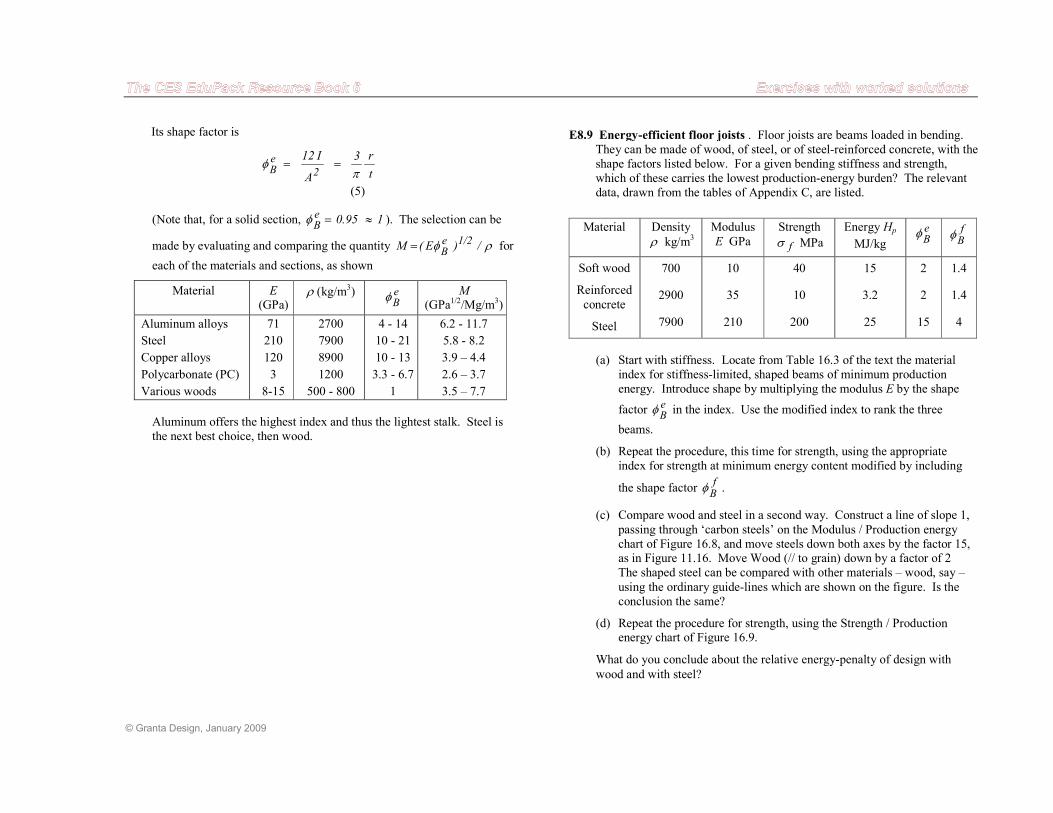
© Granta Design, January 2009
Its shape factor is
t
r3
A
I12
2
eB π
φ ==
(5)
(Note that, for a solid section, 195.0eB
≈=φ ). The selection can be
made by evaluating and comparing the quantity ρφ /)E(M 1/2eB
= for
each of the materials and sections, as shown
Material E (GPa)
ρ (kg/m3) e
Bφ
M (GPa1/2/Mg/m3)
Aluminum alloys
Steel
Copper alloys
Polycarbonate (PC)
Various woods
71
210
120
3
8-15
2700
7900
8900
1200
500 - 800
4 - 14
10 - 21
10 - 13
3.3 - 6.7
1
6.2 - 11.7
5.8 - 8.2
3.9 – 4.4
2.6 – 3.7
3.5 – 7.7
Aluminum offers the highest index and thus the lightest stalk. Steel is
the next best choice, then wood.
E8.9 Energy-efficient floor joists . Floor joists are beams loaded in bending.
They can be made of wood, of steel, or of steel-reinforced concrete, with the
shape factors listed below. For a given bending stiffness and strength,
which of these carries the lowest production-energy burden? The relevant
data, drawn from the tables of Appendix C, are listed.
Material Density
ρ kg/m3
Modulus
E GPa
Strength
fσ MPa
Energy Hp
MJ/kg
eB
φ fB
φ
Soft wood
Reinforced
concrete
Steel
700
2900
7900
10
35
210
40
10
200
15
3.2
25
2
2
15
1.4
1.4
4
(a) Start with stiffness. Locate from Table 16.3 of the text the material
index for stiffness-limited, shaped beams of minimum production
energy. Introduce shape by multiplying the modulus E by the shape
factor eB
φ in the index. Use the modified index to rank the three
beams.
(b) Repeat the procedure, this time for strength, using the appropriate
index for strength at minimum energy content modified by including
the shape factor fB
φ .
(c) Compare wood and steel in a second way. Construct a line of slope 1,
passing through ‘carbon steels’ on the Modulus / Production energy
chart of Figure 16.8, and move steels down both axes by the factor 15, as in Figure 11.16. Move Wood (// to grain) down by a factor of 2
The shaped steel can be compared with other materials – wood, say –
using the ordinary guide-lines which are shown on the figure. Is the
conclusion the same?
(d) Repeat the procedure for strength, using the Strength / Production energy chart of Figure 16.9.
What do you conclude about the relative energy-penalty of design with
wood and with steel?
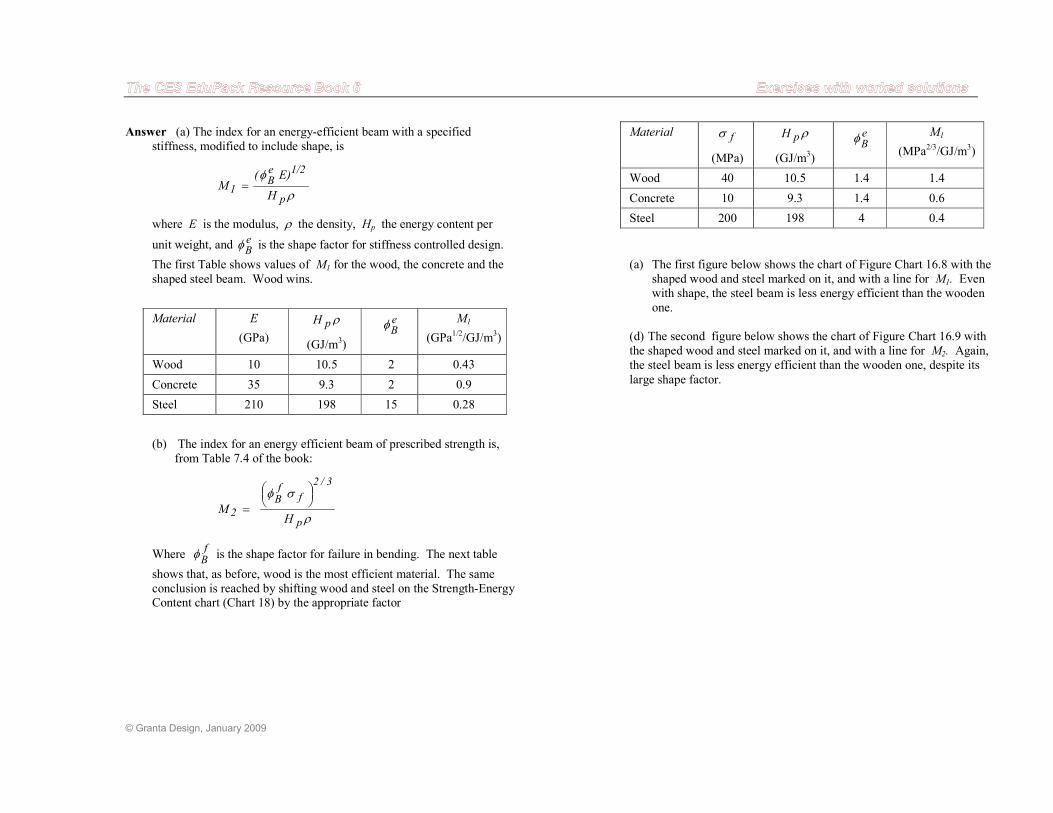
© Granta Design, January 2009
Answer (a) The index for an energy-efficient beam with a specified
stiffness, modified to include shape, is
ρ
φ
p
1/2eB
1H
E)(M =
where E is the modulus, ρ the density, Hp the energy content per
unit weight, and eB
φ is the shape factor for stiffness controlled design.
The first Table shows values of M1 for the wood, the concrete and the
shaped steel beam. Wood wins.
Material E
(GPa)
ρpH
(GJ/m3)
eB
φ M1
(GPa1/2/GJ/m
3)
Wood 10 10.5 2 0.43
Concrete 35 9.3 2 0.9
Steel 210 198 15 0.28
(b) The index for an energy efficient beam of prescribed strength is,
from Table 7.4 of the book:
ρ
σφ
p
3/2
ffB
2H
M
=
Where fB
φ is the shape factor for failure in bending. The next table
shows that, as before, wood is the most efficient material. The same
conclusion is reached by shifting wood and steel on the Strength-Energy Content chart (Chart 18) by the appropriate factor
Material fσ
(MPa)
ρpH
(GJ/m3)
eB
φ M1
(MPa2/3/GJ/m
3)
Wood 40 10.5
1.4 1.4
Concrete 10 9.3 1.4 0.6
Steel 200 198 4 0.4
(a) The first figure below shows the chart of Figure Chart 16.8 with the shaped wood and steel marked on it, and with a line for M1. Even
with shape, the steel beam is less energy efficient than the wooden
one.
(d) The second figure below shows the chart of Figure Chart 16.9 with
the shaped wood and steel marked on it, and with a line for M2. Again,
the steel beam is less energy efficient than the wooden one, despite its
large shape factor.
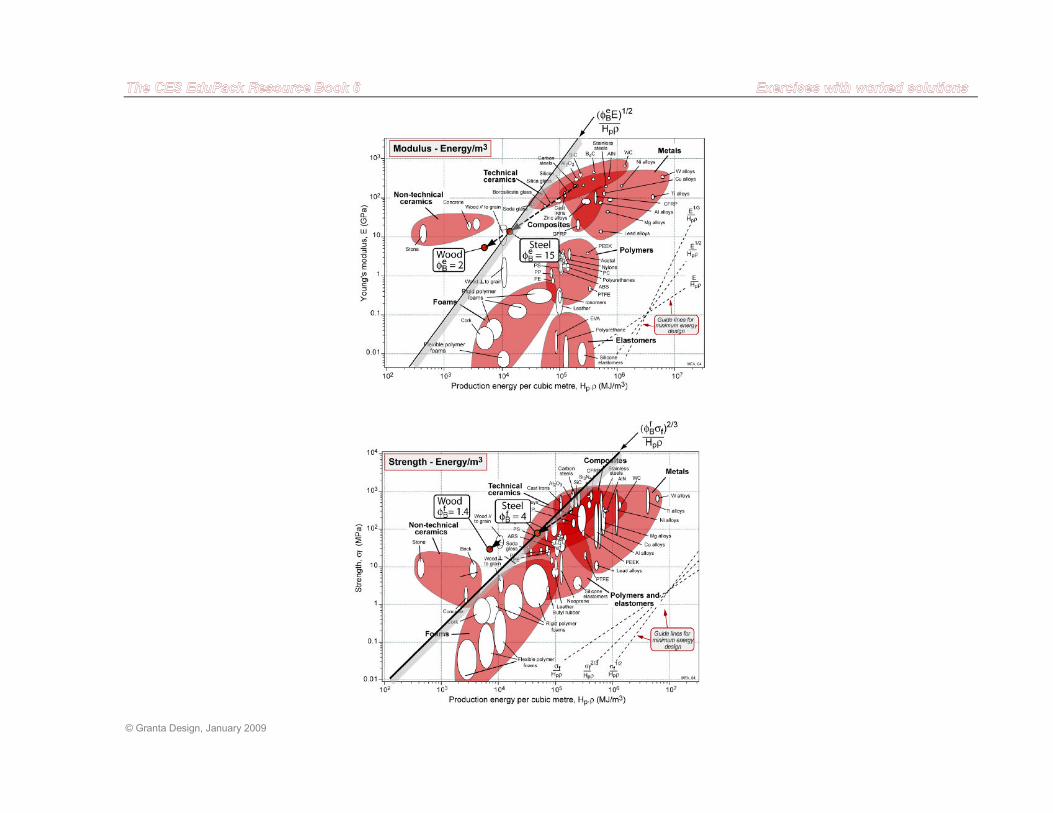
© Granta Design, January 2009
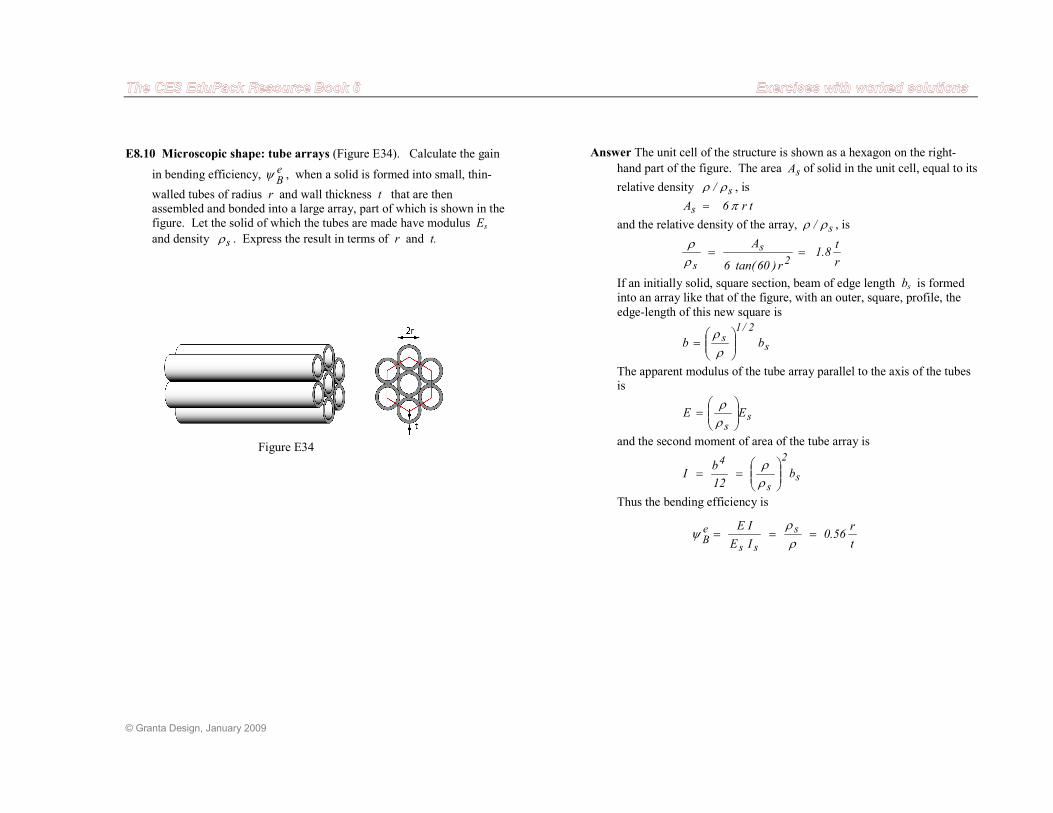
© Granta Design, January 2009
E8.10 Microscopic shape: tube arrays (Figure E34). Calculate the gain
in bending efficiency, eB
ψ , when a solid is formed into small, thin-
walled tubes of radius r and wall thickness t that are then assembled and bonded into a large array, part of which is shown in the
figure. Let the solid of which the tubes are made have modulus Es
and density sρ . Express the result in terms of r and t.
Figure E34
Answer The unit cell of the structure is shown as a hexagon on the right-
hand part of the figure. The area sA of solid in the unit cell, equal to its
relative density s/ ρρ , is
tr6As π=
and the relative density of the array, s/ ρρ , is
r
t8.1
r)60tan(6
A
2
s
s
==ρρ
If an initially solid, square section, beam of edge length bs is formed
into an array like that of the figure, with an outer, square, profile, the
edge-length of this new square is
s
2/1s bb
=
ρρ
The apparent modulus of the tube array parallel to the axis of the tubes is
ss
EE
=
ρρ
and the second moment of area of the tube array is
s
2
s
4
b12
bI
==
ρρ
Thus the bending efficiency is
t
r56.0
IE
IE s
ss
eB
===ρρ
ψ
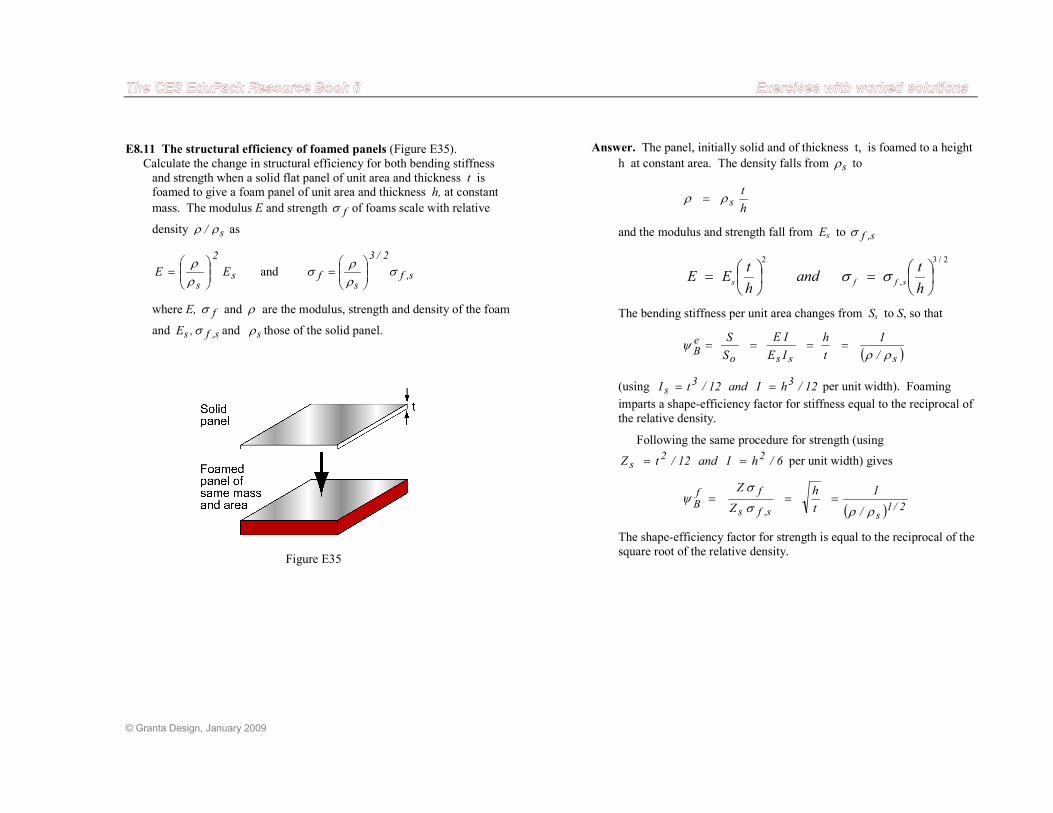
© Granta Design, January 2009
E8.11 The structural efficiency of foamed panels (Figure E35).
Calculate the change in structural efficiency for both bending stiffness
and strength when a solid flat panel of unit area and thickness t is foamed to give a foam panel of unit area and thickness h, at constant
mass. The modulus E and strength fσ of foams scale with relative
density s/ ρρ as
s
2
s
EE
=
ρρ
and s,f
2/3
sf σ
ρρ
σ
=
where E, fσ and ρ are the modulus, strength and density of the foam
and s,fs ,E σ and sρ those of the solid panel.
Figure E35
Answer. The panel, initially solid and of thickness t, is foamed to a height
h at constant area. The density falls from sρ to
h
tsρρ =
and the modulus and strength fall from Es to s,fσ
2/3
,
2
=
=h
tand
h
tEE sffs σσ
The bending stiffness per unit area changes from Ss to S, so that
( )ssso
eB /
1
t
h
IE
IE
S
S
ρρψ ====
(using 12/hIand12/tI 33s == per unit width). Foaming
imparts a shape-efficiency factor for stiffness equal to the reciprocal of
the relative density.
Following the same procedure for strength (using
6/hIand12/tZ 22s == per unit width) gives
( ) 2/1ss,fs
ffB
/
1
t
h
Z
Z
ρρσ
σψ ===
The shape-efficiency factor for strength is equal to the reciprocal of the
square root of the relative density.
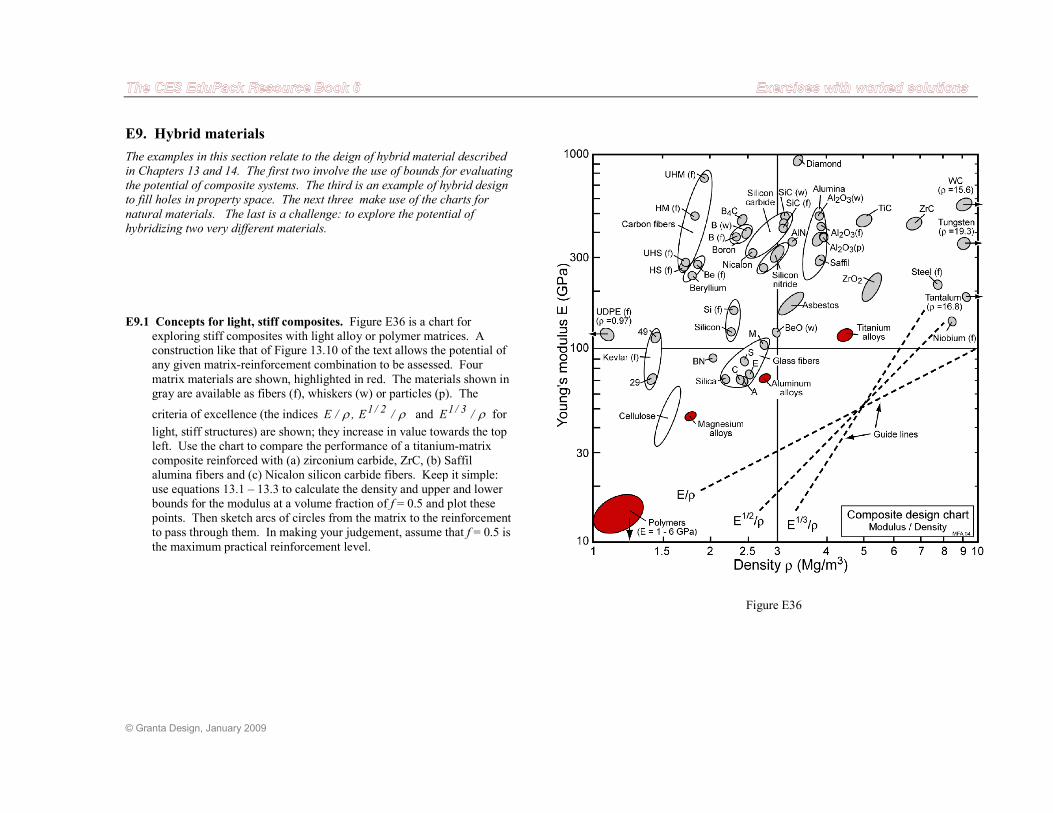
© Granta Design, January 2009
E9. Hybrid materials
The examples in this section relate to the deign of hybrid material described
in Chapters 13 and 14. The first two involve the use of bounds for evaluating
the potential of composite systems. The third is an example of hybrid design
to fill holes in property space. The next three make use of the charts for
natural materials. The last is a challenge: to explore the potential of
hybridizing two very different materials.
E9.1 Concepts for light, stiff composites. Figure E36 is a chart for
exploring stiff composites with light alloy or polymer matrices. A construction like that of Figure 13.10 of the text allows the potential of
any given matrix-reinforcement combination to be assessed. Four
matrix materials are shown, highlighted in red. The materials shown in
gray are available as fibers (f), whiskers (w) or particles (p). The
criteria of excellence (the indices ρρ /E,/E 2/1 and ρ/E 3/1 for
light, stiff structures) are shown; they increase in value towards the top
left. Use the chart to compare the performance of a titanium-matrix
composite reinforced with (a) zirconium carbide, ZrC, (b) Saffil
alumina fibers and (c) Nicalon silicon carbide fibers. Keep it simple:
use equations 13.1 – 13.3 to calculate the density and upper and lower
bounds for the modulus at a volume fraction of f = 0.5 and plot these
points. Then sketch arcs of circles from the matrix to the reinforcement
to pass through them. In making your judgement, assume that f = 0.5 is
the maximum practical reinforcement level.
Figure E36
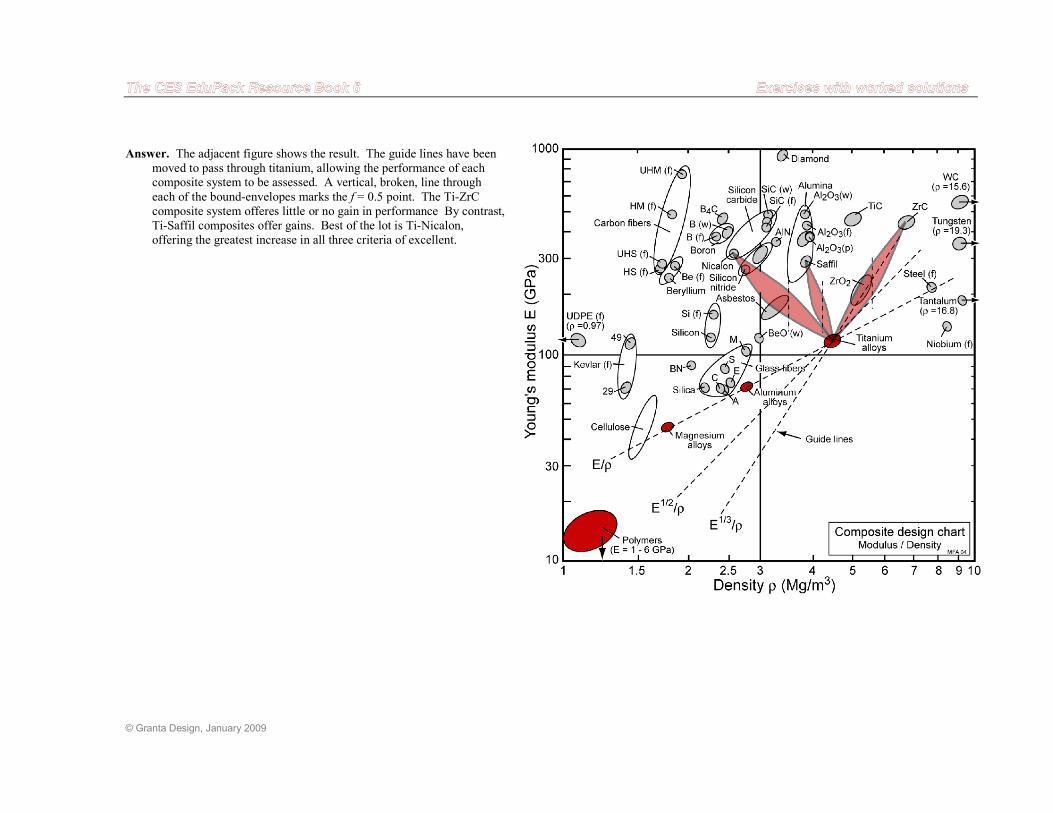
© Granta Design, January 2009
Answer. The adjacent figure shows the result. The guide lines have been
moved to pass through titanium, allowing the performance of each composite system to be assessed. A vertical, broken, line through
each of the bound-envelopes marks the f = 0.5 point. The Ti-ZrC
composite system offeres little or no gain in performance By contrast,
Ti-Saffil composites offer gains. Best of the lot is Ti-Nicalon,
offering the greatest increase in all three criteria of excellent.
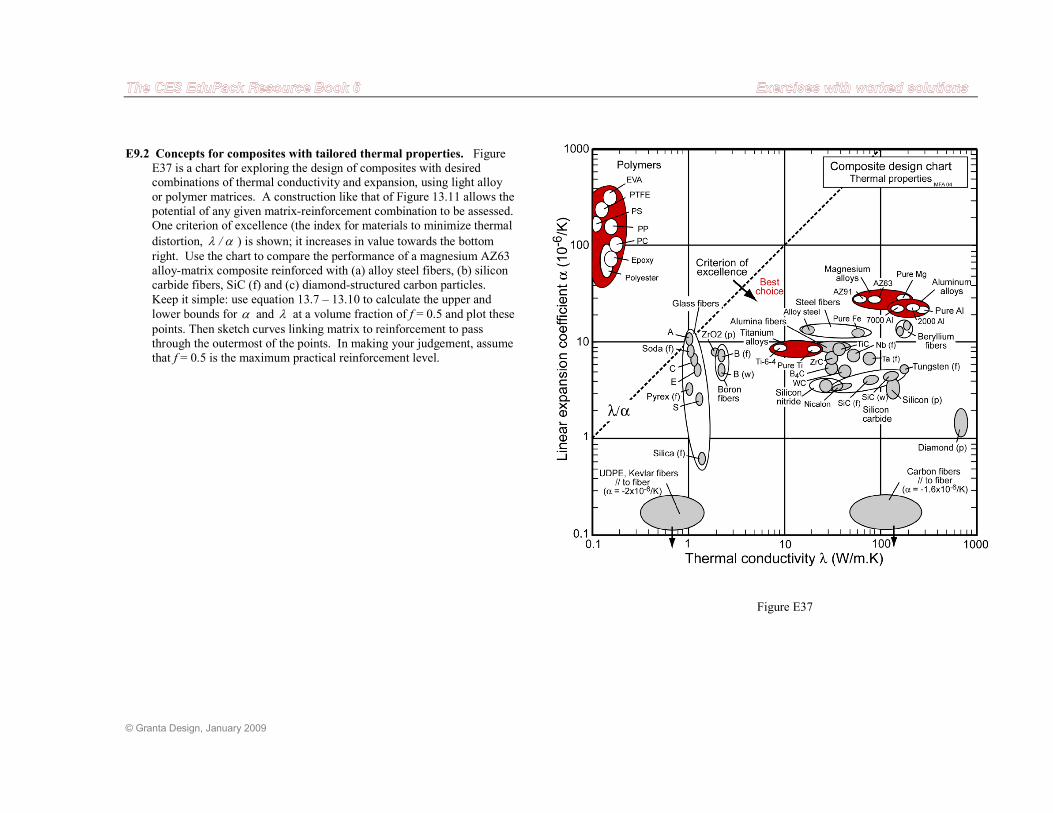
© Granta Design, January 2009
E9.2 Concepts for composites with tailored thermal properties. Figure
E37 is a chart for exploring the design of composites with desired combinations of thermal conductivity and expansion, using light alloy
or polymer matrices. A construction like that of Figure 13.11 allows the
potential of any given matrix-reinforcement combination to be assessed.
One criterion of excellence (the index for materials to minimize thermal
distortion, αλ / ) is shown; it increases in value towards the bottom
right. Use the chart to compare the performance of a magnesium AZ63
alloy-matrix composite reinforced with (a) alloy steel fibers, (b) silicon
carbide fibers, SiC (f) and (c) diamond-structured carbon particles.
Keep it simple: use equation 13.7 – 13.10 to calculate the upper and
lower bounds for α and λ at a volume fraction of f = 0.5 and plot these
points. Then sketch curves linking matrix to reinforcement to pass
through the outermost of the points. In making your judgement, assume
that f = 0.5 is the maximum practical reinforcement level.
Figure E37
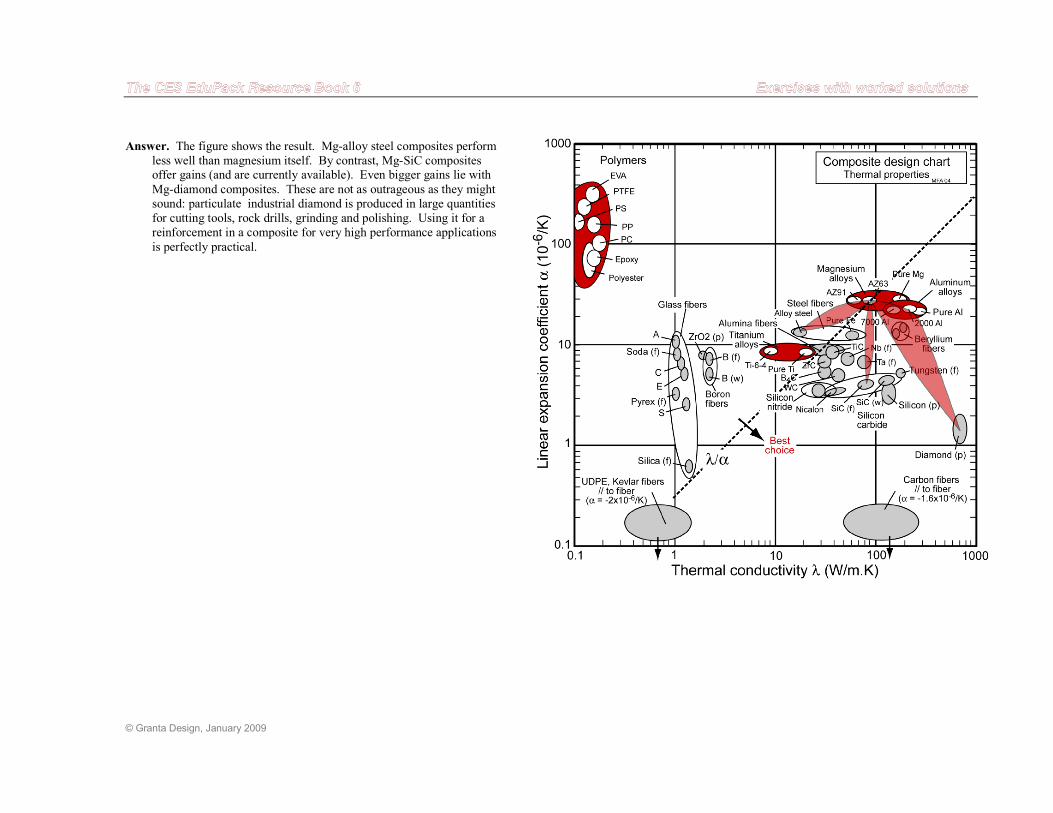
© Granta Design, January 2009
Answer. The figure shows the result. Mg-alloy steel composites perform
less well than magnesium itself. By contrast, Mg-SiC composites offer gains (and are currently available). Even bigger gains lie with
Mg-diamond composites. These are not as outrageous as they might
sound: particulate industrial diamond is produced in large quantities
for cutting tools, rock drills, grinding and polishing. Using it for a
reinforcement in a composite for very high performance applications
is perfectly practical.
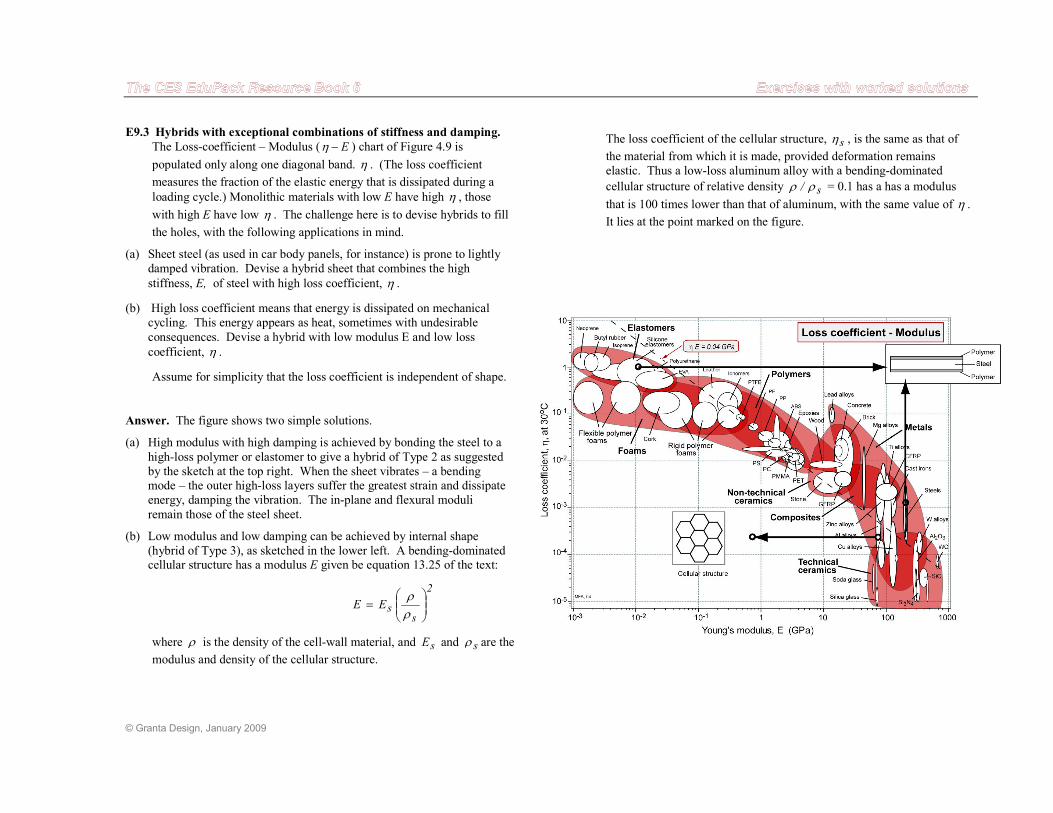
© Granta Design, January 2009
E9.3 Hybrids with exceptional combinations of stiffness and damping.
The Loss-coefficient – Modulus ( E−η ) chart of Figure 4.9 is
populated only along one diagonal band. η . (The loss coefficient
measures the fraction of the elastic energy that is dissipated during a
loading cycle.) Monolithic materials with low E have high η , those
with high E have low η . The challenge here is to devise hybrids to fill
the holes, with the following applications in mind.
(a) Sheet steel (as used in car body panels, for instance) is prone to lightly damped vibration. Devise a hybrid sheet that combines the high
stiffness, E, of steel with high loss coefficient, η .
(b) High loss coefficient means that energy is dissipated on mechanical
cycling. This energy appears as heat, sometimes with undesirable
consequences. Devise a hybrid with low modulus E and low loss
coefficient, η .
Assume for simplicity that the loss coefficient is independent of shape.
Answer. The figure shows two simple solutions.
(a) High modulus with high damping is achieved by bonding the steel to a
high-loss polymer or elastomer to give a hybrid of Type 2 as suggested
by the sketch at the top right. When the sheet vibrates – a bending mode – the outer high-loss layers suffer the greatest strain and dissipate
energy, damping the vibration. The in-plane and flexural moduli
remain those of the steel sheet.
(b) Low modulus and low damping can be achieved by internal shape
(hybrid of Type 3), as sketched in the lower left. A bending-dominated cellular structure has a modulus E given be equation 13.25 of the text:
2
ssEE
=
ρρ
where ρ is the density of the cell-wall material, and sE and sρ are the
modulus and density of the cellular structure.
The loss coefficient of the cellular structure, sη , is the same as that of
the material from which it is made, provided deformation remains
elastic. Thus a low-loss aluminum alloy with a bending-dominated
cellular structure of relative density s/ ρρ = 0.1 has a has a modulus
that is 100 times lower than that of aluminum, with the same value of η .
It lies at the point marked on the figure.
© Granta Design, January 2009
E9.4 Natural hybrids that are light, stiff and strong.
(a) Plot aluminum alloys, steels, CFRP and GFRP onto a copy of the ρ−E
chart for natural materials (Figure 14.11 of the text), where E is Young’s
modulus and ρ is the density. How do they compare, using the flexural
stiffness index ρ/E 2/1 as criterion of excellence?
(b) Do the same thing for strength with a copy of Figure 14.12, using the
flexural strength index ρσ /3/2
f (where fσ is the failure stress) as criteria
of excellence.
The table lists the necessary data.
Material Young’s
modulus E
(GPa)
Density ρ
(Mg/m3)
Strength,
fσ
(MPa)
Aluminum alloys 68 – 82 2.5 – 2.9 30 – 450
Steels 189 – 215 7.6 – 8.1 200 – 1000
CFRP 69 – 150 1.5 – 1.6 550 – 1000
GFRP 15 – 28 1.75 – 2.0 110 – 192
Answer. The comparisons are shown in two the figures below.
(a) The comparison for stiffness, using the criterion of excellence,
ρ/E 2/1 , is highlighted. The nearer a material lies to this line, the
better is its performance. Natural materials are extraordinarily efficient
by this measure. CFRP is comparable with the best of them, but the
other man-made materials compare poorly with those of nature.
(b) The comparison for strength, using criterion of excellence,
ρσ /3/2
f, is highlighted. Again, natural materials excel. CFRP alone
competes with wood, bamboo and palm.
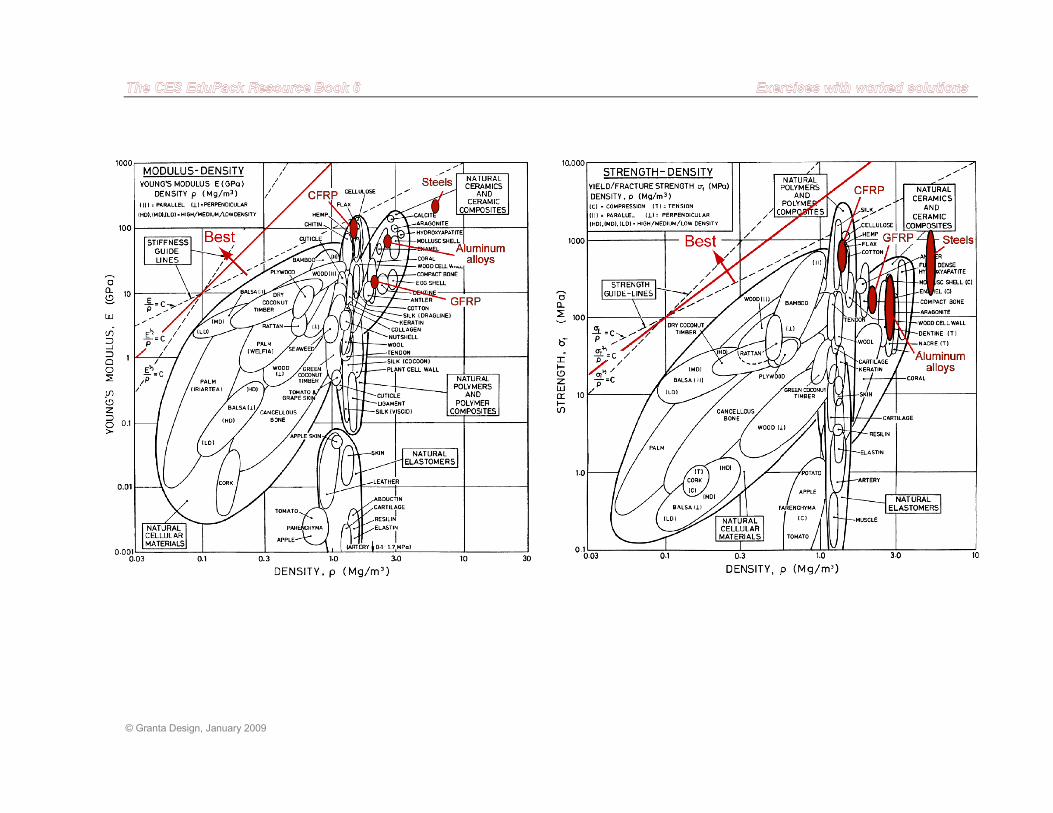
© Granta Design, January 2009
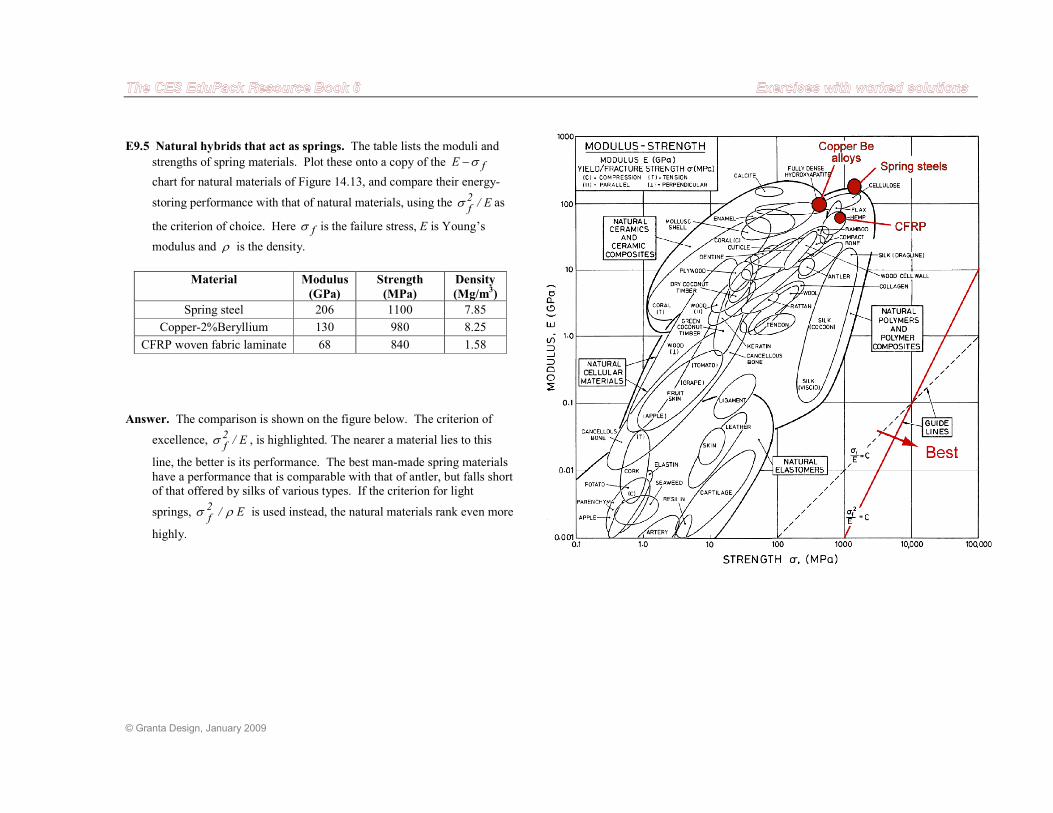
© Granta Design, January 2009
E9.5 Natural hybrids that act as springs. The table lists the moduli and
strengths of spring materials. Plot these onto a copy of the fE σ−
chart for natural materials of Figure 14.13, and compare their energy-
storing performance with that of natural materials, using the E/2f
σ as
the criterion of choice. Here fσ is the failure stress, E is Young’s
modulus and ρ is the density.
Material Modulus
(GPa)
Strength
(MPa)
Density
(Mg/m3)
Spring steel 206 1100 7.85
Copper-2%Beryllium 130 980 8.25
CFRP woven fabric laminate 68 840 1.58
Answer. The comparison is shown on the figure below. The criterion of
excellence, E/2f
σ , is highlighted. The nearer a material lies to this
line, the better is its performance. The best man-made spring materials
have a performance that is comparable with that of antler, but falls short of that offered by silks of various types. If the criterion for light
springs, E/2f
ρσ is used instead, the natural materials rank even more
highly.
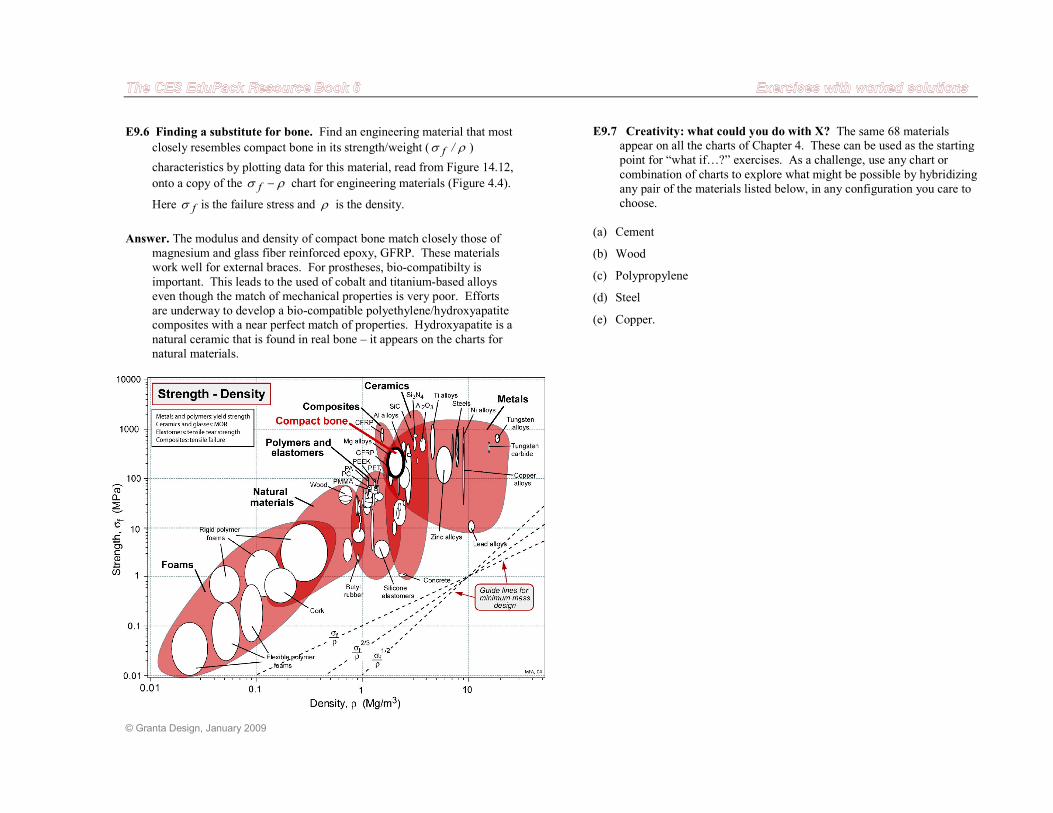
© Granta Design, January 2009
E9.6 Finding a substitute for bone. Find an engineering material that most
closely resembles compact bone in its strength/weight ( ρσ /f )
characteristics by plotting data for this material, read from Figure 14.12,
onto a copy of the ρσ −f chart for engineering materials (Figure 4.4).
Here fσ is the failure stress and ρ is the density.
Answer. The modulus and density of compact bone match closely those of
magnesium and glass fiber reinforced epoxy, GFRP. These materials
work well for external braces. For prostheses, bio-compatibilty is
important. This leads to the used of cobalt and titanium-based alloys
even though the match of mechanical properties is very poor. Efforts
are underway to develop a bio-compatible polyethylene/hydroxyapatite composites with a near perfect match of properties. Hydroxyapatite is a
natural ceramic that is found in real bone – it appears on the charts for
natural materials.
E9.7 Creativity: what could you do with X? The same 68 materials appear on all the charts of Chapter 4. These can be used as the starting
point for “what if…?” exercises. As a challenge, use any chart or
combination of charts to explore what might be possible by hybridizing
any pair of the materials listed below, in any configuration you care to
choose.
(a) Cement
(b) Wood
(c) Polypropylene
(d) Steel
(e) Copper.


This is one of six CES EduPack teaching resource books. All are
available free of charge to users with a maintained CES EduPack license.
Book 1: Getting Started with CES EduPack
Book 2: Material and Process Selection Charts
Book 3: Useful Approximate Solutions for Standard Problems
Book 4: PowerPoint Lectures
Book 5: Projects Using CES EduPack
Book 6: Exercises with Worked Solutions
Granta's CES EduPack is a the world's leading teaching resource
for materials and processes.
The complete EduPack includes the EduPack software and databases,
a choice of 4 textbooks from Professor Mike Ashby, and a range of
other resources including advice, lectures, projects, exercises, and
handouts. Download resources from www.grantadesign.com/education/.
GRANTA MI and CES Selector are Granta's industrial products for
materials information management and materials selection.
Foams
Polymers and
elastomers
Metals
Ceramics
Composites N
atural
materials
Lead alloys
T ungste n
alloys
Steels
T i alloy s
Mg alloys CFRP
GFRP
Al alloys
Rigid polymer
foams
Flexible polymer
foams
Ni alloys
Copper
alloys
Zinc alloys
P A PEEK
PMMA PC PET
Cork
W oo d
Butyl rubber
Silicone
elastomers Concrete
T ungste n
carbide
Al 2 O 3
SiC Si 3 N 4
Strength - D
ensity
Guide lines for
minimum mass
design
0.01
0.1
1
10
100
1000
10000
E 1/3
E 1/2
E
10 4 m/s
10 3
10 2
Longitudinal
wave speed Guide lin
es for
minimum mass
design
0.01
You
ng's
mod
ulu
s,
E (
GP
a)
10 -4
0.1
1
10
10 -3
10 -2
10 -1
1
10
100
1000
Polyester
Foams
Polymers and
elastomers
Metals
T echnica l
ceramics
Composites
Natural
materials
Lead alloys
W alloys Steels
T i alloy s
Mg alloys
CFRP
GFRP
Al alloys
Rigid polymer
foams
Flexible polymer
foams
Ni alloys
Cu alloys
Zinc alloys
P A
PEEK
PMMA
PC
PET
Cork
W oo d
Butyl
rubber
Silicone
elastomers
Concrete
WC
Al 2 O 3
SiC
Si 3 N 4
Y oung's modulus - Densit y
B 4 C
Epoxies
PS PTFE
E V A
Neoprene
Isoprene
Polyurethane
Leather
PP
PE
Glass
// grain
grain
T
Strength, σ f (MPa)
You
ng's
modulu
s, E
(G
Pa)
10 -1
1
10
100
1000
10 -2
10 -3
10 -4
0.1
1
10
100
1000
10000
Design guide lines
E
E
E
Non-technical
ceramics
Foams
Polymers
Metals
T echnica l ceramics
Composites Lead alloys
W alloys
T i alloy s
Mg alloys
CFRP
GFRP
Al alloys
Rigid polymer
foams
Ni alloys Cu alloys
PMMA
Cork
Polyurethane
Silicone elastomers
Concrete
Al 2 O 3
SiC
AlN
Modulus - Strength
E V A
Cast irons
WC
Soda glass
Silica glass
Stone
Brick Epoxies
Steels
P A
PC
PE PTFE
PS PP
Buckling before yield
Y ield befor e buckling
Elastomers
Flexible polymer
foams
Neoprene
Isoprene
Butyl rubber
M A T E R I A L I N S P I R A T I O N
© Copyright Granta Design Ltd.
USA T (800) 241-1546
F (216) 274-9812
T +44 1223 518895
F +44 1223 506432
France T 08 00 76 12 90
F 01 53 01 69 66
UK/Int’l
www.grantadesign.com • [email protected] • Granta Design Limited • Cambridge UK
Germany T 0800 182 5026
F 01805 4820 151 002