Embed Size (px)
Citation preview
6th November 2015
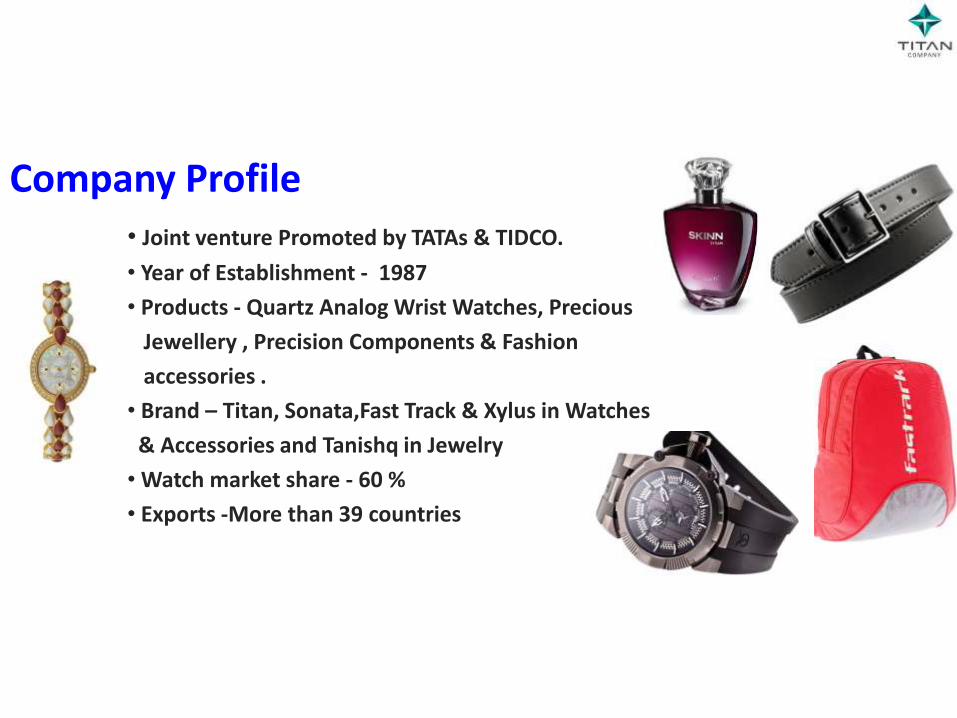
• Joint venture Promoted by TATAs & TIDCO.
• Year of Establishment - 1987
• Products - Quartz Analog Wrist Watches, Precious
Jewellery , Precision Components & Fashion
accessories .
• Brand – Titan, Sonata,Fast Track & Xylus in Watches
& Accessories and Tanishq in Jewelry
• Watch market share - 60 %
• Exports -More than 39 countries
Company Profile
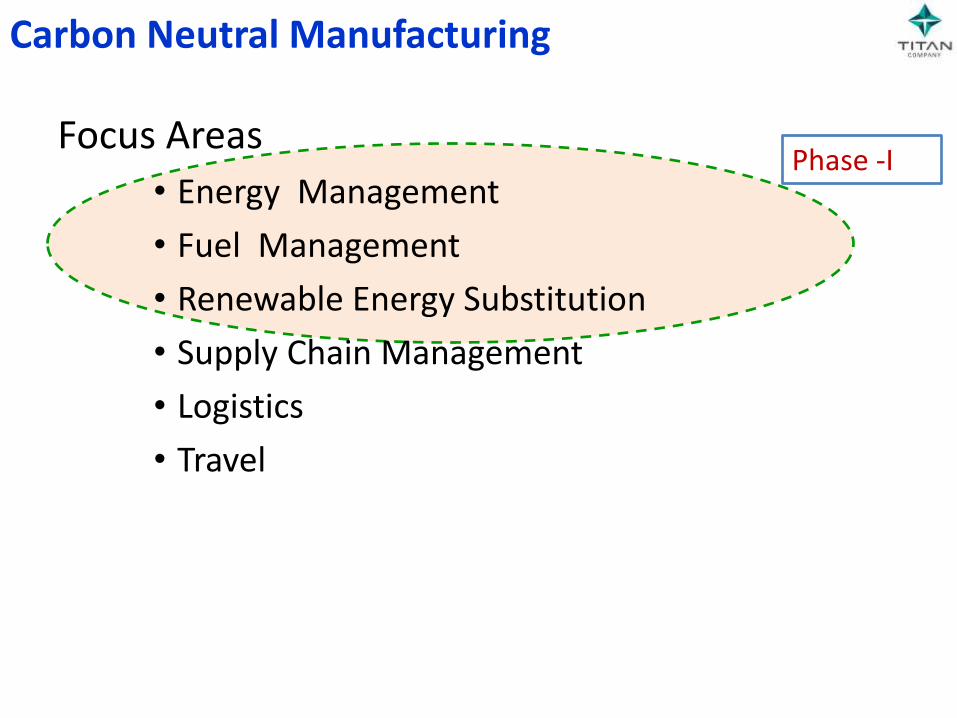
Carbon Neutral Manufacturing
Focus Areas
• Energy Management
• Fuel Management
• Renewable Energy Substitution
• Supply Chain Management
• Logistics
• Travel
Phase -I
Energy Management
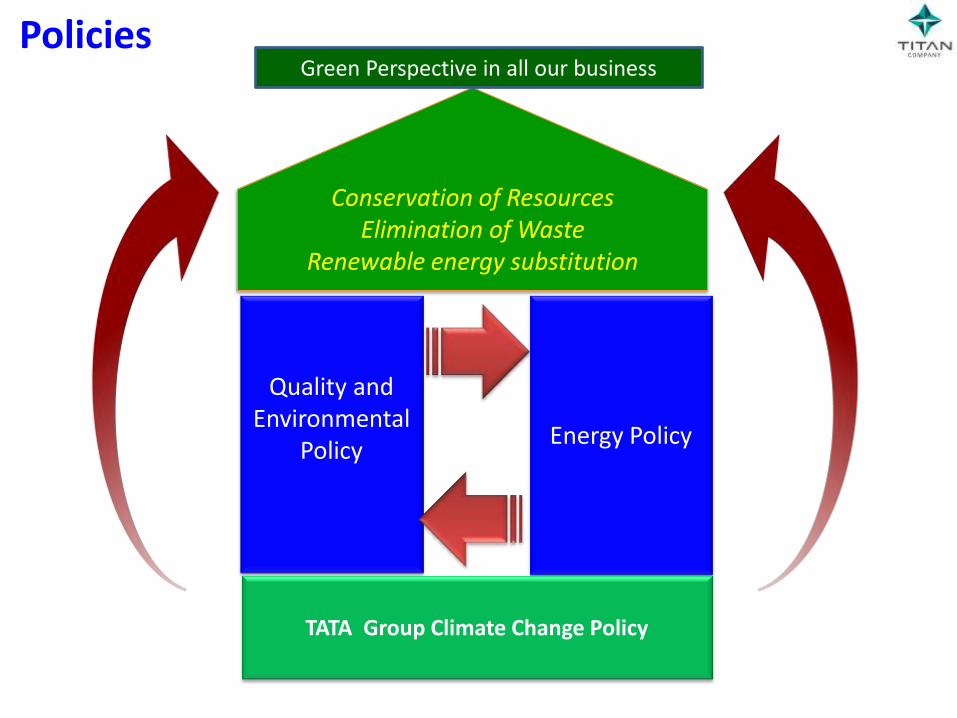
Policies
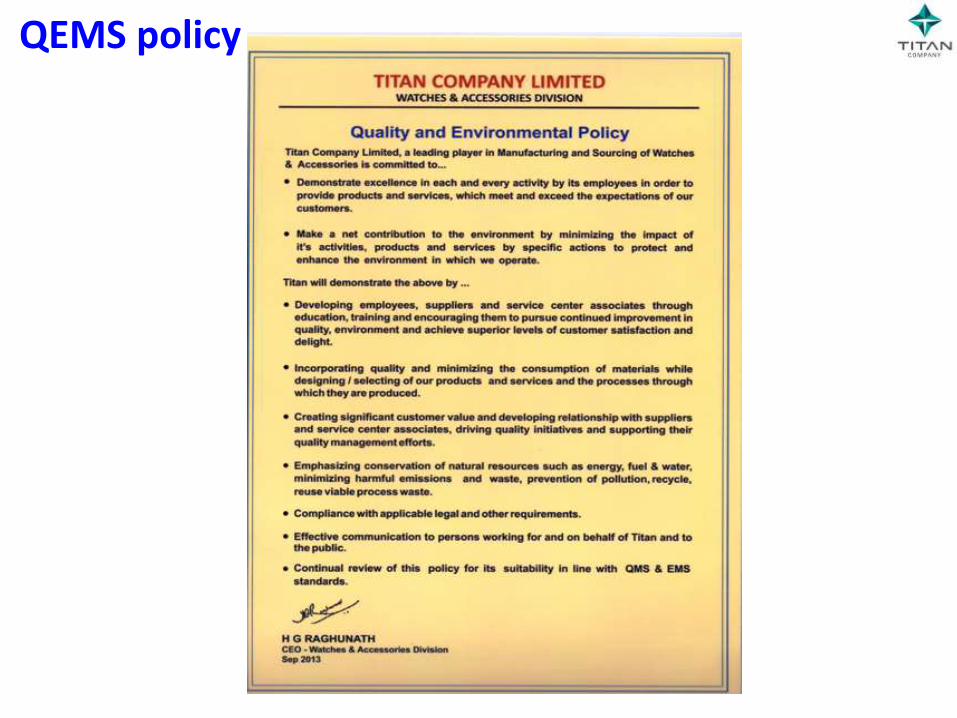
Quality and Environmental
Policy
Energy Policy
Conservation of Resources Elimination of Waste
Renewable energy substitution
TATA Group Climate Change Policy
Green Perspective in all our business
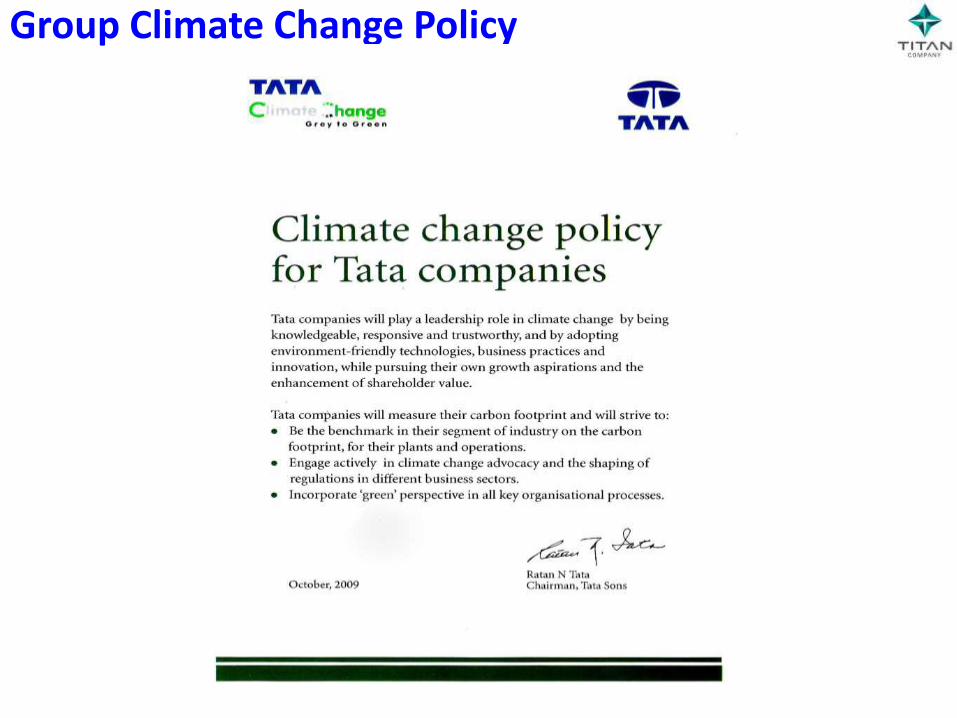
Group Climate Change Policy
QEMS policy
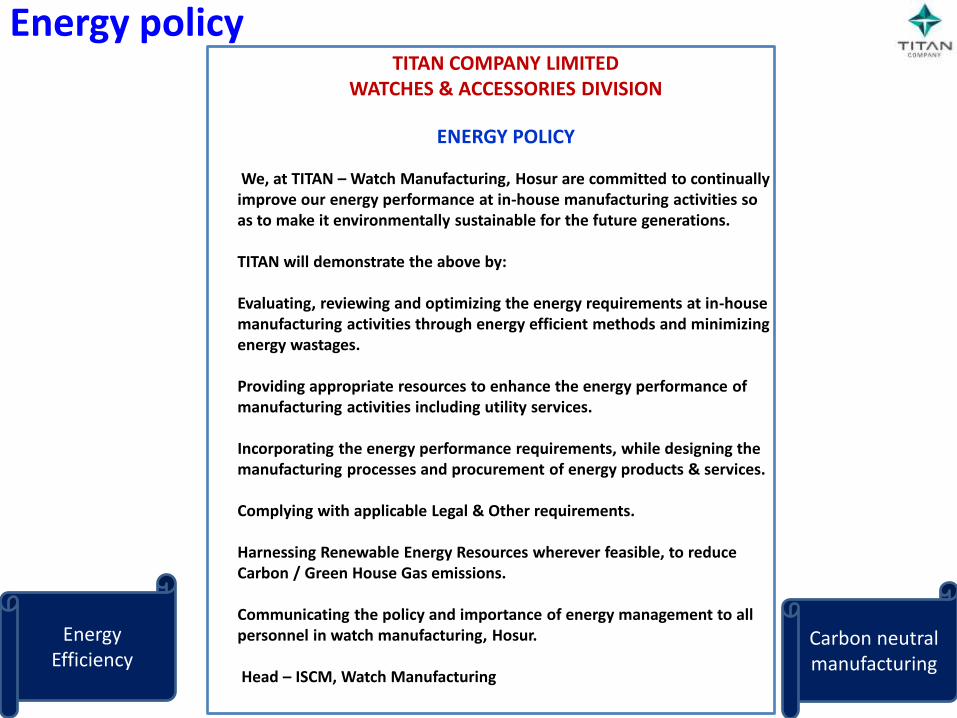
Energy policy
Energy Efficiency
Carbon neutral manufacturing
TITAN COMPANY LIMITED WATCHES & ACCESSORIES DIVISION
ENERGY POLICY
We, at TITAN – Watch Manufacturing, Hosur are committed to continually improve our energy performance at in-house manufacturing activities so as to make it environmentally sustainable for the future generations. TITAN will demonstrate the above by: Evaluating, reviewing and optimizing the energy requirements at in-house manufacturing activities through energy efficient methods and minimizing energy wastages. Providing appropriate resources to enhance the energy performance of manufacturing activities including utility services. Incorporating the energy performance requirements, while designing the manufacturing processes and procurement of energy products & services. Complying with applicable Legal & Other requirements. Harnessing Renewable Energy Resources wherever feasible, to reduce Carbon / Green House Gas emissions. Communicating the policy and importance of energy management to all personnel in watch manufacturing, Hosur. Head – ISCM, Watch Manufacturing
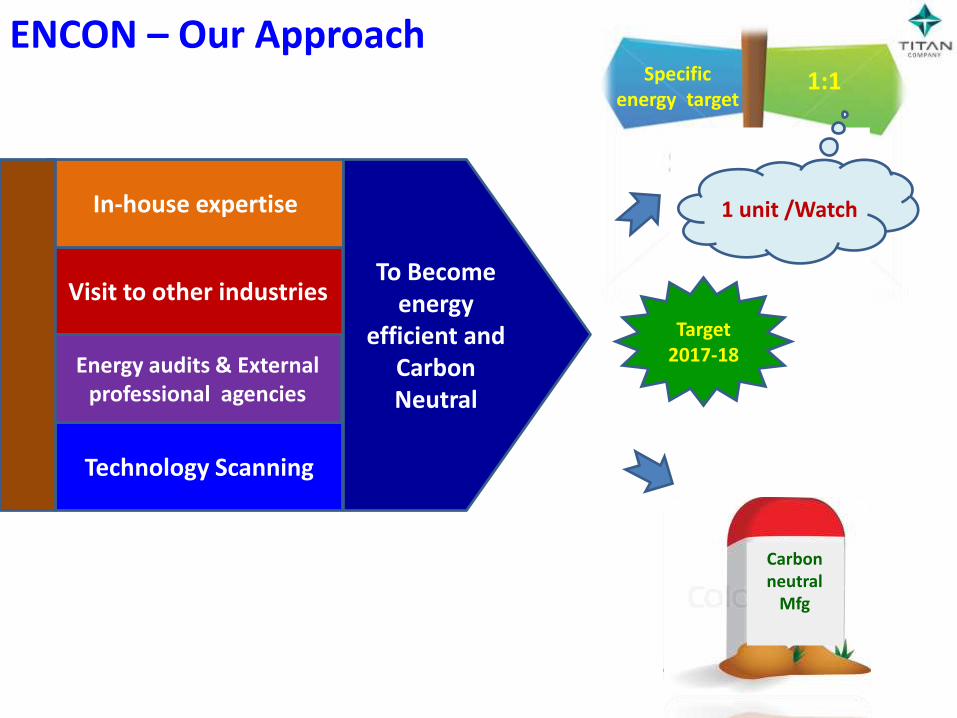
ENCON – Our Approach
Visit to other industries
Technology Scanning
Energy audits & External professional agencies
In-house expertise
To Become energy
efficient and Carbon Neutral
1:1 Specific energy target
Carbon neutral
Mfg
Target 2017-18
1 unit /Watch
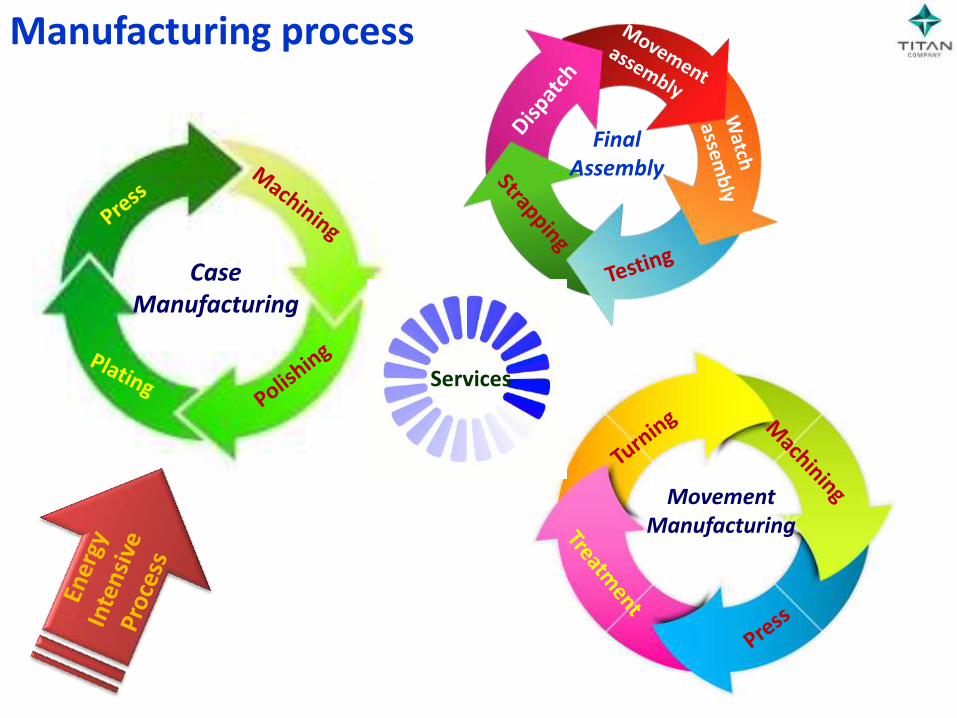
Manufacturing process
Case Manufacturing
Movement Manufacturing
Final Assembly
Services
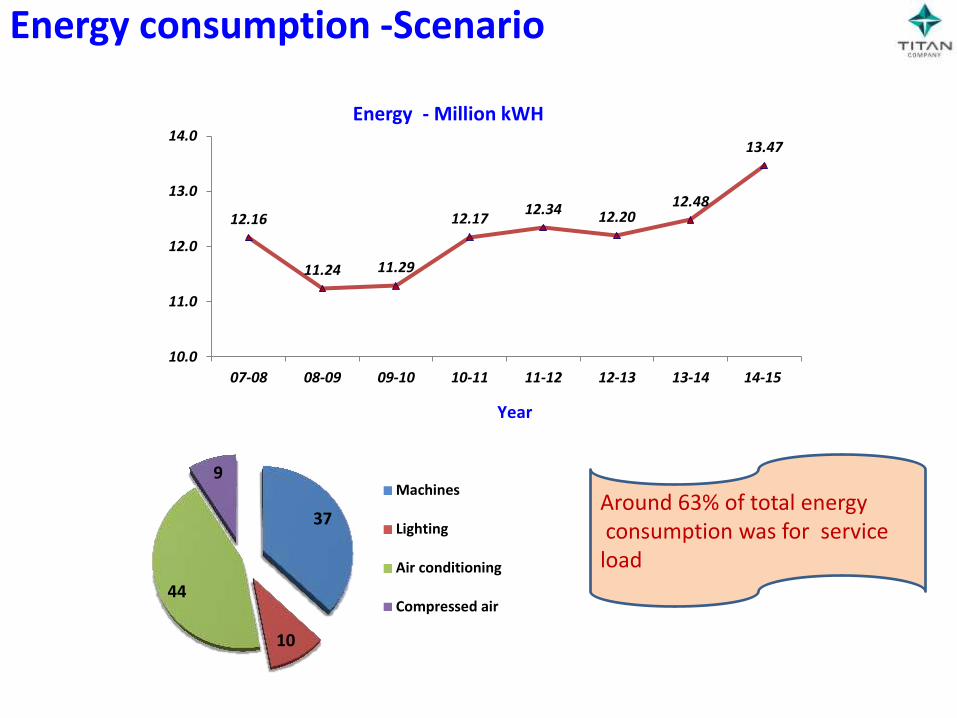
Energy consumption -Scenario
12.16
11.24 11.29
12.17 12.34 12.20
12.48
13.47
10.0
11.0
12.0
13.0
14.0
07-08 08-09 09-10 10-11 11-12 12-13 13-14 14-15
Year
Energy - Million kWH
37
10
44
9 Machines
Lighting
Air conditioning
Compressed air
Around 63% of total energy consumption was for service load
Energy Management
Energy Conservation
Key Focus Areas
Compressed Air system
Air conditioning system
Lighting system
Fuel Conservation
Energy efficiency in Production operations
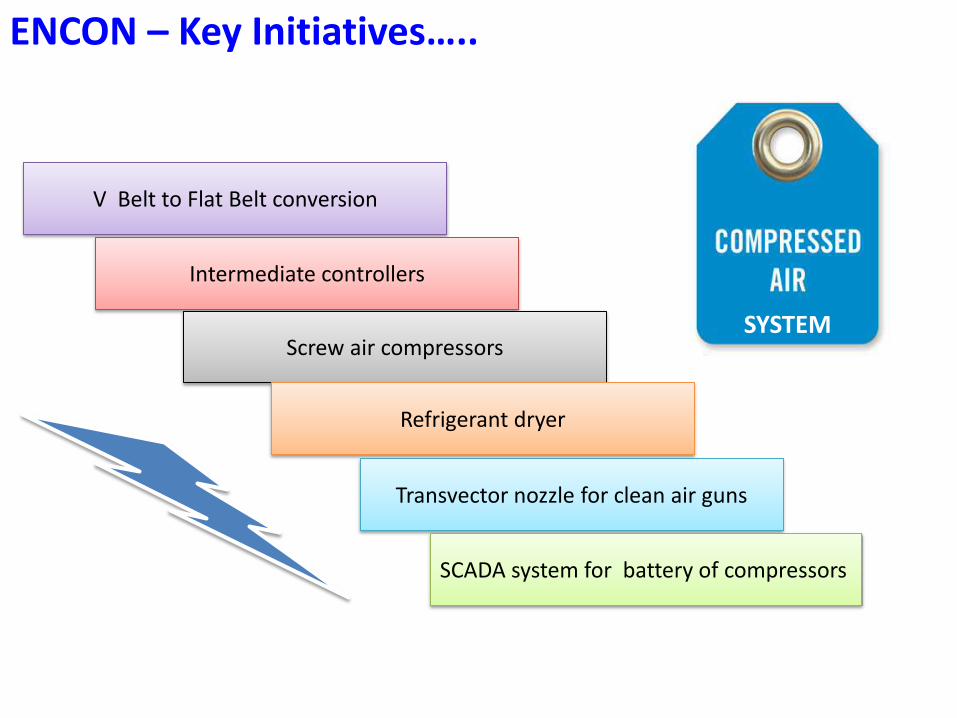
ENCON – Key Initiatives…..
V Belt to Flat Belt conversion
Intermediate controllers
Screw air compressors
Refrigerant dryer
Transvector nozzle for clean air guns
SCADA system for battery of compressors
SYSTEM
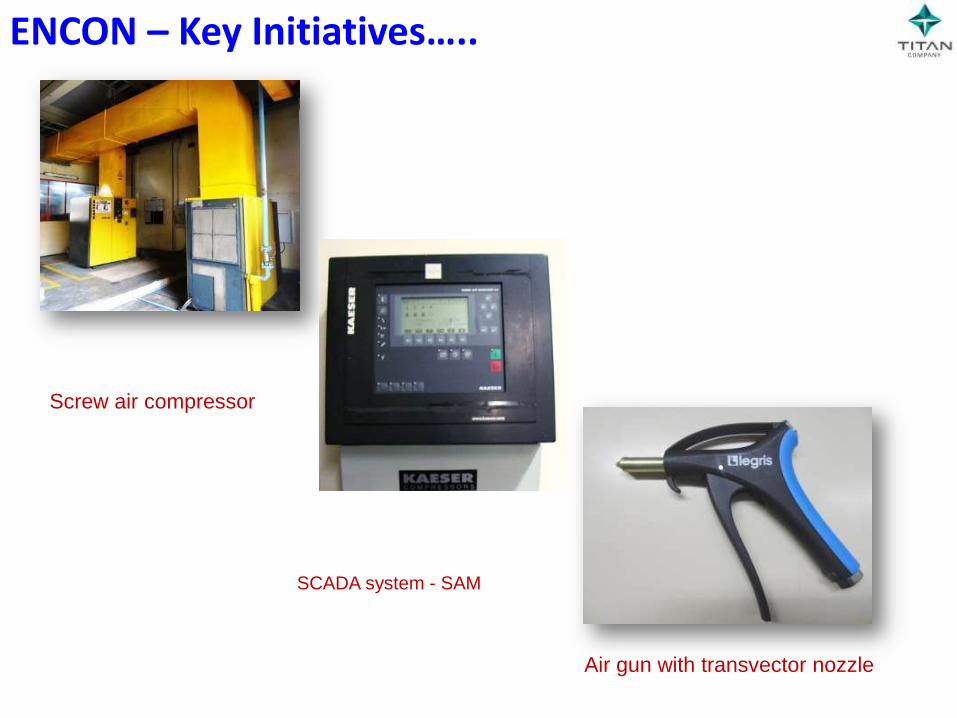
ENCON – Key Initiatives…..
Screw air compressor
SCADA system - SAM
Air gun with transvector nozzle
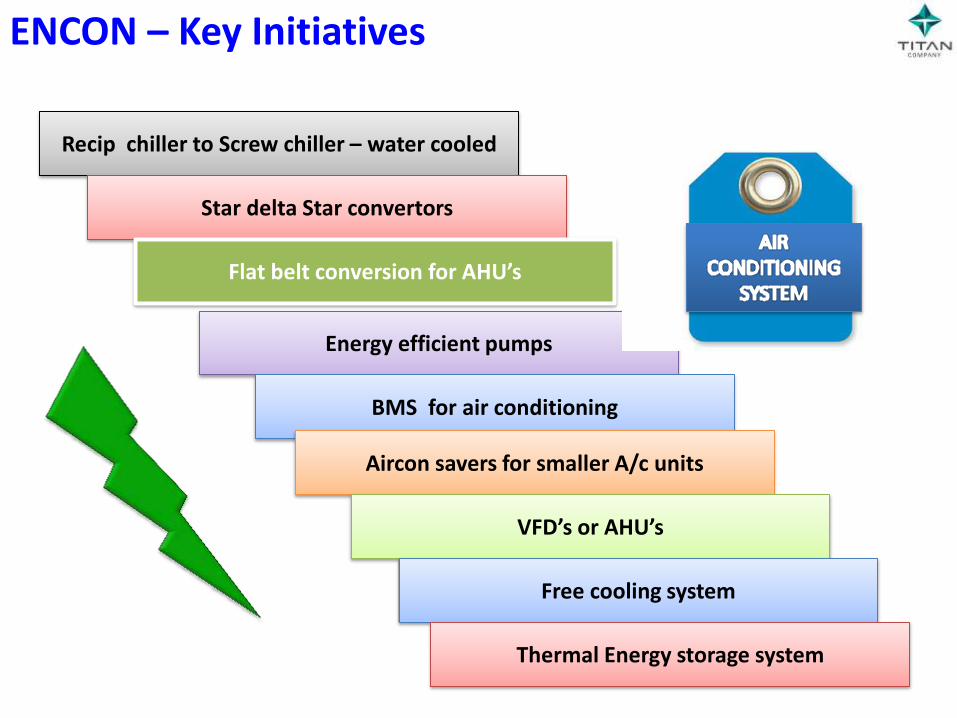
Recip chiller to Screw chiller – water cooled
Star delta Star convertors
Flat belt conversion for AHU’s
Energy efficient pumps
BMS for air conditioning
Aircon savers for smaller A/c units
VFD’s or AHU’s
Free cooling system
Thermal Energy storage system
AIR CONDITIONING SYSTEM
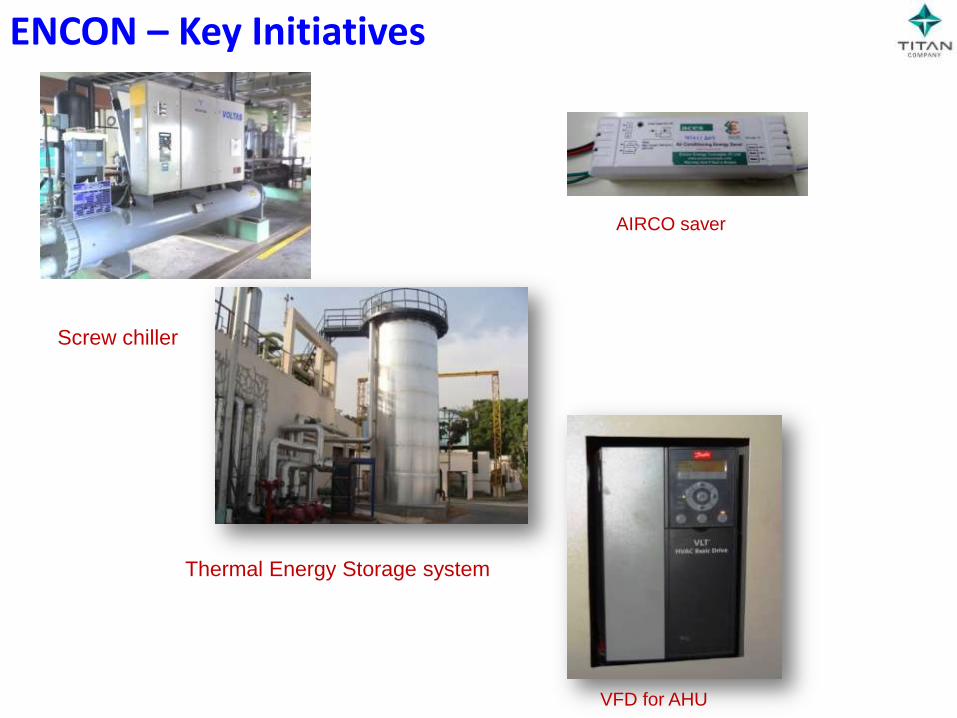
ENCON – Key Initiatives
ENCON – Key Initiatives
Screw chiller
Thermal Energy Storage system
VFD for AHU
AIRCO saver
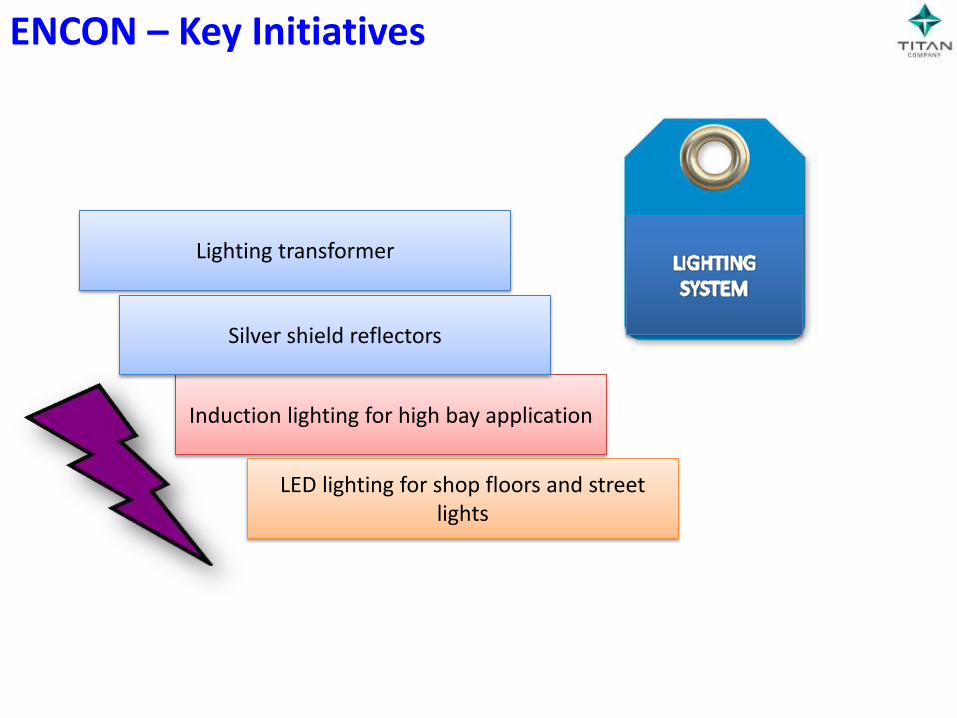
Lighting transformer
Induction lighting for high bay application
LED lighting for shop floors and street lights
ENCON – Key Initiatives
Silver shield reflectors
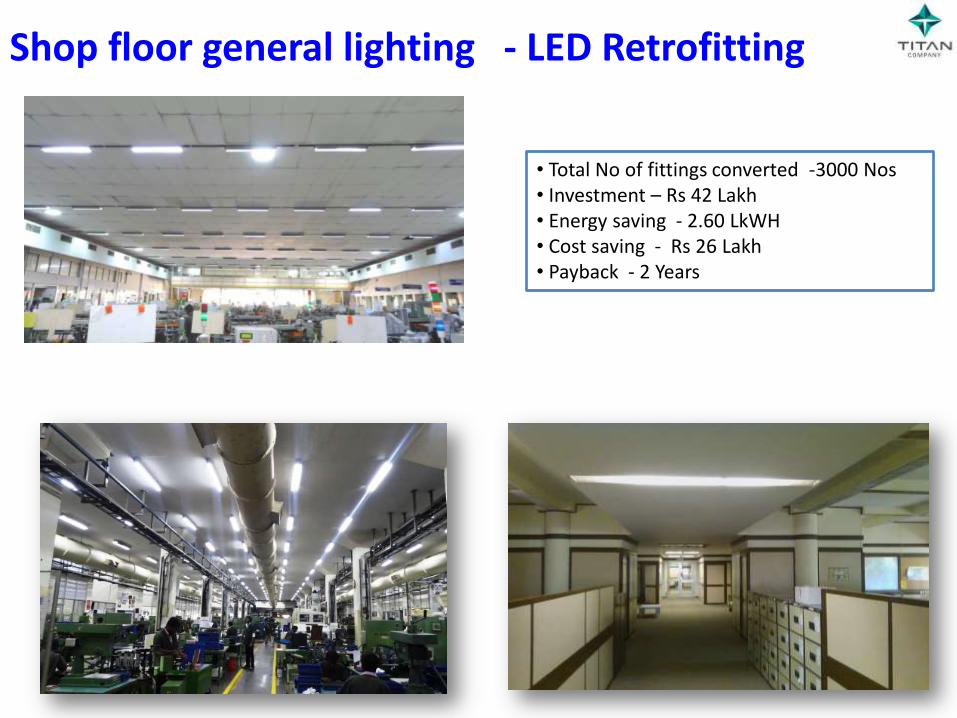
• Total No of fittings converted -3000 Nos • Investment – Rs 42 Lakh • Energy saving - 2.60 LkWH • Cost saving - Rs 26 Lakh • Payback - 2 Years
Shop floor general lighting - LED Retrofitting
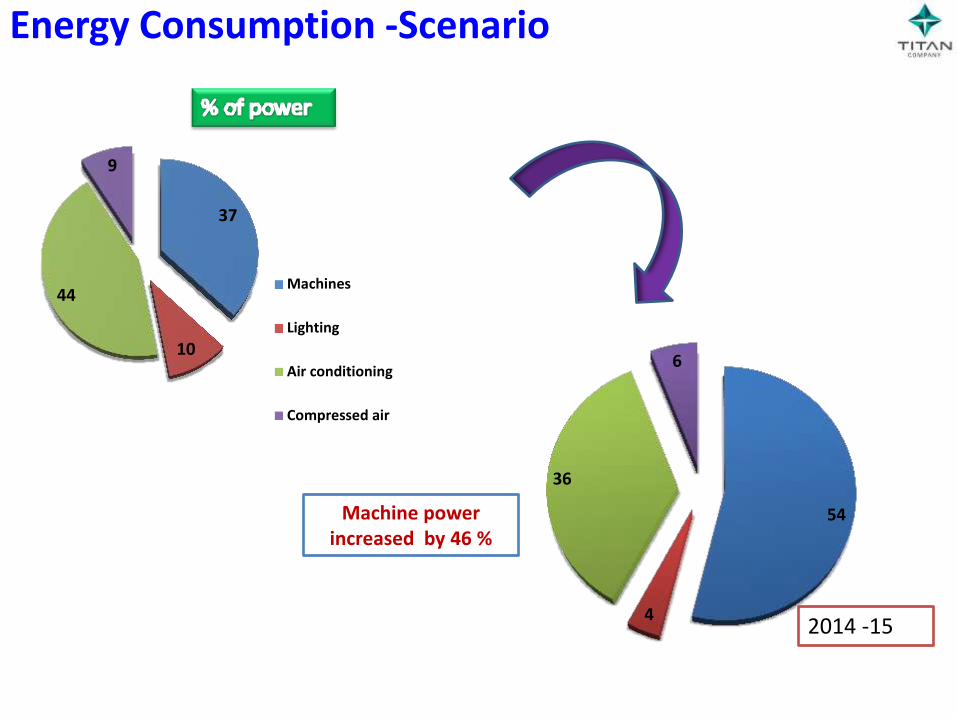
Energy Consumption -Scenario
37
10
44
9
Machines
Lighting
Air conditioning
Compressed air
Machine power increased by 46 %
54
4
36
6
2014 -15
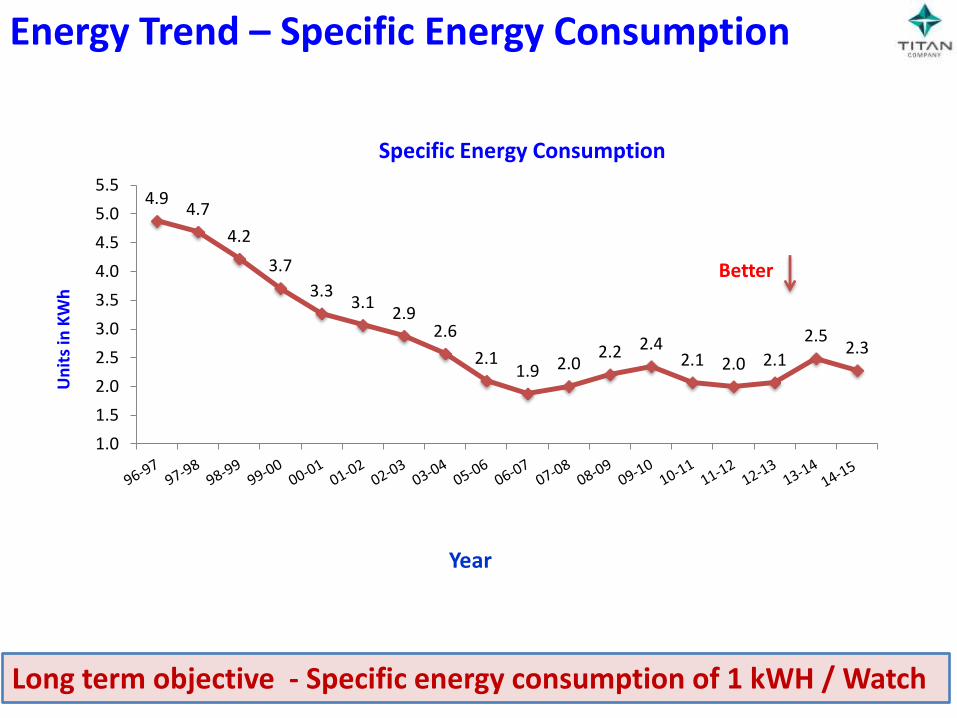
Energy Trend – Specific Energy Consumption
Better
Year
Long term objective - Specific energy consumption of 1 kWH / Watch
4.9 4.7
4.2
3.7
3.3 3.1
2.9 2.6
2.1 1.9 2.0
2.2 2.4 2.1 2.0 2.1
2.5 2.3
1.0
1.5
2.0
2.5
3.0
3.5
4.0
4.5
5.0
5.5
Specific Energy Consumption
Un
its
in K
Wh
Fuel Conservation
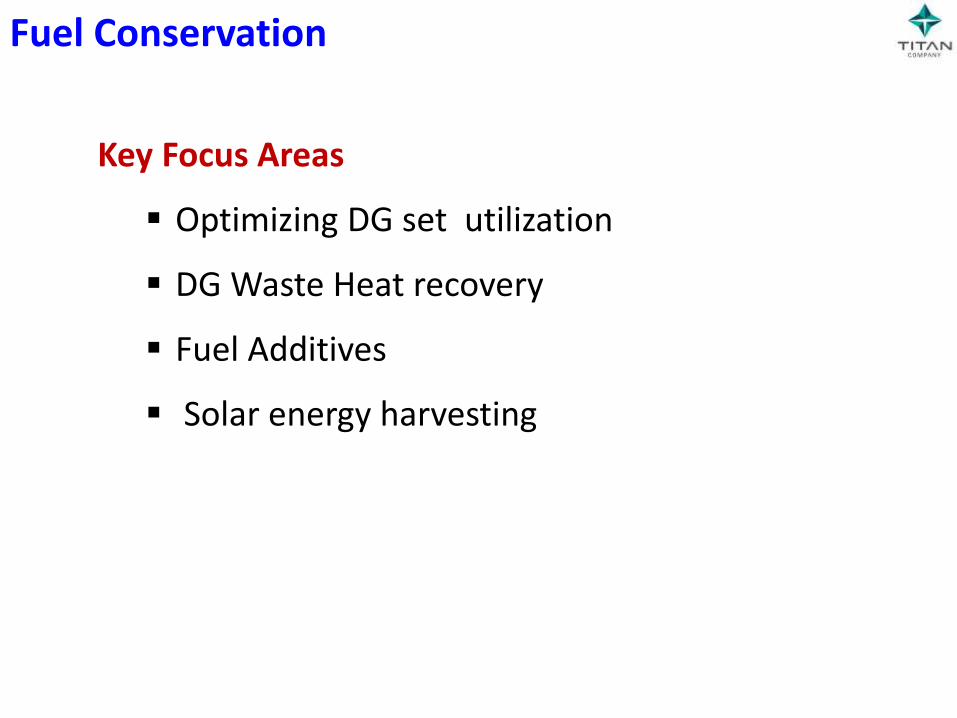
Fuel Conservation
Key Focus Areas
Optimizing DG set utilization
DG Waste Heat recovery
Fuel Additives
Solar energy harvesting
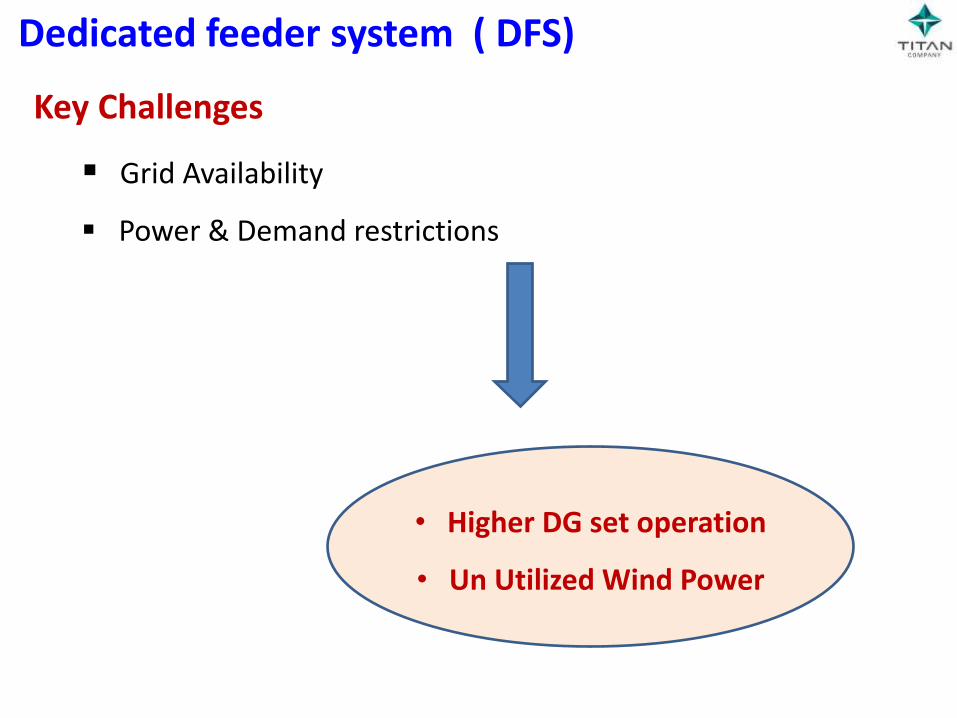
Dedicated feeder system ( DFS)
Key Challenges
Grid Availability
Power & Demand restrictions
• Higher DG set operation
• Un Utilized Wind Power
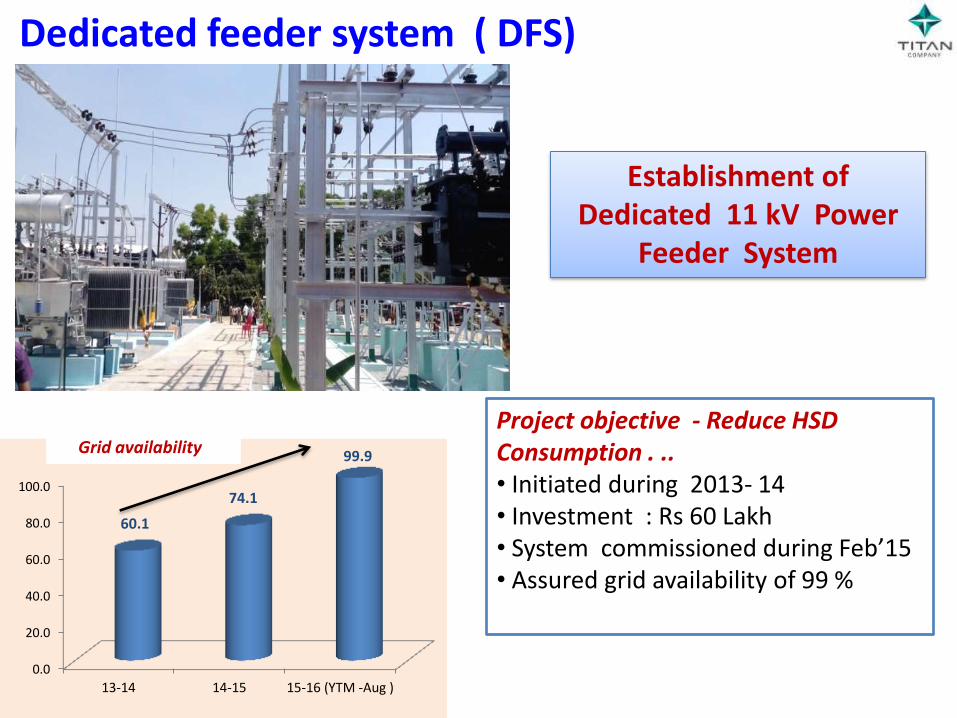
Project objective - Reduce HSD Consumption . .. • Initiated during 2013- 14 • Investment : Rs 60 Lakh • System commissioned during Feb’15 • Assured grid availability of 99 %
Dedicated feeder system ( DFS)
Establishment of Dedicated 11 kV Power
Feeder System
0.0
20.0
40.0
60.0
80.0
100.0
13-14 14-15 15-16 (YTM -Aug )
60.1
74.1
99.9 Grid availability
Apr May Jun Jul Aug Sep Oct Nov Dec Jan Feb MarPlan
15-1614-15 13-14 12-13
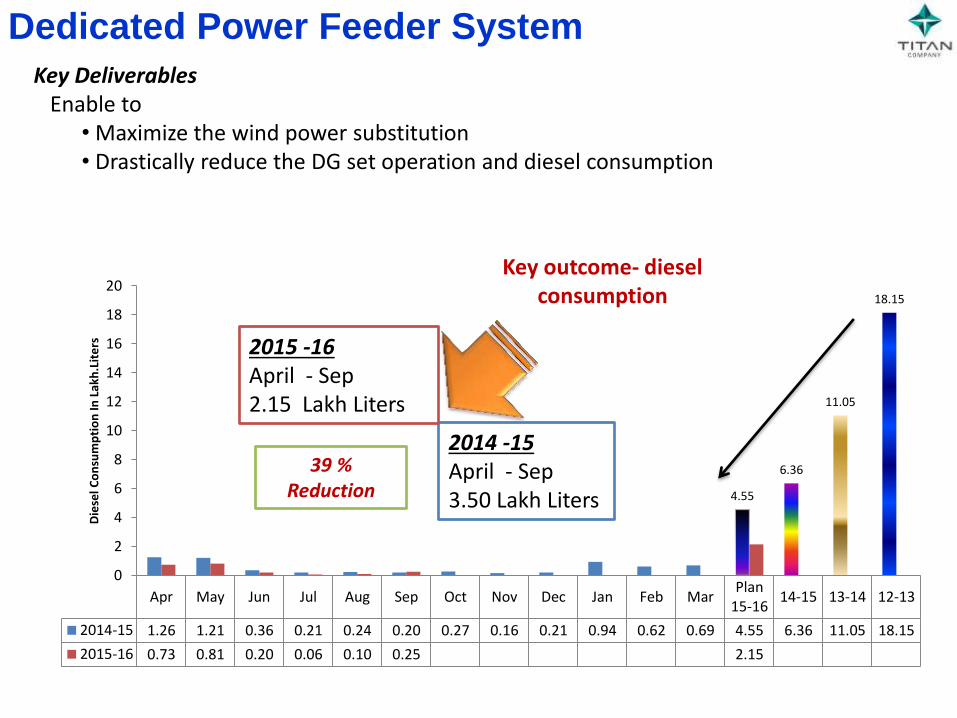
2014-15 1.26 1.21 0.36 0.21 0.24 0.20 0.27 0.16 0.21 0.94 0.62 0.69 4.55 6.36 11.05 18.15
2015-16 0.73 0.81 0.20 0.06 0.10 0.25 2.15
4.55
6.36
11.05
18.15
0
2
4
6
8
10
12
14
16
18
20
Die
sel C
on
sum
pti
on
In L
akh
.Lit
ers
Key Deliverables Enable to
• Maximize the wind power substitution • Drastically reduce the DG set operation and diesel consumption
2014 -15 April - Sep 3.50 Lakh Liters
2015 -16 April - Sep 2.15 Lakh Liters
Key outcome- diesel consumption
39 % Reduction
Dedicated Power Feeder System
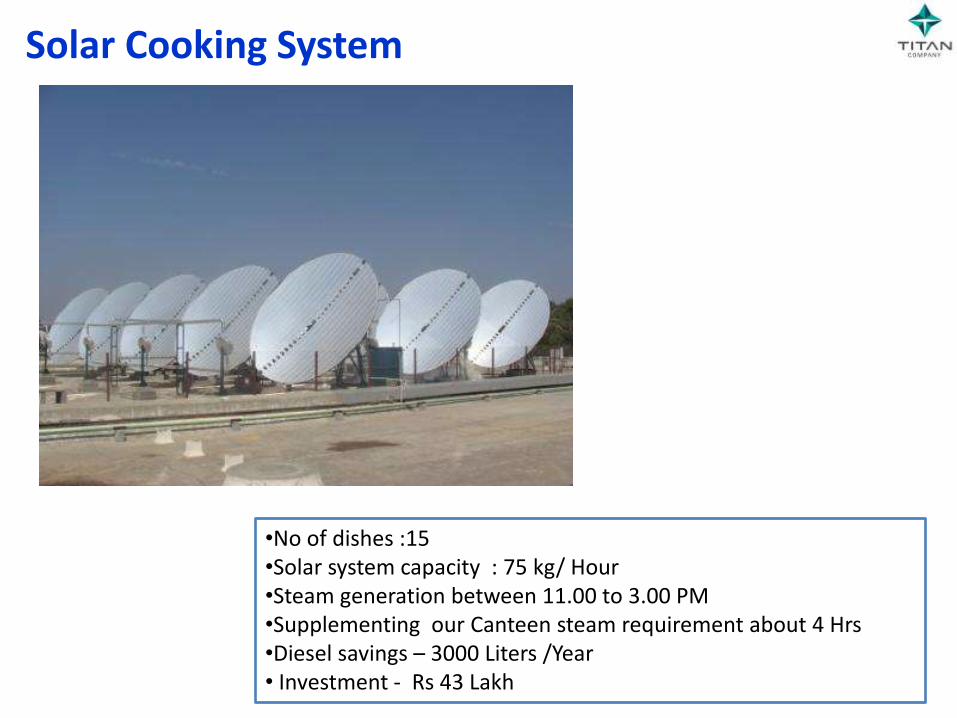
Solar Cooking System
•No of dishes :15 •Solar system capacity : 75 kg/ Hour •Steam generation between 11.00 to 3.00 PM •Supplementing our Canteen steam requirement about 4 Hrs •Diesel savings – 3000 Liters /Year • Investment - Rs 43 Lakh
28
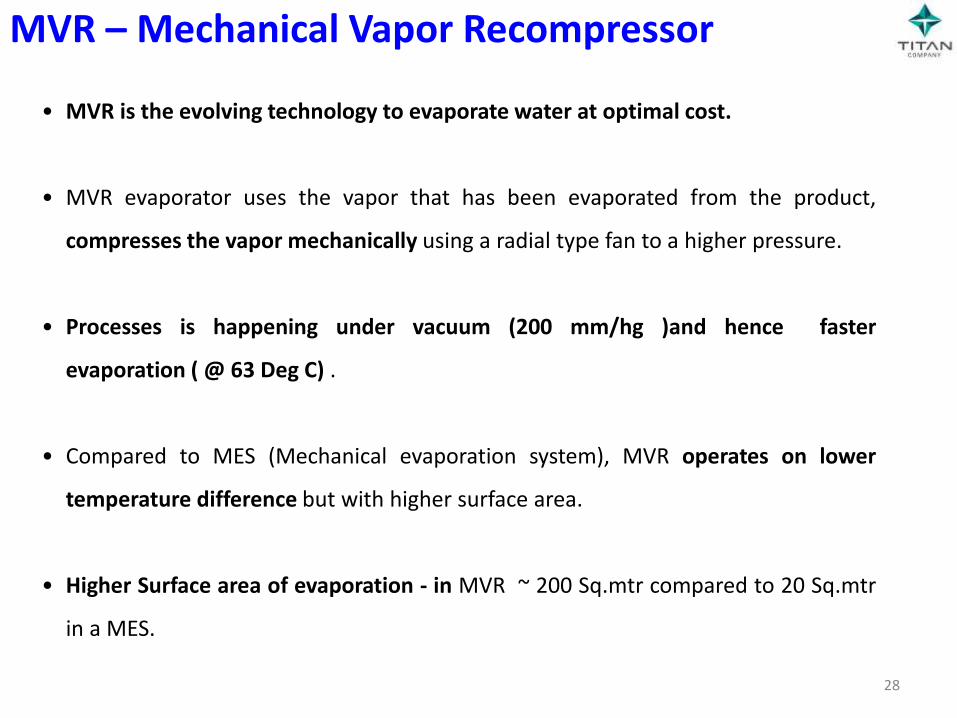
MVR – Mechanical Vapor Recompressor
• MVR is the evolving technology to evaporate water at optimal cost.
• MVR evaporator uses the vapor that has been evaporated from the product,
compresses the vapor mechanically using a radial type fan to a higher pressure.
• Processes is happening under vacuum (200 mm/hg )and hence faster
evaporation ( @ 63 Deg C) .
• Compared to MES (Mechanical evaporation system), MVR operates on lower
temperature difference but with higher surface area.
• Higher Surface area of evaporation - in MVR ~ 200 Sq.mtr compared to 20 Sq.mtr
in a MES.
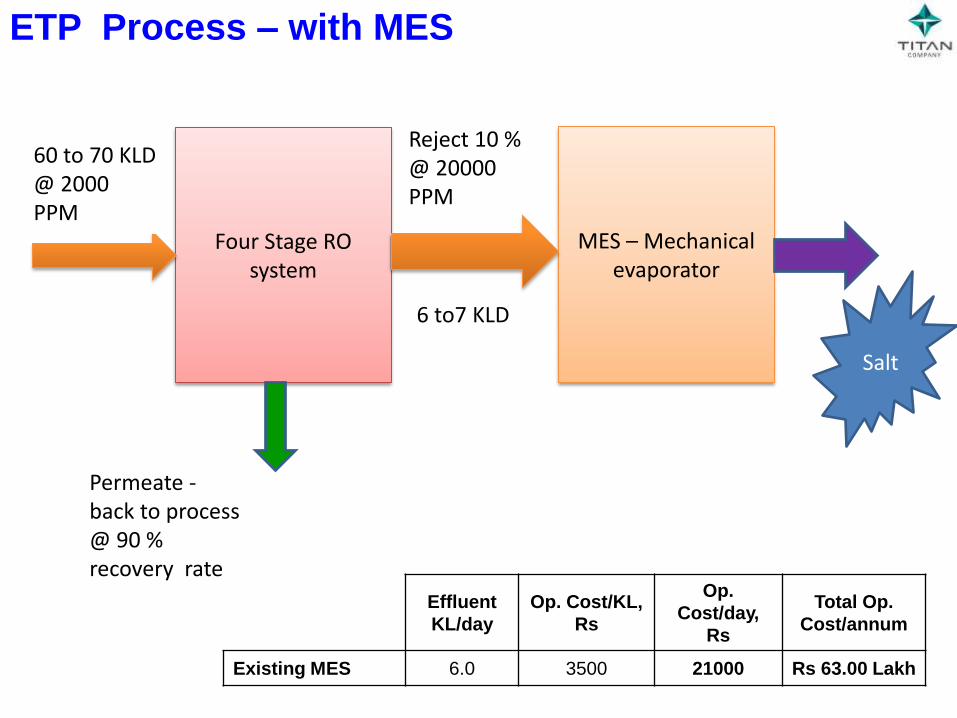
Four Stage RO system
MES – Mechanical evaporator
Salt
Reject 10 % @ 20000 PPM
ETP Process – with MES
60 to 70 KLD @ 2000 PPM
Permeate - back to process @ 90 % recovery rate
6 to7 KLD
Effluent
KL/day
Op. Cost/KL,
Rs
Op.
Cost/day,
Rs
Total Op.
Cost/annum
Existing MES 6.0 3500 21000 Rs 63.00 Lakh
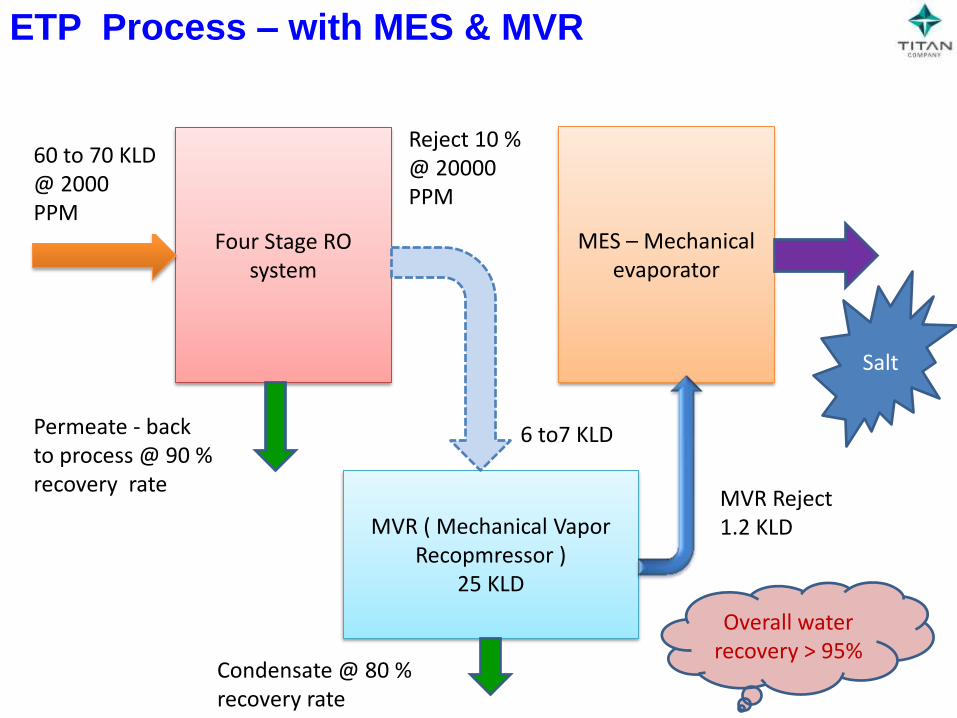
Four Stage RO system
MES – Mechanical evaporator
Salt
Reject 10 % @ 20000 PPM
ETP Process – with MES & MVR
60 to 70 KLD @ 2000 PPM
Permeate - back to process @ 90 % recovery rate
MVR Reject 1.2 KLD MVR ( Mechanical Vapor
Recopmressor ) 25 KLD
Condensate @ 80 % recovery rate
6 to7 KLD
Overall water recovery > 95%
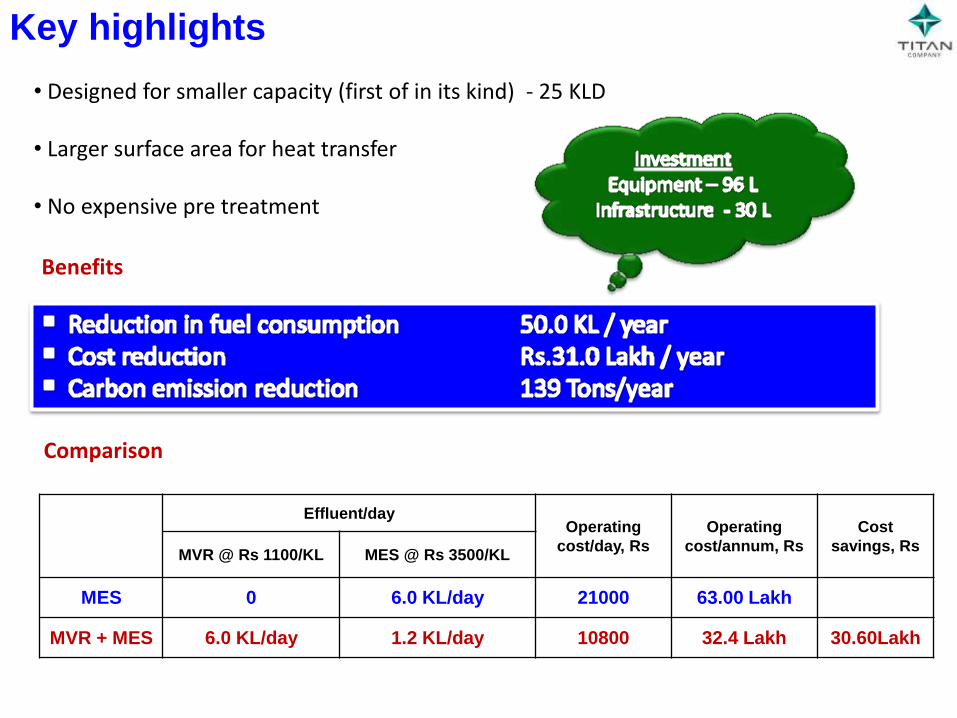
Key highlights
• Designed for smaller capacity (first of in its kind) - 25 KLD • Larger surface area for heat transfer • No expensive pre treatment
Effluent/day Operating
cost/day, Rs
Operating
cost/annum, Rs
Cost
savings, Rs MVR @ Rs 1100/KL MES @ Rs 3500/KL
MES 0 6.0 KL/day 21000 63.00 Lakh
MVR + MES 6.0 KL/day 1.2 KL/day 10800 32.4 Lakh 30.60Lakh
Benefits
Comparison
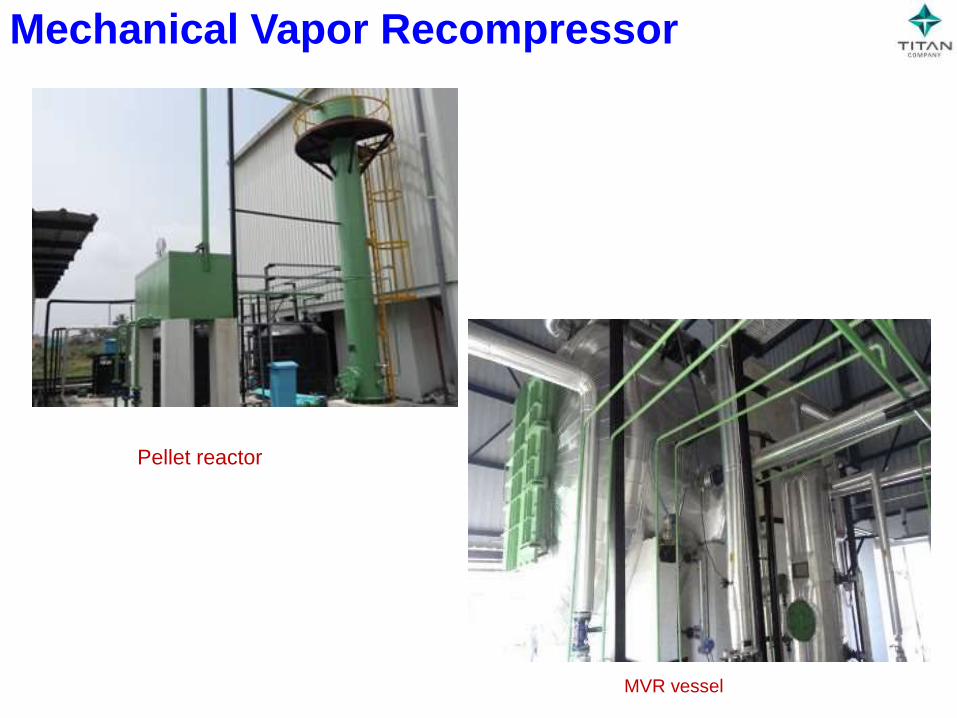
Mechanical Vapor Recompressor
Pellet reactor
MVR vessel
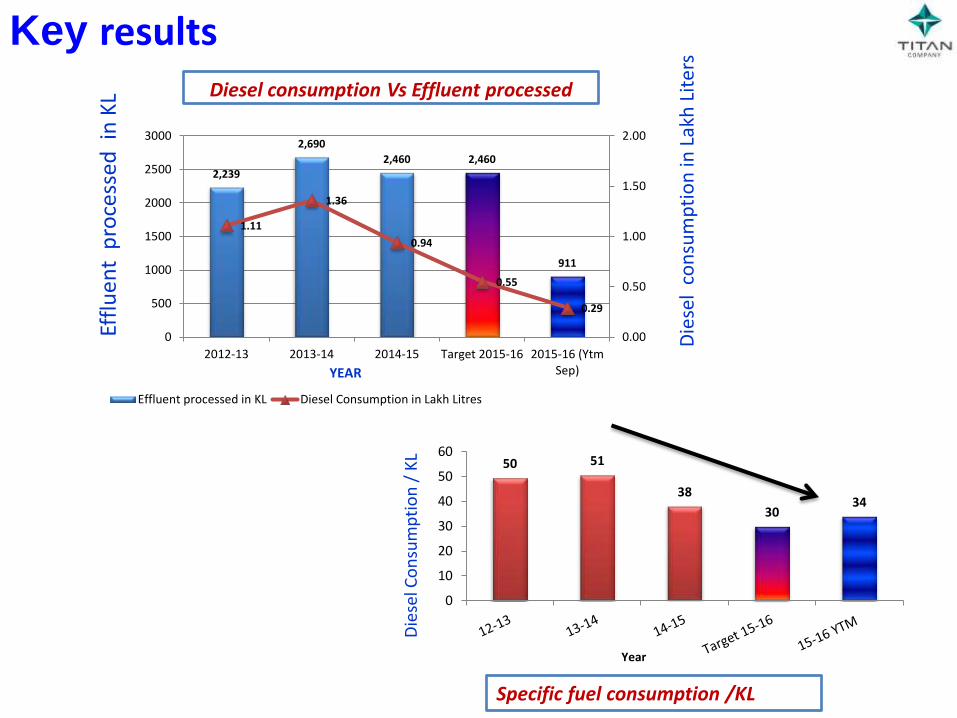
2,239
2,690
2,460 2,460
911
1.11
1.36
0.94
0.55
0.29
0.00
0.50
1.00
1.50
2.00
0
500
1000
1500
2000
2500
3000
2012-13 2013-14 2014-15 Target 2015-16 2015-16 (YtmSep)
Effluent processed in KL Diesel Consumption in Lakh Litres
YEAR
50 51
38
30 34
0
10
20
30
40
50
60
Die
sel C
on
sum
pti
on
/ K
L
Year
Key results
Specific fuel consumption /KL
Diesel consumption Vs Effluent processed
Die
sel
con
sum
pti
on
in L
akh
Lit
ers
Effl
ue
nt
pro
cess
ed i
n K
L
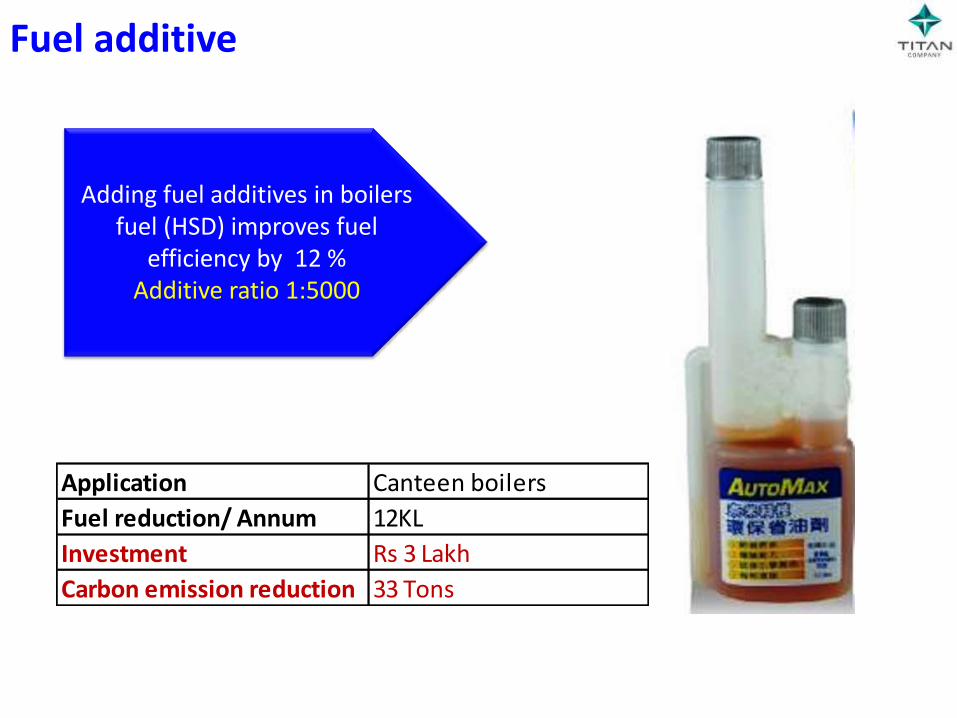
Fuel additive
Adding fuel additives in boilers fuel (HSD) improves fuel
efficiency by 12 % Additive ratio 1:5000
Application Canteen boilers
Fuel reduction/ Annum 12KL
Investment Rs 3 Lakh
Carbon emission reduction 33 Tons
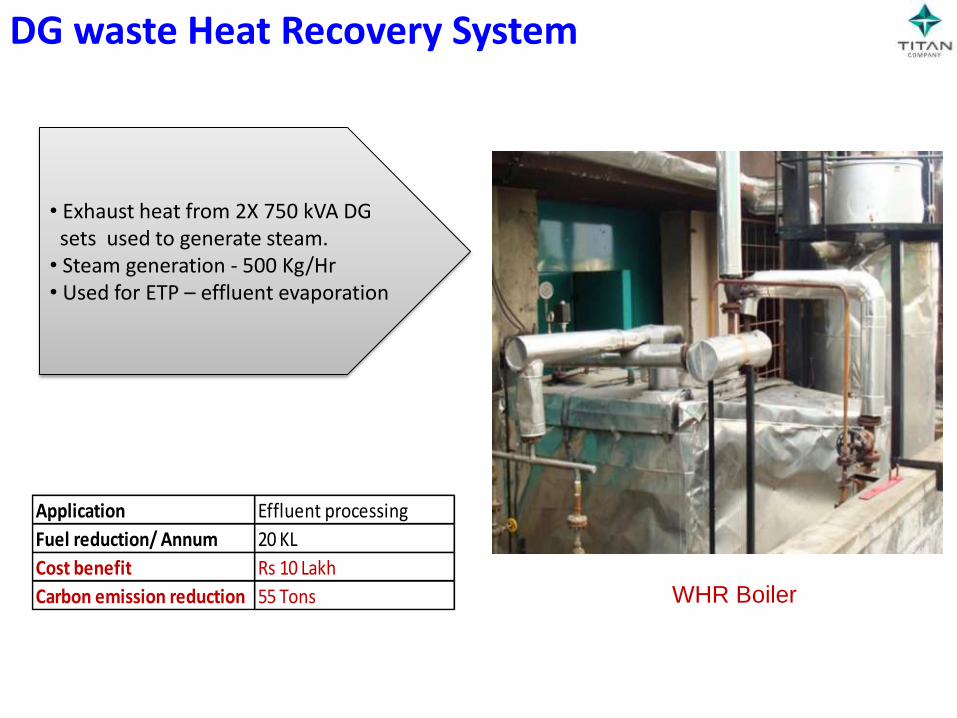
Application Effluent processing
Fuel reduction/ Annum 20 KL
Cost benefit Rs 10 Lakh
Carbon emission reduction 55 Tons
• Exhaust heat from 2X 750 kVA DG sets used to generate steam. • Steam generation - 500 Kg/Hr • Used for ETP – effluent evaporation
WHR Boiler
DG waste Heat Recovery System
Renewable Energy Substitution
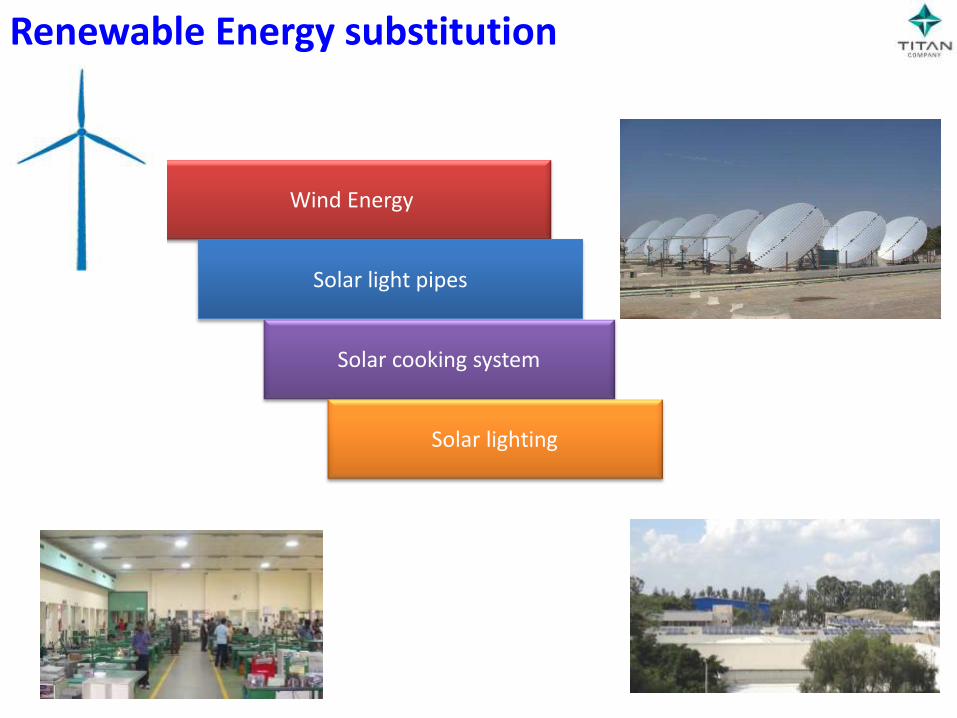
Renewable Energy substitution
Wind Energy
Solar light pipes
Solar cooking system
Solar lighting
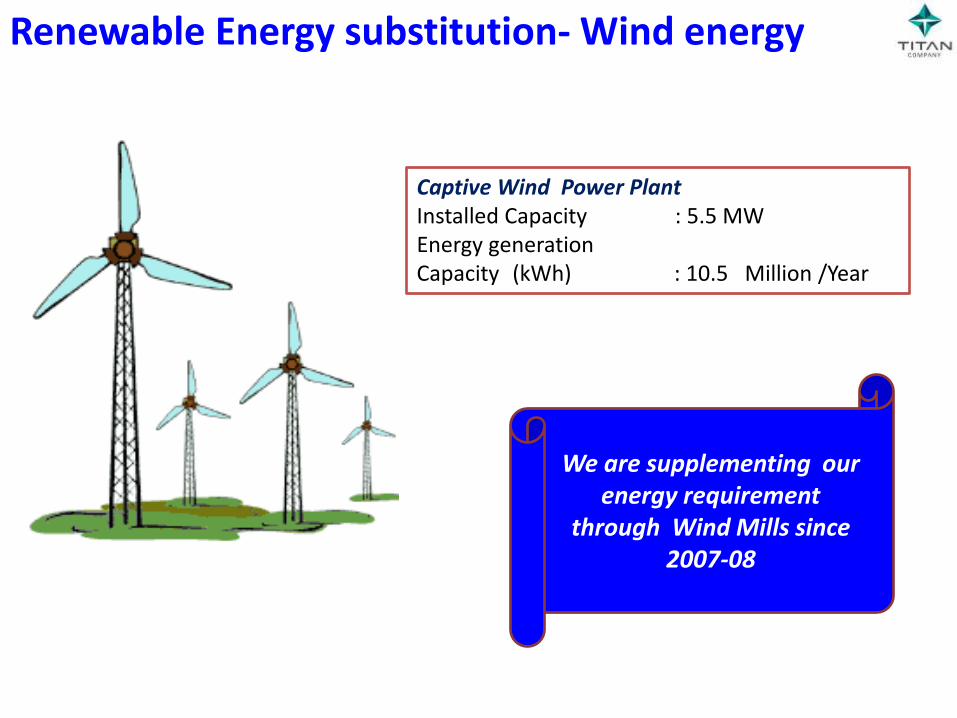
Captive Wind Power Plant Installed Capacity : 5.5 MW Energy generation Capacity (kWh) : 10.5 Million /Year
Renewable Energy substitution- Wind energy
We are supplementing our energy requirement
through Wind Mills since 2007-08
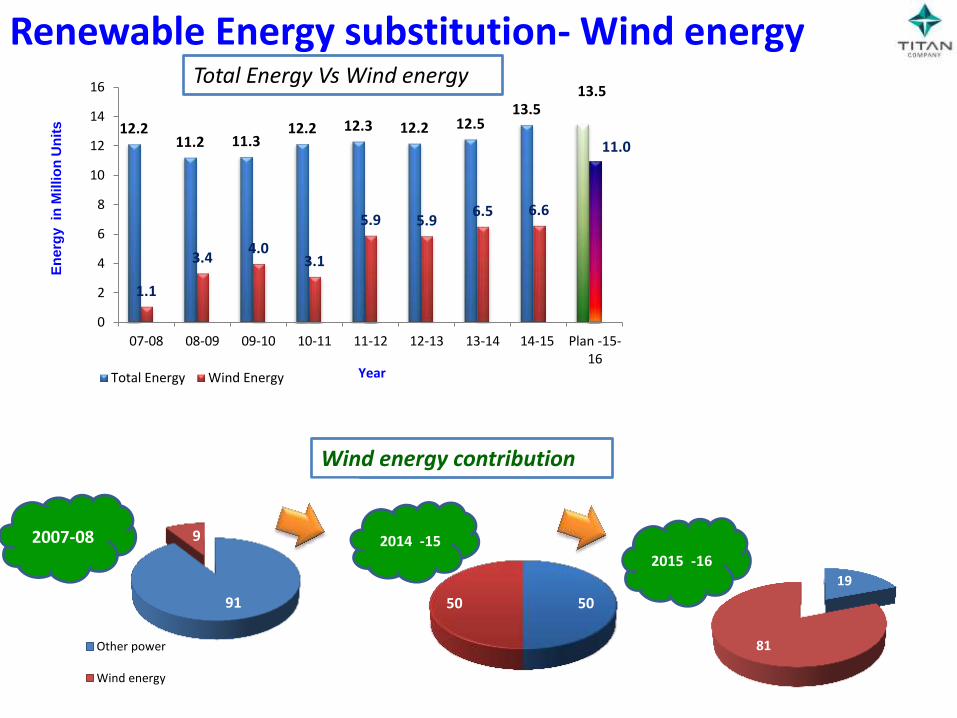
Renewable Energy substitution- Wind energy Total Energy Vs Wind energy
Wind energy contribution
12.2 11.2 11.3
12.2 12.3 12.2 12.5 13.5
13.5
1.1
3.4 4.0
3.1
5.9 5.9 6.5 6.6
11.0
0
2
4
6
8
10
12
14
16
07-08 08-09 09-10 10-11 11-12 12-13 13-14 14-15 Plan -15-16
Total Energy Wind Energy
En
erg
y in
Millio
n U
nit
s
Year
91
9
Other power
Wind energy
50 50
2007-08 2014 -15 2015 -16
19
81
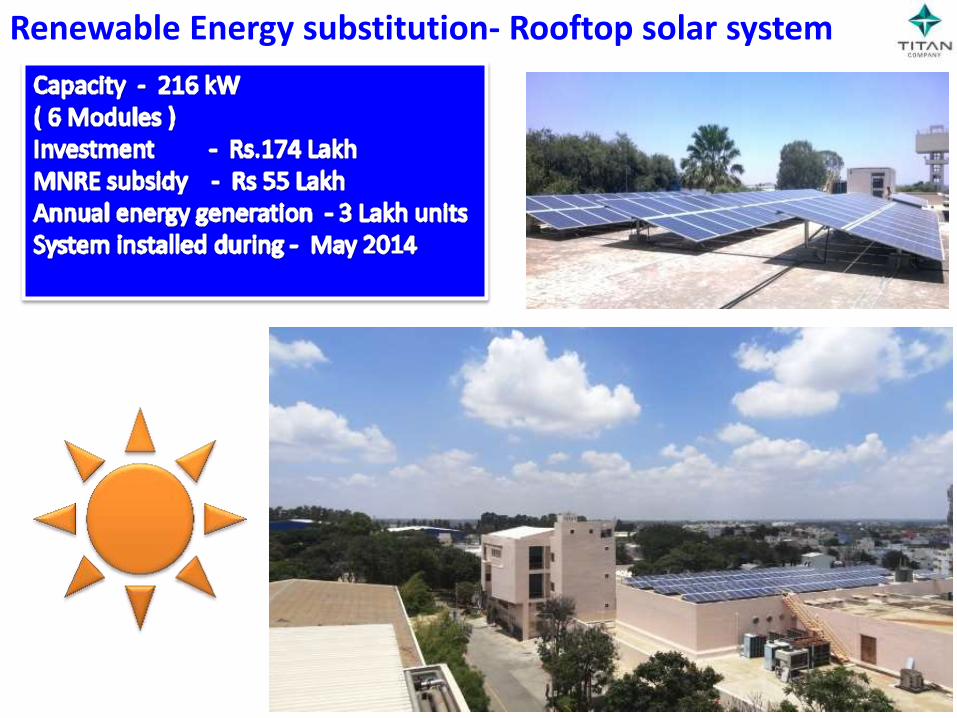
Renewable Energy substitution- Rooftop solar system
Renewable Energy substitution- Rooftop solar system
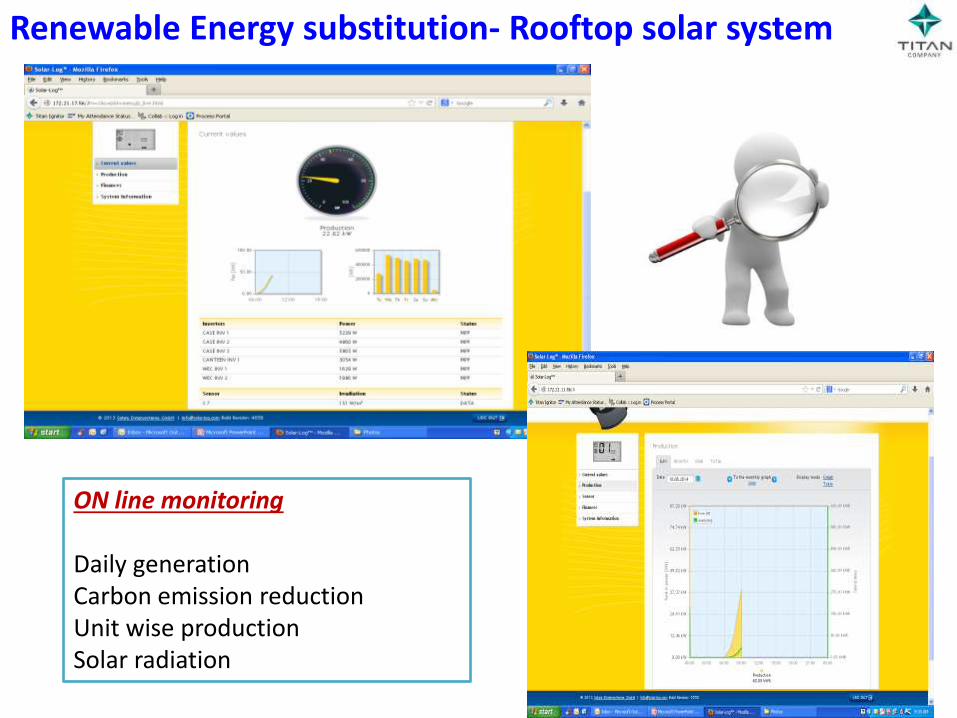
ON line monitoring Daily generation Carbon emission reduction Unit wise production Solar radiation
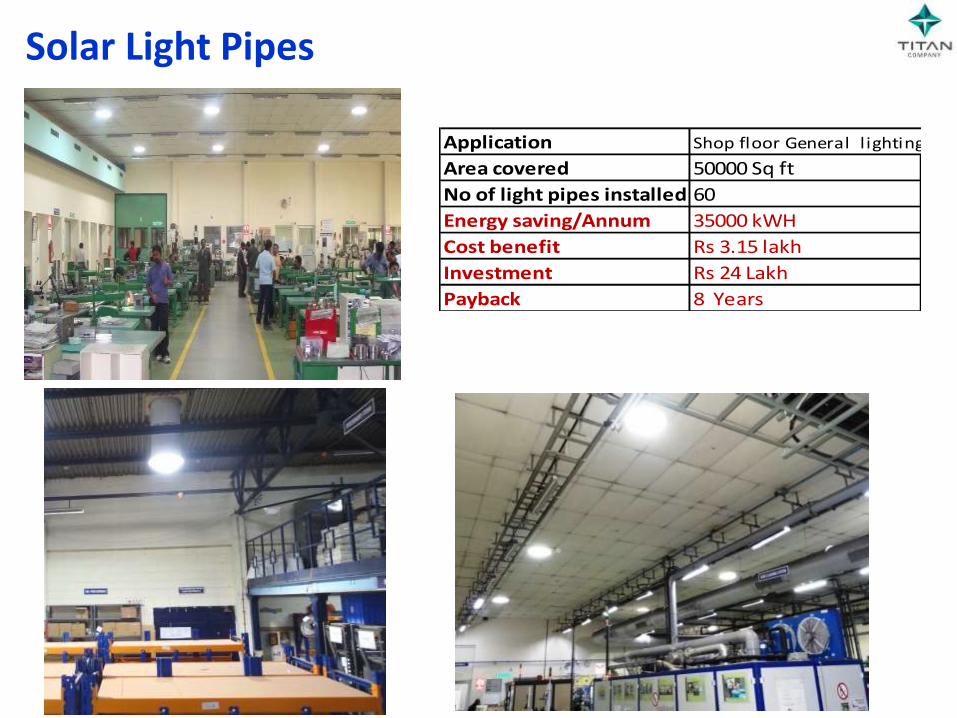
Solar Light Pipes
Application Shop floor General l ighting
Area covered 50000 Sq ft
No of light pipes installed 60
Energy saving/Annum 35000 kWH
Cost benefit Rs 3.15 lakh
Investment Rs 24 Lakh
Payback 8 Years
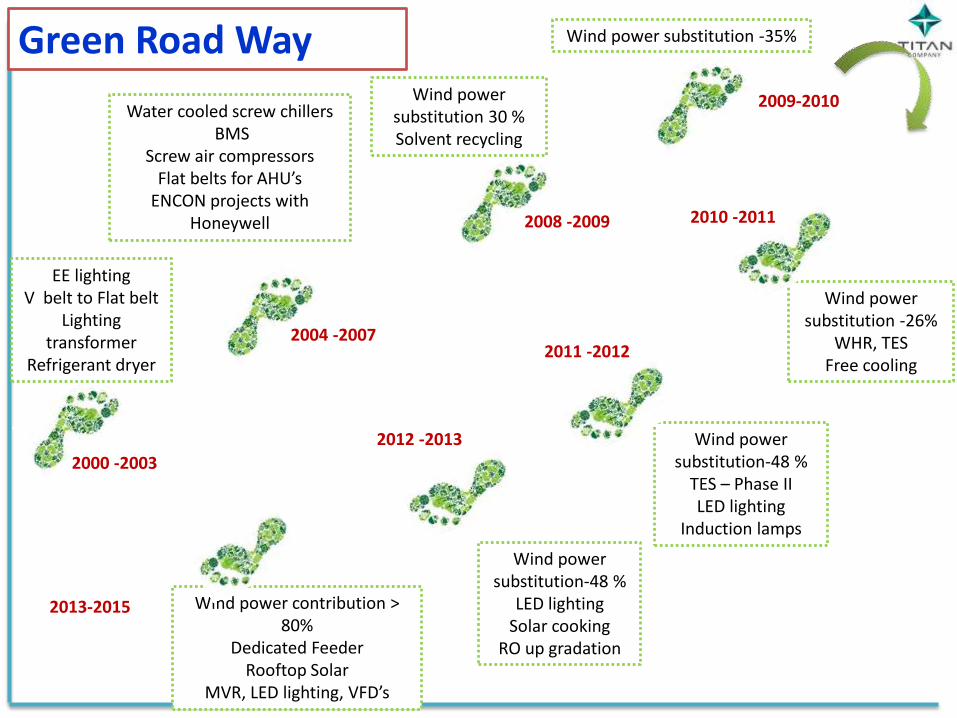
Wind power substitution 30 % Solvent recycling
Wind power substitution -26%
WHR, TES Free cooling
EE lighting V belt to Flat belt
Lighting transformer
Refrigerant dryer
Wind power substitution-48 %
TES – Phase II LED lighting
Induction lamps
Wind power substitution-48 %
LED lighting Solar cooking
RO up gradation
2000 -2003
2004 -2007
2008 -2009
2009-2010
Wind power substitution -35%
2013-2015
2012 -2013
2011 -2012
2010 -2011
Wind power contribution > 80%
Dedicated Feeder Rooftop Solar
MVR, LED lighting, VFD’s
Water cooled screw chillers BMS
Screw air compressors Flat belts for AHU’s
ENCON projects with Honeywell
Green Road Way
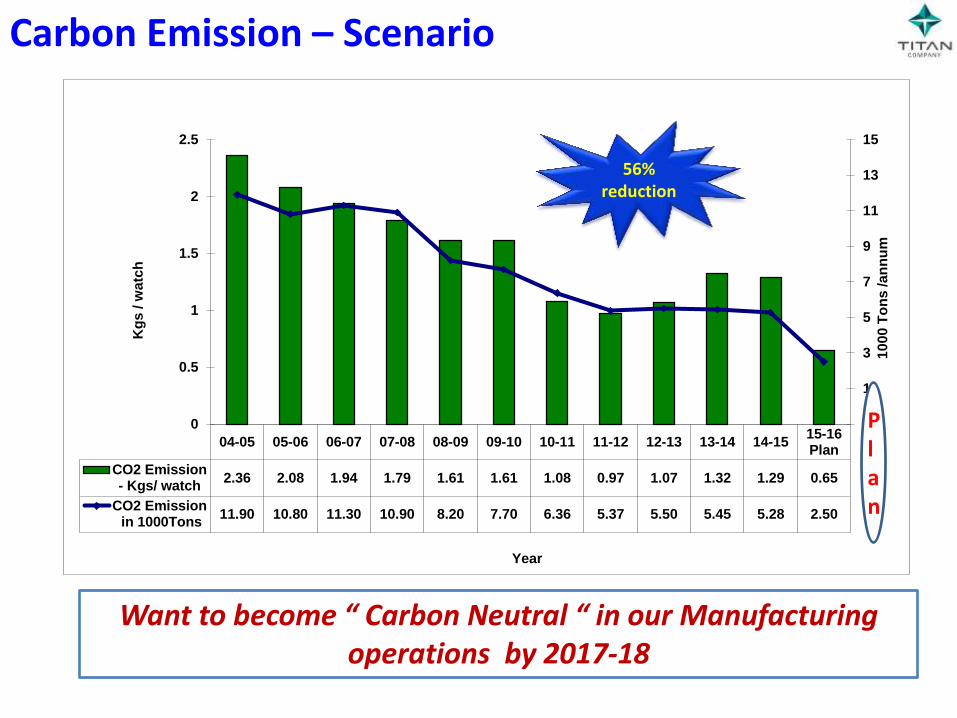
Carbon Emission – Scenario
Want to become “ Carbon Neutral “ in our Manufacturing operations by 2017-18
04-05 05-06 06-07 07-08 08-09 09-10 10-11 11-12 12-13 13-14 14-1515-16Plan
CO2 Emission- Kgs/ watch
2.36 2.08 1.94 1.79 1.61 1.61 1.08 0.97 1.07 1.32 1.29 0.65
CO2 Emission in 1000Tons
11.90 10.80 11.30 10.90 8.20 7.70 6.36 5.37 5.50 5.45 5.28 2.50
-1
1
3
5
7
9
11
13
15
0
0.5
1
1.5
2
2.5
10
00
To
ns
/a
nn
um
Kg
s / w
atc
h
Year
56% reduction
Plan
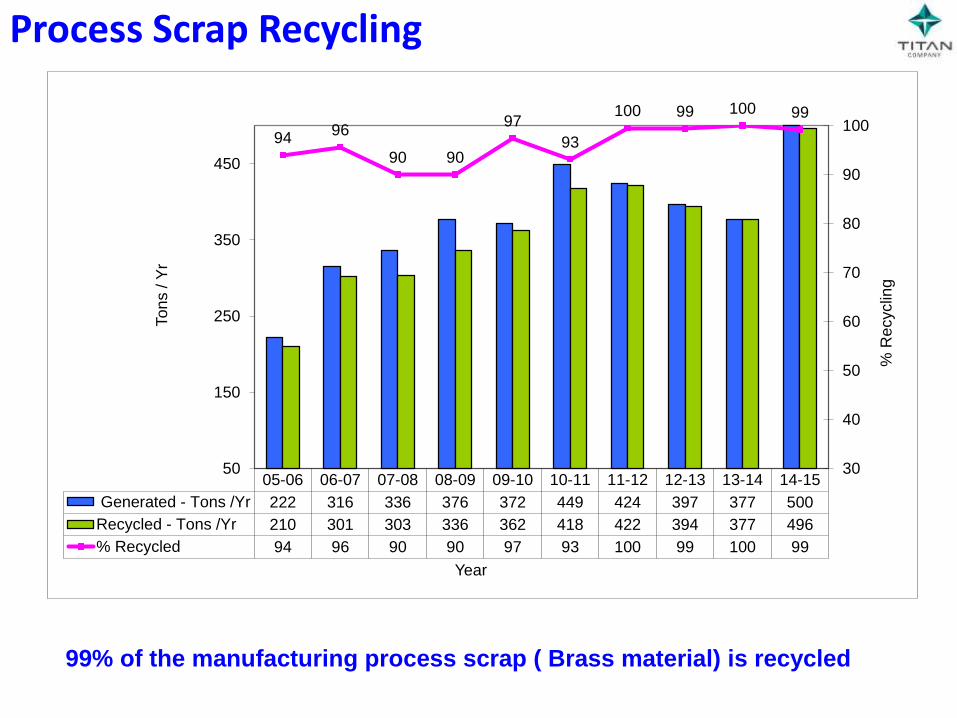
Process Scrap Recycling
99% of the manufacturing process scrap ( Brass material) is recycled
05-06 06-07 07-08 08-09 09-10 10-11 11-12 12-13 13-14 14-15
Generated - Tons /Yr 222 316 336 376 372 449 424 397 377 500
Recycled - Tons /Yr 210 301 303 336 362 418 422 394 377 496
% Recycled 94 96 90 90 97 93 100 99 100 99
94 96
90 90
97
93
100 99 100 99
30
40
50
60
70
80
90
100
50
150
250
350
450
% R
ecyclin
g
To
ns / Y
r
Year
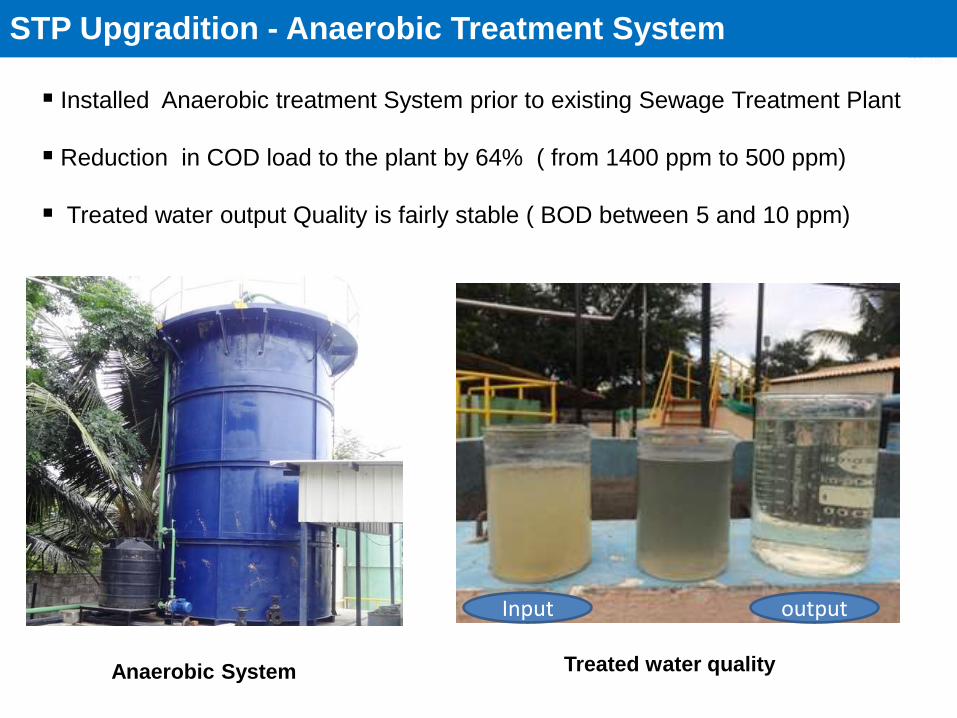
Installed Anaerobic treatment System prior to existing Sewage Treatment Plant
Reduction in COD load to the plant by 64% ( from 1400 ppm to 500 ppm)
Treated water output Quality is fairly stable ( BOD between 5 and 10 ppm)
STP Upgradition - Anaerobic Treatment System
Anaerobic System Treated water quality
Input output
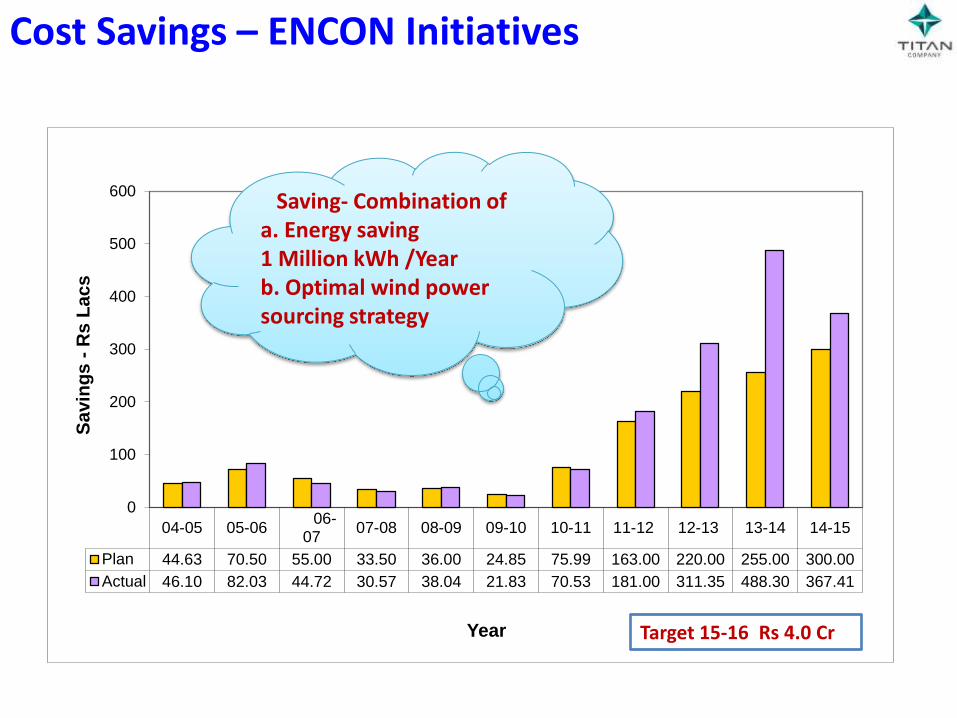
Cost Savings – ENCON Initiatives
04-05 05-06 06-
0707-08 08-09 09-10 10-11 11-12 12-13 13-14 14-15
Plan 44.63 70.50 55.00 33.50 36.00 24.85 75.99 163.00 220.00 255.00 300.00
Actual 46.10 82.03 44.72 30.57 38.04 21.83 70.53 181.00 311.35 488.30 367.41
0
100
200
300
400
500
600
Sa
vin
gs
- R
s L
ac
s
Year
Saving- Combination of a. Energy saving 1 Million kWh /Year b. Optimal wind power sourcing strategy
Target 15-16 Rs 4.0 Cr
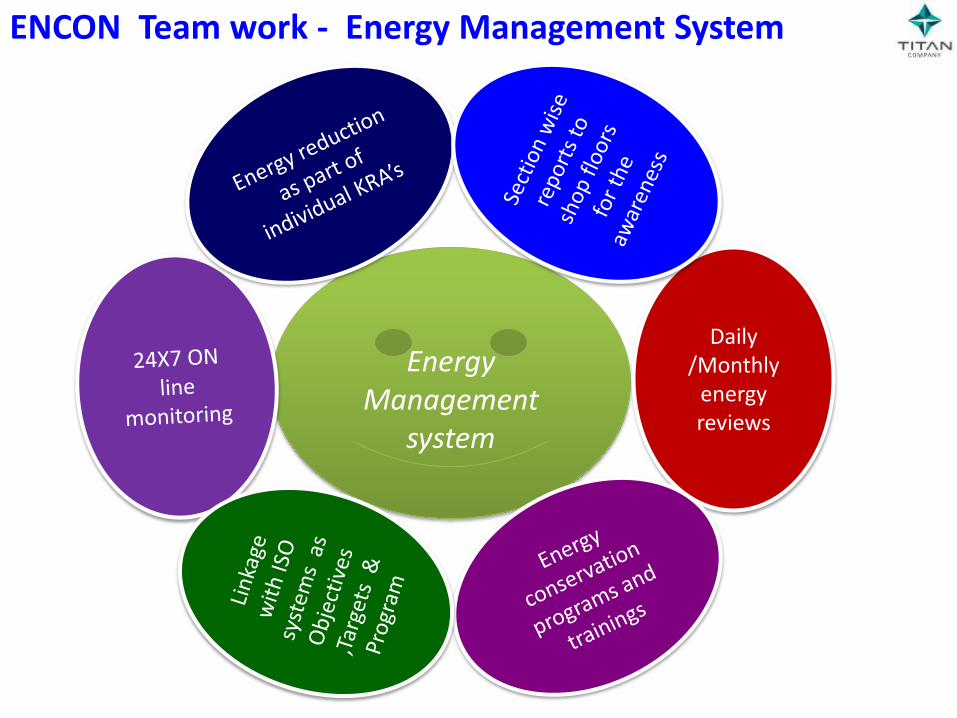
ENCON Team work - Energy Management System
Energy Management
system
Daily /Monthly
energy reviews
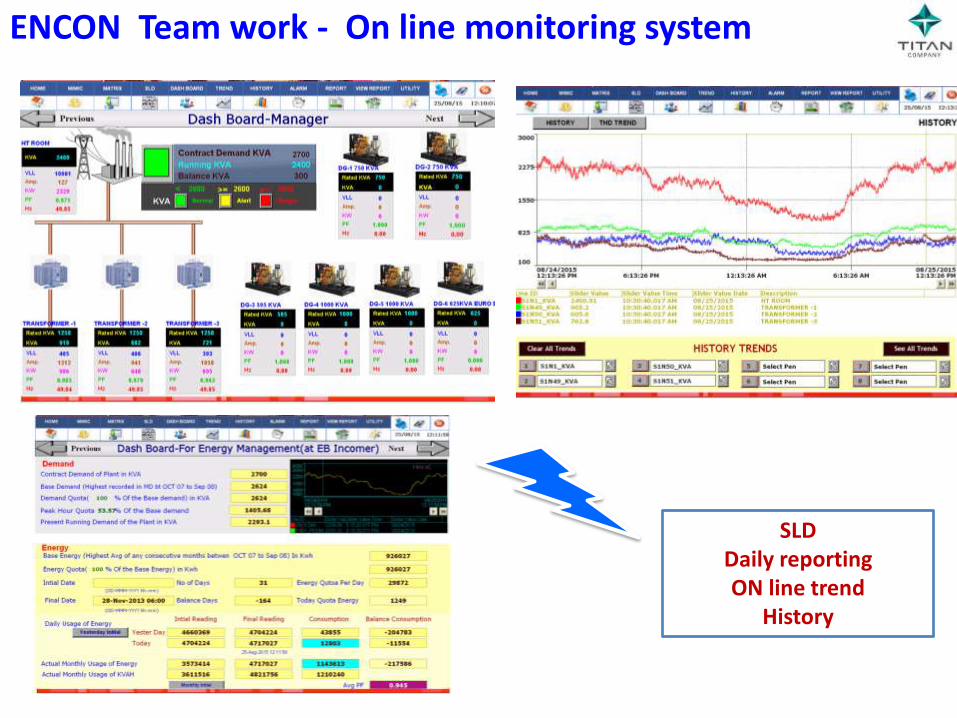
ENCON Team work - On line monitoring system
SLD Daily reporting ON line trend
History
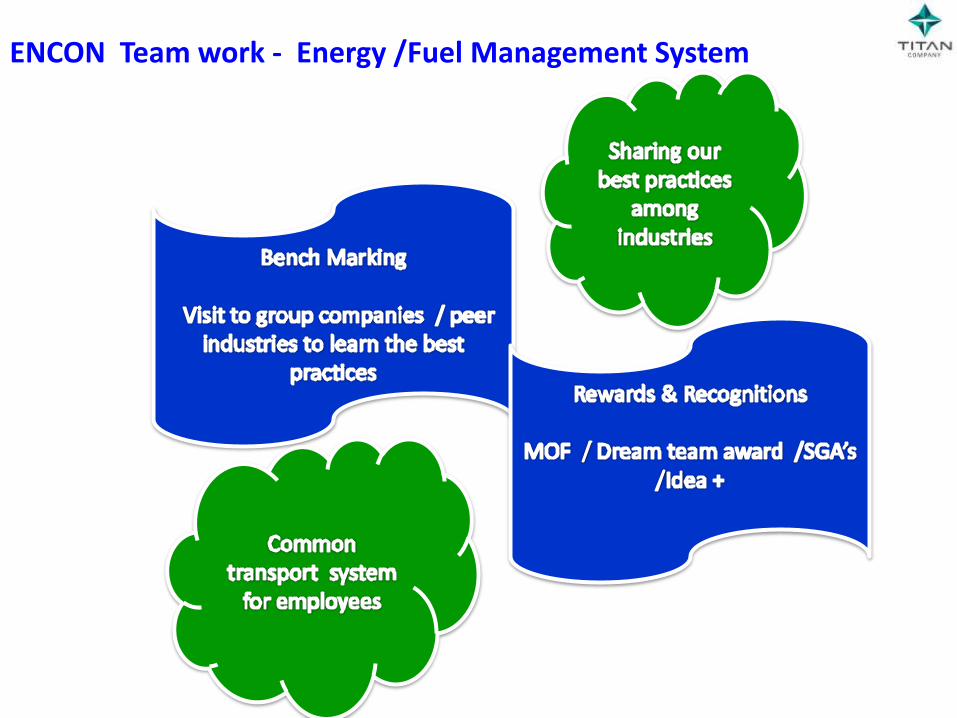
ENCON Team work - Energy /Fuel Management System
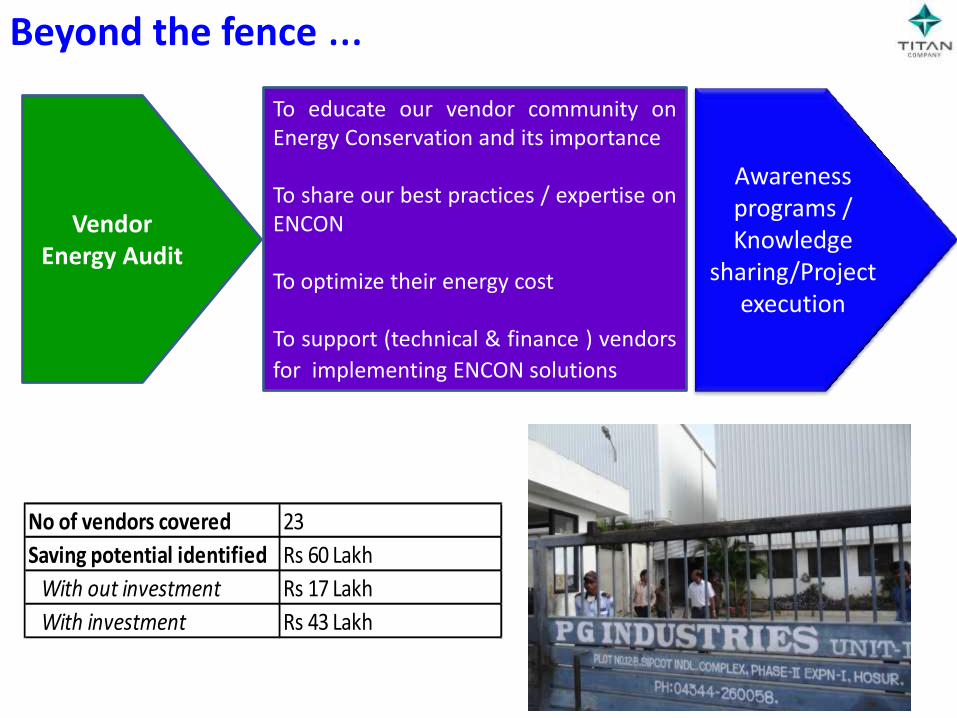
Beyond the fence … To educate our vendor community on Energy Conservation and its importance To share our best practices / expertise on ENCON To optimize their energy cost To support (technical & finance ) vendors
for implementing ENCON solutions
No of vendors covered 23
Saving potential identified Rs 60 Lakh
With out investment Rs 17 Lakh
With investment Rs 43 Lakh
Vendor Energy Audit
Awareness programs / Knowledge
sharing/Project execution
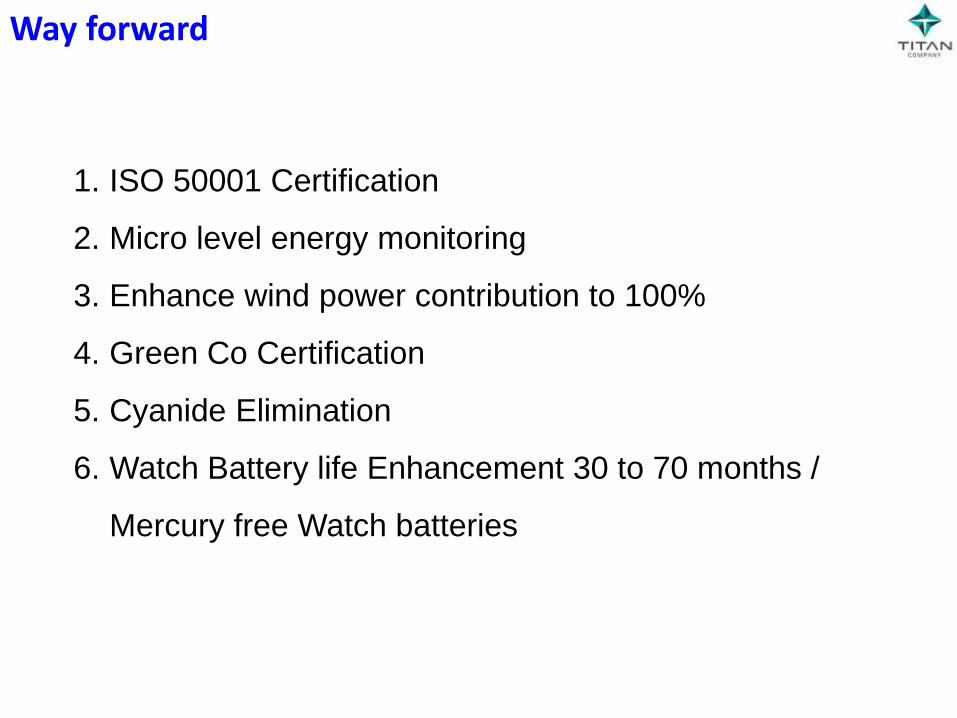
Way forward
1. ISO 50001 Certification
2. Micro level energy monitoring
3. Enhance wind power contribution to 100%
4. Green Co Certification
5. Cyanide Elimination
6. Watch Battery life Enhancement 30 to 70 months /
Mercury free Watch batteries
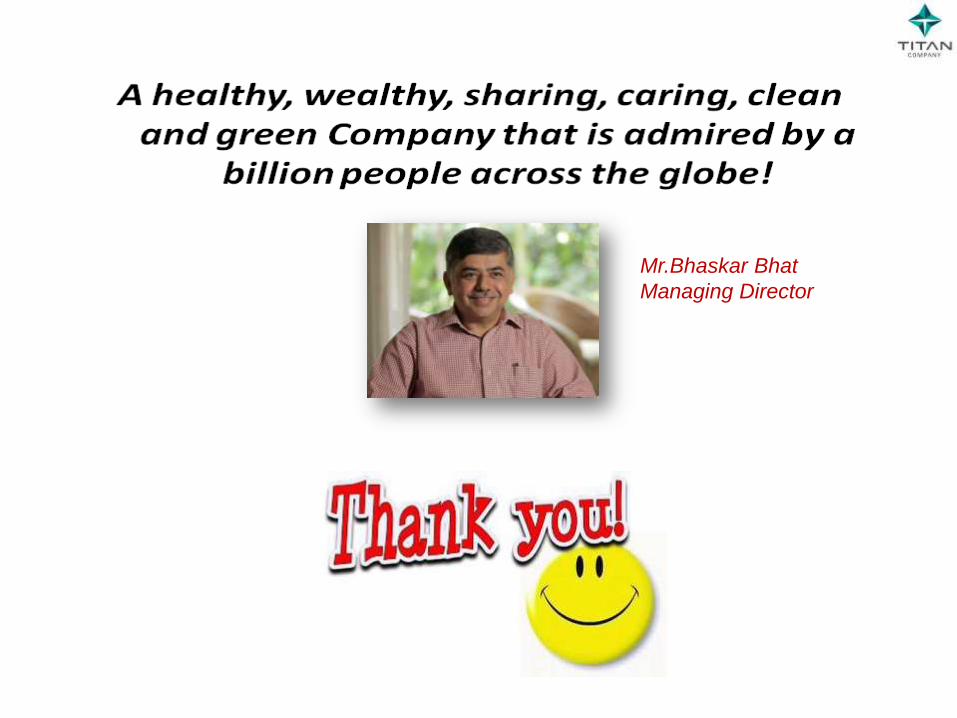
Mr.Bhaskar Bhat
Managing Director


![Tanishq Ppt Repaired]](https://img.pdfslide.us/doc/110x75/546c3035b4af9f40358b4653/tanishq-ppt-repaired.jpg)