Embed Size (px)
Citation preview
Herbert K. Haas, CEO Dr. Immo Querner, CFO
6M 2017 Results14 August 2017
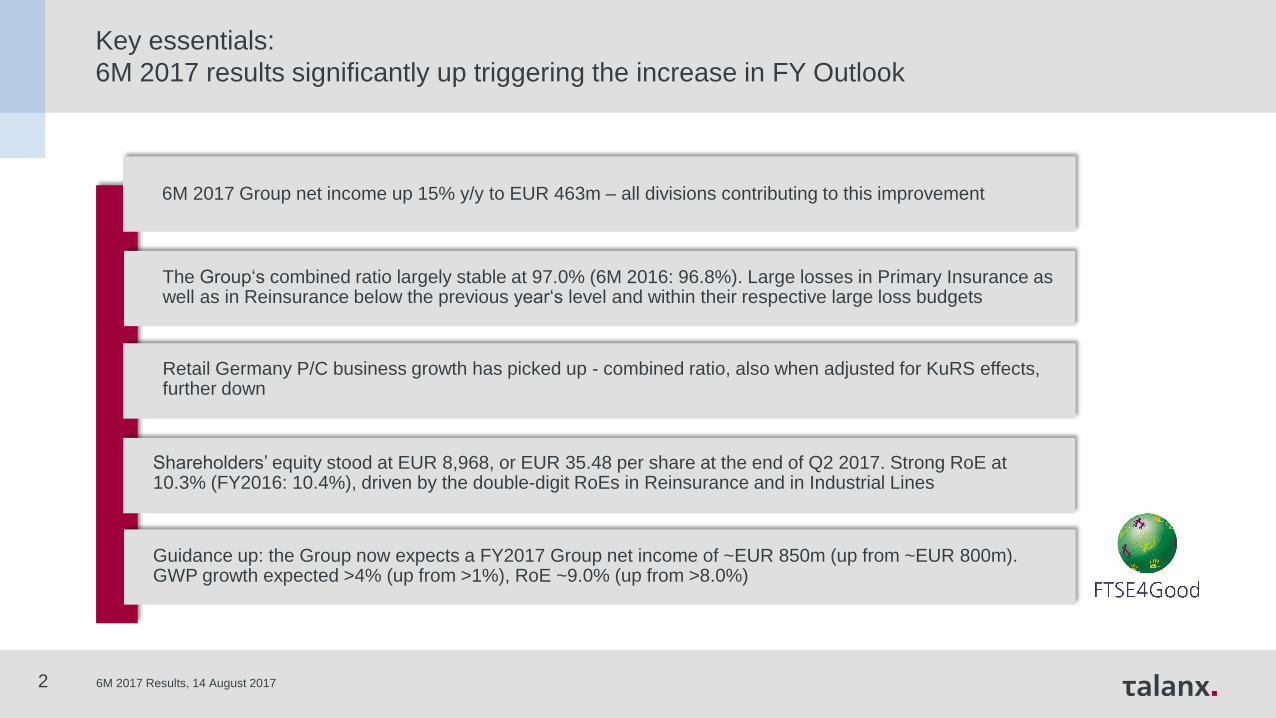
6M 2017 Group net income up 15% y/y to EUR 463m – all divisions contributing to this improvement
Shareholders’ equity stood at EUR 8,968, or EUR 35.48 per share at the end of Q2 2017. Strong RoE at 10.3% (FY2016: 10.4%), driven by the double-digit RoEs in Reinsurance and in Industrial Lines
Guidance up: the Group now expects a FY2017 Group net income of ~EUR 850m (up from ~EUR 800m). GWP growth expected >4% (up from >1%), RoE ~9.0% (up from >8.0%)
Retail Germany P/C business growth has picked up - combined ratio, also when adjusted for KuRS effects, further down
The Group‘s combined ratio largely stable at 97.0% (6M 2016: 96.8%). Large losses in Primary Insurance aswell as in Reinsurance below the previous year‘s level and within their respective large loss budgets
Key essentials:
6M 2017 results significantly up triggering the increase in FY Outlook
6M 2017 Results, 14 August 20172
6M 2017 Results, 14 August 20173
Agenda
Segments
Investments / Capital
Outlook
Appendix
Mid-term Target Matrix
Additional Information 6M 2017
Group Highlights12345
17,553
7,801
16,427
7,432
6M Q2-940
-525
-784
-362
6M Q2
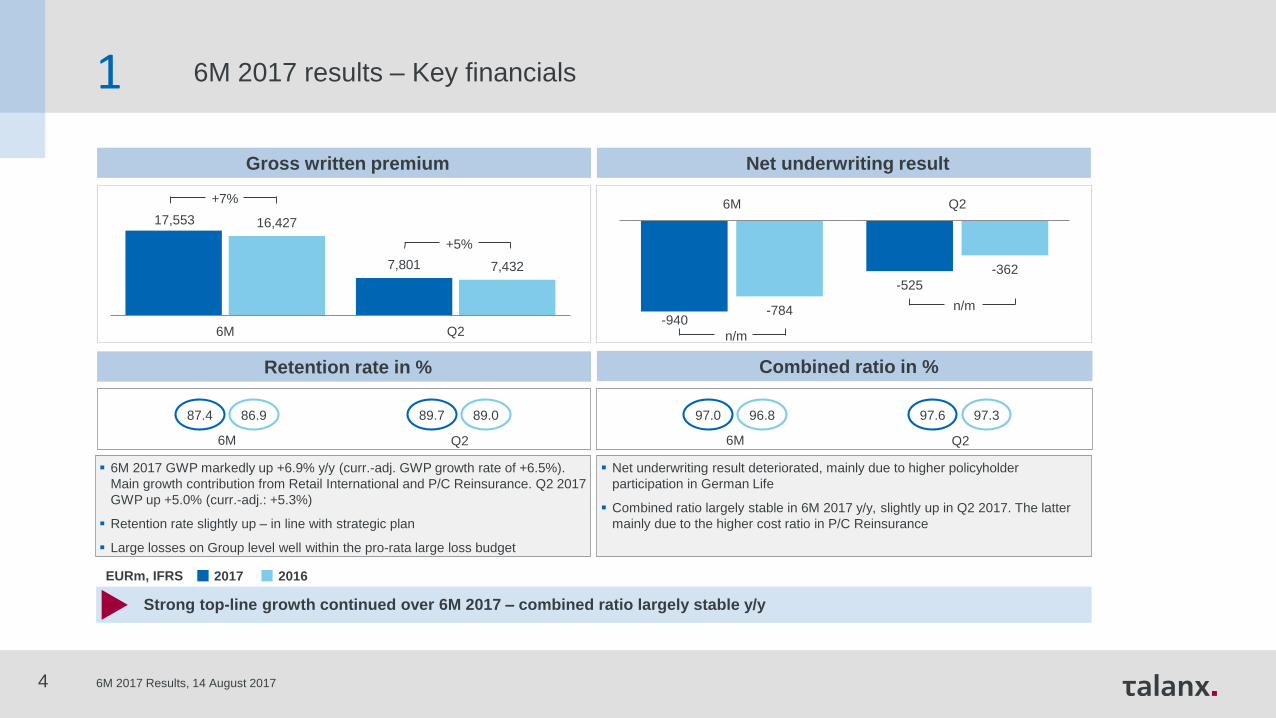
Gross written premium Net underwriting result
6M 2017 GWP markedly up +6.9% y/y (curr.-adj. GWP growth rate of +6.5%).
Main growth contribution from Retail International and P/C Reinsurance. Q2 2017
GWP up +5.0% (curr.-adj.: +5.3%)
Retention rate slightly up – in line with strategic plan
Large losses on Group level well within the pro-rata large loss budget
Net underwriting result deteriorated, mainly due to higher policyholder
participation in German Life
Combined ratio largely stable in 6M 2017 y/y, slightly up in Q2 2017. The latter
mainly due to the higher cost ratio in P/C Reinsurance
Retention rate in % Combined ratio in %
6M Q2
87.4 86.9 89.7 89.0
6M Q2
97.0 96.8 97.6 97.3
6M 2017 Results, 14 August 20174
6M 2017 results – Key financials
2017EURm, IFRS 2016
+7%
Strong top-line growth continued over 6M 2017 – combined ratio largely stable y/y
+5%
n/m
n/m
1
5 6M 2017 Results, 14 August 2017
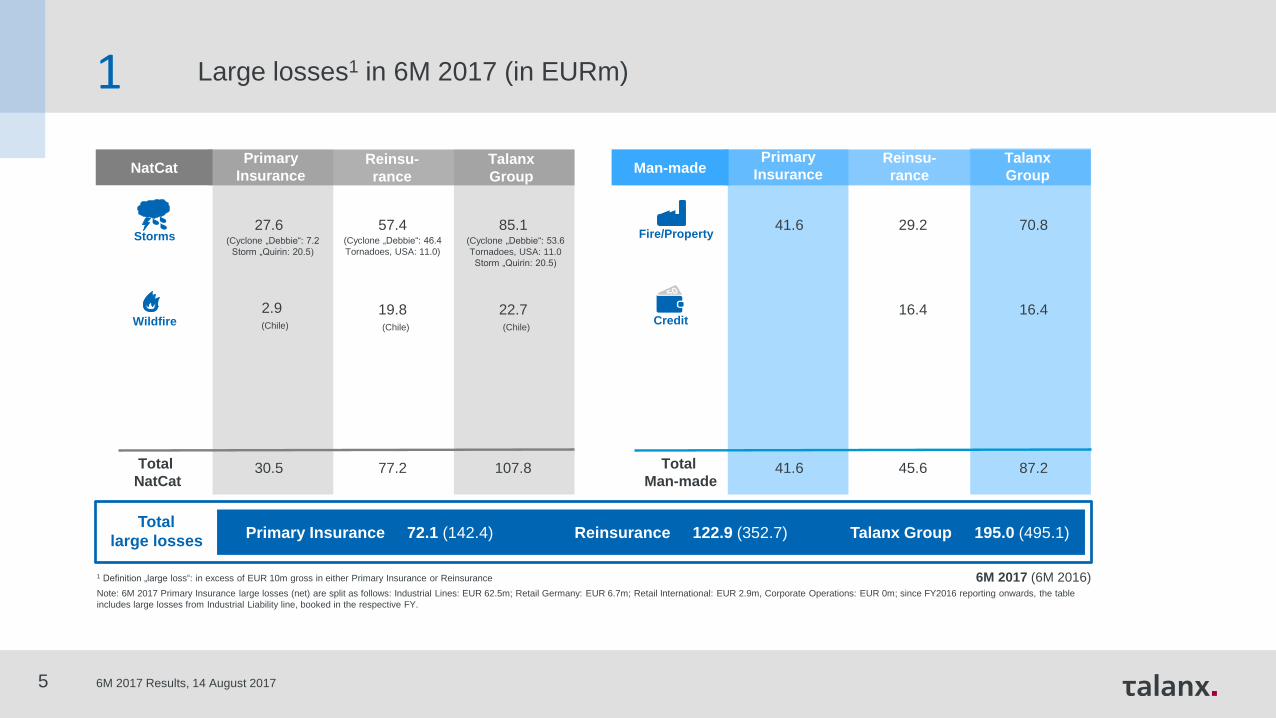
Large losses1 in 6M 2017 (in EURm)
1 Definition „large loss“: in excess of EUR 10m gross in either Primary Insurance or Reinsurance
Note: 6M 2017 Primary Insurance large losses (net) are split as follows: Industrial Lines: EUR 62.5m; Retail Germany: EUR 6.7m; Retail International: EUR 2.9m, Corporate Operations: EUR 0m; since FY2016 reporting onwards, the table
includes large losses from Industrial Liability line, booked in the respective FY.
Total
NatCat
Total
Man-made
Storms
Wildfire Credit
Total
large losses
Man-made
27.6 57.4 85.1
19.8 22.7
30.5 77.2 107.8
41.6 29.2 70.8
16.4 16.4
41.6 45.6 87.2
Primary Insurance 72.1 (142.4) Reinsurance 122.9 (352.7) Talanx Group 195.0 (495.1)
NatCatPrimary
InsuranceReinsu-
rance
Talanx
Group
Primary
InsuranceReinsu-
rance
Talanx
Group
Fire/Property(Cyclone „Debbie“: 7.2
Storm „Quirin: 20.5)
(Cyclone „Debbie“: 46.4
Tornadoes, USA: 11.0)
(Cyclone „Debbie“: 53.6
Tornadoes, USA: 11.0
Storm „Quirin: 20.5)
(Chile) (Chile)
1
2.9(Chile)
6M 2017 (6M 2016)
6 6M 2017 Results, 14 August 2017
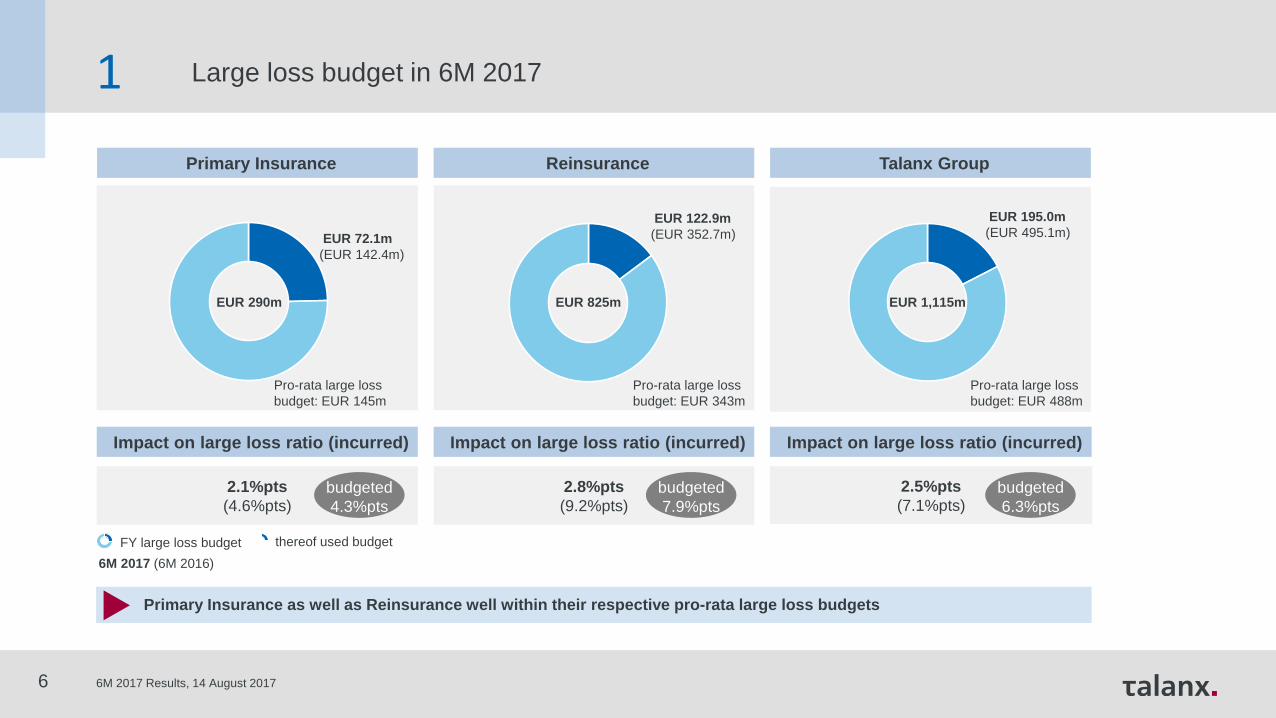
Large loss budget in 6M 2017
EUR 290m
EUR 72.1m
(EUR 142.4m)
EUR 825m
EUR 122.9m
(EUR 352.7m)
EUR 1,115m
EUR 195.0m
(EUR 495.1m)
2.1%pts
(4.6%pts)
2.8%pts
(9.2%pts)
2.5%pts
(7.1%pts)
thereof used budgetFY large loss budget
Primary Insurance Reinsurance Talanx Group
Primary Insurance as well as Reinsurance well within their respective pro-rata large loss budgets
Impact on large loss ratio (incurred) Impact on large loss ratio (incurred) Impact on large loss ratio (incurred)
1
6M 2017 (6M 2016)
Pro-rata large loss
budget: EUR 145m
Pro-rata large loss
budget: EUR 343m
Pro-rata large loss
budget: EUR 488m
budgeted
4.3%pts
budgeted
7.9%pts
budgeted
6.3%pts
7
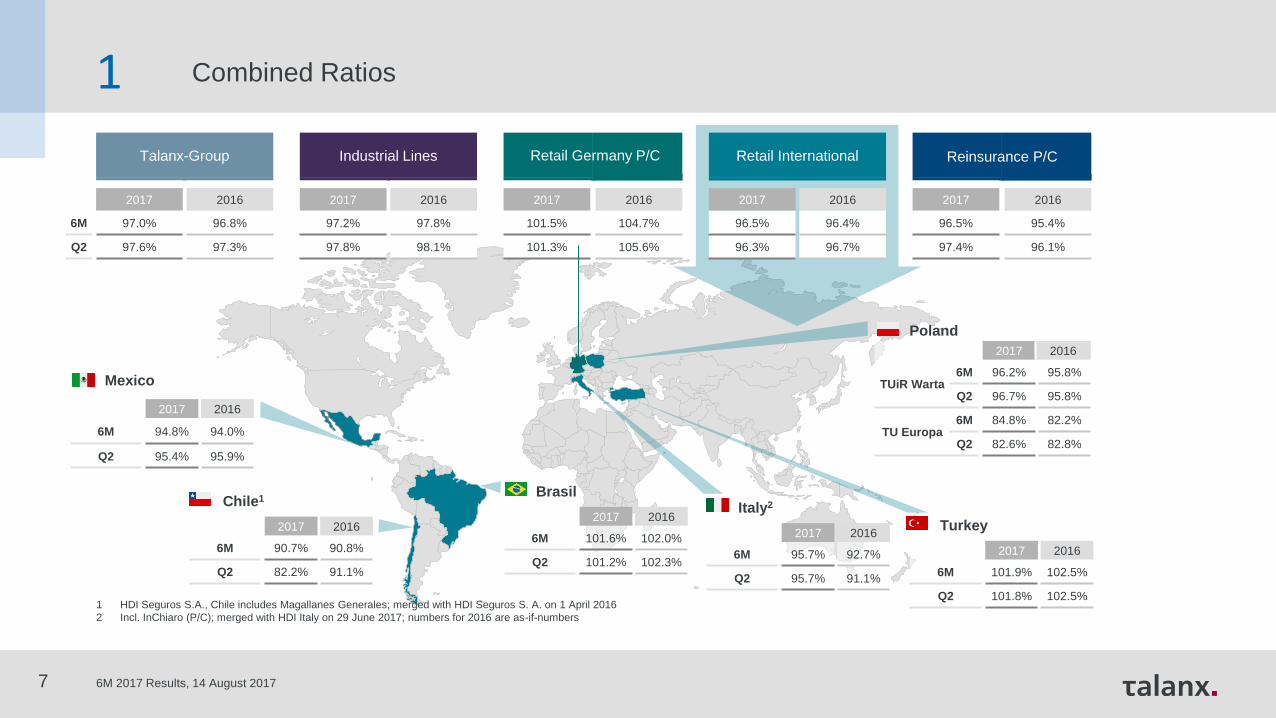
Combined Ratios
6M 2017 Results, 14 August 2017
Talanx-Group
2017 2016
97.0% 96.8%
97.6% 97.3%
6M
Q2
Industrial Lines
2017 2016
97.2% 97.8%
97.8% 98.1%
2017 2016
101.5% 104.7%
101.3% 105.6%
Retail International
2017 2016
96.5% 96.4%
96.3% 96.7%
2017 2016
96.5% 95.4%
97.4% 96.1%
2017 2016
TUiR Warta6M 96.2% 95.8%
Q2 96.7% 95.8%
TU Europa6M 84.8% 82.2%
Q2 82.6% 82.8%
Poland
Chile1
Mexico
1
Retail Germany P/C Reinsurance P/C
Turkey
Italy2
Brasil
2017 2016
6M 101.9% 102.5%
Q2 101.8% 102.5%
2017 2016
6M 95.7% 92.7%
Q2 95.7% 91.1%
2017 2016
6M 101.6% 102.0%
Q2 101.2% 102.3%
2017 2016
6M 90.7% 90.8%
Q2 82.2% 91.1%
2017 2016
6M 94.8% 94.0%
Q2 95.4% 95.9%
1 HDI Seguros S.A., Chile includes Magallanes Generales; merged with HDI Seguros S. A. on 1 April 2016
2 Incl. InChiaro (P/C); merged with HDI Italy on 29 June 2017; numbers for 2016 are as-if-numbers
Operating result (EBIT)
1,125
549
1,067
494
6M Q2
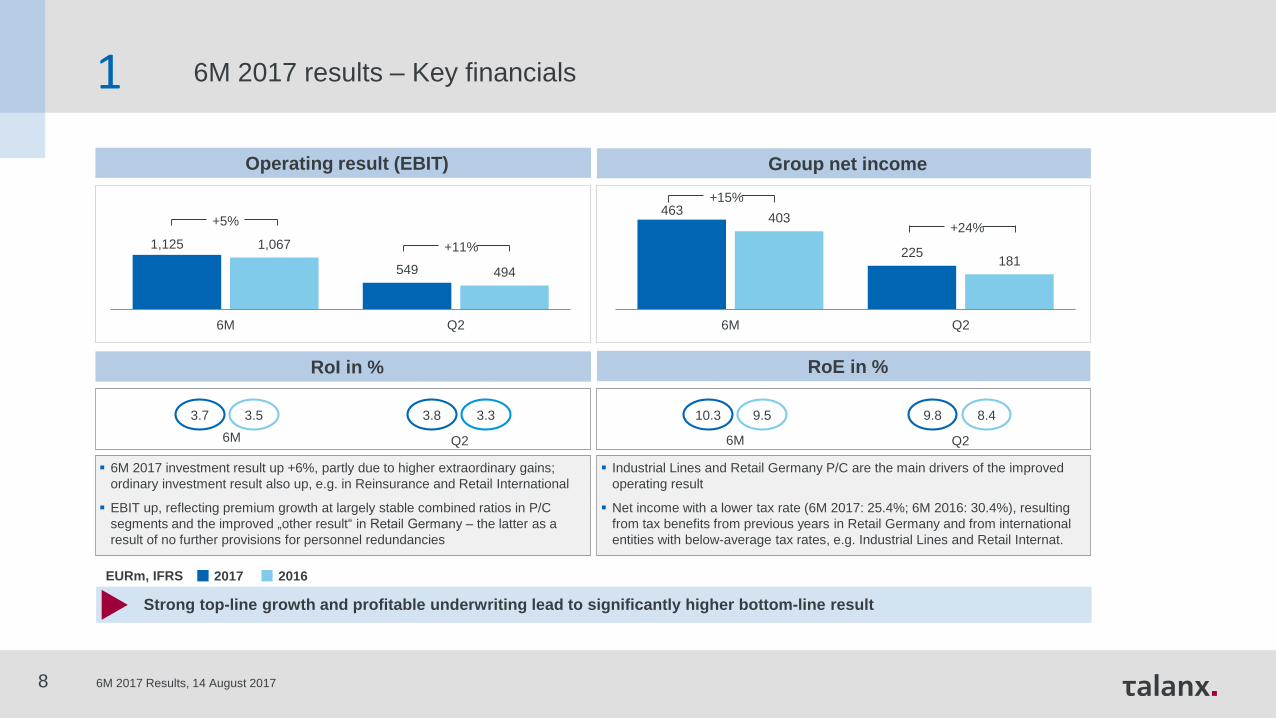
6M 2017 investment result up +6%, partly due to higher extraordinary gains;
ordinary investment result also up, e.g. in Reinsurance and Retail International
EBIT up, reflecting premium growth at largely stable combined ratios in P/C
segments and the improved „other result“ in Retail Germany – the latter as a
result of no further provisions for personnel redundancies
Group net income
6M
463
225
403
181
6M Q2
Industrial Lines and Retail Germany P/C are the main drivers of the improved
operating result
Net income with a lower tax rate (6M 2017: 25.4%; 6M 2016: 30.4%), resulting
from tax benefits from previous years in Retail Germany and from international
entities with below-average tax rates, e.g. Industrial Lines and Retail Internat.
6M 2017 Results, 14 August 20178
6M 2017 results – Key financials
Q2
3.7 3.5 3.8 3.3
6M Q2
10.3 9.89.5 8.4
RoI in % RoE in %
Strong top-line growth and profitable underwriting lead to significantly higher bottom-line result
+5%
+11%
+15%
+24%
1
2017EURm, IFRS 2016
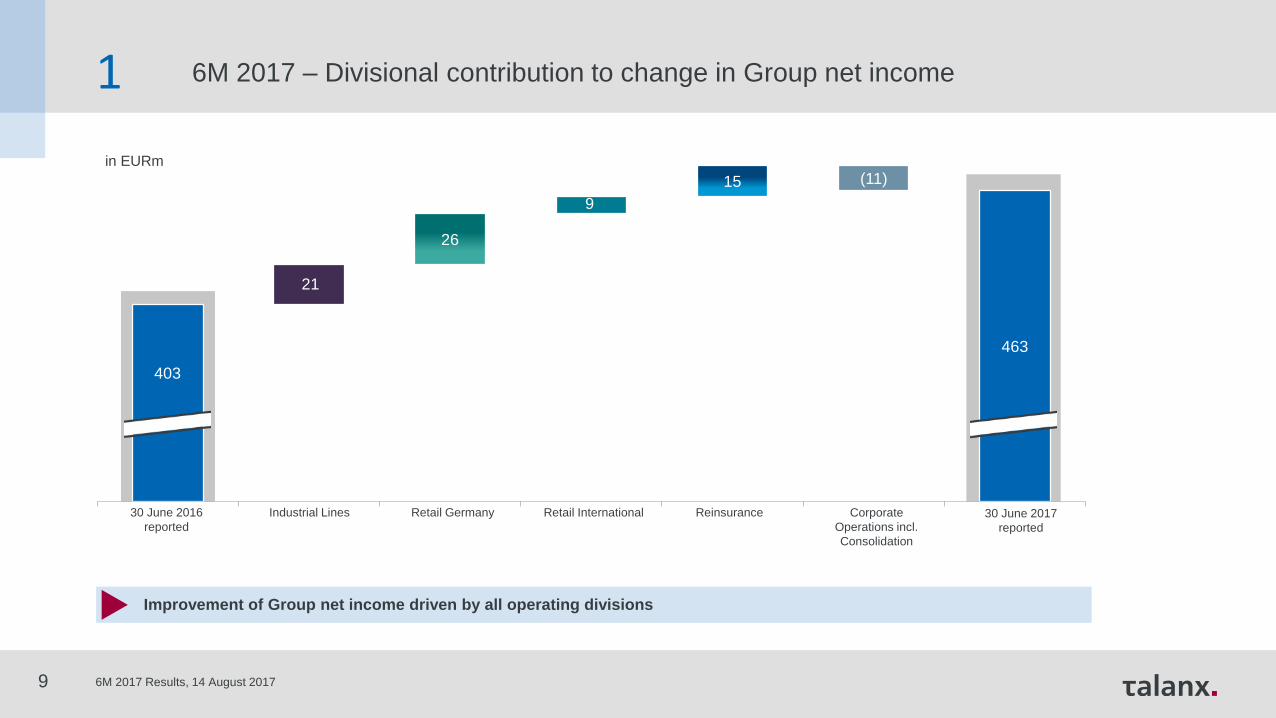
403
21
26
9
15 (11)
463
6M 2017 – Divisional contribution to change in Group net income
Industrial Lines Retail Germany Retail International Reinsurance Corporate
Operations incl.
Consolidation
30 June 2016
reported30 June 2017
reported
in EURm
6M 2017 Results, 14 August 20179
Improvement of Group net income driven by all operating divisions
1
6M 2017 Results, 14 August 201710
Agenda
Segments
Investments / Capital
Outlook
Appendix
Mid-term Target Matrix
Additional Information 6M 2017
Group Highlights12345
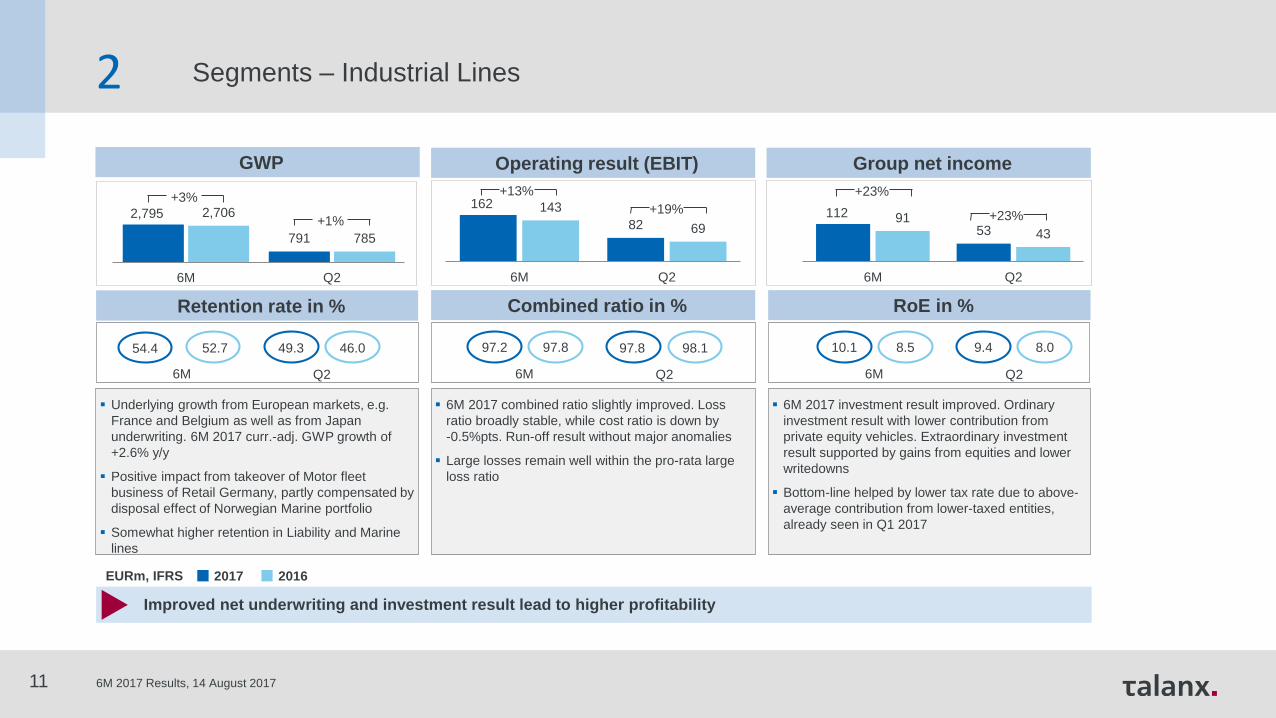
162
82
143
69
6M Q2
2,795
791
2,706
785
6M Q2
GWP Operating result (EBIT) Group net income
112
5391
43
6M Q2
Underlying growth from European markets, e.g.
France and Belgium as well as from Japan
underwriting. 6M 2017 curr.-adj. GWP growth of
+2.6% y/y
Positive impact from takeover of Motor fleet
business of Retail Germany, partly compensated by
disposal effect of Norwegian Marine portfolio
Somewhat higher retention in Liability and Marine
lines
6M 2017 combined ratio slightly improved. Loss
ratio broadly stable, while cost ratio is down by
-0.5%pts. Run-off result without major anomalies
Large losses remain well within the pro-rata large
loss ratio
6M 2017 investment result improved. Ordinary
investment result with lower contribution from
private equity vehicles. Extraordinary investment
result supported by gains from equities and lower
writedowns
Bottom-line helped by lower tax rate due to above-
average contribution from lower-taxed entities,
already seen in Q1 2017
Retention rate in % Combined ratio in % RoE in %
6M Q2
97.2 97.8
6M Q2
10.1 9.48.5 8.0
6M Q2
6M 2017 Results, 14 August 201711
Segments – Industrial Lines
54.4 52.7 49.3 46.0 97.8 98.1
Improved net underwriting and investment result lead to higher profitability
+3%
+1%
+13%
+19%
+23%
+23%
2
2017EURm, IFRS 2016
63
29
56
9
6M Q2
3,310
1,404
3,346
1,442
6M Q2
GWP Operating result (EBIT) Group net income
50 3124
-56M Q2
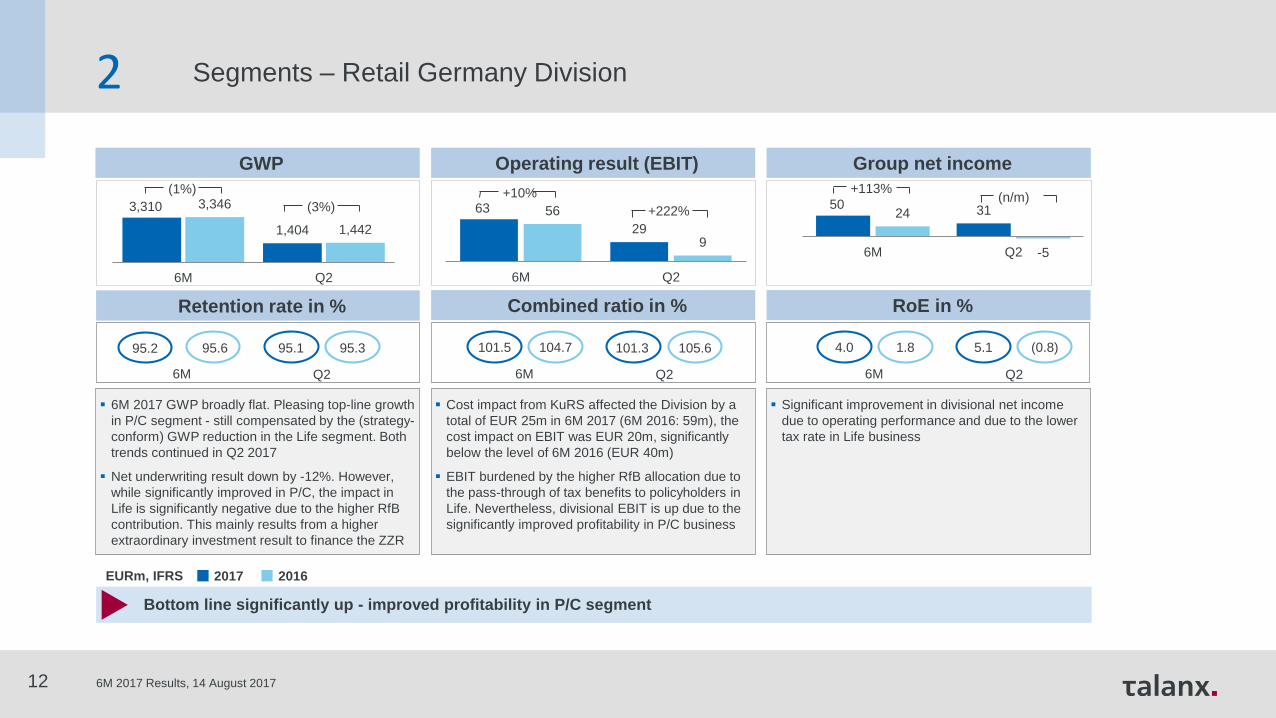
6M 2017 GWP broadly flat. Pleasing top-line growth
in P/C segment - still compensated by the (strategy-
conform) GWP reduction in the Life segment. Both
trends continued in Q2 2017
Net underwriting result down by -12%. However,
while significantly improved in P/C, the impact in
Life is significantly negative due to the higher RfB
contribution. This mainly results from a higher
extraordinary investment result to finance the ZZR
Cost impact from KuRS affected the Division by a
total of EUR 25m in 6M 2017 (6M 2016: 59m), the
cost impact on EBIT was EUR 20m, significantly
below the level of 6M 2016 (EUR 40m)
EBIT burdened by the higher RfB allocation due to
the pass-through of tax benefits to policyholders in
Life. Nevertheless, divisional EBIT is up due to the
significantly improved profitability in P/C business
Significant improvement in divisional net income
due to operating performance and due to the lower
tax rate in Life business
Retention rate in % Combined ratio in % RoE in %
6M Q2
101.5 104.7
6M Q2
4.0 5.11.8 (0.8)
6M Q2
6M 2017 Results, 14 August 201712
Segments – Retail Germany Division
95.2 95.6 95.1 95.3 101.3 105.6
Bottom line significantly up - improved profitability in P/C segment
(1%)
(3%)+10%
+222%
+113%(n/m)
2
2017EURm, IFRS 2016
22 9
(17) (22)
6M Q2
1,002
243
980
231
6M Q2
GWP Operating result (EBIT)Investment income
4419
4725
6M Q2
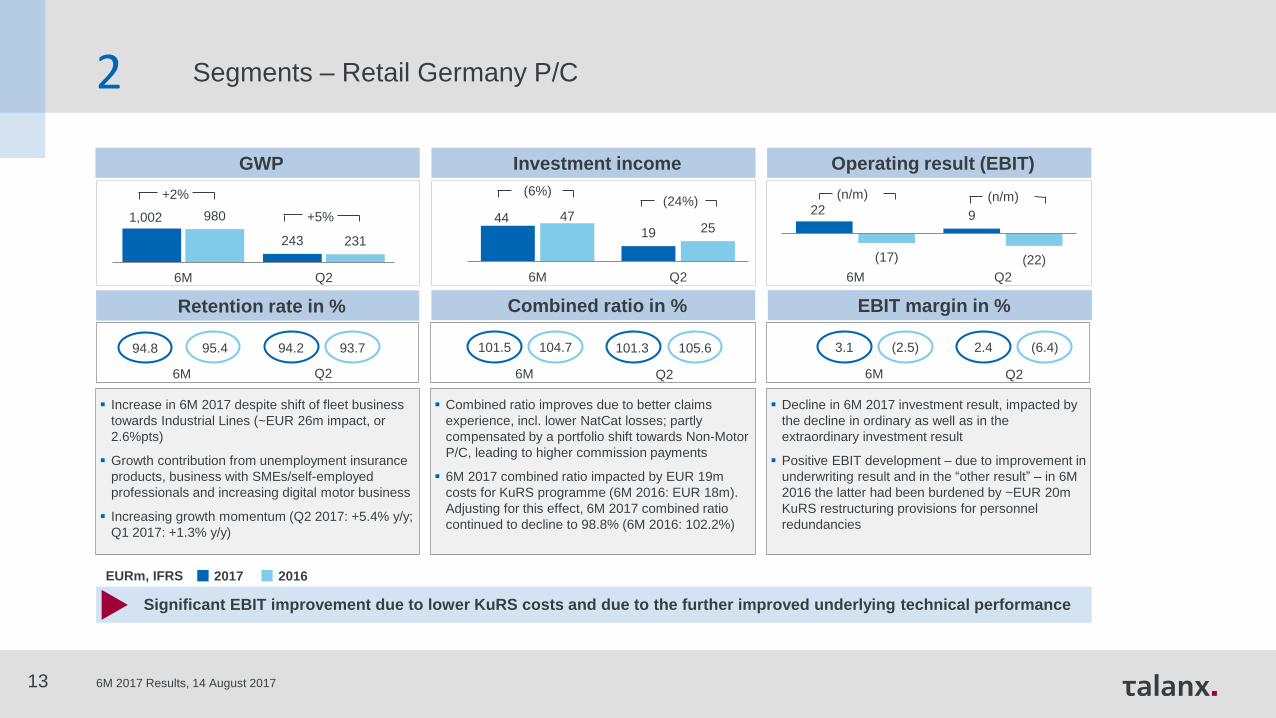
Increase in 6M 2017 despite shift of fleet business
towards Industrial Lines (~EUR 26m impact, or
2.6%pts)
Growth contribution from unemployment insurance
products, business with SMEs/self-employed
professionals and increasing digital motor business
Increasing growth momentum (Q2 2017: +5.4% y/y;
Q1 2017: +1.3% y/y)
Combined ratio improves due to better claims
experience, incl. lower NatCat losses; partly
compensated by a portfolio shift towards Non-Motor
P/C, leading to higher commission payments
6M 2017 combined ratio impacted by EUR 19m
costs for KuRS programme (6M 2016: EUR 18m).
Adjusting for this effect, 6M 2017 combined ratio
continued to decline to 98.8% (6M 2016: 102.2%)
Decline in 6M 2017 investment result, impacted by
the decline in ordinary as well as in the
extraordinary investment result
Positive EBIT development – due to improvement in
underwriting result and in the “other result” – in 6M
2016 the latter had been burdened by ~EUR 20m
KuRS restructuring provisions for personnel
redundancies
Retention rate in % Combined ratio in % EBIT margin in %
6M Q2
101.5 104.7
6M Q2
3.1 2.4(2.5) (6.4)
6M Q2
6M 2017 Results, 14 August 201713
Segments – Retail Germany P/C
94.8 95.4 94.2 93.7 101.3 105.6
Significant EBIT improvement due to lower KuRS costs and due to the further improved underlying technical performance
+2%
+5%
(n/m) (n/m)(6%)(24%)
2
2017EURm, IFRS 2016
4120
73
31
6M Q2
2,3081,161
2,3661,211
6M Q2
GWP Operating result (EBIT)Investment income
951516
890
377
6M Q2
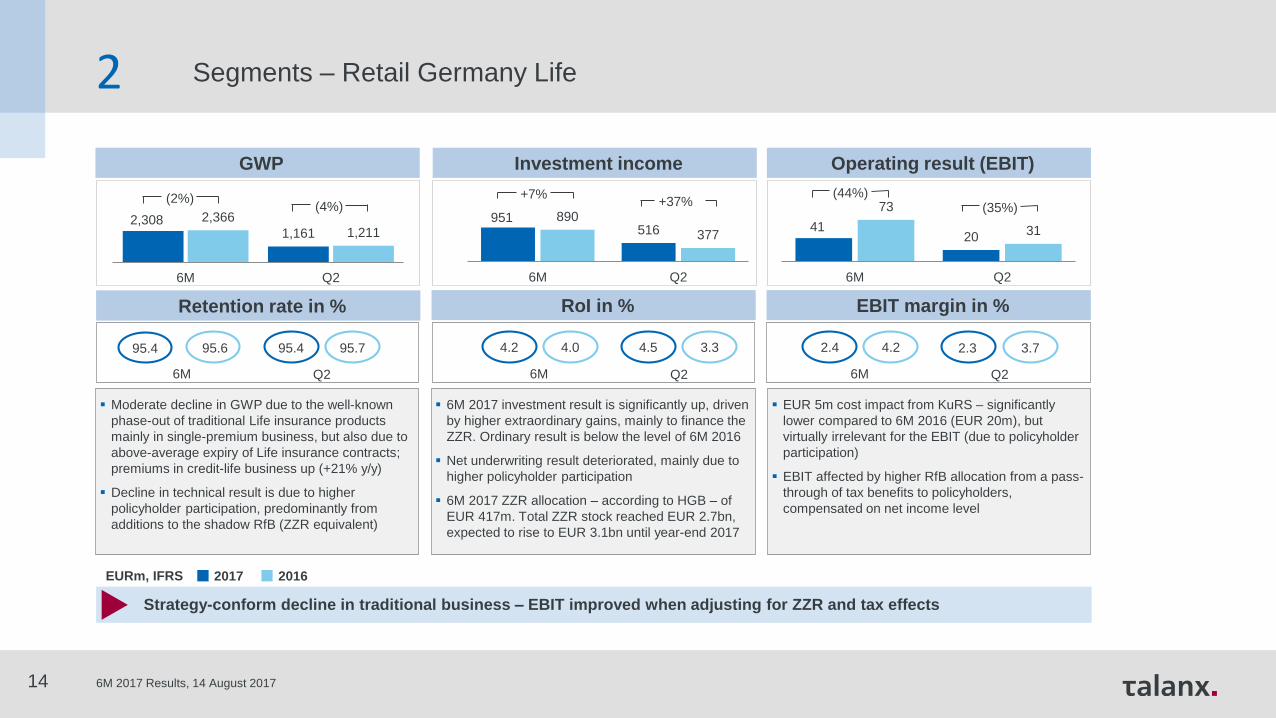
Moderate decline in GWP due to the well-known
phase-out of traditional Life insurance products
mainly in single-premium business, but also due to
above-average expiry of Life insurance contracts;
premiums in credit-life business up (+21% y/y)
Decline in technical result is due to higher
policyholder participation, predominantly from
additions to the shadow RfB (ZZR equivalent)
6M 2017 investment result is significantly up, driven
by higher extraordinary gains, mainly to finance the
ZZR. Ordinary result is below the level of 6M 2016
Net underwriting result deteriorated, mainly due to
higher policyholder participation
6M 2017 ZZR allocation – according to HGB – of
EUR 417m. Total ZZR stock reached EUR 2.7bn,
expected to rise to EUR 3.1bn until year-end 2017
EUR 5m cost impact from KuRS – significantly
lower compared to 6M 2016 (EUR 20m), but
virtually irrelevant for the EBIT (due to policyholder
participation)
EBIT affected by higher RfB allocation from a pass-
through of tax benefits to policyholders,
compensated on net income level
Retention rate in % EBIT margin in %RoI in %
6M Q2
2.4 4.2
6M Q2
4.2 4.54.0 3.3
6M Q2
6M 2017 Results, 14 August 201714
Segments – Retail Germany Life
95.4 95.6 95.4 95.7 2.3 3.7
Strategy-conform decline in traditional business – EBIT improved when adjusting for ZZR and tax effects
(2%)(4%)
(44%)(35%)
+7%+37%
2
2017EURm, IFRS 2016
116
53
107
46
6M Q2
2,828
1,3452,487
1,339
6M Q2
GWP Operating result (EBIT) Group net income
74
34
65
29
6M Q2
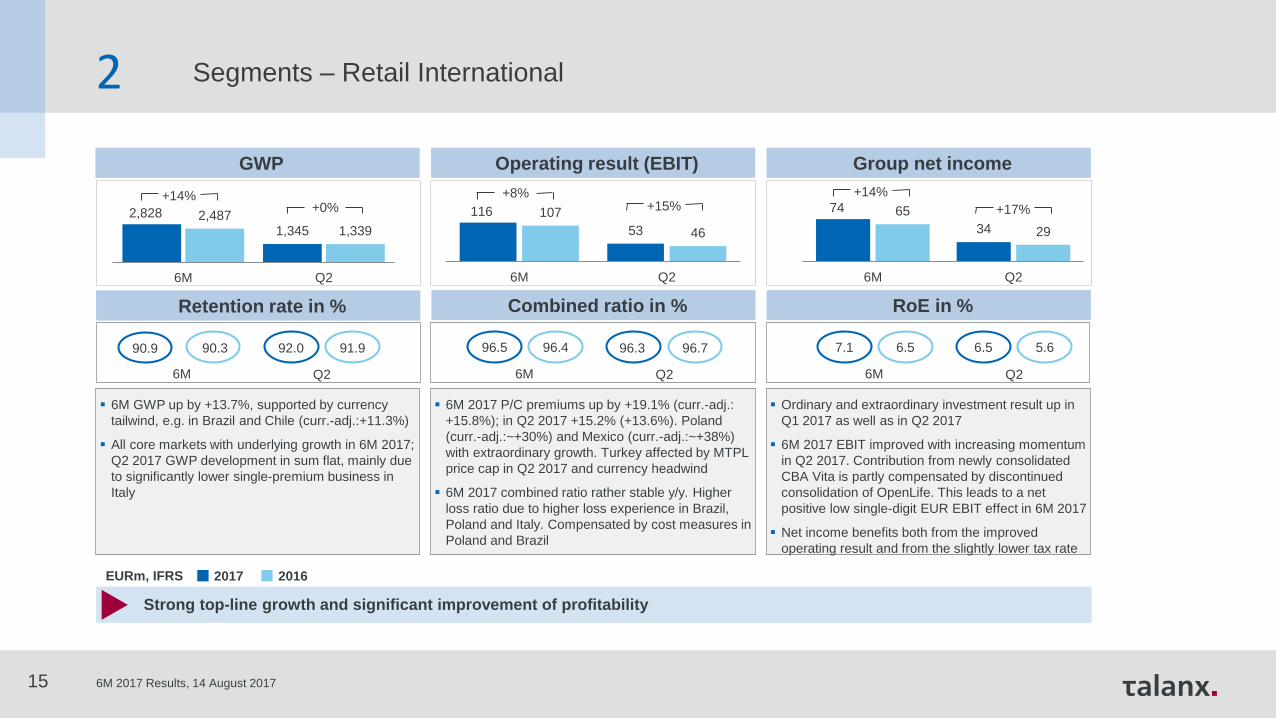
6M GWP up by +13.7%, supported by currency
tailwind, e.g. in Brazil and Chile (curr.-adj.:+11.3%)
All core markets with underlying growth in 6M 2017;
Q2 2017 GWP development in sum flat, mainly due
to significantly lower single-premium business in
Italy
6M 2017 P/C premiums up by +19.1% (curr.-adj.:
+15.8%); in Q2 2017 +15.2% (+13.6%). Poland
(curr.-adj.:~+30%) and Mexico (curr.-adj.:~+38%)
with extraordinary growth. Turkey affected by MTPL
price cap in Q2 2017 and currency headwind
6M 2017 combined ratio rather stable y/y. Higher
loss ratio due to higher loss experience in Brazil,
Poland and Italy. Compensated by cost measures in
Poland and Brazil
Ordinary and extraordinary investment result up in
Q1 2017 as well as in Q2 2017
6M 2017 EBIT improved with increasing momentum
in Q2 2017. Contribution from newly consolidated
CBA Vita is partly compensated by discontinued
consolidation of OpenLife. This leads to a net
positive low single-digit EUR EBIT effect in 6M 2017
Net income benefits both from the improved
operating result and from the slightly lower tax rate
Retention rate in % Combined ratio in % RoE in %
6M Q2
96.5 96.4
6M Q2
7.1 6.56.5 5.6
6M Q2
6M 2017 Results, 14 August 201715
Segments – Retail International
90.9 90.3 92.0 91.9 96.3 96.7
Strong top-line growth and significant improvement of profitability
+14%+0%
+8%+15%
+14%
+17%
2
2017EURm, IFRS 2016
800
399
756
343
6M Q2
8,998
4,451
8,283
4,020
6M Q2
GWP Operating result (EBIT) Group net income
266
134
251
109
6M Q2
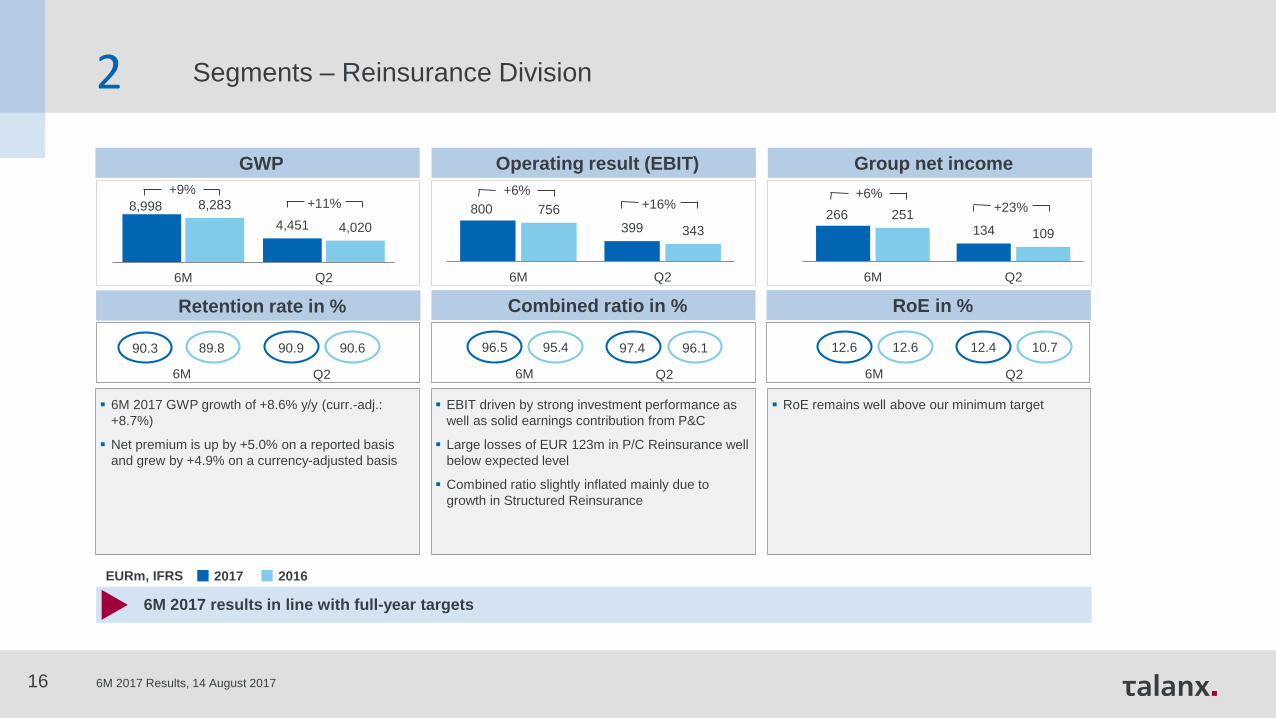
6M 2017 GWP growth of +8.6% y/y (curr.-adj.:
+8.7%)
Net premium is up by +5.0% on a reported basis
and grew by +4.9% on a currency-adjusted basis
EBIT driven by strong investment performance as
well as solid earnings contribution from P&C
Large losses of EUR 123m in P/C Reinsurance well
below expected level
Combined ratio slightly inflated mainly due to
growth in Structured Reinsurance
RoE remains well above our minimum target
Retention rate in % Combined ratio in % RoE in %
6M Q2
96.5 95.4
6M Q2
12.6 12.412.6 10.7
6M Q2
6M 2017 Results, 14 August 201716
Segments – Reinsurance Division
90.3 89.8 90.9 90.6 97.4 96.1
6M 2017 results in line with full-year targets
+9%+11%
+6%+16%
+6%+23%
2
2017EURm, IFRS 2016
6M 2017 Results, 14 August 201717
Agenda
Segments
Investments / Capital
Outlook
Appendix
Mid-term Target Matrix
Additional Information 6M 2017
Group Highlights12345
Net investment income
18
Net investment income Talanx Group Comments
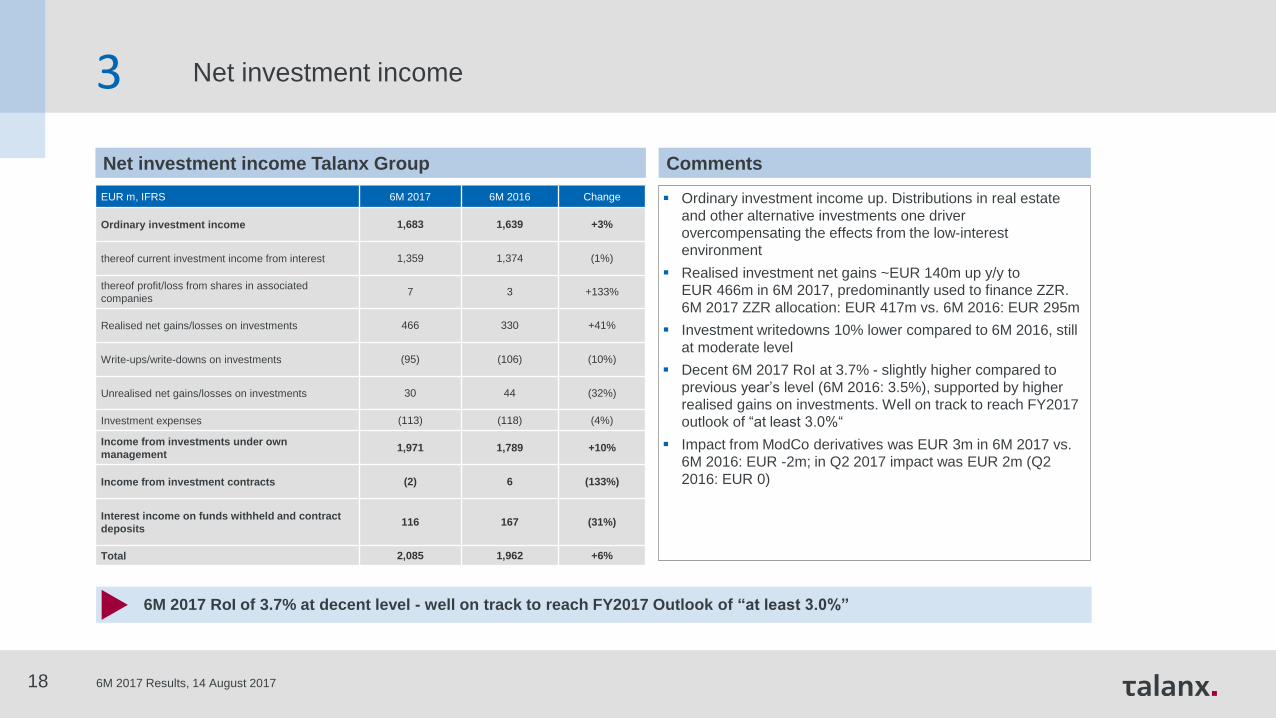
Ordinary investment income up. Distributions in real estate
and other alternative investments one driver
overcompensating the effects from the low-interest
environment
Realised investment net gains ~EUR 140m up y/y to
EUR 466m in 6M 2017, predominantly used to finance ZZR.
6M 2017 ZZR allocation: EUR 417m vs. 6M 2016: EUR 295m
Investment writedowns 10% lower compared to 6M 2016, still
at moderate level
Decent 6M 2017 RoI at 3.7% - slightly higher compared to
previous year’s level (6M 2016: 3.5%), supported by higher
realised gains on investments. Well on track to reach FY2017
outlook of “at least 3.0%“
Impact from ModCo derivatives was EUR 3m in 6M 2017 vs.
6M 2016: EUR -2m; in Q2 2017 impact was EUR 2m (Q2
2016: EUR 0)
EUR m, IFRS 6M 2017 6M 2016 Change
Ordinary investment income 1,683 1,639 +3%
thereof current investment income from interest 1,359 1,374 (1%)
thereof profit/loss from shares in associated
companies7 3 +133%
Realised net gains/losses on investments 466 330 +41%
Write-ups/write-downs on investments (95) (106) (10%)
Unrealised net gains/losses on investments 30 44 (32%)
Investment expenses (113) (118) (4%)
Income from investments under own
management1,971 1,789 +10%
Income from investment contracts (2) 6 (133%)
Interest income on funds withheld and contract
deposits116 167 (31%)
Total 2,085 1,962 +6%
6M 2017 Results, 14 August 2017
6M 2017 RoI of 3.7% at decent level - well on track to reach FY2017 Outlook of “at least 3.0%”
3
8.5 8.7 9.0 9.1 9.4 9.0
5.3 5.35.5 5.6
5.85.4
1.9 2.02.0 2.0
2.02.0
15.8 16.016.5 16.7 16.3
31 Mar 16 30 June 16 30 Sep 16 31 Dec 16 31 Mar 17 30 June 17
19
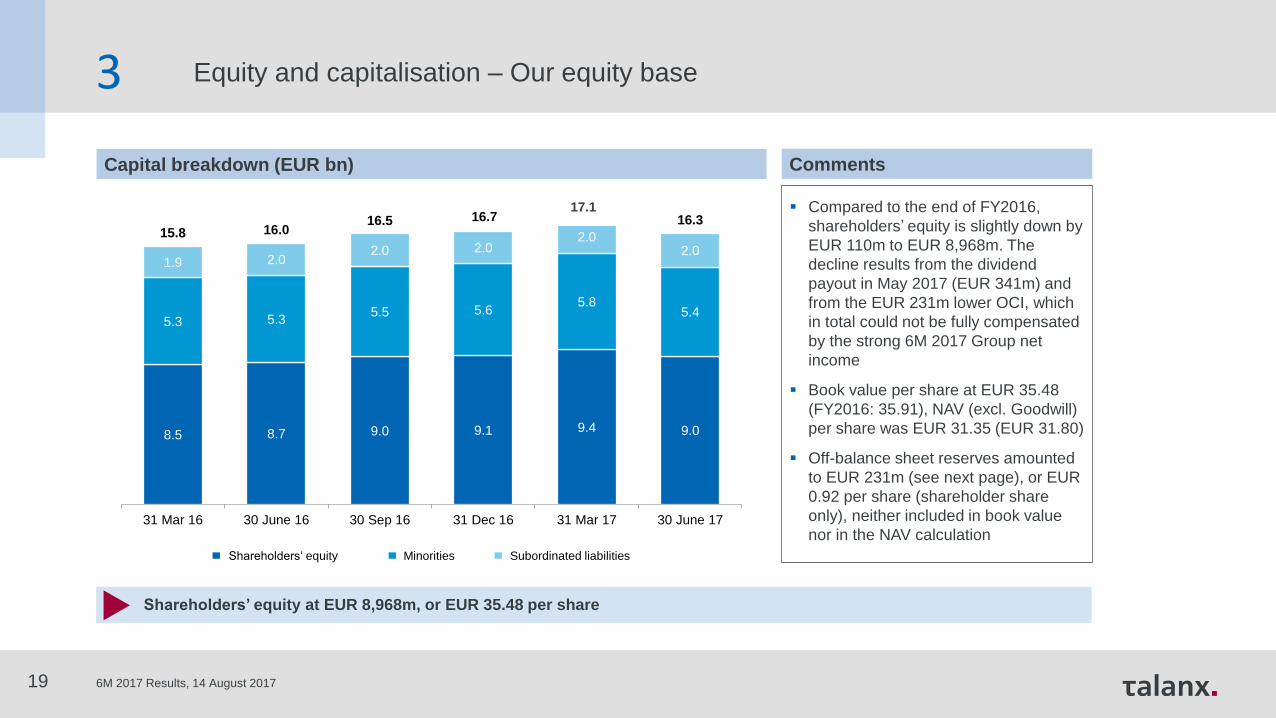
Capital breakdown (EUR bn)
Compared to the end of FY2016,
shareholders’ equity is slightly down by
EUR 110m to EUR 8,968m. The
decline results from the dividend
payout in May 2017 (EUR 341m) and
from the EUR 231m lower OCI, which
in total could not be fully compensated
by the strong 6M 2017 Group net
income
Book value per share at EUR 35.48
(FY2016: 35.91), NAV (excl. Goodwill)
per share was EUR 31.35 (EUR 31.80)
Off-balance sheet reserves amounted
to EUR 231m (see next page), or EUR
0.92 per share (shareholder share
only), neither included in book value
nor in the NAV calculation
Shareholders‘ equity Minorities Subordinated liabilities
Comments
6M 2017 Results, 14 August 2017
17.1
Shareholders’ equity at EUR 8,968m, or EUR 35.48 per share
Equity and capitalisation – Our equity base3
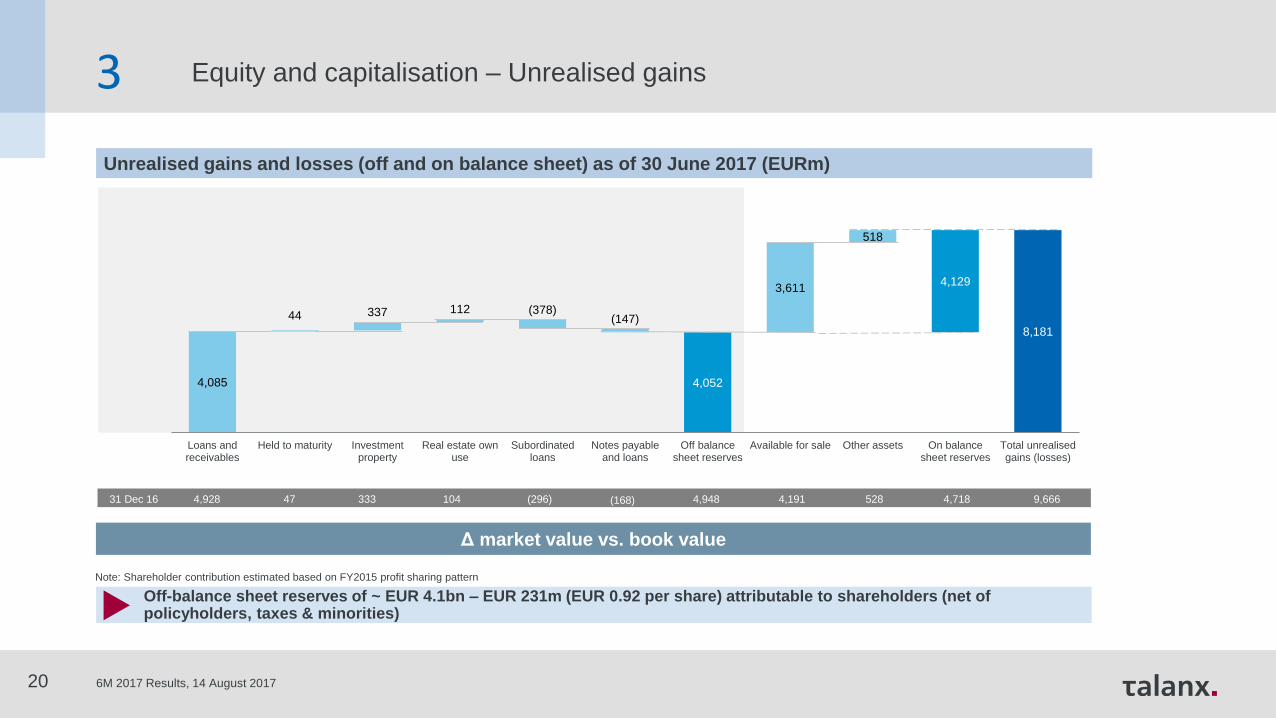
4,085
44 337 112 (378)(147)
4,052
3,611
518
4,129
8,181
Loans andreceivables
Held to maturity Investmentproperty
Real estate ownuse
Subordinatedloans
Notes payableand loans
Off balancesheet reserves
Available for sale Other assets On balancesheet reserves
Total unrealisedgains (losses)
Δ market value vs. book value
31 Dec 16 4,928 33347 104 (296) 4,948 4,191 528 4,718 9,666(168)
Unrealised gains and losses (off and on balance sheet) as of 30 June 2017 (EURm)
Note: Shareholder contribution estimated based on FY2015 profit sharing pattern
6M 2017 Results, 14 August 201720
Equity and capitalisation – Unrealised gains
Off-balance sheet reserves of ~ EUR 4.1bn – EUR 231m (EUR 0.92 per share) attributable to shareholders (net ofpolicyholders, taxes & minorities)
3
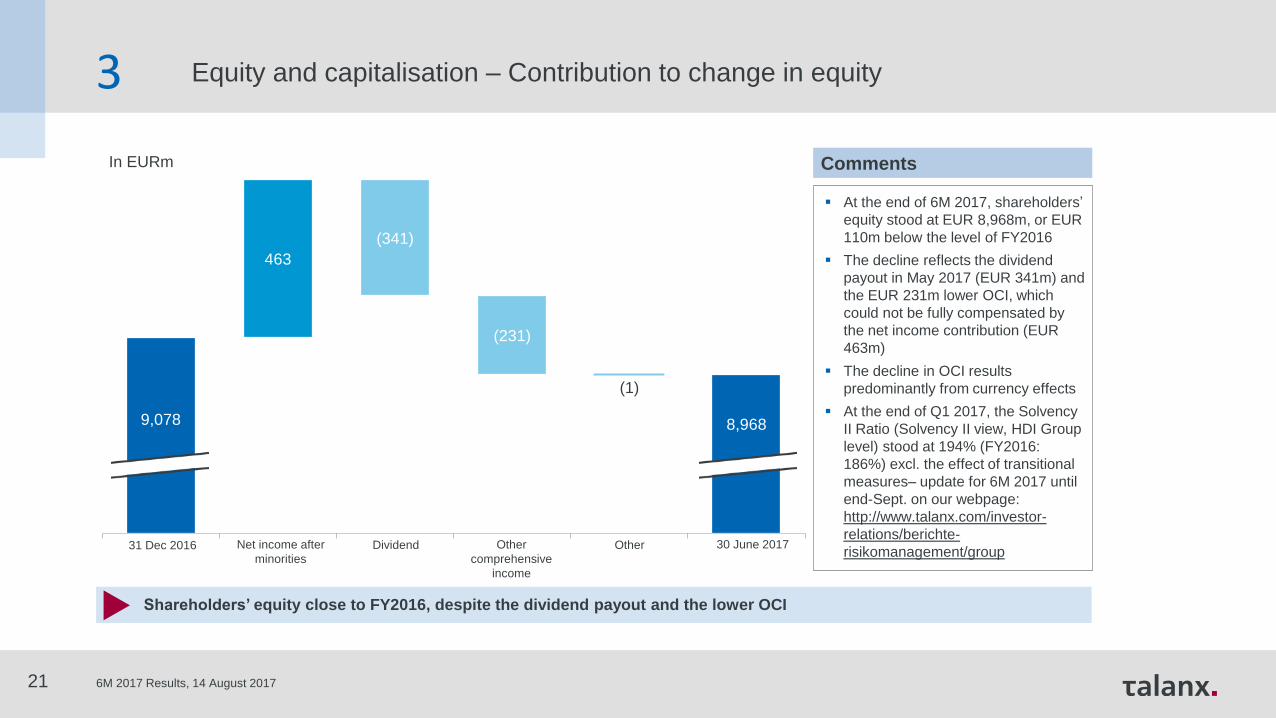
Equity and capitalisation – Contribution to change in equity
9,078
463
(341)
(231)
(1)
8,968
Comments
At the end of 6M 2017, shareholders’
equity stood at EUR 8,968m, or EUR
110m below the level of FY2016
The decline reflects the dividend
payout in May 2017 (EUR 341m) and
the EUR 231m lower OCI, which
could not be fully compensated by
the net income contribution (EUR
463m)
The decline in OCI results
predominantly from currency effects
At the end of Q1 2017, the Solvency
II Ratio (Solvency II view, HDI Group
level) stood at 194% (FY2016:
186%) excl. the effect of transitional
measures– update for 6M 2017 until
end-Sept. on our webpage:
http://www.talanx.com/investor-
relations/berichte-
risikomanagement/group Net income after
minorities
Other
comprehensive
income
30 June 2017
In EURm
31 Dec 2016
6M 2017 Results, 14 August 201721
Shareholders’ equity close to FY2016, despite the dividend payout and the lower OCI
3
OtherDividend
6M 2017 Results, 14 August 201722
Agenda
Segments
Investments / Capital
Outlook
Appendix
Mid-term Target Matrix
Additional Information 6M 2017
Group Highlights12345
23
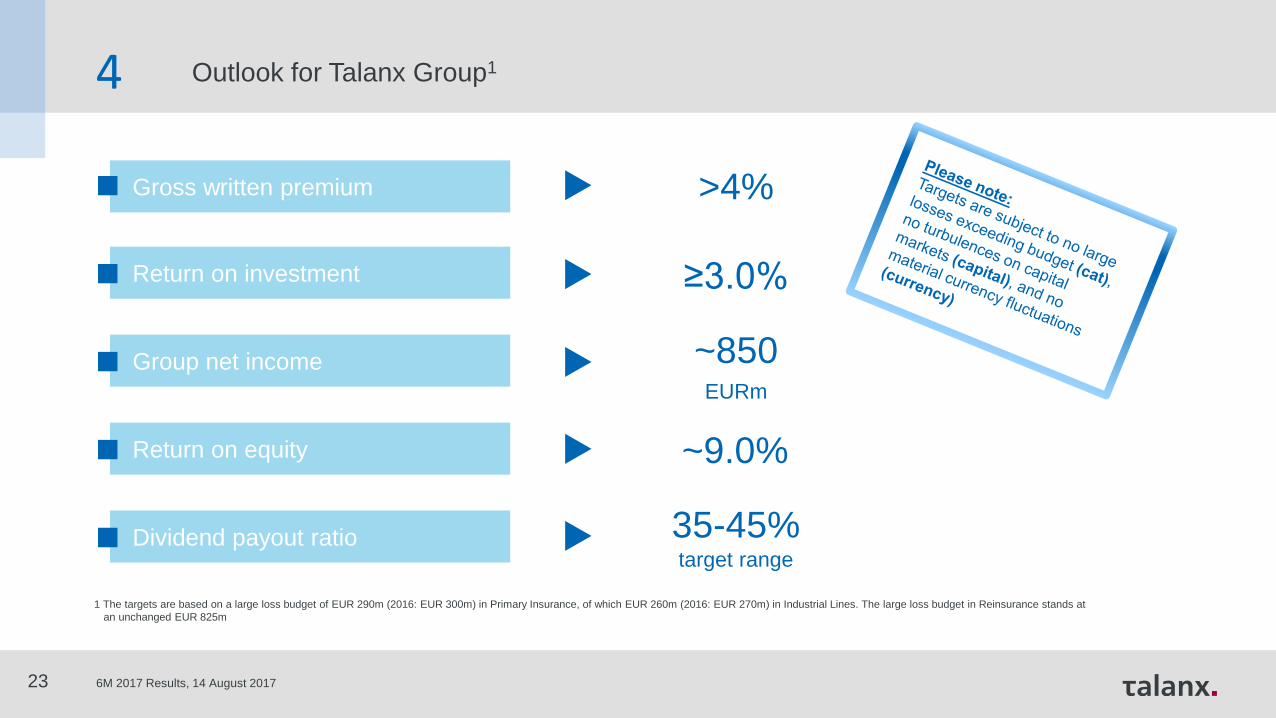
Outlook for Talanx Group1
6M 2017 Results, 14 August 2017
Group net income
Return on investment
Gross written premium
Return on equity
Dividend payout ratio
>4%
≥3.0%
~850EURm
~9.0%
35-45% target range
4
1 The targets are based on a large loss budget of EUR 290m (2016: EUR 300m) in Primary Insurance, of which EUR 260m (2016: EUR 270m) in Industrial Lines. The large loss budget in Reinsurance stands at
an unchanged EUR 825m
6M 2017 Results, 14 August 201724
Agenda
Segments
Investments / Capital
Outlook
Appendix
Mid-term Target Matrix
Additional Information 6M 2017
Group Highlights12345
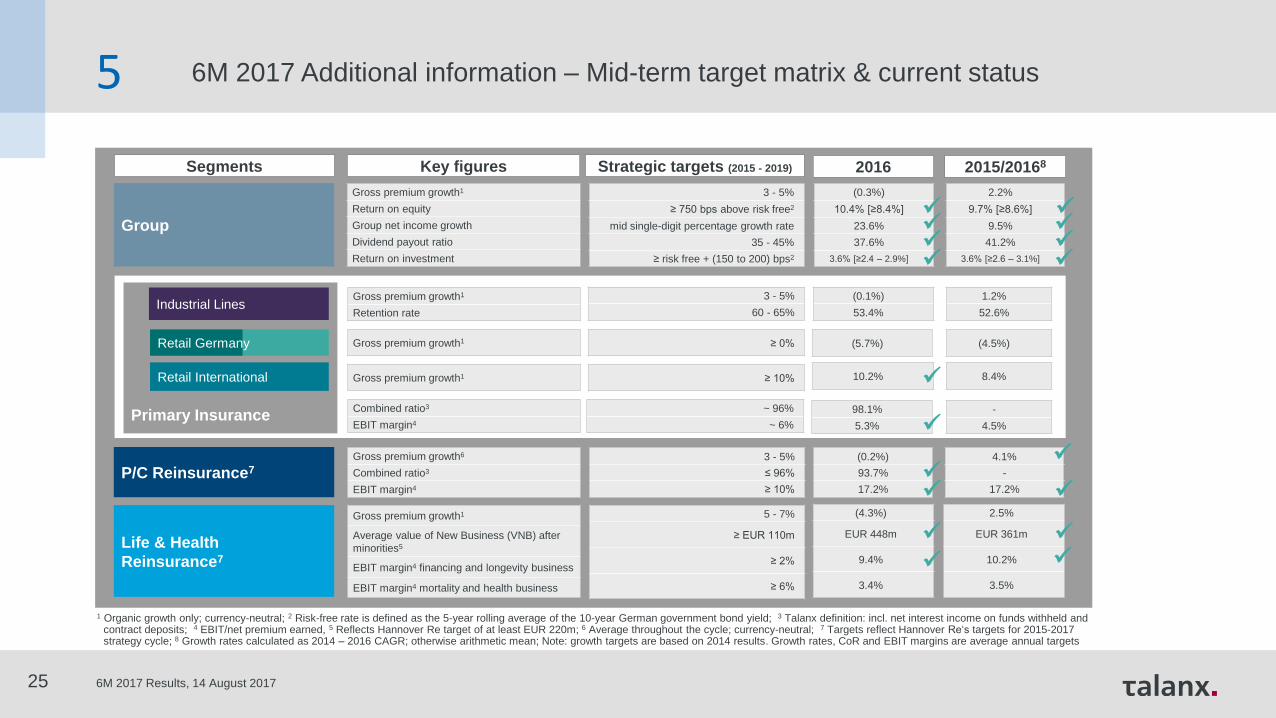
6M 2017 Additional information – Mid-term target matrix & current status
1 Organic growth only; currency-neutral; 2 Risk-free rate is defined as the 5-year rolling average of the 10-year German government bond yield; 3 Talanx definition: incl. net interest income on funds withheld and contract deposits; 4 EBIT/net premium earned, 5 Reflects Hannover Re target of at least EUR 220m; 6 Average throughout the cycle; currency-neutral; 7 Targets reflect Hannover Re‘s targets for 2015-2017 strategy cycle; 8 Growth rates calculated as 2014 – 2016 CAGR; otherwise arithmetic mean; Note: growth targets are based on 2014 results. Growth rates, CoR and EBIT margins are average annual targets
Group
Primary Insurance
P/C Reinsurance7
Life & Health
Reinsurance7
Segments
Gross premium growth1
Return on equity
Group net income growth
Dividend payout ratio
Return on investment
3 - 5%
≥ 750 bps above risk free2
mid single-digit percentage growth rate
35 - 45%
≥ risk free + (150 to 200) bps2
Key figures Strategic targets (2015 - 2019)
Gross premium growth1
Retention rate
Gross premium growth1
Gross premium growth1
Combined ratio3
EBIT margin4
Gross premium growth6
Combined ratio3
EBIT margin4
3 - 5%
60 - 65%
≥ 0%
≥ 10%
~ 96%
~ 6%
3 - 5%
≤ 96%
≥ 10%
Gross premium growth1
Average value of New Business (VNB) after
minorities5
EBIT margin4 financing and longevity business
EBIT margin4 mortality and health business
5 - 7%
≥ EUR 110m
≥ 2%
≥ 6%
Industrial Lines
Retail Germany
Retail International
6M 2017 Results, 14 August 2017
2016 2015/20168
(0.3%)
10.4% [≥8.4%]
23.6%
37.6%
3.6% [≥2.4 – 2.9%]
2.2%
9.7% [≥8.6%]
9.5%
41.2%
3.6% [≥2.6 – 3.1%]
(0.1%)
53.4%
1.2%
52.6%
(5.7%) (4.5%)
10.2% 8.4%
98.1%
5.3%
-
4.5%
(0.2%)
93.7%
17.2%
4.1%
-
17.2%
(4.3%)
EUR 448m
9.4%
3.4%
2.5%
EUR 361m
10.2%
3.5%
25
5
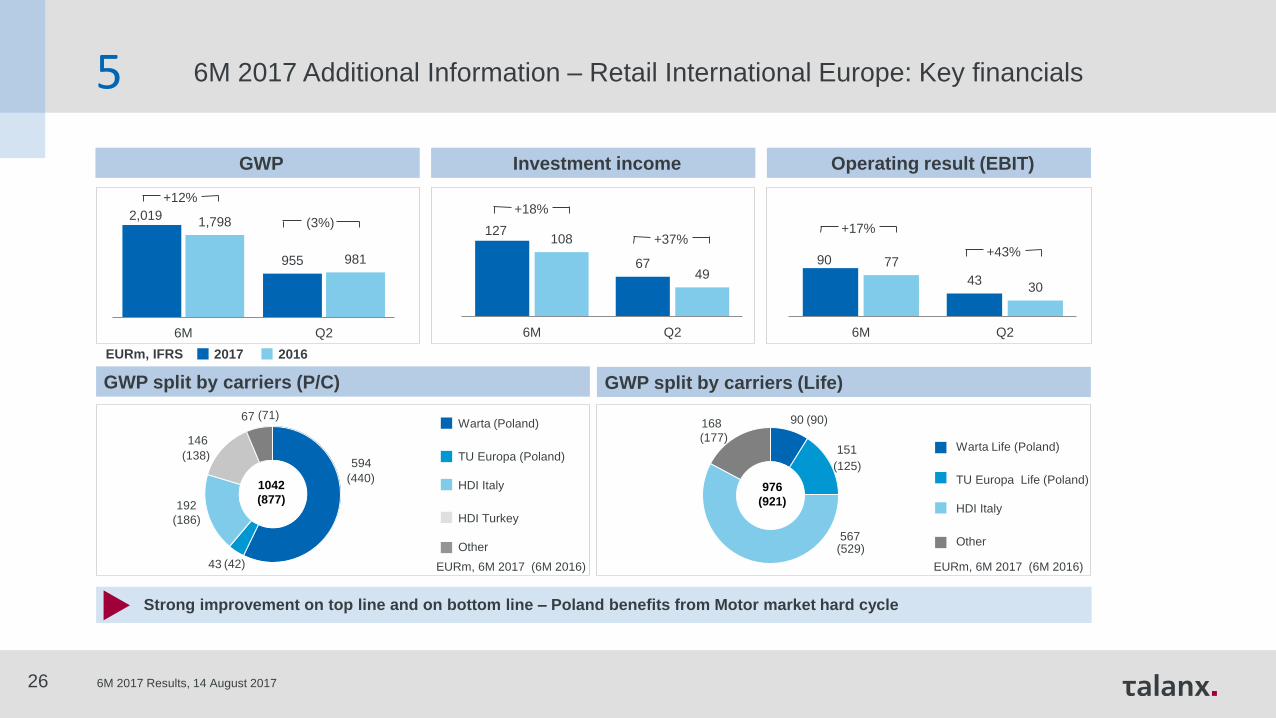
90
43
77
30
6M Q2
2,019
955
1,798
981
6M Q2
Strong improvement on top line and on bottom line – Poland benefits from Motor market hard cycle
90
151
567
168
976
(921)
594
43
192
146
67
1042
(877)
6M 2017 Additional Information – Retail International Europe: Key financials
Warta (Poland)
TU Europa (Poland)
HDI Italy
HDI Turkey
Other
Warta Life (Poland)
TU Europa Life (Poland)
HDI Italy
Other
(71)
(440)
(138)
(186)
(125)
(90)
(177)
6M 2017 Results, 14 August 201726
GWP split by carriers (P/C) GWP split by carriers (Life)
(42)
(529)
GWP Operating result (EBIT)Investment income
127
67
108
49
6M Q2
5
+12%
(3%) +17%
+43%
+18%
+37%
EURm, 6M 2017 (6M 2016)EURm, 6M 2017 (6M 2016)
2017EURm, IFRS 2016
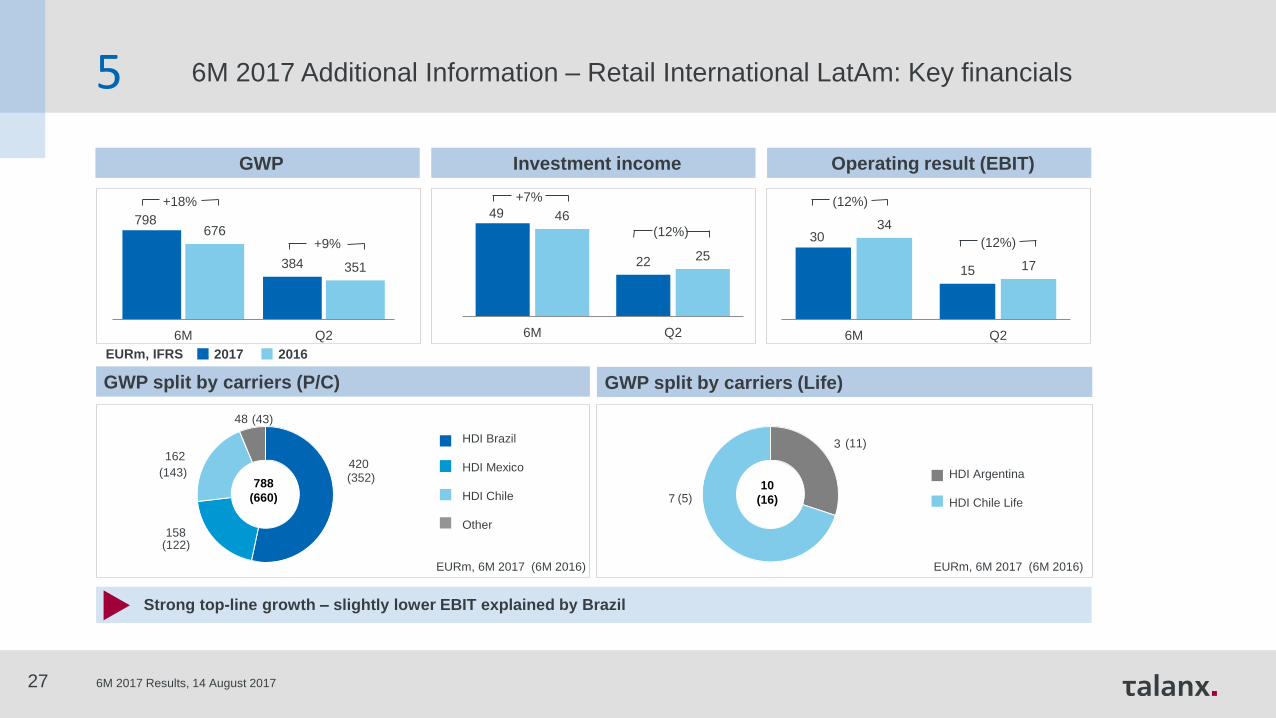
6M 2017 Additional Information – Retail International LatAm: Key financials
30
15
34
17
6M Q2
GWP split by carriers (P/C)
420
158
162
48
788
(660)
3
710
(16)
HDI Argentina
HDI Chile Life
HDI Brazil
HDI Mexico
HDI Chile
Other
(43)
(352)
(122)
(143)
(11)
(5)
6M 2017 Results, 14 August 201727
Strong top-line growth – slightly lower EBIT explained by Brazil
798
384
676
351
6M Q2
GWP Operating result (EBIT)Investment income
49
22
46
25
6M Q2
GWP split by carriers (Life)
5
+18%
+9%
(12%)
(12%)
+7%
(12%)
EURm, 6M 2017 (6M 2016)EURm, 6M 2017 (6M 2016)
2017EURm, IFRS 2016
6M 2017 Results, 14 August 201728
6M 2017 Additional Information – Segment P/C Reinsurance5
644
329
582
272
6M Q2
5,428
2,6134,627
2,125
6M Q2
GWP Operating result (EBIT)Investment income
490240
431218
6M Q2
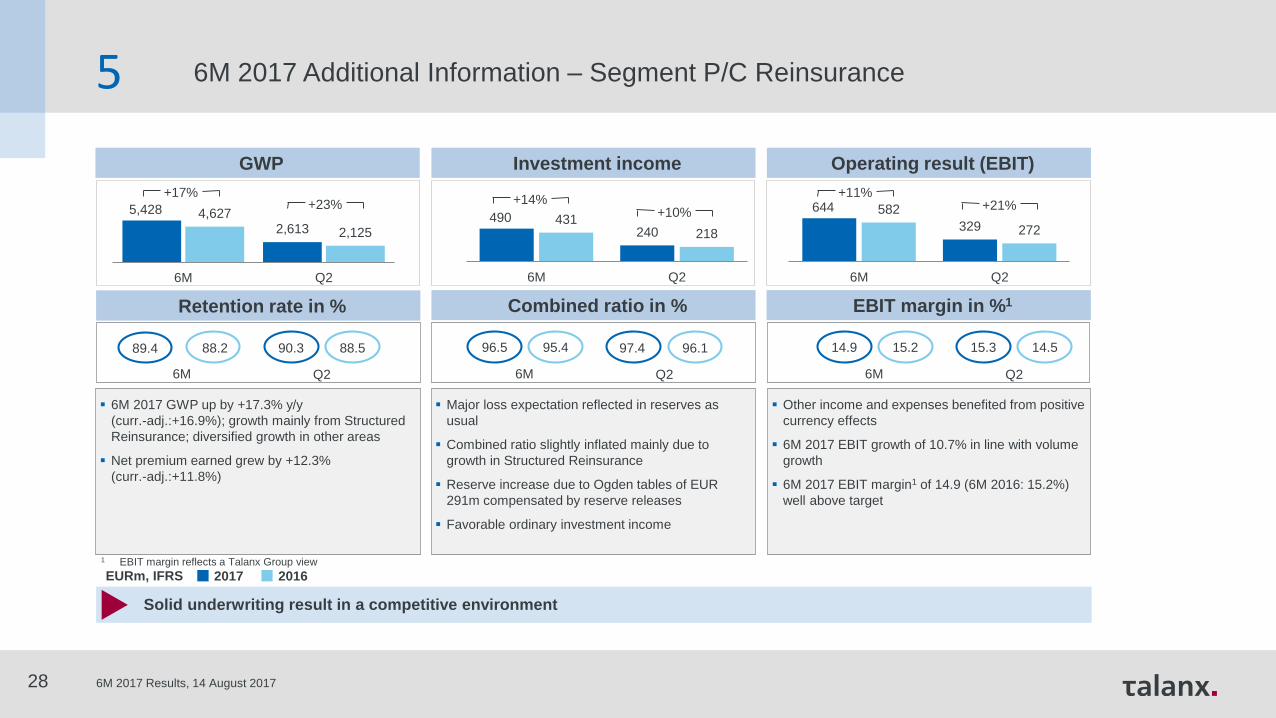
6M 2017 GWP up by +17.3% y/y
(curr.-adj.:+16.9%); growth mainly from Structured
Reinsurance; diversified growth in other areas
Net premium earned grew by +12.3%
(curr.-adj.:+11.8%)
Major loss expectation reflected in reserves as
usual
Combined ratio slightly inflated mainly due to
growth in Structured Reinsurance
Reserve increase due to Ogden tables of EUR
291m compensated by reserve releases
Favorable ordinary investment income
Other income and expenses benefited from positive
currency effects
6M 2017 EBIT growth of 10.7% in line with volume
growth
6M 2017 EBIT margin1 of 14.9 (6M 2016: 15.2%)
well above target
Retention rate in % Combined ratio in % EBIT margin in %1
6M Q2
96.5 95.4
6M Q2
14.9 15.315.2 14.5
6M Q2
89.4 88.2 90.3 88.5 97.4 96.1
Solid underwriting result in a competitive environment
+17%+23%
+11%+21%+14%
+10%
1 EBIT margin reflects a Talanx Group view
2017EURm, IFRS 2016
6M 2017 Results, 14 August 201729
6M 2017 Additional Information – Segment Life/Health Reinsurance5
3,570
1,838
3,656
1,895
6M Q2
156
70
174
71
6M Q2
GWP Operating result (EBIT)Investment income
300
152
321
164
6M Q2
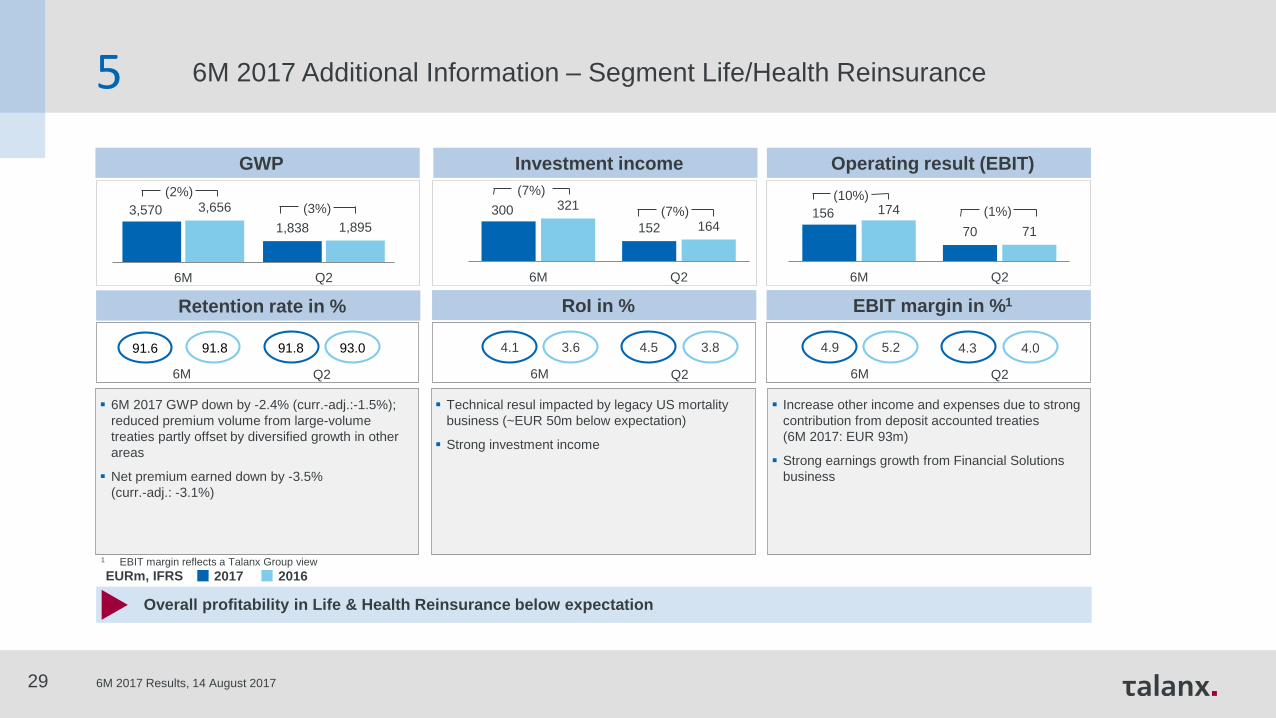
6M 2017 GWP down by -2.4% (curr.-adj.:-1.5%);
reduced premium volume from large-volume
treaties partly offset by diversified growth in other
areas
Net premium earned down by -3.5%
(curr.-adj.: -3.1%)
Technical resul impacted by legacy US mortality
business (~EUR 50m below expectation)
Strong investment income
Increase other income and expenses due to strong
contribution from deposit accounted treaties
(6M 2017: EUR 93m)
Strong earnings growth from Financial Solutions
business
Retention rate in % EBIT margin in %1RoI in %
6M Q2
4.9 5.2
6M Q2
4.1 4.53.6 3.8
6M Q2
91.6 91.8 91.8 93.0 4.3 4.0
Overall profitability in Life & Health Reinsurance below expectation
(10%)(2%)
(3%) (1%)(7%)
(7%)
1 EBIT margin reflects a Talanx Group view
2017EURm, IFRS 2016
30
EURm, IFRS 6M 2017 6M 2016 Change 6M 2017 6M 2016 Change 6M 2017 6M 2016 Change
P&L
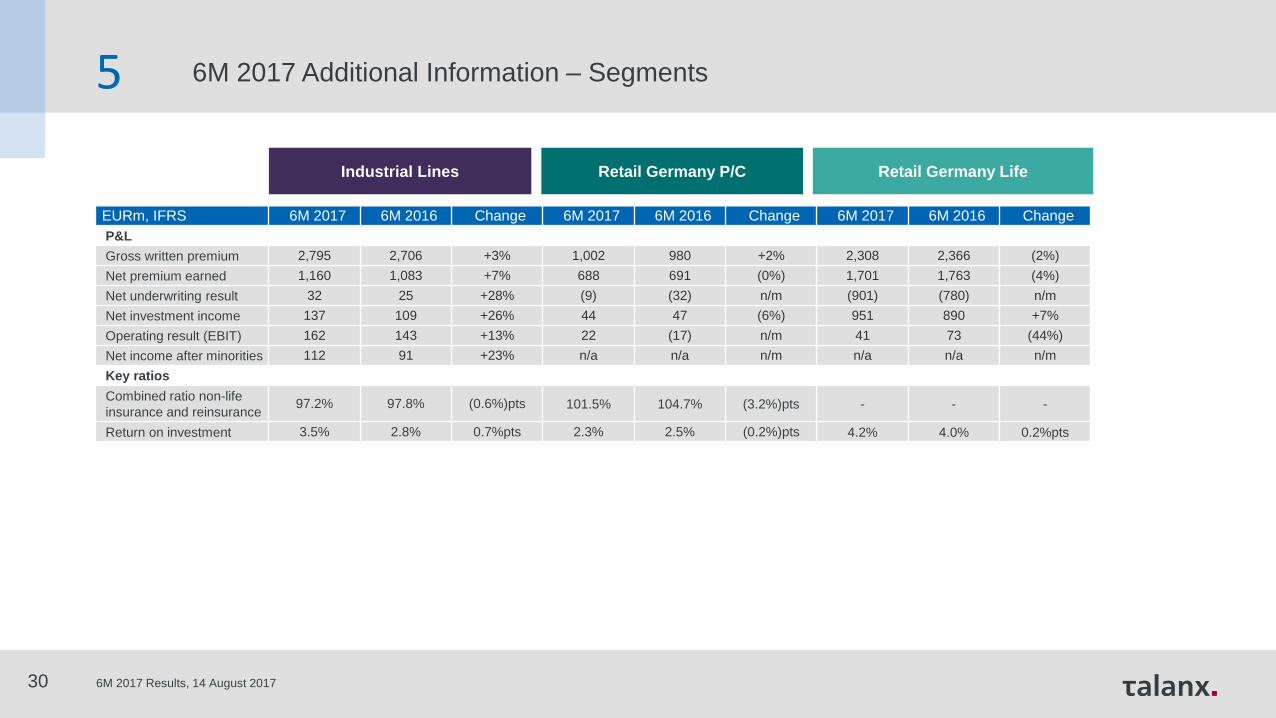
Gross written premium 2,795 2,706 +3% 1,002 980 +2% 2,308 2,366 (2%)
Net premium earned 1,160 1,083 +7% 688 691 (0%) 1,701 1,763 (4%)
Net underwriting result 32 25 +28% (9) (32) n/m (901) (780) n/m
Net investment income 137 109 +26% 44 47 (6%) 951 890 +7%
Operating result (EBIT) 162 143 +13% 22 (17) n/m 41 73 (44%)
Net income after minorities 112 91 +23% n/a n/a n/m n/a n/a n/m
Key ratios
Combined ratio non-life
insurance and reinsurance97.2% 97.8% (0.6%)pts 101.5% 104.7% (3.2%)pts - - -
Return on investment 3.5% 2.8% 0.7%pts 2.3% 2.5% (0.2%)pts 4.2% 4.0% 0.2%pts
Industrial Lines Retail Germany P/C Retail Germany Life
6M 2017 Results, 14 August 2017
6M 2017 Additional Information – Segments 5
31
EURm, IFRS 6M 2017 6M 2016 Change 6M 2017 6M 2016 Change 6M 2017 6M 2016 Change 6M 2017 6M 2016 Change
P&L
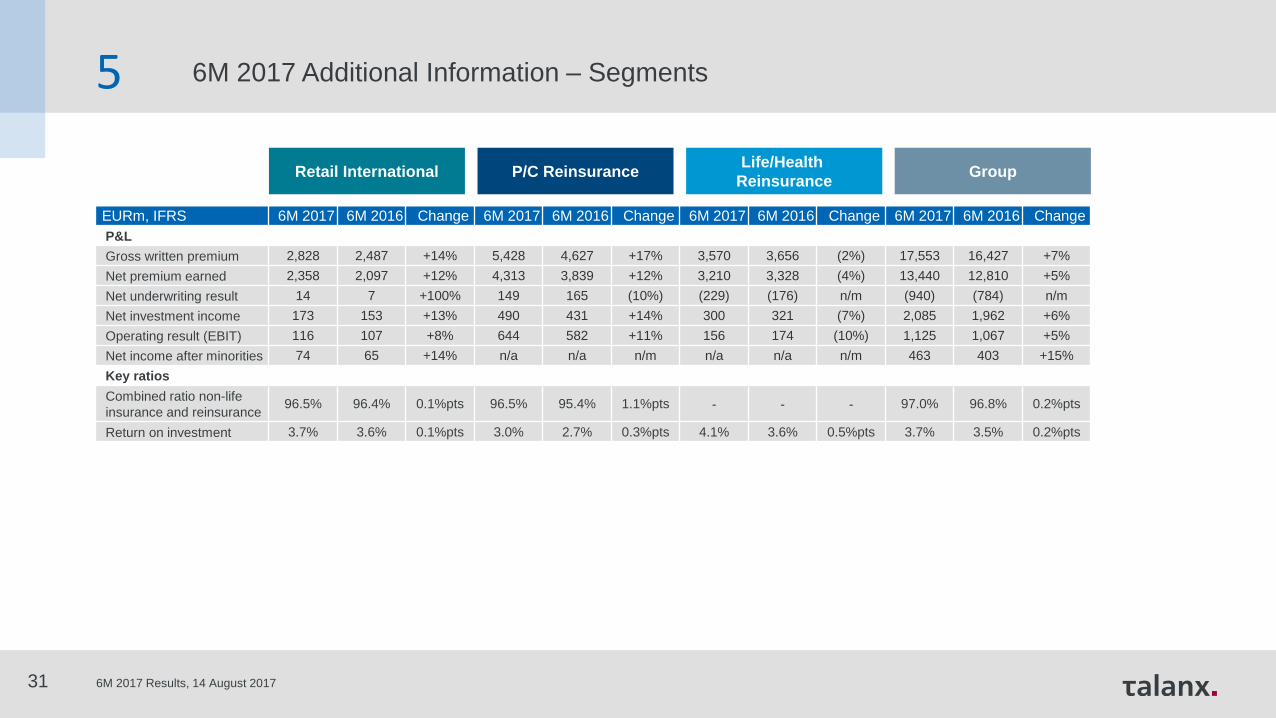
Gross written premium 2,828 2,487 +14% 5,428 4,627 +17% 3,570 3,656 (2%) 17,553 16,427 +7%
Net premium earned 2,358 2,097 +12% 4,313 3,839 +12% 3,210 3,328 (4%) 13,440 12,810 +5%
Net underwriting result 14 7 +100% 149 165 (10%) (229) (176) n/m (940) (784) n/m
Net investment income 173 153 +13% 490 431 +14% 300 321 (7%) 2,085 1,962 +6%
Operating result (EBIT) 116 107 +8% 644 582 +11% 156 174 (10%) 1,125 1,067 +5%
Net income after minorities 74 65 +14% n/a n/a n/m n/a n/a n/m 463 403 +15%
Key ratios
Combined ratio non-life
insurance and reinsurance96.5% 96.4% 0.1%pts 96.5% 95.4% 1.1%pts - - - 97.0% 96.8% 0.2%pts
Return on investment 3.7% 3.6% 0.1%pts 3.0% 2.7% 0.3%pts 4.1% 3.6% 0.5%pts 3.7% 3.5% 0.2%pts
Retail International P/C ReinsuranceLife/Health
ReinsuranceGroup
6M 2017 Results, 14 August 2017
6M 2017 Additional Information – Segments 5
32 6M 2017 Results, 14 August 2017
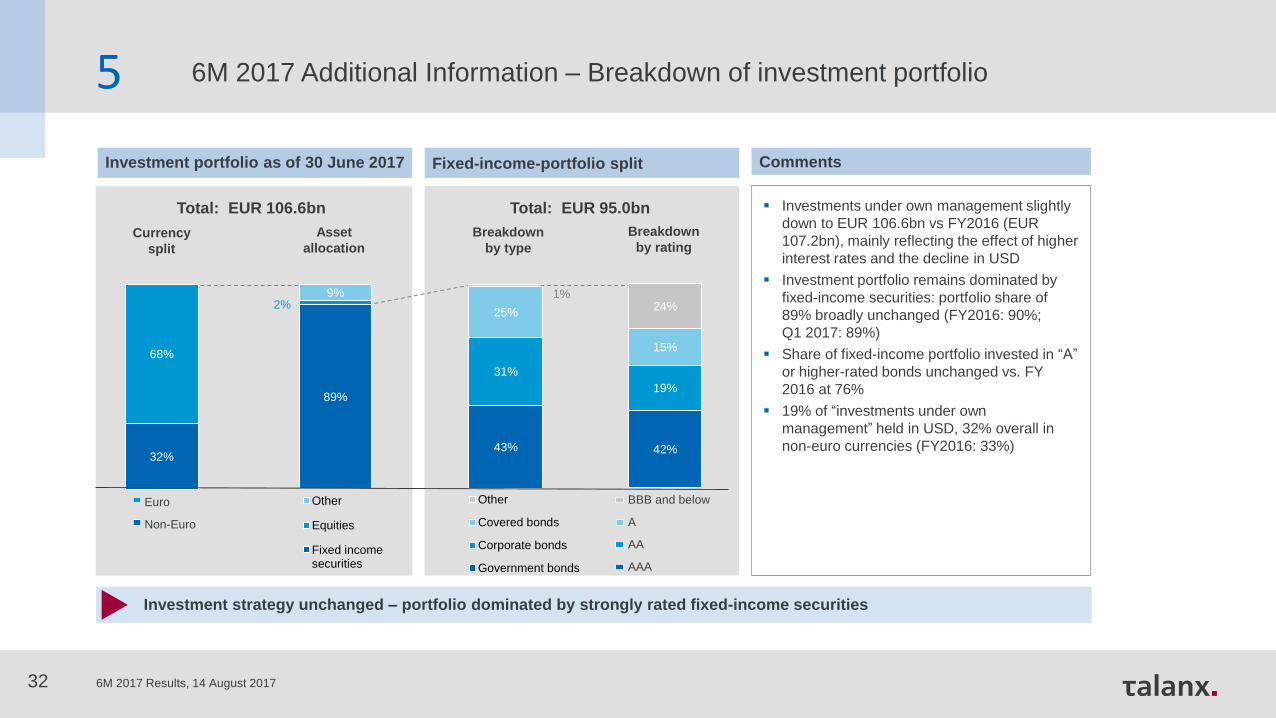
43%
31%
25%
1%
Other
Covered bonds
Corporate bonds
Government bonds
42%
19%
15%
24%
32%
68%
Euro
Non-Euro
89%
2%9%
Other
Equities
Fixed incomesecurities
Fixed-income-portfolio split Comments
Investments under own management slightly
down to EUR 106.6bn vs FY2016 (EUR
107.2bn), mainly reflecting the effect of higher
interest rates and the decline in USD
Investment portfolio remains dominated by
fixed-income securities: portfolio share of
89% broadly unchanged (FY2016: 90%;
Q1 2017: 89%)
Share of fixed-income portfolio invested in “A”
or higher-rated bonds unchanged vs. FY
2016 at 76%
19% of “investments under own
management” held in USD, 32% overall in
non-euro currencies (FY2016: 33%)
Investment portfolio as of 30 June 2017
Breakdown
by ratingBreakdown
by type
Asset
allocationCurrency
split
BBB and below
A
AA
AAA
6M 2017 Additional Information – Breakdown of investment portfolio
Total: EUR 106.6bn Total: EUR 95.0bn
Investment strategy unchanged – portfolio dominated by strongly rated fixed-income securities
5
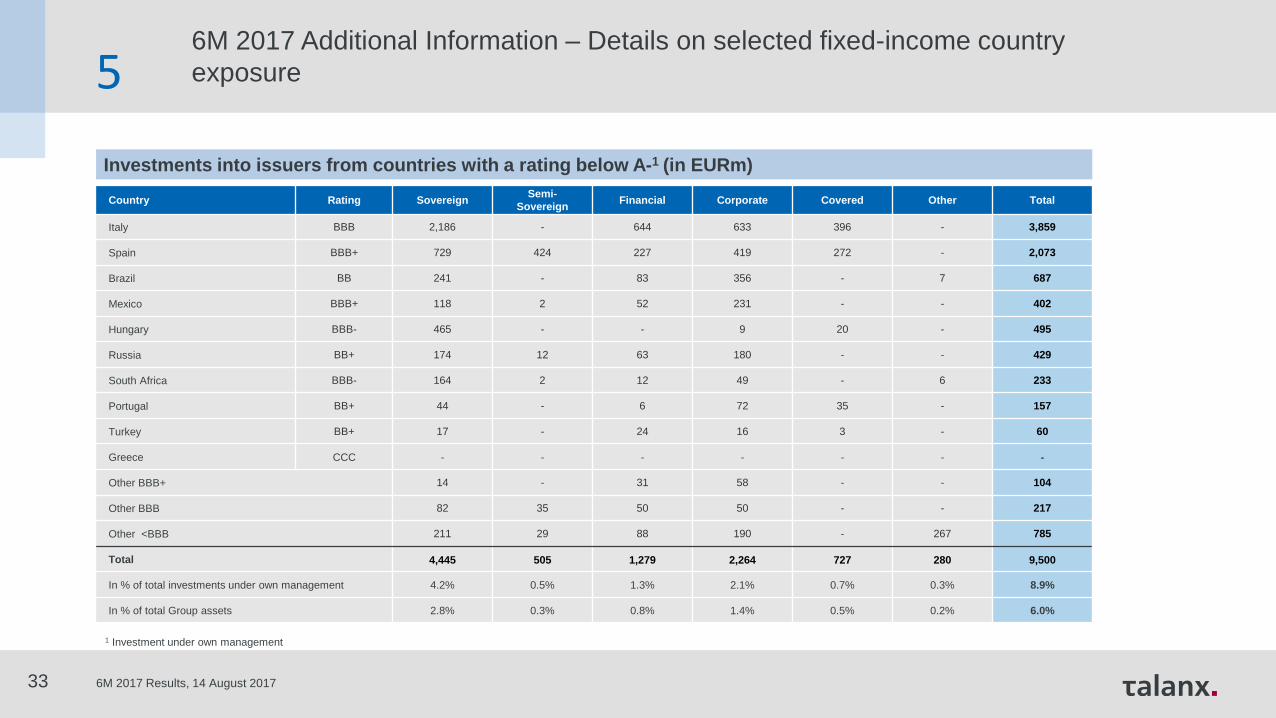
6M 2017 Additional Information – Details on selected fixed-income country
exposure
Country Rating SovereignSemi-
SovereignFinancial Corporate Covered Other Total
Italy BBB 2,186 - 644 633 396 - 3,859
Spain BBB+ 729 424 227 419 272 - 2,073
Brazil BB 241 - 83 356 - 7 687
Mexico BBB+ 118 2 52 231 - - 402
Hungary BBB- 465 - - 9 20 - 495
Russia BB+ 174 12 63 180 - - 429
South Africa BBB- 164 2 12 49 - 6 233
Portugal BB+ 44 - 6 72 35 - 157
Turkey BB+ 17 - 24 16 3 - 60
Greece CCC - - - - - - -
Other BBB+ 14 - 31 58 - - 104
Other BBB 82 35 50 50 - - 217
Other <BBB 211 29 88 190 - 267 785
Total 4,445 505 1,279 2,264 727 280 9,500
In % of total investments under own management 4.2% 0.5% 1.3% 2.1% 0.7% 0.3% 8.9%
In % of total Group assets 2.8% 0.3% 0.8% 1.4% 0.5% 0.2% 6.0%
1 Investment under own management
Investments into issuers from countries with a rating below A-1 (in EURm)
6M 2017 Results, 14 August 201733
5
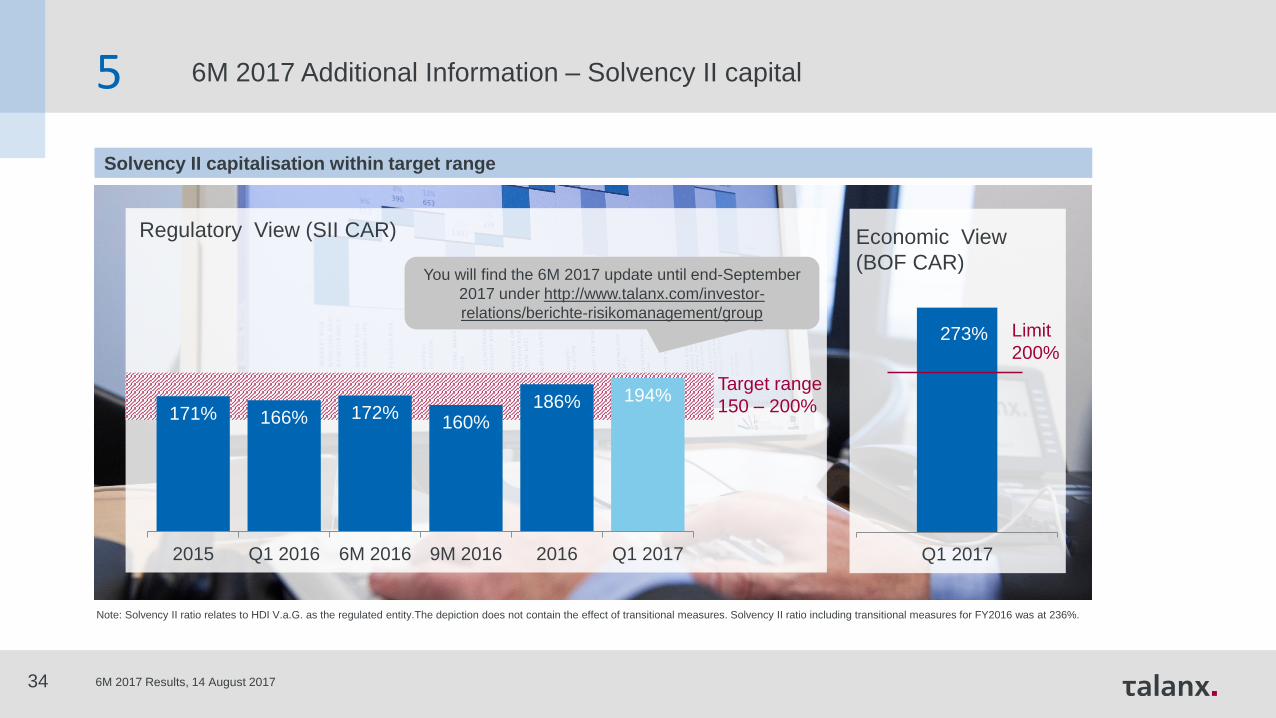
Solvency II capitalisation within target range
Target range
150 – 200%171% 166% 172%160%
186% 194%
2015 Q1 2016 6M 2016 9M 2016 2016 Q1 2017
6M 2017 Additional Information – Solvency II capital
Regulatory View (SII CAR) Economic View
(BOF CAR)
Q1 2017
273% Limit
200%
6M 2017 Results, 14 August 201734
You will find the 6M 2017 update until end-September
2017 under http://www.talanx.com/investor-
relations/berichte-risikomanagement/group
5
Note: Solvency II ratio relates to HDI V.a.G. as the regulated entity.The depiction does not contain the effect of transitional measures. Solvency II ratio including transitional measures for FY2016 was at 236%.

Talanx AG
Riethorst 2
30659 Hannover
+49 511 / 3747 - 2227
Financial Calendar and Contacts
6M 2017 Results, 14 August 201735
13 November 2017
Quarterly Statement as at 30/09/2017
23 November 2017
Capital Markets Day
19 March 2018
Annual Report 2017
From left to right: Alexander Grabenhorst (Equity & Debt IR), Anna Färber (Team
Assistant), Carsten Werle (Head of IR), Wiebke Großheim (Roadshows & Conferences, IR
webpage), Hannes Meyburg (Ratings); Alexander Zessel (Ratings), Marcus Sander
(Equity & Debt IR); not in the picture: Nicole Tadje (maternity leave)
5
36
This presentation contains forward-looking statements which are based on certain assumptions, expectations and opinions of the management of Talanx AG (the
"Company") or cited from third-party sources. These statements are, therefore, subject to certain known or unknown risks and uncertainties. A variety of factors, many of
which are beyond the Company’s control, affect the Company’s business activities, business strategy, results, performance and achievements. Should one or more of
these factors or risks or uncertainties materialize, actual results, performance or achievements of the Company may vary materially from those expressed or implied as
being expected, anticipated, intended, planned, believed, sought, estimated or projected.in the relevant forward-looking statement.
The Company does not guarantee that the assumptions underlying such forward-looking statements are free from errors nor does the Company accept any responsibility
for the actual occurrence of the forecasted developments. The Company neither intends, nor assumes any obligation, to update or revise these forward-looking
statements in light of developments which differ from those anticipated.
Where any information and statistics are quoted from any external source, such information or statistics should not be interpreted as having been adopted or endorsed by
the Company as being accurate. Presentations of the company usually contain supplemental financial measures (e.g., return on investment, return on equity, gross/net
combined ratios, solvency ratios) which the Company believes to be useful performance measures but which are not recognised as measures under International
Financial Reporting Standards, as adopted by the European Union ("IFRS"). Therefore, such measures should be viewed as supplemental to, but not as substitute for,
balance sheet, statement of income or cash flow statement data determined in accordance with IFRS. Since not all companies define such measures in the same way, the
respective measures may not be comparable to similarly-titled measures used by other companies. This presentation is dated as of 14 August 2017. Neither the delivery
of this presentation nor any further discussions of the Company with any of the recipients shall, under any circumstances, create any implication that there has been no
change in the affairs of the Company since such date. This material is being delivered in conjunction with an oral presentation by the Company and should not be taken
out of context.
Guideline on Alternative Performance Measures - For further information on the calculation and definition of specific Alternative Performance Measures please refer to the
Annual Report 2016 Chapter “Enterprise management”, pp. 23 and the following, the “Glossary and definition of key figures” on page 256 as well as our homepage
http://www.talanx.com/investor-relations/ueberblick/midterm-targets/definitions_apm.aspx
6M 2017 Results, 14 August 2017
Disclaimer


![[Public Document] - Talanx](https://img.pdfslide.us/doc/110x75/6203da7fc411ef574f365fe4/public-document-talanx.jpg)