Embed Size (px)
Citation preview
1
Electronic Supplementary Information
Experimental section
Materials: Amorphous boron (B), red phosphorus (P), sodium citrate dehydrate
(C6H5Na3O7·2H2O), nitroferricyanide (III) dihydrate (Na2Fe(CN)5NO·2H2O), and
Nafion (5wt%) sodium were purchased from Aladdin Ltd. in Shanghai. Para-
(dimethylamino) benzaldehyde (C9H11NO), salicylic acid (C7H5O3), sodium citrate
dehydrate (C6H5Na3O7·2H2O), hydrazine hydrate (N2H4·H2O), sodium hypochlorite
(NaClO), sodium hydroxide (NaOH), hydrochloric acid (HCl), ethanol (CH3CH2OH),
and carbon paper were bought from Beijing Chemical Corporation. The ultrapure water
was purified through a Millipore system used throughout all experiments.
Preparation of BP: BP was synthesis through a vacuum-seal strategy. A total weight of
200 mg elements mixture which the molar ratio of B:P was 1:1.2. After vacuum sealing,
the silica tube was annealing at 1200 oC in a muffle furnace for 10 h. The BP was
prepared well. Moreover, B catalyst was prepared by the same preparation without the
presence of P.
Preparation of BP/CP: Carbon paper (CP) was cleaned via brief sonication with ethanol
and water for several times. To prepare the BP/CP, 10 mg BP and 40 µL 5 wt% Nafion
solution were dispersed in 960 µL water/ethanol (V : V = 1 : 3) followed by 1-h
sonication to form a homogeneous ink. 20 µL ink was loaded onto a CP (1 × 1 cm2) and
dried under ambient condition. The BP/CP working electrode was prepared well.
Characterizations: TEM images were collected on a HITACHI H-8100 electron
microscopy (Hitachi, Tokyo, Japan) operated at 200 kV. XPS measurements were
performed on an ESCALABMK II X-ray photoelectron spectrometer using Mg as the
exciting source. The absorbance data of spectrophotometer were acquired on
SHIMADZU UV-1800 UV-Vis spectrophotometer.
Electrochemical measurements: The N2 reduction experiments were carried out in a
two-compartment cell under ambient condition, which was separated by Nafion 117
membrane. The membrane was treated in H2O2 (5%) aqueous solution at 80 °C for 1 h
and dipped in 0.1 M H2SO4 at 80 °C for another 1 h. And finally, the membrane was
treated in ultrapure water at 80 °C for 6 h. The electrochemical measurements were
conducted on a CHI660E electrochemical analyzer (CH Instruments, China) in a typical
three-electrode setup with an electrolyte solution of 0.1 M HCl (30 mL), a graphite rod
Electronic Supplementary Material (ESI) for Journal of Materials Chemistry A.This journal is © The Royal Society of Chemistry 2019
2
and Ag/AgCl (filled with saturated KCl solution) as the counter the reference electrode,
respectively. The potentials reported in this work were converted to RHE scale via
calibration with the following equation: E (vs RHE) =E (vs Ag/AgCl) + 0.197 + 0.059
× pH. For N2 reduction experiments, the electrolyte was bubbled with N2 for 30 min
before the measurement.
Determination of NH3: Concentration of produced NH3 was spectrophotometrically
determined by spectrophotometry measurement with salicylic acid.1 In detail, 2 ml
aliquot of solution was removed from the cathodic chamber, and then added into 2 ml
1.0 M NaOH solution containing C7H6O3 and C6H5Na3O7·2H2O (5 wt%), then added 1
ml NaClO (0.05 M) and 0.2 ml Na2[Fe(NO)(CN)5].2H2O (1 wt%) aqueous solution in
turn. After standing at room temperature for 2 hours, the UV-Vis absorption absorption
spectrum was measured. The concentration of indophenol blue was determined using
the absorbance at a wavelength of 655 nm. The concentration-absorbance curves were
calibrated using standard NH4Cl solution with a serious of concentrations. The fitting
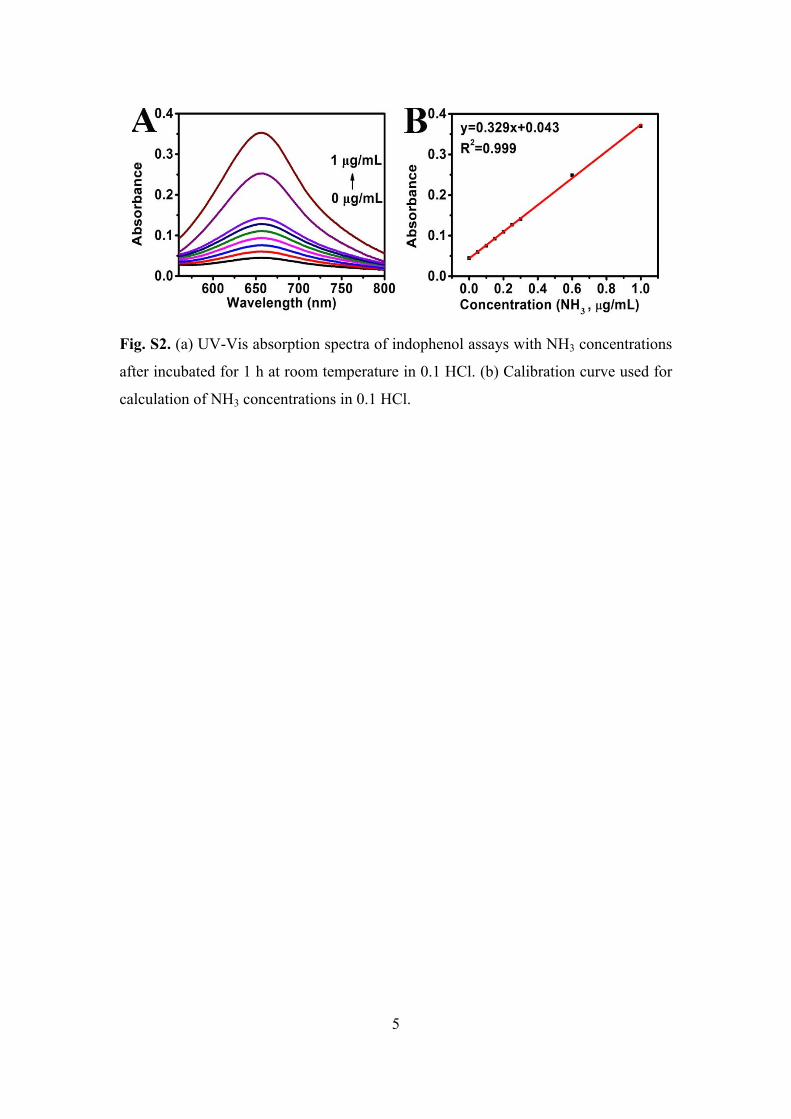
curve (y = 0.329x + 0.043, R2=0.999) shows good linear relation of absorbance value
with NH3 concentration by three times independent calibrations.
Determination of N2H4: The N2H4 presented in the electrolyte was estimated by the
method of Watt and Chrisp.2 A mixed solution of C9H11NO (5.99 g), HCl (concentrated,
30 mL) and ethanol (300 mL) was used as a color reagent. Typically, 5 mL electrolyte
was removed from the cathodic chamber, after that, added into 5 mL above prepared
color reagent and stirring 10 min at room temperature. The absorbance of the resulting
solution was measured at 455 nm. The concentration absorbance curves were calibrated
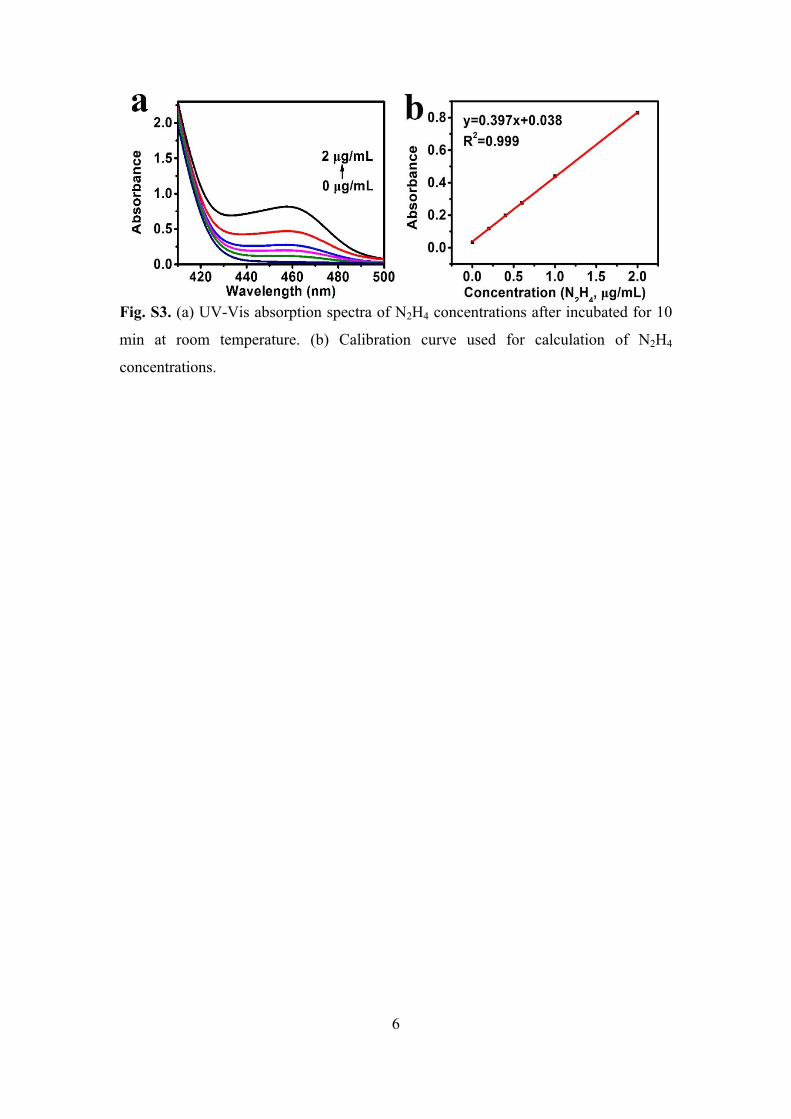
using standard N2H4 solution with a series of concentrations. The fitting curve shows
good linear relation of the absorbance with N2H4 concentration (y = 0.397 x + 0.038,
R2 = 0.999).
Determination of NH3 yield and FE: The Faradic efficiency (FE) for N2 reduction was
defined as the amount of electric charge used for synthesizing NH3 divided the total
charge passed through the electrodes during the electrolysis. The total amount of NH3
produced was measured using colorimetric methods. NH3 yield was calculated using
the following equation:
NH3 yield = [NH3] × V / (mcat. × t)
Assuming three electrons were needed to produce one NH3 molecule, the FE could be
calculated as follows:
3
FE = 3 × F × [NH3] × V / (17 × Q) × 100%
Where F is the Faraday constant, [NH3] is the measured NH3 concentration, V is the
volume of the electrolyte in the cathodic chamber, Q is the total quantity of applied
electricity; t is the reduction time; mcat. is the loaded mass of catalyst on carbon paper.
Computational details: Spin-polarized density functional theory (DFT) calculations
were performed by using the plane wave-based Vienna ab initio simulation package
(VASP).3,4 The generalized gradient approximation method with Perdew-Burke-
Ernzerhof (PBE) functional was used to describe the exchange-correlation interaction
among electrons.5 The van der Waals (vdW) correction with the Grimme approach
(DFT-D3) was included in the interaction between single molecule/atoms and
substrates.6 The energy cutoff for the plane wave-basis expansion was set to 500 eV
and the atomic relaxation was continued until the forces acting on atoms were smaller
than 0.01 eV Å-1. The BP (111) and (200) surfaces was modeled using a 3 × 2 slab with
four layers (B−P) which the bottom layer is fixed , and are separated by 15 Å of vacuum.
The Brillouin zone was sampled with 2 × 2 × 1 Gamma-center k-point mesh, and the
electronic states were smeared using the Fermi scheme with a broadening width of 0.1
eV.
The free energies of the reaction intermediates were obtained by ΔG = ΔEads + ΔZPE –
TΔS + ΔG(U) + ΔG(pH), where ΔEads is the adsorption energy, ZPE is the zero point
energy and S is the entropy at 298 K. The effect of a bias was included in calculating
the free energy change of elementary reactions involving transfer of electrons by adding
ΔG(U) = ‒neU, where n is number of electrons transferred and U is the electrode
potential.7 In our calculations, we used U = ‒0.60 V (vs. RHE). ΔG(pH) =
‒kBTln10×pH, where kB is the Boltzmann constant, and pH = 1 for electrolyte. In this
study, the entropies of molecules in the gas phase are obtained from the literature.6
4
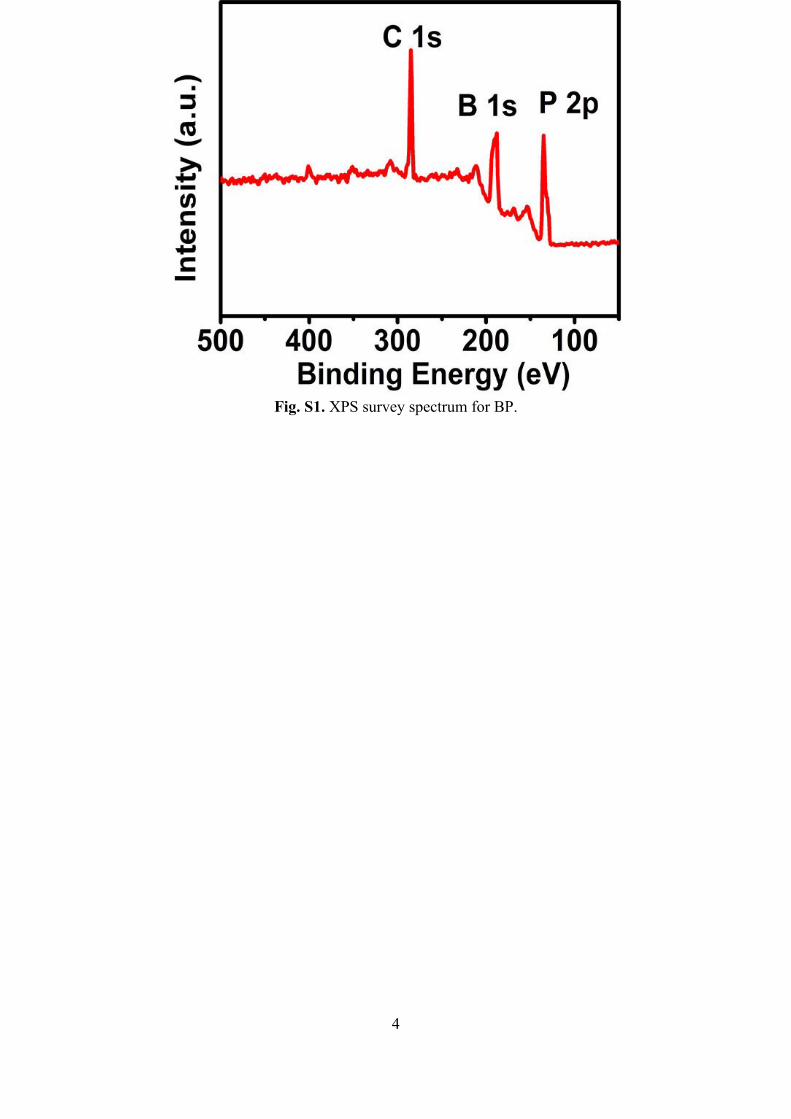
Fig. S1. XPS survey spectrum for BP.
5
Fig. S2. (a) UV-Vis absorption spectra of indophenol assays with NH3 concentrations
after incubated for 1 h at room temperature in 0.1 HCl. (b) Calibration curve used for
calculation of NH3 concentrations in 0.1 HCl.
6
Fig. S3. (a) UV-Vis absorption spectra of N2H4 concentrations after incubated for 10
min at room temperature. (b) Calibration curve used for calculation of N2H4
concentrations.
7
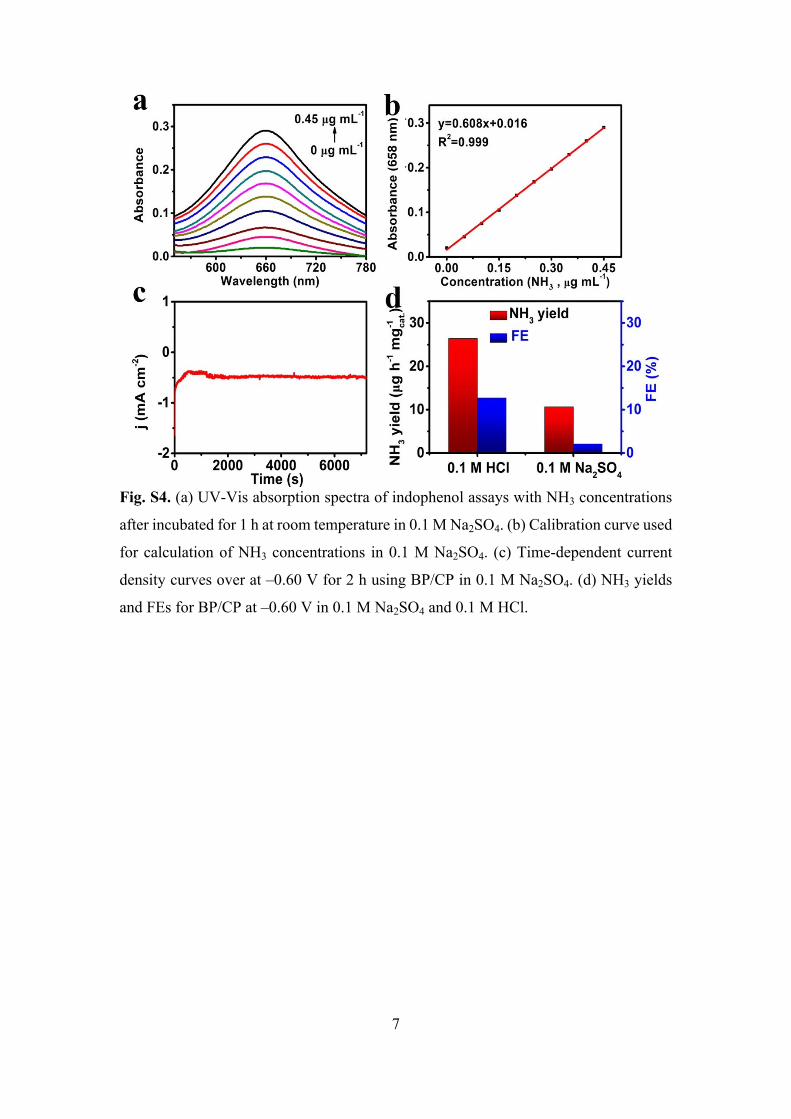
Fig. S4. (a) UV-Vis absorption spectra of indophenol assays with NH3 concentrations
after incubated for 1 h at room temperature in 0.1 M Na2SO4. (b) Calibration curve used
for calculation of NH3 concentrations in 0.1 M Na2SO4. (c) Time-dependent current
density curves over at –0.60 V for 2 h using BP/CP in 0.1 M Na2SO4. (d) NH3 yields
and FEs for BP/CP at –0.60 V in 0.1 M Na2SO4 and 0.1 M HCl.
8
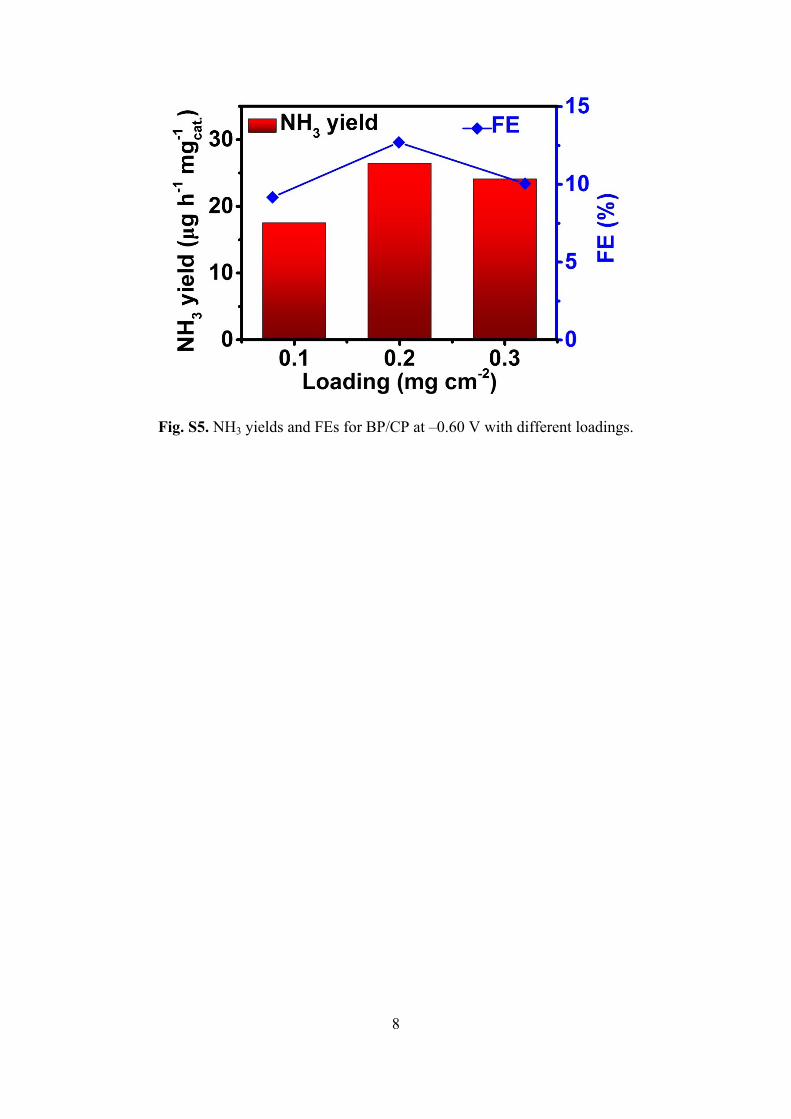
Fig. S5. NH3 yields and FEs for BP/CP at –0.60 V with different loadings.
9
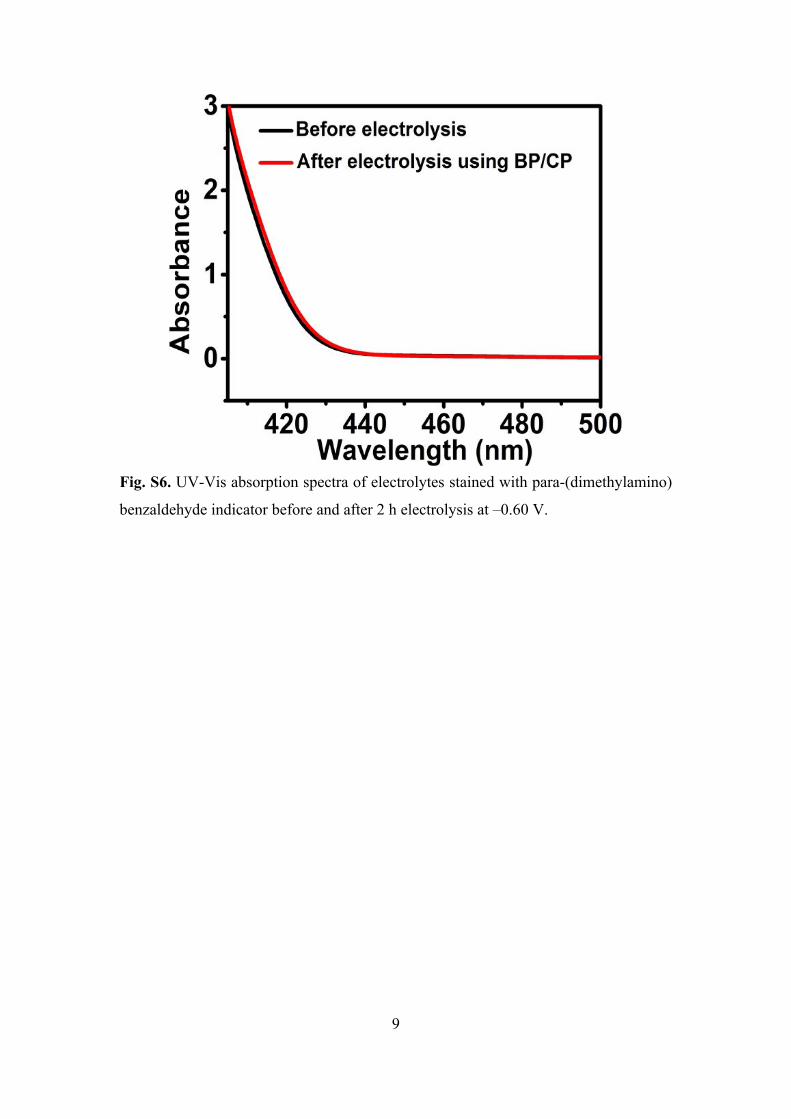
Fig. S6. UV-Vis absorption spectra of electrolytes stained with para-(dimethylamino)
benzaldehyde indicator before and after 2 h electrolysis at –0.60 V.
10
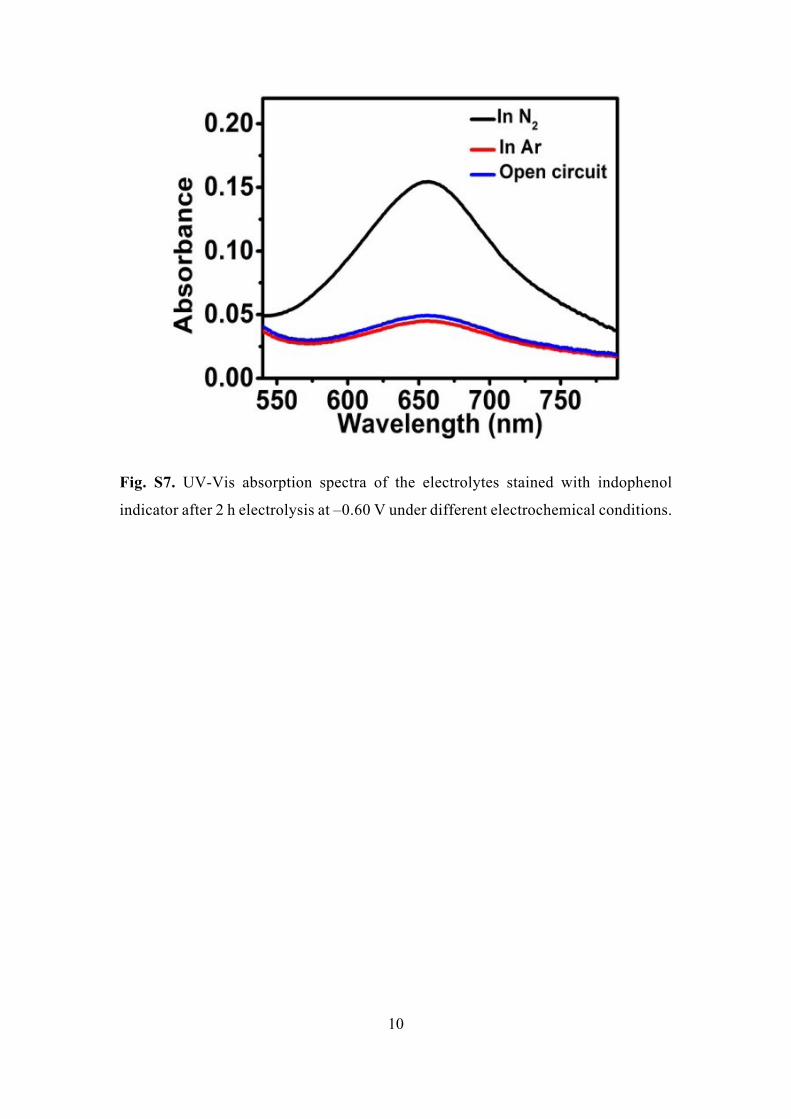
Fig. S7. UV-Vis absorption spectra of the electrolytes stained with indophenol
indicator after 2 h electrolysis at –0.60 V under different electrochemical conditions.
11
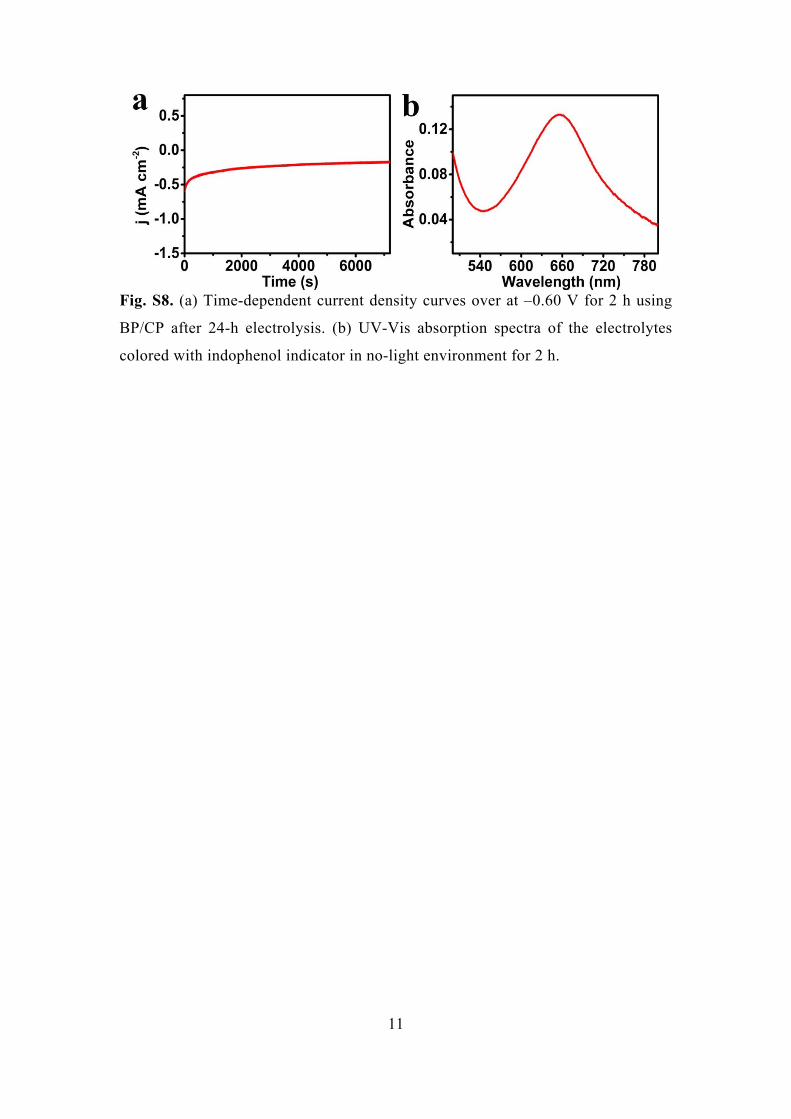
Fig. S8. (a) Time-dependent current density curves over at –0.60 V for 2 h using
BP/CP after 24-h electrolysis. (b) UV-Vis absorption spectra of the electrolytes
colored with indophenol indicator in no-light environment for 2 h.
12
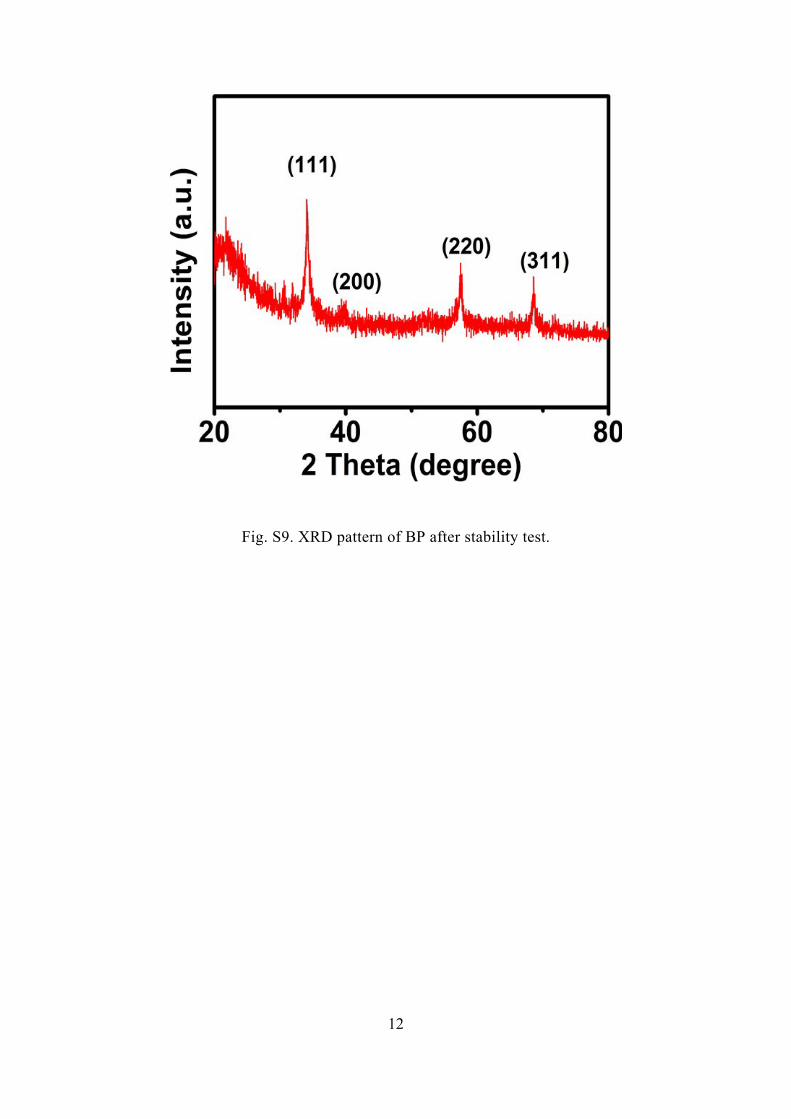
Fig. S9. XRD pattern of BP after stability test.

13
Fig. S10.
TEM image of BP nanoparticles after stability test.

14
Fig. S11. XPS spectra of BP in the (a) B 1s and (b) P 2p regions after stability test.
15
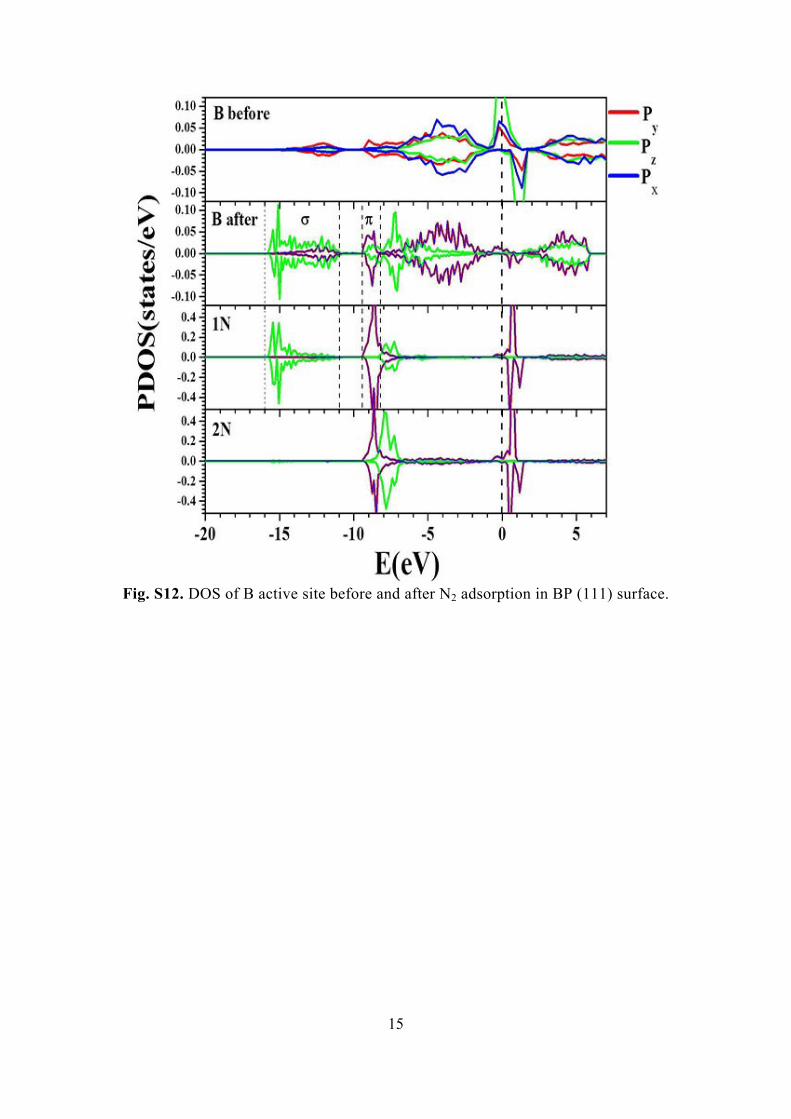
Fig. S12. DOS of B active site before and after N2 adsorption in BP (111) surface.
16
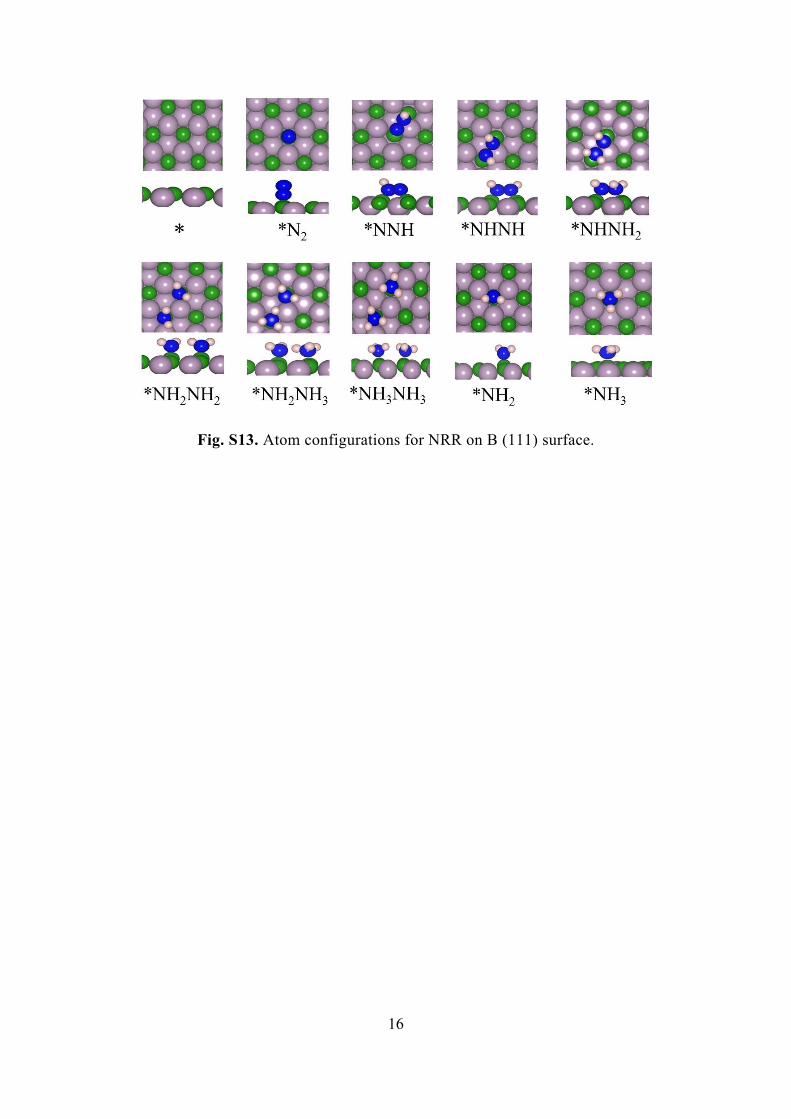
Fig. S13. Atom configurations for NRR on B (111) surface.
17
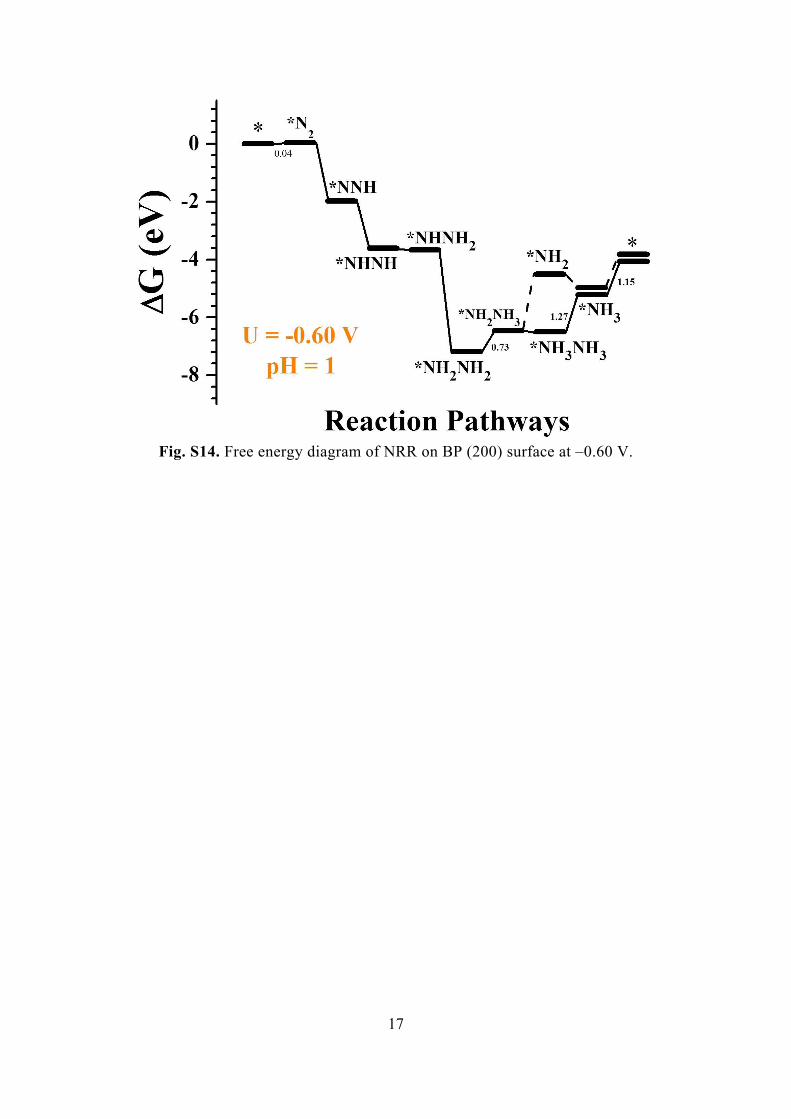
Fig. S14. Free energy diagram of NRR on BP (200) surface at –0.60 V.
18
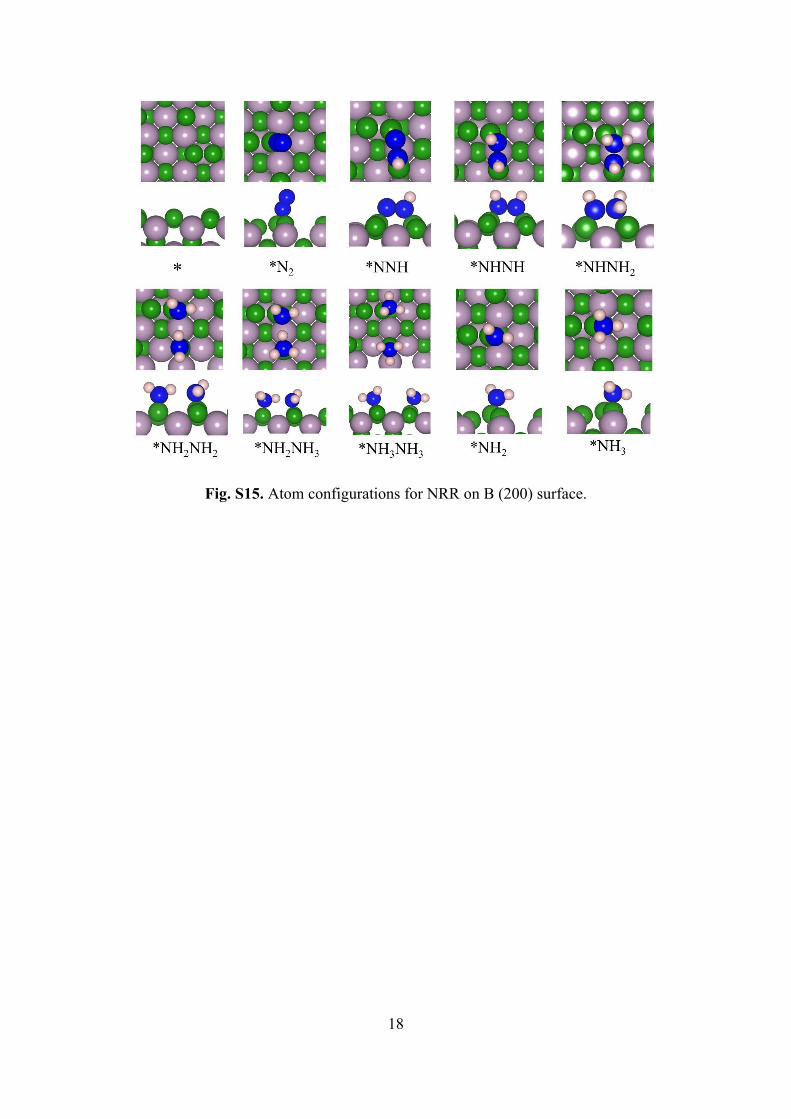
Fig. S15. Atom configurations for NRR on B (200) surface.
19
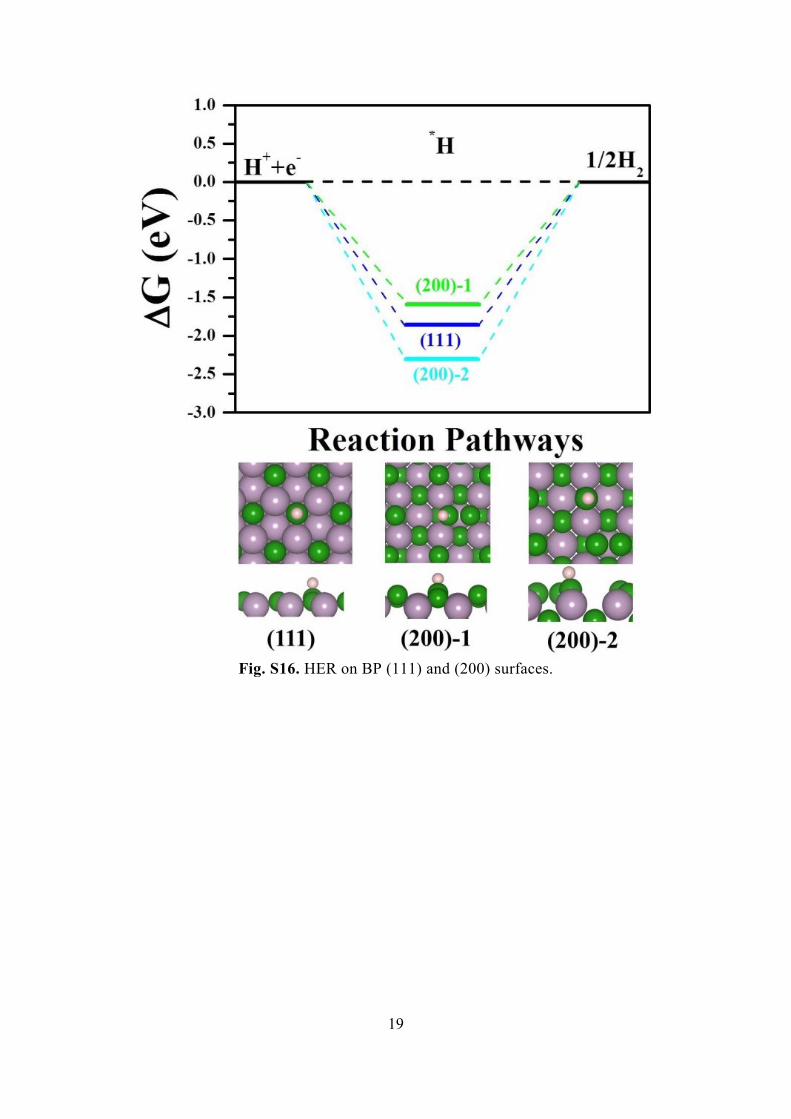
Fig. S16. HER on BP (111) and (200) surfaces.
20
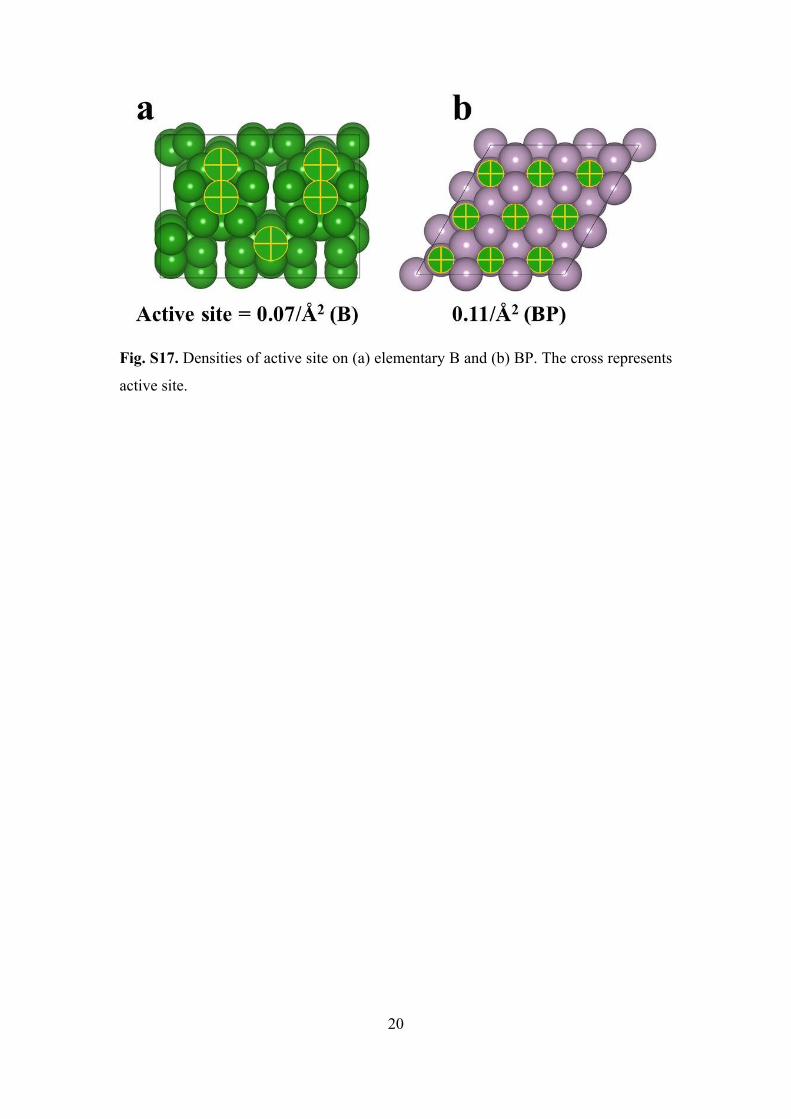
Fig. S17. Densities of active site on (a) elementary B and (b) BP. The cross represents
active site.
21
Table S1. Comparison of the catalytic performances of non-metal NRR electrocatalysts
at ambient conditions in aqueous electrolytes.
Testing method Catalyst Electrolyte NH3 yield FE(%) Ref.
BP nanoparticles 0.1 M HCl 26.42 µg h–1 mg–1
cat. 12.7 This work
boron nanosheet 0.1 M Na2SO4
13.22 µg h−1 mg−1cat. 4.04 8
boron nanosheet 0.1 M HCl 3.12 μg h-1 mg-1cat. 4.84 9
defect-rich fluorographene
0.1 M Na2SO4
9.3 μg h–1 mg–1cat. 4.2 10
BN 0.1 M HCl 22.4μg h–1 mg–1cat. 4.7 11
oxygen-doped carbon
nanosheet0.1 M HCl 20.15μg h–1 mg–1
cat. 4.97 12
black P nanosheets 0.01 M HCl 31.37 µg h−1 mg−1
cat. 5.07 13
PTCA–rGO 0.1 M HCl 24.7 µg h−1 mg−1cat. 6.9 14
sulfur dots-graphene
nanohybrid
0.5 M LiClO4
28.56 µg h−1 mg−1cat. 7.07 15
S-doped carbon nanosphere
0.1 M Na2SO4
19.07 μg h–1 mg–1cat. 7.47 16
oxygen-doped hollow carbon
microtubes0.1 M HCl 25.12 µg h−1 mg−1
cat. 9.1 17
NPC 0.005 M H2SO4
1.31 mmol h−1 g−1cat. 9.98 18
B-doped graphene
0.05 M H2SO4
9.8 μg h−1 cm−2 10.8 19
sulfur-doped graphene 0.1 M HCl 27.3 μg h−1 cm−2 11.5 20
PCN 0.1 M HCl 8.09 μg h–1 mg–1cat. 11.59 21
Indophenol blue method
B4C 0.1 M HCl 26.57 μg h–1 mg–1cat. 15.95 22
Nessle´ reagent
N-doped porous carbon
0.05 M H2SO4
23.8 μg h−1 mg−1cat. 1.42 23
EPA Standard Method
CNS 0.25 M LiClO4
97.18 μg h−1 cm−2 11.56 24
22
References
1 D. Zhu, L. Zhang, R. E. Ruther and R. J. Hamers, Nat. Mater., 2013, 12, 836–
841.
2 G. W. Watt and J. D. Chrisp, Anal. Chem., 1952, 24, 2006–2008.
3 G. Kresse and J. Furthmüller, Comp. Mater. Sci., 1996, 6, 15–50.
4 G. Kresse and J. Furthmüller, Phys. Rev. B, 1996, 54, 11169.
5 J. P. Perdew, K. Burke and M. Ernzerhof, Phys. Rev. lett., 1996, 77, 3865.
6 S. Grimme, J. Antony, S. Ehrlich and H. Krieg, J. Chem. Phys., 2010, 132,
154104.
7 L. Yang, T. Wu, R. Zhang, H. Zhou, L. Xia, X. Shi and X. Sun, Nanoscale,
2019, 11, 1555–1562.
8 X. Zhang, T. Wu, H. Wang, R. Zhao, H. Chen, T. Wang, P. Wei, Y. Luo, Y.
Zhang and X. Sun, ACS Catal., 2019, 9, 4609–4615.
9 Q. Fan, C. Choi, C. Yan, Y. Liu, J. Qiu, S. Hong, Y. Jung and Z. Sun,
Chem. Commun., 2019, 55, 4246–4249.
10 J. Zhao, J. Yang, L. Ji, H. Wang, H. Chen, Z. Niu, Q. Liu, T. Li, G. Cui and X.
Sun, Chem. Commun., 2019, 55, 4266–4269.
11 Y. Zhang, H. Du, Y. Ma, L. Ji, H. Guo, Z. Tian, H. Chen, H. Huang, G. Cui, A.
M. Asiri, F. Qu, L. Chen and X. Sun, Nano Res., 2019, 12, 919–924.
12 R. Zhang, J. Han, B. Zheng, X. Shi, A. M. Asiri and X. Sun, Inorg. Chem.
Front., 2019, 6, 391–395.
13 L. Zhang, L. Ding, G. Chen, X. Yang and H. Wang, Angew. Chem., Int. Ed.,
2019, 131, 2638–2642.
14 P. Li, J. Wang, H. Chen, X. Sun, J. You, S. Liu, Y. Zhang, M. Liu, X. Niu, Y.
Luo, J. Mater. Chem. A, 2019, 7, 12446–12450.
15 H. Chen, X. Zhu, H. Huang, H. Wang, T. Wang, R. Zhao, H. Zheng, A. M.
Asiri, Y. Luo and X. Sun, Chem. Commun., 2019, 55, 3152–3155.
16 L. Xia, X. Wu, Y. Wang, Z. Niu, Q. Liu, T. Li, X. Shi, A. M. Asiri and X. Sun,
Small Methods, 2018, 14, 1800251.
17 T. Wu, P. Li, H. Wang, R. Zhao, Q. Zhou, W. Kong, M. Liu, Y. Zhang, X. Sun
and Feng Gong, Chem. Commun., 2019, 55, 2684–2687.
18 C. Zhao, S. Zhang, M. Han, X. Zhang, Y. Liu, W. Li, C. Chen, G. Wang, H.
Zhang and H. Zhao, ACS Energy Lett., 2019, 4, 377–383.
23
19 X. Yu, P. Han, Z. Wei, L. Huang, Z. Gu, S. Peng, J. Ma and G. Zheng, Joule,
2018, 2, 1610−1622.
20 L. Xia, J. Yang, H. Wang, R. Zhao, H. Chen, W. Fang, A. M. Asiri, F. Xie, G.
Cui and X. Sun, Chem. Commun., 2019, 55, 3371–3374.
21 C. Lv, Y. Qian, C. Yan, Y. Ding, Y. Liu, G. Chen and G. Yu, Angew. Chem.,
Int. Ed., 2018, 57, 10246–10250.
22 W. Qiu, X. Xie, J. Qiu, W. Fang, R. Liang, X. Ren, X. Ji, G. Cui, A. M. Asiri,
G. Cui, B. Tang and X. Sun, Nat. Commun., 2018, 9, 3485.
23 Y. Liu, Y. Su, X. Quan, X. Fan, S. Chen, H. Yu, H. Zhao, Y. Zhang and J. Zhao,
ACS Catal., 2018, 8, 1186–1191.
24 Y. Song, D. Johnson, R. Peng, D. K. Hensley, P. V. Bonnesen, L. Liang, J.
Huang, F. Yang, F. Zhang, R. Qiao, A. P. Baddorf, T. J. Tschaplinski, N. L.
Engle, M. C. Hatzell, Z. Wu, D. A. Cullen, H. M. Meyer III, B. G. Sumpter
and A. J. Rondinone, Sci. Adv., 2018, 4, e1700336.


![o / ¡ @ ® þ i ¹ ª Î V E ¼ © Î = ð ] S È / 5 = 6 8 · +« ìg 8 Å*Ë ( õ Ü*Ë (d "i 9*Ë8 Å*Ë (h õ Ü 2h ²g h ²g h ²h h 2h ²h 8oh h d m+á*Ë8 Å*Ë (h 2h h ²h](https://img.pdfslide.us/doc/110x75/5ca69cb288c993f3238b60f2/o-b-i-a-i-v-e-i-d-s-e-5-6-8-ig-8-ae.jpg)


![Hypochlorite Ion Strength[1]](https://img.pdfslide.us/doc/110x75/577d219a1a28ab4e1e95958b/hypochlorite-ion-strength1.jpg)