Embed Size (px)
Citation preview

Foot Care for People with Diabetes: The Economic Case for Change
Marion KerrInsight Health Economics
March 2012
Supporting, Improving, Caring


3
Acknowledgements 5
Abbreviations 6
Executive Summary 7
Introduction 9
Section I The Scale of the Problem 10
Chapter 1 Incidence and Prevalence of Foot Ulceration and Amputation in Diabetes 10
Chapter 2 Impact of Ulceration and Amputation on Quality of Life 12
Chapter 3 Prognosis and Mortality 16
Chapter 4 Quality of Foot Assessment and Care 19
Section II Evidence on Clinical and Cost Effectiveness of Diabetic Foot Care 26
Chapter 5 Clinical Impact of Diabetic Foot Interventions 26
Chapter 6 Cost Effectiveness of Diabetic Foot Interventions 31
Section III The Cost of Ulceration and Amputation in Diabetes 32
Introduction 32
Chapter 7 Cost of Primary, Community and Outpatient Care for Ulceration 37
Chapter 8 Cost of Inpatient Care 40
Chapter 9 Cost of Post-Amputation Care 44
Chapter 10 Summary of NHS Costs of Ulceration and Amputation 45
Section IV The Impact of Multidisciplinary Foot Care on Patient Outcomes and 46NHS Costs
Chapter 11 Cost, Savings and QALY Estimates: Multidisciplinary Diabetes Foot Care 46
Chapter 12 Discussion 54
Appendix 1 56
Appendix 2 58
Appendix 3 62
References 64
Contents


5
This paper was written for NHS Diabetes by Insight Health Economics. We would like to thank thefollowing individuals and organisations for their help:
Simon Ashwell, Consultant Endocrinologist, South Tees Hospitals NHS Foundation Trust
Lucy Betterton, Communications Consultant, NHS Diabetes
Graham Bowen, Podiatry Clinical Service Manager, Portsmouth Hospitals NHS Trust
Paul Chadwick, Principal Podiatrist, Salford Royal NHS Foundation Trust
Michael Edmonds, Consultant in Diabetes, King’s College Hospital NHS Foundation Trust
Rajiv Hanspal, Consultant in Rehabilitation Medicine, Royal National Orthopaedic Hospital NHS Trust
Rowan Hillson MBE, National Clinical Director for Diabetes
Robert Hinchliffe, Consultant Vascular Surgeon, St. George’s Healthcare NHS Trust
Naomi Holman, Head of Health Intelligence, Diabetes Health Intelligence, Yorkshire and HumberPublic Health Observatory
William Jeffcoate, Consultant in Diabetes and Endocrinology, Nottingham University Hospitals NHSTrust
Denise Kendrick, Professor of Primary Care Research, University of Nottingham
Wing May Kong, Consultant Endocrinologist, The North West London Hospitals NHS Trust
Graham Leese, Consultant in Diabetes and Endocrinology, Ninewells Hospital, Dundee
Anna Morton, Director, NHS Diabetes
NHS Information Centre for health and social care
Ceri Phillips, Professor of Health Economics, Swansea University
Gerry Rayman, Consultant in Diabetes, Ipswich Hospital NHS Trust
Anne Scott, Diabetes Lead Nurse, Ipswich Hospital NHS Trust
Leena Sevak, Footcare Network Programme Manager, NHS Diabetes
Cliff Shearman, Consultant Vascular Surgeon, Southampton University Hospitals NHS FoundationTrust
Adam Sweeney, Information Analyst, Diabetes UK
Bridget Turner, Head of Healthcare Policy, Diabetes UK
Jonathan Valabhji, Consultant Diabetologist, Imperial College Healthcare NHS Trust
Stella Vig, Consultant Vascular and General Surgeon, Croydon Health Services NHS Trust
Sue Walker, Prosthetic and Amputee Rehabilitation Centre Manager, Royal National OrthopaedicHospital NHS Trust
Bob Young, Consultant in Diabetes, Salford Royal NHS Foundation Trust
Acknowledgements

6
APHO: Association of Public Health Observatories
HES: Hospital Episode Statistics
HRG: Healthcare Resource Group
MDT: Multidisciplinary diabetic foot care team
PbR: Payment by Results
PSSRU: Personal Social Services Research Unit
NDA: National Diabetes Audit
NICE: National Institute for Health and Clinical Excellence
ONS: Office for National Statistics
PCT: Primary Care Trust
QALY: Quality-adjusted life-year
QOF: Quality and Outcomes Framework
RCT: Randomised controlled trial
SF-6D: Short Form 6D
SF-36: Short Form 36
STARRS: Short Term Assessment, Rehabilitation and Reablement Service
YHPHO: Yorkshire and Humber Public Health Observatory
WTE: Whole-time equivalent
Abbreviations

7
1. Around 6,000 people with diabetes undergo leg, foot or toe amputation each year in England. Many ofthese amputations are avoidable. The risk of lower extremity amputation for people with diabetes ismore than 20 times that of people without diabetes. Major amputation rates in people with diabetesvary ten-fold across primary care trusts.
2. Around 61,000 people with diabetes are thought to have foot ulcers at any given time, approximately2.5% of the diabetes population.
3. Ulceration and amputation substantially reduce quality of life, and are associated with high mortality.Studies suggest that only 50% of patients with diabetes who have had an amputation survive for afurther two years. Even without amputation, the prognosis is poor. Only around 56% of people withdiabetes who have had ulcers survive for five years.
4. In 2010-11, the NHS in England spent an estimated £639 million–£662 million, 0.6–0.7% of its budget,on diabetic foot ulceration and amputation (Table A).
Table A Estimated cost of ulceration and amputation in people with diabetes, England, 2010–11
5. The focus of this paper is on costs to the NHS, but ulceration and amputation also impose costs onpatients and their carers, through lost working days and reduced mobility. These work and mobilityeffects also entail costs to the public purse through reductions in tax revenue, increases in benefitpayments and use of social care resources. If all these effects were taken into account the total cost ofdiabetic foot ulcers and amputations, both to the public sector and to society as a whole, would behigher than the figures set out in this paper.
6. Clinical evidence suggests that there is considerable potential to improve the quality of foot care forpeople with diabetes. Targeted preventive services can identify those at risk of ulceration and improveoutcomes, and rapid access to multi-disciplinary foot care can lead to faster healing, fewer amputationsand improved survival.
Executive Summary
Lower estimate Upper estimate
Primary, community and outpatient care £306,508,970 £323,062,601
Accident and emergency £849,278
Inpatient care – ulceration £213,151,916 £213,151,916
Inpatient care – amputation £43,546,901 £48,896,735
Post-amputation care £75,807,423 £75,807,423
Total £639,015,210 £661,767,953

8
7. Clinical and economic evidence suggests that multidisciplinary diabetic foot care teams (MDTs) withstrong links to community podiatry services can improve patient outcomes and generate savings for theNHS that substantially exceed the cost of the team. For example, lower-extremity amputation rates(major and minor combined) at James Cook University Hospital, Middlesbrough, fell by two-thirds afterthe introduction of an MDT. The annual cost of the team is estimated, in 2010–11 prices, at £33,000.The annual saving to the NHS from averted amputations is estimated at £249,000, more than seventimes the cost of the team. Monetised quality-adjusted life-year (QALY) gains (at a value of £25,000 perQALY) over a 5-year perspective for a 1-year cohort of patients who averted major amputation areestimated at £151,000.
8. It is believed that around one-fifth of hospitals providing inpatient care for people with diabetes haveno MDT. In many areas of the country there are no clear pathways for referral of increased-risk or high-risk patients to foot protection teams, or for rapid referral of patients with new ulcers to MDTs, asrecommended in clinical guidelines from the National Institute for Health and Clinical Excellence (NICE).

9
9. The purpose of this paper is to summarise the health economic evidence relating to foot care indiabetes, and to examine the potential for quality and productivity improvements.
10. A pragmatic review of available clinical and economic evidence has been conducted, identifyingrelevant papers and assessing the robustness of the evidence presented. A systematic review of allavailable evidence has not been conducted and is beyond the scope of this paper. A systematic reviewof interventions for foot ulcers in diabetes was published in 20121.
11. The National Institute for Health and Clinical Excellence (NICE) published clinical guidelines for theprevention and management of foot problems in type 2 diabetes in 2004,3 guidelines for type 1diabetes in 2011,2 and guidelines for inpatient management of diabetic foot problems in 2011.4 NICEDiabetes in Adults Quality Standards (2011) include a standard relating to foot care.5 A NationalMinimum Skills Framework for commissioning foot care services for people with diabetes waspublished in 2011.6 Diabetes UK and NHS Diabetes published Putting Feet First, guidance on themanagement and prevention of diabetic foot disease in hospitals, in 2009,7 and NHS Diabetespublished a commissioning guide for diabetes foot care services in 2010.8 This paper takes thestandards set out in these publications as a framework. Reference is made to the evidence reviewed inthese publications, where appropriate.
12. The paper is divided into four sections. Section I examines the scale of the problem – the incidenceand prevalence of foot problems in diabetes, the impact on quality of life, prognosis and mortality, andavailable evidence on the quality of current care. Section II examines clinical and economic evidenceon the potential to improve foot care in diabetes, and for such improvements to be cost effectiveand/or cost saving. Section III sets out cost estimates of current foot care for people with diabetes inEngland. Section IV examines the impact of MDTs on patient outcomes and NHS costs.
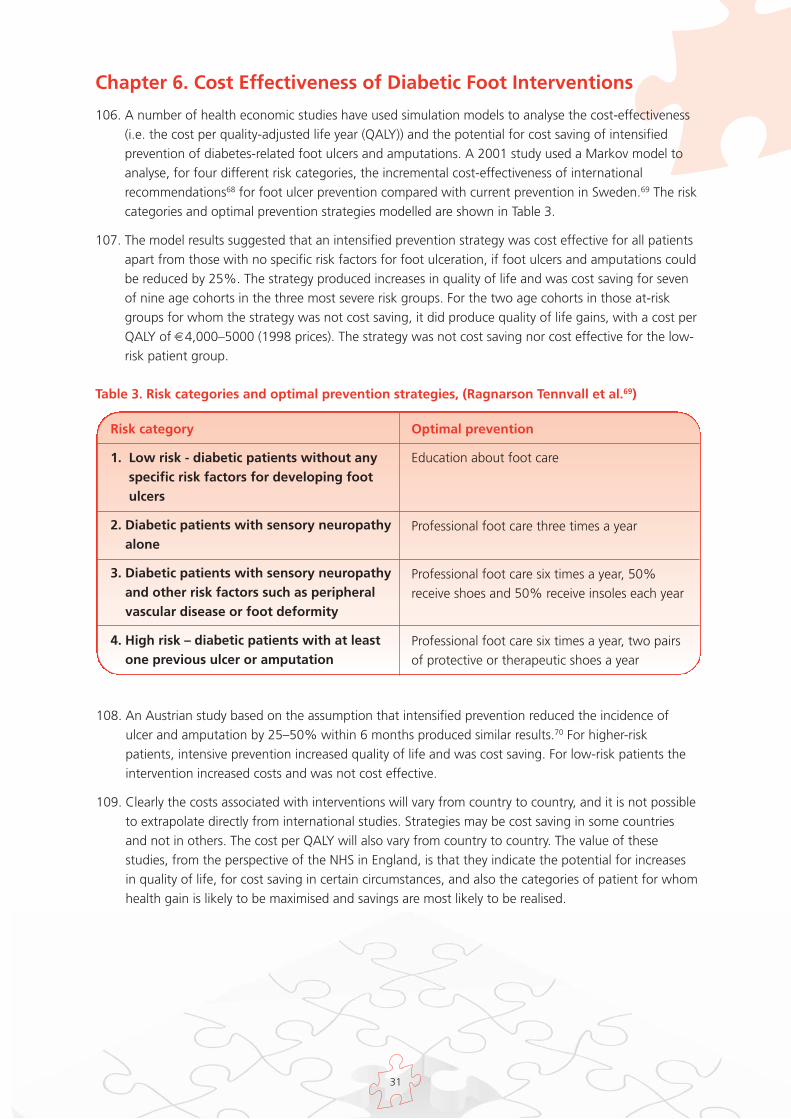
Introduction

10
Chapter 1. Incidence and Prevalence of Foot Ulceration andAmputation in Diabetes
13. Foot complications are common in people with diabetes. A community based study of 811 peoplewith type 2 diabetes from 37 general practices in Manchester, Salford and Sheffield in 1994 foundthat 5.3% had current or past foot ulcers.9 An earlier study of all diabetic patients in ten GP practicesfound the prevalence of past or present foot ulceration was 7.4%, as compared with 2.5% in a non-diabetic comparison group10. The Oxford Community Diabetes Study found foot ulcer prevalence of7% in diabetic patients aged 60 years or more.11
14. A community-based study of 9,710 diabetic patients in North-West England, published in 2002, foundan average annual incidence of foot ulcers of 2.2%.12 (This figure relates to the percentage of patientsexperiencing at least one new foot ulcer in a year. As some patients are likely to have ongoing ulcersfrom previous years, the total number of patients with foot ulcers in a year cannot be extrapolatedfrom these figures).
15. Data on foot ulcer incidence and prevalence in diabetes are not collected at national level in England.In Scotland the SCI-DC Network extracts diabetes-related data from almost all GP practices andspecialist diabetes clinics. 2.5% of the diagnosed diabetes population in Scotland had current footulcers at the beginning of December 2010.13 Data from one English foot care clinic, Salford Royal NHSFoundation Trust, indicate that approximately 2.5% of the local diabetes population have foot ulcersat any given time.14
16. If it is assumed that national ulceration rates in England are similar to those in Scotland and Salford,we can estimate that 61,400 people with diabetes in England have foot ulcers at any given time. Thisfigure is based on the diagnosed diabetes population in England, as measured in the Quality andOutcomes Framework (QOF).15 This is likely to be an under-estimate, as it does not include people whohave undiagnosed diabetes. The Association of Public Health Observatories recently estimated thattotal diabetes prevalence may be as much as 27% higher than the figure derived from QOF registers.16
17. As indicated above, the prevalence of diabetic foot ulcers (current or past) has been estimated at 5–7% of the diabetes population. This would suggest that around 130,000–180,000 people withdiabetes have current or past foot ulcers. Again, these figures are based on the diagnosed diabetespopulation, as recorded in the QOF. The true figure may be higher in view of undiagnosed diabetesprevalence.
18. The burden of diabetic foot disease is likely to increase; the incidence of type 2 diabetes is rising andcontributory factors to foot disease, such as peripheral neuropathy and vascular disease, are present inmore than 10% of people at the time of diagnosis of type 2 diabetes.17
19. The National Diabetes Audit (NDA) estimated that approximately seven out of every 10,000 peoplewith diabetes underwent a major lower extremity amputation in 2009–10, and 13 out of 10,000 hada minor amputation.18 A recent study found that there were 25.1 lower extremity amputations (majorand minor) a year for every 10,000 people with diabetes between 2007 and 2010. The risk of aperson with diabetes undergoing a lower extremity amputation was estimated at 23 times that of aperson without diabetes.19
20. It is considered likely that many such amputations and much of the morbidity associated with footulcers are avoidable. The St. Vincent Declaration (1989) called for a 50% reduction across Europe inamputations for diabetic gangrene.20
Section I The Scale of the Problem

11
21. The complications of the diabetic foot include peripheral arterial (or vascular) disease and neuropathy.Neuro-ischaemia is a combination of these two complications.
22. In peripheral arterial disease the large blood vessels supplying the lower limbs become narrowed byatheroma resulting in reduced blood flow to the legs and feet. This can cause pain on exercise andimpaired skin nutrition, which in turn can lead to ulceration and impaired healing. Complete loss ofblood supply results in gangrene which can be local or extensive depending on the extent of thevascular lesion.
23. Neuropathy, or nerve damage, causes loss of sensation, which increases the risk of undetected injuryand skin ulceration. Neuropathy can also give rise to altered foot shape, resulting in areas on theplantar surface of the foot being subjected to high pressure on walking or standing. These areas, ifnot protected, can ulcerate.
24. Neuro-ischaemic feet are also prone to ulceration from localised pressure damage. Ulcers related toneuro-ischaemia are less likely to heal than other ulcers and have a greater risk of progressing togangrene and amputation because of impaired blood supply.
25. All foot ulcers are susceptible to infection, which can spread rapidly causing extensive tissuedestruction. Infection is the main reason for major amputation in neuropathic feet. Infection is alsocommonly the final pathway to amputation in ischaemic and neuro-ischaemic feet. Infection in thefeet can spread elsewhere through the blood, with potentially life-threatening consequences.
12
Chapter 2. Impact of Ulceration and Amputation on Quality of Life
26. Ulceration and amputation substantially reduce quality of life, and are associated with increasedmortality. Some foot ulcers are extremely painful, and treatment often requires that a considerableamount of time is spent on clinic visits, hospitalisation and frequent changes of wound dressings. Thiscan impinge on many aspects of patients’ family and working lives. Amputations and the resultingdisability can result in long-term changes to patients’ mobility, living conditions, and relationships.
27. A review of literature on the quality of life of patients with foot complications associated with diabetesnoted that there were very few data on the life experiences of patients with infection and diabeticfoot ulceration.21
28. Many different questionnaires and interview techniques are used for the assessment of quality of life,and utility scores for individual health states can vary widely depending on the technique adopted. Ifcost utility analyses are used to inform healthcare resource allocation decisions, it is important thatthere is comparability across the studies used.
29. A recent randomised controlled trial (RCT) of the use of three dressing preparations in themanagement of chronic foot ulcers used the Short Form 6D (SF-6D) instrument to assess quality oflife.22 The study included 229 patients who had foot ulcers with a cross-sectional area of between 25and 2500 mm2 and of at least six weeks duration at enrolment. Patients who had ulcers extending totendon, periosteum or bone, infection of bone or soft tissue infection requiring treatment withsystemic antibiotics at enrolment were excluded.
30. SF-6D scores are derived from patient questionnaires covering six domains: pain, mental health,vitality, physical functioning, social functioning and role limitation. An index score between 0 and 1 isderived (with 1 representing perfect health) by attaching weights to each level in each domain. Theseweights are derived from valuation of health states in general population surveys.
31. Mean scores for patients with foot ulcers in the dressing preparation RCT ranged from 0.37 to 0.40,depending on the type of dressing and trial stage. For illustration purposes, these scores may becompared with those recorded in health economic studies for patients with a range of long-termconditions, as shown in Figure 1. (For strict comparison, one would require matched patient groupsand use of the same weighting system. However, the approach shown here may provide someindication of the quality of life of foot ulcer patients relative to those with other conditions).
32. The SF-6D scores from the RCT suggest that the quality of life of patients with foot ulcers is lowerthan that of patients with osteoarthritis (0.52), or Chronic Obstructive Pulmonary Disease (0.62),23 andlower than that of patients undergoing dialysis (0.67)24. It should be noted that the foot ulcer scoresare derived from a patient group without conditions such as severe peripheral arterial disease. As suchconditions are associated with increased ulcer duration and increased complication rates, it is possiblethat quality of life is lower in excluded patients than in the study sample.

13
0
0.1
0.2
0.3
0.4
0.5
0.6
0.7
0.8
0.9
1
Diabetic footulcer
Osteoarthritis COPD Dialysis Healthy Age75+
Mea
n S
F-6D
sco
re
33. A Swedish study used the EQ-5D instrument to estimate the quality of life of people with diabetic footdisease.25 EQ-5D scores are derived from patient questionnaires covering five domains: mobility,pain/discomfort, anxiety/depression, ability to care for oneself, and ability to perform usual tasks.
34. Questionnaires were sent to 457 patients treated by a multidisciplinary diabetic foot care team (MDT)between 1995 and 1998. A mean index score of 0.44 was derived for patients with current foot ulcers(without previous amputation), 0.6 for those whose ulcers had healed without amputation, 0.61 forthose who had undergone minor amputation and 0.31 for patients who had undergone majoramputation, as shown in Figure 2.
Figure 2. EQ-5D scores for patients with foot ulcers and amputation (Source: Ragnarson Tennvallet al.25)
0
0.1
0.2
0.3
0.4
0.5
0.6
0.7
0.8
0.9
1
Current foot ulcer Primary healed, noamputation
Minor amputation Major amputation
Mea
n E
Q-5
D s
core
Figure 1. Health-related quality of life (SF-6D) scores for people with diabetic foot ulcers andother long-term conditions, and for healthy people aged over 75 (Source: Jeffcoate et al,22
Brazier et al,23 Davison et al.24)

14
39. Other studies have used instruments or methods that do not produce a single index score. Theseresults cannot be used for health economic analysis. They can however aid understanding of quality oflife impacts within individual quality of life domains, such as pain, physical function and energy level.
40. A U.S. study assessed the quality of life of two focus groups of patients and a control group, eachconsisting of 20 people with diabetes.29 The first focus group was undergoing treatment for diabetic
0
0.1
0.2
0.3
0.4
0.5
0.6
0.7
0.8
0.9
1
Majoramputation
Diabetic footulcer
Osteoarthritis COPD Haemodialysis Diabetes,macrovascularcomplications
Mea
n E
Q-5
D s
core
35. EQ-5D, like SF-6D, can be used for economic evaluation. However, quality of life scores for individualhealth states can vary substantially depending on the measurement instrument used. If cost utilityanalyses are used to inform healthcare resource allocation decisions, it is important that there iscomparability across the studies used. For this reason, NICE has specified that EQ-5D is the preferredmeasure for cost effectiveness analysis in the NHS in England.26
36. The EQ-5D scores from the Swedish study have been compared with those recorded with the sameinstrument for patients with type 2 diabetes with macrovascular complications (but no foot ulcers) andwith scores for patients with a range of other long-term conditions, as shown in Figure 3. Again, thesecomparisons should be treated as illustrative. To achieve perfect comparability, it would be necessaryto ensure matched populations and use of the same weighting system across studies.
37. Broadly, the EQ-5D comparison confirms the findings of the comparison of SF-6D scores, suggestingthat patients with diabetic foot ulcers have a lower health-related quality of life than people withchronic obstructive pulmonary disease (COPD) or those on haemodialysis27. (The score forosteoarthritis is relatively low in EQ-5D compared with SF-36).
38. Scores for people with diabetes who have undergone major amputation are lower than for all othergroups examined here. (It should be noted however that the major amputation scores are based onsmall patient numbers). Scores for patients with foot ulcer and for people who have undergoneamputation are considerably lower than those for people with type 2 diabetes and macrovascularcomplications who do not have foot ulcers.28
Figure 3. Health-related quality of life (EQ-5D) scores for people with diabetic foot ulcers andother long-term conditions (Sources: Ragnarson Tennvall et al,25 U.K. Prospective Diabetes StudyGroup,28 Brazier et al,23 Wasserfallen et al.27)
15
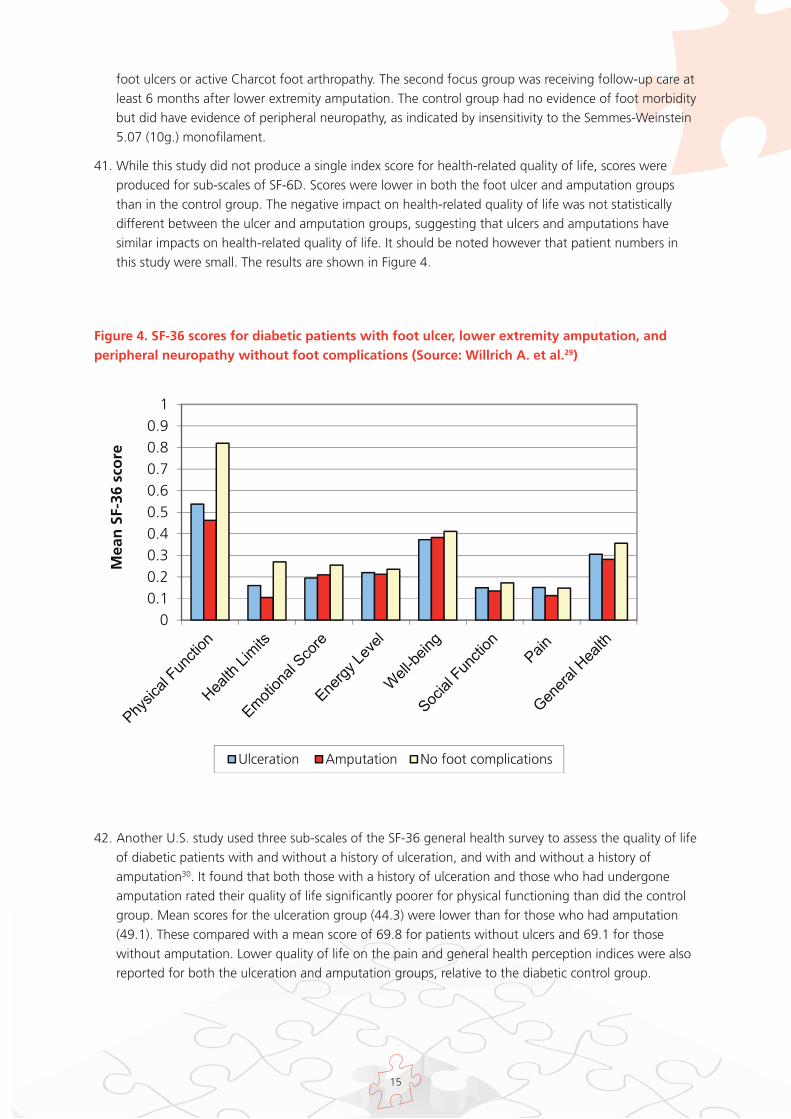
Figure 4. SF-36 scores for diabetic patients with foot ulcer, lower extremity amputation, andperipheral neuropathy without foot complications (Source: Willrich A. et al.29)
42. Another U.S. study used three sub-scales of the SF-36 general health survey to assess the quality of lifeof diabetic patients with and without a history of ulceration, and with and without a history ofamputation30. It found that both those with a history of ulceration and those who had undergoneamputation rated their quality of life significantly poorer for physical functioning than did the controlgroup. Mean scores for the ulceration group (44.3) were lower than for those who had amputation(49.1). These compared with a mean score of 69.8 for patients without ulcers and 69.1 for thosewithout amputation. Lower quality of life on the pain and general health perception indices were alsoreported for both the ulceration and amputation groups, relative to the diabetic control group.
00.10.20.30.40.50.60.70.80.9
1
Mea
n S
F-36
sco
re
Ulceration Amputation No foot complications
foot ulcers or active Charcot foot arthropathy. The second focus group was receiving follow-up care atleast 6 months after lower extremity amputation. The control group had no evidence of foot morbiditybut did have evidence of peripheral neuropathy, as indicated by insensitivity to the Semmes-Weinstein5.07 (10g.) monofilament.
41. While this study did not produce a single index score for health-related quality of life, scores wereproduced for sub-scales of SF-6D. Scores were lower in both the foot ulcer and amputation groupsthan in the control group. The negative impact on health-related quality of life was not statisticallydifferent between the ulcer and amputation groups, suggesting that ulcers and amputations havesimilar impacts on health-related quality of life. It should be noted however that patient numbers inthis study were small. The results are shown in Figure 4.
16
Chapter 3. Prognosis and Mortality
43. Only two thirds of diabetic foot ulcers eventually heal without surgery31,32,33. Up to 28% may result insome form of amputation.34 Patients who have had a foot ulcer are at increased risk of further ulceration.
44. A 2005 study of all (370) patients referred to a specialist foot clinic in Nottingham over 31 months foundthat 231 (62.4%) became ulcer-free at some stage. Five of these were excluded from the study because ofan earlier amputation. Ninety-one of the remaining 226 (40.3%) developed a recurrent or new ulcer aftera median 126 days.33 A UK RCT of the use of dressing preparations found that 26% of those whoseulcers healed during the trial had active ulceration at 3-month follow-up.22 A study examining the role offoot care education in secondary ulcer prevention in patients with newly healed ulcers found that theincidence of ulceration at 12 months was 41% in both the intervention and control groups.35
45. In a 6.5 year follow-up study of 94 consecutive patients with diabetic foot ulcers admitted to a Frenchhospital the primary healing rate was 77.5%. However, 60.9% of these patients experienced furtherulceration and 43.8% underwent amputation within a mean follow-up period of 79 months.36 ASwedish study of 558 consecutive patients found that 34% developed a new foot ulcer within oneyear, and 70% within five years.32
46. There are many studies indicating that the prognosis of patients who have undergone a majoramputation is poor; the limb on the other side is at risk, and research suggests that only around 50%of patients who have had a major amputation survive for a further two years.37 A recent study usingHospital Episode Statistics (HES) data and Office for National Statistics (ONS) mortality data forEngland showed a 1-year mortality rate of 32.7% for patients who underwent non-traumatic majoramputation in diabetes in 2004-05. For those who had minor amputation, the 1-year mortality ratewas 18.3%.38 Five-year cumulative mortality for patients with diabetes undergoing a first majoramputation has been estimated at 68%39 to 78.7%.40 The Strong Heart Study of the American Indianpopulation found that lower extremity amputation in diabetes was a significant predictor of all-causemortality (hazard ratio 2.2 after mean follow up of 8.7 years) after adjustment for potentialconfounders including age, diabetes duration, Body Mass Index, albuminuria and LDL cholesterol.41
47. Even without amputation, diabetic foot ulcers are associated with high levels of mortality. A 5-yearmortality rate of 44% was observed in a study of patients presenting with new ulcers at a Liverpoolfoot clinic.42 In the French study cited above, the mortality rate after average follow-up of 6.5 yearswas 51.7%.36 A Swedish study found a 5-year mortality rate of 42% in patients who experiencedprimary ulcer healing.32
48. The 5-year mortality rate observed in the Liverpool study42 (44%) is similar to that for patients with coloncancer and very much higher than mortality rates for patients with breast cancer and prostate cancer.
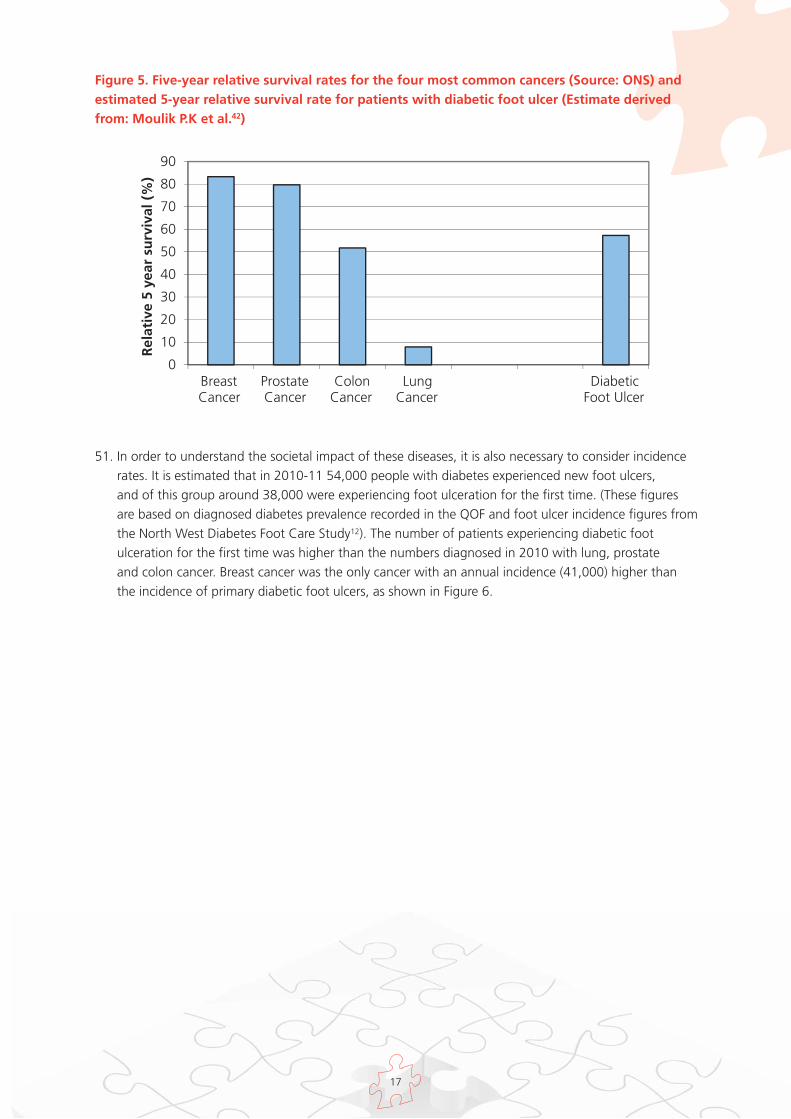
49. Figure 5 shows relative age-adjusted 5-year survival rates for the four most common cancers, takenfrom Office for National Statistics (ONS) data43, and estimated relative survival for diabetic foot ulcers,based on data from the Liverpool study. Relative survival is the ratio of the observed survival and thesurvival that would have been expected if the patients had only experienced the background mortalityseen in the general population.
50. In the case of diabetic foot ulcers, unlike cancers, there are no routine data sets that provideinformation on incidence, survival, or patient-level characteristics. Incidence and survival rates musttherefore be estimated, and are subject to a degree of uncertainty. The survival estimate shown here isextrapolated from the Liverpool study population, and it is not possible to adjust exactly for expectedsurvival. In order to produce an illustrative relative survival estimate, the Liverpool survival figure hasbeen adjusted to allow for expected survival in the general population aged 70–74 years. Using thisadjustment it is estimated that 5-year relative survival for patients with diabetic foot ulcer is around57%. This compares with 83% for patients with breast cancer and 52% for those with colon cancer.
17
51. In order to understand the societal impact of these diseases, it is also necessary to consider incidencerates. It is estimated that in 2010-11 54,000 people with diabetes experienced new foot ulcers, and of this group around 38,000 were experiencing foot ulceration for the first time. (These figuresare based on diagnosed diabetes prevalence recorded in the QOF and foot ulcer incidence figures fromthe North West Diabetes Foot Care Study12). The number of patients experiencing diabetic footulceration for the first time was higher than the numbers diagnosed in 2010 with lung, prostateand colon cancer. Breast cancer was the only cancer with an annual incidence (41,000) higher thanthe incidence of primary diabetic foot ulcers, as shown in Figure 6.
Figure 5. Five-year relative survival rates for the four most common cancers (Source: ONS) andestimated 5-year relative survival rate for patients with diabetic foot ulcer (Estimate derivedfrom: Moulik P.K et al.42)
0
10
20
30
40
50
60
70
80
90
BreastCancer
ProstateCancer
ColonCancer
LungCancer
DiabeticFoot Ulcer
Rel
ativ
e 5
year
su
rviv
al (
%)

18
52. It is important to note that while high mortality may be associated with diabetic foot ulcers, this doesnot imply that deaths in these patients can be attributed to foot ulceration. In many cases, patientswith diabetic foot ulcers have related cardiovascular disease and advanced diabetes complications.Studies suggest that mortality is higher in diabetic foot ulcer patients with ischaemia, renal impairmentor pre-existing cardiovascular disease than in those without these comorbidities.44
Figure 6 Annual incidence of the four most common cancers (Source: ONS) and estimated annualincidence of primary diabetic foot ulcers (Estimates derived from Abbott et al.12 and QOFdiabetes prevalence data15)
0
5,000
10,000
15,000
20,000
25,000
30,000
35,000
40,000
45,000
BreastCancer
ProstateCancer
LungCancer
ColonCancer
Diabeticfoot ulcer
An
nu
al In
cid
ence
(fi
rst
occ
urr
ence
)
19
Chapter 4. Quality of Foot Assessment and Care
53. NICE clinical guidelines set out the principles of good quality assessment and care.2,3,4 These weresupplemented by a National Minimum Skills Framework for commissioning foot care services forpeople with diabetes in 2011.6
54. It is not possible systematically to assess the quality of care against these principles, as nationaldatasets do not measure the activities set out in these documents. However, the available evidence onthe quality of foot care will be summarised here.
55. The QOF contains two indicators relating to diabetic foot assessment.15 The indicators for 2010-11 areshown in Table 1.
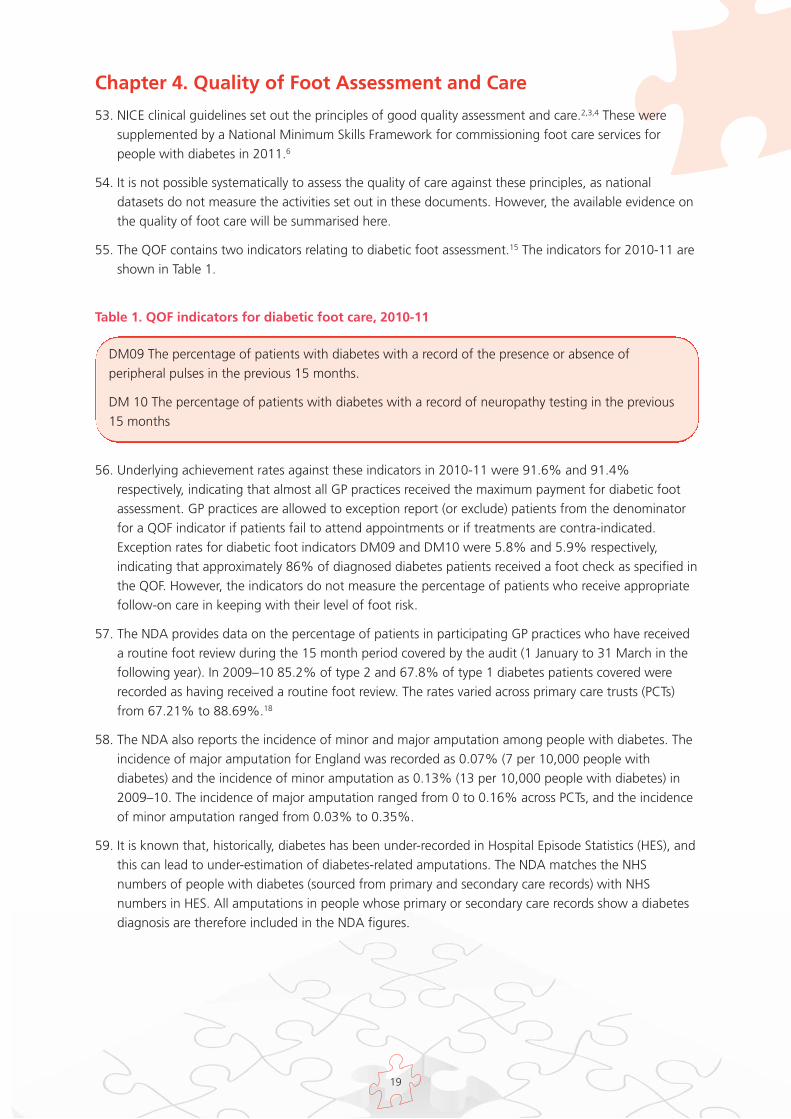
Table 1. QOF indicators for diabetic foot care, 2010-11
56. Underlying achievement rates against these indicators in 2010-11 were 91.6% and 91.4%respectively, indicating that almost all GP practices received the maximum payment for diabetic footassessment. GP practices are allowed to exception report (or exclude) patients from the denominatorfor a QOF indicator if patients fail to attend appointments or if treatments are contra-indicated.Exception rates for diabetic foot indicators DM09 and DM10 were 5.8% and 5.9% respectively,indicating that approximately 86% of diagnosed diabetes patients received a foot check as specified inthe QOF. However, the indicators do not measure the percentage of patients who receive appropriatefollow-on care in keeping with their level of foot risk.
57. The NDA provides data on the percentage of patients in participating GP practices who have receiveda routine foot review during the 15 month period covered by the audit (1 January to 31 March in thefollowing year). In 2009–10 85.2% of type 2 and 67.8% of type 1 diabetes patients covered wererecorded as having received a routine foot review. The rates varied across primary care trusts (PCTs)from 67.21% to 88.69%.18
58. The NDA also reports the incidence of minor and major amputation among people with diabetes. Theincidence of major amputation for England was recorded as 0.07% (7 per 10,000 people withdiabetes) and the incidence of minor amputation as 0.13% (13 per 10,000 people with diabetes) in2009–10. The incidence of major amputation ranged from 0 to 0.16% across PCTs, and the incidenceof minor amputation ranged from 0.03% to 0.35%.
59. It is known that, historically, diabetes has been under-recorded in Hospital Episode Statistics (HES), andthis can lead to under-estimation of diabetes-related amputations. The NDA matches the NHSnumbers of people with diabetes (sourced from primary and secondary care records) with NHSnumbers in HES. All amputations in people whose primary or secondary care records show a diabetesdiagnosis are therefore included in the NDA figures.
DM09 The percentage of patients with diabetes with a record of the presence or absence ofperipheral pulses in the previous 15 months.
DM 10 The percentage of patients with diabetes with a record of neuropathy testing in the previous15 months
20
0
10
20
30
40
50
60
70
80
90
2003-04 2004-05 2005-06 2006-07 2007-08 2008-09 2009-10
Perc
enta
ge
of
dia
bet
es p
op
ula
tio
n
rece
ivin
g f
oo
t re
view
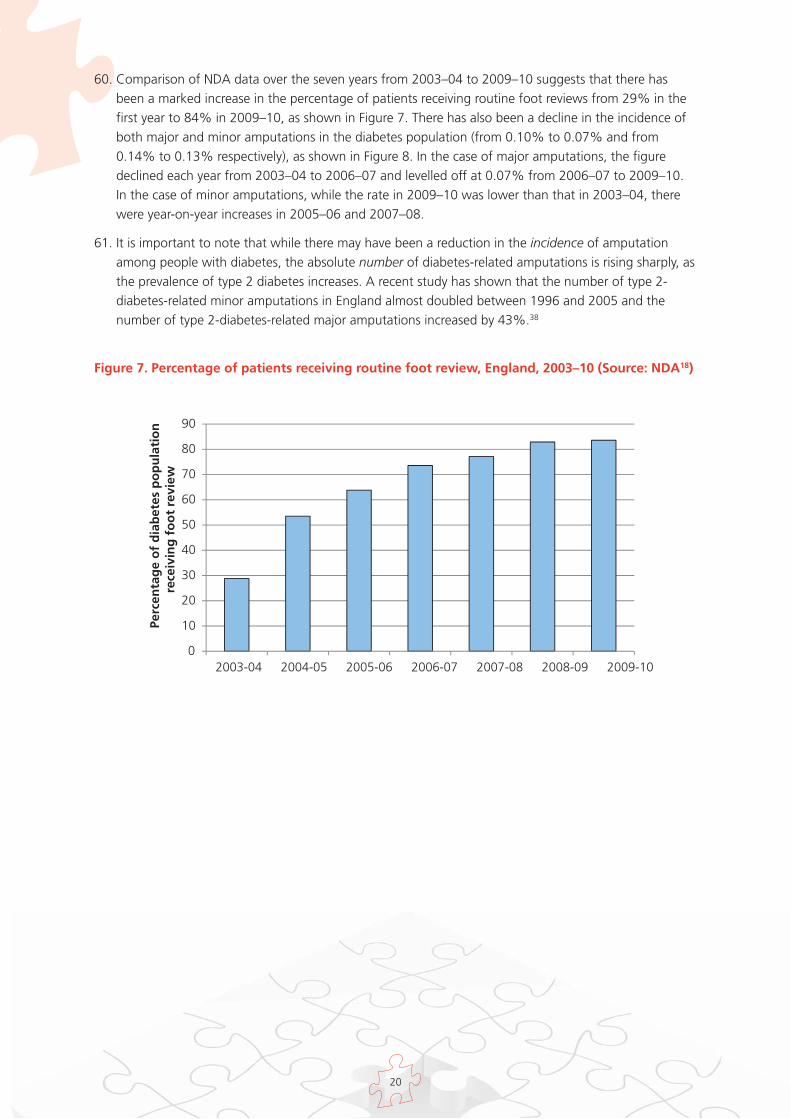
60. Comparison of NDA data over the seven years from 2003–04 to 2009–10 suggests that there hasbeen a marked increase in the percentage of patients receiving routine foot reviews from 29% in thefirst year to 84% in 2009–10, as shown in Figure 7. There has also been a decline in the incidence ofboth major and minor amputations in the diabetes population (from 0.10% to 0.07% and from0.14% to 0.13% respectively), as shown in Figure 8. In the case of major amputations, the figuredeclined each year from 2003–04 to 2006–07 and levelled off at 0.07% from 2006–07 to 2009–10.In the case of minor amputations, while the rate in 2009–10 was lower than that in 2003–04, therewere year-on-year increases in 2005–06 and 2007–08.
61. It is important to note that while there may have been a reduction in the incidence of amputationamong people with diabetes, the absolute number of diabetes-related amputations is rising sharply, asthe prevalence of type 2 diabetes increases. A recent study has shown that the number of type 2-diabetes-related minor amputations in England almost doubled between 1996 and 2005 and thenumber of type 2-diabetes-related major amputations increased by 43%.38
Figure 7. Percentage of patients receiving routine foot review, England, 2003–10 (Source: NDA18)

21
0.00
0.02
0.04
0.06
0.08
0.10
0.12
0.14
0.16
2003-04 2004-05 2005-06 2006-07 2007-08 2008-09 2009-10
Am
pu
tati
on
inci
den
ce (
% d
iab
etes
p
op
ula
tio
n)
Minor amputation Major amputation
Figure 8. Incidence of major and minor amputation among those diagnosed with diabetes,England, 2003–10 (Source: NDA18)
62. A recent study reports that, over a 3 year period to 2010, lower extremity amputation rates (major andminor) in people with diabetes varied 8-fold across PCTs.19 The incidence of amputation (major orminor) per 10,000 person years for people with diabetes was 25.1 for England, with PCT rates rangingfrom 6.4 to 52.5. The rate in people with diabetes was 23 times that in the non-diabetes population.For major amputations, the variation across PCTs was 10-fold. The study found that the incidence ofamputation was negatively correlated with the proportion of the population from Asian ethnic groupsand Black ethnic groups.
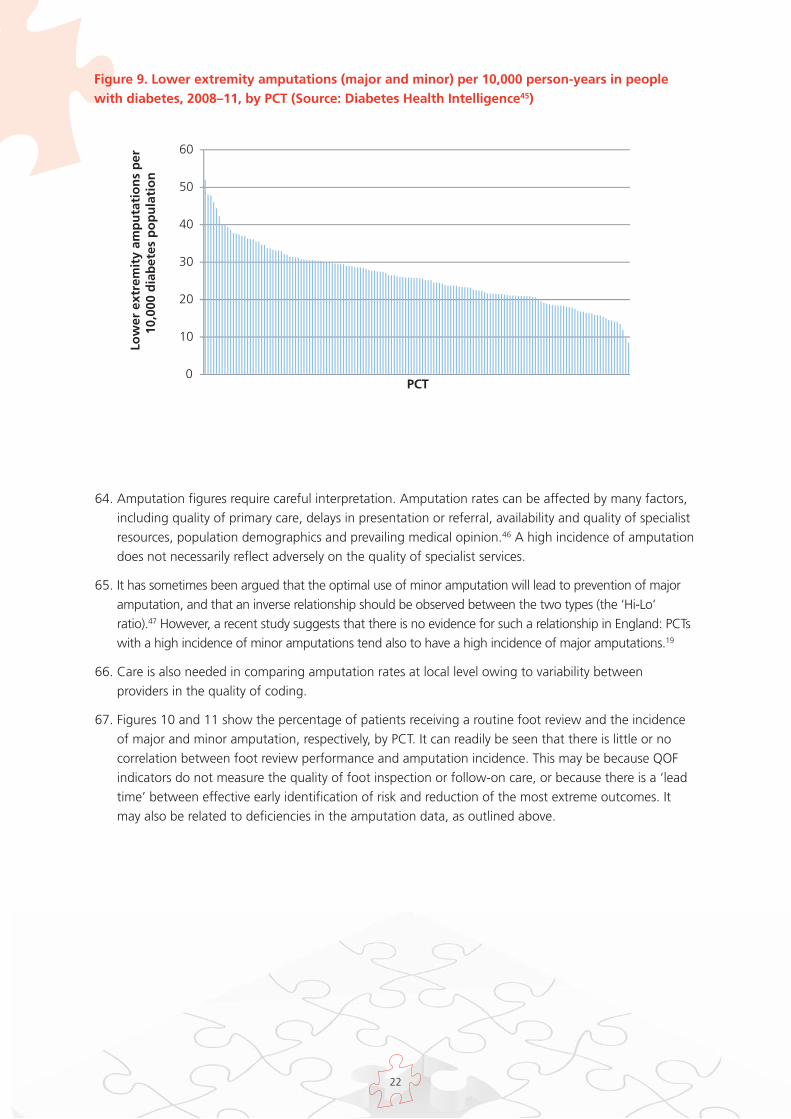
63. Updated figures for 2008–11 have been produced by the Yorkshire and Humber Public HealthObservatory (YHPHO). Over this time period the incidence of lower extremity amputation (major andminor) varied across PCTs from 8.4 to 52, as shown in Figure 9. More detailed PCT-level data onamputation rates and foot-related admissions in diabetes are available from Diabetes HealthIntelligence.45
22
0
10
20
30
40
50
60Lo
wer
ext
rem
ity
amp
uta
tio
ns
per
10
,000
dia
bet
es p
op
ula
tio
n
PCT
64. Amputation figures require careful interpretation. Amputation rates can be affected by many factors,including quality of primary care, delays in presentation or referral, availability and quality of specialistresources, population demographics and prevailing medical opinion.46 A high incidence of amputationdoes not necessarily reflect adversely on the quality of specialist services.
65. It has sometimes been argued that the optimal use of minor amputation will lead to prevention of majoramputation, and that an inverse relationship should be observed between the two types (the ‘Hi-Lo’ratio).47 However, a recent study suggests that there is no evidence for such a relationship in England: PCTswith a high incidence of minor amputations tend also to have a high incidence of major amputations.19
66. Care is also needed in comparing amputation rates at local level owing to variability betweenproviders in the quality of coding.
67. Figures 10 and 11 show the percentage of patients receiving a routine foot review and the incidenceof major and minor amputation, respectively, by PCT. It can readily be seen that there is little or nocorrelation between foot review performance and amputation incidence. This may be because QOFindicators do not measure the quality of foot inspection or follow-on care, or because there is a ‘leadtime’ between effective early identification of risk and reduction of the most extreme outcomes. Itmay also be related to deficiencies in the amputation data, as outlined above.
Figure 9. Lower extremity amputations (major and minor) per 10,000 person-years in peoplewith diabetes, 2008–11, by PCT (Source: Diabetes Health Intelligence45)

23
Figure 10. Incidence of major amputation and routine foot review by PCT, as percentages ofpeople with diabetes, 2009-10 (Source: National Diabetes Audit18)
0.00
0.02
0.04
0.06
0.08
0.10
0.12
0.14
0.16
0.18
0 20 40 60 80 100
Maj
or
amp
uta
tio
n (
% d
iab
etes
p
op
ula
tio
n)
Routine foot review (% diabetes population)
Figure 11. Incidence of minor amputation and routine foot review by PCT, as percentages ofpeople with diabetes, 2009-10 (Source: National Diabetes Audit18)
0.00
0.05
0.10
0.15
0.20
0.25
0.30
0.35
0.40
0 20 40 60 80 100
Min
or
amp
uta
tio
n (
% d
iab
etes
p
op
ula
tio
n)
Routine foot review (% diabetes population)
24
68. As indicated above, there is a dearth of data for most aspects of diabetic foot care. There are currently nonational data on the provision of services, quality of care, or outcomes for patients along most of thepatient pathway. Even in the acute setting, routine data sets do not capture the quality of foot care orprovide information on outcomes apart from amputation.
69. The National Diabetes Inpatient Audit provides a fuller picture of the acute section of the pathway.48
In 2010, only 22.6% of inpatients with diabetes included in the audit had documentation in their casenotes of a foot examination within 24 hours of admission. A further 4.9% of inpatients had adocumented examination of their feet later in their hospital stay. Almost three quarters of inpatients withdiabetes had no documented foot examination during their inpatient stay.
70. Five per cent of all inpatients with diabetes had been admitted specifically for foot disease. 9.4% had afoot complication when admitted to hospital and a further 1.3% developed a foot complication duringtheir hospital stay. (In total, 2.2% developed a new foot complication while in hospital, including patientswho had foot problems when admitted and developed further problems during their stay). Of those whodeveloped new foot complications in hospital, almost half (49.6%) had no input from an MDT.
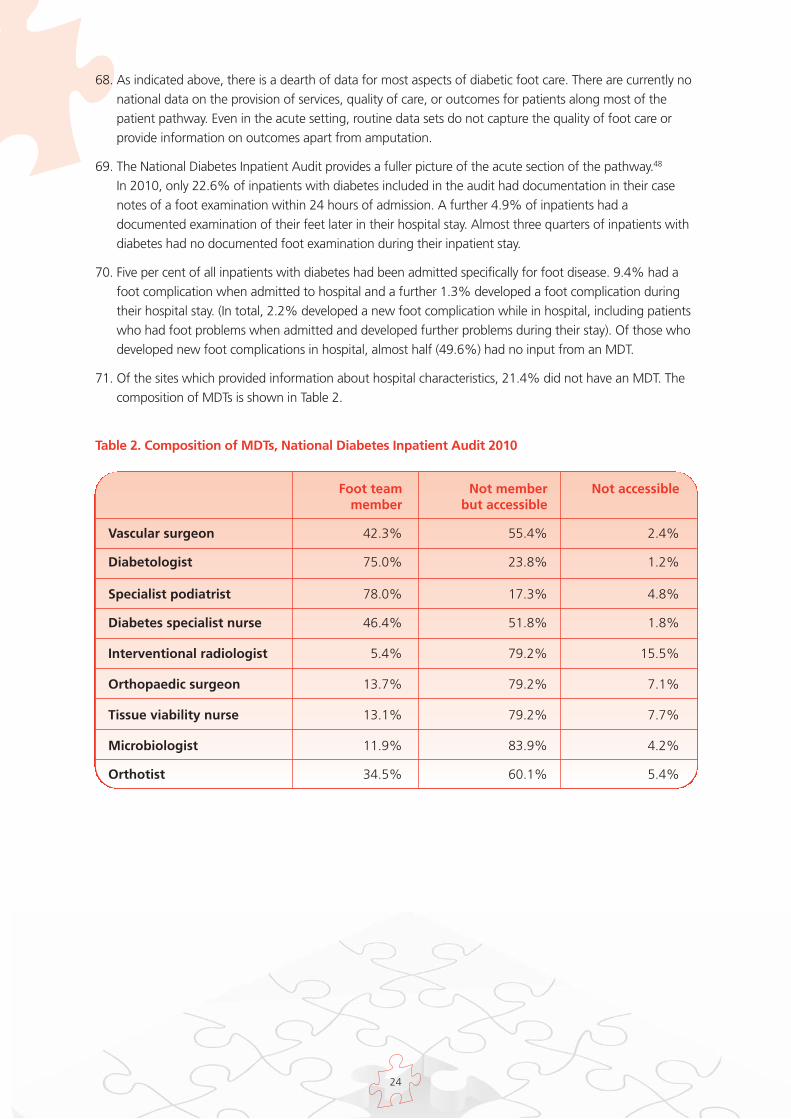
71. Of the sites which provided information about hospital characteristics, 21.4% did not have an MDT. Thecomposition of MDTs is shown in Table 2.
Table 2. Composition of MDTs, National Diabetes Inpatient Audit 2010
Foot team Not member Not accessiblemember but accessible
Vascular surgeon 42.3% 55.4% 2.4%
Diabetologist 75.0% 23.8% 1.2%
Specialist podiatrist 78.0% 17.3% 4.8%
Diabetes specialist nurse 46.4% 51.8% 1.8%
Interventional radiologist 5.4% 79.2% 15.5%
Orthopaedic surgeon 13.7% 79.2% 7.1%
Tissue viability nurse 13.1% 79.2% 7.7%
Microbiologist 11.9% 83.9% 4.2%
Orthotist 34.5% 60.1% 5.4%
25
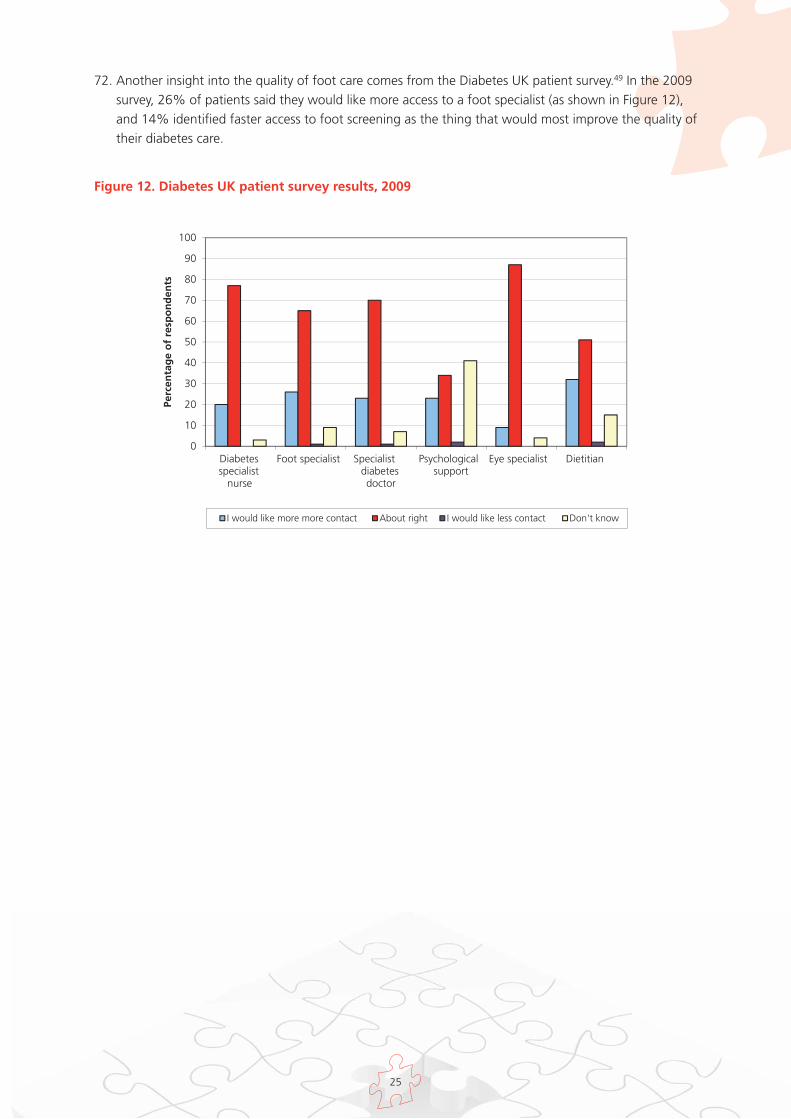
72. Another insight into the quality of foot care comes from the Diabetes UK patient survey.49 In the 2009survey, 26% of patients said they would like more access to a foot specialist (as shown in Figure 12),and 14% identified faster access to foot screening as the thing that would most improve the quality oftheir diabetes care.
Figure 12. Diabetes UK patient survey results, 2009
0
10
20
30
40
50
60
70
80
90
100
Diabetesspecialist
nurse
Foot specialist Specialistdiabetesdoctor
Psychologicalsupport
Eye specialist Dietitian
Perc
enta
ge
of
resp
on
den
ts
I would like more more contact About right I would like less contact Don't know
26
Chapter 5. Clinical Impact of Diabetic Foot Interventions
73. Key evidence on interventions to improve the quality of outcomes for patients with diabetes who havefoot problems, or are at risk of such problems, will be summarised here. It is not the intention in thispaper to provide a comprehensive review of the literature. The Scottish Intercollegiate GuidelinesNetwork (SIGN) conducted a systematic literature review to inform their 2010 guidelines on themanagement of diabetes, including diabetic foot disease.50 They searched literature from 2003–09. Areview of earlier literature was conducted for the 2004 NICE guideline.2 This section should be read inconjunction with the literature summaries provided in those guidelines. Where possible, evidence fromEnglish studies has been used here, as it is believed that the organisation of services and paymentmechanisms are important factors in facilitating or impeding change, and therefore examples fromwithin the English NHS are most likely to be relevant to decision makers. Where necessary, these havebeen supplemented with international evidence.
74. It is important to note that comparison between studies is difficult because of differences in factorssuch as population selection, baseline values and definition. For example, major amputation may bedefined differently across studies, and substantial levels of reduction may be easier to achieve ifbaseline levels are unusually high. Direct comparison cannot therefore be made between outcomefigures or rates of change reported in different studies, except where this has been undertaken inmeta-analysis with appropriate adjustment for relevant variables.
75. The evidence in this section will be presented in the following categories:
Ulcer prevention
o assessment and care of patients at risk
o patient education
Ulcer management
o early expert assessment
o multidisciplinary foot team
o cardiovascular risk reduction
Ulcer prevention – assessment and care of patients at risk
76. NICE clinical guidelines recommend annual foot screening of all diabetic patients and targeting ofpreventive and treatment interventions to those at high risk.2,3,4 The National Minimum SkillsFramework sets out the skills and knowledge required for both routine basic assessment and expertassessment of the foot at increased risk.6
77. A systematic review of 16 studies quantified the value of diagnostic tests, physical signs, and elements fromthe patient’s history in predicting the likelihood of foot ulcers,51 It found that diagnostic tests and physicalsigns that detect peripheral neuropathy were helpful in predicting the risk of diabetic foot ulceration.
Section II Evidence on Clinical and CostEffectiveness of Diabetic Foot Care
27
78. High vibration perception thresholds using a biothesiometer or a tuning fork, high plantar pressureand 10g. monofilaments appeared to be reliable methods to identify those at risk of future ulceration.Absent ankle reflexes and limited joint motion were also found to increase the risk of foot ulceration.Evidence concerning the predictive value of other physical signs such as HbA1c and ankle brachialindices, and of diabetes duration, was less clear.
79. A more recent meta-analysis has concluded, however, that glycaemia (elevated HbA1c) is associatedwith a substantial increase in the risk of eventual lower extremity amputation.52 Based on anexamination of 14 studies, the authors found that the overall relative risk for lower extremityamputation was 1.26 for each percentage point increase in HbA1c. The increase in amputation riskprobably arises through increased incidence of neuropathy and peripheral arterial disease.
80. Further studies have found that risk stratification can identify those at increased risk of footulceration.53 A prospective observational follow-up study of 3,526 patients with diabetes attendingfor routine diabetes care found that foot ulceration at follow-up (1.7 years) was 83 times morecommon in high-risk patients and six times more common in moderate-risk patients than in thoseclassified as low-risk. The tool used for risk stratification involved assessment of patient history, footpulses, monofilament sensation and presence of foot deformity.
81. The impact of assessment and care services on ulcer incidence is difficult to quantify. No large-scaleRCTs have been identified in the literature. Indeed there are practical obstacles to such a trial in thegeneral diabetes population as very large patient numbers would be required to demonstrateeffectiveness. There is evidence that ulcer prevention services can have an impact on amputation rates,in particular for high-risk groups such as renal dialysis patients with diabetes. A summary of availableliterature is provided below.
82. A diabetic foot screening and protection programme at the Royal Liverpool University Hospitalbetween 1989 and 199354 allocated 1997 patients attending a general diabetic outpatient clinicrandomly to index and control groups. (An additional four patients who had active ulcers were placedin the index group). The control group received usual care, while the index group received footscreening and risk stratification. Those in the index group judged at high risk of ulceration wereentered into a foot protection programme. A diabetic foot clinic provided foot care, support hosiery,protective shoes and advice to this group. At 2-year follow-up a statistically significant difference inmajor amputation rates was reported between the index and control groups (one major amputation inthe index group and twelve in the control group). There were no statistically significant differences inthe rates of ulceration and minor amputation between the two groups. The evaluation also reportedthat the service was cost saving as the cost of amputations for the control group exceeded the cost ofthe screening and protection service for the index group.
83. An Austrian study assigned 91 diabetic patients with healed foot ulcers randomly to a group thatreceived monthly specialist chiropodist care and to a control group.55 After a median follow-up of 386days, 38% of patients in the chiropodist care group had experienced new foot ulcers, compared with57% of patients in the control group. Analysis of patient records indicated that some patients in thecontrol group had regular chiropodist care (at least once every five weeks, on average) while somepatients in the intervention group had no or infrequent chiropodist care. New ulcers occurred in 36%of patients who had received regular chiropodist care, and in 55% of those who received infrequentor no chiropodist care.
84. Care must be taken, however, in extrapolating from this study to the English NHS. Chiropodistconsultations are not generally included in routine care in Austria, whereas in England they are morewidely available. It cannot be assumed that the difference observed between the intervention and controlgroups would be replicated in a situation where chiropody care is provided as part of routine care.
28
85. In a U.S. study, 83 diabetes patients receiving kidney dialysis were randomised to study and controlgroups.56 Patients in the study group underwent a diabetes education programme and were followedup by a care manager who provided self-management education, diabetes self-care monitoring,motivational coaching, and foot checks. The baseline foot risk category in the control group worsenedfrom 2.7 to 3.3, whereas it was unchanged in the study group (2.2 to 2.0). There were noamputations in the study group versus five amputations in the control group.
86. A systematic review of evidence on the efficacy of methods advocated for the prevention of diabeticfoot ulcers in primary care57 reported on a Dutch randomised trial examining the impact of podiatriccare on ulceration in diabetic people with neuropathy. The index group (235 people) received podiatriccare at least twice a year and the control group (263 people) received no podiatric care. During thetrial duration (≤ 3 years) there was no difference in the incidence of foot ulcers, but the podiatric caregroup had fewer deep ulcers (6 vs. 12) infected ulcers (1 vs. 10) and hospital admission days (24 vs.346). It has not been possible, however, to review the Dutch trial in detail here as the data have notbeen published in a peer-reviewed journal
87. The systematic review concluded that periodic foot inspections were effective interventions to preventulceration, but that screening foot examinations were unlikely to reduce the incidence of footcomplications unless they led to appropriate specialist referrals.
Ulcer prevention – patient education
88. NICE recommends foot care education for all those at risk of foot ulcers.2 Studies of the effectivenessof structured education programmes for patients do not produce clear-cut results. A Cochranereview58 assessing the effects of patient education on prevention of foot ulcers in patients withdiabetes examined eleven RCTs. It concluded that there was insufficient robust evidence that limitedpatient education alone was effective in achieving clinically relevant reductions in ulcer andamputation incidence.
Ulcer management – early expert assessment
89. NICE recommends that those with foot care complications or foot ulcers should be referred to an MDTwithin 24 hours.2 The National Minimum Skills Framework recommends rapid expert assessment of allfoot ulcers, inflamed foot lesions and newly occurring foot pain.6
90. There is evidence that early expert assessment of patients with foot ulcers reduces amputation ratesand times to healing. Many of the studies in this area focus on neuropathic ulcers.
91. A 5-year study at City Hospital, Nottingham59 of all patients with neuropathic foot ulcers and withoutevidence of peripheral arterial disease or infection showed that 96.3% of all ulcers <1 cm2 at firstassessment healed without amputation, compared with 87.7% of those with area of 1–3 cm2 and71.9% of those with area >3 cm2. There was also a direct relationship between ulcer duration at firstassessment and cross-sectional area, and a positive correlation between ulcer duration at firstassessment and overall time to healing.
92. Logistic regression based on a pooled analysis of individual patient data from the standard care armsof five RCTs in the USA identified ulcer area, ulcer duration and the race of the patient as factors thatcontribute to healing.60
29
93. A cohort study at a multicentre wound care network in the USA reported that the percentage ofpatients with diabetic neuropathic foot ulcers who did not heal by the 20th week of care decreasedfrom 66% in 1988–90 to 49% in 1999. The improvement was attributed to earlier referral, smallerulcer size at referral and a higher proportion of lower-grade wounds at referral (wounds withoutexposed tendons, ligaments or joints and without infection).61
94. A 2001 study of patients at the Manchester Royal Infirmary and at a centre in the USA found thatulcer area at presentation correlated with time to healing. Ulcer area at presentation was greater inpatients who went on to have amputations than in those whose ulcers eventually healed. In this study,67% of ulcers were neuropathic.62
Ulcer management – multidisciplinary diabetes foot care team
95. As indicated above, NICE recommends that those with foot care complications or foot ulcers shouldbe referred to an MDT within 24 hours.2 The National Minimum Skills Framework says that themajority of established foot ulcerations require management by a specialist multi-disciplinary team.6
96. A number of studies present evidence that MDTs can reduce the rate of amputations. Care is needed,however, in comparing study results as the composition and function of such teams varies. Someteams, for example, focus only on hospital-based care while others include outreach services andcommunity-based early intervention services.
97. An 11-year study at Ipswich Hospital found that the annual incidence of major lower extremityamputation per 10,000 people with diabetes fell by 82% from 41.4 to 6.7 following the introductionof an MDT providing outpatient and inpatient care.63 The annual incidence of minor lower extremityamputation per 10,000 people with diabetes fell by 21% from 11.8 to 9.3. The study authors arguedthat prospective audit and yearly analysis of performance were likely to have contributed to theimprovements reported. They also pointed out that during the study period, there were improvementsin vascular, radiological and microbiological services as well as in multidisciplinary working.
98. A 5-year study in South Tees studied amputation incidence before and after the establishment of adedicated diabetic foot care team with a community- based chiropody service. This includedestablishment of care pathways and protocols for managing diabetic foot problems, with input from avascular surgeon, orthopaedic surgeon, orthotist, diabetic chiropodists, and a diabetologist. The annualmajor lower extremity amputation rate fell by 76% from 31.1 in the first year of the study (before theimplementation of the team) to 7.6 per 10,000 people with diabetes in the final year. The minor lowerextremity amputation rate fell by 61% from 25.4 to 10.0 per 10,000 people with diabetes.
99. The relative risk of a person with diabetes undergoing any lower extremity amputation was reduced from46 times that of a person without diabetes at the start of the study to 7.7 times that of a person withoutdiabetes at the end of the five years. The study pointed out that during the period there was an increasein the use of angioplasty in people with diabetes, and increased use of medication to modifycardiovascular risk. It is possible that these interventions contributed to the reduction in amputations.
100. A Swedish study found that the annual incidence of diabetes-related major amputations decreasedfrom 16 to 3.6 per 100,000 inhabitants (i.e. general rather than diabetes population) over a 14-yearperiod after the implementation of a multidisciplinary programme for the prevention and treatmentof diabetic foot ulcers.65 The proportion of minor amputations increased from 28% to 53%, thoughthere was no increase in the absolute number of such amputations. The re-amputation rate in theSwedish study decreased from 36% to 22% between the first and last three year periods. Thereductions achieved were in the context of a high baseline incidence in this long-term study.

30
101. In Torbay, an open-access foot care clinic was established in 2006 with an MDT comprising weeklyinput from a diabetologist, two podiatrists and an orthotist, fortnightly input from a vascular surgeonand an orthopaedic surgeon, and support from tissue viability nurses, microbiologists, diabetes liaisonnurses and radiologists as required. Between 2006 and 2009 the service reported (in unpublisheddata) that the major amputation rate for diabetic patients fell from 31.47 to 10.15 per 10,000people with diabetes. The 3-year average fell from 27.87 in 2004–06 to 9.69 in 2007–09.66
102. A study in Southampton presented evidence (published to date in abstract only) that a diabetic footprotection team working across primary and secondary care could reduce lengths of stay for footulcer admissions, and associated expenditure, as well as reducing major amputations.67 Over a threeyear period, the median length of stay for foot ulcer admissions fell from 47 to 19 days. Thisproduced a saving estimated at £1.3 million a year, even though hospital admissions related todiabetic foot problems increased from 118 to 174 a year. The abstract reported a 60% reduction inmajor amputations over three years, but an increase in minor amputations of 42%.
Ulcer management – cardiovascular risk reduction
103. The Specialist Diabetic Foot Clinic of the Royal Infirmary of Edinburgh introduced an aggressivecardiovascular risk policy in 2001.44 Patients referred with new ulceration were screened for knowncardiovascular risk factors including blood pressure and serum cholesterol. HbA1c, total cholesteroland serum creatinine results were taken from the year of ulceration. A cardiovascular risk score wasderived and recommendations were made for anti-platelet therapy, statins, ACE inhibitors orangiotensin receptor blockers, and beta blockers, according to individual patient risk and takingaccount of contra-indications. Letters were sent to the primary care team for each patient setting outthe recommended therapy changes (if any). Follow-up letters were sent in 2004 and 2005 to ensurethat the first letter had been received and the recommended changes had been made.
104. In the first three years of this policy, 251 patients were screened and identified. The 5-year mortalityfor this group (cohort 2) was audited in 2008, and compared with rates for 404 diabetic foot ulcerpatients who developed first ulceration between 1995 and 1999 (cohort 1). There were nosignificant differences in the available data for the two groups apart from total cholesterol (meanvalue 5.21 mmol/l in cohort 1 compared with 4.77 mmol/l in cohort 2). Blood pressure data were notavailable for cohort 1.
105. Five-year mortality was 48% in cohort 1 and 26.8% in cohort 2. Improvement in survival was seenfor both neuro-ischaemic patients (5-year mortality of 58% in cohort 1 compared with 36% incohort 2) and neuropathic patients (36% in cohort 1 and 19% in cohort 2).
31
Chapter 6. Cost Effectiveness of Diabetic Foot Interventions
106. A number of health economic studies have used simulation models to analyse the cost-effectiveness(i.e. the cost per quality-adjusted life year (QALY)) and the potential for cost saving of intensifiedprevention of diabetes-related foot ulcers and amputations. A 2001 study used a Markov model toanalyse, for four different risk categories, the incremental cost-effectiveness of internationalrecommendations68 for foot ulcer prevention compared with current prevention in Sweden.69 The riskcategories and optimal prevention strategies modelled are shown in Table 3.
107. The model results suggested that an intensified prevention strategy was cost effective for all patientsapart from those with no specific risk factors for foot ulceration, if foot ulcers and amputations couldbe reduced by 25%. The strategy produced increases in quality of life and was cost saving for sevenof nine age cohorts in the three most severe risk groups. For the two age cohorts in those at-riskgroups for whom the strategy was not cost saving, it did produce quality of life gains, with a cost perQALY of €4,000–5000 (1998 prices). The strategy was not cost saving nor cost effective for the low-risk patient group.
Table 3. Risk categories and optimal prevention strategies, (Ragnarson Tennvall et al.69)
Risk category
1. Low risk - diabetic patients without anyspecific risk factors for developing footulcers
2. Diabetic patients with sensory neuropathyalone
3. Diabetic patients with sensory neuropathyand other risk factors such as peripheralvascular disease or foot deformity
4. High risk – diabetic patients with at leastone previous ulcer or amputation
Optimal prevention
Education about foot care
Professional foot care three times a year
Professional foot care six times a year, 50%receive shoes and 50% receive insoles each year
Professional foot care six times a year, two pairsof protective or therapeutic shoes a year
108. An Austrian study based on the assumption that intensified prevention reduced the incidence ofulcer and amputation by 25–50% within 6 months produced similar results.70 For higher-riskpatients, intensive prevention increased quality of life and was cost saving. For low-risk patients theintervention increased costs and was not cost effective.
109. Clearly the costs associated with interventions will vary from country to country, and it is not possibleto extrapolate directly from international studies. Strategies may be cost saving in some countriesand not in others. The cost per QALY will also vary from country to country. The value of thesestudies, from the perspective of the NHS in England, is that they indicate the potential for increasesin quality of life, for cost saving in certain circumstances, and also the categories of patient for whomhealth gain is likely to be maximised and savings are most likely to be realised.

32
Introduction
110. This section will set out estimates of current NHS spending on diabetes-related foot problems inEngland. Robust estimates of the cost of diabetic foot care are difficult to produce owing to the lackof routine datasets outside the acute setting, and incomplete coding of diabetes in the acute sector.As a result, there is uncertainty as to resource use by people with diabetic foot ulcers in bothcommunity and acute settings.
111. Costs are modelled here using routine data sets, where available, supplemented by academic studies,local data, patient survey data and expert opinion, as appropriate. Estimates are compared withthose from a 2003 cost of illness study. All costs are given in 2010–11 values.
112. Costs are estimated in the following categories:
primary, community and outpatient care for those with ulcers,
inpatient care for ulceration and amputation
post-amputation care
Section III The Cost of Ulcerationand Amputation in Diabetes
33
Chapter 7. Cost of Primary, Community and Outpatient Care forUlceration
113. National datasets do not provide details of foot ulcer incidence, nor of resource use for patientswith diabetic foot ulcers in the community setting. While overall activity data and unit costs areavailable for outpatient consultations, it is not possible discretely to identify patients with diabeticfoot ulcers owing to the lack of detailed coding in outpatient datasets.
114. As shown in chapter 1, estimates of the prevalence of foot ulceration vary from 5% to 7% of thediabetes population, but these figures include patients with past as well as current ulcers.9,10,11 It isnot known how many people with diabetes experience foot ulcers in a year. Recent data indicatethat in Scotland 2.5% of the diagnosed diabetes population had current foot ulcers at thebeginning of December 2010.13 Data from one English foot care clinic, Salford Royal NHSFoundation Trust, indicate that approximately 2.5% of the local diabetes population have footulcers at any given time.14
115. For modelling purposes, it has been assumed that 2.5% of the diagnosed diabetes population inEngland (61,400 people) have foot ulcers in any given week. The cost of primary, community andoutpatient care is estimated on a weekly basis, and the weekly estimates are then multiplied by61,400 x 52 to produce an estimate of annual expenditure for England.
116. Because of the uncertainty regarding use of primary, community and outpatient services bypatients with diabetic foot ulcers, two approaches are used to estimate expenditure in this chapter.In part A, the results of an RCT are used, supplemented by data from two acute trusts. In part B,data from an NHS Diabetes/Diabetes UK patient survey are used. In part C, the cost estimates arecompared.
A: Expenditure estimates based on RCT and acute trust data
117. In this section, the cost of community and outpatient care is estimated on a weekly basis for twopatient groups; patients in the first group have no infection or relatively mild infection, and do nothave conditions such as severe peripheral arterial disease, osteomyelitis or Charcot foot. Those inthe second group have more severe infection, severe ischaemia, osteomyelitis, Charcot foot or acombination of these factors. Patients have been divided in this way as studies suggest thatresource use is affected by factors such as the presence of bacterial infection and by comorbiditiessuch as peripheral arterial disease. 71,72,73
118. The cost of care for the first group is estimated using data from a recent RCT. The cost of care forthe second group is estimated using data provided by two acute providers, Imperial CollegeHealthcare NHS Trust, and The North West London Hospitals NHS Trust.
Group 1: patients with less severe ulcers
119. An RCT of the use of dressing preparations estimated the average per patient cost of dressingsmanagement and professional time (apart from admitted patient care) in managing diabetic foot-related problems over a 24- week period.22 Costs for admissions and amputations were excluded.
120. Patients with ulcers extending to tendon, periosteum or bone, and those with infections of bone,soft tissue infections requiring systemic antibiotics, gangrene, critical renal disease, severeperipheral arterial disease and other complications at trial outset were excluded from the study.

34
121. The average cost of dressings management, across the three dressings, was £172 (£185 in 2010–11 prices), and the average cost of professional time was £489 (£525 in 2010–11 prices). (Costs inthis study were derived from 2005–07 publications. 2005–06 has been taken to be the averagebaseline price level).
122. The average weekly cost per patient for dressings and professional time is estimated at £44 (in2010–11 prices) based on the assumption that care was provided to mean time to healing forthose who healed during the trial and that care was provided for 24 weeks for those who did notheal during the trial. It should be noted, however, that nearly 70% of dressing changes for thispatient group were performed by non-professionals such as family members or friends. No costsare counted for these dressing changes.
123. Secondary infection affected between 5.7% and 11.2% of unhealed ulcers at each of the clinicvisits during the study. A total of 560 episodes of medication prescription for infection werereported during 24 weeks. Details are given in the trial report of all medications prescribed forinfections. Costs for these have been estimated using the British National Formulary.74 Of theseprescriptions, 9% were for intravenous antibiotics. It is assumed that these were administeredduring a half hour district nurse home visit. Total expenditure on these medications andintravenous administration, (assuming average prescription duration of 14 days) is estimated at£77,358 for the study cohort. The mean weekly cost per patient is estimated at £19, calculated bydividing total expenditure by the number of ongoing patients at the mid-point of the study (169 at12 weeks, allowing for 60 withdrawn and 88 healed).
124. The study also provides details of off-loading methods; 44% of patients had a casted device, 21%had bespoke shoes and/or insoles, 17% had a removable off-loading device, and 11% usedanother offloading method such as crutches. The average cost for these off-loading devices perpatient during the trial period is estimated at £233, equivalent to £10 per patient per week. Costsfor casted devices and removable off-loading devices are taken from a 2007 Italian study.75 Costsfor bespoke shoes and insoles were provided by Salford Royal NHS Foundation Trust.14 It isassumed that of those receiving shoes and/or insoles, 80% receive insoles and 20% receivebespoke shoes.
125. The mean weekly cost of all primary, community and outpatient care for patients in this group isestimated at £73.
126. As indicated above, patients with more serious ulcers or infections at baseline were excluded fromthe trial. Eighty eight patients (28%) withdrew from the trial. In at least 45% of these cases, thereason for withdrawal was ulcer deterioration, infection or amputation.
Group 2: patients with more severe ulcers
127. Costs for the care of patients with relatively severe ulcers are estimated from data on resource usesupplied by two acute trusts, Imperial College Healthcare NHS Trust, and The North West LondonHospitals NHS Trust.
128. Imperial College Healthcare NHS Trust provided details of care pathways for patients with severeulceration, by type, indicating frequency of clinic attendance, and use of resources such as imagingand patient transport. The North West London Hospitals NHS Trust provided details of antibioticsprescribed for patients attending their multidisciplinary foot clinic over a 12- month period.

35
129. Data from The North West London Hospitals Trust indicate that mean disease duration for patientswith osteomyelitis was approximately 35 weeks in 2010–11.76 A Spanish study reported meandisease duration of 42 weeks for this patient group.77 It will be assumed here that mean diseaseduration for patients with osteomyelitis is 35 weeks.
130. No studies have been identified showing mean ulcer duration for other severe ulcers. Median ulcerduration has been estimated as 31 weeks for patients with severe arteriopathy and as 29 weeksfor patients with Charcot foot.78 (These figures include approximately four weeks of ulcerationbefore specialist assessment). For these patient groups, the study estimates of median duration willbe taken as a proxy for the mean, although it is recognised that mean duration may beconsiderably longer than the median. More than one quarter of patients in both study groups hadongoing ulceration after a year of specialist care.
131. Care pathways provided by Imperial College Healthcare NHS Trust indicate that patients withosteomyelitis attend high-risk podiatry clinics on average 33 times in the first 35 weeks of care.79 Itis assumed that these consultations last 15 minutes. Patients have, on average, eight consultationswith the multi-disciplinary team over 35 weeks, and three MRI scans. NHS transport is provided for43% of attendances.
132. Data from The North West London Hospitals NHS Trust indicate that mean duration of antibioticprescribing for patients with osteomyelitis was 30 weeks in 2010–11. The mean cost of prescribingwas £2,608, equivalent to £75 a week averaged over the 35 weeks of ulcer duration. Medicationcosts are taken from the British National Formulary.74
133. Attendance estimates for patients with Charcot foot and neuro-ischaemic lesions, derived fromImperial College pathways, are shown in Table 4. Staff unit costs for podiatry (assumed to be band7) and plaster room staff (assumed to be band 3) are taken from the Personal Social ServicesResearch Unit (PSSRU) Unit Costs of Health and Social Care 2011.80 Costs for MDT attendancesand MRI scans are taken from 2010-11 Payment by Results (PbR) tariffs, adjusted for the averageMarket Forces Factor.81 No data were available on orthotic or dressing use. It has therefore beenassumed that weekly costs in these areas are the same as for patients in Group 1. No data onantibiotic prescribing were available for patients with Charcot foot or neuro-ischaemic lesions. Ithas therefore been assumed that weekly costs for antibiotics for these patients are the same as forthose in Group 1.
134. Mean weekly care costs for patients in Group 2 range from £82 to £189, as shown in Table 4.Estimated weekly costs for patients with osteomyelitis are more than twice those for Group 1patients, while costs for those with neuro-ischaemia and Charçot foot are 13% and 30% higher,respectively.

36
Osteomyelitis
Attendances Cost Attendances Cost Attendances Cost
Infected neuro-ischaemic lesion
Charcot foot withneuropathic lesion
High-riskpodiatrist clinic
33 £1,064 32 £1,032 32 £1,032
MDT 8 £2,038 4 £599 7 £1,049
MRI 3 £677 1 £226
Plaster room(and podiatryattendance)
6 £254
Transport 18 £562 17 £548 5 £151
Total £4,342 £2,179 £2,710
Weekly cost £103 £52 £65
Weekly costincludingantibiotics,orthoticsanddressings
£189 £82 £95
Table 4. Estimated cost of community and outpatient care for patients with osteomyelitis,infected neuro-ischaemic ulcers, and Charçot foot with neuropathic ulcers
135. In order to estimate national expenditure, it is necessary to estimate the proportion of patients ineach group. The prevalence of osteomyelitis among patients with diabetic foot ulcers has beenestimated at 12%82 to 15%83 in US studies and at 23% in a UK study.84 Of patients attending amultidisciplinary foot clinic in Nottingham over a 4-year period, 40.5% had peripheral arterialdisease (defined as both pedal pulses missing), and a further 2.2% had Charcot foot.78 The Englisharm of an international study using the six-element SINBAD classification system (based on ulcersite, area, and depth, and presence of ischaemia, neuropathy and bacterial infection) found that41% of patients had ulcers with scores of 3 or more (associated with longer ulcer duration andreduced likelihood of healing).71
136. For modelling purposes it has been assumed that 60% of patients fall into Group 1 and 40% intoGroup 2. The prevalence of osteomyelitis is estimated at 18%, and that of Charcot foot at 2.2%. Itis assumed that the remainder of patients in Group 2 have other complicating conditions such assevere ischaemia, bacterial infection, or a combination of these factors, and costs estimated abovefor patients with neuro-ischaemic ulcers with infection are used for these patients. Based on theseassumptions, the total cost of community and inpatient care for people with diabetic foot ulcers isestimated at £307 million a year, as shown in Table 5.
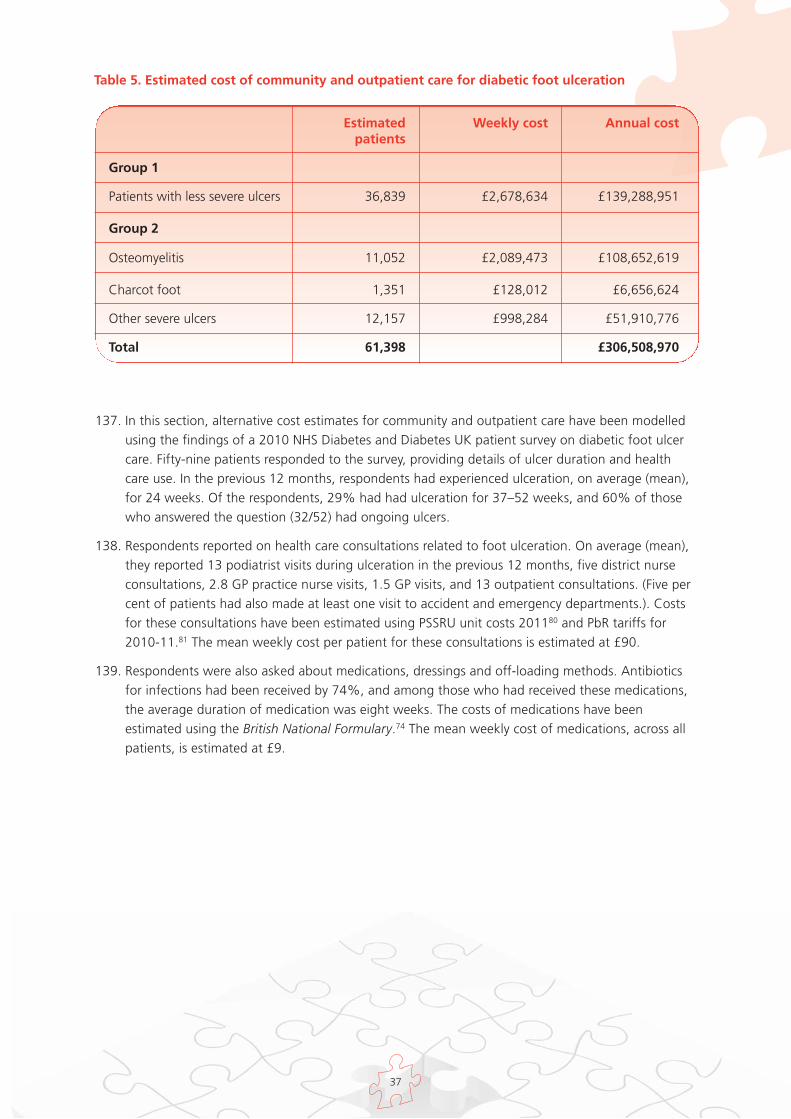
37
Estimated Weekly cost Annual costpatients
Group 1
Patients with less severe ulcers 36,839 £2,678,634 £139,288,951
Group 2
Osteomyelitis 11,052 £2,089,473 £108,652,619
Charcot foot 1,351 £128,012 £6,656,624
Other severe ulcers 12,157 £998,284 £51,910,776
Total 61,398 £306,508,970
137. In this section, alternative cost estimates for community and outpatient care have been modelledusing the findings of a 2010 NHS Diabetes and Diabetes UK patient survey on diabetic foot ulcercare. Fifty-nine patients responded to the survey, providing details of ulcer duration and healthcare use. In the previous 12 months, respondents had experienced ulceration, on average (mean),for 24 weeks. Of the respondents, 29% had had ulceration for 37–52 weeks, and 60% of thosewho answered the question (32/52) had ongoing ulcers.
138. Respondents reported on health care consultations related to foot ulceration. On average (mean),they reported 13 podiatrist visits during ulceration in the previous 12 months, five district nurseconsultations, 2.8 GP practice nurse visits, 1.5 GP visits, and 13 outpatient consultations. (Five percent of patients had also made at least one visit to accident and emergency departments.). Costsfor these consultations have been estimated using PSSRU unit costs 201180 and PbR tariffs for2010-11.81 The mean weekly cost per patient for these consultations is estimated at £90.
139. Respondents were also asked about medications, dressings and off-loading methods. Antibioticsfor infections had been received by 74%, and among those who had received these medications,the average duration of medication was eight weeks. The costs of medications have beenestimated using the British National Formulary.74 The mean weekly cost of medications, across allpatients, is estimated at £9.
Table 5. Estimated cost of community and outpatient care for diabetic foot ulceration

38
140. On average, patients reported 33 dressing changes for their ulcers. The cost of dressings wastaken from the RCT.22 Special insoles had been received by 75% and special shoes by 61%. Thecosts of insoles and shoes were provided by Salford Royal NHS Foundation Trust.14
141. The mean weekly cost of medications, dressings and off-loading is estimated at £34 per patient.The total weekly cost of consultations, medications, dressings and off-loading is estimated at£101.
142. The total cost of primary, community, and outpatient care is estimated at £324 million a year,based on the NHS Diabetes/Diabetes UK patient survey data, as shown in Table 6. The cost ofaccident and emergency care is estimated at £849,000.
Table 6. Estimated cost of primary, community, outpatient and accident and emergency carefor ulceration in people with diabetes, based on NHS Diabetes/Diabetes UK Patient Survey,2010
Estimated weekly Estimated annual cost per patient expenditure, England
GP and Practice Nurse £4.12 £13,148,111
Podiatry £17.96 £57,329,795
District nurse £4.43 £14,149,398
Orthotist/Occupational Therapist £0.09 £274,669
Outpatients £63.01 £201,178,354
Medications £8.50 £27,127,275
Off-loading £3.35 £10,704,276
Total £101.45 £323,911,879
Accident and Emergency £0.27 £849,278
Total including Accident and £324,761,157Emergency

39
C: Comparison of expenditure estimates
143. The estimate of total expenditure on primary, community and outpatient care derived in part B is 5%higher than that derived in part A. The weekly per patient estimates in part B are higher than for allpatient sub-groups considered in part A, apart from those with osteomyelitis.
144. Patients who participated in the NHS Diabetes/Diabetes UK survey reported more health careconsultations than recorded in the dressings RCT. Given the patient selection criteria used for theRCT, and the absence of data on resource use for those who withdrew, it may be that the RCTunderestimates resource use for the 60% of patients with less severe ulcers. It is also noteworthythat 70% of dressing changes for patients in the RCT were carried out by non-professionals such asfamily members. It is not known whether this is typical practice for people with diabetic foot ulcers.
145. The range of activity covered in the survey was wider than that for Group 2 patients, covering GP,practice nurse, district nurse, and accident and emergency resource use as well as secondary carescheduled attendances.
146. It should be noted however, that the survey sample was small (59 patients) and it is not possible insuch a survey to ensure a representative sample.
40
Chapter 8. Cost of Inpatient Care
147. In order to estimate expenditure on hospital admissions related to diabetic foot ulcers, HospitalEpisode Statistics (HES) for 2010–11 were searched to identify admissions with a diabetes diagnosiscode and diagnosis or procedure codes related to foot ulceration or amputation. Diabetes admissionswere identified by means of International Classification of Diseases-10 (ICD-10) codes E10–14.Details of diagnosis and procedure codes used to identify foot problems are given in Appendix 1.Day-case admissions were excluded. Records with invalid Healthcare Resource Group (HRG) fieldswere also excluded.
148. Hospital Episode Statistics record 72,459 inpatient spells for 2010–11 in which diabetes and footulcer or amputation codes are recorded. This represents 8.8% of all ordinary admissions with adiabetes diagnosis code. (Ordinary admissions are those with at least one overnight stay).
149. Of these admissions, 5,917 included amputation procedure codes, 315 were for procedures onamputation stumps, and the remainder (66,227) included ulceration codes without amputation.
150. This section examines, first, admissions related to ulceration without amputation, and thenamputation admissions and resource use.
151. PbR tariffs for 2010–11, adjusted for the average Market Forces Factor, are used to estimate costs foramputations and for admissions in foot care HRGs.81 It should be noted that while the tariffrepresents the cost of admissions to commissioners, and is derived from HRG-level Reference Costssubmitted by acute providers, in some instances the mean cost to providers of care for sub-groups ofpatients may differ from the price paid by commissioners. This may occur, for example, if a sub-groupof patients has significantly greater mean length of stay or requires more resource-intensive care thanothers whose care is grouped to a particular HRG. A recent patient-level costing study at CambridgeUniversity Hospitals NHS Foundation Trust found that in 2006–07 the mean cost of care forinpatients with diabetes was 8.5% higher than tariff.85
152. For admissions in non-foot care HRGs, costs are estimated for excess bed days, relative to admissionsfor people with diabetes who do not have foot ulceration.
Cost of inpatient care – ulceration
153. Some hospital admissions in people with diabetic foot ulcers occur as a direct result of ulceration. Forexample, patients may be admitted to hospital because of ulcer-related infection, for diagnosticprocedures, or for debridement. In other cases, people with diabetic foot ulcers may be admitted tohospital for conditions unrelated to the ulcer, or ulceration may occur during an admission for anunrelated condition.
154. The impact of ulceration on the cost of a hospital admission is also likely to be variable. In some casesfoot care will be the major cost-driver in an admission. In others, foot care may have a relatively smallimpact on overall cost.
155. In order to estimate inpatient expenditure attributable to foot ulceration, it is necessary to distinguishbetween these admission types. In situations where ulceration appears to be the main cost-driver inan admission, the whole cost of the admission will be counted here. In situations where ulcerationdoes not appear to be the main cost driver, the marginal cost of ulceration will be estimated.

41
156. Inpatient activity is grouped to HRGs by means of an algorithm developed by the NHS InformationCentre. A single HRG is chosen for each admission. The algorithm uses all procedure and diagnosiscodes from the patient record, but generally gives particular weight to procedure codes and torelatively costly activity.
157. Admissions with diabetes and foot ulcer codes in 2010-11 were grouped to more than 500 HRGs.Clinical advice was sought in order to identify HRGs that relate to foot ulcer care. Approximately onefifth of these HRGs were considered to be foot care-related. Details of HRGs, and of the distributionof diabetic foot ulcer admissions, are provided in Appendix 2.
158. Of 66,227 admissions with diabetes and foot ulceration, 47% (31,391) were grouped to HRGs thatwere considered to be related to foot ulcer care. The allocation of activity to these HRGs is taken toindicate that foot ulcer care was likely to be the sole or most significant cost-driver during theadmission. The cost of these admissions, based on 2010–11 PbR tariff payments, adjusted by theaverage Market Forces Factor, was £114 million.
159. The remainder of admissions with diabetes and foot ulceration (34,836) were grouped to HRGs inother clinical areas, indicating that non-foot-ulcer care was also provided during the admission, andwas used to determine the HRG and tariff payment. For these admissions, the tariff paid bycommissioners is unaffected by foot ulceration (unless length of stay is extended by ulceration to thepoint where additional payments are due). It is likely, however, that the cost to acute providers ofthese admissions is higher than if ulceration had not occurred. Care for patients with ulcers is likely inmany cases to be more resource intensive than care for patients without ulcers, and lengths of staymay be longer (though often not sufficiently long to trigger additional payments). It is not possible toestimate the difference in the cost of a day of care for patients with and without foot ulcers. Lengthof stay has therefore been used here as a proxy for the marginal cost of ulceration in theseadmissions.
160. Multivariate regression analysis was carried out to estimate the impact of foot ulceration on lengthof hospital stay for patients with diabetes who are admitted in non-foot-ulcer-specific HRGs. HESdata for 2009–10 were used. Finished admissions for people with diabetes were analysed. Day-caseadmissions were excluded, as were maternity admissions and non-emergency transfers betweenacute providers. Admissions with a diabetes diagnosis were identified by ICD-10 codes E10-E14.Foot ulcer admissions were identified by ICD-10 codes L97, L89, or R02, or by Office of PopulationCensuses and Surveys Classification of Surgical Operations and Procedures-4.4 (OPCS-4.4) codeS571 in combination with OPCS-4.4 codes Z504, Z505 or Z506. Foot ulcer and amputation-specificHRGs were excluded from the analysis, as costs for admissions in these HRGs are consideredseparately.
161. Generalised linear model regression was conducted. Covariates were selected through pairwisecorrelation using p<0.05 as the benchmark. Covariates used in the regression were ulceration,patient age, gender, ethnicity, index of multiple deprivation score, admission method (elective oremergency), and specialty type (surgical or non- surgical).
162. Six model specifications were tested: normal, gamma and inverse Gaussian using both identity andlog links. Candidate models were ranked according to their Akaike information criterion (AIC) values.The model with the lowest AIC value was the gamma identity link model. The gamma identity linkmodel results were therefore used to estimate parameters.
163. The coefficient for ulceration in the gamma-link model was 12.71 (95% confidence interval 12.15 –13.26). Based on this analysis, it is estimated that in 34,836 admissions coded to non-foot-ulcer-related HRGs, there were 417,804 excess bed days for patients with ulceration relative to peoplewith diabetes who did not have ulceration.

42
164. The NHS Institute has estimated the cost of an inpatient bed day at £225.86 Using this cost,expenditure on excess bed days in people with diabetic foot ulcers admitted to non-foot care HRGs isestimated at £100 million.
165. The annual cost of non-amputation inpatient care for diabetic foot ulcers is estimated at £213 million.
Cost of inpatient care - amputation
166. As indicated above, Hospital Episode Statistics for 2010–11 were searched to identify major andminor amputation admissions in people with diabetes. Major amputation admissions were identifiedby means of OPCS-4.4 codes X09 (amputation of leg) or X10 (amputation of foot). Minoramputation admissions were identified by means of OPCS-4.4 code X11 (amputation of toe).Trauma-related amputations (identified by ICD-10 codes S70–99. T00–35, or V01–Y09) wereexcluded from the analysis. Data without valid HRGs were also excluded.
167. HES data indicate that in 2010-11, there were 2,608 admissions for non-trauma-related majoramputation in people with diabetes and 3,309 admissions for non-trauma related minor amputation.This is equivalent to an incidence rate of 0.11% of the diagnosed diabetes population for majoramputations and 0.13% for minor amputations. These figures may be compared with those from theNDA for 2009-10, which showed incidence rates of 0.7% (major) and 0.13% (minor)18 and studydata showing incidence rates of 0.10% (major) and 0.14% (minor) derived from 2008–09 HESdata.87 The overall amputation rate (0.24%) may be compared with that in a recent study of 2009–10 HES data, which found a rate of 0.25%.19
168. It should be noted that the NDA data measure the percentage of people with diabetes who have hadat least one amputation in a given year. Our approach, and the other two studies cited, measureadmissions in which a diabetes-related amputation occurs. The patient-to-amputation ratio wasestimated at 0.88 in 2008–09.87 It is to be expected, therefore, that the NDA incidence rate will belower than the rate derived using admission-based approaches.
169. The majority of major amputations (61%) are grouped in HES to HRGs QZ11A and QZ11B(Amputation with and without complications and comorbidities, respectively). The remainder aregrouped to other HRGs. The total cost of admissions involving non-traumatic major amputation inpeople with diabetes, in 2010–11, based on HRG tariff prices, was £25 million. Tariff prices areadjusted for the average Market Forces Factor.
170. The majority (60%) of minor amputations are grouped to HRG QZ12Z (Foot procedure for diabetesor arterial disease, and procedures to amputation stumps). The remainder are coded to other HRGs.The total cost of admissions involving non-traumatic minor amputation in people with diabetes, in2010–11, based on HRG tariff prices, was £17 million.
171. It is noteworthy that some major amputations are grouped to non-amputation HRGs. This suggeststhat in those cases amputations were performed during admissions where other care was alsoprovided. The mean tariff paid for major amputations grouped to amputation HRGs was £11,535,while the mean tariff paid for admissions in which a major amputation took place, but which werecoded to other HRGs was £7,688. If all major amputations were grouped to amputation HRGs, thecost of major amputation admissions would rise to £30 million. The distribution of amputationactivity and expenditure by HRG, for major and minor amputations, is shown in Appendix 3.
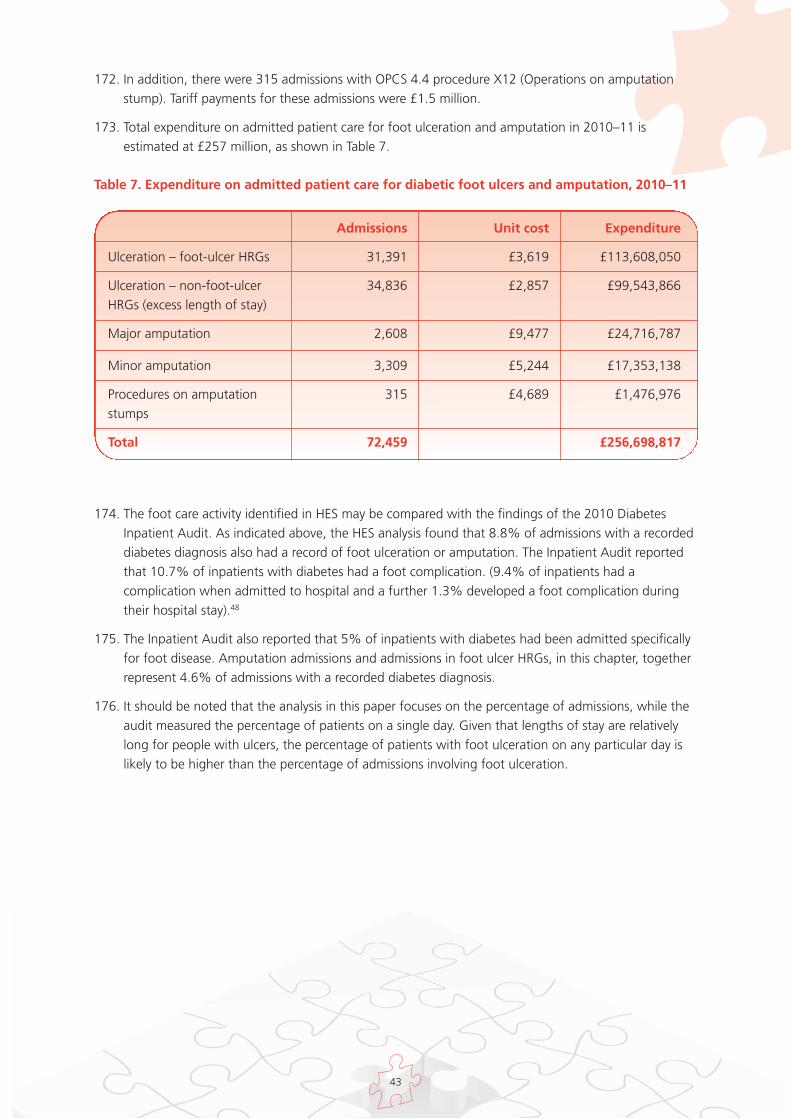
43
172. In addition, there were 315 admissions with OPCS 4.4 procedure X12 (Operations on amputationstump). Tariff payments for these admissions were £1.5 million.
173. Total expenditure on admitted patient care for foot ulceration and amputation in 2010–11 isestimated at £257 million, as shown in Table 7.
Table 7. Expenditure on admitted patient care for diabetic foot ulcers and amputation, 2010–11
Admissions Unit cost Expenditure
Ulceration – foot-ulcer HRGs 31,391 £3,619 £113,608,050
Ulceration – non-foot-ulcer 34,836 £2,857 £99,543,866HRGs (excess length of stay)
Major amputation 2,608 £9,477 £24,716,787
Minor amputation 3,309 £5,244 £17,353,138
Procedures on amputation 315 £4,689 £1,476,976stumps
Total 72,459 £256,698,817
174. The foot care activity identified in HES may be compared with the findings of the 2010 DiabetesInpatient Audit. As indicated above, the HES analysis found that 8.8% of admissions with a recordeddiabetes diagnosis also had a record of foot ulceration or amputation. The Inpatient Audit reportedthat 10.7% of inpatients with diabetes had a foot complication. (9.4% of inpatients had acomplication when admitted to hospital and a further 1.3% developed a foot complication duringtheir hospital stay).48
175. The Inpatient Audit also reported that 5% of inpatients with diabetes had been admitted specificallyfor foot disease. Amputation admissions and admissions in foot ulcer HRGs, in this chapter, togetherrepresent 4.6% of admissions with a recorded diabetes diagnosis.
176. It should be noted that the analysis in this paper focuses on the percentage of admissions, while theaudit measured the percentage of patients on a single day. Given that lengths of stay are relativelylong for people with ulcers, the percentage of patients with foot ulceration on any particular day islikely to be higher than the percentage of admissions involving foot ulceration.
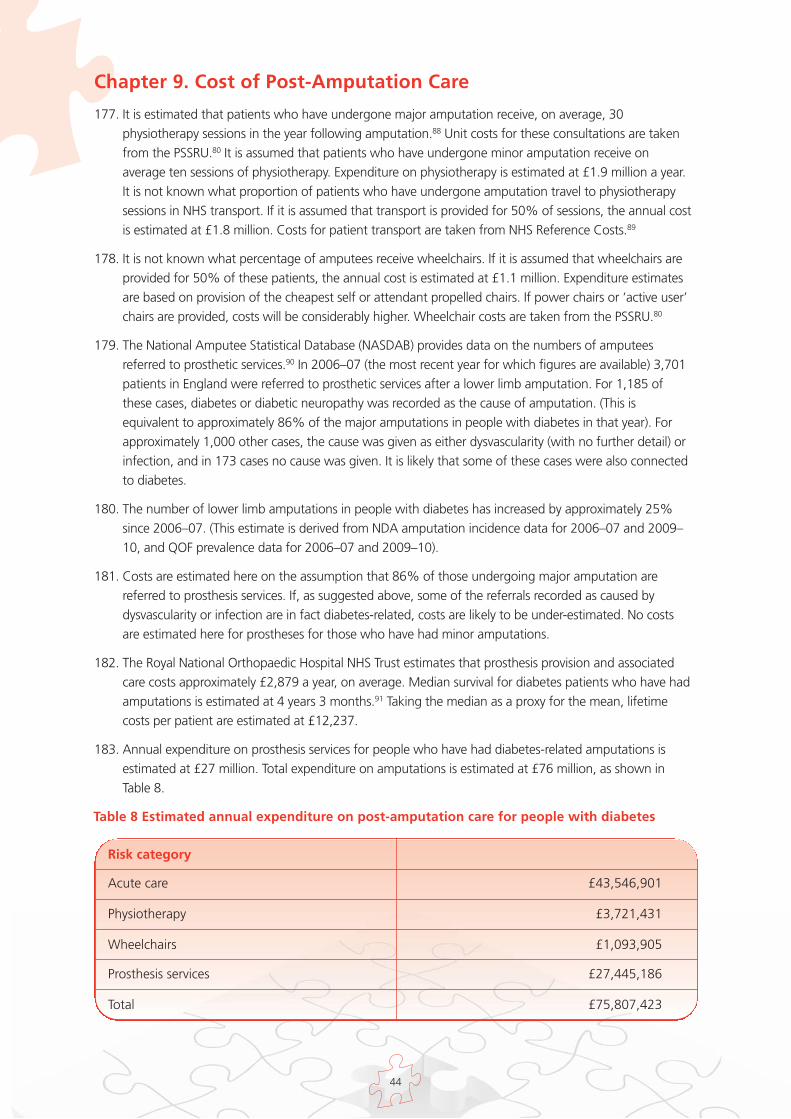
44
Chapter 9. Cost of Post-Amputation Care
177. It is estimated that patients who have undergone major amputation receive, on average, 30physiotherapy sessions in the year following amputation.88 Unit costs for these consultations are takenfrom the PSSRU.80 It is assumed that patients who have undergone minor amputation receive onaverage ten sessions of physiotherapy. Expenditure on physiotherapy is estimated at £1.9 million a year.It is not known what proportion of patients who have undergone amputation travel to physiotherapysessions in NHS transport. If it is assumed that transport is provided for 50% of sessions, the annual costis estimated at £1.8 million. Costs for patient transport are taken from NHS Reference Costs.89
178. It is not known what percentage of amputees receive wheelchairs. If it is assumed that wheelchairs areprovided for 50% of these patients, the annual cost is estimated at £1.1 million. Expenditure estimatesare based on provision of the cheapest self or attendant propelled chairs. If power chairs or ‘active user’chairs are provided, costs will be considerably higher. Wheelchair costs are taken from the PSSRU.80
179. The National Amputee Statistical Database (NASDAB) provides data on the numbers of amputeesreferred to prosthetic services.90 In 2006–07 (the most recent year for which figures are available) 3,701patients in England were referred to prosthetic services after a lower limb amputation. For 1,185 ofthese cases, diabetes or diabetic neuropathy was recorded as the cause of amputation. (This isequivalent to approximately 86% of the major amputations in people with diabetes in that year). Forapproximately 1,000 other cases, the cause was given as either dysvascularity (with no further detail) orinfection, and in 173 cases no cause was given. It is likely that some of these cases were also connectedto diabetes.
180. The number of lower limb amputations in people with diabetes has increased by approximately 25%since 2006–07. (This estimate is derived from NDA amputation incidence data for 2006–07 and 2009–10, and QOF prevalence data for 2006–07 and 2009–10).
181. Costs are estimated here on the assumption that 86% of those undergoing major amputation arereferred to prosthesis services. If, as suggested above, some of the referrals recorded as caused bydysvascularity or infection are in fact diabetes-related, costs are likely to be under-estimated. No costsare estimated here for prostheses for those who have had minor amputations.
182. The Royal National Orthopaedic Hospital NHS Trust estimates that prosthesis provision and associatedcare costs approximately £2,879 a year, on average. Median survival for diabetes patients who have hadamputations is estimated at 4 years 3 months.91 Taking the median as a proxy for the mean, lifetimecosts per patient are estimated at £12,237.
183. Annual expenditure on prosthesis services for people who have had diabetes-related amputations isestimated at £27 million. Total expenditure on amputations is estimated at £76 million, as shown inTable 8.
Table 8 Estimated annual expenditure on post-amputation care for people with diabetes
Risk category
Acute care £43,546,901
Physiotherapy £3,721,431
Wheelchairs £1,093,905
Prosthesis services £27,445,186
Total £75,807,423
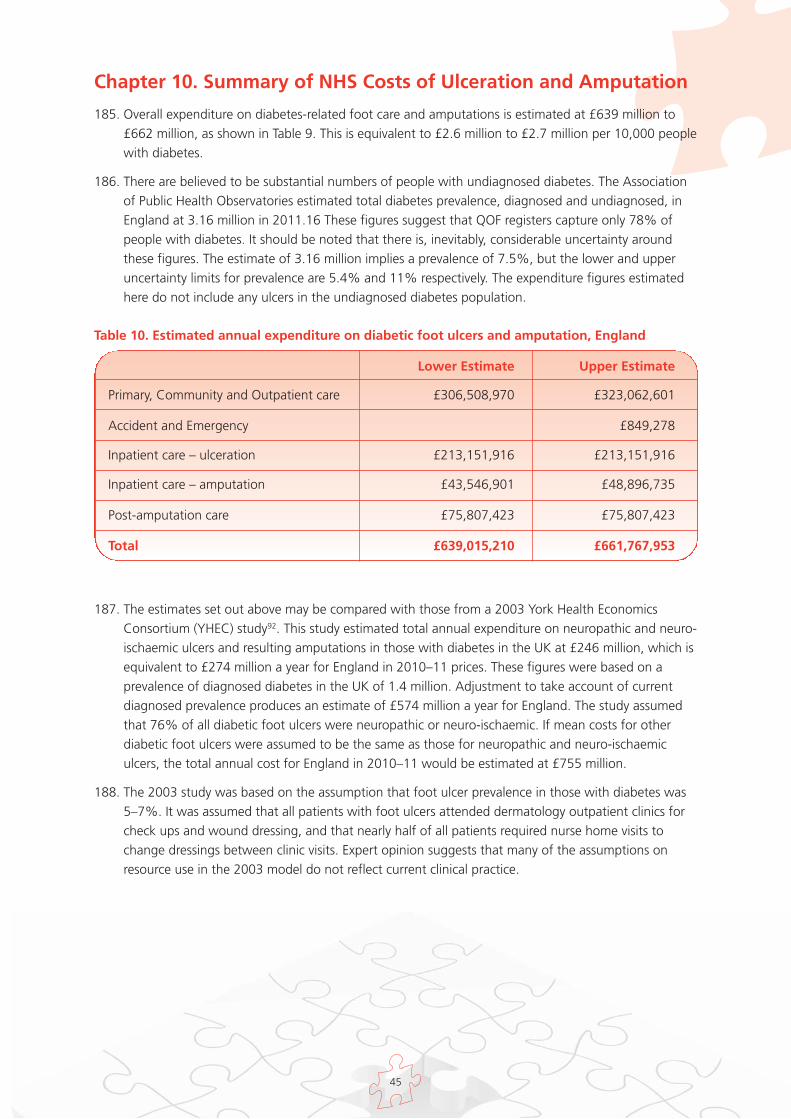
45
Chapter 10. Summary of NHS Costs of Ulceration and Amputation
185. Overall expenditure on diabetes-related foot care and amputations is estimated at £639 million to£662 million, as shown in Table 9. This is equivalent to £2.6 million to £2.7 million per 10,000 peoplewith diabetes.
186. There are believed to be substantial numbers of people with undiagnosed diabetes. The Associationof Public Health Observatories estimated total diabetes prevalence, diagnosed and undiagnosed, inEngland at 3.16 million in 2011.16 These figures suggest that QOF registers capture only 78% ofpeople with diabetes. It should be noted that there is, inevitably, considerable uncertainty aroundthese figures. The estimate of 3.16 million implies a prevalence of 7.5%, but the lower and upperuncertainty limits for prevalence are 5.4% and 11% respectively. The expenditure figures estimatedhere do not include any ulcers in the undiagnosed diabetes population.
Table 10. Estimated annual expenditure on diabetic foot ulcers and amputation, England
Lower Estimate Upper Estimate
Primary, Community and Outpatient care £306,508,970 £323,062,601
Accident and Emergency £849,278
Inpatient care – ulceration £213,151,916 £213,151,916
Inpatient care – amputation £43,546,901 £48,896,735
Post-amputation care £75,807,423 £75,807,423
Total £639,015,210 £661,767,953
187. The estimates set out above may be compared with those from a 2003 York Health EconomicsConsortium (YHEC) study92. This study estimated total annual expenditure on neuropathic and neuro-ischaemic ulcers and resulting amputations in those with diabetes in the UK at £246 million, which isequivalent to £274 million a year for England in 2010–11 prices. These figures were based on aprevalence of diagnosed diabetes in the UK of 1.4 million. Adjustment to take account of currentdiagnosed prevalence produces an estimate of £574 million a year for England. The study assumedthat 76% of all diabetic foot ulcers were neuropathic or neuro-ischaemic. If mean costs for otherdiabetic foot ulcers were assumed to be the same as those for neuropathic and neuro-ischaemiculcers, the total annual cost for England in 2010–11 would be estimated at £755 million.
188. The 2003 study was based on the assumption that foot ulcer prevalence in those with diabetes was5–7%. It was assumed that all patients with foot ulcers attended dermatology outpatient clinics forcheck ups and wound dressing, and that nearly half of all patients required nurse home visits tochange dressings between clinic visits. Expert opinion suggests that many of the assumptions onresource use in the 2003 model do not reflect current clinical practice.
46
Chapter 11. Cost, Savings and QALY Estimates: MultidisciplinaryDiabetes Foot Care
189. The clinical and economic evidence reviewed in chapters 5 and 6 suggest that:
it is possible to identify people with diabetes who are at risk of ulceration
targeted preventive services can improve outcomes
early access to multi-disciplinary specialist care for patients with ulcers can reduce ulcer duration,improve healing rates, reduce amputations and increase survival rates.
190. In this chapter, illustrative costs, savings and QALY gains from the introduction of specialistmultidisciplinary care are presented, based on initiatives at South Tees Hospitals NHS FoundationTrust, Southampton University Hospitals NHS Trust, and Brent Teaching PCT. Staff costs are estimatedin 2010–11 prices, using unit costs for salary, oncosts, and management, estates, administrative andcapital overheads from PSSRU 2011.80 Savings are estimated using bed day cost estimates from theNHS Institute,86 and NHS tariffs for 2010–11.81
191. QALY gains are estimated for amputations averted over a 5-year perspective for a 1-year cohort ofpatients. It is assumed that those who avert amputation experience ulcer healing. EQ-5D scoresderived from a Swedish study25 have been used. A mean index score of 0.44 was derived for patientswith current foot ulcers (without previous amputation), 0.6 for those whose ulcers had healedwithout amputation, 0.61 for those who had undergone minor amputation and 0.31 for patientswho had undergone major amputation. It has been assumed that 5 year mortality after ulceration is44%,42 and that 2 year mortality after major amputation is 50%.37 A re-ulceration rate of 3.5% amonth is assumed, derived from study data.32 This is applied both to those whose ulcers have healedwithout amputation, and to those who have undergone amputation. QALYs are valued at £25,000(the mid-point of the cost effectiveness range generally used by NICE).
Example 1: South Tees Hospitals NHS Foundation Trust (1995-2000)
192. As shown in chapter 5, the James Cook University Hospital in Middlesbrough established amultidisciplinary diabetic foot care team in 1995. The team was established in response to the GlobalLower Extremity Amputation Study (GLEAS), which found that the South Tees area had by far thehighest rate of diabetes-related lower limb amputations of four participating UK centres.64 Carepathways and protocols were established for the management of diabetic foot ulcers, andeducational events were organised to raise awareness of diabetic foot complications. The teamestablished strong links with existing community chiropody services. Between 1995 and 2000, thediabetes related major amputation rate fell from 31.1 to 7.6, and the minor amputation rate from25.4 to 10.0, per 10,000 people with diabetes.
Section IV The Impact ofMultidisciplinary Foot Care onPatient Outcomes and NHS Costs

47
193. The MDT ran a weekly 4 hour consultant-led clinic with a diabetes specialist nurse and twopodiatrists.93 The annual cost of the team is estimated at £33,000, as shown in Table 11. Theseexpenditure estimates do not include set up costs, or the cost of educational events. No costs havebeen estimated for community chiropody as it is understood that inputs from this service for diabeticfoot ulcers did not increase with the establishment of the team.
Table 11. Estimated annual cost of MDT at James Cook University Hospital, Middlesbrough
*WTE, whole-time equivalent
194. In 2000, the number of people with diabetes in the South Tees area was estimated at 6,254. Usingthis denominator, it is estimated that there were 24 fewer amputations in 2000 than if the rate hadbeen maintained at the 1995 level. The saving to the NHS from these averted amputations, based onunit costs derived in chapter 8, is estimated at £249,000, as shown in Table 12. The estimated savingis more than seven times the cost of the team.
195. Monetised QALY gains (valued at £25,000 per QALY) over a 5-year perspective for a 1-year cohort ofpatients who avert major amputation are estimated at £151,000. No QALY gains are estimated forminor amputations averted, as studies suggest that long-term quality of life after minor amputationis not significantly different from that after ulcer healing.
Table 12. Estimated savings and monetised QALY gains, James Cook University Hospital,Middlesbrough
Staff WTE* Grade Unit cost Total cost
Podiatrist 0.21 7 £59,530 £12,700
Consultant 0.10 £180,845 £18,085
Diabetes Specialist Nurse 0.11 6 £50,667 £2,294
Total £33,078
Rate per 10,000people withdiabetes
Amputationsaverted
Savings Value of QALYgain (at £25,000per QALY)
Year 1995 2000 2000 2000 2000
Major amputations 31.05 7.58 15 £195,600 £151,412
Minor amputations 25.38 10.05 9 £53,859
Total 56.43 17.63 24 £249,459 £151,412
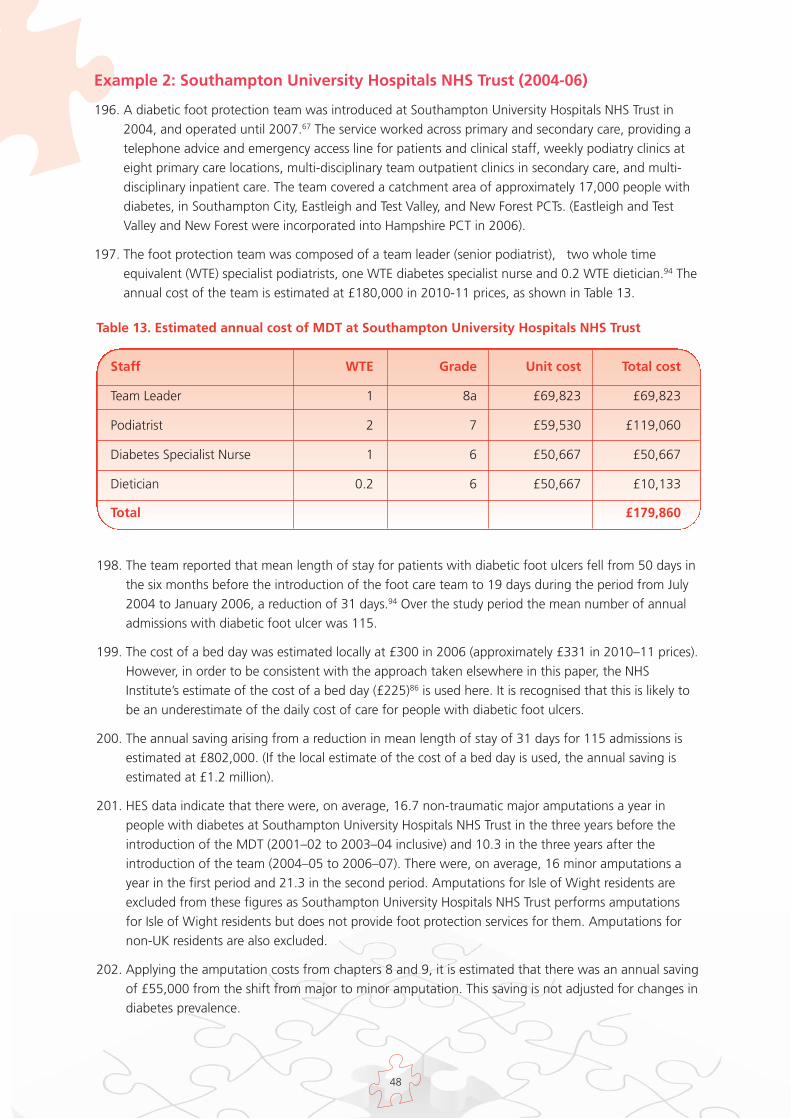
48
Example 2: Southampton University Hospitals NHS Trust (2004-06)
196. A diabetic foot protection team was introduced at Southampton University Hospitals NHS Trust in2004, and operated until 2007.67 The service worked across primary and secondary care, providing atelephone advice and emergency access line for patients and clinical staff, weekly podiatry clinics ateight primary care locations, multi-disciplinary team outpatient clinics in secondary care, and multi-disciplinary inpatient care. The team covered a catchment area of approximately 17,000 people withdiabetes, in Southampton City, Eastleigh and Test Valley, and New Forest PCTs. (Eastleigh and TestValley and New Forest were incorporated into Hampshire PCT in 2006).
197. The foot protection team was composed of a team leader (senior podiatrist), two whole timeequivalent (WTE) specialist podiatrists, one WTE diabetes specialist nurse and 0.2 WTE dietician.94 Theannual cost of the team is estimated at £180,000 in 2010-11 prices, as shown in Table 13.
Table 13. Estimated annual cost of MDT at Southampton University Hospitals NHS Trust
198. The team reported that mean length of stay for patients with diabetic foot ulcers fell from 50 days inthe six months before the introduction of the foot care team to 19 days during the period from July2004 to January 2006, a reduction of 31 days.94 Over the study period the mean number of annualadmissions with diabetic foot ulcer was 115.
199. The cost of a bed day was estimated locally at £300 in 2006 (approximately £331 in 2010–11 prices).However, in order to be consistent with the approach taken elsewhere in this paper, the NHSInstitute’s estimate of the cost of a bed day (£225)86 is used here. It is recognised that this is likely tobe an underestimate of the daily cost of care for people with diabetic foot ulcers.
200. The annual saving arising from a reduction in mean length of stay of 31 days for 115 admissions isestimated at £802,000. (If the local estimate of the cost of a bed day is used, the annual saving isestimated at £1.2 million).
201. HES data indicate that there were, on average, 16.7 non-traumatic major amputations a year inpeople with diabetes at Southampton University Hospitals NHS Trust in the three years before theintroduction of the MDT (2001–02 to 2003–04 inclusive) and 10.3 in the three years after theintroduction of the team (2004–05 to 2006–07). There were, on average, 16 minor amputations ayear in the first period and 21.3 in the second period. Amputations for Isle of Wight residents areexcluded from these figures as Southampton University Hospitals NHS Trust performs amputationsfor Isle of Wight residents but does not provide foot protection services for them. Amputations fornon-UK residents are also excluded.
202. Applying the amputation costs from chapters 8 and 9, it is estimated that there was an annual savingof £55,000 from the shift from major to minor amputation. This saving is not adjusted for changes indiabetes prevalence.
Staff WTE Grade Unit cost Total cost
Team Leader 1 8a £69,823 £69,823
Podiatrist 2 7 £59,530 £119,060
Diabetes Specialist Nurse 1 6 £50,667 £50,667
Dietician 0.2 6 £50,667 £10,133
Total £179,860
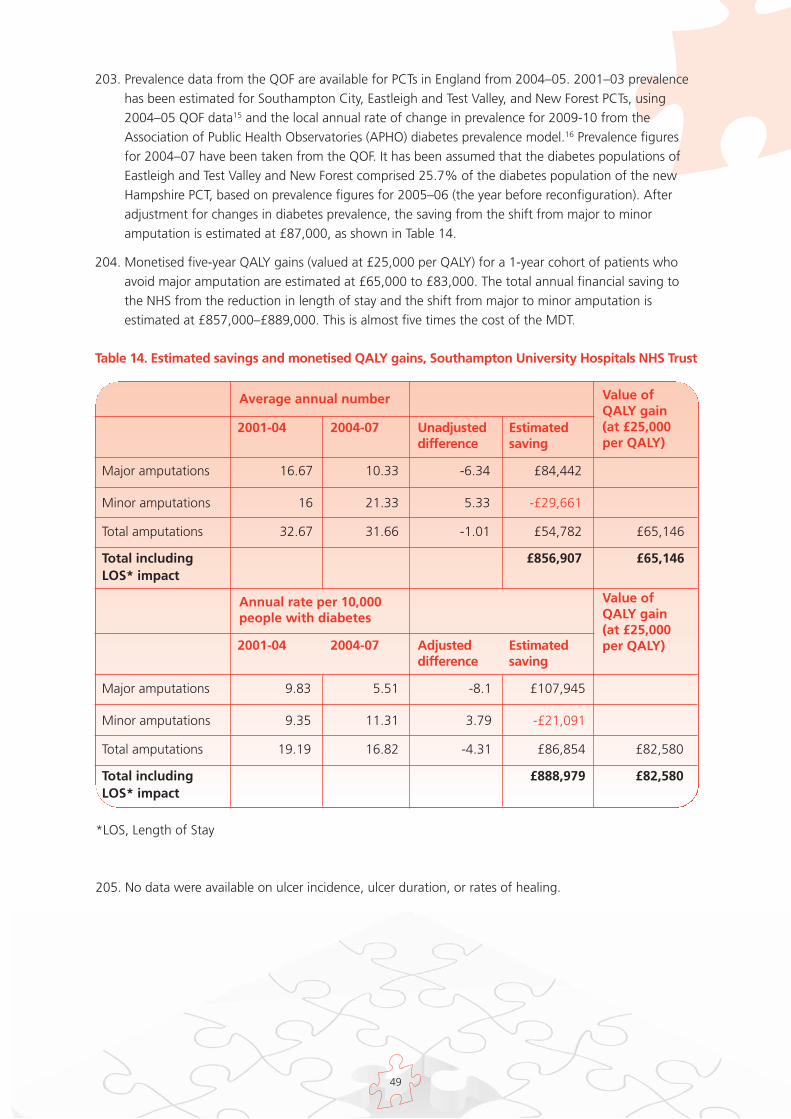
49
203. Prevalence data from the QOF are available for PCTs in England from 2004–05. 2001–03 prevalencehas been estimated for Southampton City, Eastleigh and Test Valley, and New Forest PCTs, using2004–05 QOF data15 and the local annual rate of change in prevalence for 2009-10 from theAssociation of Public Health Observatories (APHO) diabetes prevalence model.16 Prevalence figuresfor 2004–07 have been taken from the QOF. It has been assumed that the diabetes populations ofEastleigh and Test Valley and New Forest comprised 25.7% of the diabetes population of the newHampshire PCT, based on prevalence figures for 2005–06 (the year before reconfiguration). Afteradjustment for changes in diabetes prevalence, the saving from the shift from major to minoramputation is estimated at £87,000, as shown in Table 14.
204. Monetised five-year QALY gains (valued at £25,000 per QALY) for a 1-year cohort of patients whoavoid major amputation are estimated at £65,000 to £83,000. The total annual financial saving tothe NHS from the reduction in length of stay and the shift from major to minor amputation isestimated at £857,000–£889,000. This is almost five times the cost of the MDT.
Table 14. Estimated savings and monetised QALY gains, Southampton University Hospitals NHS Trust
Average annual number
2001-04 2004-07 Unadjusteddifference
Estimatedsaving
Value ofQALY gain (at £25,000per QALY)
Major amputations 16.67 10.33 -6.34 £84,442
Minor amputations 16 21.33 5.33 -£29,661
Total amputations 32.67 31.66 -1.01 £54,782 £65,146
Total including £856,907 £65,146LOS* impact
Annual rate per 10,000people with diabetes
2001-04 2004-07 Adjusteddifference
Estimatedsaving
Value ofQALY gain (at £25,000per QALY)
Major amputations 9.83 5.51 -8.1 £107,945
Minor amputations 9.35 11.31 3.79 -£21,091
Total amputations 19.19 16.82 -4.31 £86,854 £82,580
Total including £888,979 £82,580LOS* impact
*LOS, Length of Stay
205. No data were available on ulcer incidence, ulcer duration, or rates of healing.
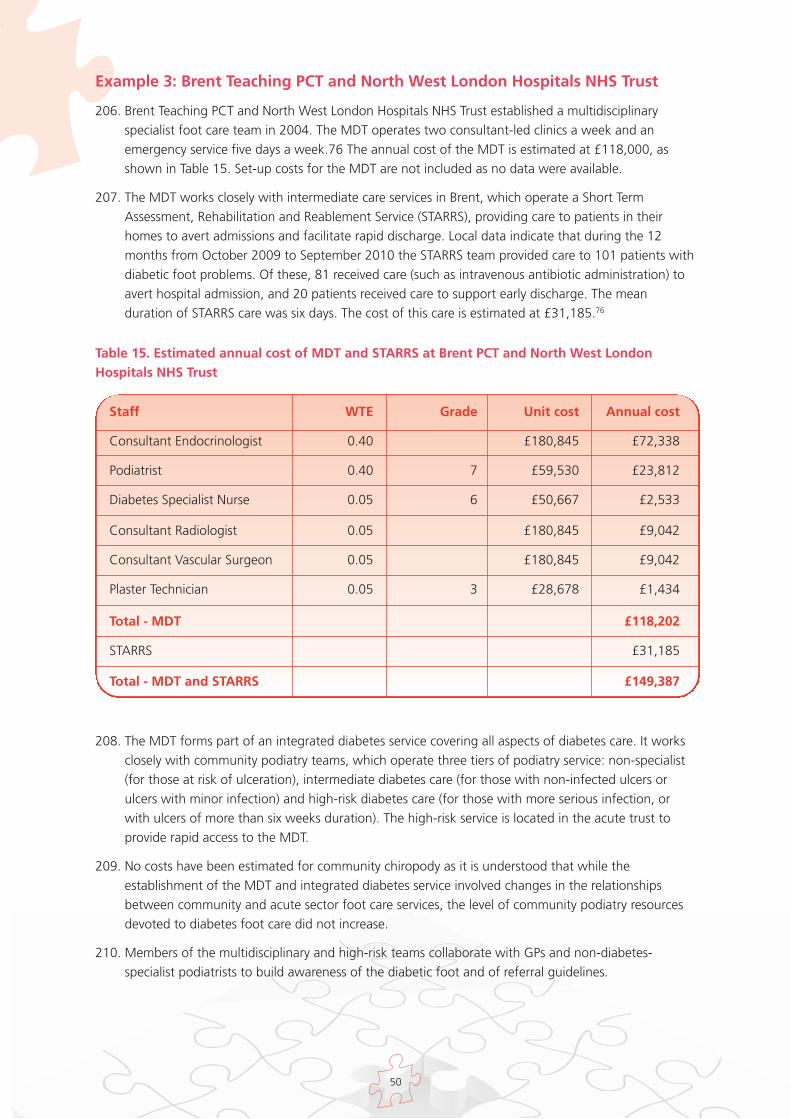
Table 15. Estimated annual cost of MDT and STARRS at Brent PCT and North West LondonHospitals NHS Trust
50
Staff WTE Grade Unit cost Annual cost
Consultant Endocrinologist 0.40 £180,845 £72,338
Podiatrist 0.40 7 £59,530 £23,812
Diabetes Specialist Nurse 0.05 6 £50,667 £2,533
Consultant Radiologist 0.05 £180,845 £9,042
Consultant Vascular Surgeon 0.05 £180,845 £9,042
Plaster Technician 0.05 3 £28,678 £1,434
Total - MDT £118,202
STARRS £31,185
Total - MDT and STARRS £149,387
208. The MDT forms part of an integrated diabetes service covering all aspects of diabetes care. It worksclosely with community podiatry teams, which operate three tiers of podiatry service: non-specialist(for those at risk of ulceration), intermediate diabetes care (for those with non-infected ulcers orulcers with minor infection) and high-risk diabetes care (for those with more serious infection, orwith ulcers of more than six weeks duration). The high-risk service is located in the acute trust toprovide rapid access to the MDT.
209. No costs have been estimated for community chiropody as it is understood that while theestablishment of the MDT and integrated diabetes service involved changes in the relationshipsbetween community and acute sector foot care services, the level of community podiatry resourcesdevoted to diabetes foot care did not increase.
210. Members of the multidisciplinary and high-risk teams collaborate with GPs and non-diabetes-specialist podiatrists to build awareness of the diabetic foot and of referral guidelines.
Example 3: Brent Teaching PCT and North West London Hospitals NHS Trust
206. Brent Teaching PCT and North West London Hospitals NHS Trust established a multidisciplinaryspecialist foot care team in 2004. The MDT operates two consultant-led clinics a week and anemergency service five days a week.76 The annual cost of the MDT is estimated at £118,000, asshown in Table 15. Set-up costs for the MDT are not included as no data were available.
207. The MDT works closely with intermediate care services in Brent, which operate a Short TermAssessment, Rehabilitation and Reablement Service (STARRS), providing care to patients in theirhomes to avert admissions and facilitate rapid discharge. Local data indicate that during the 12months from October 2009 to September 2010 the STARRS team provided care to 101 patients withdiabetic foot problems. Of these, 81 received care (such as intravenous antibiotic administration) toavert hospital admission, and 20 patients received care to support early discharge. The meanduration of STARRS care was six days. The cost of this care is estimated at £31,185.76
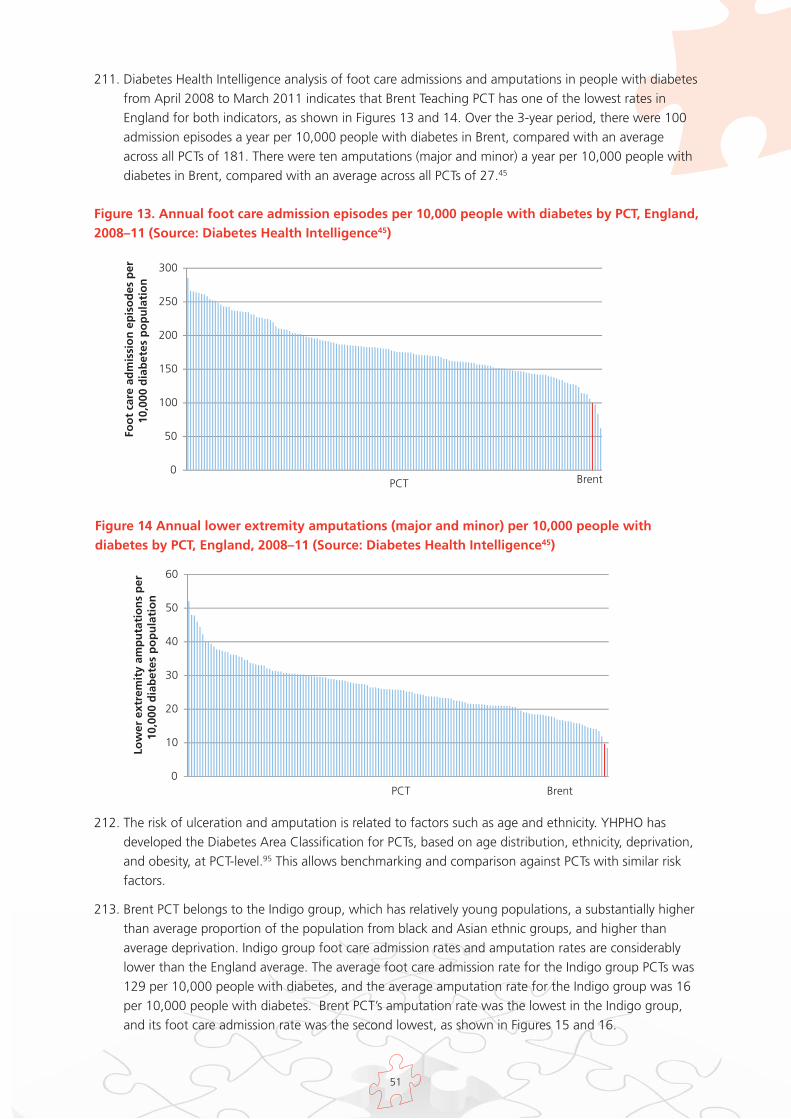
51
211. Diabetes Health Intelligence analysis of foot care admissions and amputations in people with diabetesfrom April 2008 to March 2011 indicates that Brent Teaching PCT has one of the lowest rates inEngland for both indicators, as shown in Figures 13 and 14. Over the 3-year period, there were 100admission episodes a year per 10,000 people with diabetes in Brent, compared with an averageacross all PCTs of 181. There were ten amputations (major and minor) a year per 10,000 people withdiabetes in Brent, compared with an average across all PCTs of 27.45
Figure 13. Annual foot care admission episodes per 10,000 people with diabetes by PCT, England,2008–11 (Source: Diabetes Health Intelligence45)
212. The risk of ulceration and amputation is related to factors such as age and ethnicity. YHPHO hasdeveloped the Diabetes Area Classification for PCTs, based on age distribution, ethnicity, deprivation,and obesity, at PCT-level.95 This allows benchmarking and comparison against PCTs with similar riskfactors.
213. Brent PCT belongs to the Indigo group, which has relatively young populations, a substantially higherthan average proportion of the population from black and Asian ethnic groups, and higher thanaverage deprivation. Indigo group foot care admission rates and amputation rates are considerablylower than the England average. The average foot care admission rate for the Indigo group PCTs was129 per 10,000 people with diabetes, and the average amputation rate for the Indigo group was 16per 10,000 people with diabetes. Brent PCT’s amputation rate was the lowest in the Indigo group,and its foot care admission rate was the second lowest, as shown in Figures 15 and 16.
Brent 0
50
100
150
200
250
300
Foo
t ca
re a
dm
issi
on
ep
iso
des
per
10
,000
dia
bet
es p
op
ula
tio
n
PCT
Figure 14 Annual lower extremity amputations (major and minor) per 10,000 people withdiabetes by PCT, England, 2008–11 (Source: Diabetes Health Intelligence45)
0
10
20
30
40
50
60
Low
er e
xtre
mit
y am
pu
tati
on
s p
er
10,0
00 d
iab
etes
po
pu
lati
on
PCT Brent
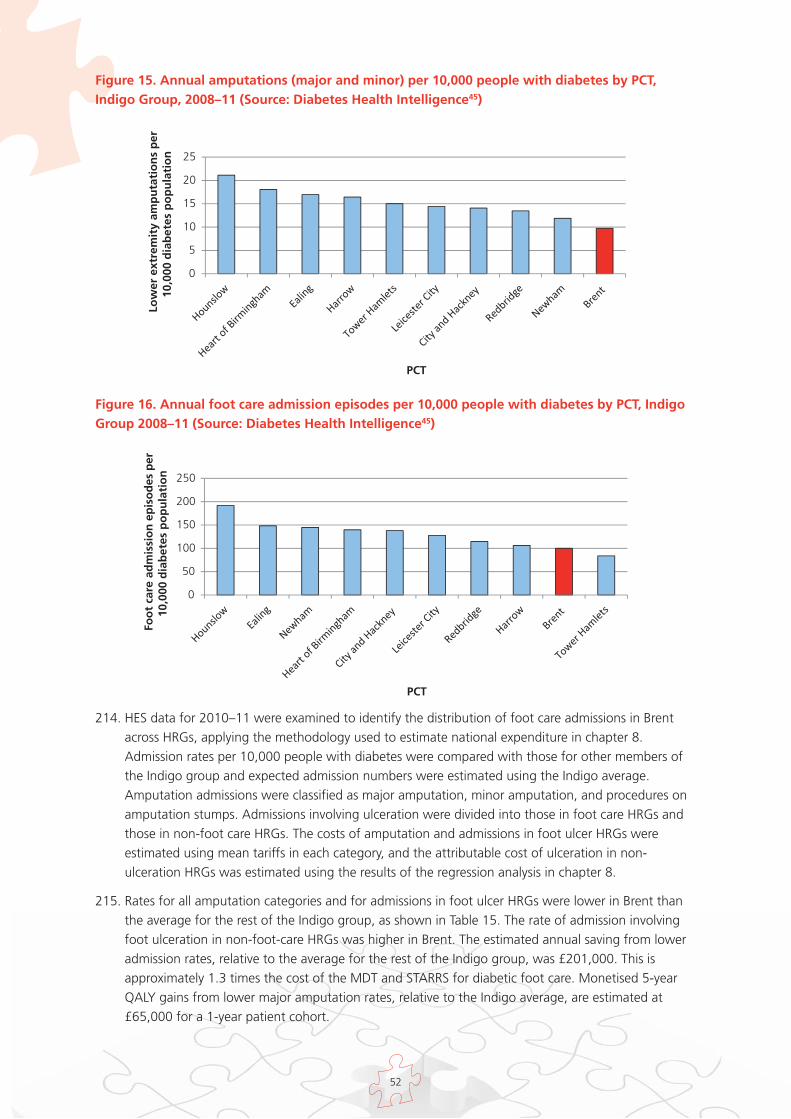
52
214. HES data for 2010–11 were examined to identify the distribution of foot care admissions in Brentacross HRGs, applying the methodology used to estimate national expenditure in chapter 8.Admission rates per 10,000 people with diabetes were compared with those for other members ofthe Indigo group and expected admission numbers were estimated using the Indigo average.Amputation admissions were classified as major amputation, minor amputation, and procedures onamputation stumps. Admissions involving ulceration were divided into those in foot care HRGs andthose in non-foot care HRGs. The costs of amputation and admissions in foot ulcer HRGs wereestimated using mean tariffs in each category, and the attributable cost of ulceration in non-ulceration HRGs was estimated using the results of the regression analysis in chapter 8.
215. Rates for all amputation categories and for admissions in foot ulcer HRGs were lower in Brent thanthe average for the rest of the Indigo group, as shown in Table 15. The rate of admission involvingfoot ulceration in non-foot-care HRGs was higher in Brent. The estimated annual saving from loweradmission rates, relative to the average for the rest of the Indigo group, was £201,000. This isapproximately 1.3 times the cost of the MDT and STARRS for diabetic foot care. Monetised 5-yearQALY gains from lower major amputation rates, relative to the Indigo average, are estimated at£65,000 for a 1-year patient cohort.
Figure 15. Annual amputations (major and minor) per 10,000 people with diabetes by PCT,Indigo Group, 2008–11 (Source: Diabetes Health Intelligence45)
0
5
10
15
20
25Lo
wer
ext
rem
ity
amp
uta
tio
ns
per
10
,000
dia
bet
es p
op
ula
tio
n
PCT
Figure 16. Annual foot care admission episodes per 10,000 people with diabetes by PCT, IndigoGroup 2008–11 (Source: Diabetes Health Intelligence45)
0
50
100
150
200
250
Foo
t ca
re a
dm
issi
on
ep
iso
des
per
10
,000
dia
bet
es p
op
ula
tio
n
PCT
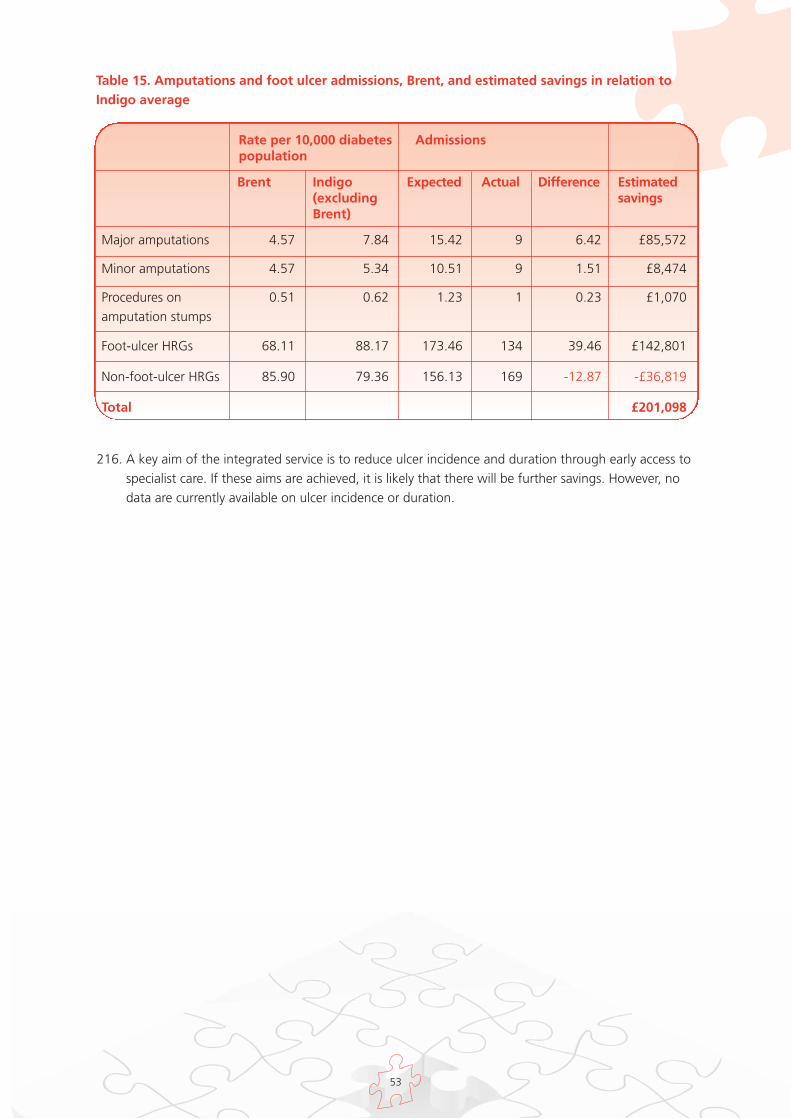
53
Table 15. Amputations and foot ulcer admissions, Brent, and estimated savings in relation toIndigo average
Rate per 10,000 diabetespopulation
Admissions
Brent Indigo(excludingBrent)
Expected Actual Difference Estimatedsavings
Major amputations 4.57 7.84 15.42 9 6.42 £85,572
Minor amputations 4.57 5.34 10.51 9 1.51 £8,474
Procedures on 0.51 0.62 1.23 1 0.23 £1,070amputation stumps
Foot-ulcer HRGs 68.11 88.17 173.46 134 39.46 £142,801
Non-foot-ulcer HRGs 85.90 79.36 156.13 169 -12.87 -£36,819
Total £201,098
216. A key aim of the integrated service is to reduce ulcer incidence and duration through early access tospecialist care. If these aims are achieved, it is likely that there will be further savings. However, nodata are currently available on ulcer incidence or duration.

54
Chapter 12. Discussion
217. The analysis presented in this paper suggests that expenditure on diabetic foot ulcers is substantial,around 0.6% to 0.7% of all NHS spending. Approximately £1 in every £150 the NHS in Englandspends each year is spent on diabetic foot ulcers.
218. Much of this activity is not pro-actively commissioned, or recognised by commissioners as spendingrelated to diabetic foot disease. Much of the care is provided by non-specialist staff, and is notidentified in local budgets as diabetic foot care.
219. The clinical and economic evidence reviewed in this paper suggest that targeted preventive servicescan identify those at risk of ulceration and improve outcomes, and that early access tomultidisciplinary specialist care for patients with ulcers can reduce ulcer duration, improve healingrates, reduce amputations and increase survival rates.
220. The paper also presents cost, benefit and saving estimates from three services, which suggest thatmultidisciplinary foot teams with strong links to community services can generate QALY gains forpatients, and financial savings for the NHS that substantially exceed the cost of the team. Savings areestimated in this paper arising from reductions in amputation rates, acute admissions, and length ofhospital stay.
221. No savings or QALY gains are estimated here for reductions in ulcer duration as data were notavailable. However, given study evidence on the impact of early specialist assessment on ulcerduration, it is likely that multidisciplinary teams with strong links to community care and rapid accesscan generate additional NHS savings and QALY gains through faster healing.
222. It is believed that around one fifth of sites providing inpatient care for people with diabetes have nomultidisciplinary foot team.48 In many areas of the country there are no clear pathways for referral ofincreased risk or high risk patients to foot protection teams, or for rapid referral of patients with newulcers, swelling or discolouration to MDTs, as recommended in NICE clinical guidelines.2,3,4
223. Unlike current models of care, establishment of targeted specialist services requires proactivecommissioning decisions. As in all areas of health care, decisions regarding the introduction ofimproved prevention and care services for foot problems in diabetes will need to be informed by localdata on costs, savings and outcomes. The figures will vary depending on how services are currentlydelivered, and on the configuration of proposed new services. The potential for savings and benefitswill also vary according to baseline standards of care.
224. The delivery of improved outcomes for patients and savings to the NHS is likely to require closecollaboration between primary, community and acute care providers. Rapid access to specialistservices requires understanding of the diabetic foot among non-specialist staff and clear referralprotocols, as well as the availability of multidisciplinary teams. Avoidance of unnecessary admissionsand early hospital discharge can only be achieved if appropriate services are available outside theacute setting.
225. The savings from improved care are likely to accrue both to commissioners and acute providers. Theexcess costs of extended lengths of stay are borne by acute providers, while the costs of amputationsand extended ulcer duration are paid by commissioners. It will be important for commissioners andproviders of care to consider the distribution of costs and savings arising from improved care, in orderto ensure that improved services are appropriately incentivised.

55
226. It will be important to audit new services using patient outcome and satisfaction measures, alongwith clinical and economic metrics, to ensure that gains in quality and productivity are achieved.
227. Diabetes prevalence is increasing. The Association of Public Health Observatories Diabetes Prevalencemodel predicts that the number of people with diabetes in England will increase by 23% between2010 and 2020.16 The absolute number of type 2 diabetes-related major amputations in Englandincreased by 43% between 1996 and 2005, even as rates per 10,000 people with diabetes werereduced.38 Unless there is a significant increase in the quality and efficiency of diabetes foot care, it islikely that the cost of ulceration and amputation care for people with diabetes will rise substantiallyin the coming years, both in absolute terms and as a proportion of total NHS spending.
228. Provision of higher quality cost effective foot care for people with diabetes, and early intervention toavoid complications, are likely to play an important part in attempts to improve the overall qualityand productivity of the NHS in the coming years.

56
Codes for Identification of Inpatient Admissions related to Ulceration orAmputation in Diabetes
Appendix 1
Diagnosis code(ICD-10)
Procedure code(OPCS- 4)
Other ICD-10code required
Other OPCS- 4code required
Amputation
At least one ofE10, E11, E12,E13, E14
Major amputation At least one ofX09, X10
Ulceration
L97Ulcer of the lowerlimb
At least one ofE10, E11, E12,E13, E14
L89Decubitus ulcer At least one ofE10, E11, E12,E13, E14
At least one ofL03.0, L03.1
Cellulitis At least one ofE10, E11, E12,E13, E14
M86Osteomyelitis At least one ofE10, E11, E12,E13, E14 AND atleast one of L97,L89, L03.0, L03.1,R02
R02Gangrene At least one ofE10, E11, E12,E13, E14
I70.2Atherosclerosis At least one ofE10, E11, E12,E13, E14 AND atleast one of L97,L89, L03.0, L03.1,R02
At least one ofE10, E11, E12,E13, E14
Minor amputation X11
At least one ofE10, E11, E12,E13, E14
Procedures onamputationstumps
X12
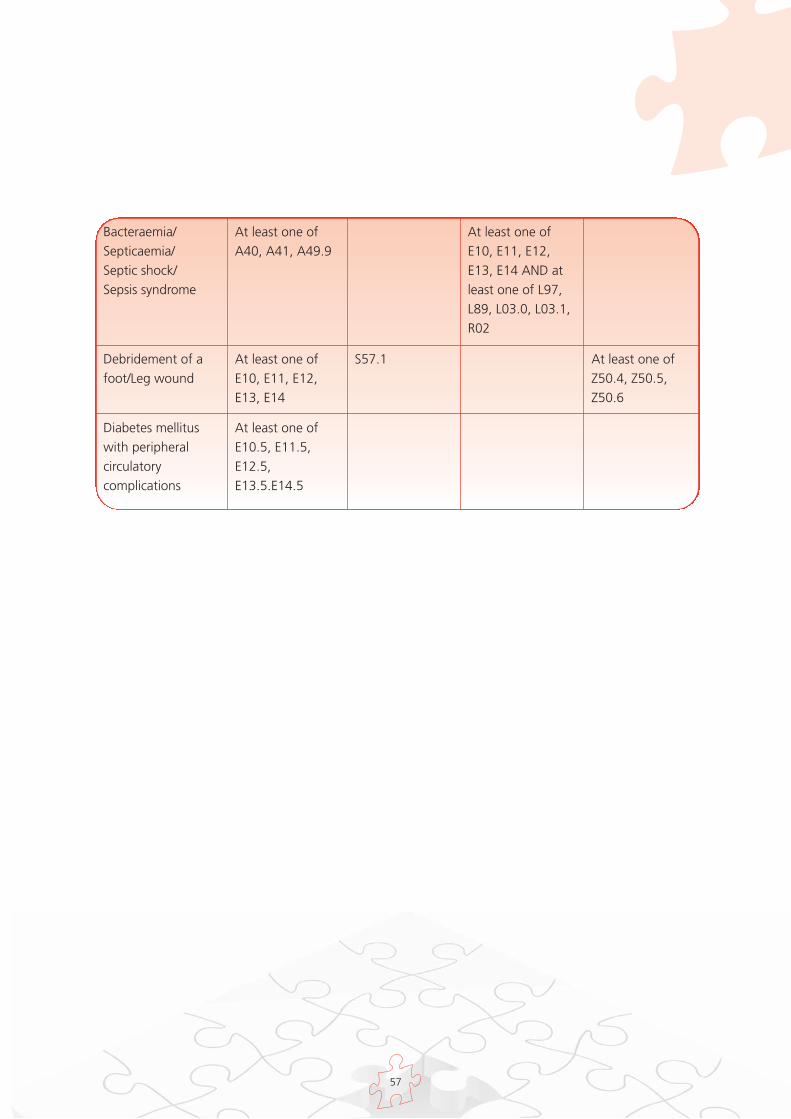
57
At least one ofA40, A41, A49.9
Bacteraemia/Septicaemia/Septic shock/Sepsis syndrome
At least one ofE10, E11, E12,E13, E14 AND atleast one of L97,L89, L03.0, L03.1,R02
At least one ofE10, E11, E12,E13, E14
Debridement of afoot/Leg wound
S57.1 At least one ofZ50.4, Z50.5,Z50.6
At least one ofE10.5, E11.5,E12.5,E13.5.E14.5
Diabetes mellituswith peripheralcirculatorycomplications
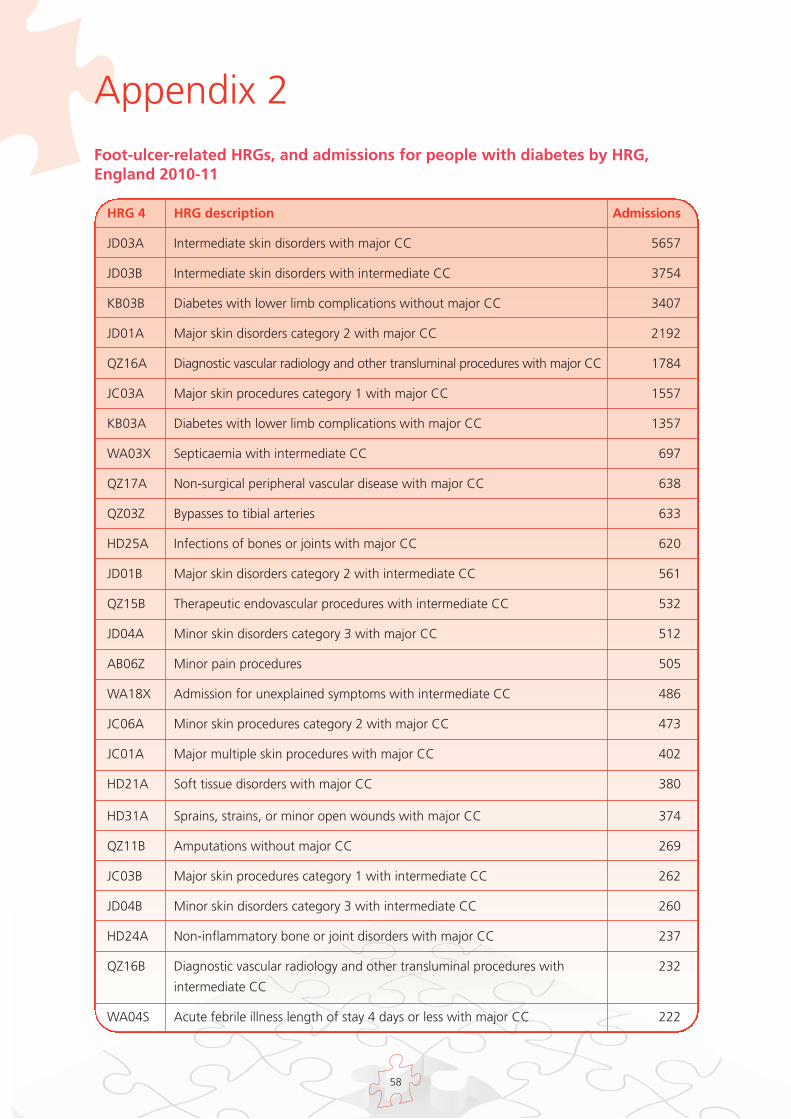
58
Foot-ulcer-related HRGs, and admissions for people with diabetes by HRG,England 2010-11
Appendix 2
HRG 4 HRG description Admissions
JD03A Intermediate skin disorders with major CC 5657
JD03B Intermediate skin disorders with intermediate CC 3754
KB03B Diabetes with lower limb complications without major CC 3407
JD01A Major skin disorders category 2 with major CC 2192
QZ16A Diagnostic vascular radiology and other transluminal procedures with major CC 1784
JC03A Major skin procedures category 1 with major CC 1557
KB03A Diabetes with lower limb complications with major CC 1357
WA03X Septicaemia with intermediate CC 697
QZ17A Non-surgical peripheral vascular disease with major CC 638
QZ03Z Bypasses to tibial arteries 633
HD25A Infections of bones or joints with major CC 620
JD01B Major skin disorders category 2 with intermediate CC 561
QZ15B Therapeutic endovascular procedures with intermediate CC 532
JD04A Minor skin disorders category 3 with major CC 512
AB06Z Minor pain procedures 505
WA18X Admission for unexplained symptoms with intermediate CC 486
JC06A Minor skin procedures category 2 with major CC 473
JC01A Major multiple skin procedures with major CC 402
HD21A Soft tissue disorders with major CC 380
HD31A Sprains, strains, or minor open wounds with major CC 374
QZ11B Amputations without major CC 269
JC03B Major skin procedures category 1 with intermediate CC 262
JD04B Minor skin disorders category 3 with intermediate CC 260
HD24A Non-inflammatory bone or joint disorders with major CC 237
QZ16B Diagnostic vascular radiology and other transluminal procedures with 232
intermediate CC
WA04S Acute febrile illness length of stay 4 days or less with major CC 222
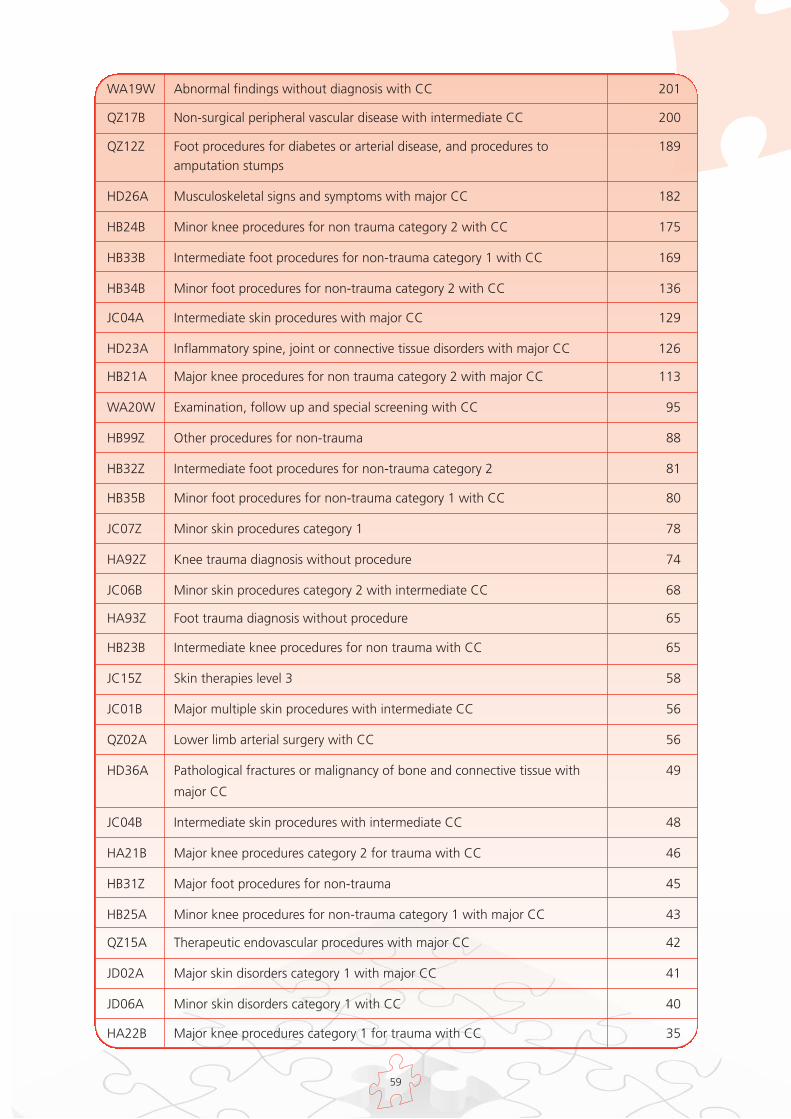
59
WA19W Abnormal findings without diagnosis with CC 201
QZ17B Non-surgical peripheral vascular disease with intermediate CC 200
QZ12Z Foot procedures for diabetes or arterial disease, and procedures to 189amputation stumps
HD26A Musculoskeletal signs and symptoms with major CC 182
HB24B Minor knee procedures for non trauma category 2 with CC 175
HB33B Intermediate foot procedures for non-trauma category 1 with CC 169
HB34B Minor foot procedures for non-trauma category 2 with CC 136
JC04A Intermediate skin procedures with major CC 129
HD23A Inflammatory spine, joint or connective tissue disorders with major CC 126
HB21A Major knee procedures for non trauma category 2 with major CC 113
WA20W Examination, follow up and special screening with CC 95
HB99Z Other procedures for non-trauma 88
HB32Z Intermediate foot procedures for non-trauma category 2 81
HB35B Minor foot procedures for non-trauma category 1 with CC 80
JC07Z Minor skin procedures category 1 78
HA92Z Knee trauma diagnosis without procedure 74
JC06B Minor skin procedures category 2 with intermediate CC 68
HA93Z Foot trauma diagnosis without procedure 65
HB23B Intermediate knee procedures for non trauma with CC 65
JC15Z Skin therapies level 3 58
JC01B Major multiple skin procedures with intermediate CC 56
QZ02A Lower limb arterial surgery with CC 56
HD36A Pathological fractures or malignancy of bone and connective tissue with 49
major CC
JC04B Intermediate skin procedures with intermediate CC 48
HA21B Major knee procedures category 2 for trauma with CC 46
HB31Z Major foot procedures for non-trauma 45
HB25A Minor knee procedures for non-trauma category 1 with major CC 43
QZ15A Therapeutic endovascular procedures with major CC 42
JD02A Major skin disorders category 1 with major CC 41
JD06A Minor skin disorders category 1 with CC 40
HA22B Major knee procedures category 1 for trauma with CC 35

60
JC02A Major skin procedures category 2 with major CC 34
JD05A Minor skin disorders category 2 with major CC 33
WA21W Other procedures and health care problems with CC 31
HA23B Intermediate knee procedures category 2 for trauma with CC 30
JC05B Minor skin procedures category 3 with intermediate CC 29
JC05A Minor skin procedures category 3 with major CC 28
HA34Z Minor foot procedures for trauma category 2 20
WA06W Other viral illness with CC 20
HA26B Minor knee procedures category 1 for trauma with CC 19
PA17B Intermediate infections without CC 19
HA31B Major foot procedures for trauma with CC 17
JC27Z Nursing procedures & dressings 1 16
AB03Z Complex pain procedures 15
HA25B Minor knee procedures category 2 for trauma with CC 15
HA35Z Minor foot procedures for trauma category 1 15
HA33Z Intermediate foot procedures for trauma category 1 13
WA04T Acute febrile illness length of stay 4 days or less with intermediate CC 11
HB22B Major knee procedures for non trauma category 1 with CC 10
AB04Z Major pain procedures 9
JD05B Minor skin disorders category 2 with intermediate CC 9
WA18V Admission for unexplained symptoms with major CC 9
JC02B Major skin procedures category 2 with intermediate CC 8
JD03C Intermediate skin disorders without CC 8
HB25B Minor knee procedures for non trauma category 1 with CC 7
HA24Z Intermediate knee procedures category 1 for trauma 6
HA32Z Intermediate foot procedures for trauma category 2 6
HA96Z Multiple trauma diagnoses without procedure 6
JC16Z Skin therapies level 4 6
JD01C Major skin disorders category 2 without CC 6
HD23B Inflammatory spine, joint or connective tissue disorders with CC 5
JD02B Major skin disorders category 1 with intermediate CC 5
AB05Z Intermediate pain procedures 4

61
HB21B Major knee procedures for non trauma category 2 with CC 4
JC17Z Skin therapies level 5 4
QZ11A Amputations with major CC 4
QZ19Z Blood vessel injury with no significant procedure 4
WA22V Other specified admissions and counselling with major CC 4
HD31B Sprains, strains, or minor open wounds with CC 3
HD32A Major cranial, visceral or blood vessel injury with major CC 3
JC14Z Skin therapies level 2 3
HB91Z Other non trauma diagnosis without procedure 2
HD21B Soft tissue disorders with CC 2
HD25B Infections of bones or joints with CC 2
WA09W Other non-viral infection with CC 2
AB02Z Complex major pain procedures 1
HD24B Non-inflammatory bone or joint disorders with CC 1
HD35A Other wounds or injuries with major CC 1
JC03C Major skin procedures category 1 without CC 1
NZ09Z Admission with full investigation 1
PA17A Intermediate infections with CC 1
PA35A Skin disorders with CC 1
PA37Z Diabetes mellitus 1
WA03V Septicaemia with major CC 1
CC, complications and comorbidities
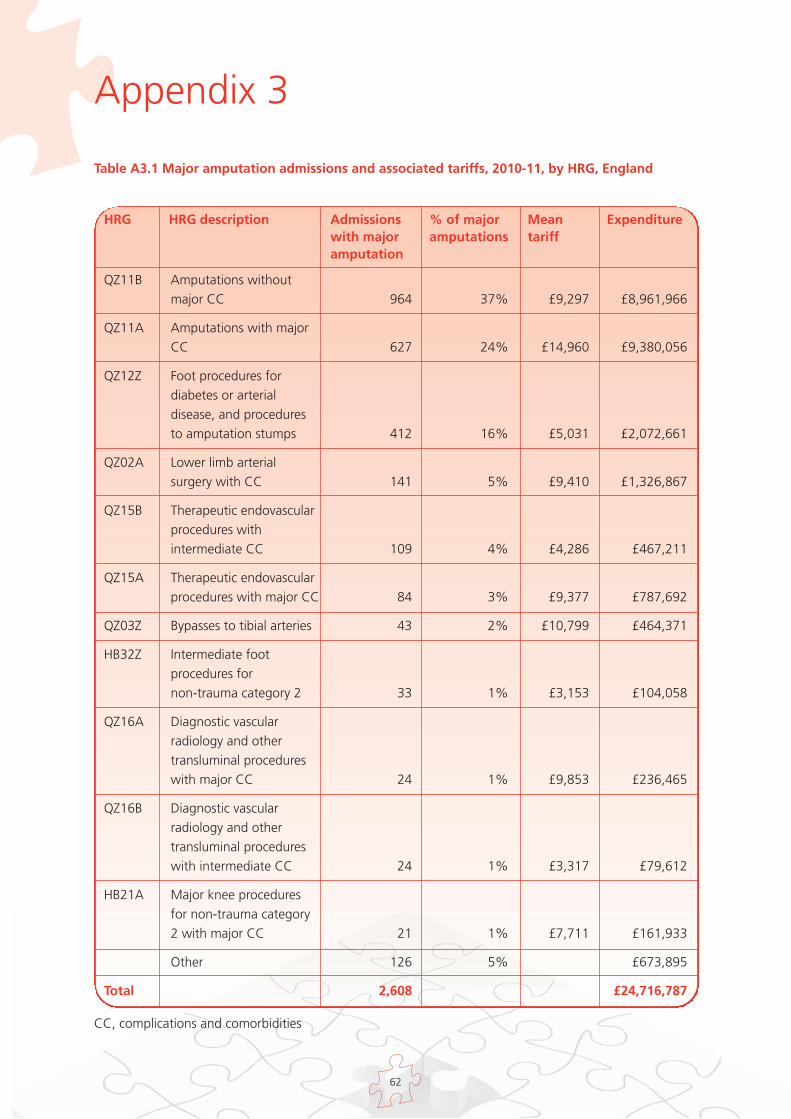
62
HRG HRG description Admissionswith majoramputation
% of majoramputations
Meantariff
Expenditure
QZ11B Amputations without major CC 964 37% £9,297 £8,961,966
QZ11A Amputations with major CC 627 24% £14,960 £9,380,056
QZ12Z Foot procedures for diabetes or arterial disease, and procedures to amputation stumps 412 16% £5,031 £2,072,661
QZ02A Lower limb arterial surgery with CC 141 5% £9,410 £1,326,867
QZ15B Therapeutic endovascular procedures with intermediate CC 109 4% £4,286 £467,211
QZ15A Therapeutic endovascular procedures with major CC 84 3% £9,377 £787,692
QZ03Z Bypasses to tibial arteries 43 2% £10,799 £464,371
HB32Z Intermediate foot procedures for non-trauma category 2 33 1% £3,153 £104,058
QZ16A Diagnostic vascular radiology and other transluminal procedures with major CC 24 1% £9,853 £236,465
QZ16B Diagnostic vascular radiology and other transluminal procedures with intermediate CC 24 1% £3,317 £79,612
HB21A Major knee procedures for non-trauma category 2 with major CC 21 1% £7,711 £161,933
Other 126 5% £673,895
Total 2,608 £24,716,787
CC, complications and comorbidities
Table A3.1 Major amputation admissions and associated tariffs, 2010-11, by HRG, England
Appendix 3
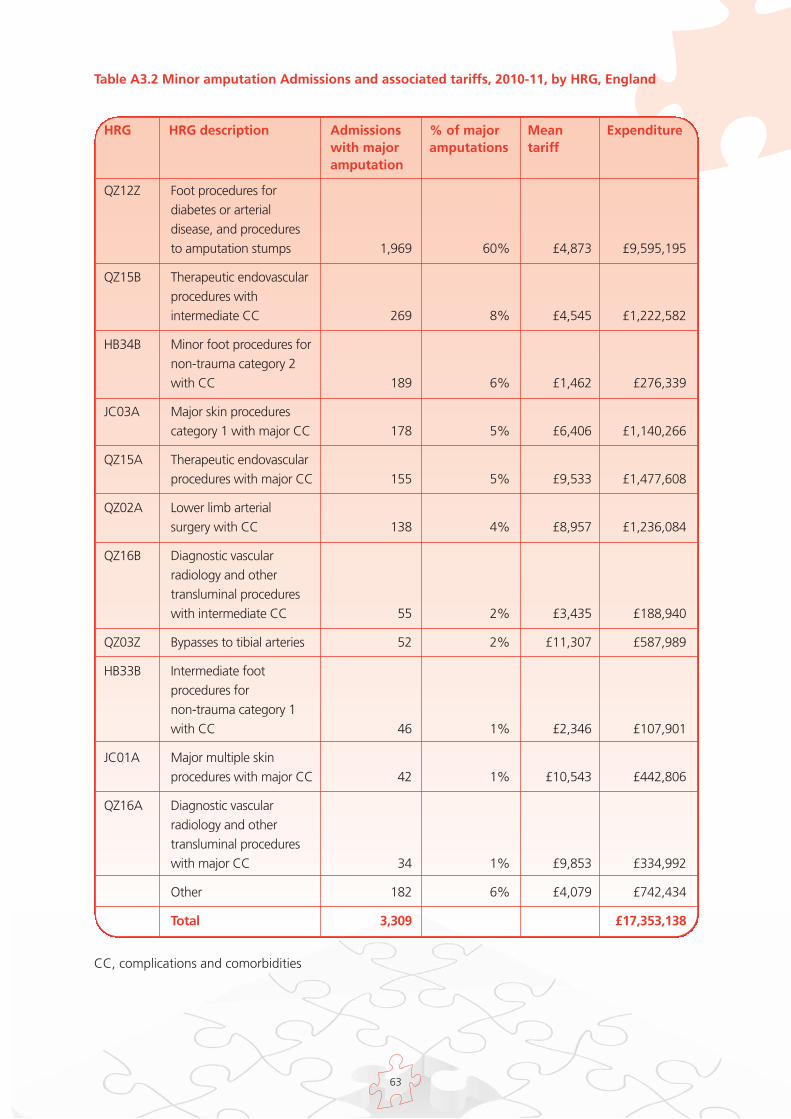
63
Table A3.2 Minor amputation Admissions and associated tariffs, 2010-11, by HRG, England
HRG HRG description Admissionswith majoramputation
% of majoramputations
Meantariff
Expenditure
QZ12Z Foot procedures for diabetes or arterial disease, and procedures to amputation stumps 1,969 60% £4,873 £9,595,195
QZ15B Therapeutic endovascular procedures with intermediate CC 269 8% £4,545 £1,222,582
HB34B Minor foot procedures for non-trauma category 2 with CC 189 6% £1,462 £276,339
JC03A Major skin procedures category 1 with major CC 178 5% £6,406 £1,140,266
QZ15A Therapeutic endovascular procedures with major CC 155 5% £9,533 £1,477,608
QZ02A Lower limb arterial surgery with CC 138 4% £8,957 £1,236,084
QZ16B Diagnostic vascular radiology and other transluminal procedures with intermediate CC 55 2% £3,435 £188,940
QZ03Z Bypasses to tibial arteries 52 2% £11,307 £587,989
HB33B Intermediate foot procedures for non-trauma category 1 with CC 46 1% £2,346 £107,901
JC01A Major multiple skin procedures with major CC 42 1% £10,543 £442,806
QZ16A Diagnostic vascular radiology and other transluminal procedures with major CC 34 1% £9,853 £334,992
Other 182 6% £4,079 £742,434
Total 3,309 £17,353,138
CC, complications and comorbidities
64
1 Game FL, Hinchliffe RJ, Apelqvist J et al. A systematic review of interventions to enhance the healing
of chronic ulcers of the foot in diabetes. Diabetes Metab Res Rev 2012;28(Suppl 1):119–41.
2 National Institute for Health and Clinical Excellence. Type 2 Diabetes Prevention and Management of
Foot Problems. Clinical Guideline 10. London: National Institute for Health and Clinical Excellence,
2004. Available from http://publications.nice.org.uk/type-2-diabetes-foot-problems-cg10, last
accessed 28 Feb 2012.
3 National Institute for Health and Clinical Excellence. Type 1 Diabetes in Children, Young People and
Adults. Clinical Guideline 15. London: National Institute for Health and Clinical Excellence, 2004, last
modified 2011. Available from http://publications.nice.org.uk/type-1-diabetes-cg15, last accessed 28
Feb 2012.
4 National Institute for Health and Clinical Excellence. Diabetic Foot Problems: Inpatient Management
of Diabetic Foot Problems. Clinical Guideline 119. London: National Institute for Health and Clinical
Excellence, 2011. Available from http://publications.nice.org.uk/diabetic-foot-problems-cg119, last
accessed 28 Feb 2012.
5 National Institute for Health and Clinical Excellence. Diabetes in Adults Quality Standard. London:
National Institute for Health and Clinical Excellence, 2011. Available from
www.nice.org.uk/guidance/qualitystandards/diabetesinadults/diabetesinadultsqualitystandard.jsp, last
accessed 28 Feb 2012.
6 Putting Feet First: National Minimum Skills Framework. Joint initiative from Diabetes UK, Foot in
Diabetes UK, NHS Diabetes, the Association of British Clinical Diabetologists, the Primary Care
Diabetes Society, the Society of Chiropodists and Podiatrists. London: Diabetes UK, 2011. Available
from
www.diabetes.org.uk/Documents/Professionals/Education%20and%20skills/NMSF_16Feb2011.pdf,
last accessed 27 Feb 2012.
7 Putting Feet First: Commissioning Specialist Services for the Management and Prevention of Diabetic
Foot Disease in Hospitals. London: Diabetes UK, 2009. Available from
www.diabetes.org.uk/Documents/Reports/Putting_Feet_First_010709.pdf, last accessed 27 Feb 2012.
8 Commissioning Diabetes Foot Care Services. London: NHS Diabetes, 2011. Available from
www.diabetes.nhs.uk/document.php?o=23, last accessed 27 Feb 2012.
9 Kumar S, Ashe HA, Parnell LN et al. The prevalence of foot ulceration and its correlates in type 2
diabetic patients: a population-based study. Diabet Med 1994;11:480–4.
10 Walters DP, Gatling W, Mullee MA, Hill RD. The distribution and severity of diabetic foot disease: a
community study with comparison to a non-diabetic group. Diabet Med 1992;9:354–8.
References
65
11 Neil HA, Thompson AV, Thorogood M et al. Diabetes in the elderly: the Oxford Community Diabetes
Study. Diabet Med 1989;6:608–13.
12 Abbott CA, Carrington AL, Ashe H et al. The North-West Diabetes Foot Care Study: incidence of,
and risk factors for, new diabetic foot ulceration in a community-based patient cohort. Diabet Med
2002;19:377–84.
13 Leese GP, Stang D, McKnight JA and Scottish Diabetes Foot Action Group A national strategic
approach to diabetic foot disease in Scotland: changing a culture. The British Journal of Diabetes &
Vascular Disease 2011; 11: 69-73
14 Personal communication, Paul Chadwick, Principal Podiatrist, Salford Royal NHS Foundation Trust
15 http://www.ic.nhs.uk/qof last accessed 27 Feb 2012.
16 APHO Diabetes Prevalence model for England,
http://www.yhpho.org.uk/resource/view.aspx?RID=81090 last accessed 27 Feb 2012.
17 Boulton AJ, Vileikyte L, Ragnarson-Tennvall G, Apelqvist J. The global burden of diabetic foot
disease. Lancet 2005;366:1719–24.
18 National Diabetes Audit Executive Summary 2009-10 The NHS Information Centre 2011
19 Holman N, Young RJ, Jeffcoate WJ. Variation in the incidence of amputation of the lower limb in
England Diabetologia 2012
20 Krans HM, Porta M, Keen H. Diabetes care and research in Europe: the St. Vincent Declaration
action programme 1992. Copenhagen: World Health Organization; 1992. WHO Regional Office,
document no. EUR/IGP/OR 055/3
21 Price P. The Diabetic Foot: Quality of Life Clinical Infectious Diseases 2004:39 (Suppl.2) S129-131
22 Jeffcoate WJ, Price PE, Phillips CJ et al. Randomised controlled trial of the use of three dressing
preparations in the management of chronic ulceration of the foot in diabetes. Health Technol Assess
2009;13:1–86, iii–iv.
23 Brazier J, Roberts J, Tsuchiya A, Busschbach J. A comparison of the EQ-5D and SF-6D across seven
patient groups. Health Econ 2004;13:873–84.
24 Davison SN, Jhangri GS, Feeny DH. Comparing the Health Utilities Index Mark 3 (HUI3) with the
Short Form-36 preference-based SF-6D in chronic kidney disease. Value Health 2009;12:340–5.
25 Ragnarson Tennvall G, Apelqvist J. Health-related quality of life in patients with diabetes mellitus
and foot ulcers. J Diabetes Complications 2000;14:235–41.
26 Guide to the Methods of Technology Appraisal NICE 2008
27 Wasserfallen JB, Halabi G, Saudan P et al. Quality of life on chronic dialysis: comparison between
haemodialysis and peritoneal dialysis. Nephrol Dial Transplant 2004;19:1594–9.
66
28 U.K. Prospective Diabetes Study Group Quality of Life in Type 2 Diabetic Patients Is Affected by
Complications But Not by Intensive Policies to Improve Blood Glucose or Blood Pressure Control
(UKPDS 37) Diabetes Care 22: 7 July 1999
29 Willrich A, Pinzur M, McNeil M et al. Health related quality of life, cognitive function, and
depression in diabetic patients with foot ulcer or amputation. A preliminary study. Foot Ankle Int
2005;26:128–34.
30 Eckman MH, Greenfield S, Mackey WC et al. Foot infections in diabetic patients. Decision and cost-
effectiveness analyses. JAMA 1995;273:712–20.
31 Jeffcoate WJ, Chipchase SY, Ince P, Game FL. Assessing the outcome of the management of diabetic
foot ulcers using ulcer-related and person-related measures. Diabetes Care 2006;29:1784–7.
32 Apelqvist J, Larsson J, Agardh CD. Long-term prognosis for diabetic patients with foot ulcers. J
Intern Med 1993;233:485–91
33 Pound N, Chipchase S, Treece K et al. Ulcer-free survival following management of foot ulcers in
diabetes. Diabet Med 2005;22:1306–9.
34 Armstrong DG, Lavery LA, Harkless LB. Validation of a diabetic wound classification system. The
contribution of depth, infection, and ischemia to risk of amputation. Diabetes Care 1998;21:855–9.
35 Lincoln NB, Radford KA, Game FL, Jeffcoate WJ. Education for secondary prevention of foot ulcers
in people with diabetes: a randomised controlled trial. Diabetologia 2008;51:1954–61.
36 Ghanassia E, Villon L, Thuan Dit Dieudonne JF et al. Long-term outcome and disability of diabetic
patients hospitalized for diabetic foot ulcers: a 6.5-year follow-up study. Diabetes Care
2008;31:1288–92.
37 Waugh NR. Amputations in diabetic patients—a review of rates, relative risks and resource use.
Community Med 1988;10:279–88.
38 Vamos EP, Bottle A, Majeed A, Millett C. Trends in lower extremity amputations in people with and
without diabetes in England, 1996-2005. Diabetes Res Clin Pract 2010;87:275–82.
39 Icks A, Scheer M, Morbach S et al. Time-dependent impact of diabetes on mortality in patients after
major lower extremity amputation: survival in a population-based 5-year cohort in Germany.
Diabetes Care 2011 34:1350-4
40 Ikonen TS, Sund R, Venermo M, et al. Fewer major amputations among individuals with diabetes in
Finland in 1997-2007: a population-based study. Diabetes Care 2010; 33:2598-603
41 Resnick HE, Carter EA, Lindsay R et al. Relation of lower-extremity amputation to all-cause and
cardiovascular disease mortality in American Indians: the Strong Heart Study. Diabetes Care
2004;27:1286–93.
42 Moulik PK, Mtonga R, Gill GV. Amputation and mortality in new-onset diabetic foot ulcers stratified
by etiology. Diabetes Care 2003;26:491–4.

67
43 Cancer survival in England: one-year and five-year survival for 21 common cancers, by sex and age
ONS 2010
44 Young MJ, McCardle JE, Randall LE, Barclay JI. Improved survival of diabetic foot ulcer patients
1995-2008: possible impact of aggressive cardiovascular risk management. Diabetes Care
2008;31:2143–7.
45 http://www.yhpho.org.uk/default.aspx?RID=116836 last accessed 27 Feb 2012.
46 Jeffcoate WJ, van Houtum WH. Amputation as a marker of the quality of foot care in diabetes.
Diabetologia 2004;47:2051–8.
47 Wrobel JS, Robbins J, Armstrong DG. The high-low amputation ratio: a deeper insight into diabetic
foot care? J Foot Ankle Surg 2006;45:375–9.
48 National Diabetes Inpatient Audit 2010 NHS Diabetes
http://www.diabetes.nhs.uk/information_and_data/diabetes_audits/national_diabetes_inpatient_aud
it/ last accessed 27 Feb 2012.
49 Diabetes UK survey of people with diabetes and access to healthcare services 2009
http://www.diabetes.org.uk/Documents/Reports/Members'_survey_report_22.01.2010.pdf last
accessed 27 Feb 2012.
50 Management of diabetes A national clinical guideline Scottish Intercollegiate Guidelines Network
2010
51 Crawford F, Inkster M, Kleijnen J, Fahey T. Predicting foot ulcers in patients with diabetes: a
systematic review and meta-analysis. QJM 2007;100:65–86.
52 Adler AI, Erqou S, Lima TA, Robinson AH. Association between glycated haemoglobin and the risk
of lower extremity amputation in patients with diabetes mellitus-review and meta-analysis.
Diabetologia 2010;53:840–9.
53 Leese GP, Reid F, Green V et al. Stratification of foot ulcer risk in patients with diabetes: a
population-based study. Int J Clin Pract 2006;60:541–5.
54 McCabe CJ, Stevenson RC, Dolan AM. Evaluation of a diabetic foot screening and protection
programme. Diabet Med 1998;15:80–4.
55 Plank J, Haas W, Rakovac I et al. Evaluation of the impact of chiropodist care in the secondary
prevention of foot ulcerations in diabetic subjects. Diabetes Care 2003;26:1691–5.
56 McMurray SD, Johnson G, Davis S, McDougall K. Diabetes education and care management
significantly improve patient outcomes in the dialysis unit. Am J Kidney Dis 2002;40:566–75.
57 Singh N, Armstrong DG, Lipsky BA. Preventing foot ulcers in patients with diabetes. JAMA
2005;293:217–28.
58 Dorresteijn JA, Kriegsman DM, Assendelft WJ, Valk GD. Patient education for preventing diabetic
foot ulceration. Cochrane Database Syst Rev 2010:CD001488.
68
59 Ince P, Game FL, Jeffcoate WJ. Rate of healing of neuropathic ulcers of the foot in diabetes and its
relationship to ulcer duration and ulcer area. Diabetes Care 2007;30:660–3.
60 Margolis DJ, Kantor J, Santanna J et al. Risk factors for delayed healing of neuropathic diabetic foot
ulcers: a pooled analysis. Arch Dermatol 2000;136:1531–5.
61 Margolis DJ, Allen-Taylor L, Hoffstad O, Berlin JA. Healing diabetic neuropathic foot ulcers: are we
getting better? Diabet Med 2005;22:172–6.
62 Oyibo SO, Jude EB, Tarawneh I et al. The effects of ulcer size and site, patient's age, sex and type
and duration of diabetes on the outcome of diabetic foot ulcers. Diabet Med 2001;18:133-8.
63 Krishnan S, Nash F, Baker N et al. Reduction in diabetic amputations over 11 years in a defined U.K.
population: benefits of multidisciplinary team work and continuous prospective audit. Diabetes Care
2008;31:99–101.
64 Canavan RJ, Unwin NC, Kelly WF, Connolly VM. Diabetes- and nondiabetes-related lower extremity
amputation incidence before and after the introduction of better organized diabetes foot care:
continuous longitudinal monitoring using a standard method. Diabetes Care 2008;31:459–63.
65 Larsson J, Apelqvist J, Agardh CD, Stenstrom A. Decreasing incidence of major amputation in
diabetic patients: a consequence of a multidisciplinary foot care team approach? Diabet Med
1995;12:770–6.
66 Rates calculated from unpublished data provided by South Devon Healthcare NHS Foundation Trust
67 Bowen G. et al. The impact of a diabetic foot protection team (DFPT) on outcomes for patients with
diabetic vascular disease British Journal of Surgery 2008; 95(S1): 4-5
68 International Consensus on the diabetic foot. The International Working Group on the Diabetic
Foot, Amsterdam 1990
69 Ragnarson Tennvall G, Apelqvist J. Prevention of diabetes-related foot ulcers and amputations: a
cost-utility analysis based on Markov model simulations. Diabetologia 2001;44:2077–87.
70 Rauner M. et al. Using a Markov model to evaluate the cost-effectiveness of diabetic foot
prevention strategies in Austria (2004) Proceedings of the Western Multiconference, International
conference on Health Sciences Simulation, January 18-22 2004 San Diego, California, USA
71 Ince P, Abbas ZG, Lutale JK et al. Use of the SINBAD classification system and score in comparing
outcome of foot ulcer management on three continents. Diabetes Care 2008;31:964–7.
72 Oyibo SO, Jude EB, Tarawneh I et al. A comparison of two diabetic foot ulcer classification systems:
the Wagner and the University of Texas wound classification systems. Diabetes Care 2001;24:84–8.
73 Leese G, Nathwani D, Young M. et al. Use of antibiotics in people with diabetic foot disease: A
consensus statement The Diabetic Foot Journal 2009;12: 2

69
74 British National Formulary 62 http://bnf.org/bnf/bnf/current/ last accessed on 10/02/12
75 Piaggesi A, Macchiarini S, Rizzo L et al. An off-the-shelf instant contact casting device for the
management of diabetic foot ulcers: a randomized prospective trial versus traditional fiberglass cast.
Diabetes Care 2007;30:586–90.
76 Personal communication, Wing May Kong, Consultant Endocrinologist, The North West London
Hospitals NHS Trust
77 Morales Lozano R, Gonzalez Fernandez ML, Martinez Hernandez D et al. Validating the probe-to-
bone test and other tests for diagnosing chronic osteomyelitis in the diabetic foot. Diabetes Care
2010;33:2140–5.
78 Ince P, Kendrick D, Game F, Jeffcoate W. The association between baseline characteristics and the
outcome of foot lesions in a UK population with diabetes. Diabet Med 2007;24:977–81.
79 Personal communication, Jonathan Valabhji, Consultant Diabetologist, Imperial College Healthcare
NHS Trust
80 Curtis L. Unit Costs of Health and Social Care 2011 PSSRU
81 http://www.dh.gov.uk/en/Publicationsandstatistics/Publications/PublicationsPolicy
AndGuidance/DH_112284 last accessed 27 Feb 2012.
82 Lavery La, Armstrong DG, Peters EJG. Probe-to-Bone Test for Diagnosing Diabetic Foot Osteomyelitis
Reliable or relic? Diabetes Care February 2007 vol. 30 no. 2 270-274
83 Ramsey SD, Newton K, Blough D. et al. Incidence, Outcomes, and Cost of Foot Ulcers in Patients
with Diabetes Diabetes Care22:382–387, 1999
84 Shone A, Burnside J, Chipchase S. et al. Probing the Validity of the Probe-to-Bone Test in the
Diagnosis of Osteomyelitis of the Foot in Diabetes Diabetes Care April 2006 vol. 29 no. 4 945
85 Simmons D, Wenzel H. Diabetes inpatients: a case of lose, lose, lose. Is it time to use a 'diabetes-
attributable hospitalization cost' to assess the impact of diabetes? Diabet Med 2011;28:1123–30.
86 http://www.institute.nhs.uk/quality_and_service_improvement_tools/quality_and_service_
improvement_tools/length_of_stay.html last accessed 27 Feb 2012.
87 Vamos EP, Bottle A, Edmonds ME. et al. Changes in the incidence of lower extremity amputations
in people with and without diabetes in England between 2004 and 2008 Diabetes Care. 2010
Dec;33(12):2592-7
88 Estimates provided by the Royal National Orthopaedic Hospital, Stanmore
89 NHS Reference Costs 2009-10
http://www.dh.gov.uk/en/Publicationsandstatistics/Publications/PublicationsPolicyAndGuidance/DH_
123459 last accessed 27 Feb 2012.

70
90 The Amputee Statistical Database for the United Kingdom 2006/07 Information Services Division,
NHS Scotland on behalf of National Amputee Statistical Database (NASDAB) 2009
91 Stewart CP, Jain AS, Ogston SA. Lower limb amputee survival. Prosthet Orthot Int 1992;16:11–18.
92 Gordois A, Scuffham P, Shearer A et al. The health care costs of diabetic peripheral neuropathy in
the US. Diabetes Care 2003;26:1790–5.
93 Personal communication, Simon Ashwell, Consultant Endocrinologist, The James Cook University
Hospital
94 Personal communication, Graham Bowen, Clinical Lead for Diabetes , Southampton City PCT, 2004-
07
95 http://www.yhpho.org.uk/resource/item.aspx?RID=9950 last accessed 27 Feb 2012


Further copies of this publication can be ordered from Prontaprint, by emailing [email protected] or tel: 0116 275 3333, quoting DIABETES 175
www.diabetes.nhs.uk