Embed Size (px)
Citation preview

f
__) RocketdyneNorth American Rockwell
6633 Canoga Avenue,
Canoga Park, Cahfornia 91304
R-8144
TRIDYNE ATTITUDE CONTROL
TttRUSTER INVESTIGATION,
FINAL REPORT
M d
Contract NAS7-719
PREPARED BY
It. E. Barber
C. H. Buell
NO. OF PAGES 120 & xii
APPROVED BY
_riedmanManager
Advanced Technology Programs
REVISIONS DATE 3 April 1970
DATE REV. BY PAGES AFFECTED REMARKS
FORM R18-G REV. 5-69
https://ntrs.nasa.gov/search.jsp?R=19700018281 2018-06-01T02:55:25+00:00Z

V
v
FOREUORD
This document, the final report of the Tridyne Attitude
Control Thruster Investigation Program, is submitted to
the Jet Propulsion Laboratory, Pasadena, California, in
compliance with Article II, Paragraph D, of NASA Contract
NAS 7-719.
fir. P. Moynihan of the Jet Propulsion Laboratory was the
Program Technical Manager, and Mr. J. Friedman, Rocketdyne
Advanced Technology, was Program Manager for the subject
contract.
ABSTRACT
The results of an experimental program to evaluate and
demonstrate the feasibility of a Tridyne attitude control
thruster are reported herein. Substantiating data are
presented for catalyst selection and optimization.
Criteria for the design of a Tridyne attitude control
module with preconditioning heaters are described. The
design, fabrication, and testing of a flightweight thruster
is detailed.
R-8144 iii/iv


ACKNOWLEDGI_IENTS
Important contributions to the conduct of the program and the preparationof this technical report were madeby the following personnel:
G. L. Falkenstein
J. P. Federer
G. C. French
R. N. Gurnitz
B. T. McDunn
v
R-8144 v/vi


CONTENTS
Foreword ..........
Abstract ..........
Acknowledgements........
Summary ...........Introduction ..........
Thruster Design .........
Design Requirements .......Phase I: Test Hardware .....
Phase If: Module Concept .....Phase IV: Test Hardware .....
Thrust ChamberAssembly and Installation
Experimental Evaluations .....
Experimental Equipment and Procedures .
Task I: Experimental Results ....
Task IV: Flightweight Thruster Tests .
Analysis ...........
Performance Analysis .......
Thermal Analysis ........Test Conditions ........
Tridyne Module Performance .....
Projected Performance ......Conclusions and Recommendations....
References ...........
Appendi× A
Test Summaries for Tasks I and IV . . .
......... iii
........ iii
i u • • • • • • • • V
• • • • • • • • • 3
i • • • • • • • • 5
• • • • • • • i • 5
• • • • • • • • • 6
• . . . . . . , , 6
......... I0
......... 13
......... 23
......... 23
......... 31
......... 47
......... 71
......... 71
......... 80
......... 85
......... 90
........ 97
......... 99
......... I01
. A-I
R-8144 vii/viii

me
2.
3.
4.
5.
6.
7.
8.
9.
I0.
II.
12.
13.
14.
15.
16o
17.
18.
19.
20.
21.
22.
23.
24.
25.
26.
27.
28.
ILLUSTRATIONS
Tridyne Microthruster .........
Catalyst Evaluation Chamber Assembly ....
Lightweight Development Thruster ......
Flight-Type, Three-Engine Module Assembly . . .
_rust Chamber Assembly .........
Flightweight Test Configuration ......
Flow Calibrated Venturi Assembly ...... • • • •
347 Stainless-Steel Tube Sample Prior to Welding
347 Stainless-Steel Tube Sample Following Laser-Beam Welding
Assembled Flightweight Thrusters ..........
Laser Beam-Welded Enclosures ...........
Thermocouple Installation in Tridyne Thruster .....
Washer-Shaped Braze Materials ...........
Thrust Chamber Assembly Fixture ..........
Vacuum Sys tern ................
Kulite Model XTL-190-50 Pressure Transducer ......
Walter Kidde Valve and Test Fittings ........
Tridyne Thruster, 25-Millisecond Pulse ........
0.150-Inch Stainless-Steel Thrust Chamber .......
Thermal Response of 0.1-Inch-ID Lavalite Chamber
(30-Mesh MFSA Catalyst) ..............
Thermal Response of 0.150- and 0.224-Inch-ID Stainless-
Steel Chambers (MFSA Catalyst) ...........
Thermal Response of 0. l-Inch-ID Lavalite Chamber
(30-Mesh Shell-405 Catalyst) ............
Thermal Response of 0.150- and 0.224-Inch-ID Stainless-
Steel Chambers (Shell-405 Catalyst) ..........
Chamber Pressure and Temperature Versus Time (Tests 71 and 75) .
Chamber Pressure and Temperature Versus Time (Tests 73 and 76) .
Chamber Pressure and Temperature Versus Time (Tests 77 and 78) .
Chamber Pressure and Temperature Versus Time (Tests 79 and 80) .
Chamber Surface Temperature Versus Ileater Power ......
• 1
• 7
• 7
• 9
• II
• 12
. 13
o 15
• 15
• 16
• 17
• 19
. 20
. 21
• 24
o 25
• 26
• 27
o 29
33
34
35
36
39
4O
41
42
43
R-8144 ix

29. Typical Temperature ResponseCharacteristics for aCatalytic Reactor ................ 46
30. Thermal Time Constant Parameter Versus Catalyst Mass .... 46
31. Flightweight Thruster Test Schematic ......... 48
32. Temperature and Pressure Response (AT = 35 F/40 ms) .... 52
33. Temperature and Pressure Response (AT = 37 F/30 ms) .... 52
34. Temperature and Pressure Response (AT = 56 F/20 ms)35. Thruster Temperature Decay Characteristics ....... 55
36. Temperature Time Transient for Run 59 ......... 5737. Thermal Time Constant Versus ChamberPressure Parameter
Flightweight Thrusters .............. 59
38. Temperature and Pressure Response .......... 61
39. ThermocoupleTemperature Versus Time ......... 62
40. Venturi Pressure Response(MinimumVenturi Mount Volume) . . o 65
41. Venturi Pressure Response (Excess Volume in Venturi) .... 65
42. ChamberPressure Response(Excess Volume in Venturi) .... 66
43. Tridyne ChamberWith Pressure Probe .......... 66
44. Tridyne Thruster 2S-Millisecond Pulse ......... 67
45. Pressure Response (MinimumVolumeVenturi) ....... 68
46. Pressure Responseat Venturi for 30-psia ChamberPressure . . 6847. Theoretical Specific Impulse vs Temperature ....... 72
48. _rust Coefficient Efficiency vs ChamberTemperature .... 73
49. Delivered Specific Impulse vs Temperature ........ 74
50. Viscosity of Tridyne Combustion Products vs Temperature . . . 7551. Predicted Values of Discharge Coefficient for Sonic Nozzles . . 77
52. ChamberMassFlowrate vs Exit Temperature for Tridyne . . . 78
53. Mass Flow Function vs Temperature .......... 7954. Sonic Static to Total Pressure Ratio vs Ter0perature .... 79
55. _rust Variation With Temperature .......... 81
56. Throat Reynolds Numbervs Throat Diameter (Molecular Weight
of Reacted Tridyne = 27.0) ............. 82
57. Throat Reynolds Numbersvs Throat Diameter (Molecular Weight
of Tridyne Gas = 25o61) ............ 83
V
x R-8144

58. Throat Reynolds NumberVariation With Temperature ..... 84
59. Throat Discharge Coefficient vs GasTemperature .... 84
60° Oscilloscope Recording of ThermocoupleTransient . . . 86
61. Rapid Thermal Transient (AT = 56 F/20 ms) ...... 86
62. Tridyne EnthalDy Versus Temperature ........ 88
63. Tridyne Thermal Model .............. 91
64. Tridyne Hodule Thrust ChamberForward Mount Heat Loss .... 9265. Tridyne Module Thrust ChamberRear Mount Heat Loss ..... 93
66. Tridyne Thruster Module Propellant Line ]{eat Loss vs
Line Length .................. 94
67. Tridyne Hodule Thrust ChamberRadiation }{eat Loss .... 9568. Tridyne Module Thrust Chamber Total }{eat Loss Conduction
and Radiation ................. 96
69. Projected Thermal Response for Advanced Tridyne Thruster . . . 97
k._ TABLES
1. Effect of Temperature Change on AT/At ......... 53
2. Summary of Task IV Thermal Response Data ........ 58
3. Volume Percent of Tridyne ............. 69
R-8144 x i/xii

V
/_7
S_MA_
Spacecraft and satellites for extended-duration space flights require
attitude control systems that are simple, highly reliable, and capable
of intermittent operation over long time periods. These features, com-
monly identified with cold gas systems, can be achieved in an improved
specific impulse system through the use of a catalytically reactive gas
(Tridyne) in place of an inert agent. The only system hardware change
required is that of using reaction thrusters incorporating catalysts to
replace the gas jets of a cold gas system.
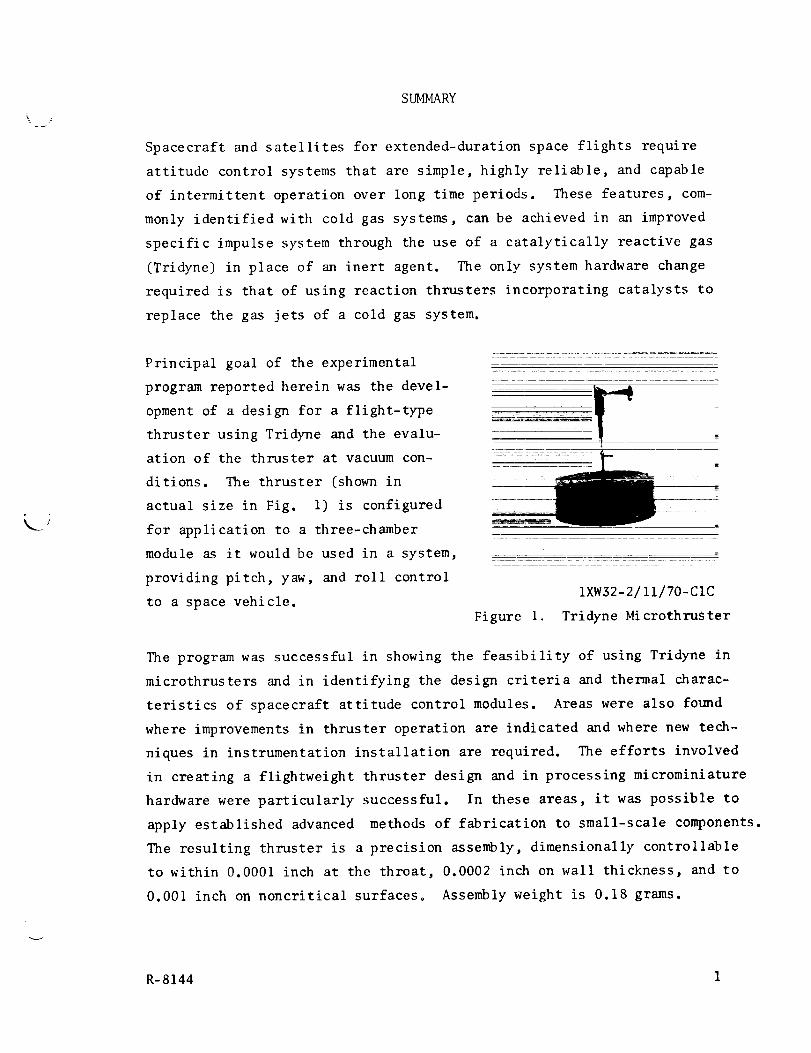
Principal goal of the experimental
program reported herein was the devel-
opment of a design for a flight-type
thruster using Tridyne and the evalu-
ation of the thruster at vacuum con-
ditions. The thruster (shown in
actual size in Fig. i) is configured
for application to a three-chamber
module as it would be used in a system,
providing pitch, yaw, and roll control
to a space vehicle.
qg
IXW32-2/II/70-CIC
Figure I. Tridyne MicrothruSter
The program was successful in showing the feasibility of using Tridyne in
microthrusters and in identifying the design criteria and thermal charac-
teristics of spacecraft attitude control modules. Areas were also found
where improvements in thruster operation are indicated and where new tech-
niques in instrumentation installation are required. The efforts involved
in creating a flightweight thruster design and in processing microminiature
hardware were particularly successful. In these areas, it was possible to
apply established advanced methods of fabrication to small-scale components.
The resulting thruster is a precision assembly, dimensionally controllable
to within 0.0001 inch at the throat, 0.0002 inch on wall thickness, and to
0.001 inch on noncritical surfaces. Assembly weight is 0.18 grams.
R-8144 1

The thruster development sequence was initiated by selecting and optimizing
the catalyst to be used in the chamber. These tests resulted in the selec-
tion of Engelhard Industries' 30-mesh MFSA catalyst in preference to Shell-
405 catalyst from the Shell Development Company. Secondly, thermal losses
from the catalyst reactor were determined and heater requirements to main-
tain a minimum thruster temperature were analytically established. In the
three-chamber module in a space environment, the heat losses were computed
to be 1.6 watts at a chamber temperature of I000 F.
The flightweight thruster design (Fig. l) was then established to be com-
patible with a three-chamber modular installation. The final effort con-
sisted of fabricating and testing the flightweight thruster. The constant-
pressure engine mass flowrate at maximum temperature was determined to be
about one-half that of the cold-flow value. Thrust produced by the thruster,
however, varies only slightly (less than 5 percent) over the operational tem-
perature range. Pressure and temperature transients were also documented to
show pulse-mode operational characteristics.
Operation and performance of the thruster may be improved by using a smaller-
mesh catalyst and by a general reduction in the effective thermal mass. If
required, higher combustion temperatures can be provided by increasing the
Tridyne reactant concentration slightly° Additional effort with Tridyne
chambers should include the construction of a complete three-chamber module
for evaluation of operation over a real-time long-duration space mission
duty cycle. In this operation, integration of the module with a set of
valves to provide proper mission simulation would be required. The data
provided on possible valve leakage effects would also be of interest.
v
W
2 R-8144

_J
INTRODUCTION
Spacecraft, such as earth orbital satellites and interplanetary probes,
are normally volume-and weight-limited, and require relatively efficient
attitude control systems. Frequently, it is also possible to increase
the impulsive energy of such systems by use of electrical heaters. Prior
exploratory work at Rocketdyne with catalytically reacting gases (Tridyne)
shows them to be potentially very suitable for use in the spacecraft types
requiring high-performance propulsion systems at the microthrust level.
The investigation of Tridyne in flightweight thrusters at 0.01 pound thrust
is reported herein. The requirements for heaters were also evaluated at
various temperatures.
7
Experimental work at Rocketdyne with catalysts and various reactive gases
shows that a chemical reaction can be promoted over a wide range of tem-
peratures and pressures in a predictable and repeatable manner. In the
Tridyne concept small fractions of reactive gases are combined with an
inert diluent to form a nondetonable mixture that may be safely stored
at high pressure in a vessel. Energy release is accomplished by passing
the mixture through a catalyst which combines the reactants and creates
a hot gaseous mixture. Hixture temperature is controlled by varying the
reactant concentration. The basic gas composition, 1500 F design opera-
tional temperature, used in the Tridyne thruster tests consists of mole
fractions of 0.85 nitrogen, 0.I0 hydrogen, and 0.05 oxygen.
Data on Tridyne storability and the uses of various gas mixtures for pres-
surization were obtained on an advanced pressurization system technology
program under Air Force contract (Ref. I)° Numerous experiments with
catalysts as potential ignition devices are reported under a J-2 Engine
ignition development program (Ref. 2). The characteristics of catalysts
with cryogenic oxygen and hydrogen propellants in reaction control systems
are reported in Ref. 3 and 4. Tridyne was also recently evaluated as an
agent for clearing gases from tank guns (Ref. 5). The program consisted
of applying the accumulated Rocketdyne technologies with Tridyne to
R-8144 3

operation in the microthrust regime. Five tasks were conducted in the
Tridyne evaluation: Task I consisted of catalyst selection, Task II was
assigned to thermal analysis and heater design, Task III included the
design and fabrication of flightweight thrusters that were tested inTask IV, and Task V consisted of documenting and reporting the results.
The information of the report is oriented in the sequence of thruster
design requirements, hardware design details, experimental evaluations,and test results. Test summaries are included in the Appendix.
W
4 R-8144

"u
DESIGN REQUIREMENTS
THRUSTER DESIGN
The design effort of the program consisted of providing the test configu-
rations for the experimental evaluations and the flight-type concepts for
detailed studies. The initial task involved the test hardware for the
evaluation and selection of the catalyst and for the determination of the
amount of catalyst for a complete Tridyne reaction. A flightweight module
concept also was improvised to illustrate the use of Tridyne thrusters for
pitch, yaw, and roll control of a spacecraft° The concept included pro-
visions for temperature maintenance above a minimum level by the use of
heaters. A flightweight thruster design was then created based on the
module geometry. This design was fabricated and used for the flightweight
thruster tests of the program.
Requirements for the flightweight design were established by the performance
specification prepared for the program by the Jet Propulsion Laboratory.
The principal parameters Iisted below are compared to the performance
attained during the program.
P ar ame te r
Vacuum Thrust, pounds (calculated)
Expansion Area Ratio
Chamber Pressure Range, psia
Impulse Bit, ib-sec x 104
Valve Excitation Time, milliseconds
Thrust Response Time, milliseconds
From Signal to 2-Percent Pc
From Signal to 90-Percent Pc
Nominal Pulse Width
Thrust Decay Times, milliseconds
Off Signal to 10-Percent Pc
Specified Value
0.01 +0.002
I00 :1
15 to 30
2.4 +_0.4
2O
6
8
20
Program Value
0.01 ±0.0004
I00:I
30 selected
2.0 +_0.2
2O
6
8
20
18
R-8144 5

Provisions were madefor heating the catalyst during tests. The thruster
designs were established to be consistent with spacecraft constructionpract ices.
PHASE I : TEST tIARDWARE
The test configuration shown in Fig. 2 was used in the first test series
for the selection of a catalyst and in the sizing of the catalyst bed. It
consists of a machined, stainless-steel thrust chamber configured for assem-
bly to a standard, flared-tube fitting and includes provisions for varying
the catalyst bed length. The large mass of material at the injector end
prohibited a precise evaluation of the catalyst, but the ease of disassembly
and the flexibility in changing or modifying the catalyst bed geometry made
this design very convenient for test changes in the early catalyst evaluation.
To verify and further evaluate the catalyst and its bed geometry, a more
nearly optimum chamber configuration was devised by eliminating the large
injector-end fitting. A selected length and diameter of chamber was fitted
to a small, low mass injector (Fig. 3). This assembly was readily fabricated
except for the installation of the small thermocouple. The thermocouple
is very sensitive and can be easily damaged. This is possible not only dur-
ing the brazing operation but also in subsequent handling of the unit. The
chamber was tested with an outer wall surface thermocouple to record tem-
peratures since the internal thermocouple was found to be inoperative.
PIIASE II: MODULE CONCEPT
The second principal design task consisted of the formulation of a three-
chamber module concept for providing pitch, )raw, and roll control of a
spacecraft. _is task was a progressive effort and consisted of several
V
6 R-8144

Gas
Inlet
\/
Ca ta lys t --_ /--The rmocoup le
Figure 2. Catalyst Evaluation Chamber Assembly
Catalys_
Thermocouple
0.017
Diameter
_X__P ress u re
Port
Figure 3. Lightweight Development Thruster
_J
R-8144 7

preliminary design layouts to resolve the best geometric shape of the cham-
ber, nozzle, and temperature-conditioning heater. Periodically, as test
data were acquired on the thruster, the designs were modified to incorporate
indicated improvements. Informal design reviews also were held to ensure
design consistency with conventional flight hardware standards.
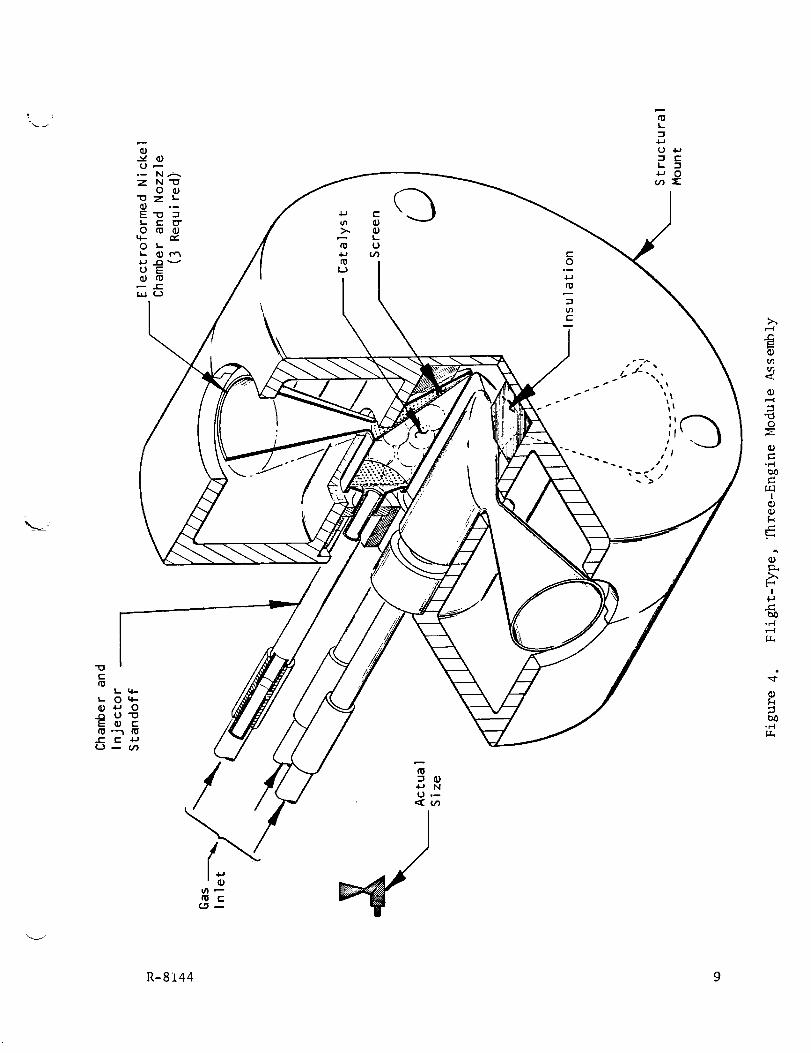
_le flightweight module resulting from the study is shown in Fig. 4. Two
opposing chambers are oriented for pitch and yaw control in a vertical
plane with a roll chambe_ at a right angle to the vertical chambers. The
thrusters are configured for ease of assembly into a thermally efficient,
three-chamber cluster and heater module. The concept provided a basis for
a realistic flightweight thruster configuration and, additionally, was a
useful tool in determining the probable thruster heat loss rates as they
would occur on a spacecraft installation.
The principal module materials used in the thermal analysis were selected
to control the heat flux from the chambers into the valves to a tolerable
level and to minimize radiation losses. The inlet lines are stainless steel
of reference size: 0.030-inch ID, 0.002-inch wall thickness, and 1.25-inch
length. The module shell is titanium with the inner surfaces gold plated
to reflect radiant heat from the thrusters° The thruster supports are
shown as stabilized zirconia, although minimum surface contact supports
of titanium are thermally comparable and were used in the thermal analysis.
The thrusters are made from electroformed nickel and are gold plated to
reduce radiation losses.
The module is large enough to enclose three 0.5-watt heaters, which would
permit maintaining the module above 600 F with 60 percent of the heat energy
being contained within the module. The thermal loss characteristics are
shown in the Thermal Analysis section.
W
8 R-8144
_
c-O
c-
i
,f
:.%,.
0
.r-,l
U.II
_)
!
.e4
R-8144 9

PHASEIV: TESTHARDWARE
A flightweight thruster design was established based on the thruster con-
figuration in the modular concept shown in Fig. 4. Considerable effort
was devoted to the refinemen't of the _est flighweight thrust design to
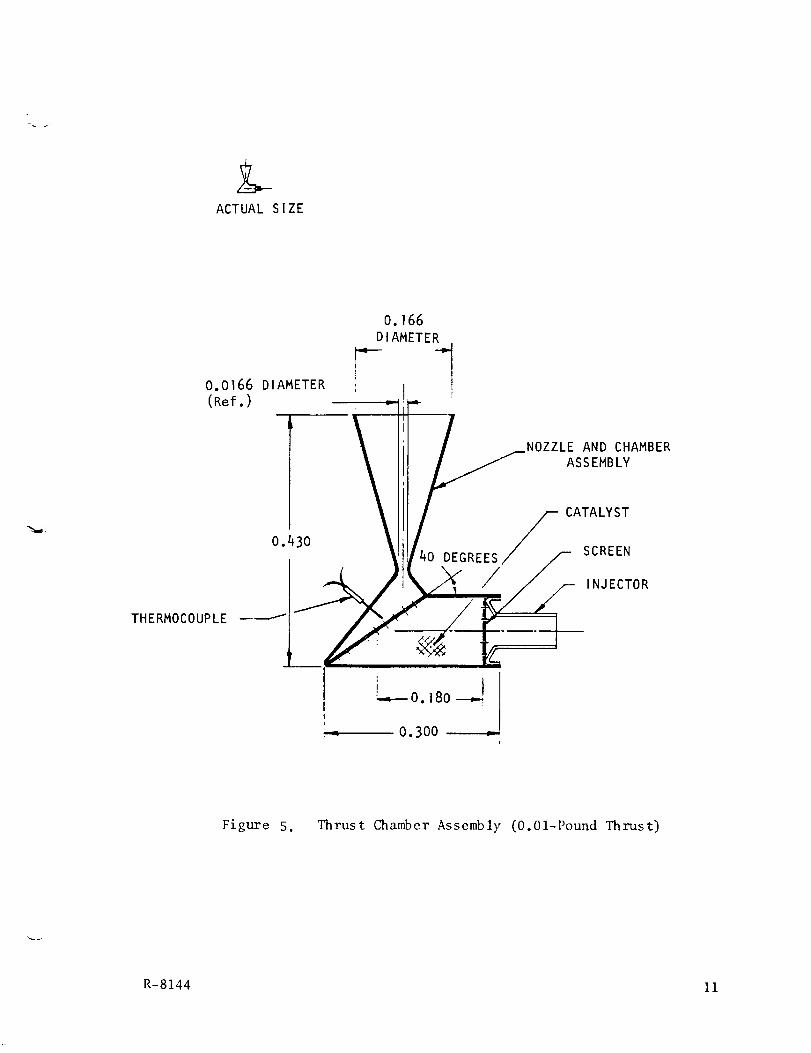
achieve reproducibility. As shown in Fig. 5, the chamberbody is a cylindri-
cal section with an injector and screen at the inlet to provide a uniformdistribution of Tridyne through the catalyst bed. The catalyst bed also
has a screen at the downstreamface which is positioned 40 degrees fromthe chamber axis. The screen is elliptical in shape and configured tomatch the chamberand nozzle section truncations. The exit nozzle aa_d
throat section is formed by joining two cones (nozzle section with 16-
degree half-angle and convergent section with 33-degree half-angle) by awall radius three times the throat radius. The convergent section is cut
at a complementary angle (50 degrees from the nozzle centerline) to form
an elliptical face matching the chambersection. By use of this design
approach, the chamberis easily constructed by electrodepositing nickel
over two simple mandrels with a screen interface. The single critical
dimension is the throat diameter, which is controlled to a tolerance of-+0.0001inch.
V
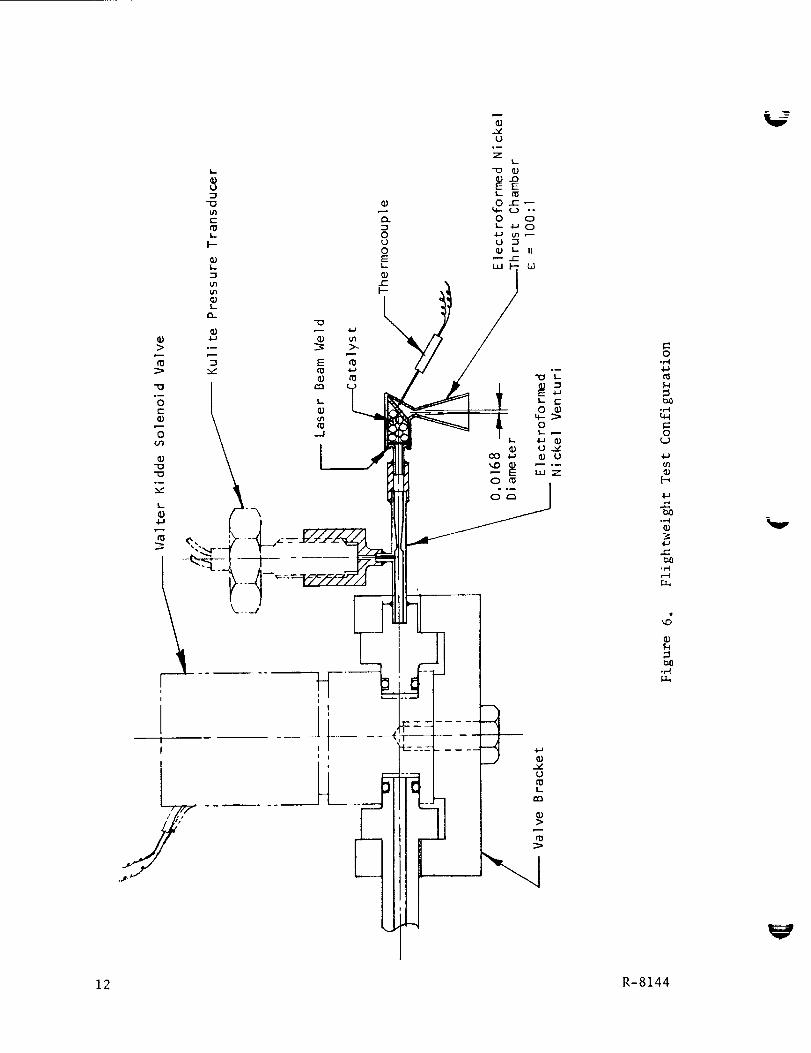
A test configuration (Fig. 6) was assembled for evaluation of the flight-weight thrusters. It consists of an electroformed chamberand nozzle assem-
bly, an electroformed injector that is laser beamwelded to the chamber,
nickel screens at the chamber inlet and at the convergent section of the
nozzle, a calibrated venturi flow-measurement device, a Kulite transducer
for measuring pulse performance, a Walter Kidde Corporation solenoid valve
assembly, and a thermocouple in the chamberassembly. The greatest tech-
nical problem was encountered in installing the pressure transducer and
thermocouple. The best technique for installing thermocouples was found
to be that of electroforming the thermocouple in place during the chamberfabrication.
I0 R-8144
ACTUAL SIZE
0.0166 DIAMETER
(Ref.)
THERMOCOUPLE
O. 166
DIAMETER
1
1
NOZZLE AND CHAMBERASSEMBLY
S CATALYST
0.430 40 DEGREES/ _" SCREEN
)_ 0. 300 fIi
Figure 5. Thrust Chamber Assembly (O.Ol-Pound Thrust)
R-8144 Ii
O
,I.a
°r..4
Orj
,I-J
¢1E'-'
©
4.J
la0,el
,dII1
°_I
11
4-1
¢)
Ur_L
¢D
12 R-8144

The sonic venturi (Fig. 7) used for flow measurements during pulse opera-
tion is a dimensionally precise device fabricated by electroforming nickel
over an aluminum mandrel followed by chemically leaching the aluminum.
The wall/throat radius ratio is 3:1 and the duct flow area at the trans-
ducer probe has an A/A* ratio of 8.2:1 with a static to total pressure
ratio of 0.9965:1. The throat dimension was fabricated to a tolerance
of 0.0001 inch.
Gas
Inlet
Figure 7.
IL__Ku I i te Transducer
..... i
Flow Calibrated Venturi Assembly
THRUST CHAMBER ASSEMBLY AND INSTALLATION
Chamber Ass emb I_
In the various steps of assembling hardware and improvising test installa-
tions, it was frequently necessary to explore unconventional methods and
processes and, as is normally encountered, with varying degrees of success.
Some of the more fruitful of these merit comment.
v
A critical step in the thrust chamber assembly process is that of sealing
the chamber with the catalyst in place. The catalyst should not be heated
above the range of 400 F unless immersed in an inert gas to prevent cata-
lyst oxidation. The thruster also must be capable of an unlimited number
of thermal cycles from ambient temperatures to 1400 F. Three methods of
chamber enclosure were investigated.
R-8144 13

Induction brazing was found to be unsatisfactory from the viewpoint of
quality control and possible catalyst contamination. Ilowever, inductionbrazing was shown to be a logical method for the assembly of componentsinto a test installation. Electron-beam welding was explored and has the
potential of precise control and repeatability. It is performed in an
inert atmospherewhich would prevent catalyst damage. However, the machines
readily available were too large for use on the thrusters. A centrally
positioned, 0.115-inch-diameter chamberrotating at maximumspindle speed
has a peripheral speed substantially below the minimumpermitted. Use ofbeamdeflection to create a circular electron discharge path also was tried
but was found to cause excessive heating. This work was performed on a
Ilamilton-Standard welder rated at 6 kilowatts power and 150,000 volts. A
small electron-beam welder of proper size for the thrusters would probably
be the most suitable approach for welding a large numberof chambers.
Consultation with welding specialists resulted in the evaluation of laser
beamwelding. A 347 stainless-steel weld sample is shown in Fig. 8 . The
sample consists of a sleeve inserted within a cylinder. Wall thicknessesare 0.004 inch and the contact surface diameter is 0.100 inch. The geometry
closely approximates the chamberweldment° The sample following welding
is shownin Fig° 9, illustrating the effectiveness of the laser weld method.
Nickel 200 samples also were satisfactorily welded.
Flightweight thrusters assembledby laser beamwelds at the injector face
are shownin Fig. i0. The central chamberhas a pressure probe installation
to documentpressure transient characteristics. The chamberdiscoloration
is from brazing flux used to attach the inlet line for testing.
The final two chambersto be laser beamwelded are presented in Fig. ll.
As shown, the weld beads are uniform and the discharge point overlap is
reasonably symmetrical° It was noted that the general weld quality pro-
gressively improved as the operator gained experience in positioning the
discharge point° The final weld time was on the order of 2.5 minutes.
V
14 R-8144
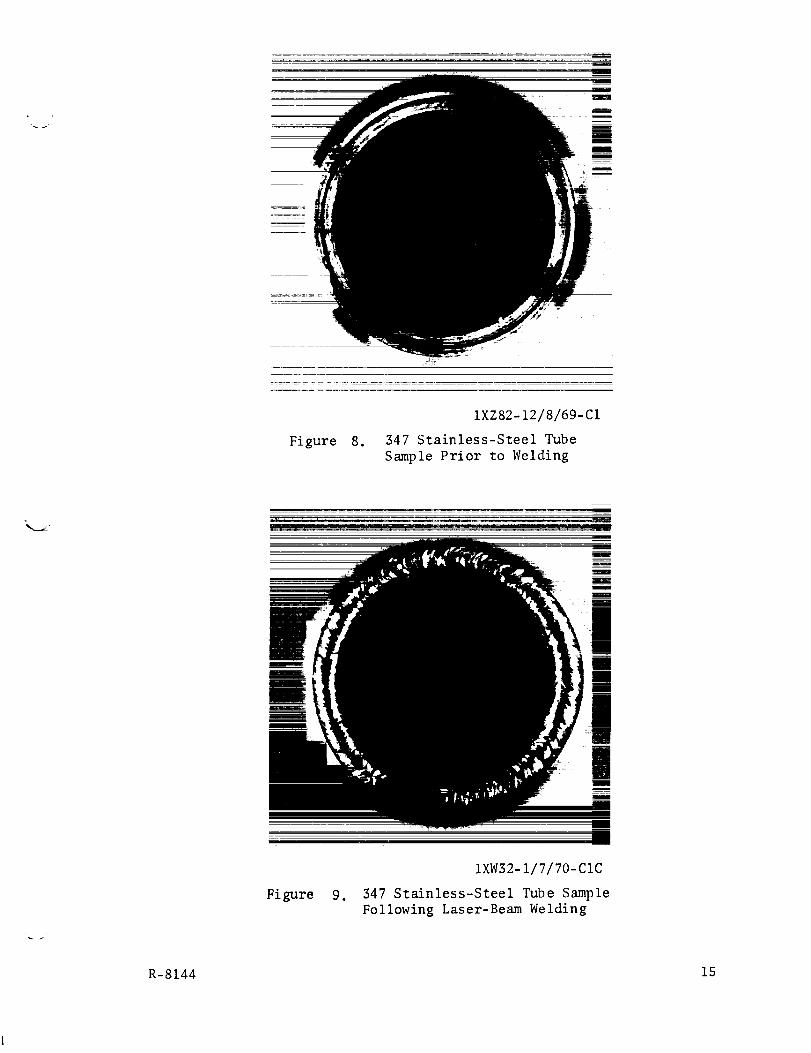
Figure
IXZ82-12/8/69-CI
8. 347 Stainless-Steel TubeSamplePrior to Welding
wm
|
m
Figure 9.
IXW32- I/7/70-CIC
347 Stainless-Steel Tube Sample
Following Laser-Beam Welding
R-8144 15

m
H
V
16 R-8144

v
=
O
U
!
i,-.-,,I
0r,,I
R-8144 17
The thermal cycling accomplished to date on the welded chambers has had
no evident effect on the weld integrity. The maximum recorded chamber
operational temperature was 1331 F. It was also necessary to heat the
weld area to a temperature of about 1700 F when assembling the test cham-
bers to the inlet line. IIere, again, no adverse effect from the heating
is shown.
Laser weld technology is an interesting development and is relatively new.
There is still a great deal of information yet to be obtained on optimum
weld methods. Clealiness is obviously important, and normal degreasing of
parts should be performed. No open cracks at the weld face are permitted
as the beam will penetrate the crack, causing erosion and a larger aperture.
The weld consists of a series of overlapping spot discharges placed pro-
gressively along the weld seam, and causes virtually no increase in metal
temperature since the highly focused, small impact energy is readily dissi-
pated into the adjacent metal. An argon jet shield is used to blanket the
weld area to avoid local surface oxidation.
Component Assembly
The test instrumentation required unusual design features to avoid exces-
sively large weld bosses and fittings. Experiments with test devices showed
that induction brazing can be successfully used to place miniaturized thermo-
couples and pressure taps on the chamber. A thermocouple installation is
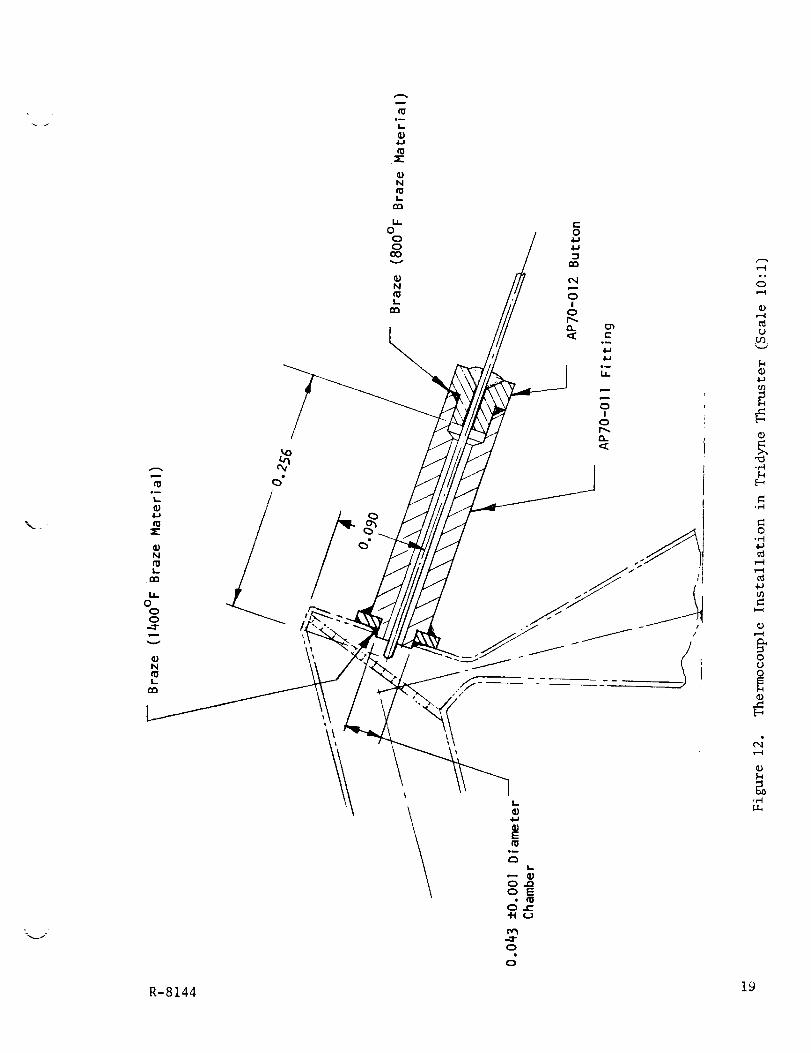
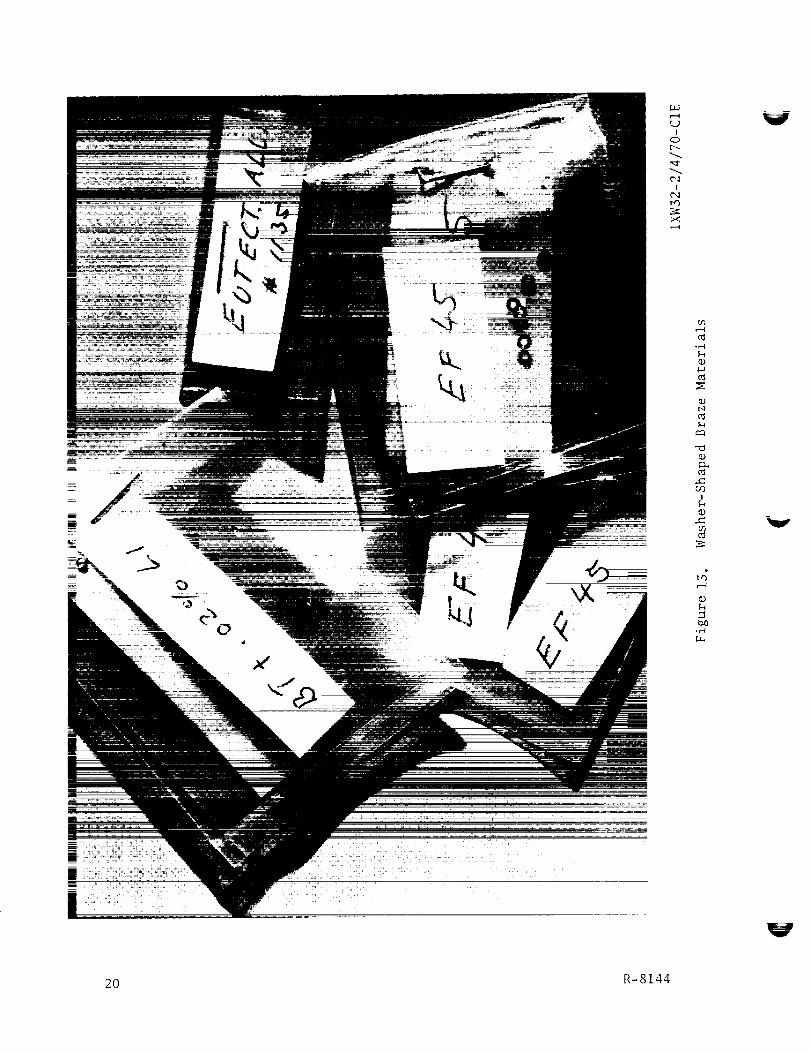
shown in Fig. 12. The braze materials were formed into washers (Fig. 13 )
and held in place during the induction heating. The Task IV test chamber
with a pressure probe has the same fitting as in Fig. 12 without the thermo-
couple and button.
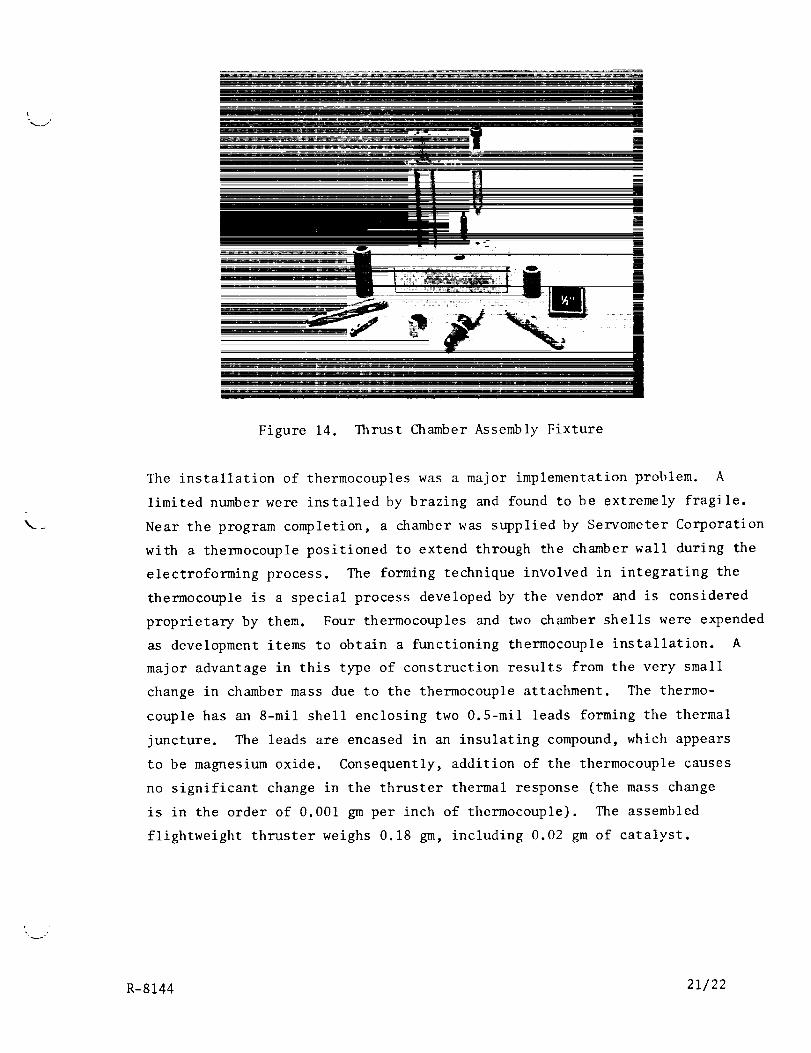
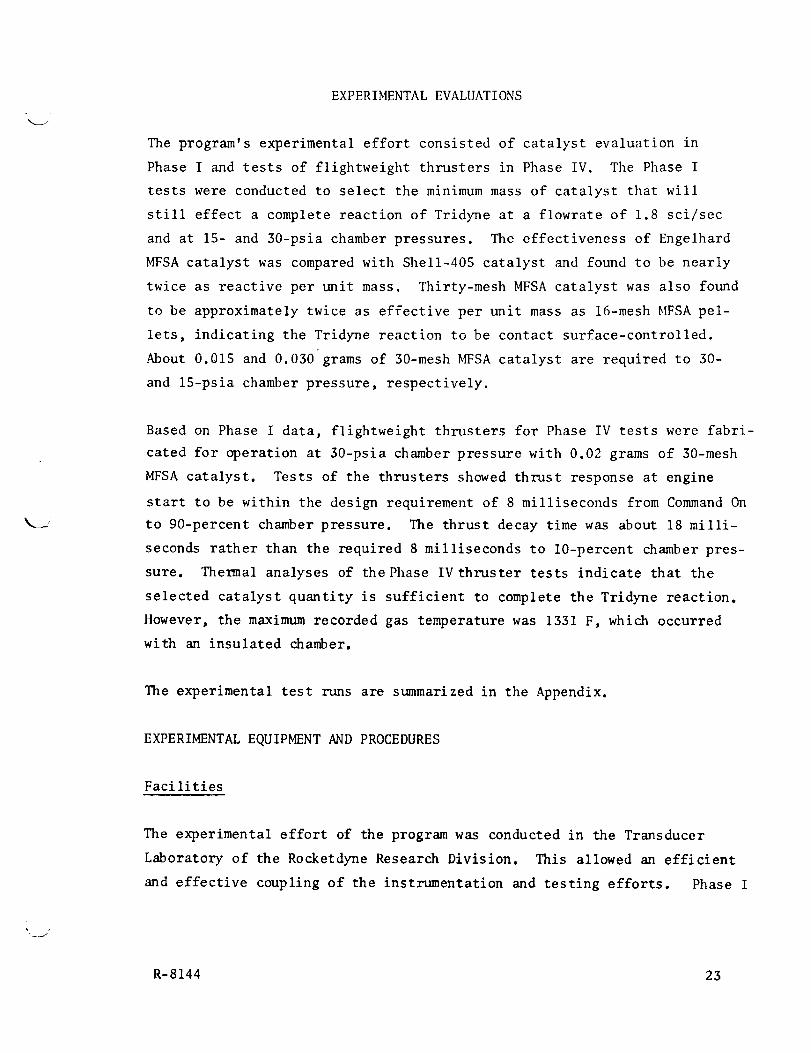
Proper alignment and positioning of the chamber were achieved by use of the
fixtures shown in Fig. 14. Pressure probe and thermocouple installations
were made with the same fittings.
18 R-8144
_J
%
!
\I..¢;
tU_m
I-
O-Q
0 E
o t--H c.j
-.I-0
0
,-4
cd
U
0.rH
tQ
0U
©
R-8144 19
I
0
f
oO
©
©
V
V
20 R-8144
L
Figure 14. Thrust Chamber Assembly Fixture
The installation of thermocouples was a major implementation problem. A
limited number were installed by brazing and found to be extremely fragile.
Near the program completion, a chamber was supplied by Servometer Corporation
with a thermocouple positioned to extend through the chamber wall during the
electroforming process. The forming technique involved in integrating the
thermocouple is a special process developed by the vendor and is considered
proprietary by them. Four thermocouples and two chamber shells were expended
as development items to obtain a functioning thermocouple installation. A
major advantage in this type of construction results from the very small
change in chamber mass due to the thermocouple attachment. The thermo-
couple has an 8-mil shell enclosing two 0.5-mil leads forming the thermal
juncture. The leads are encased in an insulating compound, which appears
to be magnesium oxide. Consequently, addition of the thermocouple causes
no significant change in the thruster thermal response (the mass change
is in the order of 0.001 gm per inch of thermocouple). The assembled
flightweight thruster weighs 0.18 gm, including 0.02 gm of catalyst.
v
R-8144 21/22

EXPERIMENTALEVALUATIONS
The program's experimental effort consisted of catalyst evaluation in
Phase I and tests of flightweight thrusters in Phase IV. The Phase Itests were conducted to select the minimummassof catalyst that will
still effect a complete reaction of Tridyne at a flowrate of 1.8 sci/secand at 15- and 30-psia chamberpressures. The effectiveness of Engelhard
MFSAcatalyst was comparedwith Shell-405 catalyst and found to be nearly
twice as reactive per unit mass. Thirty-mesh MFSAcatalyst was also found
to be approximately twice as effective per unit mass as 16-meshMFSApel-
lets, indicating the Tridyne reaction to be contact surface-controlled.
About 0.015 and 0.030 grams of 30-meshMFSAcatalyst are required to 30-
and 15-psia chamberpressure, respectively.
Based on Phase I data, flightweight thrusters for Phase IV tests were fabri-cated for operation at 30-psia chamber pressure with 0.02 grams of 30-mesh
MFSA catalyst. Tests of the thrusters showed thrust response at engine
start to be within the design requirement of 8 milliseconds from Command On
to 90-percent chamber pressure. The thrust decay time was about 18 milli-
seconds rather than the required 8 milliseconds to 10-percent chamber pres-
sure. Thermal analyses of the Phase IV thruster tests indicate that the
selected catalyst quantity is sufficient to complete the Tridyne reaction.
However, the maximum recorded gas temperature was 1331 F, which occurred
with an insulated chamber.
The experimental test runs are summarized in the Appendix.
EXPERIMENTAL EQUIPMENT AND PROCEDURES
Facilities
The experimental effort of the program was conducted in the Transducer
Laboratory of the Rocketdyne Research Division, This allowed an efficient
and effective coupling of the instrumentation and testing efforts. Phase I
R-8144 23

and Phase IV thruster testing was
performed in a high-altitude sim-
ulator stand (Fig.iS) which con-
sists of a bell jar connected to
a 6-inch CVC oil-type diffusion
pump and a 1397 Welch forepu_.
With no thruster flow, the fore-
pump is capable of reducing the
pressure to 5 x 10 .3 mm Hg, mak-
ing it possible to demonstrate
vacuum starts. It is estimated
that during steady-state opera-
tion of the thruster with a gas
flowrate of 1.75 sci/sec, the
forepump is capable of maintain-
ing a system pressure below 1 psia.
Figure 1S.
5AH23-I/23/68-SI
Vacuum System
Test operations and data acqui-
sition were conducted through a central control and recording center. All
measurements were recorded on a CEC direct-reading oscillograph with six
input channels. A CRT oscilloscope with two-channel input and storage
capabilities was used to display the response characteristics during many
of the tests.
V
Test Instrumentation
Commercially available microminiature regime instrumentation was used in
the experimental evaluations. The critical parameters measured during
the 20-millisecond pulses were pressure and temperature. A Kulite Model
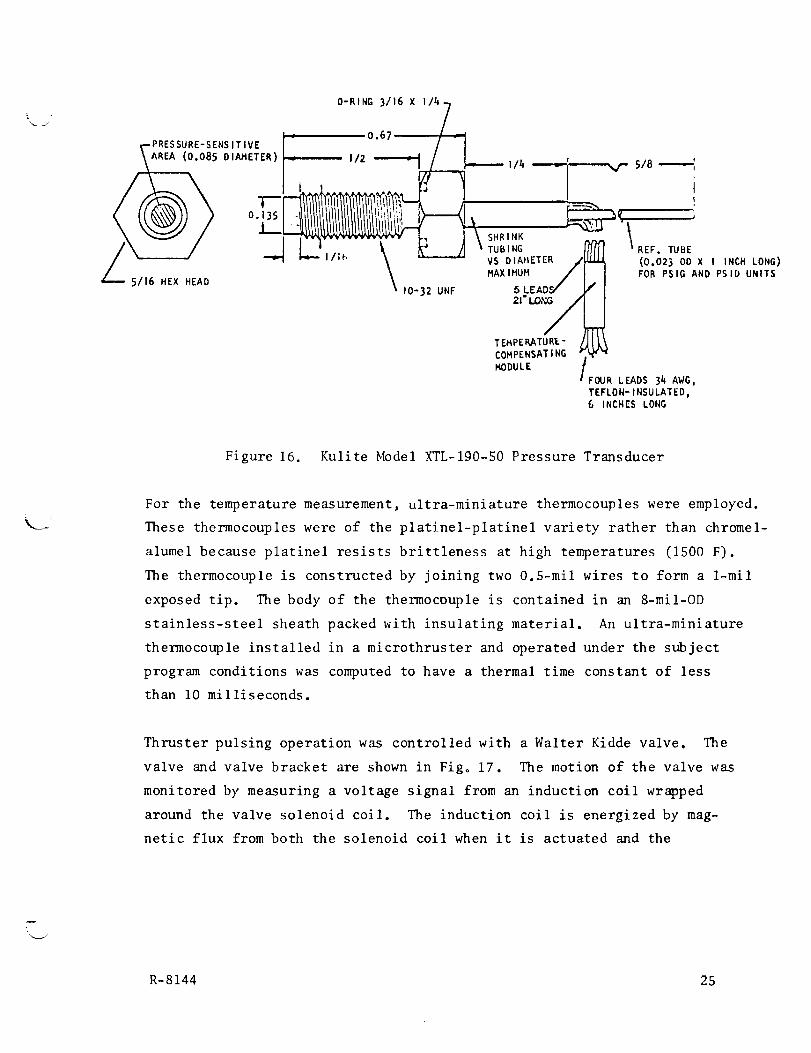
XTL-190-50 transducer (Fig. 16) was used for pressure measurements. The
transducer, featuring a 0.070-inch-diameter diaphragm sensor enclosed
within a 0.13S-inch-OD threaded casing, is rated for S0 psia and has a
natural frequency of i00 kllz or a time constant less than 0.I millisecond.
24 R-8144
0-RING 3/16 X I/47/
0.67
(0.08,O,A,ETER>I. ',2 -;.: ,/8
/\ / I I-'_ _, i" A \ To_,,,,G N _,,E_TU_E/ ', ,' ---..{ )-..- ,1,(, \ '_"--"' vs O,A)',ETER/ _._ (0._23 OOX , ,NCHLONG>
/--- 5116 HEX HEAD \ HAXIMUH / | FORPSIG AND PSID UNITS\ )0°32 UNF 5 LEADS,`/'. / [
MODULEFOURLEADS34 AWG,TEFLON-INSULATED,G INCHESLONG
Figure 16. Kulite Model XTL-190-50 Pressure Transducer
For the temperature measurement, ultra-miniature thermocouples were employed.
These thermocouples were of the platinel-platinel variety rather than chromel-
alumel because platinel resists brittleness at high temperatures (1500 F).
The thermocouple is constructed by joining two 0.5-rail wires to form a l-rail
exposed tip. The body of the thermocouple is contained in an 8-mil-OD
stainless-steel sheath packed with insulating material. An ultra-miniature
thermocouple installed in a microthruster and operated under the subject
program conditions was computed to have a thermal time constant of less
than I0 milliseconds.
Thruster pulsing operation was controlled with a Walter Kidde valve. The
valve and valve bracket are shown in Figo 17. The motion of the valve was
monitored by measuring a voltage signal from an induction coil wrapped
around the valve solenoid coil. The induction coil is energized by mag-
netic flux from both the solenoid coil when it is actuated and the
R-8144 25

V
Figure 17.
......... IXZ22-6/2/69-CIA
Walter Kidde Valve and Test Fittings
armature motion due to its effect on the magnetic field. An oscilloscope
trace of the valve being opened and closed is shown in Fig. 18. The first
peak shows that when the solenoid is energized, the voltage across the
monitoring coil instantaneously rises to a maximum and then begins to
decay because the energizing current is no longer changing. The movement
of the armature changes the strength of the magnetic field and induces an
additional voltage across the monitored coil during motion as shown by the
second peak on the trace. The lag time required for the valve to open or
close from signal initiation is between 3 and 4 milliseconds.
V
A pressure-time trace for a 0.15-inch-OD chamber filled with MFSA catalyst
is also shown in Fig. 18. It should be noted that although the trace
is for a Phase I prototype chamber, only about 6 milliseconds are required
for the pressure to reach a steady value after the valve opens. This is
sufficient to meet specification requirements.
Steady-state flow measurements, which are thought to be within ±4 percent
of actual flowrate, were obtained by the use of a rotameter. A sonic
venturi was used as a flowmeter in the pulse-mode operation of Phase IV.V
26 R-8144

Q)
q)
q)
G)
[0tOQ)
¢)
E_
"0
0
u_
,--4
I
[...,
o8
o
F-_
_J
R-8144 27
Calibration Procedures
Pressure transducers were calibrated by recording the output on an
oscillograph. The procedure consisted of first evacuating the vacuum
system to obtain zero pressure and then making a recording. The system
was next allowed to reach ambient pressure and another recording was made.
Barometric pressure was also tabulated. A 200-psig Heise gage was used
to calibrate the transducers from ambient to 35 psig.
The accuracy of the first thermocouples to be received was checked by
measuring the temperature output of the thermocouples when submerged in
boiling water. The readings obtained were found to be within ±i F of
the boiling point of water. Thermocouples from subsequent shipments were
merely checked for continuity.
Thrust Chambers
The principal test effort of Phase I consisted of comparing and evaluating
catalyst reactors suitable for use at pressures of 15 to 30 psia, with
flowrates in the range of 1.8 _ci/sec. Several chambers were constructed
and tested with various amounts of catalyst at the above conditions. The
first two chambers tested were 0.150 inch and 0.224 inch ID. The 0.150-
inch chamber is shown in Fig. 19.
Both chambers constructed of stainless steel had a common B-nut attachment
at the injector which created considerable heat loss. It was calculated
that approximately 15 percent of the heat is lost at the injector end of
the O.150-inch chamber during operation. When the heat losses from the
pressure and thermocouple ports are included, a maximum chamber temperature
of II00 F is obtained. Experimental results reveal this to be a realistic
value. The calculations neglect radiation and conduction heat losses from
the chamber to the insulation material used in some of the tests.
In an attempt to reduce the heat lo_s, a O.lO-inch-ID chamber was con-
structed from Lavalite, a non-metallic composite that has a thermalV
28 R-8144

m
m
_mB
iR
rJ
U_
v--I
4-__'_
I
U_
U')
r-4
,_,-Ia_4J
,.c
1--I
I
Lr)
D
f_
°r-I
R-8144 29

conductivity about 9.5 percent that of stainless steel. However, the
steady-state chamber temperature was approximately the same as in the
0o 150-inch chamber. This is attributable to the heavy walls of the
Lavalite chamber, which were about 12 times as thick as the walls of
the steel chambers. The thicker walls, which were necessary for struc-
tural integrity, produced a similar heat loss.
A modified 0.150-inch stainless=steel chamber with a flange replacing the
B-nut and union combination at the injector was also tested. In these
tests, a phenolic insulator was placed between the support flange and the
chamber flange. The experimental results show that the heat losses were
similar to those observed in the other chambers; however, the heat loss
in this chamber could probably have been reduced by increasing the insula-
tion thickness between the flanges. An improved chamber design incorpor-
ating a small-diameter inlet line was also fabricated and tested. The
test results were inconclusive since the chamber thermocouple was found
to be open after test installation. However, test temperatures were mea-
sured by a thermocouple placed on the chamber external wall surface. Elec-
trical heaters were also used with the chamber to provide data on catalyst
characteristics at high temperatures.
Test Procedure
After the thrust chamber, valve, and pressure transducers were installed-3
in the test facility, the vacuum cell was reduced to a pressure of 5 x lO
mm Hg to verify the zero readings of the pressure transducers. The line
between the valve and the Tridyne supply bottle was then pressurized to the
desired value. Steady-state readings were obtained by flowing Tridyne through
the thrust chamber for 30 seconds. Oscillograph readings were usually taken
for the first 5 seconds and the last 5 seconds of a test. Pulses of approxi-
mately 20-millisecond durations were usually made after a steady-state test
was completed. The system was operated at nominal line pressure of 16 and
32 psia.
30 R-8144

_J
TASK I: EXPERIMENTAL RESULTS
Shell-405 and _IFSA catalysts were tested in various sizes and geometri-
cal arrangements to determine optimum catalyst quantities. It was found
that tile Engelhard MFSA catalyst is about twice as active per unit mass
as tile Shell-405, and the 30-mesh MFSA catalyst is about twice as active
per unit mass as the 16-mesh MFSA. For a flowrate of 1.8 sci/sec, about
0.015 and 0.030 grams of 30-mesh MFSA catalyst are required at 30 and
15 psia, respectively.
In previous experimental programs using 1/16-inch HFSA catalyst with
Tridyne, it was found the minimum amount of catalyst required to completely
react the Tridyne could be computed by the following empirical relationship:
where
M : K i
c Pc
M : catalyst mass, gramsc
P = chamber pressure, psiac
= chamber flowrate, sci/sec
K = experimental constant for the catalyst formulation and size
This equation has been found applicable in the pressure range between I0
and i000 psia. The units within the equation may be varied by adjusting
the K value as required. Rearranged in the form K = _Ic (Pc/_) and plot-
ting the steadyastate chamber temperature as a function of M c (Pc/_), it
was found that as Mc is increased while the flow conditions (Pc/_) are
held constant, the temperature will increase to a point where all the gas
is reacting. Adding more catalyst beyond this point will produce no addi-
tional increase in temperature. In practice, the use of more catalyst than
necessary may cause a decrease in temperature because more catalyst will
be in contact with the chamber walls thus increasing heat transfer from
the gas to the chamber. Additional catalyst also increases the thermal
mass.
R-8144 31

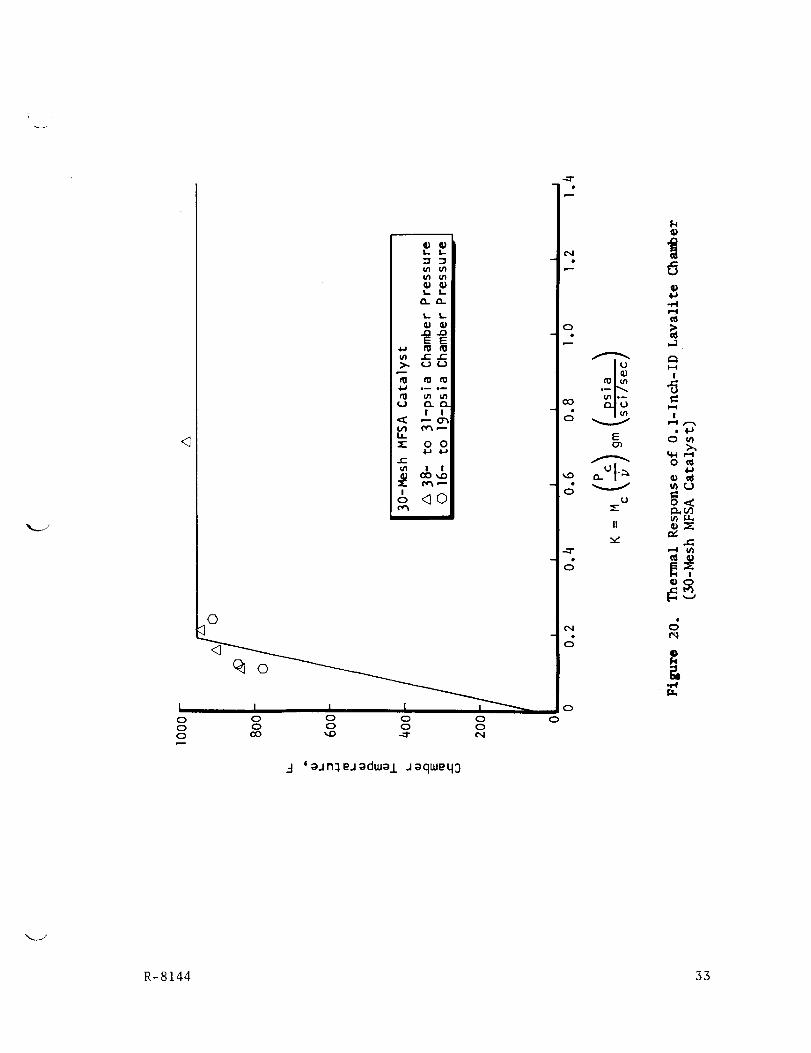
The experimental results for the Lavalite chamberwith 30-meshMFSAcatalyst
are shownin Fig. 20. The steady-state chambertemperature is plotted as
a function of Mc _Pc/_). A break in the temperature curve occurs at K =0.20; therefore, this point corresponds to the optimum amount of catalyst.It should be noted that the temperature is independent of pressure for a
given value of K.
V
Figure 21 illustrates the experimental results for the 0.224- and 0.150-inch stainless-steel chamberswith 16- and 30-meshHFSAcatalyst at 32 psia.
Although the quantity of data is limited in the low K value range, the opti-mumK values for the 30- and 16-meshcatalysts are about 0.2 and 0.6, respec-
tively. These results can be comparedwith trends predicted theoretically.If the Tridyne reaction is surface catalyzed, then the reactivity should
be proportional to the outer surface area. Becausethe surface area per unitmass in inversely proportional to the diameter, as theorized, the 30-mesh
catalyst should have approximately twice the surface area and twice thereactivity of the 16-meshcatalyst. Therefore, the optimum K values for
30- and 16-meshcatalysts indicate that the reaction is surface catalyzed.
Several factors were found that influenced the maximumtemperature reached
during a test ru_. Someof these were difficult to control because thesmall chamberdiameter caused varying catalyst packaging densities and, in
non-optimum geometries, flow striation. Heat loss rates were affected by
the spacers used to position the catalyst-retaining screens and also bythe degree of componentcompression attained at assembly. At low values
of the K parameter, the number of pellets was significant in determiningthe catalyst geometry and the variable mass increment; i.e., in sometests as few as three or four 16-meshpellets were used or six to eight
30-meshpellets. As a result of these considerations, the tests producedconsiderable data scatter. However, the Lavalite chamberdata appear
reasonably consistent and are used for the flightweight thruster design.
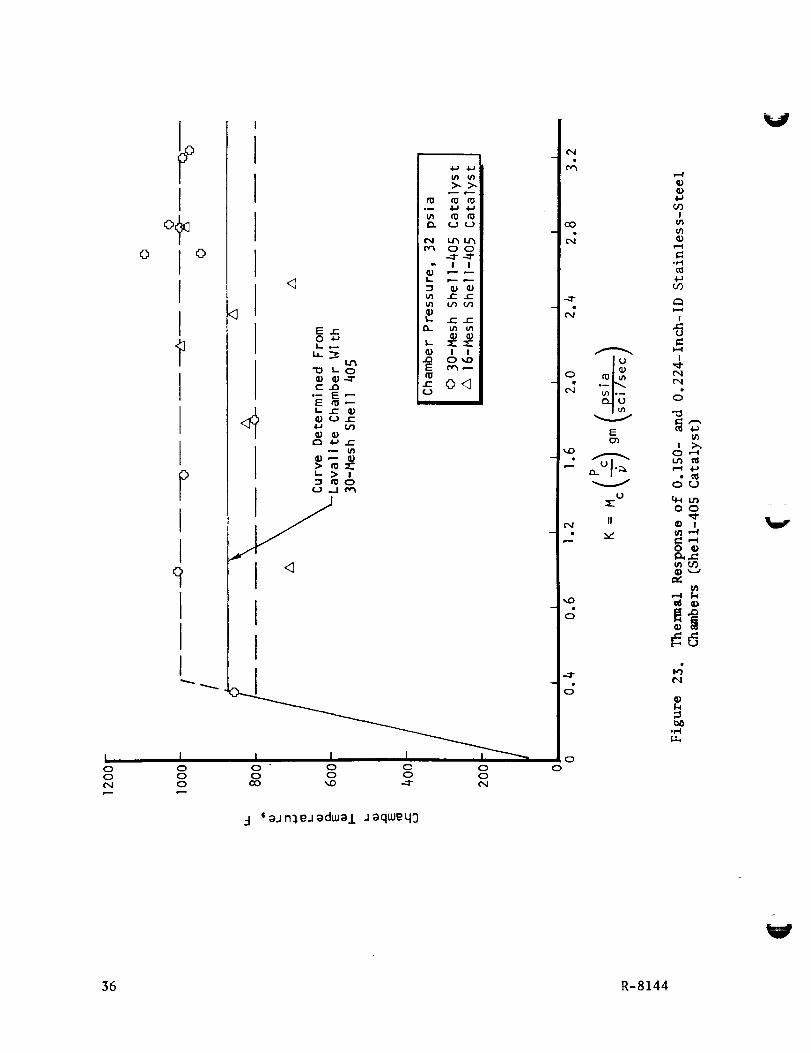
Experimental results for the Shell-405 catalyst are shownin Fig. 22 and 23.The most important of these is that the optimum K value for 30-meshShell-405
is about 0.5 as comparedwith about 0.24 for the equivalent sized MFSAcatalyst.
32 R-8144
Iooo
to
u !
_- ootm
& <1©
©
I I I _l0 0 0 00 0 0 0GO _ -.:1- t_J
._ '_._n_e._dw_.L ._qwe40
o
o
c_
c_
N
0
0
V"
Et_
o
II
k
qP4-J
F-4
f
I"4
!r-4
0
0
c;f_
f_.,
4._
r,-I
[-6
#o
R:8144 33

V
, Iooo
E.z:0
r- r_•_ E
E_ <
<a
<1
<]
o
<_
r-
r'- °l
u_r-
D I,-
e 1" _
o_Li.
YI I I
o o oo o o_o _D -:r
u
_-_r
Q) r- r"L- U1 (/1
t.. I Ia) o,_o
E
>I.LL:_r-3Ij r-
o,,z)
o I.-
JooIM
'ajn_eJadma I jaqmeq3
co
o
,o.
¢,,I
(x)
c;
oo
E
vo
_r-
II
v"
I
(/)
_hO
C_I--4
I
I
c',l(-4
_lr-,
u_ _._
*uo
<
o[.._
,-,d
11)
,4
V
34 R-8144

Iooo
©
©
©
I. L- -_
_ °--L L
a.a. f-
m E E *_0
o .... L.
r- .-I0 0
C',4_ !
,o
i
0 0 0 00 0 0 0O0 _D -_
.-I '_._n_eJ_d_usl J_qwe4_)
ii
¢4
0
0
-c_
c_
¢4
0C)
E
t)
II
v"
k_)
_)
0_
I
CJ
Ou_C)
r...I
_.z::_)ct)
,-4
4) o
¢41
¢)14
.el
R-8144 35
IOOC_l
©
I
1°IIt
IrII
III
IOOO
I
]]iI
t,-
C:
E
L.IJ1 -> r0
t... >3
lm
LO_.._r
E_
r"
IO
4-1 .IJ
D- cJ (..)
N 1.4_ I,_OO
g--
m i-- r
I1) I I
I
I I ,I _O O O OO O O OOO _ID ,-=r- ('4
j 'ajn_Ej_dwal JaqwE43
OO
E
U
II
• v"
-,-71"
OO
Q;
I
(D
U')
I
I,,,,4I
d
g_m
m _
OU
mrs)
N
°_,,i
V
36 R-8_44
In conclusion, it appears that the MFSA is more reactive per unit mass
than the Shell-405, and the smaller catalyst pellets are about twice as
reactive per unit mass as the larger catalyst pellets. For the 30-
mesh MFSA catalyst the optimum K value is 0.24. This implies that with
a flowrate of 1.8 sci/sec, 0.015 and 0.03 grams of catalyst are needed
at 30 and 15 psia, respectively.
Test results of platinum and platinum-rhodium wires evaluated as potential
catalyst retainers show that the platinum-rhodium combination is catalyt-
ically inactive with Tridyne. There was no attempt to try to activate
the wire by applying heat or special cleaning processes. The use of 0.5-
mil wire as a retainer at the injector end of the chamber may be advan-
tageous. This wire is lighter than the screens presently in use and possibly
could more effectively prevent the catalyst from moving around the chamber
than the screens. Since the platinum-rhodium wire was catalytically inactive,
nickel wire, which is less expensive, would be preferable as a retainer
material.
Thermal preconditioning tests were conducted with a Tridyne flowrate of
1.8 sci/sec at chamber pressures of 15 and 30 psia and at catalyst bed
temperatures of 70, 500, i000, and 1500 F. A 0.150-inch chamber, modified
to incorporate a flange mounting, was wound with 3-mil insulated chromel
wire, which was used as a heater. The chamber was filled with 0.0214 grams
of 30-mesh MFSA catalyst and operated at 16 psia. The heater operated
satisfactorily at 500 F; however, when it was heated to i000 F in a vacuum,
the wire developed a hot spot and burned out, necessitating rewinding.
Tests were then conducted in a vacuum at initial catalyst bed temperatures
as high as 966 F before the tests were terminated when heater wire insula-
tion began breaking down. Results of tests 60 through 71 are tabulated
in the Appendix, which includes initial and steady-state temperatures,
chamber pressure, and thermal time constant.
On the average, the thermal time constants for chamber pressures of 29 and
17 psia are about 1 and 2 seconds, respectively. The depressurization time
constants were found to be about Ii milliseconds.
R-8144 37

It is not clear why test 62 has such an unusually large thermal time con-
stant as comparedto the other tests. It maybe attributed in someway
to system startup, although this samephenomenondid not occur in test 66after the chamberwas rewound. There is a possibility that somegrease
or oil, which mayhave been accidentally left on the chamber during fabri-
cation, was vaporized during test run 61.
Transient temperature and pressure characteristics for these tests are
shown in Fig. 24 through 27. It can be seen that for approximately
equivalent initial bed temperatures, the high-pressure tests have faster
temperature responses than the low-pressure tests. Also, as would be ex-
pected, higher initial bed temperatures produce higher steady-state
temperatures.
Tests were also conducted with a heated steel chamber containing 0.053
grams of 30-mesh Shell-405 catalyst. The maximum catalyst bed temperature
attained was 1600 F. Chamber temperatures were recorded by means of an
external surface thermocouple. Since the chamber internal thermocouple
was open, temperature response data were not obtained. The recorded re-
sults did show that the catalyst was active after eight 30-second tests
with catalyst bed temperatures at least 1600 F and possibly higher.
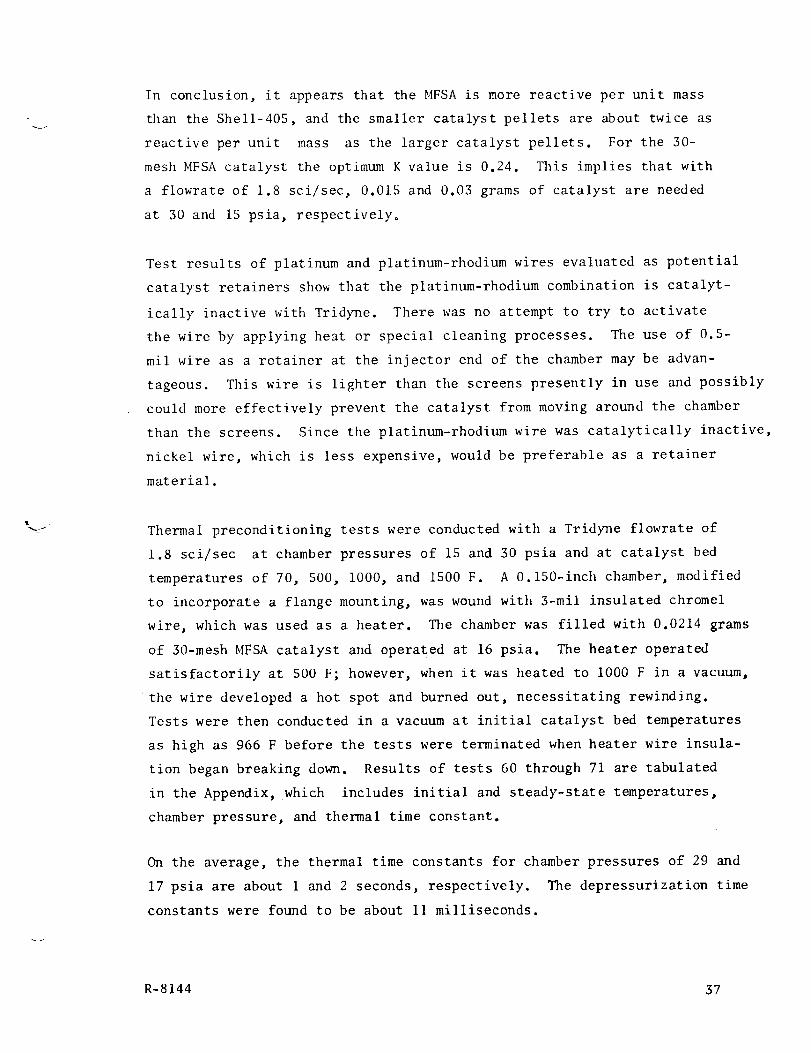
A preliminary analysis of heater power was performed for a 0.225-inch-ID
lightweight chamber with a 0.045-inch-OD supply tube. The power require-
ments calculated for the lightweight model are compared in Fig. 28 with
the experimental results obtained from a 0.150-inch lightweight chamber
with a O.062-inch-OD fuel inlet tube. The 0.150-inch chamber had greater
heat losses than the 0.22S-inch model. This can be attributed to more
heat being dissipated through the larger fuel inlet tube in the experi-
mental 0.150-inch chamber.
At the completion of Task I tests, calculations were performed to estimate
the surface and gas temperature for the lightweight model without external
heating. It was found that with a complete Tridyne reaction the chamber
surface temperature should be about 980 F and the exit gas temperature about
1400 F. Total heat loss was computed to be about 3.2 watts.
38 R-8144
V

32-
16-
_
Test #75
Test #71
o--i O.150-1nch-ID,Flange-Mounted,
i000_ Stainless-Steel Chamber
00-
600-
AO0-
200-
I
I _ I I"_l ' I r
0 0._ 0.8 1.2 30.0 30.& 30.8
Time, seconds
Figure 24. Chamber Pressure and Temperature Versus Time (Tests 71 and 75)
t
R-8144 39

CD
_D
2_
16
8
0
1200-
i000
80O
600 -
Test #76
[]
Test #73©
--lO'150-1nch-ID'F1ange-Mou nted,Stainless-Steel Chamber
I
I I I
%
_00 i f0 O.L 0.8 1.2 30.0 30.A 30.8
Time, seconds
Figure 25. Chamber Pressure and Temperature Versus Time (Tests 73 and 76)
V
40 R-8144

co
5_
Q}
4)
32-
2_
16
Test #77
Test #78
0 - -I O.150-1nch-ID,
IFlange-Mou nted,Stainless-Steel Chamber
I_O0
0
[]
1200
b_
S_
+_
zooo
E-,
© 800
6OO
I
I I l I l
0 O.A 0.8 1.2 30.0 30,4 30.8
Time, seconds
Figure 26. Chamber Pressure and Temperature Versus Time (Tests 77 and 78)
R-8144 41

32-Test #80
. []
C_
_D
2_ -
16
8
Test #790
1400-
0---I O'150-1nch- ID' 1IFlange-Mounted,IStainless-Steel Chamber
1200
I000
8OO
600
c)------
J
I I I I_ I I
0._ 0._ 1.2 30.0 30.2 30.8
Time, seconds
V
V
F_gure 27. Chamber Pressure and Temperature Versus Time (Tests 79 and 80)
42 R-8144
v /
!
1800-
I_'_00
LO0
120C'
-_ IOOO
F_
e 800
L
(/3
• 600
&O0
200 -
Theoretical
0.225-1nch-ID _ Vacuum 7
Lightweight _/ /o
Model Chamber / _"
0.045-Inch --_'/ / Air ,a
Supply Tube / / _k/
/ / Experimental [3/
/ / p/-q_-O. ] 50-;nch- ,D_
_" ?/ Attached to Tuber
0.062 OD x 0,038 ID
/ / _ Chamber WithFlangeinVacuum
0 ! ! I I !
0 & 8 12 16 20
Heater Power, watts
!
/
v Figure 28. Chamber Surface Temperature Versus Heater Power
R-8144 45

Pressure dynamics were also analytically investigated for the chamber
design in Task IV. None of the chambers fired in Task I had a small
enough depressurization time constant to satisfy the performance speci-
fications. The flightweight chamber preliminary design was shown to
have a void volume less than one-half that of the Task I chamber and was
predicted to provide improved pressure-response characteristics.
System geometry iterations were performed to provide AP data for Task IV.
Chambers with 0.255-, 0.150-, and 0.100-inch ID's and containing 0.02 to
0.03 grams of catalyst were tested. Approximate pressure drops of I psi
were observed across the catalyst beds at 30-psia chamber pressure° There-
fore, the Task IV design criteria were based on minimizing chamber heat
losses since catalyst bed pressure drops were shown to be insignificant.
The instrumentation and techniques for data measurements in Task IV were
developed. Microminiature thermocouples with l-rail beads and thermal time
constants of less than 1.0 millisecond were used in both Tasks I and IV.
A 50-psia pressure transducer was used to measure chamber pressure. The
time constant for the transducer was calculated to be less than 0.I milli-
second. A rotameter accurate to within -+4 percent measured steady-state
flowrates, and a sonic venturi was used as a flowmeter in the pulse-mode
operation of Task IV.
Temperature Response Analysis
Temperature data were correlated by means of thermal time constants to
facilitate configuration comparisons and to establish the temperature-
time curve form for analytical performance projections. The time constant
is defined as the time required for the temperature to increase from the
initial value to 63 percent of the final steady-state temperature.
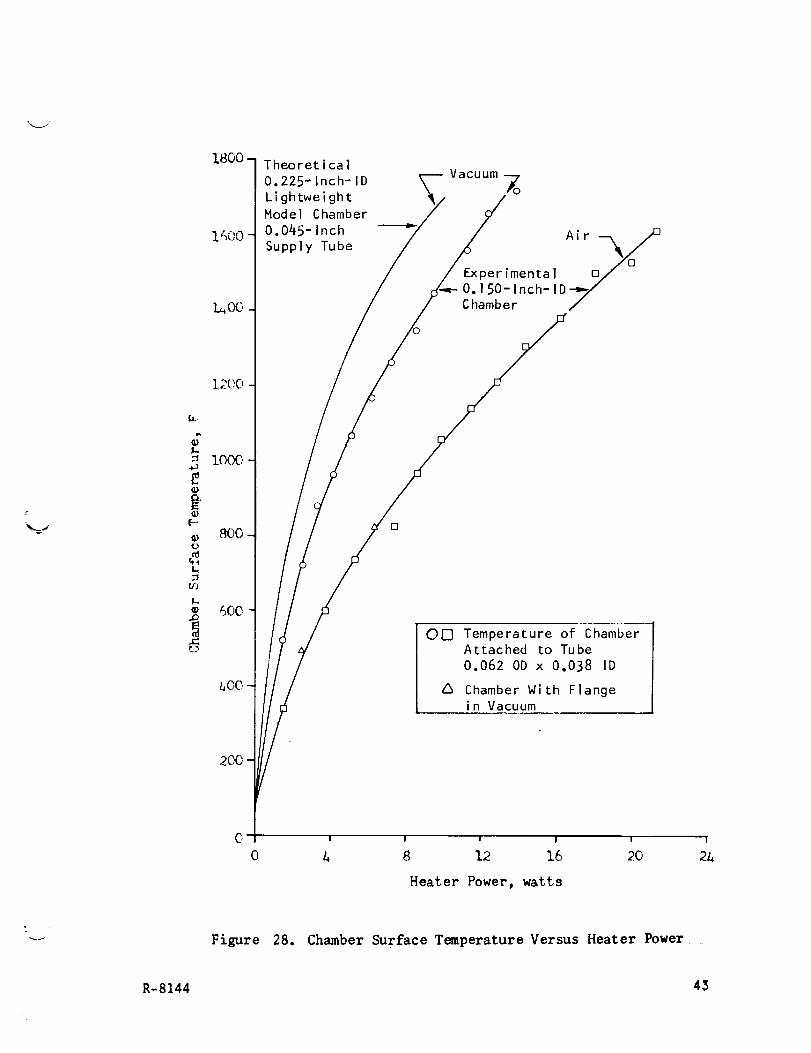
The theoretical temperature response can be estimated by means of a heat
balance for the catalyst bed. The catalyst bed was assumed to be in thermal
equilibrium with the gas, and the gas was assumed to react instantaneously
44 R-8144

on the catalyst's surface. If an incremental mass for the screens and
chamber is included in the heat balance, the equation becomes:
(-Ailr) dt = 03 Cp (T-To) dt + M c Cpc dT + }leCpe dT
where
AHr
Mc
Me
CP
C
Pc
C
Pe
T
_- = average Tridyne flowrate, Ib/sec
= Tridyne heat of reaction = Cp (Tf - Ti), Btu/ib
= catalyst mass, pounds
= mass due to the screens and chamber, pounds
= heat capacity of Tridyne, Btu/ib-R
= catalyst heat capacity, Btu/ib-R
= effective heat capacity of the M e increment, Btu/Ib-R
-- outlet temperature of Tridyne,R;also assumed equal to catalyst
bed temperature under assumption of thermal equilibration
T. = initial temperature of Tridyne, Ri
Tf = adiabatic flame temperature of Tridyne, R
T = initial temperature of catalyst, Ro
Integrating the above equation from TO
outlet temperature is:
to T and rearranging, the Tridyne
T = Tf- (Tf- To) e-t/T (i)
where the time constant term is T = (Mc Cpc + Me Cpe)/a Cp. (The curve
form is illustrated in Fig. 29). The equation neglects both the effects
of a temperature gradient within the catalyst and the heat losses.
Heat losses reduce the steady-state chamber temperature to a value below
the flame temperature. By replacing the flame temperature in Eq. 1 with
R-8144 45
Tf_____
( ),. -AH
4J
tOL
_T --0
T.-- I I I | tI
0 ) 2 3 4 5
Figure 29. Typical Temperature Response Characteristics fora Catalytic Reactor
V
O.lO
0.08
Eo_ 0.06
v
U
Q)_n
I-:_ 0.04b
0.02
F1 ightweight I_Chambers V
//
0.i/
/Io
//
/
//
//
/
_x_Lava.l ite Chamber
_r_)= 0.025 + 1.23 MC
O.Ol
Figure 30.
0.02 0.03 0.04 0.05 0.06
Catalyst Mass (Mc), gram
Thermal Time Constant Parameter
Versus Catalyst Mass
0.07
V
46 R-8144

L
_J
the steady-state temperature, an estimate of the temperature response
allowing for nonideal effects can be obtained. Equation 1 then becomes
T = T - - T ) e-t/Tss (Tss o
(2)
The time constant T can be determined experimentally since T = t when the
temperature reaches T = Tss - 0.37 (Tss - To )"
To investigate the validity of this analysis, the experimental value of
To0 was plotted as a function of M c in Fig. 30 for the Lavalite chamber.
The resulting curve appears to be a linear function of catalyst mass as
predicted. The intercept at Mc = 0 indicates that Ele(Cpe/Cp) = 0.025 gm.
If the extra mass has the same heat capacity as the Tridyne, then Me =
0.025 gm, which may be optimistic for a flightweight chamber but appears
to be reasonable for the low thermal capacitance l,avalite material. Computed
time constants for the major test configurations are shown in the run summary
(Appendix).
TASK IV: FLIGHTWEIGHT THRUSTER TESTS
The objective of Task IV was to evaluate the characteristics of flight-
weight Tridyne thrusters in both pulse-mode and steady-state operation.
The tests were to provide performance data and information on thermal-
and pressure-response characteristics and to demonstrate the feasibility
of flightweight thrusters.
Equipment
The test system (shown schematically in Fig. 3D consists of a rotameter,
a sonic venturi flowmeter, a flightweight chamber, and a thermocouple
placed in the exit nozzle. Chamber details are presented in the Design
section.
Two engine configurations were employed in the tests. One was instrumented
with a thermocouple in the chamber wall; the other had a pressure probe
installed in the chamber upstream of the nozzle throat. Instrumentation
R-8144 47

II
LI!
L_
i. 500-PSI PRESSURE VESSEL2. FILL VALVE3. SHUTOFF VALVE4. DISCOI'_ECT5. HAND-OPERATED PRESSURE
REGULATOR6, ROTAHETER7. SOLENOID VALVE8. VACUUH TANK9. REACTOR OR THRUSTE'R
i0. SONIC VENTURI
Figure 31.
A. PRESSURE TRANSDUCER (0 TO I000 PSI)B. THERNOCOUPLE (0 TO 100 F)C. PRESSURE TRANSDUCER (0 TO 50 PSI)D. THERHOCOUPLE (O TO 1500 F)E. THERI_COUPLE (O TO 15OO F)F. PRESSURE TRANSDUCER (O TO 50 PSI)G, PRESSURE TRANSDUCER (O,i TO 1OOO
MILLINETERS)
Flightweight Thruster Test Schematic
48 R-8144

mounts were designed to record representative transient response rates but
were only partially successful as demonstrated by test data. The area of
the base of the pressure transducer is 132 percent of the thruster cross-
sectional area and the pressure probe volume caused substantial delays in
thrust rise and decay times. The thermocouple provided reasonably exact
wall temperature transients but was of questionable value for evaluating
gas temperatures. Further details of the operational characteristics are
presented with the test data.
Experimental results showed that the exit nozzle thermocouple always read
lower than the chamber thermocouple when the chamber was hot. This was
attributed to the low gas density in the nozzle. The thermocouple also
produced generally inconsistent readings and was quite sensitive to its
orientation in the nozzle; therefore, these data are not presented.
The venturi shown in the schematic diagram was flow calibrated and used to
record flowrates during pulse-mode operation. The venturi flow is sonic at
low chamber temperatures as the chamber exit throat area is larger than the
venturi throat area (area ratio 1.43:1) permitting an approximate chamber/
venturi total pressure ratio of 0.70 with ambient temperatures throughout
the system. This value includes a molecular weight adjustment for the
Tridyne reaction.
The venturi will maintain sonic flow to a total pressure ratio (PTI/PT2)
across the throat of 1.3:1. This means that the venturi mass flow is con-
stant and a direct function of the inlet pressure: However, at constant
mass flow, the chamber pressure increases as temperature is increased.
This may be illustrated by the compressible flow equation:
PT(P/PT)mA
R-8144 49

where
PT =
P =
=
A
T =
mass flow, ibm/sec
total pressure, psia
static pressure, psia
g4@-_ M + - M ; g = 32.174, M = I,
32. 174R = 1545
molecular weight
2geometric throat and discharge coefficient, in.
total temperature, R
At a known inlet temperature and gas composition, the mass flow equation
reduces to the expression:
= constant x PT
This permits the mass flow to be measured very precisely by recording the
total pressure at the venturi. In the tests, the venturi pressure was
established by a wall static measurement at a station with an A/A* ratio
of 8.2:1, resulting in a static/total pressure ratio at the station of
0.9965. However, as the chamber gas becomes hot during combustion, it
is seen from the mass flow equation that the chamber pressure will increase
by the approximate ratio of 1/T 0"5, The parameters P/PT and m vary only
a small amount with temperature. Vaiues of m and P/PT versus temperature
are shown in the Performance Analysis section. ConsequentIy, the engine
chamber pressure increases to the point at which the venturi unchokes
(chamber pressure/venturi pressure ratio of 0.77). The chamber then func-
tions as a conventionally supplied thruster, and mass flow varies as a
function of chamber temperature. At this condition, thrust changes very
little over the temperature range as discussed in the Performance Analysis
section. The advantage of the venturi is in being abie to record mass
flow at the chamber inlet and thus identify, with reasonable accuracy,
V
50 R-8144

v
the pulse performance of the chamber by mass continuity relationships.
flight system would not include venturis but would be designed as a low
AP system with a nearly constant chamber pressure.
A ,
Steady-State Performance
Steady-state tests were conducted with gaseous nitrogen and Tridyne, the
nitrogen tests providing a baseline for the Tridyne tests. They also made
it possible to check the system calibration for constant temperature flow
conditions. The long-duration Tridyne tests were conducted to determine
the thermal time constant and to record the steady-state temperature. The
steady-state Tridyne tests were conducted at line pressures between 23.8
and 48.1 psia, with the sonic venturi unchoked. The results of the long-
duration tests are presented in the following sections.
Temperature Response
A flightweight thruster with an integral thermocouple was used to evaluate
the thermal response of the chamber. The installation was intended to
permit the thermocouple tip to approach free stream temperature and thus
permit characterization of the thruster thermal transients. After several
test runs and data analyses, it was determined that the thermocouple would
provide excellent chamber wall temperature measurements but would not ap-
proach true gas temperatures. This is illustrated by the recorded thermo-
couple output (millivolts) during a pulse interval (Fig. 32). The tempera-
ture trace increases from 129 to 164 F during the 40-millisecond on time
(measured rate I000 deg/sec). The rate of decrease is also extremely fast
at the pulse termination, indicating a rapid energy loss from the thermo-
couple Juncture. The indicated rate of temperature change is shown to
have an increasingly greater slope (AT/At) as the thruster temperature
increases (Fig. 32 through 34). These values are listed in Table i. The
slope increase is consistent with the assumption that the maximum gas-
chamber temperature difference occurs at peak chamber temperatures; i.e.,
at low chamber temperature more of the available Tridyne energy is absorbed
by the catalyst and chamber, at high chamber temperatures very little is
absorbed (steady-state chamber heat loss).
R-8144 51

LL
L
4-J
t-OC_
E(D
f-
0
Lr)
0
164
147
129
-0
,w
L
I-
---IITime =_
Figure 32. Temperature and Pressure Response (AT = 35 F/40 ms)
_= 626¢J
i=.
r_E
b=.
= 5890
4-J
-35.8
-0
tU,m
O.
I,,.
LO-
Figure 33.
_"! I--- lo ms
Time _
Temperature and Pressure Response {AT = 37 F/30 ms)
V
52 R-8144

ture
0
C#igure 34. Temperature and Pressure Response (AT = 56 F/20 ms)
TABLE 1
EFFECT OF TEMPERATURE CHANGE ON AT/At
Pv'
.psia
36.7
35.8
36.7
34.9
Tini ti al '
F
129
589
126
803
Tfina 1 ,
F
164
626
161
859
Run
Dur at ion,
milliseconds
40
30
4O
20
AT/At, F/ms
20/20
24/20
21/2o
56/20
*Insulated
Rate of
Change,
degrees/second
1000
1200
1050"
2800
R-8144 53

Long-duration runs, presented later in this section, show that the Tridyne
temperature varies only a small amount over a 40-millisecond period (pos-
sibly 2 F) near maximum temperature. The chamber wall temperature change
is also shown to be negligible over this interval. Referring again to
Fig. 33 and 34, which are short pulses following relatively long-duration
operations, it is a logical deduction that the indicated AT/At rate is the
thermocouple transient response at nearly steady-state gas temperatures
and not a reflection of gas temperature changes. The maximum temperature
differential measured between the chamber steady-state value and the
thermocouple-indicated temperature is about 65 F. This is considered to
be substantially less than the actual difference because of the rapid
thermocouple temperature decay at shutdown° An analytical determination
of the probable true gas temperature is presented in the Thermal Analysis
section.
r
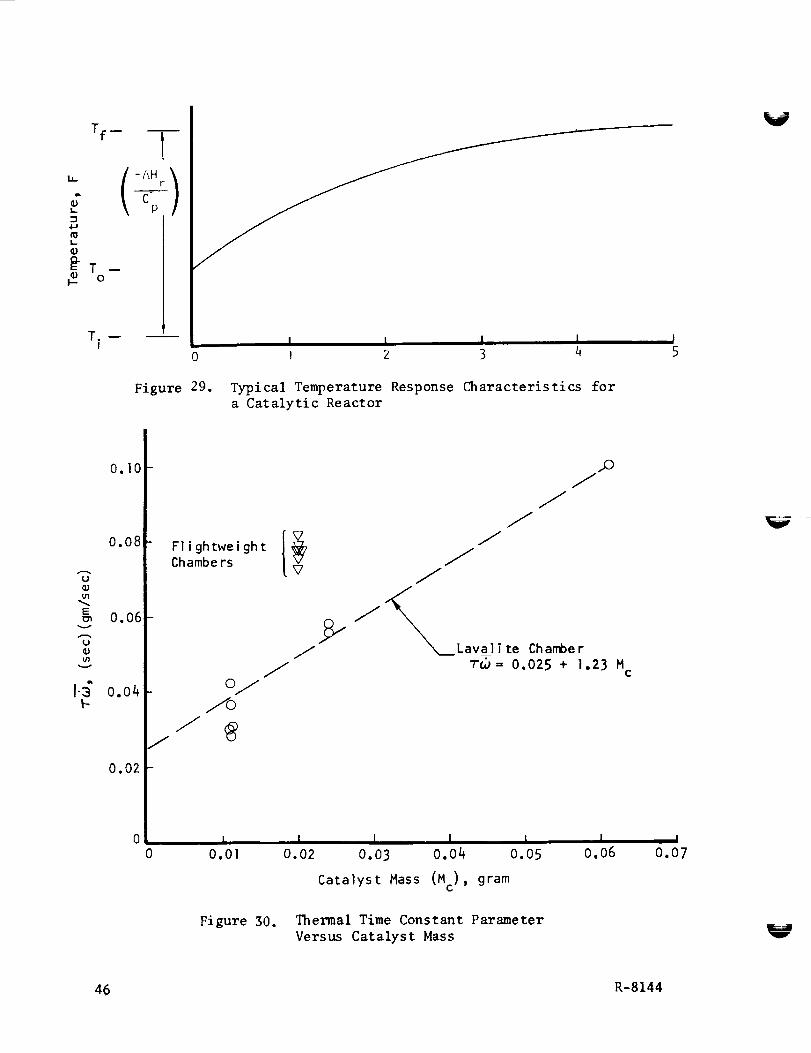
Long-duration thermal transients were recorded to evaluate heat loss rates
from the thrust chamber. Following a period of steady-state operation,
the thermocouple trace was recorded from thrust termination over a 5-
second period to determine the heat loss rate (Fig. 35). The initial drop
at peak temperature is the equilibration of the thermocouple tip with the
chamber wall followed by a gradual temperature decay at the initial rate
of about 98 deg/sec. This rate coupled with tile thruster thermal capaci-
tance shows an energy decrease of 54 x 10-4 Btu/sec, which is 17.7 percent
of the Tridyne reaction enthalpy. A similar temperature-decay recording
shown in the Thermal Analysis section is used for predicting flight-type
thruster module performance.
V
Thermal Characterization
Long-duration tests were conducted to determine the thermal time constant
for the thruster. In these tests, the Tridyne gas was allowed to flow
through the chamber for about I0 seconds, which is the time required for
the chamber to heat up to a constant temperature. The thermal time con-
stant is defined as the time required for the temperature to increase from
V
54 R-8144
147
Figure 35.
---I I--o.5 secTime
Thruster Temperature Decay Characteristics
R-8144 55

its initial value to 63 percent of its steady-state value. If the system
is first order with respect to temperature, the temperature will reach
86 percent of its steady-state value at two time constants and 95 percent
of its steady-state value at three time constants.
Thrust chamber temperature changes with time were recorded with the chamber
initial temperature near ambient. A typical test is presented in Fig. 36.
The temperatures are thermocouple-recorded temperatures and are above the
actual thruster wall temperature. The curve illustrates the temperature
increase with time to approximately steady state. Since the inlet venturi
becomes unchoked at a chamber temperature of 136 F, the data are with an
unchoked venturi, and chamber mass flow decreases from 3.80 sci/sec at 136 F
to 2.85 sci/sec as the chamber reaches 991 F. These flowrates are about I0
percent above the target flowrate of 3.40 sci/sec at 136 F and 30 psia, but
are representative of design-point operation° The curve form is used in
predicting thruster gas temperatures over the design operational temperature
range.
Thermal time constants were computed from the temperature-response data
of the long-duration runs listed in Table 2. The values were found to
vary from 1.46 to 2.94 seconds, depending on the venturi pressure° The
time constant (T) was plotted in Fig° 37 as a function of the venturi
pressure (Pv) in the form 100/P v.
The time constant equation previously presented is:
(McCpc c )/_ cT = + Me Pe P
where all terms except the flowrate are constant.
Fig. 37, the experimental data are described by:
As can be seen from
= 67.5/P v
since
_ = kPV
where k is a constant, the experimental data are in agreement with the
theoretical prediction.
56 R-8144
V

_J
000
/
00
,3
0
U
°_ °_ ,_
II II II _ II
L > U U
r"-0u
-.1-
4-_
o4
(:3
U
"G "_ "_i,
0 _ _ 0
dd_,,_--
Ur_
0
R-8144 57.
0._I
,--I
"Ct
0
00
PU4
Z
CO 0"__ ,.4 _
_0
0
,-4
-._ .r4
0
O0 0 C) 0 0 0
[...,
;:>i...-4
<
0
%-I
b-,
_-_
.,'4
0
0
.,4
G_ oO C_ _ 0(3 fxl t_
,-_ ,--I ,-_ ,-¢
fxt ,-4 I._ fxl _ Lt_
_xl t_ fx]
g
c_
c_ 0
N o
,---t
% .,.-t
I1 II
0 0
_ m
_ .,-_
_ m
% 0113 0 _
• _ ,-_ 0
II II II
._-I
_l, [_ _ H .3
[.0Z
v
V
58 R-8144

3.0
2.8
2.6
oL)
2.4
2.2
2.0
//
1.8
[]
InsulatedChamber
1.6
1.42.0 2.5 3.0 3.5 4.0
Reciprocal Chamber Pressure (IO0/P),(psia) -TV
Figure 37. Thermal Time Constant Versus Chamber Pressure
Parameter Flightweight Thrusters
4.5
R-8144 59

To compare the thermal characteristics of the flightweight chamber with
the Lavalite test configuration, the term T_ is plotted in Fig. 30 as a
function of the catalyst mass (0.020 gram). It can be seen that the T_
data for the Task IV chambers are about 50 percent higher than for the
Task I Lavalite chamber. The higher time constant is attributed to an
increase in the effective mass (Me). This is possibly due to the higher
thermal capacitance of the nickel in the flightweight chambers as compared
to that of Lavalite.
Insulation Effects. A chamber was embedded in an insulating blanket to
evaluate the effects of insulation on the chamber thermal behavior. Figure
38 illustrates the temperature response with the chamber initially at room
temperature and wrapped with insulation. Because the results are identical
to those of Fig. 32, it may be concluded that the insulation does not in-
fluence the temperature-response characteristics with the chamber initially
at room temperature° These data substantiate the long-duration tests which
revealed that the insulation did not increase the thermal time constant or
the extra thermal mass (Me) of the system. This implies that the heat
transferred from the chamber by radiation and conduction to the insulation
is negligible in comparison to the heat absorbed by the chamber and the
inlet lineo
Some data on the thermal behavior of the chamber at high temperatures were
provided during the insulation tests by run number 108 (Table 2 ). The
temperature-time history is shown in Fig. 39 together with runs 109 and
II0. A series of pretest checkout and instrumentation calibration firings
were made prior to run 108) which caused the chamber and inlet venturi to
reach near equilibration at a 400 F temperature. The run was then conducted
at an initial temperature of 402 F, which increased to 1331 F at the run
termination. Subsequently recorded temperature traces indicate that the
thermocouple tip does not attain actual gas temperatures because of its
close proximity to the wall because its shield is integral with the wall
structure. Consequently, the free stream gas temperature may have ap-
proached the design operational temperature of the Tridyne, i.e., 1500 F.
60 R-8144

e!sd +aJnssaJd
I .I
I I i_o
'.l_gJn_e-Jgdtu'o I uo !:_snqwo_
;=
4-1
t,_
II
N 0
,_>'
_gN._
._"1
R-8144 61
\
.-I ' a.ln_ej aduJal
_ o
oo
q,i4-)
4-)
.P4
r_
0
I;[-,
6"1
o
l.J
[...,
oo0
o;
°_
V
V
62 R-8144
In such conditions, the possible thermocouple error would be limited to
the difference between 1331 and 1500 F or 169 F. At a 1331 F thermocouple
reading, the chamber wall temperature is computed to be about 1250 F by
using the temperature ratios and characteristics shown in Fig. 35. These
values are later used in a performance projection presented following the
Thermal Analysis section.
Typically, in a catalyst reactor there is a large axial temperature gradient
from the front to the back of the bed because of the progressive combustion
process. There is also a large degree of interegenerative heating, i.e.,
thermal conduction of heat from the back of the chamber to the front via
the chamber wall. Under the conditons of run 108, much of the thermal
equilibration preceded the run, substantially reducing the heat loss at
the inlet. The insulation also contained the thermal radiation loss to
a very low value. With no insulation the computed thermal loss caused by
radiation would be about 8 percent of the Tridyne enthalpy. The run results
stress the importance of using a thermally effective installation for Tridyne
thrusters with low-conductance inlet supply lines. Also demonstrated were
the operational characteristics of a thruster with small conductive and
radiative heat losses.
Heater Test. A 36-ohm heater was attached to the flightweight chamber and
the assembly was wrapped with insulation. The heater was capable of heat-
ing the chamber in a vacuum from 95 to 168 F with 0.36 watt of power. A
maximum temperature of 224 F was produced with 0.81 watt of power. The
i/2-watt heater burned out when the current input was intentionally in-
creased above its rated power level. The steady-state power requirements
for thermal preconditioning of a thruster module are presented in the
Thermal Analysis section.
".v. _
This demonstration showed the feasibility of heating the Tridyne thrusters
by using auxiliary electrical heaters. Although heating is unnecessary for
chamber operation, an appreciably higher specific impulse is attained during
pulse-mode operation by preconditioning the chambers to an intermediate
temperature range, i.e., 400 to 600 F.
R-8144 63

Pressure Response
Pressure transient characteristics of the thruster were evaluated by a
fast-response Kulite transducer mounted directly on the chamber and then
on the sonic venturi in the inlet line. A high degree of sensitivity to
the volumes of the lines and transducer mounts was noted during these tests°
By reducing the void volume in the Kulite mount to a practical minimum
amount, it was possible to achieve a pressure transient (Fig. 40) of 5
milliseconds from valve-open to full chamber pressure. These traces were
made with the transducer mounted on the inlet venturi (Fig. 6) and reflec-
ted the pressure buildup at the sensor element through a O.OlO-inch-ID
inlet line. The mount void volume was estimated to be in the range of
25 percent of the chamber void volume.
Previously, a test with the Kulite transducer mounted in the same position
but with a larger cavity volume showed a 10-millisecond interval from valve-
open to full chamber pressure (Fig. 41 ). In this case, the transducer mount
cavity was larger (0°050 inch long) due to the use of 0-ring seals rather
than flat seals under the transducer adapter. These data provided some
insight into the effects of relatively small geometry variations.
A pressure trace with the Kulite transducer mounted directly on the chamber
(Fig. 42) shows a 15-millisecond pressure buildup interval, which included
comparatively large instrumentation volumes° The transducer was mounted
on the chamber as shown in Fig. 43 and an inactive Kulite was positioned
at the venturi as a sealing device. These added volumes prevented an
accurate appraisal of the pressure transients for an unencumbered chamber.
The close-coupled Kulite trace (Fig. 44) when compared with earlier cham-
ber response recordings on the Task I development hardware (Fig. 18) was
found to have nearly the same pressure buildup interval. As a result, the
thrust response rate on the flightweight chamber is assumed to be represented
by the venturi pressure buildup rate with potential improvement by further
reductions in the instrumentation line and mount volumes. The criteria for
more exact pressure transient measurements were also identified.
64 R-8144

¢O
(D
L
tDu_Q}L
e_
Tlmel _--5 ms
Figure 40. Venturi Pressure Response (MinimumVenturi Mount Volume)
cO,m
g)
.24.5Q}L=
ol
L 0
--'-i I_'- s msTime
Figure 41. Venturi Pressure Response (ExcessVolume in Venturi)
R-8144 65

Figure 42.
-- I_ 5ms
Time =
Chamber Pressure Response (ExcessVolume in Venturi)
Braze (1400 F Braze Material)
0.043 ±O.OO 1Diameter Chamber
0.090
PressureTransducer
Mount
AP70-OI l Fitting
Figure 43. Tridyne Chamber WithPressure Probe
66 R-8144

3o
fO
rs
k-
-s
k.
O-
--I ITime =,.,
Figure 44. Tridyne Thruster 25-Millisecond Pulse
The required thrust buildup rate of 8 milliseconds from the Command On
signal to 90-percent thrust on a flight-type installation is readily
achieved by employing a valve, such as the test valve, with an approximate
3-millisecond interval from signal initiation to open. A flight-type in-
stallation would have smaller-diameter supply lines than those of the test
installation and these would be only slightly longer than those tested, thus
providing a response improvement over that shown by tests. The pressure
buildup transients at various pressure levels are shown in detail in Fig. 45
with a greatly expanded time scale in 1-millisecond increments. Shown in
Fig. 46 is a representative pressure trace at a venturi pressure of 38.8
psia to provide 30-psia chamber pressure. The total impuse per pulse is
easily measured by integrating the pressure-time trace over the required
interval. In Fig. 46, time from on to off is 46 milliseconds. Some of
the traces presented in other sections show typical pulse widths varying
from 10 to 50 milliseconds. Thrust variance with temperature is discussed
in the Performance Analysis section.
The pressure decay time (Fig. 40) of 18 milliseconds from the off signal
to 10 percent of maximum pressure is a conservative estimate of the actual
R-8144 67

----.- !_ ] msTime
Figure 45. Pressure Response (MinimumVolume Venturi)
V
•-_ 38.8I,/I
1-3
L,.
a_ 0
|_10 msTime
Figure 46. Pressure Response at Venturi for
30-psia Chamber Pressure
V
68 R-8144

chamber thrust decay as the chamber pressure is always slightly less than
the venturi pressure. A minor improvement could be effected by eliminating
instrumentation lines and minimizing valve downstream volumes, but the pro-
gram objective of 8 milliseconds from the off signal to 10-percent chamber
pressure is probably unattainable.
E
Tridyne Test Composition
The volume percentages of the reactants in the test Tridyne is shown in
Table 3 .
TABLE 3
VOLUME PERCENT OF TRIDYNE
Gas Volume Percent
Nitrogen 85.21
Oxygen 5.02
Hydrogen 9.77
Ideal reaction temperature 1470 F with an inlet gas temperature of 70 F.
Error Analysis
Task IV errors were limited to those produced by the instrumentation. The
errors produced by zero shifts were corrected by checking the pressure
transducer zeros before each test sequence° The exit nozzle thermocouple
oscillograph output was nonlinear below 4 millivolts and the zero seemed
to fluctuate. Therefore, the exit nozzle temperature data were not reported
or used in the calculations. No problems were encountered with the chamber
thermocouple and only one incident occurred in which a leak developed in
the chamber. The leak was caused by the pressure probe attachment in Con-
figuration I. Another source of error exists in evaluating the oscillograph
and oscilloscope traces. The values can be read to about -+0.00S inch, which
is equivalent to about -+0.01 psia for the pressure transducer and about
-+0.i0 millivolt {or -+4 F) for the thermocouple.
R-8144 69

Microminiature thermocouples with l-mil beads and thermal time constants
of less than 1.0 millisecond were used in both Tasks I and IV. A 50-psia
pressure transducer was used to measure chamber pressure. The time constant
for the transducer was calculated to be less than 0.i millisecond. A rota-
meter accurate to within -+4 percent was used to measure steady-state flow-
rates. In the pulse-mode operation of Task IV, a sonic venturi was used as
a flowmeter.
70 R-8144
v
PERFORMANCE ANALYSIS
ANALYSIS
Thrust chamber performance is presented at conditions established during
program development. These include a chamber pressure of 30 psia, an
expansion ratio of 100:l, and an exit nozzle throat nominal diameter of
0.017 inch. Parameters used in evaluating thruster operation and for
correlating data are discussed in the following paragraphs.
Theoretical Performance
The performance characteristics of Tridyne (molar fractions of 0.85 nitro-
gen, 0.I0 hydrogen, and 0.0S oxygen) were evaluated to determine specific
impulse, thrust, and mass flow variances with temperature. The theoreti-
cal specific impulse of Tridyne at 30 psia pressure and I00:I expansion
ratio is shown in Fig. 47 as a function of the gas total temperature at
the nozzle throat. Flow loss factors are evaluated by means of a Rocketdyne-
developed analytical model that utilizes the integral momentum and energy
equations with a finite difference solution. The loss terms, potential flow
at the throat, nozzle divergence, and boundary layer effects are combined
as a thrust coefficient efficiency term presented in Fig. 48. These
efficiencies are applied to establish the delivered specific impulse curve
of Fig. 49. The thrust chamber effective throat area is thus determined
by the flowrate required to deliver the rated thrust of 0.01 pounds.
The efficiency terms of Fig. 48 are Slightly lower (about 4 percent) than
those predicted at the start of the program, primarily because of a more
complete evaluation of gas viscosity effects. The gas viscosity-temperature
variation is shown in Fig. 50. The only significant effects from the effi-
ciency change are a slight increase in throat diameter (from 0.0166 to 0.0172
inch) and an increase in engine mass flow (from 6.9 x 10 -5 to 7.3 x 10 -5
ibm/sec at 1500 F) to produce 0.01 pound thrust. Chamber thrust is virtually
s
R-8144 71
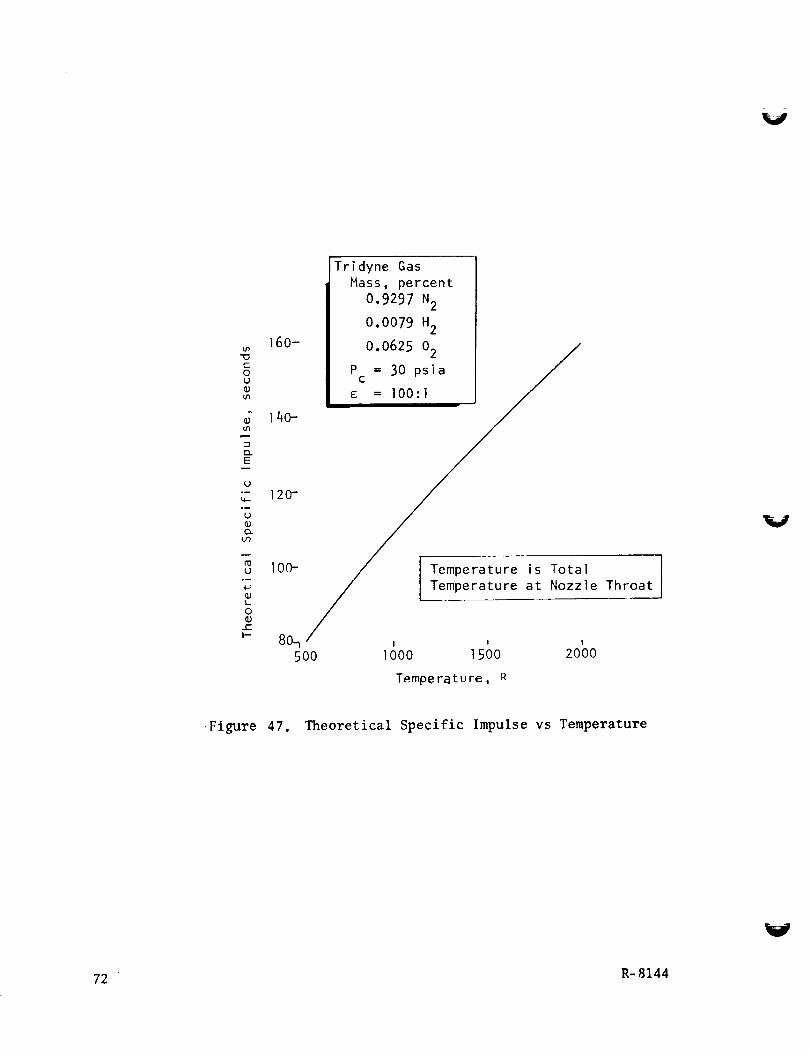
u_
cOL_
im
Gu_
Q.E
k_
3
_J
L
O
i-
160-
140-
120-
100-
80_5OO
Tridyne Gas
Hass, percent
0.9297 N2
0.0079 H2
0.0625 02 /
Pc = 30 psia
/ I Temperature is Total
le Throat
t Temperature at Nozz
• I ! !
I000 1500 2000
Temperature, R
i
•Figure 47. Theoretical Specific Impulse vs Temperature
V
72 R-8144
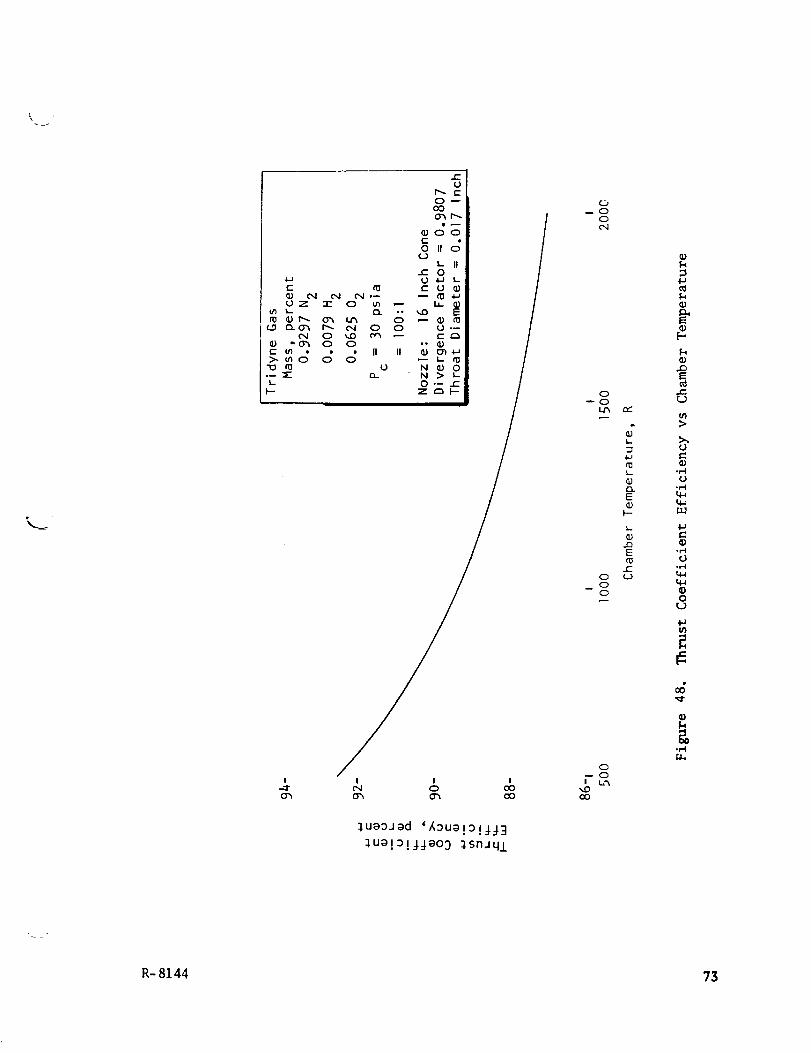
.iJo-
N102:
_n i..
I'D or',-.
oq0 _07C t/1 •
!-
i
o'7
r-u
0O00"_ r'_
g,dL II
e- 0U ._J L
to coo_ "I I _ _
r--. tN o o o.- /o _ e_ _ c c:_ /o o .- o !
• " II II 0 0"_ ._' I
• o N O0 /o_ " N > L /
O.-- r-
1
! ! Ie,l o oooh 0"_ oo
0
--0
0
Oq
o--o
o_ o
o
o-- o
co
rv-
o"
_.J
to
oQ.Eo
t-
I--
otnE
c-
o
,Ia
o
[.-,
%
m
u
u°r,,t
l-J
°_U
°_
q4
0
l-J
_ua_Jad '_ua!_!jj3_ua!_!JJao3 _snJ41
R- 8144 73

0_ 0
0c',l
O
o"I-
0 4-_-- 0
c_l I--
_LE
I--
0-- 0
O0
¢)
;>
.--4
0-,E
U.,-I
U
@
.,--I
0
rl
V
I I I I I0 0 0 0 0,,.0 -1" C_l 0 O0
spuo0_s 'aslndm I o!_!o_d S p_J_A!la G
O-- c'7,
O_D
u
74 R-8144
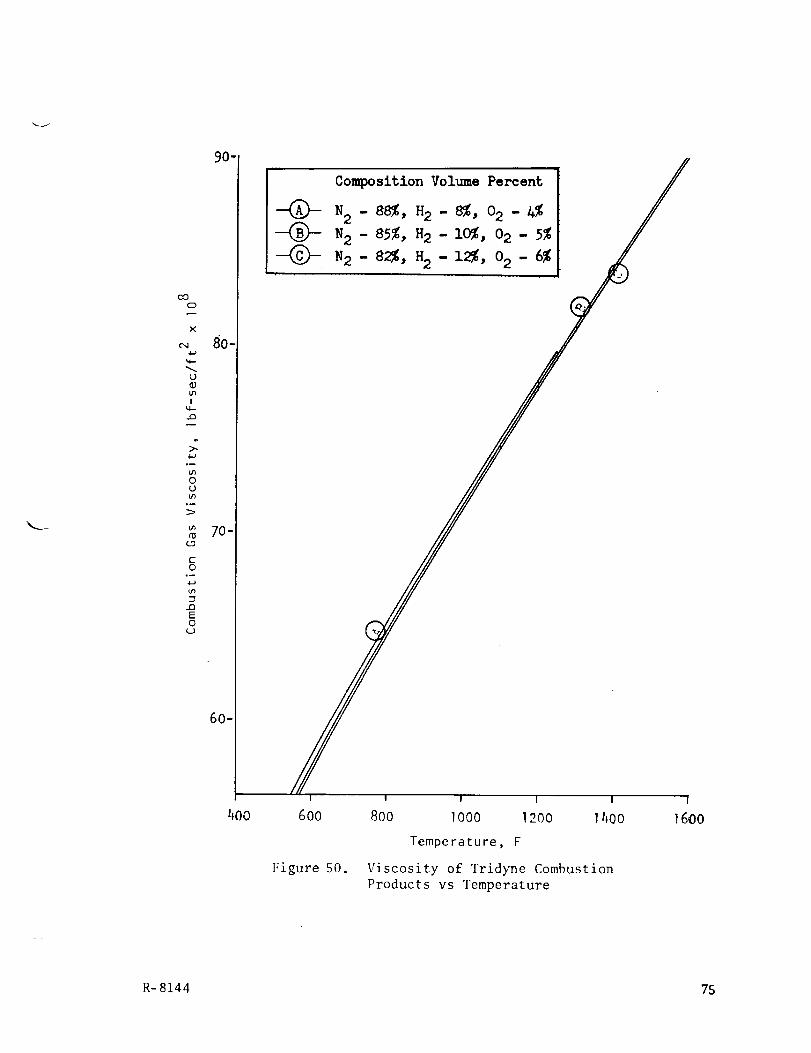
x._
CO
O
×
¢q
¢D
0_%0
I
t_
>.4-_
O_
O
_D
%0
>
%0
t_
C
O.d
4-J
%0
-I
t_
E
O¢.D
90-
80-
70-
60-
400
I ! I I I
600 800 1000 1200 1400
Temperature, F
Figure 50. Viscosity of Tridyne Combustion
Products vs Temperature
I
1600
R-8144 75

constant within the temperature range of 70 to 1500 F with a low AP system
as the chamber mass flowrate decreases as the exit temperature increases.
This characteristic is discussed more fully in the following paragraphs.
Delivered Performance
For microthrust nozzles, the boundary layer effects are significant and
substantially reduce nozzle throat effective areas. Although experimental
data on discharge coefficients in the low Reynolds numbers range are some-
what limited, recent analysis of the effects of approach velocity and the
boundary layer profile has resulted in remarkably good agreement between
various references. A correlation developed by Roc|_etdyne personnel is
shown in Fig. 51 distributed over a Reynolds number range of 50 to i00,000.
The range of interest on the Tridyne program is from I000 to 8000. The
values shown are estimated to be within 1 percent of actual.
Superimposed on the Fig. 51 curves are data acquired from calibration of
the sonic venturi used for measuring thruster flowrates. Both nitrogen
and helium were flowed over a pressure range of l0 to 50 psig and flow
versus time was measured by a Beckman positive-displacement flowmeter.
The venturi throat diameter was 0.01395 inch with an error margin of less
than 0.00005 inch. The wall/throat radius ratio was 3:1. Calibration
data show no apparent coefficient change due to the difference in specific
heat ratios of helium and nitrogen (1.66 and 1.40, respectively)•
V
The thrust developed by the chamber is determined by the product of the
mass flowrate and the delivered specific impulse. The mass flowrate change
with temperature at a constant inlet pressure is shown in Fig. 52. The
mass flowrate equation is presented in the experimental evaluation section
for venturi flow analysis. Two parameters used in the equation, m and
P/PT' are shown in Fig. 53 and 54, respectively, plotted as functions
of temperature. It should be noted that a chamber pressure increase with
76 R-8144

_J
k._
=_J
o o'%
? ...1
-i :i
i_!r •
_-.+--
j-- -
• |_ +._
i-i -
! i
_--4-
i- 4_ -
k_
--.I-- w
.-4---.--
L__m_
--t--- --
I
-._=
i- -
-\-L: -
=Z-
_}_-
oo
]uo!_!_oo_ _6_eq_s!o
d
oo
o
t_
I1)
tq
I"-1
oZ
°r.-_
o
o
°_-'l
_+_
o
o
o
o
R-8144 77

T' J ' I
x.O -.-r 04 o 0o
_0L x _as/mq[ '_EJMO[3 J_qwRq3
O.O
O
(:D
!-
.1.1
L
L
JQE
..E(J
O'O¢O
O-0
_0
,r-I
0
[.-,
,IJ
0
c_
U
V
78 R-8144
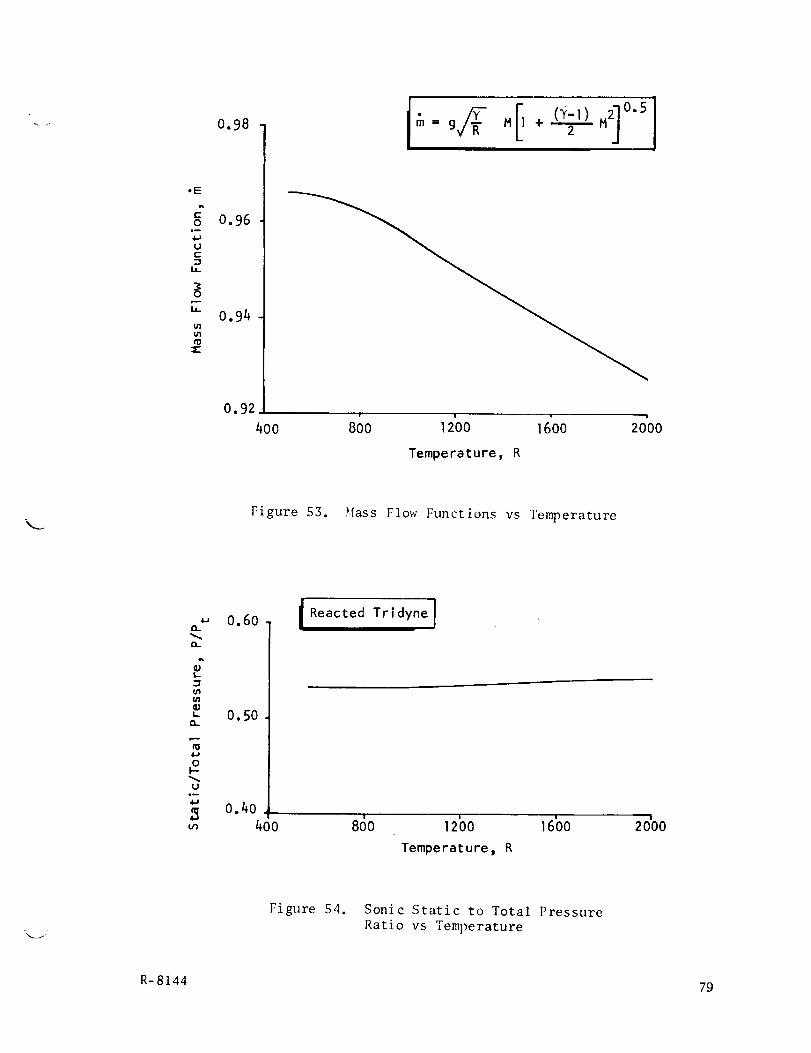
0.98 I.E
O,m
4-J
U
c-
-1LL
m
0.96
0.94
0.92|' i
400 800 1200 16'00 20'00
Temperature, R
Figure 53. Hass Flow Functions vs Temperature
(2.
I..
&/1
{/I
L
(2.
4_
0F-
Uw_
0.60
0.50
0.40
400
I Reacted Tridyne I
860 12b0 16'00 20'0o
Temperature, R
Figure 54. Sonic Static to Total Pressure
Ratio vs Temperature
R-8144 79

temperature would produce a higher thrust. The constant pressure thrust
variation with temperature is shown in Fig. 55 which indicates a slight
increase with decreasing temperatures. This may be partially compensated
for by a slight chamber pressure decrease at lower pressure. It is also
quite possible that the viscous losses predicted at high temperatures by
Rocketdyne's performance program are conservatively computed. The pro-
gram is well substantiated at thrust levels about l-pound thrust. However,
few substantiating data are available for reference in the range of 0.01
pound thrust. This is an area warranting study and further experimental
evaluation.
Because of frequent reference to Reynolds number effects on the discharge
coefficient during the program, a parametric range of numbers were com-
puted for both unreacted Tridyne at ambient temperature (70 F) and the
combustion products over a temperature range of 100 to 1500 F. These
are shown in Fig. 56 and 57, respectively. A crossplot of Fig. 56 data
showing the exit nozzle Reynolds number variation with temperature is
shown in Fig. 58 permitting the discharge coefficient temperature variance
to be determined by reference to Fig. 51. This is also plotted in Fig. 59.
-- I
V
THERMAL ANALYSIS
An analysis was made of the flightweight thruster tests to determine heat
loss factors and to provide criteria for spacecraft module designs. The
test installation is shown in Fig. 12. An ultra-miniature thermocouple
is shown positioned downstream of the catalyst bed in the cavity formed
between the aft screen and the chamber nozzle. The thermocouple juncture
is approximately 0.020 inch from the chamber wall and the thermocouple is
electroformed integrally within the wall. The couple is formed of two
0.5-mil platinum alloy leads encased within a thin-wall, 8-mil-diameter
sheath. Insulation of magnesium oxide is provided in the 2-mil nominal
gaps separating the wires from each other and from the casing, and the
sheath closure is a high-temperature refractory bead.
80 R-8144

f'4O
>4
q--
_D
i
K.r-
1.4
1.2
1.0
0.8
, l T
500 ] 000 ] 500 2000
Temperature, R
Figure 55. Thrust Variation With Temperature
R-8144 81

IO
X
E4: 0
O_ r-•t,¢ _
4-1iffl
;:1
E
m
O¢-
¢U
0i-e-
I--
2O
18,
16-
14-
12
lO
Temperature, R
1960
1460
..... 960
56O
/
//
/
Chamber Pressure, psia
/
//
/ 40
//
//
_ , v 7
0.008 0.012 0.016 0.020
Figure 56.
Throat Diameter, inch
Throat Reynolds Number vs Throat Diameter
(Molecular Weight of Reacted Tridyne = 27.0)
V
82 R-8144

28-
24-
oX
I c 20"
_-_ .0
m
g
_!_ 16-
._ 12-
o
4-
O_
IVolume =0.85 N2, 0.1 H2, 0.05 02
,Temperature = 70 F _ ___
I ! I
0.008 0.012 0.016
Throat Diameter, inch
0.020
Figure 57. Throat Reynolds Numbers vs Throat Diameter
(Holecular Weight of Tridyne Gas = 25.61)
R-8144 83

l[Throat Diameter = 0.017 InchIWall/Throat Radius Ratio = 3"I
L 12] IMolecular Weight of_ m, I Reacted Tridyne = 27.0
O
X
-Q 8"
_, "_ 4,L _t"-
soo Io%0 15bo 20100Temperature, R
Figure 58. 13_roat Reynolds Number Variation
With Temperature
0.98-r-
U
W-
0.96.
g
U
0.94
2 500¢-
I---
Throat Diameter = 0.017 Inch I
Wall/Throat Radius Ratio = 3:1
Molecular Weight of
Reacted Tridyne = 27.0I I I I I
10%0 1500 2oo0Temperature R
Figure 59. Throat Discharge Coefficient
vs Gas Temperature
v
84 R-8144

Those thruster thermal characteristics of interest in the analysis are
summarizedbriefly. The chamberbody is of electroformed nickel and
weighs 0.16 gram. The chamber contains nominally 0.02 gram of catalyst
which is formed by the disperson of noble metals over aluminum oxide
pellets. The catalyst pellets have single-point contact with the chamber
although somealso contact the retaining screens. The screens are vir-
tually free floating and contact the chamberwall in approximately four
local areas at the outer peripheries. Consequently, the screens wereassumedto approach gas stream temperature.
The inlet line is the primary heat loss path. It consists of nickel tubing
0.04 inch ID, 0.i0 inch OD, and 0.15 inch in length. Mounting material forthe inlet line is assumedto be an infinite heat sink as the mass is two or
three orders of magnitude larger than the thruster. The inlet line admit-tances were lumped to that of an equivalent solid line of 15.7 x 10⁻⁴ sq in.
area and 0.21 inch length.
TESTCONDITIONS
The thrust chamberwas operated at design conditions (30-psia chamberpres-
sure) and found to equilibrate at near I000 F as recorded by the chamber
thermocouple described above. The Tridyne mixture is designed to provide
1500 F reaction temperature. Consequently, a study was performed to deter-
mine thermal losses and provide data on the engine thermal efficiency.
The thermocouple output (millivolts) was recorded on an oscilloscope (Fig.
60 ) during the temperature decay transient from peak temperature. Figure
61 depicts pressure traces and thermocouple voltage during a pulse ofabout 15 milliseconds duration. The thermocouple response during the pres-
sure buildup is initially very sharp, and shows a temperature response rate
of 14.2 F/ms. The rate decreases to 0.4 F/ms after 15 milliseconds of opera-tion and at chamber shutdowndeclines at the initial rate of 2 F/ms. Since
R-8144 85

100 ms
V
Ref. I45 1' my = 42.7
degrees
A = 1000 F; B = 940 F; C = 890 F; D = 860 F
Figure 60. Oscilloscope Recording of Thermocouple Transient
859 F
803 F
34.9 psia
0 psia
"0
t-
Figure 61. Rapid Thermal Transient (AT = $6 F/20 ms)
R-814486
the decay rate is almost completely caused by conduction from the juncture
into the chamber wall, it becomes evident that the thermocouple does not
record peak gas temperatures because of the high energy loss from the thermo-
couple juncture. However, with no gas flow the thermocouple should provide
an accurate chamber temperature-time history.
Referring again to Fig. 60, the maximum steady-state chamber temperature is
940 F (point B following thermocouple-chamber equilibration). The slope of
the curve at this point indicates a heat loss rate from the chamber of
1.85 x 10 -2 Btu/sec. At points C and D the loss rates are 1.23 x 10 -2
and 0.5 x 10 -2 Btu/sec, respectively. These rates are based on the thermal
capacitance of the thruster outer shell. The potential energy loss of the
Tridyne is shown, by the product of the enthalpy difference between the
temperatures of 1500 and i000 F (Fig. 62) of 145.8 Btu/ibm and the thruster
flowrate of 7.9 x 10⁻⁵ Ibm/sec at i000 F to be 1.15 x l0 -2 Btu/sec. Based
on this theoretical loss, the highest loss rate (point B) is 1.60 times
as large as the theoretical potential loss. This indicates that the thermo-
couple is reading very close to the actual chamber temperature instead of
fully responding to gas temperatures. In addition, it is evident there is
a large axial flow of heat from the nozzle end of the chamber to the in-
jector end. Point D, 550 milliseconds after chamber shutdown, shows a
loss rate about one-half the theoretical loss with little change in the slope
for the rest of the recorded interval. The assumption that this rate approx-
imates the actual conduction heat loss from the chamber during steady-state
operation would account for 50 percent of the theoretical energy loss.
Thermal Anal.ysis
Radiation losses were analyzed using the Stefan-Boltzmann equation with
emissivity (e) values assigned by comparison with tabulated reference
materials. Using e values of 0.3 for the chamber body and nozzle exter-
ior, 0.9 for the nozzle interior, and a 0.95 form factor results in a
computed radiation loss value of 9.7 x 10 -4 Btu/sec at a chamber tempera-
ture of 940 F. This is equivalent to 8.5 percent of the estimated theo-
retical loss.
R-8144 87

V
80O
Gas Composi tion,mass percent
0.93 N2
O.07 H20
3OO
5OO
700
600
Cw 500
C
L
400
lO00 1500 2000
Temperature p R
Figure 62. Tridyne Enthalpy Versus Temperature
88 R-8144

\ The actual gas temperature in the chamber can be computed by using the
thermal loss rates, a heat transfer coefficient, the effective chamber
area, and the driving potential.
The Bartz equation for convective heat transfer coefficient estimation
in the region of the nozzle is as follows:
g D,0.2 Pr 0.6 P
where
hg
D
2= heat transfer coefficient, Btu/in. -sec, F
= throat diameter, inch
= gas viscosity, Ibm/in.-sec
C = gas specific heat, Btu/Ibm-FP
Pr = Prandtl number, _ Cp/k
gc = gravitational acceleration, 32.174 ft/sec 2
c* = characteristic velocity, ft/sec
R : nozzle wall radius of curvatureC
2A, = throat area, in.
2A = area of reference, in.
, inch
81 = boundary layer factor, dimensionless (value of 1.0 used
for small wall-gas gradient)
\ _v
Computing h for conditions in the chamber at the thermocouple stationg
results in a value of 1.88 x 10⁻⁴ Btu/in.2-sec-F. Assuming this value applies
over the thruster internal wall area and using the measured conductive and
radiation losses results in a computed temperature difference of 17S F
between the gas stream temperature and the wall temperature. The calcu-
lated gas temperature is ii15 F. With allowance for the thermal losses,
this is consistent with virtually complete Tridyne energy conversion.
R-8144 89

A thermocouple was placed in the exit nozzle in an effort to record the
gas stream temperature directly. The thermocouple response was found to
be intolerably slow due to the low gas density (at a 6:1 expansion ratio
the gas density is 5 percent of that in the chamber). An alternate in-
stallation was tried (Fig. 12) in which the thermocouple was inserted ina tube in the aft chambersection with a braze attachment at the tube's
outer end 0.25 inch from the chamberwall. This method resulted in thermo-
couple damagefrom the braze process. It is an attractive approach, how-
ever, as it would permit the thermocouple bead and sheath to approach gas
stream temperature.
V
TRIDYNE MODULE PERFORMANCE
An important phase of the program was the projection of test data and thruster
performance to conditions of spacecraft operation. The module design pre-
sented in the Design section (Fig. 4) is the basis of the thermal analysis
to establish heat loss rates from a three-chamber cluster (pitch, yaw, and
roll control) and to determine heater requirements to maintain the module
at a reference temperature. The design features of the module are discussed
in the Design section.
A thermal analog network of the rocket engine assemblies in the three-chamber
module configuration was constructed for input to the Rocketdyne Differential
Equation Analyzer Program {DEAP-I). One-third of the Tridyne module analog
network formulated is illustrated in Fig. 63. The analog uses a three-node
nozzle and three-node combustion chamber thermal representation with con-
vective heating from the combustion gases, radiation to space, and conduc-
tion through attachments to the shield. Radiation is considered from the
thrust chamber to the shield. A two-node representation of the propellant
lines is assumed to connect the thrust chambers to the propellant valves.
Heat losses for the three-chamber module are shown in parametric form for
application to various mounting conditions. The base reference assumes an
V
go R-8144
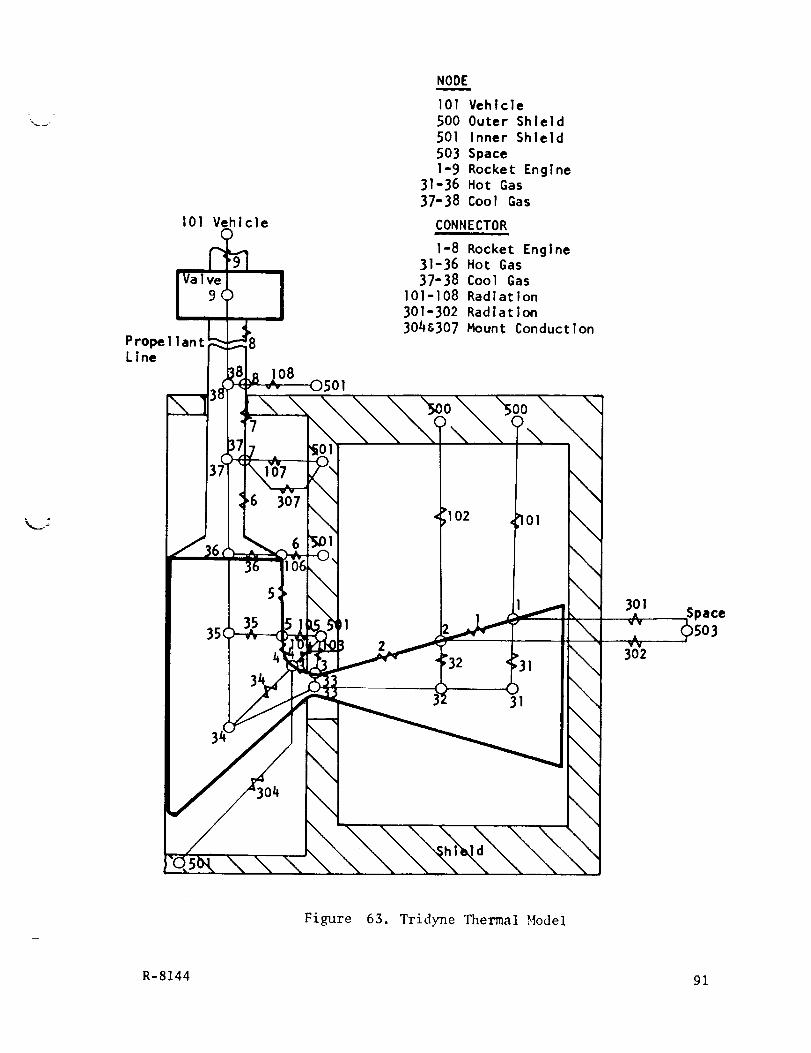
I01 Vehicle
lVal _el =9O
L . j
Prope| ]ant _ _3Line
NODE
101 Vehicle500 Outer Shield501 Inner Shleld503 Space1-9 Rocket Engine
31-36 Hot Gas37-38 Cool Gas
CONNECTOR
1-8 Rocket Engine31-36 Hot Gas37-38 Cool Gas
101-108 Radiation301-302 Radlatlon3046307 Mount Conduction
_ I_-_501
3_ ._\ \ \ \ \ _o0\ _c,0\, .
B7- ,._1
\
\\
IS., _,63o7 :,o_ ,_o, \16¢'_- _01
_( --0,,
15 _ I •35(_ _ z
_ ,, _ 32 313_"}' _ _
3'_
c_'sb_\ \ \
\
\\\\\\
301A Space
302
Figure 63. Tridyne Thermal Hodei
R-8144 91

environmental temperature of 175 F as might occur at the end of a solar
panel deployed in space. Heat losses For conditions other than the ref-
erence can be estimated by using appropriate ratios.
Heat losses for the thrust chambers forward mounts and rear mounts are
shown in Fig. 64 and 65 as functions of thruster temperature. Figure 66
shows inlet line conduction losses versus line length for various thruster
temperatures, and radiation losses versus thruster temperature are presented
in Fig. 6_ Total heat loss is shown in Fig. 68 over a thruster temperature
range for the conditions noted on the curve.
The temperature losses occurring at maximum chamber wall temperature (esti-
mated to be 1300 F) would be 2.6 watts which represents an enthalpy loss
of 8.4 percent. If no heat were supplied to the module, the equilibrium
temperature would be 1850 R and the chamber mass flow would be 103 percent
of the minimum (1960 R mass flow is 7.3 x l0 -5 Ibm/sec).
1.0
I.I4J
3
_'o.5
O.J
4=w
_b-r
I NOTE: ITitanium Mount I J
175 "
! !
500 1000 15bo20'o0
Thrust Chamber Temperature, F
Figure 64. Tridyne Module Thrust ChamberForward Hount IIeat Loss
V
92 R-8144

I-
ra
t-
O_
°I
E r-J
.Ir-I__
• . ._
F- I'-_0
Z
I ! t
s]3eM _sso 1 ]e_ H
000
00L_
00
_0
0
0
00L/'%
LI_
4-J
I-0r_E
.Q
E
r-___
4-J
L-r-
0
0
0
0
0
%
©
0
©
.r,4%
ot_
0
R-8144 93

1.0
p.5
0.2
cO
0.1Ah30.--I
.I-P
0.05-r
0.02
NOTE:
O.030-1nch-I DStain]ess Stee] Line
O.O020-1nch Wa]]0.0040- Inch Wa]]
. m i
Chamber
ture_ F
Line Length_ inches
V
V
Figure 66. Tridyne Thruster Hodule PropellantLine Heat Loss vs Line Length
V
94 R-8144

=
I I
500 1000 1500
Thrust Chamber Temperature, F
Figure 67. Tridyne _iodule Thrust ChamberRadiation I]eat Loss
!
2000
R-8144 95

4J
4J
tO
o..J
4-J
rO
4.0
3.0
2.0
l.O
NOTE:
O.030-1nch-ID CRES Line
O.O02-1nch Wall
1.25-1nch Length /
Titanium Mounts /Radiation Shield = 175 F /
= 0.05 /I
560 10_30 15'00
Thrust Chamber Temperature, F
!
2000
V
Fi_lre 66. Tridyne Module Thrust Chamber TotalHeat Loss Conduction and Radiation
V
96 R-8144

PROJECTED PERFORMANCE
A projection of the thermal response for a Tridyne thruster incorporating
design refinements is shown in Fig. 69. The major changes include small
catalyst pellets (0.002-inch-OD), reduced catalyst mass (0.14 gram), thin
retaining screens (0.004 inch), and minor changes to the thruster contour
to permit use of thinner walls (0.0025 inch) in the chamber body. Previously
presented modular installation features of reflective insulation and low-
conductivity inlet lines are included in the projection thermal analysis.
4J
K.
e_E
1600-
1200-
800
400
O- • I 1 l I"i00 2 4 6 8
Time, seconds
Re fe ren ce
15oo F
Figure 69. Projected Thermal Response for Advanced Tridyne Thruster
=
R-8144 97/98

rr_
V
CONCLUSIONS AND RECOMMENDATIONS
The program demonstrated the feasibility of using Tridyne in attitude con-
trol thrusters in the 0.01-pound-thrust class. Criteria were also provided
for catalyst selection, thruster module designs, and thruster fabrication
methods. Operational characteristics of the thruster were documented over
a range of initial temperatures from ambient to equilibrium, and the thermal
characteristics were measured.
The flightweight thrusters can be fabricated and assembled to standards
normally used for spacecraft hardware. Dimensional tolerances are control-
lable to 0.0001 inch on critical dimensions, which permits a high degree
of control on the thrust level of the thrusters.
k,_
Several areas are noted in which performance improvements are possible.
A smaller catalyst pellet would permit a reduction in the catalyst mass
as well as the chamber size and mass, thus improving thermal response.
A separate internal catalyst compartment isolated from the thruster body
and a moderate chamber redesign to permit use of a thinner wall would
also decrease the chamber thermal inertia.
Some of the instrumentation installations could be improved by minor ex-
changes for better adaptation to the small scale of the test hardware.
Thermocouples, in particular, could be made more responsive to gas tem-
perature by extending the juncture and leads a short distance (about
0.015 inch) beyond the end of the shield. The installation should then
be calibrated to reference gas temperatures in the range of interest.
Both temperature response rate and error magnitude should be measured.
Representative pressure response measurements are feasible on Tridyne thrus-
ters by use of prototype mockup chambers duplicating the flightweight thrus-
ter void volumes. This approach would more closely approximate the actual
pressure response by permitting low-void-volume, close-coupled transducers
to be used.
R-8144 99
Thruster temperature characteristics could also be more precisely deter-
mined by providing better thermal isolation in the form of long, thin-wall
inlet lines and reflective shielding for radiation losses.
A logical extension of the program effort should include the demonstration
of a representative real-time, long-duration space mission duty cycle witha three-chamber module. Data of interest are thermal behavior, impulse
repeatability, valve leakage effects, and general componentdurability in
a vacuumenvironment for prolonged periods.
V
I00 R-8144

REFERENCES
i. AFRPL-TR-66-278, Advanced Pressurization Systems Technology program,
Final Report, H. E. Barber, Rocketdyne, a Division of North American
Rockwell Corporation, Canoga Park, California, 15 November 1966,
CONF IDENTI AL.
2. RR 64-2, Hydrogen/Oxygen Catalytic Ignition Studies for Application
in the J-2 Engine, R. W. Roberts, Rocketdyne, a Division of North
American Rockwell Corporation, Canoga Park, California, January 1964.
3. NASA-CR-72176, Evaluation and Demonstration of the Use of_ Cryogenic
Propellants (02/H2) for Reaction Control Systems, Volume I ; Expe_ri-
.
mental Evaluations and Demonstration, N. Rodewald, G. Falkenstein,
P. Herr, and E. Prono, NASA, June 1967.
NASA-CR-72244, Evaluation and Demonstration of the Use of Crypgenic
Propellants (02/H2) for Reaction Control Systems, Volume II: Experi-
1
mental Evaluations and Demonstrations, N. Rodewald, G. Falkenstein,
P. Herr, and E. Prono, NASA, June 1968.
Tridyne Tank Gun Scavenger Systems (Report in Process), C. Buell and
R. Gurnitz, Rocketdyne, a Division of North American Rockwell Corpora-
tion, Canoga Park, California, 1969.
R-8144 101/102

_J
rrj

k__jAPPENDI X A
TEST SUMMARIES FOR TASKS I AND IV
The test summaries for the experimental evaluation of Tasks I and IV are
included within the following pages of this report.
Qualifying information relative to the Task I tests is briefly presented.
Tests 1-61 were conducted with the purpose to determine the catalyst quanti-
ties for representative chambers. The pressure data in Runs 31-43 are
slightly in error due to zero shifts in the pressure transducers. Tempera-
ture response information is presented in tests 44-81 for the purpose of
comparing experimental results with theoretically predicted results. The
chambers used in tests 61-81 were wound With heaters. These tests provide
information concerning catalyst temperature preconditioning.
Table A-1 presents data for Task I and Table A-2 lists Task IV data.
R-8144 A-I
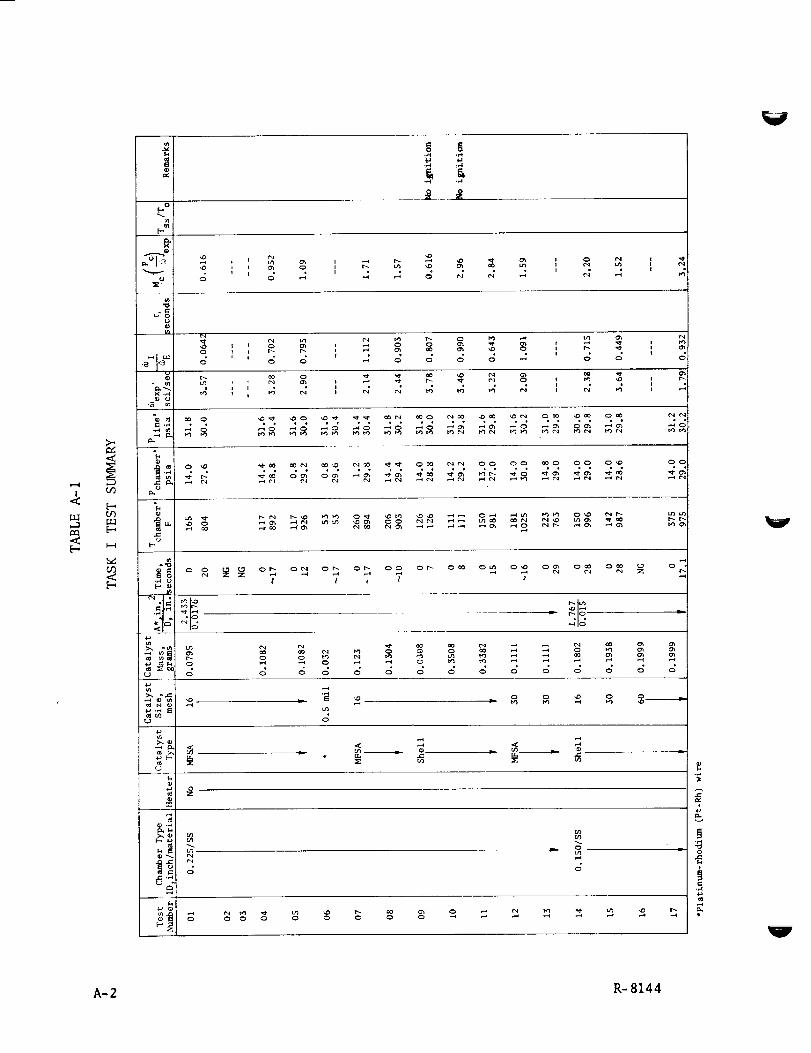
v-..,I
!
.,a:
Lt.]
b-,
.<
t--,(./3
_d(/3.,<t.-,
b-,
•rl" .,-i
dx0
ta
.o ,, ,° °° ,° =- °
(.j
---- _ --.-
r,
i
W
A-2 R-8144
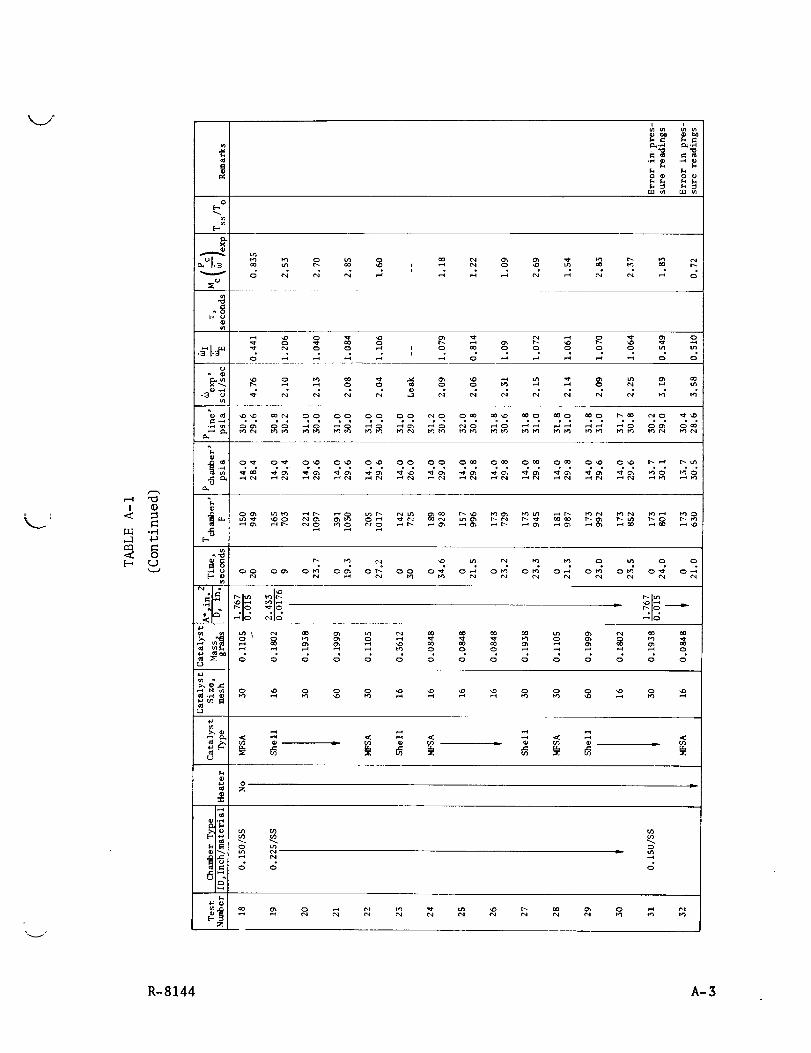
v
LL] ._
[-_ u
E. °
[--
• . o ° • • ° , • ° • °
_ ,_d dd
R-8144 A-3

F- u
o
I
-3 um
= ........................ ', " " : " I a'"" _ 8_ 8_ 8_ _.°_ 8_ 8_ ,_,-°_ _ 8:_ _,_"_ _
_ ......... _ •
< = < < _ : : = .<
J_
V
A-4 R-8144

v
It o
_J
E-?
R-8144 A-5

LL.] 0_
0
[..o
A-6 R-8144

w
"13t ©
U
•_ oF-, t.)
0d
OE-,
_ , , , , , , , , ,
• • • ° • • •
,-........... ,_:,:,: ...:_ _ _ ,_,_ ,_ _._ ,"1,"4
q_
._ .... _ ,-.,.-,•,0_ '_,_'_k'_,,
t,.1
t_
z
R-8144 A-7

I
E_,-I
_0[.q
[--O'3[.I-I[-,
[--O3I
C_
[--b')
0_J
I/I
[--
_.):
1--I
_)e,4-)
h'
-, UII _
°_ _ ._
U
_-_ U0 m
Lu
C_
4-) ._
>C_
._
,In
(--,Z
C_Zt_9
I0
0
II
0<
l,I,l
©
©
c_
c_
U
._
C',,l0 Z
t.9
°_.I
,._ ,._0 0
,.c: ,._ ,.c:U U
_0_1 II• .--I II
OO',(3OO
__' _
I'-_t",- h--
•I¢ _ Cxl (xl
_--I 0,1 ,-_ (N
I I
,,-I ,--I
d dII II
C'_ t,_ C..lt_ C',I h'_ _I"
I--I i.-I
• I I Id_, ,,
MMdd_ d_
_0_ _0__0 O_
©
"0
0-,-II-)
,--I
O_
0oo
L_
I o_ 4-)0,--I II ,--I
UU
LmIV_ U
II "_ ,--'_
V
A-8 R-8144

; APPENDIX B
DISTRIBUTION LIST
NASA Pasadena Office
4800 Oak Grove Drive
Pasadena, California 91103
Attn: Patents and Contracts Management
Jet Propulsion Laboratory4800 Oak Grove Dr.
Pasadena, California 91103
Attn: Philip I. Hoynihan
Chief, Liquid Propulsion Technology RPL
or
Chief, Liquid Experimental Engineering, RPX
Office of Advanced Research and Technology
NASA Headquarters
Washington, D.C. 20546
Director, Technology Utilization Division
Office of Technology Utilization
NASA Headquarters
Washington, D.C. 20546
NASA Scientific and Technical Information FacilityP.O. Box 33
College Park, Naryland 20740
Director, Launch Vehicles and Propulsion
Office of Space Science and Applications
NASA Headquarters
Washington, D.C. 20546
Director, Advanced _lanned Misions
Office of Hanned Space Flight
NASA Headquarters
Washington, D.C. 20546
Mission Analysis Division
NASA A_IES Research Center
Moffett Field, California 24035
i0
3
IU
R-8144 B-1
Ames Research Center
Moffett Field, California
Attn: llans M. blark
94035
Goddard Space Flight Center
Greenbelt, Maryland 20771
Attn: Merland L. Moseson
Code 620
Attn: Dr. R. E. Hunter
Code 734
Jet Propulsion Laboratory
California Institute of Technology
4800 Oak Grove Drive
Pasadena, California 91103
Attn: llenry Burlage, Jr.
Propulsion Div. 38
Langley Research (;enter
Langley Station
ttampton, Virginia 23365
Attn: Ed Cortwright, Director
Lewis Research Center
21000 Brookpark Road
Cleveland, Ohio 44135Attn: Dr. Abe Silverstein, Director
Marshall Space Flight CenterHuntsville, Alabama 35812Attn: ILans G. Paul
Code R- P+VED
Manned Spacecraft Center
lbuston, Texas 77001Attn: J. G. Thibodaux, Jr., Chief
Propulsion Power Division
John F. Kennedy Space Center, NASA
Cocoa Beach, Florida 32931Attn: Dr. Kurt tt. Debus
Aeronautical Systems Division
Air Force Systems Command
Wright-Patterson Air Force Base
Dayton, Ohio 45433
Attn: D. L. Schmidt
Code ASRCNC-2
2
V
=. =
B-2 R-8144

Air Force Missile Development Center
llolloman Air Force Base, New Hexico
Attn: Hajor R. F. Bracken
88330
Air Force Hissile Test Center
Patrick Air Force Base, Florida
Attn: L. J. Ullian
Space and Missile Systems OrganizationAir Force Unit Post Office
Los Angeles, California 90045
Attn: Col. Clark,Technical Data Center
Arnold Engineering Development CenterArnold Air Force Station
Tullahoma, Tennessee 37388Attn: Dr. H. K. Doetsch
Bureau of Naval Weapons
Department of the Navy
Washington, D.C. 20546
At tn: J. KayRq_IS-41
Defense Documentation Center lleadquarters
Cameron Station, Building 55010 Duke Street
Alexandria, Virginia 22314Attn: TISIA
lleadquarters USAF (AFRDDG)
Pentagon
Washington, D.C. 20330
Picatinny Arsenal
Dover, New Jersey 07801
Attn: I. Forsten, Chief
Liquid Propulsion Laboratory
Air Force Rocket Propulsion Laboratory
Research and Technology Division
Air Force Systems Command
Edwards, California 93523
Attn: RPRPD/Hr. H. Main
Copie s
1
R-8144 B-3
U.S. Army Hissile CommandRedstoneArsenalAlabama 35809Attn: Walter '_q_arton
U.S. Naval OrdnanceTest StationChina LakeCalifornia 93557Attn: Chief, Missile Propulsion DivisionCode 4562
Chemical Propulsion Information AgencyApplied Physics Laboratory8621 Georgia AvenueSilver Spring, Haryland 20910Attn : TomReedy
Aeroj et-General CorporationP.O. Box 296Azusa, California 91703Attn: W. L. Rogers
Aeroj et-General CorporationP.O. Box 1947Technical Library, Bldg. 2015, Dept. 2410Sacramento, California 95809Attn: R. Stiff
Space DivisionAeroj et-General Corporation9200 East Flair Dr.E1 Monte, California 91734Attn: S. r4achlawski
Aerospace Corporation2400 East E1 SegundoBoulevardP.O. Box 95085LosAngeles, California 90045Attn: John G. WilderHS-2293
Astrosystems International, Inc.1275 Bloomfield AvenueFairfield, NewJersey 07007Attn: A. Mendenhall
Atlantic Research CorporationEdsaii Roadand Shirley HighwayAlexandria, Virginia 22314Attn: Dr. Ray Friedman
Copies
i
V
B-4 R-8144
k._j
AVCO Systems Division
Wilmington, MassachusettsAttn: Howard B. Winkler
Beech Aircraft CorporationBoulder Division
Box 631
Boulder, Colorado
Attn: J. H. Rodgers
Bell Aerosystems CompanyP.O. Box 1
Buffalo, New York 14240
Attn: W.M. Smith
BELLC@_I
955 L-Enfant Plaza, S.W.
Washington, D.C.
Attn: H. S. London
Bendix Systems Division
Bendix Corporation
3300 Plymouth Road
Ann Arbor, Michigan 48105
Attn: John M. Brueger
Boeing CompanyP.O. Box 3707
Seattle, WashingtonAttn: J. D. Alexander
98124
Boeing Company
1625 K Street, N.W.
Washington, D.C.
Attn: Library
20006
Boeing CompanyP.O. Box 1680
Huntsville, Alabama
Attn: Ted Snow
35801
Missile Division
Chrysler Corporation
P.O. Box 2628
Detroit, Hichigan
Attn: John Gates
48231
Wright Aeronautical Division
Curtiss-Wright Corporation
Woodridge, New Jersey 07075
Attn: G. Kelley
Copies
1
R-8144 B-5

Research CenterFairchild-Hiller CorporationGermantown,MarylandAttn: Ralph Hall
Republic Aviation Corporation
Fairchild-Hiller Corporation
Farmingdale, Long Island, New York
Attn: Library
General Dynamics, Convair Division
Library and Information Services (128-00)
P.O. Box 1128
Los Angels, California 90005Attn: Frank Dore
_]issile and Space Systems Center
General Electric Company
Valley Forge Space Technology CenterP.O. Box 8555
Philadelphia, Pa.
Attn: F. Mezger
F. E. Schultz
Grumman Aircraft Engineering Corp.
Bethpage, Long Island,New York 11714
Attn: Joseph Gavin
Honeywell, Inc.
Aerospace Div.
2600 Ridgway Rd
_linneapolis, Minn.
Attn: Mr. Gordon Harms
Hughes Aircraft Co.
Aerospace GroupCentinela and Teale Streets
Culver City, California 90230
Attn: E. 11. Meier
Vice President and Division Manager
R&D Division
Walter Kidde and Company, Inc.
Aerospace Operations567 Main Street
Believille, New Jersey
Attn: R. J. Hanville
Dir. of Research Engr.
1
B-6 R-8144
Ling-Temco-Vought Corporation
P.O. Box 5907
Dallas, Texas 75222
Attn: Warren G. Trent
Arthur D. Little, Inc.20 Acorn Park
Cambridge, Hassachusetts
Attn: Library
02140
Lockheed Missiles and Space Co.Attn: J. Guill
Technical Information Center
Sunnyvale, California 94088
Lockheed Propulsion Company
P.O. Box iii
Redlands, California 92374
The 3_arquardt Corporation
Attn: R. C. Allen
16555 Saticoy Street
Van Nuys, California 91409
Baltimore Division
Martin Marietta Corporation
Baltimore, _aryland 21203
Attn: J. Calathes
(3214_
Denver Division
Martin Marietta Corporation
P. O. Box 179
Denver, Colorado 80201
Attn: Dr. Horganthaler
A. J. Kullas
Orlando Division
L1artin Harietta Corporation
Box 5837
Orlando, FloridaAttn: J. Ferm
Astropower Laboratory
McDonnell-Douglas Aircraft Company2121 Paularino
Newport Beach, California 92663
Attn: Dr. George Moc
Director, Research
Copies
1
R-8144 B-7

McDonnell-Douglas Aircraft Corporation
P.O. Box 516
Municipal Airport
St. Louis, blissouri 63166
Attn: R.A. Herzmark
Missile and Space Systems Division
McDonnell-Douglas Aircraft Company3000 Ocean Park Boulevard
Santa Monica, California 90406
Attn: R. W. Hallet, Chief Engineer
Adv. Space Tech.
Space Systems DivisionNorth American Rockwell
12214 Lakewood Boulevard
Downey, California 90241
Attn: Library
Rocketdyne ((Library 055--306)
6633 Canoga Avenue
Canoga Park, California 91304
Attn: Dr. R. J. Thompson
S. F. Iacobellis
Northrop Space Laboratories
3401 West Broadway
Hawthorne, California 90250
Attn: Dr. W. Howard
Aeronutronic Division
Philco CorporationFord Road
Newport Beach, California 92663Attn: D.A. Garrison
Astro-Electronics Division
Radio Corporation of America
Princeton, New Jersey 08540
Attn: Y. Brill
Rocket Research Corporation520 South Portland Street
Seattle, Washington 98108
Attn: F. McCullough, Jr.
Copies
1
B-8 R-8144

Sunstrand Aviation
2421 llth Street
Rockford, Illinois 61101
Attn: R. W. Reynolds
Stanford Research Institute
333 Ravenswood Avenue
Menlo Park, California 94025
Attn: Dr. Gerald Marksman
TRW Systems Group
TRW Incorporated
One Space Park
Redondo Beach, CaliforniaAttn: G. W. Elverum
90278
TAPCO Division
TRW, Incorporated23555 Euclid Avenue
Cleveland, Ohio 44117
Attn: P. T. Angell
Reaction Motors Division
_liokol Chemical Corporation
Denville, New Jersey 07832
Attn: Dwight Smith
_liokol Chemical CorporationHuntsville Division
Huntsville, Alabama 35807
Attn: John Goodloe
Research Laboratories
United Aircraft Corporation
400 Hain Street
East Hartford, Conn. 06108
Attn: E. Martin
Hamilton Standard Division
United Aircraft Corporation
Windsor Locks, Conn. 06096
Attn: R. Hatch
United Technology Center587 Methilda Avenue
P.O. Box 358
Sunnyvale, California 94088
Attn: Dr. David Altman
Copies
1
_J
R-8144 B-9

Florida Research and DevelopmentPratt and Whitney AircraftUnited Aircraft CorporationP.0. Box 2691West Palm Beach, Florida 33402Attn: R. J. Coat
Naval Research LaboratoryWashington, D.C.Attn: P. Beal
Copies
1
B-10 R-8144

UNCLASS IF lED
Securit_ Classilfication , )
DOCUMENT CONTROL DATA - R & D(SacuTIfy ¢lastlllcefion el rifle, body of abalracl end indazln_ annotation must be, entered when the overall re_ort Is claaellled_i
. ORIGINATING ACTIVITY (COtlDoFale euthoT) faR. NI[PONT II[CURITY CLASSIFICATION
Rocketdyne, a Division of North American Rockwell [ UNCLASSIFIEDCorporation, 6633 Canoga Avenue, Canoga Park, ,b.a.OU,California 91304
3. REPORT TITL Ir
TRIDYNE ATTITUDE CONTROL THRUSTER INVESTIGATION, FINAL REPORT
4. DESCRIPTIVE NOTES (T_lpe Of Tepott and Inclusive dates)
Final Reports. AUTHOR(Sl fFIra[ name, middle initial, lair name)
Hartley E. Barber; C. H. Buell
S, REPORT DATE 7m. TOTAL NO. OF PAGES 17b. No, oF REds
3 April 1970 132 ] 0Se. CONI"NACT OR GIqANT NO.
NAS7-719
b. PROJECT NO,
c.
d.
SdB. ORIGINATOR'S REPORT NUMI_IIrRIS)
R-8144
Db. OTHER REPORT NOfS) (Any other numbers that mmy be es._l_nedthis report)
0, OISTIqlBUTION S?ATIrM[N?
I, SUPPLEMENTARY NOTES
12, SPONSORING MILITARY ACTIVITY
3 ABSTIqACT
The results of an experimental program to evaluate and demonstrate the
feasibility of a Tridyne attitude control thruster are reported. Substantiating
data are presented for catalyst selection and optimization. Criteria for the
design of a Tridyne attitude control module with preconditioning heaters are
described. The design, fabrication, and testing of a fiightweight thruster
is detaiIed.
DD ,'::r.,14 73I II I I I I II
UNCLASS IFIEDSecurity Ctassificatlnn
UNC LASS IF IED
Security Cl.ssi(ication
KEY WOMD|
Tridyne
Thrust Chamber Assembly
Performance Analys is
Thermal Analysis
Venturi
Catalyst Bed
MF SA
Shell-405
LINK &
mOLE WT
LINK B
ROLE WT
LINK C
ROLE WT
V
UNCLASSIFIED
Security Cilll|(|cition