Embed Size (px)
Citation preview

An empirical regressive model to improvethe metrological performance of mobilespatial coordinate measuring systemsD Maisano and L Mastrogiacomo
Dipartimento di Sistemi di Produzione ed Economia dellrsquoAzienda Politecnico di Torino Torino Italy
The manuscript was received on 15 April 2009 and was accepted after revision for publication on 10 September 2009
DOI 10124309544054JEM1604
Abstract The mobile spatial coordinate measuring system (MScMS) is a system to performdimensional measurements of large-scale objects It consists of a wireless measuring probewith ultrasonic (US) transceivers the position of which is determined using a distributedconstellation of analogous transceivers arranged around the measuring area The principle is tomeasure the time-of-flight (TOF) of the US signals exchanged between pairs of transceiversand consequently to obtain an estimate of their distances The accuracy of TOF measurementscan be attributed to many factors the most influential are those associated with US signalattenuationThe purpose of this paper is to build an experimental correction model to reduce the MScMSrsquo
error in TOF measurements First a two-way block design which is based on exploratoryexperiments is created to show that transmitterndashreceiver distance and relative orientationbetween US transceivers have significant effects on TOF measurement error Next an empiricalregressive model is constructed on the basis of additional detailed experiments After per-forming an extensive experimental validation the model is automatically implementedby MScMS with an iterative procedure The most important benefit of such a model isan important reduction in the dispersion and an improved accuracy associated with TOFmeasurements
Keywords large-scale metrology time-of-flight ultrasound attenuation factorial experimentexperimental model
1 INTRODUCTION
The mobile spatial coordinate measuring system(MScMS) is a distributed wireless-sensor-networkbased system designed to perform dimensionalmeasurements on large-scale objects [1] The field oflarge-scale metrology can be defined as the metrol-ogy of large machines and structures specificallylsquothe metrology of objects in which the linear dimen-sions range from tens to hundreds of metersrsquo [2]Typical large objects that can be measured usingMScMS are airplane wings fuselages longerons ofrailway vehicles and boat parts
MScMS consists of a wireless measuring probewith two ultrasonic (US) transceivers the position ofwhich is determined using a distributed constellationof other transceivers arranged around the measuringarea These devices known as Crickets transmit USsignals to each other and measure their time-of-flight(TOF) in order to determine the mutual distances [3]Using this information MScMS is able to calculatethe Cartesian coordinates of the objectrsquos surfacepoints touched by the probe
The introduction of distributed measuring systemssuch as MScMS will probably have important effectson simplifying the current measuring practiceswithin large-scale industrial metrology [4] Thistendency is confirmed by other recent distributedmeasuring systems such as the Indoor-GPS and theThird Tech Hi-Ball [5ndash8] All these systems havea constellation of distributed devices acting as
Corresponding author Production Systems and Business
Economics Politecnico di Torino Corso Duca degli Abruzzi
24 Torino 10129 Italy
email domenicomaisanopolitoit
JEM1604 Proc IMechE Vol 224 Part B J Engineering Manufacture
663
reference points for the location of a wireless mea-suring probe
Cricket devices are relatively simple and lowpriced but not very accurate in estimating themutual distances The basic reason is that ultrasoundtechnology can be subject to many error sources asbelow [1]
1 Speed of sound (s) dependence on environmentalconditions ndash air temperature (T) and relativehumidity (RH) which can exhibit both temporaland spatial variations within large workingvolumes Since s value makes it possible to turnTOFs into distances it is required to be oftenupdated depending on the time and the positionA partial solution to this problem is to use thetemperature information evaluated by embeddedthermometers at the Cricket receivers and toperiodically update s using an experimental rela-tion sfrac14 s(T) [9]
2 Ultrasound reflections or diffraction due to thepresence of obstacles or external uncontrolledsources of ultrasounds (key jingling neon blink-ing etc) In order to protect MScMS from theseerror sources some statistical tests for onlinediagnostics are implemented [10]
3 Non-punctiform dimension of US transceiversThis makes it difficult to determine the exactpoint of departurearrival of a US signal exchan-ged between a pair of Crickets and consequentlyto obtain a precise estimate of their distance [1]
4 The technique used by Cricket US transceivers fordetecting the US signal known as lsquothresholdingrsquois simple to implement but has some drawbacks[11 12] More precisely TOF measurements arecorrupted by the US signal attenuation whichmay have two major sources
(a) transmitterndashreceiver distance(b) transceiversrsquo relative orientation as deter-
mined by some experimental tests [13]
Measurement error is affected by many differentfactors however the most important effects are thoserelated to the sources of US signal attenuation This isdirectly caused by the thresholding detection methodof ultrasound [13] Other more refined rangingmethods are based on phase-detection with fixed-frequency signals and with frequency-modulatedsignals The implementation of these techniqueshowever would require rather complexmodificationsto the current Cricket hardware and firmware such asthe introduction of a digital signal processor to pro-cess the phase measurements [11 14ndash18]
The goal of this paper is to build a two-factorexperimental model to improve the accuracy in theMScMSsrsquo TOF measurements without any mod-ification to the current Cricket hardware A simpler
model was proposed by Moore et al and imple-mented in a previous version of Cricket firmware[21] However this model is not very effective inreducing the TOFmeasurement error derived from theattenuation because it takes account of the contribu-tion related to the transceiversrsquo distance but not thatrelated to the transceiversrsquo relative orientation
The new proposed model can be successfully usedat two different stages
1 In the system set-up so as to improve the locationof the constellation of devices (an operation thathas necessarily to be performed before measure-ments) [20]
2 During measurements so as to improve theaccuracy in the location of the wireless probewhich is used to determine the spatial coordinatesof the desired points from the measured objectsurface
The experimental construction of the model isperformed following an analytical protocol in whichthe US signal TOF is identified as the key factor(dependent variable) to be examined Next twoindependent variables affecting TOF (transceiversrsquodistance and relative orientation) are varied in orderto create a two-way block design with repetition AirT and RH are fixed and the presentation order iscompletely randomized to minimize order-of-testingeffects After showing that the two independentvariables have a significant effect on the TOF mea-surement error additional experiments are per-formed and a model is constructed by performing alinear regression based on the experimental resultsFinally the empirical model is implemented andvalidated
The paper is organized into four sections Section 2briefly describes the MScMS structure and featuresfocusing on the most critical aspects from themetrological performance viewpoint Section 3 pro-vides a detailed description of the experimental set-up used to determine the input information for con-structing the empirical model Section 4 discussesand analyses the experimental results In section 5the model is constructed on the basis of experimentaldata An iterative operational procedure for themodel online implementation is presented insection 6 The same section presents and discussesthe model validation based on further experimentaltests Finally the conclusions and future direction ofthis research are given
2 SHORT DESCRIPTION AND CRITICALASPECTS OF MSCMS
The MScMS prototype consists of three components(Fig 1)
Proc IMechE Vol 224 Part B J Engineering Manufacture JEM1604
664 D Maisano and L Mastrogiacomo
1 A constellation (network) of Cricket devicesarranged around the working area
2 A measuring probe to communicate with the con-stellation of devices and obtain the coordinates(x y z) of the touched points More precisely themeasuring probe is a mobile system equipped witha tip to touch the points of the measured objectsand a trigger which is pulled to calculate and storethe current coordinates of the probe tip The con-stellation Crickets act as reference points for locat-ing the measuring probe [20 21]
3 A computing system to receive and process datasent by the measuring probe in order to evaluateobject geometrical features
Cricket devices are developed by the Massachu-setts Institute of Technology and produced byCrossbow [3 22] Being quite small light andpotentially cheap they are compatible with a varietyof network configurations [12 23] All Crickets haveradiofrequency (RF) and US transceivers (Fig 2)They repeatedly communicate and calculate theirmutual distances by measuring the TOF of the USsignals exchanged [24] TOF is multiplied by the svalue to obtain the distance between the two sensorsThanks to the RF communication Crickets rapidlyshare the information about their mutual distancesCrickets being equipped with embedded processorand memory can be programmed by the user andcustomized depending on the communication logicto implement This flexibility as well as the relativelow cost is the main reason for their use in MScMSprototype design
The measuring probe contains two Cricket deviceswhich repeatedly determine their distance from theconstellation Crickets A Bluetooth transmitter isconnected to one of the probersquos Crickets in order tosend this distance information to a PC which isequipped with an ad hoc software
Before starting measurements the constellationCrickets are placed around the measuring area so
that the region of interest is completely covered withan overlap of at least three devices [25] Next con-stellation Crickets have to be localized becausemeasurements are possible only if their position isknown In order to reduce manual operations amethod for a semi-automatic localization has beenimplemented [1 19 25 26]
Measurements consist of three phases
(a) the mobile probe is used to touch the desiredpoints from the part surface
(b) the probe trigger is pulled and data are sent viaBluetooth to the PC
(c) the Cartesian coordinates (x y z) of the pointsare calculated by the PC The PC then uses theCartesian points to generate a geometrical modelof the measured objectrsquos surface [1 19]
At the time of writing the MScMS accuracy indetermining the spatial position of the measuredpoints may be improved The most critical aspectsinfluencing the current systemrsquos metrological perfor-mance are illustrated in sections 21 to 24 [1]
21 Cones of vision
While the RF sensorrsquos communication volume isalmost omnidirectional and up to 25m US sensorshave a communication volume limited by lsquocones ofvisionrsquo with an opening angle of approximately 170
and a range of approximately 6m (Fig 3) Signalstrength inside the cones of vision may be mostaffected by two factors the distance and the anglefrom the transmitterrsquos surface Outside the conessignal strength drops to 1 per cent of the maximumvalue [27 28]
22 Number of constellation devices
For MScMS the number of constellation devices isstrictly related to the measurement volume and theircommunication range Some tests show that a cov-erage of an indoor working volume is achievable witha network density of at least 06 devicesm2 con-sidering a plant layout [1] It should be noticed thatthe number of constellation devices lsquoseenrsquo by the
Fig 1 MScMS representation scheme Fig 2 Cricket device (crossbow technology) [3]
JEM1604 Proc IMechE Vol 224 Part B J Engineering Manufacture
An empirical regressive model to improve metrological performance 665
sensors has a strong influence on the positioningaccuracy This particular aspect is studied throughpreliminary tests combined with simulation [4]
Specifically 30 points ndash with a-priori known posi-tions ndash are measured (repeating the measurement150 times per point) while the number of constella-tion devices for the desired points is deliberatelychanged from four to 13 Coordinatesrsquo position errors(residuals) are determined considering the differencebetween the lsquotruersquo coordinatesrsquo position and thecoordinatesrsquo position of the points as calculated bytrilateration The coordinatesrsquo position errors relatedto all the 30 points show a normally distributed pat-tern verified by the AndersonndashDarling normality testat plt 005
The result of the simulation experiment shows thatwhen only four devices are used the uncertainty inthe measured points is very high This uncertaintydecreases to a great extent (for example by a factor ofalmost three for the Z axis) when six devices are usedfor measuring the same point When the seventhdevice is added the improvement in the accuracyreduces although still significant By adding theeighth or more transmitters the improvement isshown to be small and negligible This behaviour isillustrated in Fig 4 in which standard deviations (sxsy sz) related to the coordinatesrsquo positioning errorsare plotted based on the number of devices of theconstellation
Notice that the value of sz is basically lower than sx
and sy This behaviour is due to the geometric con-figuration of the constellation devices in generalthey are mounted on the ceiling or at the top of themeasuring area and for this reason they can beconsidered as approximately placed on a plane (XY)perpendicular to the vertical (Z) axis [7]
23 Error transmission in the location ofCricket devices
Spatial location of each probersquos Cricket is achievedusing a trilateration technique [29] The trilaterationproblem can be solved numerically by solving asystem of n non-linear equations It is important toremark that input data ndash (a) constellation devicecoordinates and (b) measured distances from thedevice to locate and the constellation devices ndash areaffected by errors Specifically the positioning errorof the constellation devices depends on the accuracyof the location procedure implemented On the otherhand the distance error depends on the measure-ment error of the corresponding TOF
Currently the constellation devicesrsquo localization isperformed using a reference artefact equipped withseveral Cricket devices [1] This artefact is placed indifferent positions within the measuring area Foreach of these positions the TOFs between constella-tion Crickets and the artefactrsquos Crickets are collectedNext they are used so as to locate the whole con-stellation by an ad hoc bundle adjustment algorithm[19 25] Thus the positioning error of the constella-tion devices is also influenced by the error in TOFmeasurements
Summarizing the two most important error sour-ces in determining the position of a device are (a) theconstellation devices positioning error and (b) theerror in the corresponding distance measurements
24 US signal detection technique
Several methods have been developed for detectingUS signals [14 15] Thresholding is the simplest andthe most widely used ndash both from the hardware andthe software points of view [16] In this methodimplemented by Crickets the receiver electric outputsignal is compared with a threshold level (65mV for
Fig 4 Influence of the transmittersrsquo number on the position error for MScMS
Fig 3 Representation scheme of the US transmitterslsquocones of visionrsquo
Proc IMechE Vol 224 Part B J Engineering Manufacture JEM1604
666 D Maisano and L Mastrogiacomo
the Crickets) such that the arrival of the wave isacknowledged when the signal reaches this level(Fig 5)
This method depends on the amplitude of thepulse received the larger the signal amplitude thesmaller the time taken by the signal before reachingthe threshold For example in Fig 5 when the sig-nal has a full amplitude the detection threshold isfirst exceeded by the second peak of the ultrasoundwaveform When the waveform is attenuated by afactor of 05 (half the amplitude signal) the detec-tion threshold is first exceeded by the third peak ofthe ultrasound waveform If the channel attenua-tion is quite significant then it may cause thethreshold to be exceeded a few periods late insteadof just one period late Consider that at 40 kHz theperiod is 25ms so the error will be in integer mul-tiples of approximately 25ms The error in the TOFevaluation results in an error in the distance esti-mation The s value is approximately 340mstherefore one ultrasound time period correspondsto a distance of about 25 3401000frac14 85mm Inpractice the threshold can be exceeded by up tofour periods late so the distance overestimationcan be up to 3ndash4 cm
Typical sources of attenuation are [3 28]
(a) distance between transceivers (d)(b) angle of the transmitter with respect to the
transceiver distance (transmitter misalignmentangle u(t) in Fig 6)
(c) angle of one receiver with respect to the trans-ceiver distance (receiver misalignment angle u(r)
in Figure 6)
In general the larger these three factors the largerthe US signal attenuation
3 DESCRIPTION OF THE EXPERIMENTS
The goal of this work is to obtain an experimentalmodel to correct the TOF-Error derived from themost influential sources of US signal attenuationExperimental data are collected in the same opera-tional conditions in which the correction model willbe used [31] more precisely constellation devicesare assumed to be parallel with respect to the devicesto locate In the current practice this condition isgenerally satisfied because constellation devices arearranged on the ceiling at the top of the measuringarea and Crickets to locate are generally mounted onthe measuring probe and oriented upwards (Fig 7)This configuration is a practical solution to obtain agood coverage and to maximize the measuringvolume [28]
In this configuration the misalignment anglesrelated to a constellation device (Ci) and the onerelated to the devices to locate with respect to their
Fig 5 Graphical representation of thresholding detectionA minimum number of cycles are necessary to bringthe receiver to steady state conditions (transienttime at the receiver) [30] The error in the distancemeasurement is dependent upon the received USsignal amplitude The time taken for the receivedsignal to reach the threshold is dependent on itsamplitude
USReceiverTransmitter
d
θ(t) θ(r)
Fig 6 Illustration of the most important sources ofattenuation transceiver distance (d) transmittermisalignment angle u(t) and receiver misalignmentangle u(r)
Fig 7 Typical arrangement of the constellation devices(C1Cn) To obtain a good coverage constellationdevices are placed at the top of the measuring areaparallel to the ceiling With this configurationCricket to locate (P) should be oriented upwardsThe formula for calculating the misalignment angle(ui) is used in the iterative procedure for the TOF-Error correction reported in section 61
JEM1604 Proc IMechE Vol 224 Part B J Engineering Manufacture
An empirical regressive model to improve metrological performance 667
distance is the same (ui in Fig 7) Figure 8 illustratesthe experimental set-up
(a) transmitter and receiver are positioned facingeach other
(b) the distance (d ndash first factor) between transceiversis known
(c) transmitter face is parallel with receiver face butthey are not perpendicular with respect tothe direction of the distance A misalignmentangle (u ndash second factor) is introduced
As shown in Fig 8 the reference point for deter-mining the transceiversrsquo distance and misalignmentangle corresponds to the centre of the US transceivercoverrsquos face Distances and angles are measuredusing a set of calibrated reference bars and a preci-sion goniometer [32]
Experiments are organized in two steps
1 Exploratory experiments Based on a limitednumber of observations this phase is aimed atinvestigating whether the two factors of interesthave significant effects on the TOF measure-ments To that purpose an experimental factorialplan is built measuring TOF and changing thefactors at different levels Table 1 provides asummary of the factor level combinations
2 Detailed experiments The factor working domainand the number of observations are increased soas to build an empirical regressive model repre-senting the two factorsrsquo effect Table 2 containsthe list of observations considered in this phase
For each of the combinations in Tables 1 and 250 repeated measurements of the TOF are performed
The response variable considered in the factorialplan is the TOF-Error which is defined as follows
TOF-Errorfrac14ethTOF Expected-TOFTHORN eth1THORN
beingTOF TOF measured by pair of CricketsExpected-TOFfrac14ds where d is the transceiversknown distance and s is the speed of sound in theexperimental conditions (with air temperatureTfrac14 21 C and relative humidity RHfrac14 27 per cents 344ms)TOF-Error is used as an indicator of the error inTOF evaluation
4 ANALYSIS OF THE EXPERIMENTAL RESULTS
41 Results of the exploratory experimentsand factorial analysis
Analysing the outputs of the exploratory factorialexperiments notice that TOF-Error dispersion chan-ges depending on the average of the TOF-Error valueThis behaviour is illustrated on Fig 9 For each of the36 factorial plan combinations the average TOF-Error and the respective deviations ndash calculated usingthe corresponding 50 repeated measurements ndash areplotted Notice that the larger the average TOF-Errorvalue the larger the individual measurement disper-sion The non-homogeneity of the TOF-Error var-iance is also tested through the Levene statistical testat plt 005
Since the assumption of homogeneity of TOF-Errorvariances is violated the Analysis of Variance(ANOVA) cannot be properly applied in order toverify whether factors have a significant effect on theresponse (TOF-Error) [31] The usual approach todealing with non-homogeneous variance is to apply a
Table 1 List of the experiments carried out in theexploratory phase
Factors
1st ndash Distance betweentransceivers (d)
2nd ndash Transceivermisalignment angle (u)
1000 02000 153000 30
45
ndash all the possible 3 middot 4frac14 12 different combinations are carried outin random order
ndash for each combination TOF measurements are repeated 50 timesndash all the 12 combinations above are replicated three times
consequently the total number of combinations is 36 The testsequence is randomized using the random number generatorprovided by Minitab
Levels
Fig 8 Experimental set-up
Table 2 List of the experiments carried out in the detailphase
Factors
1st ndash Distance betweentransceivers (d)
2nd ndash Transceivermisalignment angle (u)
500 01000 151500 302000 452500 60300035004000
ndash all the possible 8 middot5frac14 40 different combinations are carried out inrandom order
ndash for each combination TOF measurements are repeated 50 times
Levels
Proc IMechE Vol 224 Part B J Engineering Manufacture JEM1604
668 D Maisano and L Mastrogiacomo
variance-stabilizing transformation In this approachthe conclusions of the analysis of variance will applyto the transformed populations The most commontransformation is the exponential yfrac14 yl where l isthe parameter of the transformation [33 34]
The BoxndashCox method is used to select l Theexperimenter can analyse the data using
Ry as the
transformed response (hereafter it will be identifiedas lsquoTransformed TOF-Errorrsquo) In the authorsrsquo specificcase the obtained transformation parameter islfrac14 017 Applying Levenersquos test to the transformedresponse the resulting variance no longer violatesthe testrsquos null hypothesis of homogeneity To con-struct a model in terms of the original response theopposite change of variable yeth THORN1l - is performed
The main effects plot representing the singleexamined factors effect on the TOF-Error is shown inFig 10
The points in the plot are the means of theresponse variable at the various levels of each factor(for each level of the examined factor the mean iscalculated averaging all the responses obtainedchanging the remaining factor) A reference line isdrawn at the grand mean of the response data Thiskind of plot is useful for comparing magnitudes ofmain effects The qualitative result is that d and u
have an important effectIn order to qualitatively judge the presence of
interactions among the two factors an InteractionPlot is constructed in Fig 11 Interaction between twofactors is present when the response at a factor leveldepends upon the level(s) of the other factor Parallelcurves in an interactions plot indicate no interactionThe greater the departure of the curves from theparallel state the higher the degree of interaction[31]
Figure 11 shows that the two-way interactions arenot very pronounced and that the main effects pre-sented in Fig 10 are consistent within each factorlevel
Results of the factorial plan are examined byANOVA (Fig 12)
In the ANOVA the variance related to the responseis partitioned into contributions owing to the differ-ent factors and their interactions Results of anANOVA can be considered reliable as long as thefollowing assumptions are met
(a) the response variable is normally distributed(b) data are independent(c) variances of populations are equal
After applying the BoxndashCox response transforma-tion all these assumptions are satisfied In particularthe assumption of normal distribution is verified bythe AndersonndashDarling normality test at plt 005
Analysing the ANOVA results all two factors andtheir two-way interactions are found to be significantbased on Fisherrsquos test at plt 005 With regard to sin-gle factors both d and u have an important effectThis is consistent with the main effects plot of Fig 10With regard to the factor interaction it is also statis-tically significant too (plt 005) Thus it can be statedthat the composition of large misalignment angles (u)and large distances (d) produces TOF-Errors whichare larger than those obtained by adding the effects ofthe single factors taken separately
Fig 9 TOF-Error deviation versus average TOF-Error For each of the 36 factors combinations variablesare calculated using the corresponding 50 repeated TOF-Error measurements
300020001000
250
245
240
235
230
4530150
d [mm]
na
eM
[degrees]
Main Effects Plot for Avg Transformed TOF-Error
θ
rorrE-
FO
T demrofsnar
T ]sae
m fo tinu demrofsnart[
Fig 10 Main effect plot for means related to the twoexamined factors d (transmitterndashreceiver dis-tance) and u (misalignment angle)
JEM1604 Proc IMechE Vol 224 Part B J Engineering Manufacture
An empirical regressive model to improve metrological performance 669
42 Results of the detailed experiments
Results of detailed experiments are graphicallyrepresented in Fig 13 They represent the averageTOF-Error and the corresponding standard deviation(calculated for each combination of factors usingthe 50 repeated measurements) depending on d andu From the two graphs in Fig 13 it can be noticedthat TOF-Error increases with an increase in d and u
Again TOF-Error is always positive because of theTOF overestimation due to the signal attenuation(which is proportional to d and u) In particular therelationship between TOF-Error and d appearsapproximately linear while the relationship betweenTOF-Error and u appears approximately quadratic
Analysing the graphs in Fig 13 notice that TOF-Error measurements cannot be performed when thetwo factors have both large values ndash ie when ufrac14 45
4530150
255
250
245
240
235
230
225
220
[degrees]
na
eM
100020003000
d [mm]
Interaction Plot for Avg Transformed TOF-Error
θ
rorrE-
FO
T d em ro fsnar
T
]saem fo ti nu de
mr of snar t[
Fig 11 Interaction plot for transformed TOF-Error considering the two factors (d and u)
General Linear Model Transformed TOF-error versus d and θ
Factor Type Levels Values d fixed 3 1000 2000 3000 θ fixed 7 0 15 30 45
Analysis of Variance for Transformed TOF-Error
Source DF Seq SS Adj SS Adj MS F P d 2 0078990 0078990 0039495 485941 0000 θ 3 0243035 0243035 0081012 996754 0000 dθ 6 0003364 0003364 0000561 6897 0000 Error 24 0000195 0000195 0000008 Total 35 0325583
single factor effect
interactions between factors
Fig 12 ANOVA applied to the (transformed) response of the factorial plan
Average TOF-Error vs Distance between Transceivers
100
120
140
160
180
200
220
240
260
280
300
320
500 1000 1500 2000 2500 3000 3500 4000Distance between Transceivers (d) [mm]
[ rorrE-FOT ega re v
Amicro
]s
= 00 degrees = 15 degrees = 30 degrees = 45 degrees = 60 degrees
θθθθθ
100
120
140
160
180
200
220
240
260
280
300
320
0 15 30 45 60Misalignment Angle (θ) [degrees]
[ rorrE-FOT egarev
Amicro
]s
d = 500 mmd = 1000 mmd = 1500 mmd = 2000 mmd = 2500 mmd = 3000 mmd = 3500 mmd = 4000 mm
Average TOF-Error vs Misaligment Angle
4
5
6
7
8
9
10
11
12
13
14
15
0 15 30 45 60Misalignment Angle (θ) [degrees]
d = 500 mmd = 1000 mmd = 1500 mmd = 2000 mmd = 2500 mmd = 3000 mmd = 3500 mmd = 4000 mm
TOF-Error Standard Deviation vs Misaligment Angle
[ noitaiveD dradnatS rorrE-F
OTmicro
]s
TOF-Error Standard Deviation vs Distance between Transceivers
4
5
6
7
8
9
10
11
12
13
14
15
16
500 1000 1500 2000 2500 3000 3500 4000Distance between Transceivers (d) [mm]
= 00 degrees = 15 degrees = 30 degrees = 45 degrees = 60 degrees
θθθθθ
[ noitaiveD dradnatS rorrE-F
OTmicro
]s
Fig 13 Average value of the TOF-Error and standard deviation depending on the misalignment angle (u)for different transmitterndashreceiver distances (d)
Proc IMechE Vol 224 Part B J Engineering Manufacture JEM1604
670 D Maisano and L Mastrogiacomo
and dgt 3500mm and when ufrac14 60 and dgt 1500mm(see also Table 3) In fact in all these conditionstransmitter and receiver are not able to communicatebecause of the strong signal attenuation (receiverbeyond the transmitterrsquos cone of vision)
5 MODEL CONSTRUCTION
In this section an experimental regressive model tolink TOF-Error with u and d is proposed The totalnumber of observations that are used to construct themodel is given by
37ethcombinationsTHORN 50ethrepetitions per
combinationTHORN frac14 1850 TOFethmeasurementsTHORN eth2THORN
Analysing the graph patterns in Fig 13 and based onthe knowledge of the physical phenomenon investi-gated a second order polynomial model is chosen(see equation (3)) [35] This model makes it possibleto evaluate the factors interaction [13]
TOF-Error frac14 C1thornC2 dthorn C3 uthorn C4 d2
thornC5 middot u2thornC6 d u
eth3THORN
With the support of the Minitab Best-Subsets tool itis found that the terms with coefficients C3 and C4
have slightly influential contributions (see results inFig 14) Also this is confirmed by an initial regres-sion based on the model in equation 3 Conse-quently terms with coefficients C3 and C4 areremoved from the model and a new second ordermodel representing a compromise solution between
best-fitting and reduction of the number of pre-dictors is constructed using equation (4)
TOF-Error frac14 C1 thorn C2 dthorn C5 u2 thorn C6 d u eth4THORN
The model requires the information about the dis-tance and the misalignment angle related to each pairof Cricket devices Being linear with respect to d andquadratic with respect to u the model well representsthe graph patterns in Fig 13 It is important to noticethe presence of the last term (C6du) which accountsfor the interaction between the two factors
Since the variance of the response variable (TOF-Error) is not homogeneous a simple linear regressionis not perfectly suitable In particular hetero-scedasticity may have the effect of giving too muchweight to subset of the data where the error varianceis larger when estimating coefficients To reducestandard error associated with coefficient estimatesin regression in which homoscedasticity is violated acommon approach is to weight observations by thereciprocal of the estimated point variance [31 3437] For each observation the variance is calculatedusing the 50 repetitions associated to the corre-sponding factor combination (numerical values ofthe s related to each factor combination are reportedin Figure 13) The final regression equation is
TOF-Error frac14 846thorn 00207dthorn00314u2 thorn 0000336du
eth5THORN
In equation (5) TOF-Error d and u are respectivelyexpressed in msmm and degrees
This model can be useful for correcting the sys-tematic error in TOF measurements The variation inthe response standard deviation being not very largeit was checked that equation (5) is not very dissimilarto the result that would be obtained by a simple(non-weighted) linear regression
The regression output is quantitatively examinedby an ANOVA (Fig 15) Based on a t test at plt 005 itcan be deduced that all the terms in equation (5) aresignificant Examining the residuals they can be
Table 3 Communication between transceivers depend-ing on factors d and q For some particular com-binations of the two factors transceivers are notable to communicate and ndash consequently ndash theexperimental table cannot be completely filledMeasurements can be performed precisely onlyfor 37 of 45 (95) combinations When thetwo factors both have large values ndash ie whenqfrac14 45 and dgt 3500mm and when qfrac14 60 anddgt 1500mm ndash measurements are not feasible
u [degrees]
0 15 30 45 60
500 1000 1500 2000 szlig2500 szlig3000 szlig3500 szlig4000 szlig szlig4500 szlig szlig
measurement performed szligmeasurement not feasible
d[m
m]
Best Subsets RegressionAverage TOF-Error versus d θθ d2 θ2 and dmiddotθ Vars R-Sq R-Sq(adj) Mallows Cp S d θ d2 θ2 dmiddotθ 1 721 712 1556 28715 X 1 554 540 2668 36307 X 2 926 921 214 15052 X X 2 901 895 377 17359 X X 3 950 945 43 11785 X X X 3 943 937 122 13449 X X X 4 957 952 73 12566 X X X X 4 955 948 66 12167 X X X X 5 958 950 64 11922 X X X X X
(C2) (C3) (C4) (C5) (C6)
Fig 14 Results obtained from Minitab Best-Subsets toolThe above table suggests that the model with thethree terms d u2 and du is relatively precise andunbiased because its Mallowsrsquo Cp (43) is closest tothe number of predictors plus the constant (4) [36]
JEM1604 Proc IMechE Vol 224 Part B J Engineering Manufacture
An empirical regressive model to improve metrological performance 671
considered as randomly distributed by the Anderson-Darling normality test at plt 005 The model fits theexperimental data well
6 MODEL IMPLEMENTATION AND VALIDATION
61 Model online implementation
Considering that reference devices are generally par-allel to the device to locate both during theconstellation location and measurements the experi-mental model can be implemented online by the fol-lowing iterative procedure (see flow chart in Fig 16)
1 TOFs between the device to locate (P) and thereference devices with known position (C1ndashCn) aremeasured and then the iteration number (j) isinitialized to 1
2 Corresponding distances are calculated as di(j)
frac14TOFi(j)s Superscript lsquo(j)rsquo indicates that the jth
iteration is considered Since TOFi(j) is generally
overestimated because of the attenuation di(j) will
of course result in being overestimated3 Device P (with coordinates u(j) v(j) and w(j)) is
located through a trilateration using the distancesfrom at least three reference devices with knownposition (xi yi zi)
4 Misalignment angles (ui(j)) between device P and
each of the reference devices ndash with which itcommunicates ndash are calculated Because deviceshave approximately parallel faces equation (6)can be used (Fig 7)
uethjTHORNi frac14 cos1 ziwethjTHORN
di
eth6THORN
5 Correction of the TOFs associated with each of thereference devices using the following formula
TOFethjthorn1THORNi frac14 TOF
eth1THORNi TOF-Error
ethjTHORNi eth7THORN
where TOF-Errori(j) (function of di
(j) and ui(j))
is calculated using the empirical formula in Equ-ation 5
6 New estimation of the distances (di(jthorn 1)) between
P and the devices with known position andrepetition of the procedure (steps 2 to 6 replacingsuperscripts j with jthorn 1)
The same procedure can be iterated until changes inthe calculated position of P are not significant Con-ventionally this condition is reached when the dis-tance between the current position of P and theposition in the previous iteration is smaller than1mm This algorithm is designed to guarantee con-vergence to a stable solution In this sense this wasconfirmed to give good results Typically no morethan three iterations were necessary for the algorithmto converge Using a standard PC the total time tocomplete the procedure was no larger than 02 stherefore it is fully compatible with the Cricketsrsquo TOFmeasurement sampling period of 05 s
62 Model validation
Additional measurements were performed so as toexperimentally validate the empirical regressivemodelin conditions that are representative of the typicalworking environment At this stage a constellation ofdevices and a set of devices to be measured within themeasuring volume were considered It is important to
(Weighted) Regression Analysis TOF-Error versus d θ and dmiddotθ
The regression equation is TOF-Error = 846 + 00207middotd + 00314middotθ2 + 0000336middotdmiddotθ
Predictor Coef SE Coef T P Constant 846410 06040 14014 0000 d 00206548 00002960 6978 0000 θ2 00314441 00004298 7315 0000 dmiddotθ 000033568 000001144 2935 0000
S = 165608 R-Sq = 939 R-Sq(adj) = 938
Analysis of Variance
Source DF SS MS F P Regression 3 71072 23691 863796 0000 Residual Error 1696 4651 3 Total 1699 75723
Source DF Seq SS d 1 18037 θ2 1 50672 dmiddotθ 1 2362
Fig 15 Results of the (weighted) regression analysis
Initialization of the iteration number j=1
Is the current position of P significantly changed with
respect to the previous oneNO YES
TOFs are turned into distances (di(j)) through the speed of
sound
Localization of P by trilateration using the distances (di(j))
Calculation of the misalignment angle (θi) related to each reference device (Ci) using the formula in Eq 6
Application of the experimental model in order to ldquocorrectrdquo TOFs between P and the reference devices New iteration
of the algorithm (j=j+1)
END
Measurement of the TOFs between the point to locate (P) and the reference devices (Ci)
1
2
3
4
5
Fig 16 Flowchart related to the iterative procedure for themodel online implementation
Proc IMechE Vol 224 Part B J Engineering Manufacture JEM1604
672 D Maisano and L Mastrogiacomo
remark that the model is based on the assumptionthat all the Crickets have parallel faces Unfortunatelythis condition cannot be perfectly satisfied in a realmeasurement context for two reasons
1 Devices of the constellation are not perfectlyparallel to each other This condition would slowdown and complicate the manual arrangementof constellation devices and compromise theMScMSsrsquo easy start-up [1] It was experienced thatin a typical (quick) arrangement misalignmentsof constellation devices with respect to the lsquoidealrsquoparallelism condition are included within 3 [23]
2 Devices to be measured which are mounted onthe mobile probe are not necessarily parallel toconstellation devices In fact during the mea-surement task it is very difficult to keep themobile probe always horizontal and facing con-stellation devices due to the shape of the mea-sured object The mobile probersquos misalignmentwith respect to the lsquoidealrsquo orientation was seen tobe up to 10ndash15 [23]
Thus to test the efficiency of the proposed modelin realistic measurement conditions small mis-alignments ndash of the same amount as before ndash weredeliberately introduced both for constellation devi-ces and devices to be measured More preciselymeasurements were carried out in the followingway
bull A limited indoor measuring volume of about 24 m3
(4 middot 3 middot 2) is considered Eight constellationdevices are distributed at the top of the volumeand a planar density of about 07 devicesm2
(Fig 17) The rough position of each device is
randomly decided using a random numbergenerator
Then in line with the previous experiments (Fig 8)the lsquoreferencersquo position of each device ndash the Cartesiancoordinates of the point coinciding with the centre ofthe transceiver coverrsquos face ndash is calculated using alaser-tracker Because of the transceiverrsquos relativelysmall dimensions it is difficult to measure thecylindrical cover touching it directly with the laser-tracker (catrsquos-eye) retroreflector Therefore mea-surements are performed using a support lsquocaprsquo ndash iean auxiliary component consisting of a hollow cylin-der surmounted by a hemisphere More precisely theinternal hole of the cap fits the US transducerrsquos coverso that when the transducer is lsquocappedrsquo the centre ofthe coverrsquos face coincides with the centre of the caphemisphere (Fig 18(b)) For the Crickets orienteddownwards ie those arranged on the ceiling the capis fixed to the Cricket board using some plasticineThe cap is made of aluminium and manufacturedusing a CNC turning lathe with typical uncertainty ofapproximately a few hundredths of a millimetre
The measurement procedure consists in
(a) lsquocappingrsquo the transducer with the support cap(b) measuring several points (ie four or more)
which are uniformly distributed on the hemi-sphere surface using the laser-tracker retro-reflector (Fig 18(a))
(c) determining the coordinates (x y z) of thehemisphere centre through a standard optimi-zation algorithm
A preliminary uncertainty budget is constructedconsidering the uncertainty related to
0
500
1000
1500
2000
2500
3000
0 500 1000 1500 2000 2500 3000 3500 4000
0
500
1000
1500
2000
2500
3000
3500
0 500 1000 1500 2000 2500 3000 3500 4000
0500
1500
2500
3500
1000
2000
3000
4000
0
1000
2000
3000
500
1500
2500
0
500
1000
1500
2000
2500
3000
3500
YX
Z
X
Y
Z
X
(a)
(b)
(c)
C2
C1
C3
C4
C5
C6
C7
C8
C1
C2
C3 C4C5
C6
C7
C8
C2
C1
C3
C4
C5
C6
C7
C8
P1
P2
P6
P9
P3
P11
P10
P1
P4
P5
P12
P7
P8
P16
P17
P15
P13 P19
C1
P20
P18
P1
P2
P2
P3
P3
P4
P4 P5
P5 P6
P6
P7
P7P8
P8
P9
P9
P10
P10
P11
P11
P12
P12
P13
P13
P14
P14
P15
P15
P16
P16
P17
P17
P18
P18
P19
P19P20
P20
constellation devices (Ci) measured points (Pi)
Fig 17 Representation of the experimental set-up used for the validation experiment Specifically (a) XZplane view (b) XY plane view (c) 3D view The measuring volume contains eight constellationdevices (amp) and 20 measured points (middot) which are randomly positioned
JEM1604 Proc IMechE Vol 224 Part B J Engineering Manufacture
An empirical regressive model to improve metrological performance 673
(a) the dimensional features of the support cup(b) the laser-tracker measurement of the points on
the cap hemispheric surface(c) the algorithm to determine the centre of the
hemisphere using the previous points
The result is that the error associated to the coor-dinates of the point to measure is reasonably smallerthan one millimetre which is one to two orders ofmagnitude more accurate than the Cricket distancemeasurements [38ndash40]
bull A Cricket device is placed next to 20 representativepoints that are positioned within the measuringvolume The approximate position of each point israndomly decided using a random number gen-erator Next the lsquoreferencersquo position is measured bya laser-tracker with the same procedure as beforeFor each of the 20 points eight TOFs from thecorresponding constellation devices are collectedreplicating the individual measurements five timesIn practice the device to be located is moved andrepositioned before each measurement with theaim of reproducing the usual measurement condi-tions Thus 20 middot 8 middot 5frac14 800 total TOF measure-ments (number of measured points middot number ofconstellation devices middot replications) These TOFsare turned into corresponding distances applyingthe iterative procedure seen in section 61 Thendistance values are compared with the corre-sponding reference values ndash derived using thelaser-tracker reference positions ndash so as to calculatethe resultant error Results obtained by the appli-cation of the experimental model are compared(a) with the results obtained by applying a firstorder one-factor model which was proposed byMoore et al [21] and implemented in a previousversion of Cricket firmware (see equation (8)) and(b) with the results obtained with no correction
difrac14 49671thorn 000096 middot s middotTOFi eth8THORN
In equation (8) di s and TOFi are respectivelyexpressed inmm ms and ms
Using the one-factor model in equation (8) dis-tances (di) can be calculated from the correspondingTOFis Unlike the two-factor model this model onlyaccounts for the attenuation effect due to d but doesnot consider the effect of u
In summary the distance error is calculated in thethree following situations
(a) application of the two-factor empirical model(b) application of the one-factor model(c) no correction
Next the average value (md-error) and the standarddeviation (sd-error) related to distance error are cal-culated Results are reported in Table 4 It is relevantto emphasize that these errors are not overall uncer-tainties for the system because they are not achieved
Fig 18 Representation scheme of the procedure to calculate the coordinates of the point in the middle ofthe face of the US transducer cover
Table 4 Results of validation experiments with regard tothe Cricket distance error Notice that the two-factor correction model compared to the one-factor model makes it possible to reduce thedispersion in the distance evaluation con-siderably Moreover results obtained with nocorrection are very poor both in terms of cen-tring (md-errorfrac14 705mm due to the systematicTOF measurement overestimation) and disper-sion (sd-error)
Distanceerror
Two-factorexperimental model
One-factorexperimental model
Nocorrection
md-error
[mm]03 06 705
sd-error
[mm]56 98 159
md-error and sd-error are calculated considering 800 individualdistance evaluations performed in random order
Reference distances are obtained using a laser-tracker (see Fig 18)with a measurement uncertainty onendashtwo orders of magnitudesmaller than Cricketsrsquo
Proc IMechE Vol 224 Part B J Engineering Manufacture JEM1604
674 D Maisano and L Mastrogiacomo
when all the error sources are combined in anuncertainty budget also including traceable calibra-tion uncertainties of the reference artefacts [39 41]
Notice that the two-factor correction model com-pared to the one-factor model makes it possible toreduce the dispersion in the distance evaluationconsiderably Specifically reduction is larger than40per cent ndash ie (98 56)98 The price to pay isthat the two-factor model is based on the assumptionthat constellation devices are parallel with respectto the device to locate (Fig 7) Also from Table 4notice that results obtained with no correction arevery poor both in terms of centring (large md-errordue to the systematic TOF measurement over-estimation) and dispersion (sd-error) In this case thereduction of the dispersion is larger than 60per cent ndashie (159 56159)
Depending not on the constellation device density ndashbut only on the TOF measurements between deviceto locate and constellation devices these results canbe extended to constellations with a different density
It is important to remark that the two-factor modelwas obtained under a precise air condition T and RH(Tfrac14 21 C and RHfrac14 27 per cent) In theory the modelshould be used in these precise conditions and fordifferent T and RH values it is no longer valid USsignal attenuation which is the main source of TOFestimation errors and the speed of sound (s) valueare both influenced by air T and RH [34] In generalthe effect of RH can be neglected especially formoderate variations (ie DRH not larger than 30ndash40per cent ndash conditions generally satisfied within shop-floors) Moreover if T variations are limited (ie DTcontained within 8ndash10 C ndash condition generally satis-fied within shop-floors) the effect of T on ultrasoundattenuation can be neglected also [9 42] Thus theonly effect to be compensated is that of T on s Tothat purpose T is periodically evaluated by embed-ded thermometers at the Cricket receivers and s isautomatically updated using an experimental rela-tion sfrac14 s(T) [1]
Referring to the validation experiments the posi-tion of the 20 points is calculated by trilateration ofthe distances from the eight constellation devices
The average position error (mposition-error) calculatedwith respect to the laser-tracker reference positionsand the corresponding standard deviations (sposition-
error) are reported in Table 5 Again those resultsobtained applying ndash in the same conditions ndash the one-factor model and those obtained with no correctionare compared
Again results show that the two-factor modelmakes it possible to improve the position accuracysignificantly Notice that the sz values are generallylower than sx and sy This behaviour is due to thegeometric configuration of the constellation devicesas explained in section 22
7 CONCLUSIONS
This paper proposes an experimental model toreduce the error in the TOF measurement amongMScMSrsquo Crickets Being the most important errorsources the model takes the transceiver distance andthe misalignment angle into account Both thesefactors are related to the US signal attenuation andby reason of an empirical factorial analysis it isshown that the factors and their interaction havesignificant effects on TOF-Error
An empirical regressive model is constructed onthe basis of experimental data and successively vali-dated through additional experiments The model isbased on the assumption that the Cricket devices incommunication have parallel faces In commonpractice this condition is respected approximatelybecause constellation devices are arranged on theceiling above the measuring area and the face of thedevice to locate is roughly parallel to them In thevalidation results provided by the correction modelare compared with those obtained applying respec-tively
(a) a one-factor model(b) with no correction
The most important benefit of the two-factormodel is a reduction in the dispersion associatedwith TOF measurements specifically more than
Table 5 Results of validation experiments with regard to the positioning error The two-factor correction model comparedto the one-factor model makes it possible to reduce the dispersion in the position error considerably Besidesresults obtained with no correction are very poor both in terms of centring and dispersion because of the sys-tematic overestimation of the distances between constellation devices and points to locate
Position error related tothe single coordinates
Two-factor experimental model One-factor experimental model No correction
Dx Dy Dz Dx Dy Dz Dx Dy Dz
mposition-error [mm] 13 33 10 40 127 02 48 238 695sposition-error [mm] 64 62 23 95 104 28 259 266 26
Reference positions of the twenty measured points are obtained using a laser-tracker (see Figure 18) with a measurement uncertainty one-two orders of magnitude smaller than Cricketsrsquo
JEM1604 Proc IMechE Vol 224 Part B J Engineering Manufacture
An empirical regressive model to improve metrological performance 675
40per cent with respect to the one-factor model andmore than 60 per cent with respect to the case withno correction The two-factor model can be auto-matically implemented by Crickets with an iterativeprocedure and profitably used both in the measure-ment and in the constellation location phases Themodel is effective provided that air T is around 21 Cwith variations not larger than 8ndash10 C however thiscondition is generally satisfied within shop-floors Itis remarkable that requiring no extra hardware orsoftware equipments the model makes it possible toenhance the MScMS metrological performance withno additional effort Even if in the future the MScMStechnology could be substantially improved theproposed methodology can still be relevant to correctother error sources in a homologous way
Regarding the future a more refined correctionmodel which takes account of the fact that duringthe measurement task the mobile probersquos devices arenot perfectly parallel to constellation devices will bestudied In fact it is very difficult to keep the mobileprobe always horizontal and facing the constellationdevices owing to the shape of the measured objectFurthermore Cricketrsquos accuracy could be improvedusing more refined ranging methods based on USpulse compression so as to reduce the transceiverangular sensitivity substantially This should beobtained with some modifications to the currentCricket hardware and firmware Another possiblesolution to the error associated with transmittermisalignment is the use of US transducers whichpresent a smaller directivity such as cylindricalpolyvinylidene fluoride (PVDF) film transducers [4344] Also other experiments will be carried out inorder to study the best way of positioning the MScMSconstellation devices depending on the measuredobject and the working volume layout [23]
Authors 2010
REFERENCES
1 Franceschini F Galetto M Maisano D andMastrogiacomo L Mobile spatial coordinate measur-ing system (MScMS) ndash introduction to the system Int JProd Res 2009 47(14) 3867ndash3889
2 Puttock M J Large-scale metrology Ann CIRP 197821(1) 351ndash356
3 MIT Computer Science and Artificial Intelligence LabCricket v2 user manual 2004 available from httpcricketcsailmiteduv2manhtml
4 Maisano D Jamshidi J Franceschini FMaropoulos P Mastrogiacomo L Mileham A andOwen G Comparison of two distributed large volumemeasurement systems MScMS and iGPS Proc IMechEPart B J Engineering Manufacture 2009 223(B5)511ndash521 DOI 10124309544054JEM1271
5 ARC Second Product literature 2004 available fromURL httparcsecondcom
6 Metris 2008 available from e URL httpwwwmetriscom
7 Maisano D Jamshidi J Franceschini FMaropoulos P Mastrogiacomo L Mileham A andOwen G Indoor GPS system functionality and initialperformance evaluation Int J Mfg Res 2008 3(3) 335ndash349
8 Welch G Bishop G Vicci L Brumback S andKeller K High-performance wide-area optical trackingthe HiBall tracking system In Presence Teleoperatorsand Virtual Environ 2001 10(1) 1ndash21
9 Bohn D A Environmental effects on the speed ofsound J Audio Engng Soc 1988 36(4) 223ndash231
10 Franceschini F Galetto M Maisano D andMastrogiacomo L On-line diagnostics in the mobilespatial coordinate measuring system Precision Engng2009 22(7) 698ndash716
11 Piontek H Seyffer M and Kaiser J Improving theaccuracy of ultrasound-based localisation systemsPersonal and Ubiquitous Comput 2007 11(6) 439ndash449
12 Priyantha N B Chakraborty A and BalakrishnanH The Cricket location-support system In Proceedingsof the Sixth ACM MOBICOM Boston MA 2000
13 Franceschini F Maisano D Mastrogiacomo L andPralio B Ultrasound transducers for large-scalemetrology a performance analysis for their use bythe MScMS IEEE Trans on Instrumn andMeasmt 200958(11) 1ndash12
14 Patwary N Ash J Kyperountas S Hero III AMoses R and Correal N Locating the nodes ndash coop-erative localization in wireless sensor networks IEEESignal processing Mag 2005 22(4) 54ndash69
15 Martin J M Jimenez A R Seco F Calderon LPons J L and Ceres R Estimating the 3D-positionfrom time delay data of US-waves experimental analy-sis and new processing algorithm Sensors and Actua-tors 2002 101(3) 311ndash321
16 Crossbow Technology 2009 available from URL httpwwwxbowcom
17 Balakrishnan H Baliga R Curtis D Goraczko MMiu A Priyantha N B Smith A Steele KTeller S and Wang K Lessons from developing anddeploying the Cricket indoor location system 2003(Preprint)
18 Gustafsson F and Gunnarsson F Positioning usingtime difference of arrival measurements In Proceedingsof the IEEE International Conference on Acousticsspeech and signal processing (ICASSP 2003) Hong Kong2003 vol 6 pp 553ndash556
19 Franceschini F Galetto M Maisano D andMastrogiacomo L A review of localization algorithmsfor distributed wireless sensor networks in manu-facturing Int J Computer Integrated Mfg 2009 22(7)698ndash716
20 Mahajan A and Figueroa F An automatic self-instal-lation and calibration method for a 3D position sensingsystem using ultrasonics Robotics and AutonomousSyst 1999 (28) 281ndash294
21 Moore D Leonard J Rus D and Teller S S Robustdistributed network localization with noisy range
Proc IMechE Vol 224 Part B J Engineering Manufacture JEM1604
676 D Maisano and L Mastrogiacomo
measurements In Proceedings of SenSys 2004Baltimore MD pp 50ndash61
22 Priyantha N B Balakrishnan H Demaine H Dand Teller S Mobile-assisted localization in wirelesssensor networks In Proceedings of the 24th AnnualJoint Conference of the IEEE Communications Societyon Computer communications (INFOCOM 2005)Miami Florida 13ndash17 March 2005 vol 1 pp 172ndash183
23 Franceschini F Galetto M Maisano D andMastrogiacomo L The problem of distributed wirelesssensors positioning in the mobile spatial coordinatemeasuring system (MScMS) In Proceedings of theNinth Biennial ASME Conference on Engineeringsystems design and analysis ESDA08 Haifa Israel 7-9July 2008
24 Akcan H Kriakov V Breuroonnimann H and Delis AGPS free node localization in mobile wireless sensornetworks In Proceedings of MobiDErsquo06 ChicagoIllinois USA 2006
25 Hazas M and Ward A A novel broadband ultrasoniclocation system In Proceedings of the Fourth Interna-tional Conference on Ubiquitous computing (UbiComp2002) Goteborg Sweden 2002 pp 264ndash280
26 Parrilla M Anaya J J and Fritsch C Digital signalprocessing techniques for high accuracy ultrasonicrange measurements IEEE Trans Instrumn MeasmtAugust 1991 40(4) 759ndash764
27 Manthey W and Kroemer N V Ultrasonic transdu-cers and transducer arrays for applications in airMeasmt Sci Technol 1991 3(3) 249ndash261
28 Johansson J Gustafsson M and Delsing J Ultra-lowpower transmitreceive ASIC for battery operatedultrasound measurement systems Sensors and Actua-tors 2006 125 317ndash328
29 Montgomery D CDesign and analysis of experiments ndash7th edition 2008 (Wiley New York)
30 Box GEP and Cox DR An analysis of transforma-tions J Royal Stat Soc Series B 1964 vol 26 pp 1ndash78
31 Box G E P Hunter W G and Hunter J S Statisticsfor experimenters 1978 (Wiley New York)
32 Magori V Ultrasonic sensors in air In Proceedings ofUltrasonics Symposium IEEE Cannes France 1ndash4November 1994 vol 1 pp 471ndash481
33 Godfrey L G Orme C D and Santos Silva J M CSimulation-based tests for heteroskedasticity in linear
regression models some further results Econometrics J
2006 9 76ndash9734 Zhang D Rolt S and Maropoulos P G Modelling
and optimization of novel laser multilateration schemes
for high-precision applications Measmt Sci Technol
2005 16 2541ndash254735 Jakevicius L and Demcenko A Ultrasound attenua-
tion dependence on air temperature in closed cham-
bers Ultragarsas (Ultrasound) 2008 63(1) 18ndash2236 Kino G S Acoustic waves devices imaging and analog
signal processing 1987 Prentice-Hall New Jersey37 Kimenez A R and Seco F Precise localisation of
archaeological findings with a new ultrasonic 3D posi-
tioning sensor Sensors and Actuators A 2005 123ndash124
224ndash23338 Ronchetti E and Staudte R G A robust version of
Mallowrsquos Cp J Am Statist Ass 1994 89 550ndash55939 Cross N R Dotson J R Flank D R Peggs G N
Cox M G Forbes A B Corta R OrsquoDonnell J and
Prieto E A large reference artefact for CMM verifica-
tion National Physical Laboratory NPL Report CLM 6
May 1998 45 pp40 GUM Guide to the expression of uncertainty in mea-
surement International Organization for Standardiza-
tion Geneva Switzerland 200441 VIM International vocabulary of basic and general
terms in metrology International Organization for
Standardization Geneva Switzerland 200442 Mastrogiacomo L and Maisano D Network localiza-
tion procedures for experimental evaluation of mobile
spatial coordinate measuring system (MScMS) Sub-
mitted to Int J Advd Mfg Technol 200943 Toda M Cylindrical PVDF film transmitters and recei-
vers for air ultrasound IEEE Transactions on Ultra-
sonics Ferroelectrics and Frequency control 2002 49(5)
626ndash63444 Toda M and Dahl J PVDF corrugated transducer for
ultrasonic ranging sensor Sensors and Actuators 2005
134 427ndash43545 Box G E P and Cox D R An analysis of transforma-
tions J Royal Statist Soc Series B 1964 26 1ndash7846 Kino G S Acoustic waves devices imaging and analog
signal processing 1987 (Prentice-Hall New Jersey)
JEM1604 Proc IMechE Vol 224 Part B J Engineering Manufacture
An empirical regressive model to improve metrological performance 677
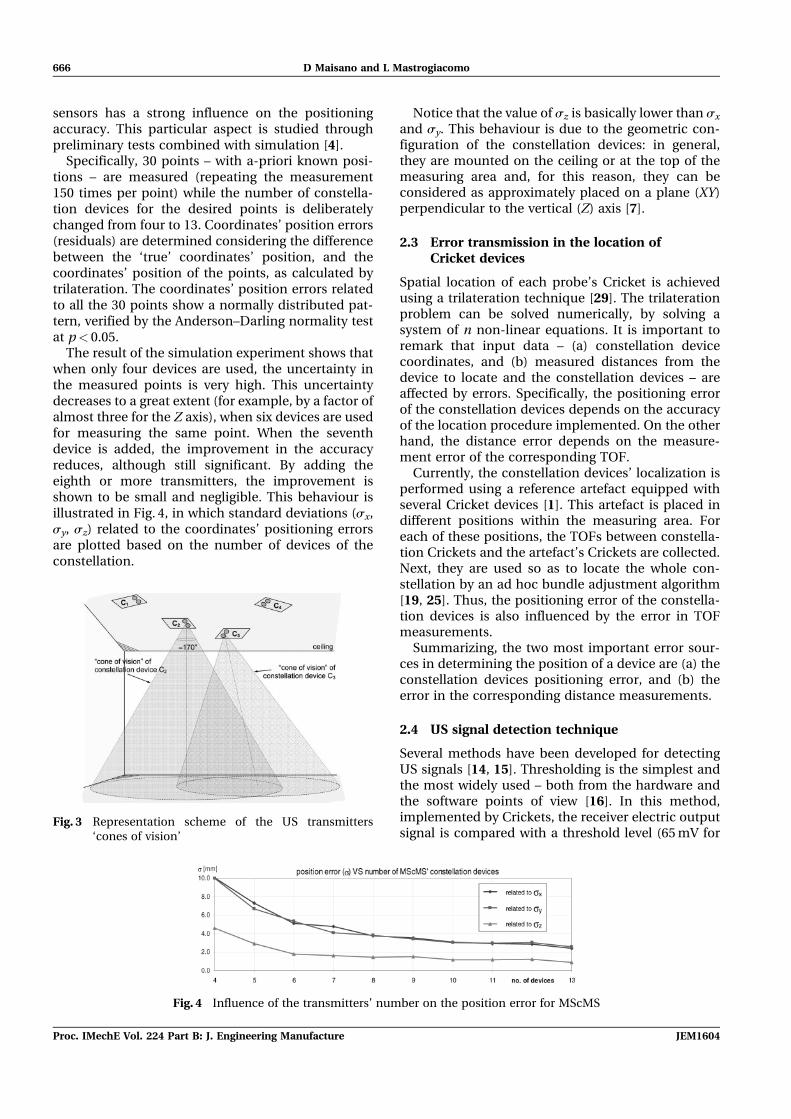
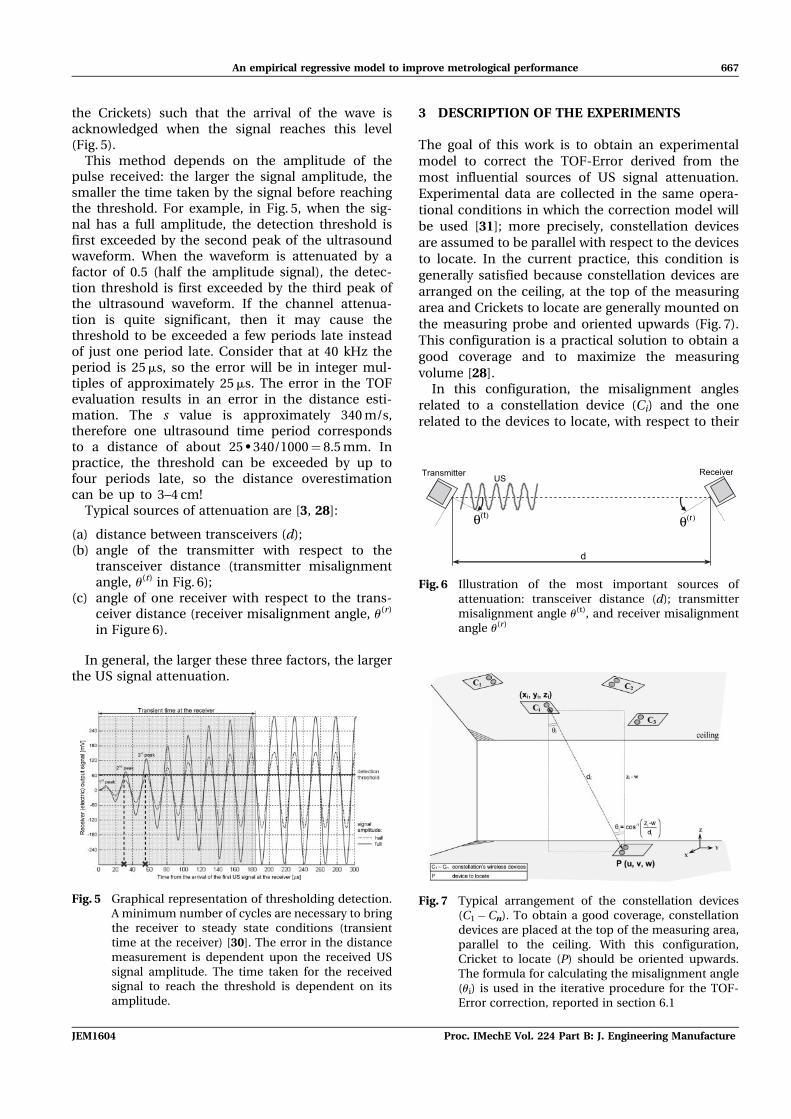
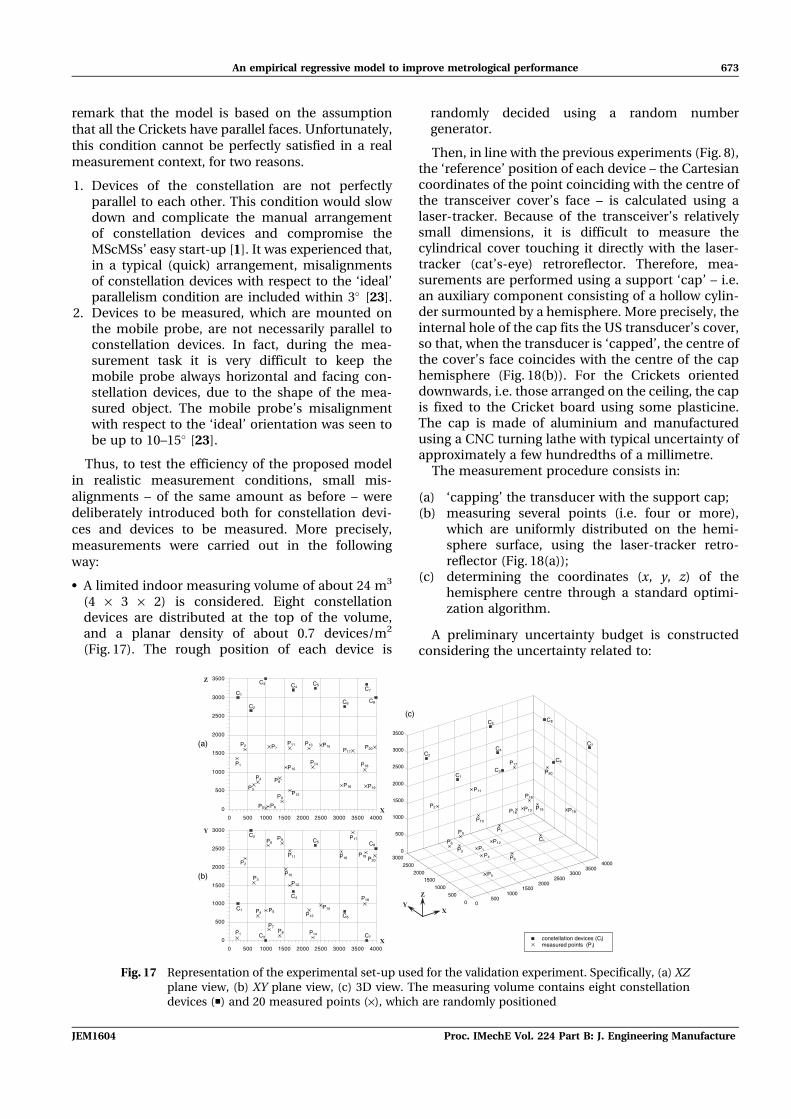