Embed Size (px)
Citation preview

RELATIONSHIPS BETWEEN QUANTITIES
Lesson 3: Creating and Graphing Equations in Two Variables
Instruction
CCGPS Coordinate Algebra Teacher Resource © Walch Education
U1-99
• Sometimes you need to skip values on the y-axis. It makes sense to do this if the y-intercept is very large (positive) or very small (negative). For example, if your y-intercept is 10,000, you could start your y-axis numbering at 0 and “skip” to 10,000 at the next y-axis number. Use a short, zigzag line starting at 0 to about the first grid line to show that you’ve skipped values. Then continue with the correct numbering for the rest of the axis. For an illustration, see Guided Practice Example 3, step 4.
• Only use x- and y-values that make sense for the context of the problem. Ask yourself if negative values make sense for the x-axis and y-axis labels in terms of the context. If negative values don’t make sense (for example, time and distance can’t have negative values), only use positive values.
• Determine the independent and dependent variables.
• The independent variable will be labeled on the x-axis. The independent variable is the quantity that changes based on values you choose.
• The dependent variable will be labeled on the y-axis. The dependent variable is the quantity that is based on the input values of the independent variable.
Graphing Equations Using a Table of Values
Using a table of values works for any equation when graphing. For an example, see Guided Practice Example 1, step 7.
1. Choose inputs or values of x.
2. Substitute those values in for x and solve for y.
3. The result is an ordered pair (x, y) that can be plotted on the coordinate plane.
4. Plot at least 3 ordered pairs on the line.
5. Connect the points, making sure that they lie in a straight line.
6. Add arrows to the end(s) of the line to show when the line continues infinitely (if continuing infinitely makes sense in terms of the context of the problem).
7. Label the line with the equation.

RELATIONSHIPS BETWEEN QUANTITIES
Lesson 3: Creating and Graphing Equations in Two Variables
Instruction
CCGPS Coordinate Algebra Teacher Resource
U1-100
© Walch Education
Graphing Equations Using the Slope and y-intercept
For an example, see Guided Practice Example 2, step 6.
1. Plot the y-intercept first. The y-intercept will be on the y-axis.
2. Recall that slope is rise
run
. Change the slope into a fraction if you need to.
3. To find the rise when the slope is positive, count up the number of units on your coordinate
plane the same number of units in your rise. (So, if your slope is 3
5
, you count up 3 on
the y-axis.)
4. For the run, count over to the right the same number of units on your coordinate plane in your
run, and plot the second point. (For the slope 3
5
, count 5 to the right and plot your point.)
5. To find the rise when the slope is negative, count down the number of units on your coordinate
plane the same number of units in your rise. For the run, you still count over to the right the
same number of units on your coordinate plane in your run and plot the second point. (For a
slope of 4
7
, count down 4, right 7, and plot your point.)
6. Connect the points and place arrows at one or both ends of the line when it makes sense to have arrows within the context of the problem.
7. Label the line with the equation.
Graphing Equations Using a TI-83/84:
Step 1: Press [Y=] and key in the equation using [X, T, , n] for x.
Step 2: Press [WINDOW] to change the viewing window, if necessary.
Step 3: Enter in appropriate values for Xmin, Xmax, Xscl, Ymin, Ymax, and Yscl, using the arrow keys to navigate.
Step 4: Press [GRAPH].

RELATIONSHIPS BETWEEN QUANTITIES
Lesson 3: Creating and Graphing Equations in Two Variables
Instruction
CCGPS Coordinate Algebra Teacher Resource © Walch Education
U1-101
Graphing Equations Using a TI-Nspire:
Step 1: Press the home key.
Step 2: Arrow over to the graphing icon (the picture of the parabola or the U-shaped curve) and press [enter].
Step 3: At the blinking cursor at the bottom of the screen, enter in the equation and press [enter].
Step 4: To change the viewing window: press [menu], arrow down to number 4: Window/Zoom, and click the center button of the navigation pad.
Step 5: Choose 1: Window settings by pressing the center button.
Step 6: Enter in the appropriate XMin, XMax, YMin, and YMax fields.
Step 7: Leave the XScale and YScale set to auto.
Step 8: Use [tab] to navigate among the fields.
Step 9: Press [tab] to “OK” when done and press [enter].
Common Errors/Misconceptions
• switching the slope and y-intercept when creating the equation from context
• switching the x- and y-axis labels
• incorrectly graphing the line with the wrong y-intercept or the wrong slope

RELATIONSHIPS BETWEEN QUANTITIES
Lesson 3: Creating and Graphing Equations in Two Variables
Instruction
CCGPS Coordinate Algebra Teacher Resource
U1-102
© Walch Education
Guided Practice 1.3.1
Example 1
A local convenience store owner spent $10 on pencils to resell at the store. What is the equation of the store’s revenue if each pencil sells for $0.50? Graph the equation.
1. Read the problem and then reread the problem, determining the known quantities.
Initial cost of pencils: $10
Charge per pencil: $0.50
2. Identify the slope and the y-intercept.
The slope is a rate. Notice the word “each.”
Slope = 0.50
The y-intercept is a starting value. The store paid $10. The starting revenue then is –$10.
y-intercept = –10
3. Substitute the slope and y-intercept into the equation y = mx + b, where m is the slope and b is the y-intercept.
m = 0.50
b = –10
y = 0.50x – 10
4. Change the slope into a fraction in preparation for graphing.
0.5050
100
1
2

RELATIONSHIPS BETWEEN QUANTITIES
Lesson 3: Creating and Graphing Equations in Two Variables
Instruction
CCGPS Coordinate Algebra Teacher Resource © Walch Education
U1-103
5. Rewrite the equation using the fraction.
y x1
210= −
6. Set up the coordinate plane and identify the independent and dependent variables.
In this scenario, x represents the number of pencils sold and is the independent variable. The x-axis label is “Number of pencils sold.”
The dependent variable, y, represents the revenue the store will make based on the number of pencils sold. The y-axis label is “Revenue in dollars ($).”
Determine the scales to be used. Since the slope’s rise and run are within 10 units and the y-intercept is –10 units, a scale of 1 on each axis is appropriate. Label the x-axis from 0 to 10 since you will not sell a negative amount of pencils. Label the y-axis from –15 to 15, to allow space to plot the $10 the store owner paid for the pencils (–10).
0 1 2 3 4 5 6 7 8 9 10
15
-15
-14
-13
-12
-11
-10
-9
-8
-7
-6
-5
-4
-3
-2
-1
1
2
3
4
5
6
7
8
9
10
11
12
13
14
Number of pencils sold
Re
ve
nu
e i
n d
oll
ars
($
)
y
x

RELATIONSHIPS BETWEEN QUANTITIES
Lesson 3: Creating and Graphing Equations in Two Variables
Instruction
CCGPS Coordinate Algebra Teacher Resource
U1-104
© Walch Education
7. Plot points using a table of values.
Substitute x values into the equation y x1
210= − and solve for y.
Choose any values of x to substitute. Here, it’s easiest to use values of
x that are even since after substituting you will be multiplying by 1
2.
Using even-numbered x values will keep the numbers whole after
you multiply.
x y
01
2(0) 10 10− =−
2 –9
4 –8
6 –7
0 1 2 3 4 5 6 7 8 9 10
15
-15
-14
-13
-12
-11
-10
-9
-8
-7
-6
-5
-4
-3
-2
-1
1
2
3
4
5
6
7
8
9
10
11
12
13
14
Number of pencils sold
Re
ve
nu
e i
n d
oll
ars
($
)
y
x

RELATIONSHIPS BETWEEN QUANTITIES
Lesson 3: Creating and Graphing Equations in Two Variables
Instruction
CCGPS Coordinate Algebra Teacher Resource © Walch Education
U1-105
8. Connect the points with a line and add an arrow at the right end of the line to show that the line of the equation goes on infinitely in that direction. Be sure to write the equation of the line next to the line on the graph.
0 1 2 3 4 5 6 7 8 9 10
15
-15
-14
-13
-12
-11
-10
-9
-8
-7
-6
-5
-4
-3
-2
-1
1
2
3
4
5
6
7
8
9
10
11
12
13
14
Number of pencils sold
Re
ve
nu
e i
n d
oll
ars
($
)
y
x
y = x – 10 1 2

RELATIONSHIPS BETWEEN QUANTITIES
Lesson 3: Creating and Graphing Equations in Two Variables
Instruction
CCGPS Coordinate Algebra Teacher Resource
U1-106
© Walch Education
Example 2
A taxi company in Atlanta charges $2.50 per ride plus $2 for every mile driven. Write and graph the equation that models this scenario.
1. Read the problem statement and then reread the problem, determining the known quantities.
Initial cost of taking a taxi: $2.50
Charge per mile: $2
2. Identify the slope and the y-intercept.
The slope is a rate. Notice the word “every.”
Slope = 2
The y-intercept is a starting value. It costs $2.50 initially to hire a cab driver.
y-intercept = 2.50
3. Substitute the slope and y-intercept into the equation y = mx + b, where m is the slope and b is the y-intercept.
m = 2
b = 2.50
y = 2x + 2.50

RELATIONSHIPS BETWEEN QUANTITIES
Lesson 3: Creating and Graphing Equations in Two Variables
Instruction
CCGPS Coordinate Algebra Teacher Resource © Walch Education
U1-107
4. Set up the coordinate plane.
In this scenario, x represents the number of miles traveled in the cab and is the independent variable. The x-axis label is “Miles traveled.”
The dependent variable, y, represents the cost of taking a cab based on the number of miles traveled. The y-axis label is “Cost in dollars ($).”
Determine the scales to be used. Since the slope’s rise and run are within 10 units and the y-intercept is within 10 units of 0, a scale of 1 on each axis is appropriate. Label the x-axis from 0 to 10, since miles traveled will only be positive. Label the y-axis from 0 to 10, since cost will only be positive.
101 2 3 4 5 6 7 8 9
10
1
2
3
4
5
6
7
8
9
Miles traveled
Co
st
in d
oll
ars
($
)
y
x
0

RELATIONSHIPS BETWEEN QUANTITIES
Lesson 3: Creating and Graphing Equations in Two Variables
Instruction
CCGPS Coordinate Algebra Teacher Resource
U1-108
© Walch Education
5. Graph the equation using the slope and y-intercept. Plot the y-intercept first.
The y-intercept is 2.5. Remember that the y-intercept is where the graph crosses the y-axis and the value of x is 0. Therefore, the coordinate of the y-intercept will always have 0 for x. In this case, the coordinate of the y-intercept is (0, 2.5).
To plot points that lie in between grid lines, use estimation. Since 2.5 is halfway between 2 and 3, plot the point halfway between 2 and 3 on the y-axis. Estimate the halfway point.
101 2 3 4 5 6 7 8 9
10
1
2
3
4
5
6
7
8
9
y
x
0
Miles traveled
Co
st
in d
oll
ars
($
)
RELATIONSHIPS BETWEEN QUANTITIES
Lesson 3: Creating and Graphing Equations in Two Variables
Instruction
CCGPS Coordinate Algebra Teacher Resource © Walch Education
U1-109
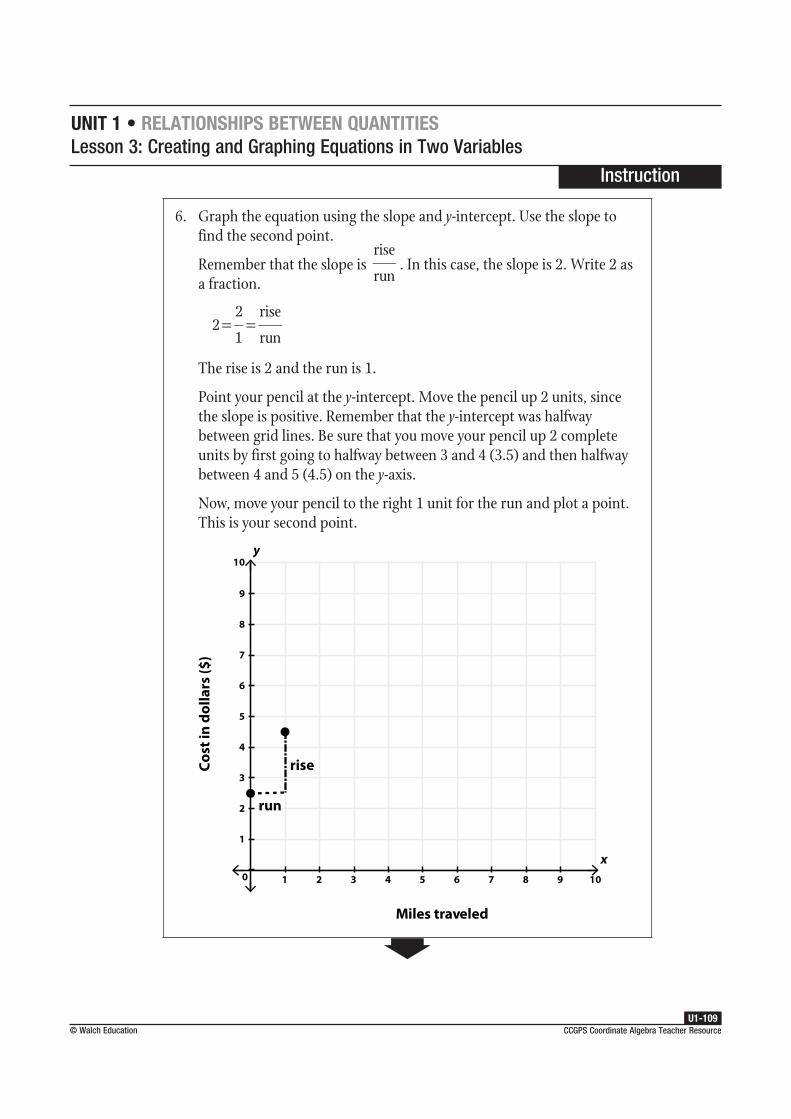
6. Graph the equation using the slope and y-intercept. Use the slope to find the second point.
Remember that the slope is rise
run. In this case, the slope is 2. Write 2 as
a fraction.
22
1
rise
run
The rise is 2 and the run is 1.
Point your pencil at the y-intercept. Move the pencil up 2 units, since the slope is positive. Remember that the y-intercept was halfway between grid lines. Be sure that you move your pencil up 2 complete units by first going to halfway between 3 and 4 (3.5) and then halfway between 4 and 5 (4.5) on the y-axis.
Now, move your pencil to the right 1 unit for the run and plot a point. This is your second point.
101 2 3 4 5 6 7 8 9
10
1
2
3
4
5
6
7
8
9
y
x
0
rise
run
Miles traveled
Co
st
in d
oll
ars
($
)

RELATIONSHIPS BETWEEN QUANTITIES
Lesson 3: Creating and Graphing Equations in Two Variables
Instruction
CCGPS Coordinate Algebra Teacher Resource
U1-110
© Walch Education
7. Connect the points and extend the line. Then, label your line.
Draw a line through the two points and add an arrow to the right end of the line to show that the line of the equation continues infinitely in that direction. Label the line with the equation, y = 2x + 2.5.
101 2 3 4 5 6 7 8 9
10
1
2
3
4
5
6
7
8
9
y
x
0
y = 2x + 2.5
Miles traveled
Co
st
in d
oll
ars
($
)

RELATIONSHIPS BETWEEN QUANTITIES
Lesson 3: Creating and Graphing Equations in Two Variables
Instruction
CCGPS Coordinate Algebra Teacher Resource © Walch Education
U1-111
Example 3
Miranda gets paid $300 a week to deliver groceries. She also earns 5% commission on any orders she collects while out on her delivery run. Write an equation that represents her weekly pay and then graph the equation.
1. Read the problem statement and then reread the problem, determining the known quantities.
Weekly payment: $300
Commission: 5% = 0.05
2. Identify the slope and the y-intercept.
The slope is a rate. Notice the symbol “%,” which means percent, or per 100.
Slope = 0.05
The y-intercept is a starting value. She gets paid $300 a week to start with before taking any orders.
y-intercept = 300
3. Substitute the slope and y-intercept into the equation y = mx + b, where m is the slope and b is the y-intercept.
m = 0.05
b = 300
y = 0.05x + 300

RELATIONSHIPS BETWEEN QUANTITIES
Lesson 3: Creating and Graphing Equations in Two Variables
Instruction
CCGPS Coordinate Algebra Teacher Resource
U1-112
© Walch Education
4. Set up the coordinate plane.
In this scenario, x represents the amount of money in orders Miranda gets. The x-axis label is “Orders in dollars ($).”
The dependent variable, y, represents her total earnings in a week. The y-axis label is “Weekly earnings in dollars ($).”
Determine the scales to be used. The y-intercept is in the hundreds and
the slope is in decimals. Work with the slope first. The slope is 0.05 or 5
100. The rise is a small number, but the run is big. The run is shown
on the x-axis, so that will need to be in increments of 100. Start at –100
or 0 since the order amounts will be positive and continue to 1,000.
The rise is shown on the y-axis and is small, but remember that the
y-intercept is $300. Since there’s such a large gap before the y-intercept,
the y-axis will need to skip values so the graph doesn’t become too
large. Start the y-axis at 0, then skip to 250 and label the rest of the axis
in increments of 5 until you reach 450. Use the zigzag line to show you
skipped values between 0 and 250.
1000-100 0 100 200 300 400 500 600 700 800 900
450
250
255
260
265
270
275
280
285
290
295
300
305
310
315
320
325
330
335
340
345
350
355
360
365
370
375
380
385
390
395
400
405
410
415
420
425
430
435
440
445
y
x
Orders in dollars ($)
We
ek
ly e
arn
ing
s in
do
lla
rs (
$)

RELATIONSHIPS BETWEEN QUANTITIES
Lesson 3: Creating and Graphing Equations in Two Variables
Instruction
CCGPS Coordinate Algebra Teacher Resource © Walch Education
U1-113
5. Graph the equation using the slope and y-intercept. Plot the y-intercept first.
The y-intercept is 300. Remember that the y-intercept is where the graph crosses the y-axis and the value of x is 0. Therefore, the coordinate of the y-intercept will always have 0 for x. In this case, the coordinate of the y-intercept is (0, 300).
1000-100 0 100 200 300 400 500 600 700 800 900
450
250
255
260
265
270
275
280
285
290
295
300
305
310
315
320
325
330
335
340
345
350
355
360
365
370
375
380
385
390
395
400
405
410
415
420
425
430
435
440
445
y
x
Orders in dollars ($)
We
ek
ly e
arn
ing
s in
do
lla
rs (
$)

RELATIONSHIPS BETWEEN QUANTITIES
Lesson 3: Creating and Graphing Equations in Two Variables
Instruction
CCGPS Coordinate Algebra Teacher Resource
U1-114
© Walch Education
6. Graph the equation using the slope and y-intercept. Use the slope to find the second point.
Remember that the slope is rise
run. In this case, the slope is 0.05. Rewrite
0.05 as a fraction.
0.055
100
rise
run
The rise is 5 and the run is 100.
Place your pencil on the y-intercept. Move the pencil up 5 units, since the slope is positive. On this grid, 5 units is one tick mark.
Now, move your pencil to the right 100 units for the run and plot a point. On this grid, 100 units to the right is one tick mark. This is your second point.
1000-100 0 100 200 300 400 500 600 700 800 900
450
250
255
260
265
270
275
280
285
290
295
300
305
310
315
320
325
330
335
340
345
350
355
360
365
370
375
380
385
390
395
400
405
410
415
420
425
430
435
440
445
y
x
Orders in dollars ($)
We
ek
ly e
arn
ing
s in
do
lla
rs (
$)

RELATIONSHIPS BETWEEN QUANTITIES
Lesson 3: Creating and Graphing Equations in Two Variables
Instruction
CCGPS Coordinate Algebra Teacher Resource © Walch Education
U1-115
7. Connect the points and extend the line. Then, label your line.
Draw a line through the two points and add an arrow to the right end of the line to show that the line continues infinitely in that direction. Label your line with the equation, y = 0.05x + 300.
1000-100 0 100 200 300 400 500 600 700 800 900
450
250
255
260
265
270
275
280
285
290
295
300
305
310
315
320
325
330
335
340
345
350
355
360
365
370
375
380
385
390
395
400
405
410
415
420
425
430
435
440
445
y = 0.05x + 300
Orders in dollars ($)
We
ek
ly e
arn
ing
s in
do
lla
rs (
$)
y
x

RELATIONSHIPS BETWEEN QUANTITIES
Lesson 3: Creating and Graphing Equations in Two Variables
Instruction
CCGPS Coordinate Algebra Teacher Resource
U1-116
© Walch Education
Example 4
The velocity (or speed) of a ball thrown directly upward can be modeled with the following equation: v = –gt + v
0, where v is the speed, g is the force of gravity, t is the elapsed time, and v
0 is the initial
velocity at time 0. If the force of gravity is equal to 32 feet per second, and the initial velocity of the ball is 96 feet per second, what is the equation that represents the velocity of the ball? Graph the equation.
1. Read the problem statement and then reread the problem, determining the known quantities.
Initial velocity: 96 ft/s
Force of gravity: 32 ft/s
Notice that in the given equation, the force of gravity is negative. This is due to gravity acting on the ball, pulling it back to Earth and slowing the ball down from its initial velocity.
2. Identify the slope and the y-intercept.
Notice the form of the given equation for velocity is the same form as y = mx + b, where y = v, m = –g, x = t, and b = v
0. Therefore, the
slope = –32 and the y-intercept = 96.
3. Substitute the slope and y-intercept into the equation y = mx + b, where m is the slope and b is the y-intercept.
m = –g = –32
b = v0 = 96
y = –32x + 96

RELATIONSHIPS BETWEEN QUANTITIES
Lesson 3: Creating and Graphing Equations in Two Variables
Instruction
CCGPS Coordinate Algebra Teacher Resource © Walch Education
U1-117
4. Set up the coordinate plane.
In this scenario, x represents the time passing after the ball was dropped. The x-axis label is “Time in seconds.”
The dependent variable, y, represents the velocity, or speed, of the ball. The y-axis label is “Velocity in ft/s.”
Determine the scales to be used. The y-intercept is close to 100 and the slope is 32. Notice that 96 (the y-intercept) is a multiple of 32. The y-axis can be labeled in units of 32. Since the x-axis is in seconds, it makes sense that these units are in increments of 1. Since time cannot be negative, use only a positive scale for the x-axis.
101 2 3 4 5 6 7 8 9
256
-32
32
64
96
128
160
192
224
-64
-192
-160
-128
-96
Time in seconds
Ve
loci
ty i
n f
t/s
y
x
0
-224
-256

RELATIONSHIPS BETWEEN QUANTITIES
Lesson 3: Creating and Graphing Equations in Two Variables
Instruction
CCGPS Coordinate Algebra Teacher Resource
U1-118
© Walch Education
5. Graph the equation using the slope and y-intercept. Plot the y-intercept first.
The y-intercept is 96. Remember that the y-intercept is where the graph crosses the y-axis and the value of x is 0. Therefore, the coordinate of the y-intercept will always have 0 for x. In this case, the coordinate of the y-intercept is (0, 96).
101 2 3 4 5 6 7 8 9
256
-32
32
64
96
128
160
192
224
-64
-192
-160
-128
-96
Time in seconds
Ve
loci
ty i
n f
t/s
y
x
0
-224
-256

RELATIONSHIPS BETWEEN QUANTITIES
Lesson 3: Creating and Graphing Equations in Two Variables
Instruction
CCGPS Coordinate Algebra Teacher Resource © Walch Education
U1-119
6. Graph the equation using the slope and y-intercept. Use the slope to find the second point.
Remember that the slope is rise
run. In this case, the slope is –32.
Rewrite –32 as a fraction.
3232
1
rise
run− =
−=
The rise is –32 and the run is 1.
Place your pencil on the y-intercept. Move the pencil down 32 units, since the slope is negative. On this grid, 32 units is one tick mark.
Now, move your pencil to the right 1 unit for the run and plot a point. This is your second point.
101 2 3 4 5 6 7 8 9
256
-32
32
64
96
128
160
192
224
-64
-192
-160
-128
-96
Time in seconds
Ve
loci
ty i
n f
t/s
y
x
0
-224
-256

RELATIONSHIPS BETWEEN QUANTITIES
Lesson 3: Creating and Graphing Equations in Two Variables
Instruction
CCGPS Coordinate Algebra Teacher Resource
U1-120
© Walch Education
7. Connect the points and extend the line toward the right. Then, label your line.
Draw a line through the two points and add an arrow to the right end of the line to show that the line of the equation continues infinitely in that direction. Label your line with the equation y = –32x + 96.
101 2 3 4 5 6 7 8 9
256
-32
32
64
96
128
160
192
224
-64
-192
-160
-128
-96
Time in seconds
Ve
loci
ty i
n f
t/s
y
x
0
-224
-256
y = –32x + 96