Embed Size (px)
Citation preview

62&,$/�352*5(66�,1�+21*�.21*�
7KH�8QILQLVKHG�$JHQGD
5LFKDUG�-��(VWHV��3K�'�
Professor and Chair,Concentration in Social and Economic Development
8QLYHUVLW\�RI�3HQQV\OYDQLDSchool of Social WorkPhiladelphia PA 19104
Tele: 215/898-5531Fax: 215/573-2099
E-Mail: [email protected]
In Collaboration With
Chua Hoi Wai1
John FungAnthony Wong
Presented at the
&RQIHUHQFH�RQ�6RFLDO�6FLHQFH�0HWKRGRORJ\�LQ�WKH�1HZ�0LOOHQLXP
Cologne, Germany
3-6 October 2000
1 All are staff members of the Hong Kong Council of Social Service (HKCSS).

1
62&,$/�352*5(66�,1�+21*�.21*�
7KH�8QILQLVKHG�$JHQGD
,1752'8&7,21
Hong Kong is an international metropolis located at the mouth of the Pearl River delta on the
southeast coast of China. Consisting of 420 square miles, Hong Kong contains a population
of some seven million people. Since at least the mid-1960s, Hong Kong has been regarded as
one of East Asia’s major economic centers—a so-called “small dragon.” Since the 1980s,
Hong Kong also has developed into a major trading and financial center for the world-as-a-
whole. Today, with a per capita income exceeding USD $25,000 Hong Kong enjoys a level
of affluence that places the SAR2 among the most prosperous societies worldwide (UNDP,
1999; World Bank, 2000).
The social benefits associated with Hong Kong’s decades-long economic transforma-
tion are obvious--a magnificent skyline, a first class transportation system, world class shop-
ping districts, a major financial center, modern apartment blocks, beautiful entertainment
centers and a network of highly regarded institutions of higher education . Hong Kong’s
economic successes also are reflected in improvements in the day-to-day living conditions of
her people—longer life expectation, increased access to preventive and curative health serv-
ices, better schools, a rich network of sports and recreational services, a sophisticated system
of social services, more locally available library services, significantly improved income se-
curity programs, and more public parks and other “green spaces.” Occupational safety stan-
dards also have improved as have building codes and sanitation requirements associated with
Hong Kong’s extensive restaurant and food handling industries. These and other important
advances in Hong Kong have added measurably to improvements in the quality of life expe-
rienced by the people of Hong Kong (Lau et al., 1999).
Following decades of rapid economic expansion, however, Hong Kong has arrived at
an important crossroads. Economic expansion is no longer as rapid or as great as during ear-
lier decades. Jobs are more difficult to secure, pay less well, and are associated with less se-
curity than in the past. The cost of housing, food, health care and other basic necessities con-
sume a larger share of total household earnings for which people must work longer hours.
Meaningful savings are more difficult for all but a privileged few. And the SAR’s problems
2 Since its return to Chinese sovereignty on June 30, 1997, Hong Kong is referred to as “Hong Kong SAR”(Special Administrative Region).

2
with crime, homelessness and the environment have proven more intractable than anticipated.
In addition, “new” problems in the areas of family violence and drug abuse have surfaced as
have issues associated youth suicide and sex and drug tourism from Hong Kong into Main-
land China. Rapid increases in population aging also are posing special challenges for Hong
Kong’s already heavily pressed income security system.3
The Need For A Social Report
By early 1999 recognition existed in Hong Kong of the need to conduct a comprehensive as-
sessment of its changing social conditions. The broad purpose of such an assessment would
be to arrive at an understanding of the SAR’s social environment more or less comparable to
those which existed of its changing economic environment (HK Commission on Strategic
Development, 2000). With that purpose in mind, the Hong Kong Council of Social Service
(hereafter HKCSS) commissioned this author to undertake work on Hong Kong’s ILUVW com-
prehensive Social Report. The goals associated with the effort included:
1. the creation of an analytical tool unique to the Hong Kong for use in assessing the
SAR’s changing social, political and economic needs over time;
2. a systematic analysis of the SAR’s social development trends at various points in
time;
3. comparisons of the SAR’s social development patterns with those of other well-off
societies;
4. a systematic analysis of social development “performances” of Hong Kong’s histori-
cally vulnerable population groups—women, the aged, children, youth, and low-
income households—vis-à-vis those of the society-as-a-whole; and,
5. with others in Hong Kong society, to initiate a process of working toward more com-
prehensive social, political, economic, cultural and environmental development.
The paper that follows summarizes a more extensive report of social development trends oc-
curring in Hong Kong for the 17-year period 1981-1998 (Estes, 2000). The paper illustrates
3 In addition to the references already cited, additional statistical data documenting Hong Kong’s developmenttrends were obtained from the following departments of the Hong Kong SAR government: Chan, 1995; Chan,1996; HK Census and Statistics Dept., 1998; HK Census and Statistics Dept., 1999a and b; HK Census and Sta-tistics Dept., 2000; HK Central Registry of Drug Abuse, 1998; HK Consumer Council, 1999; HK Coroner’sOffice, 1999; HK Dept. of Health, 1999; HK Education Dept., 1999; HK Environmental Protection Department,1998; HK Hospital Authority, 1999; HK Housing Authority, 1998; HK Immigration Dept., 1998; HK Independ-ent Commission Against Corruption, 1999; HK Labour Dept., 1999; HK Police Force, 1998; HK Social WelfareDept., 1998; HK Sports Development Board, 1998; HK Television and Entertainment Licensing Authority,1998; HK Tourist Association, 1999; HK Transport Dept., 1999; University Grants Council of HK, 1999.

3
the contribution made by social indicators and social reporting in helping a society refocus its
development priorities.
5(6($5&+�0(7+2'6
The project involved completion of a large number of conceptual, data collection, and proc-
essural tasks: 1) the conceptualization of social development in the context of a well-off East
Asian society; 2) the creation of an analytical tool for use in measuring changes over time in
that development; 3) data collection; 3) preliminary testing of the initial model; and 4) re-
finements to and re-testing of the final analytical model. Once fully tested, the refined
model—referred to as the Social Development Index (SDI-2000)--was used to conduct an
analysis of social development trends in Hong Kong for the 17-year period 1981-1998. For a
variety of reasons, the decision was made to assign particular priority to analysis of social
development trends that occurred in the SAR during the 12-year period 1986-1998.
Table 1 summarizes the major organizational, research and other tasks associated with
the project’s implementation.
7DEOH��0DMRU�5HVHDUFK�7DVNV�DQG�7LPH�3KDVHV$VVRFLDWHG�:LWK�'HYHORSPHQW�RI�WKH
6RFLDO�'HYHORSPHQW�,QGH[�������6',������3URMHFW�3KDVHV�DQG�'DWHV� 0DMRU�7DVNV
3KDVH�,�0DUFK�-XQH������
• Appointment of Board of Consultants• Selection of Senior Consultant• Appointment of Panel of Experts• Assignment of HKCSS research team members
3KDVH�,,�-XO\�$XJXVW�����
• First residential period for Senior Consultant in Hong Kong• Conceptualization of the general SDI-HKCSS• Identification of the major domains of the SDI• Selection of key indicators used to operationalize each domain• Consultations with Board of Consultants and Panel of Experts• Preliminary data collection
3KDVH�,,,�6HSW�'HF�������
• Collaboration with key data centers in Hong Kong for the collectionof identified social indicators
• Data collection, cleaning, refinement• Assignment of authors for each of the report’s major sections
3KDVH�,9�-DQXDU\�������
• Second residential period for Senior consultant• With research team, refinement of the preliminary SDI model• Further data collection• Preliminary data analysis• Consultations with members of Board of Consultants and Panel of
Experts

4
3KDVH�9�-DQXDU\�0DUFK�������
• Completion of data collection and transmittal to Senior Consultant
3KDVH�9,�$SULO�0D\�������
• Completion of data analysis by Senior Consultant• Finalization of the SDI• Preparation of graphs and charts• Review and integration of all materials by Senior Consultant• Draft report prepared and submitted for review by Board of Consult-
ants and Executive Committee of the Hong Kong Council of SocialService
3KDVH�9,,�-XQH�������
• Third and final residential period for the Senior Consultant• Consultative meetings with Executive Committee of the HKCSS• Consultative meeting with the Board of Consultants• Dissemination of report to government and media in Hong Kong• Two-day institute on “Social Development Trends in Hong Kong:
Preparing For the Future”• Interviews with public media and others as requested by the HKCSS
Time Periods Studied: 1981, 1986, 1991, 1996, 1998
Level of Analysis: N=1, i.e., Hong Kong SAR (Hong Kong 6SHFLDO�$GPLQLVWUDWLYH
5HJLRQ�of the People’s Republic of China)
Data Sources: Principally government sources but a variety of independent
sources both inside and outside Hong Kong also were used
SOCIAL DEVELOPMENT:ITS MEANING AND MEASUREMENT IN HONG KONG
Table 2 identifies the conceptual framework used to develop the SDI-2000 for Hong Kong.
The framework places emphasis on three distinct aspects of social life in Hong Kong: a) the
community’s collective memory and experience; b) the contemporary social, political, eco-
nomic and environmental realities that confront the SAR; and c) the basic needs and higher
level aspirations of Hong Kong’s individual residents and other social collectivities. A
graphical representation of the model appears on the next page.
7DEOH��0RGHO�RI�,QWHUORFNLQJ�6RFLHWDO��,QGLYLGXDO�$VSLUDWLRQV
Collective Memory and Experience • +LVWRU\• 7UDGLWLRQV• 9DOXHV• 1RUPV
Contemporary Societal Realities• 6RFLR�3ROLWLFDO�6LWXDWLRQ• (FRQRPLF�6LWXDWLRQ

5
• (QYLURQPHQWDO�&RQVWUDLQWV
Individual Needs and Aspirations• 6DWLVIDFWLRQ�RI�%DVLF�1HHGV• 6HFXULW\�1HHGV• /RYH�DQG�$IIHFWLRQ�1HHGV• 6HOI�$FWXDOL]DWLRQ�1HHGV
Conceptual Model Underpinning SDI-2000
&RQWHPSRUDU\�(FRQRPLF�)RUFHV
&RQWHPSRUDU\�6RFLR�3ROLWLFDO�
)RUFHV�
(QYLURQPHQWDO�3UHVVXUHV�DQG�&RQVWUDLQWV�
+LVWRU\�7UDGLWLRQV�
9DOXHV� 1RUPV�
/HYHO����3K\VLRORJLFDO�1HHGV�
/HYHO����6DIHW\��6HFXULW\�1HHGV�
/HYHO����/RYH��$I��
IHFWLRQ�1HHGV�
/HYHO����6HOI�$FWXDOL]DWLRQ�
1HHGV
6
7+(�62&,$/�'(9(/230(17�,1'(;�������6',������
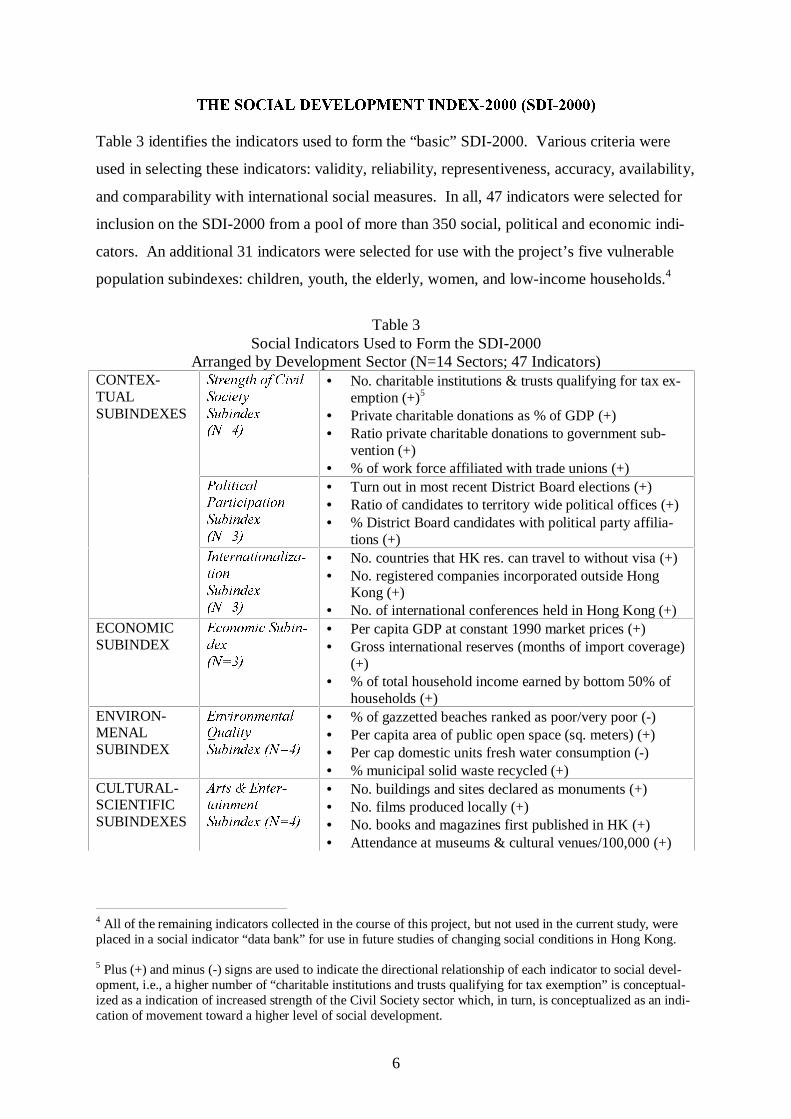
Table 3 identifies the indicators used to form the “basic” SDI-2000. Various criteria were
used in selecting these indicators: validity, reliability, representiveness, accuracy, availability,
and comparability with international social measures. In all, 47 indicators were selected for
inclusion on the SDI-2000 from a pool of more than 350 social, political and economic indi-
cators. An additional 31 indicators were selected for use with the project’s five vulnerable
population subindexes: children, youth, the elderly, women, and low-income households.4
Table 3Social Indicators Used to Form the SDI-2000
Arranged by Development Sector (N=14 Sectors; 47 Indicators)6WUHQJWK�RI�&LYLO6RFLHW\6XELQGH[�1 ��
• No. charitable institutions & trusts qualifying for tax ex-emption (+)5
• Private charitable donations as % of GDP (+)• Ratio private charitable donations to government sub-
vention (+)• % of work force affiliated with trade unions (+)
3ROLWLFDO3DUWLFLSDWLRQ6XELQGH[�1 ��
• Turn out in most recent District Board elections (+)• Ratio of candidates to territory wide political offices (+)• % District Board candidates with political party affilia-
tions (+)
CONTEX-TUALSUBINDEXES
,QWHUQDWLRQDOL]D�WLRQ6XELQGH[�1 ��
• No. countries that HK res. can travel to without visa (+)• No. registered companies incorporated outside Hong
Kong (+)• No. of international conferences held in Hong Kong (+)
ECONOMICSUBINDEX
(FRQRPLF�6XELQ�GH[�1 ��
• Per capita GDP at constant 1990 market prices (+)• Gross international reserves (months of import coverage)
(+)• % of total household income earned by bottom 50% of
households (+)ENVIRON-MENALSUBINDEX
(QYLURQPHQWDO4XDOLW\6XELQGH[��1 ��
• % of gazzetted beaches ranked as poor/very poor (-)• Per capita area of public open space (sq. meters) (+)• Per cap domestic units fresh water consumption (-)• % municipal solid waste recycled (+)
CULTURAL-SCIENTIFICSUBINDEXES
$UWV��(QWHU�WDLQPHQW6XELQGH[��1 ��
• No. buildings and sites declared as monuments (+)• No. films produced locally (+)• No. books and magazines first published in HK (+)• Attendance at museums & cultural venues/100,000 (+)
4 All of the remaining indicators collected in the course of this project, but not used in the current study, wereplaced in a social indicator “data bank” for use in future studies of changing social conditions in Hong Kong.
5 Plus (+) and minus (-) signs are used to indicate the directional relationship of each indicator to social devel-opment, i.e., a higher number of “charitable institutions and trusts qualifying for tax exemption” is conceptual-ized as a indication of increased strength of the Civil Society sector which, in turn, is conceptualized as an indi-cation of movement toward a higher level of social development.

7
6SRUWV��5HF�UHDWLRQ�6XELQGH[�1 ��
• No. of public sporting facilities (+)• Average utilization rate of public sporting facilities (+)• Size of delegation participating in major games (+)
6FLHQFH��7HFK�QRORJ\6XELQGH[��1 ��
• No. patents granted to HK entities (residents• No. scientific publications in refereed publications (+)
(GXFDWLRQ�6XELQ�GH[�1 ��
• % age 20+ with upper secondary educational attainment(+)
• % of persons aged 15 or > having attained tertiary edu-cation (+)
• Adults in continuing education per 100,000 (+)+HDOWK6XELQGH[�1 ��
• Average life expectation at birth (+)• Infant Mortality Rate per 1,000 live born (-)• Tuberculosis cases per 100,000 population (-)• Adults smoking per 100,000 population (-)• Deaths from coronary heart diseases/100,000 (-)• Suicides per 100,000 adults aged 20+ (-)
3HUVRQDO�6DIHW\6XELQGH[���1 ��
• Reported food poisoning cases per 100,000 pop (-)• No. occupational fatalities per 100,000 workers (-)• No. traffic fatalities per 100,000 population (-)
+RXVLQJ6XELQGH[�1 ��
• Expenditure on housing as share of total household in-come (-)
• No. waiting list applicants for Housing Authority rentalflats (-)
&ULPH��3XEOLF6DIHW\6XELQGH[�1 ��
• Violent crimes per 100,000 population (-)• Non-violent crimes per 100,000 population (-)• % population reporting victimized by violent (-)• No. corruption crime convictions per 100,000 (-)
HUMAN RE-SOURCE DE-VELOPMENTSUBINDEXES
)DPLO\�6ROLGDULW\6XELQGH[�1 ��
• Marriages per 100,000 persons aged 15+ (+)• Divorces as % of marriages (-)• Reported domestic violence cases per 100,000 (-)
Table 4 identifies 31 additional indicators that were used to assess changes in development
patterns occurring among five population groups of special interest to the HKCSS: FKLOGUHQ�
\RXWK��ZRPHQ��HOGHUO\�SHUVRQV��DQG�ORZ�LQFRPH�KRXVHKROGV�DQG�SHUVRQV�. These indicators
are not part of the basic SDI-2000 indicator system but do work in a complementary fashion
with the SDI-2000 in making possible an analysis of development trends occurring for Hong
Kong’s most socially vulnerable population group’s vis-à-vis those of the general population.
6 An effort was made to construct a similar subindex for persons with disabilities but, owing to current datashortage problems, the effort was abandoned. By 2001 the HK Bureau of the Census expects to have completedwork on a four-part survey of persons with disabilities which will permit in-depth analyses of the special socialneeds of this high vulnerable population group.

8
7DEOH��6RFLDO�,QGLFDWRUV�8VHG�WR�)RUP
3RSXODWLRQ�6SHFLILF�6XELQGH[HV�IRU�+RQJ�.RQJ¶V+LVWRULFDOO\�9XOQHUDEOH�3RSXODWLRQ�*URXSV
�1 ��6XELQGH[HV�����,QGLFDWRUV�:RPHQ¶V6WDWXV6XELQGH[�1 ��
• % of women in low income households (-)• Married women’s labour force participation rate (+)• Median women’s wages as % of median men’s wages, all ages (+)• % women administrators and managers (+)• % District Board political positions occupied (+)
/RZ�,QFRPH6XELQGH[�1 ��
• No. of persons in low-income domestic households/100,000 (-)• % low income household expenditure on housing (-)• Unemployment rate of persons in low-income households (-)• Real Wage Index of wage workers (+)• Homeless persons per 100,000 population (-)
&KLOG�6WDWXV6XELQGH[�1 ��
• % children aged 0-14 in low-income households (-)• % children living in single parent households (-)• Under age 5 child mortality per 100000 (-)• Children aged 2-6 enrolled in kindergarten and child care centers (+)• Child abuse cases per 100,000 (-)• % children immunized against DPT (+)• Children 7-15 arrested per 100,000 (-)
<RXWK�6WDWXV6XELQGH[�1 ��
• % of youth aged 15-19 in low-income households (-)• % youth aged 15-19 attaining S4 or above (+)• % aged 15-24 studying full-time at tertiary education (+)• Youth unemployment rate (-)• Arrests of persons age 16-20 for violent crimes per 100,000 (-)• Prevalence of drug use among persons 15-19 (-)• Youth suicide rate, aged 10-19 years (-)
(OGHUO\�6WDWXV6XELQGH[�1 ��
• % of persons aged 65+ in low income households (-)• Years of additional life expectation at age 65 (+)• % elderly with lower secondary educational attainment (+)• Turn out rate of elderly voting in most recent District Board elections (+)• % of elderly participating in organized social programs (+)• Percentage of elderly aged 65+ living alone (-)• Elderly suicide rate per 100,000 (-)
A. Measuring Hong Kong’s Social Progress
Changes over time in Hong Kong’s social development were assessed using two methods: 1)
cross-sectional analyses of the VWDWH�of Hong Kong’s development at each of five time inter-
vals—1981, 1986, 1991, 1996 and 1998 (SDI-2000); and 2) the SDFH of Hong Kong’s social
development between 1986 and 1998 (T-98).
9
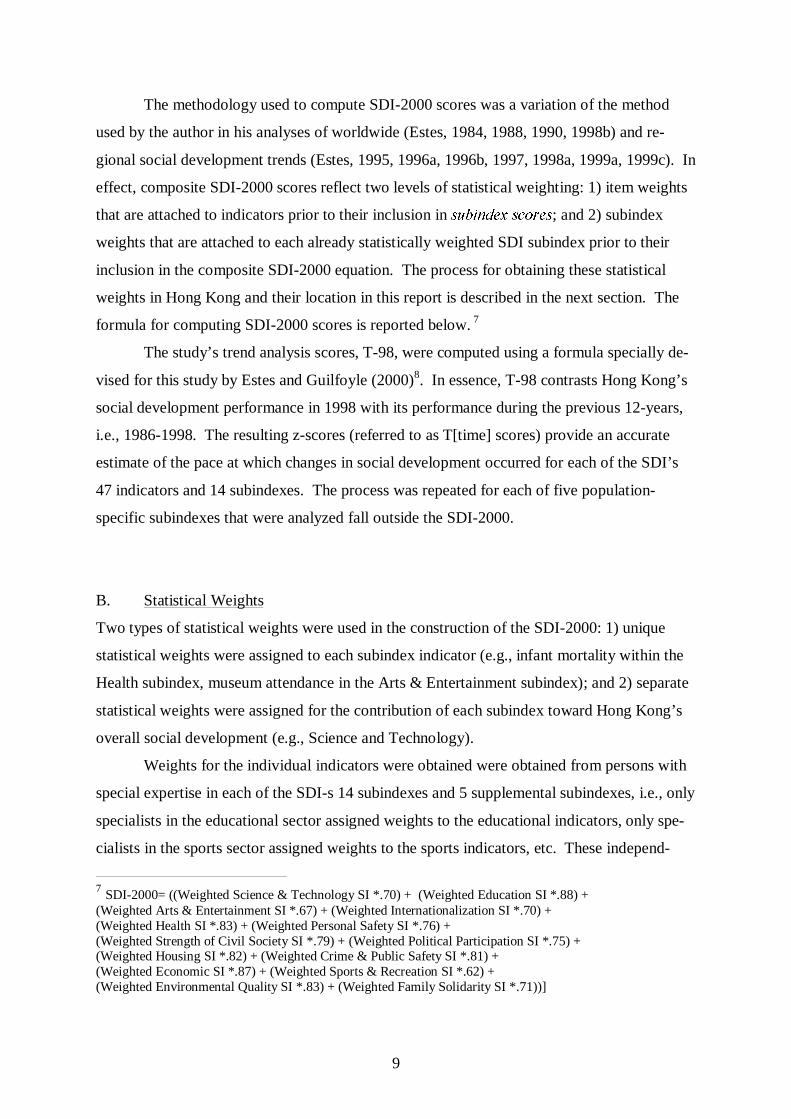
The methodology used to compute SDI-2000 scores was a variation of the method
used by the author in his analyses of worldwide (Estes, 1984, 1988, 1990, 1998b) and re-
gional social development trends (Estes, 1995, 1996a, 1996b, 1997, 1998a, 1999a, 1999c). In
effect, composite SDI-2000 scores reflect two levels of statistical weighting: 1) item weights
that are attached to indicators prior to their inclusion in VXELQGH[�VFRUHV; and 2) subindex
weights that are attached to each already statistically weighted SDI subindex prior to their
inclusion in the composite SDI-2000 equation. The process for obtaining these statistical
weights in Hong Kong and their location in this report is described in the next section. The
formula for computing SDI-2000 scores is reported below. 7
The study’s trend analysis scores, T-98, were computed using a formula specially de-
vised for this study by Estes and Guilfoyle (2000)8. In essence, T-98 contrasts Hong Kong’s
social development performance in 1998 with its performance during the previous 12-years,
i.e., 1986-1998. The resulting z-scores (referred to as T[time] scores) provide an accurate
estimate of the pace at which changes in social development occurred for each of the SDI’s
47 indicators and 14 subindexes. The process was repeated for each of five population-
specific subindexes that were analyzed fall outside the SDI-2000.
T
B. Statistical Weights
Two types of statistical weights were used in the construction of the SDI-2000: 1) unique
statistical weights were assigned to each subindex indicator (e.g., infant mortality within the
Health subindex, museum attendance in the Arts & Entertainment subindex); and 2) separate
statistical weights were assigned for the contribution of each subindex toward Hong Kong’s
overall social development (e.g., Science and Technology).
Weights for the individual indicators were obtained were obtained from persons with
special expertise in each of the SDI-s 14 subindexes and 5 supplemental subindexes, i.e., only
specialists in the educational sector assigned weights to the educational indicators, only spe-
cialists in the sports sector assigned weights to the sports indicators, etc. These independ-
7 SDI-2000= ((Weighted Science & Technology SI *.70) + (Weighted Education SI *.88) +(Weighted Arts & Entertainment SI *.67) + (Weighted Internationalization SI *.70) +(Weighted Health SI *.83) + (Weighted Personal Safety SI *.76) +(Weighted Strength of Civil Society SI *.79) + (Weighted Political Participation SI *.75) +(Weighted Housing SI *.82) + (Weighted Crime & Public Safety SI *.81) +(Weighted Economic SI *.87) + (Weighted Sports & Recreation SI *.62) +(Weighted Environmental Quality SI *.83) + (Weighted Family Solidarity SI *.71))]

10
ently generated weights were combined by the consultant to produce average indicator statis-
tical weights.
Each of the project’s 45 Panel of Experts participated in the assignment of statistical
weights to SDI-2000’s 14 basic and 5 supplemental subindexes. Statistical weights for the
subindexes are reported in Table 5.
),1',1*6
A. SDI-2000: General Findings
The study’s summary SDI-2000 findings are reported in Chart 1. The chart reports these data
in two ways: a) as Weighted Social Development Index (WSDI) scores for each of the
study’s five time periods--1981, 1986, 1991, 1996, 1998; and b) as standardized versions of
the composite scores in which 1991 is used as the baseline year against which earlier and
later development changes were assessed (1991=100).
&KDUW��
:HLJKWHG�6RFLDO�'HYHORSPHQW�,QGH[�6FRUHV�6WDQGDUGL]HG�:6',�6FRUHV�IRU�+RQJ�.RQJ������ �������������
��
��
��
��
��
���
��
���
��
���
:6',�6FRUHV
6WQ�:6',�6FRUHV
����
����
����
����
����
When viewed through the broadest possible social lens,
8 T(Z)98= (Value 1998 – (mean of values for 1986, 1991, 1996))/ (standard deviation 1986, 1991, 1996)
11
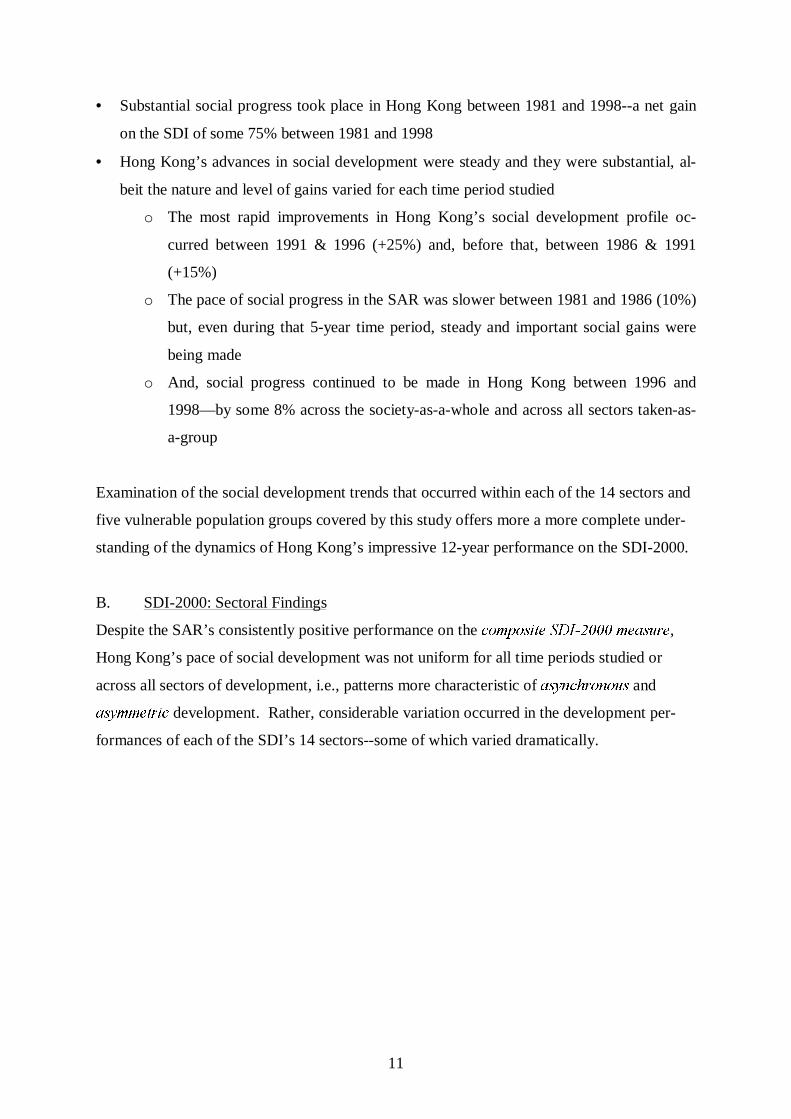
• Substantial social progress took place in Hong Kong between 1981 and 1998--a net gain
on the SDI of some 75% between 1981 and 1998
• Hong Kong’s advances in social development were steady and they were substantial, al-
beit the nature and level of gains varied for each time period studied
o The most rapid improvements in Hong Kong’s social development profile oc-
curred between 1991 & 1996 (+25%) and, before that, between 1986 & 1991
(+15%)
o The pace of social progress in the SAR was slower between 1981 and 1986 (10%)
but, even during that 5-year time period, steady and important social gains were
being made
o And, social progress continued to be made in Hong Kong between 1996 and
1998—by some 8% across the society-as-a-whole and across all sectors taken-as-
a-group
Examination of the social development trends that occurred within each of the 14 sectors and
five vulnerable population groups covered by this study offers more a more complete under-
standing of the dynamics of Hong Kong’s impressive 12-year performance on the SDI-2000.
B. SDI-2000: Sectoral Findings
Despite the SAR’s consistently positive performance on the FRPSRVLWH�6',������PHDVXUH,
Hong Kong’s pace of social development was not uniform for all time periods studied or
across all sectors of development, i.e., patterns more characteristic of DV\QFKURQRXV�and
DV\PPHWULF development. Rather, considerable variation occurred in the development per-
formances of each of the SDI’s 14 sectors--some of which varied dramatically.

12
Chart 2
• Very impressive 12-year social development gains occurred in two SDI-2000’s sec-
tors:
o 6FLHQFH�DQG�7HFKQRORJ\�6XELQGH[ (+107)
� Hong Kong’s net 12-year development increases were especially im-
pressive in: a) dramatic increases in the number of patents granted by
foreign patent offices to persons residing in or doing business in Hong
Kong; and b) even more dramatic increases in Hong Kong’s scholarly
contributions to the scientific literature
o (GXFDWLRQ�6XELQGH[ (+102)
� Hong Kong’s net 12-year development increases were especially im-
pressive in: a) rises in adult literacy rates; 2) the percentage of the
population completing upper secondary school; and 3) the percentage
of the population attaining tertiary level education
+RQJ�.RQJ�6RFLDO�'HYHORSPHQW�7UHQGV�E\�
6XELQGH[�DQG�0RGDO�7LPH�3HULRGV���������
[HK_Z_Sb_81-98]
���
���
��
��
��
��
��
��
��
��
��
��
��
����
6FL
(GX
$UW
,QW
+OWK
$FF
&LY
3RO
+RX
&UL
(FR
6SU
(QY
)DP
� �� ��� ������������������

13
• Impressive 12-year social development gains also were realized in 5 SDI sectors:
o $UWV��(QWHUWDLQPHQW�6XELQGH[ (+80)
� Hong Kong’s book publishing and film producing industries continued
to gain strength between 1986 and 1998.
� The number of historic sites preserved for future generations in Hong
Kong also increased markedly.
o ,QWHUQDWLRQDOL]DWLRQ�6XELQGH[ (+75)
� Hong Kong remains a place that people from throughout the world
travel to: a) meet with others; b) conduct business; c) promote interna-
tional exchange.
� Hong Kong remains a major international air and shipping port ensur-
ing its role as an economic gateway between Asian and Western socie-
ties.
o +HDOWK�6XELQGH[ (+59)
� Infant mortality rates, maternal mortality, and rates of infectious and
communicable diseases declined dramatically during the years covered
by the study.
� The average life expectation of Hong Kong residents increased dra-
matically and, currently, is among the longest worldwide.
� On the negative side, child mortality rates in Hong Kong are among
the highest among high human development countries. Adult cigarette
consumption rates remain high as do health risks problems associated
with air pollution, overcrowding, and somewhat lower than average
immunization rates for preventable childhood diseases.
o 3HUVRQDO�6DIHW\�6XELQGH[ (+55)
� Deaths from traffic accidents dropped precipitously during the period
of the study, albeit occupational fatalities and food poisoning cases
remain high.
o 6WUHQJWK�RI�&LYLO�6RFLHW\�6XELQGH[ (+49)
� Hong Kong’s civil society is an exemplar for the rest of East Asia.
This sector continued to gain strength of the 12 years of the study, al-
beit some tension continues to exist over the role of the private sector
vis-à-vis Hong Kong’s strong governmental and corporate sectors.

14
• And important, but less impressive, 12-year social development gains were achieved
in 3 SDI sectors:
o 3ROLWLFDO�3DUWLFLSDWLRQ�6XELQGH[ (+39)
� Increasing participation in the SAR’s political life is the dominant
finding on this subindex. Gains in this sector include: a) increases in
the numbers of persons willing to run for elected office; b) the propor-
tion of candidates willing to affiliate with political parties; and c)
electorate turnout rates.
o +RXVLQJ�6XELQGH[�(+39)
� Population density remains higher in Hong Kong than anywhere in the
world. This has a profound impact on its problematic housing sector
for which only modest 12-year gains were reported.
o &ULPH��3XEOLF�6DIHW\ (+30)
� Hong Kong remains a comparatively safely place with in which to
work and live, albeit a certain volume of crime does occur within the
SAR. The prevalence of both violent and non-violent crimes de-
creased steadily between 1991 and 1998, even during period of eco-
nomic recession. Convictions for public corruption crimes rose,
though, between 1986 and 1998.
• Comparatively slow 12-year improvements occurred on three additional SDI-2000
subindexes:
o (FRQRPLF�6XELQGH[�(+23)
o 6SRUWV�6XELQGH[ (+23)
o (QYLURQPHQW�6XELQGH[ (+14)
• Of considerable concern, though, are the very substantial social losses recorded on the
SDI’s )DPLO\�6ROLGDULW\�6XELQGH[�(-166)—the only basic SDI subindex for which
substantial net social losses were recorded! Hong Kong’s dramatic losses on this
subindex resulted from:
o Sharp decreases in the marriage rate;
o Sharp increases in the divorce rate; and,
o Rapidly increasing rates of family violence—including between spouses, to-
ward children, and between adult children and their aging parents living in the
child’s household

15
C. Hong Kong’s Vulnerable Population Groups
Considerable variation exists in the 12-year social development performances of Hong
Kong’s historically vulnerable population groups. The data for these groups are summarized
in the following chart (Chart 3).
&KDUW��
62&,$/�'(9(/230(17�75(1'6�)25�+21*�.21*¶6+,6725,&$//<�98/1(5$%/(�3238/$7,216�����������
��
��
���
���
���
:RPHQ
(OGHUO\
&KLOGUHQ
<RXWK
/RZ�,QFRPH
� �� �� �� ������������������
These data confirm that net social progress occurred for only two of Hong Kong’s historically
vulnerable population groups between 1986 an d 1998, i.e., ZRPHQ (+71) and WKH�HOGHUO\
(+13). But the pace of change observed for the elderly was so slow as to be considered insig-
nificant given the level of their needs!
Very troubling are the highly negative social development trend findings for three ad-
ditional population groups: FKLOGUHQ�(- 17),�\RXWK�(- 52)� and ORZ�LQFRPH�KRXVHKROGV�(- 77).
The size of all three populations for which net social losses were observed is quite large and
suggests the need for dramatic new initiatives in responding to the negative conditions that
persist for many of the most vulnerable subgroups within these populations. The situation is
especially urgent among Hong Kong’s low-income population groups whose numbers more
than doubled between 1986 (N=524,000) and 1998 (N=1,093,000).
During the same time period:

16
� The percentage of children aged 1-14 years living in low income households
increased by 77% from 13% to 23%
� The percentage of youth aged 15-19 years living in low income households in-
creased 122% from 9% to 20%
� The percentage of women living in low income households increased 70%
from 10% to 17%
� The percentage of elderly living in low income households increased by 55%
from 22% to 34%
',6&866,21
The social development patterns uncovered in this investigation are quite profound. Some
offer reassurance that Hong Kong is on the “right track” with respect to achieving at least a
portion of its social agenda—particularly in those sectors that advance is ambitious economic
goals. Other findings, though, are more disturbing—especially those that demonstrate that
entire segments of Hong Kong society are being left out of the prosperity enjoyed by others.
Disparities in development are particularly pronounced among the SAR’s growing numbers
of low-income households, its sizable population of troubled youth, and those tens of thou-
sands of elderly residents who have not been able to achieve a reasonable degree of security
in their old age. Large segments of the SAR’s children also are at considerable of social un-
der-development. Despite some important recent gains in social progress, social progress for
Hong Kong women is far from secure. And one of Hong Kong’s most important and tradi-
tional sources of social stability and strength, its extended family system, is under serious as-
sault.
Based on the results obtained from this investigation, Hong Kong appears already to
have developed into four distinct DQG�XQHTXDO societies: 1) the “well off” whose social posi-
tions and development status are largely immune from swings in the local economy; 2) the
“socially secure” who occupy important positions of influence and who have been able to
more or less insulate themselves against all but the most extreme development shifts occur-
ring in Hong Kong; 3) the “socially insecure” who are employed and are “making it”…but
with difficulty; and 4) a growing “underclass” of more or less permanently impoverished per-
sons who possess limited means of extricating themselves from poverty.
Many in Hong Kong’s social underclass are drawn from its new arrival community;
others have lived in the SAR for decades…even longer. All are poor. Most are under-
17
educated. A good many are ill. Some are drug dependent. Comparatively few possess the
educational or employment skills required to compete successful for other than the lowest
paying jobs. A disproportionate number occupy its infamous “caged homes”; some few sim-
ply sleep on the streets. This study suggests that the harsh social conditions that exist for too
many in Hong Kong today could dramatically swell the size of Hong Kong’s underclass over
the near-term.
7+(�&+$//(1*(6
Given the development patterns uncovered in this analysis, Hong Kong society could benefit
from a re-examination of the planning premises used to guide its development—especially
the SAR’s almost exclusive preoccupation with the economic dimensions of development.
Thus, careful consideration needs to be given to:
1. The adoption of a more balanced approach to development, i.e., one that places at
least equal priority on the social and economic dimensions of development; impor-
tance also must be assigned to the territory’s complex cultural and environmental de-
velopment.
2. A forum (council or committee) is need at the highest level of Hong Kong society to
promote balanced social and economic development. Membership on the forum
should include representatives of government, the for-profit commercial sector, and
Hong Kong’s leading private, not-for-profit, civil society organizations and institu-
tions. Prominent individuals and others with special knowledge and expertise con-
cerning the SAR’s development also should be members of the Development Forum.
3. Among others, the goals of the Development Forum should promote: a) stronger and
more effective partnerships between Hong Kong’s governmental and non-
governmental sectors; b) stronger and more effective partnerships between Hong
Kong’s human service and corporate sectors; c) stronger and more effective partner-
ships between Hong Kong’s governmental and private sectors, peoples organizations
and other grassroots organizations.
4. Hong Kong also requires a more comprehensive, i.e., integrated, approach to social
welfare--especially in meeting the income security and social service needs of Hong
Kong’s most vulnerable population groups. The SAR’s current “patch work quilt”
approach to social welfare is expensive and, based on the evidence provided in this

18
report, is not succeeding in reducing either the social disparities or income inequali-
ties that persist between various segments of Hong Kong society.
As confirmed by this investigation, Hong Kong is well positioned to achieve the pre-
ceding goals. The SAR’s most important resources in support of these goals include: 1) a
large and well-educated pool of human resources; 2) a high level of good will and spirit
of cooperation between Hong Kong’s people, government, nongovernmental organiza-
tions; 3) substantial private and public sector fiscal resource bases; 4) a commitment to
promote a high standard of living for all the people of Hong Kong; and 5) a delimited
geographic space free that is comparatively free of external threats.
Now that the facts about Hong Kong social development imbalances are known, the
question before Hong Kong society today concerns the extent to which all relevant seg-
ments of Hong Kong society--its extensive and well capitalized corporations, its powerful
governmental agencies, its influential non-governmental sector, its large number of ty-
coons and others with power, resources and influence---can be mobilized to reduce the
most extreme forms of social inequality that exist for an unparalleled number of the
SAR’s population?
5()(5(1&(6
Chan, Annie. 1995. Directory of Sports Facilities in Hong Kong� (Hong Kong: Hong KongSports Development Board).
Chan, Danny C.Y. 1996. Hong Kong Bus Handbook� (Hong Kong: Northcord Transport).
Chung, Ting-yiu, Robert. 1995. Surveys on Media Performance and Freedom of Speech:Summary Report�� (Hong Kong: Social Sciences Research Centre, University of Hong Kong).
Community Chest of Hong Kong. 1999. Annual Report 1998/99� (Hong Kong: CommunityChest).
Estes, Richard J. 1976. World social welfare analysis: A theoretical model, (with John S.Morgan) International Social Work 19(2):29-41.
Estes, Richard J. 1984. The Social Progress of Nations. (New York: Praeger).
Estes, Richard J. 1988. Trends in World Social Development. (New York: Praeger).
Estes, Richard J. 1990. Social development under different political and economic systems,Social Development Issues 13(1): 5-19.

19
Estes, Richard J. 1995. Social development trends in Africa: The need for a new developmentparadigm,�Social Development Issues�17(1):18-47.
Estes, Richard J. 1996a. Social development trends in Latin America, 1970-1994: In theshadows of the 21st century, Social Development Issues 18(1):25-52.
Estes, Richard J. 1996b. Social development trends in Asia, 1970-1994: The challenges of anew century, Social Indicators Research 37(2):119-148.
Estes, Richard J. 1997. Social development trends in Europe, 1970-94: Development pros-pects for the new Europe Social Indicators Research 42:1-19.
Estes, Richard J. 1998a. Social development trends in the successor states to the former So-viet Union: The Search for a new paradigm, in Kempe R. Hope, Jr., Challenges of Transfor-mation and Transition From Centrally Planned to Market Economies, (Nagoya: United Na-tions Centre for Regional Development), pp. 13-30.
Estes, Richard J. 1998b. Trends in World Social Development, 1970-95: Development Pros-pects For a New Century" Journal of Developing Societies 14(1):11-39.
Estes, Richard J. 1999a. Social development trends in the Middle East, 1970-1997: Thesearch for modernity, Social Indicators Research (1999):1-31.
Estes, Richard J. 1999b. The ’Poverties’: Competing Definitions and Alternative Approachesto Measurement," Social Development Issues 21(2):11-21.
Estes, Richard J. 1999c. ”Developmental trends in the Middle East: The policy context forbuilding and sustaining social policy reforms,” in Belkacem Labbas (Editor) Building andSustaining the Capacity for Social Policy Reforms (London: Ashgate Publishers, 1999).
Estes, Richard J. 2000. Social Development in Hong Kong: The Unfinished Agenda—FinalReport, (Hong Kong: Hong Kong Council of Social Service).
Hong Kong Census and Statistics Department. 1998. Hong Kong Annual Digest of statistics�(Hong Kong: Government Printer).
Hong Kong Census and Statistics Department.1999a. Annual Report on the Consumer PriceIndex, 1998� (Hong Kong: Consumer Price Index Section, Census & Statistics Department).
Hong Kong Census and Statistics Department. 1999b. Crime and Its Victims in Hong Kong1998 – A Report on Crime Victimization Survey Conducted in January 1999�� Compiled bythe Census and Statistics Department Under the Auspices of the Fight Crime Committee,1998� (Hong Kong: Government Printer).
Hong Kong Census and Statistics Department. 2000. Estimates of Gross Domestic Product1961/99. (Hong Kong: Government Printer).
Hong Kong Central Registry of Drug Abuse. 1998. Forty-Second Report��-DQ������-XQ������� (Hong Kong: Government Printer).

20
Hong Kong Commission on Strategic Development. 2000. Bringing the Vision to Life: HongKong’s Long-Term Development Needs and Goals. (Hong Kong: the Government of theHong Kong Special Administrative Region).
Hong Kong Consumer Council. 1999. Annual Report 1997-98�� (Hong Kong: The Council).
Hong Kong Coroners’ Office.1999. Coroners Report, 1998� (Hong Kong: GovernmentPrinter).
Hong Kong Department of Health. 1999. Annual Departmental Report / by Director ofHealth 1997/98� (Hong Kong: Government Printer).
Hong Kong Education Department. 1999. Enrolment Statistics, 1998��(Hong Kong: StatisticsSection, Education Department).
Hong Kong Environmental Protection Department. 1998. Monitoring of Solid Waste inHong Kong. (Hong Kong: The Department).
Hong Kong Hospital Authority. 1999. Hospital Authority Statistical Report 1997/98� (HongKong: Hospital Authority).
Hong Kong Housing Authority. 1998. Annual Report 1997/98� (Hong Kong: GovernmentPrinter).
Hong Kong Immigration Department. 1998. Annual Report 1997/98���(Hong Kong: Gov-ernment Printer).
Hong Kong Independent Commission Against Corruption. 1999. 1998 Annual report by theCommissioner of the Independent Commission Against Corruption� (Hong Kong: Govern-ment Printer).
Hong Kong Labour Department. 1999. Report of the Commissioner for Labour 1998. (HongKong: the Department).
Hong Kong Police Force. 1998. Hong Kong Police Review, 1997� (Hong Kong: Govern-ment Printer).
Hong Kong Social Welfare Department. 1998. Annual departmental report by the Director ofSocial Welfare Department, 1996-97� (Hong Kong: Government Printer).
Hong Kong Sports Development Board. 1998. Annual Report, 1997-98���(Hong Kong: TheBoard).
Hong Kong Television and Entertainment Licensing Authority. 1998. Annual Report, 1997-98� (Hong Kong: The Authority).
Hong Kong Tourist Association. 1999. A Statistical Review of Tourism: Hong Kong, 1998�(Hong Kong: The Association).

21
Hong Kong Transport Department. 1999. Road Traffic Accident Statistics���(Hong Kong:Road Safety Division, Transport Department).
Lau, S.K, Lee, M.K., Wan, P.S and Wong, S.L. 1999. Indicators of Social Development:Hong Kong 1997. (Hong Kong: Hong Kong Institute of Asian-Pacific Studies, The ChineseUniversity of Hong Kong).
Samaritan Befrienders. 1998. Annual Report by the Samaritan Befrienders H.K., 1997�(Hong Kong: Samaritan Befrienders Hong Kong).
University Grants Committee of Hong Kong. 1999���URBCO & USD in Figures 1998/99.(Hong Kong: The Council).
United Nations Development Programme. 1999. Human Development Report, 1999. (NewYork: Oxford University Press).
World Bank. 2000. World Development Report, 1999/2000 (New York: Oxford UniversityPress).


![?ddelWj l[ FheZkYj :[i ]d · 2019. 7. 31. · k $hwqd qf w } ] Ç $jhqgd 3urgxfw /lihf\foh 7kh 5roh ri wkh $fwxdu\ qqrydwlrq lq +hdowk qvxudqfh](https://img.pdfslide.us/doc/110x75/60b2a3113f5876772278edd4/ddelwj-l-fhezkyj-i-d-2019-7-31-k-hwqd-qf-w-jhqgd-3urgxfw-lihffoh.jpg)