Embed Size (px)
Citation preview
6.21The Geologic History of SeawaterH. D. Holland
Harvard University, Cambridge, MA, USA
6.21.1 INTRODUCTION 583
6.21.2 THE HADEAN (4.5–4.0 Ga) 584
6.21.3 THE ARCHEAN (4.0–2.5 Ga) 5856.21.3.1 The Isua Supracrustal Belt, Greenland 5856.21.3.2 The Mesoarchean Period (3.7–3.0 Ga) 5896.21.3.3 The Neoarchean (3.0–2.5 Ga) 591
6.21.4 THE PROTEROZOIC 5956.21.4.1 The Paleoproterozoic (2.5–1.8 Ga) 5956.21.4.2 The Mesoproterozoic (1.8–1.2 Ga) 5996.21.4.3 The Neoproterozoic (1.2–0.54 Ga) 601
6.21.5 THE PHANEROZOIC 6056.21.5.1 Evidence from Marine Evaporites 6056.21.5.2 The Mineralogy of Marine Oolites 6066.21.5.3 The Magnesium Content of Foraminifera 6076.21.5.4 The Spencer–Hardie Model 6096.21.5.5 The Analysis of Unevaporated Seawater in Fluid Inclusions 6116.21.5.6 The Role of the Stand of Sea Level 6116.21.5.7 Trace Elements in Marine Carbonates 6126.21.5.8 The Isotopic Composition of Boron in Marine Carbonates 6146.21.5.9 The Isotopic Composition of Strontium in Marine Carbonates 6146.21.5.10 The Isotopic Composition of Osmium in Seawater 6146.21.5.11 The Isotopic Composition of Sulfur and Carbon in Seawater 6156.21.5.12 The Isotopic Composition of Oxygen in Seawater 616
6.21.6 A BRIEF SUMMARY 616
ACKNOWLEDGMENTS 618
REFERENCES 618
6.21.1 INTRODUCTION
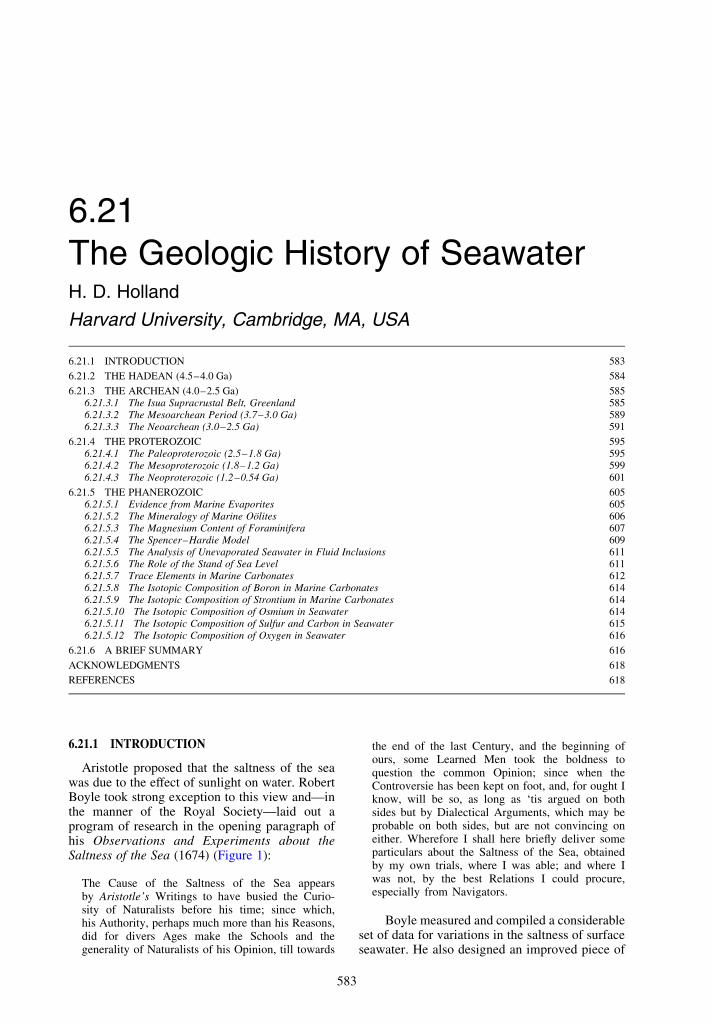
Aristotle proposed that the saltness of the seawas due to the effect of sunlight on water. RobertBoyle took strong exception to this view and—inthe manner of the Royal Society—laid out aprogram of research in the opening paragraph ofhis Observations and Experiments about theSaltness of the Sea (1674) (Figure 1):
The Cause of the Saltness of the Sea appearsby Aristotle’s Writings to have busied the Curio-sity of Naturalists before his time; since which,his Authority, perhaps much more than his Reasons,did for divers Ages make the Schools and thegenerality of Naturalists of his Opinion, till towards
the end of the last Century, and the beginning ofours, some Learned Men took the boldness toquestion the common Opinion; since when theControversie has been kept on foot, and, for ought Iknow, will be so, as long as ‘tis argued on bothsides but by Dialectical Arguments, which may beprobable on both sides, but are not convincing oneither. Wherefore I shall here briefly deliver someparticulars about the Saltness of the Sea, obtainedby my own trials, where I was able; and where Iwas not, by the best Relations I could procure,especially from Navigators.
Boyle measured and compiled a considerableset of data for variations in the saltness of surfaceseawater. He also designed an improved piece of
583
equipment for sampling seawater at depth, butthe depths at which it was used were modest: 30 mwith his own instrument, 80 m with another,similar sampler. However, the younger JohnWinthrop (1606–1676), an early member of theRoyal Society, an important Governor ofConnecticut, and a benefactor of Harvard College,was asked to collect seawater from the bottom ofthe Atlantic Ocean during his crossing fromEngland to New England in the spring of 1663.The minutes of the Royal Society’s meeting onJuly 20, 1663, give the following account ofhis unsuccessful attempt to do so (Birch, 1756;Black, 1966):
Mr. Winthrop’s letter written from Boston toMr. Oldenburg was read, giving an account of thetrials made by him at sea with the instrument forsounding of depths without a line, and with the vesselfor drawing water from the bottom of the sea; bothwhich proved successless, the former by reason oftoo much wind at the time of making soundings; thelatter, on account of the leaking of the vessel. Capt.Taylor being to go soon to Virginia, and offeringhimself to make the same experiments, the society
recommended to him the trying of the one in calmweather, and of the other with a stanch vessel.
Mr. Hooke mentioning, that a better way mightbe suggested to make the experiment above-mentioned, was desired to think farther upon it, andto bring in an account thereof at the next meeting.
A little more than one hundred years later, in the1780s, John Walker (1966) lectured at Edinburghon the saltness of the oceans. He marshaled all ofthe available data and concluded that “thesereasons seem all to point to this, that the waterof the ocean in respect to saltness is pretty muchwhat it ever has been.”
In this opinion he disagreed with Halley (1715),who suggested that the salinity of the oceans hasincreased with time, and that the ratio of the totalsalt content of the oceans to the rate at whichrivers deliver salt to the sea could be used toascertain the age of the Earth. The first reallyserious attempt to measure geologic time by thismethod was made by Joly (1899). His calculationswere refined by Clarke (1911), who inferred thatthe age of the ocean, since the Earth assumed itspresent form, is somewhat less than 100 Ma. Heconcluded, however, that “the problem cannot beregarded as definitely solved until all availablemethods of estimation shall have convergedon one common conclusion.” There was littleappreciation in his approach for the magnitude of:(i) the outputs of salt from the oceans,(ii) geochemical cycles, and (iii) the notion of asteady-state ocean. In fact, Clarke’s “age” of theocean turns out to be surprisingly close to theoceanic residence time of Naþ and Cl2.
The modern era of inquiry into the history ofseawater can be said to have begun with the workof Conway (1943, 1945), Rubey (1951), and Barth(1952). Much of the progress that was madebetween the appearance of these publications andthe early 1980s was summarized by Holland(1984). This chapter describes a good deal of theprogress that has been made since then.
6.21.2 THE HADEAN (4.5–4.0 Ga)
The broad outlines of Earth history during theHadean are starting to become visible. The solarsystem originated 4.57 Ga (Allegre et al., 1995).The accretion of small bodies in the solar nebulaoccurred within ,10 Myr of the birth of the solarsystem (Lugmaier and Shukolyukov, 1998). TheEarth reached its present mass between 4.51 Gaand 4.45 Ga (Halliday, 2000; Sasaki andNakazawa, 1986; Porcelli et al., 1998). The coreformed in ,30 Ma (Yin et al., 2002; Kleine et al.,2002). The early Earth was covered by a magmaocean, but this must have cooled quickly at the end
Figure 1 Title page of Robert Boyle’s Tracts consist-ing of Observations about the Saltness of the Sea and
other essays (1674).
The Geologic History of Seawater584
of the accretion process, and the first primitivecrust must have formed shortly thereafter.
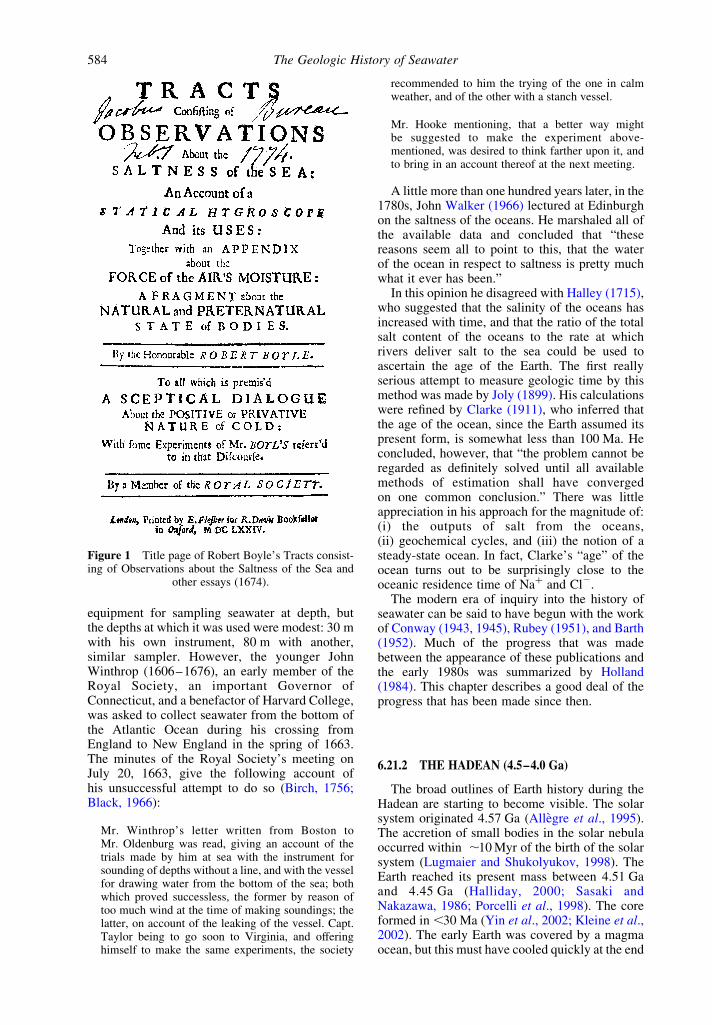
At present we do not have any rocks older than4.03 Ga (Bowring and Williams, 1999). There are,however, zircons older than 4.03 Ga which wereweathered out of their parent rocks and incorpor-ated in 3 Ga quartzitic rocks in the MurchisonDistrict of Western Australia (Froude et al., 1983;Compston and Pidgeon, 1986; Nutman et al.,1991; Nelson et al., 2000). A considerable numberof 4.2–4.3 Ga zircon grains have been found inthe Murchison District. A single 4.40 Ga zircongrain has been described by Wilde et al. (2001).The oxygen of these zircons has apparentlyretained its original isotopic composition. Mojzsiset al. (2001), Wilde et al. (2001), and Peck et al.(2001) have shown that the d18O values of thezircons which they have analyzed are significantlymore positive than those of zircons which havecrystallized from mantle magmas (see Figure 2).The most likely explanation for this difference isthat the melts from which the zircons crystallizedcontained a significant fraction of materialenriched in 18O. This component was probably apart of the pre-4.0 Ga crust. Its enrichment in 18Owas almost certainly the result of subaerialweathering, which generates 18O-enriched clayminerals (see, e.g., Holland, 1984, pp. 241–251).If this interpretation is correct, the data imply thepresence of an active hydrologic cycle, a signifi-cant quantity of water at the Earth surface, and anearly continental crust. However, as Halliday(2001) has pointed out, inferring the existence ofentire continents from zircon grains in a single
area requires quite a leap of the imagination. Weneed more zircon data from many areas to confirmthe inferences drawn from the small amount ofavailable data. Nevertheless, the inferences them-selves are reasonable and fit into a coherent modelof the Hadean Earth.
At present, little can be said with any degree ofconfidence about the composition of the proposedHadean ocean, but it was probably not verydifferent from that of the Early Archean ocean,about which a good deal can be inferred.
6.21.3 THE ARCHEAN (4.0–2.5 Ga)
6.21.3.1 The Isua Supracrustal Belt, Greenland
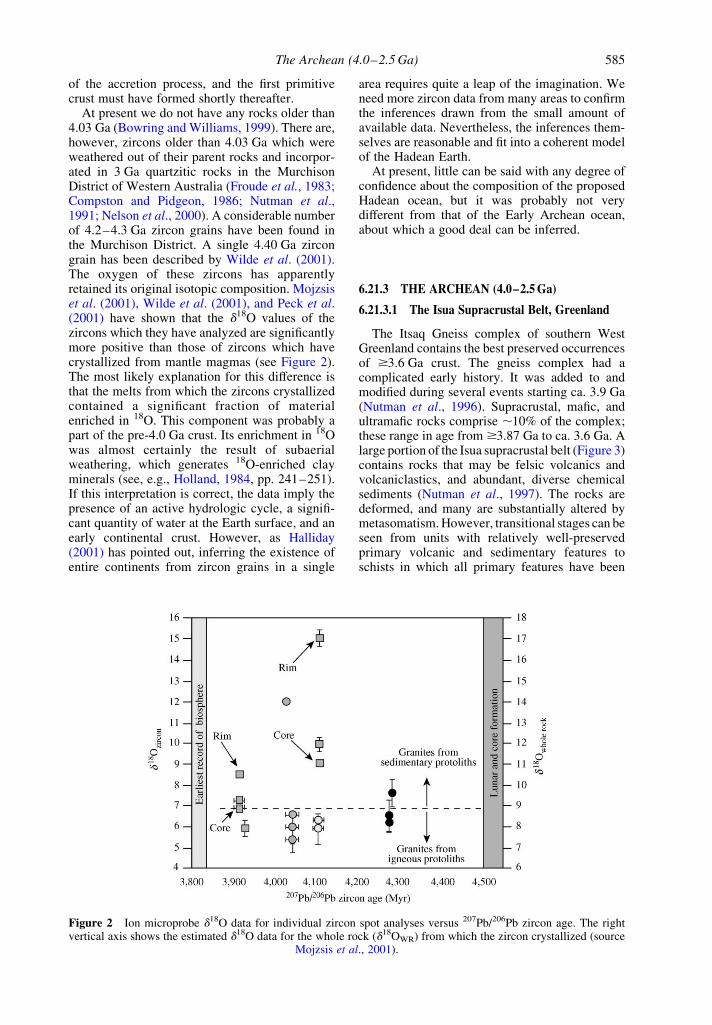
The Itsaq Gneiss complex of southern WestGreenland contains the best preserved occurrencesof $3.6 Ga crust. The gneiss complex had acomplicated early history. It was added to andmodified during several events starting ca. 3.9 Ga(Nutman et al., 1996). Supracrustal, mafic, andultramafic rocks comprise ,10% of the complex;these range in age from $3.87 Ga to ca. 3.6 Ga. Alarge portion of the Isua supracrustal belt (Figure 3)contains rocks that may be felsic volcanics andvolcaniclastics, and abundant, diverse chemicalsediments (Nutman et al., 1997). The rocks aredeformed, and many are substantially altered bymetasomatism. However, transitional stages can beseen from units with relatively well-preservedprimary volcanic and sedimentary features toschists in which all primary features have been
Figure 2 Ion microprobe d18O data for individual zircon spot analyses versus 207Pb/206Pb zircon age. The rightvertical axis shows the estimated d18O data for the whole rock (d18OWR) from which the zircon crystallized (source
Mojzsis et al., 2001).
The Archean (4.0–2.5 Ga) 585
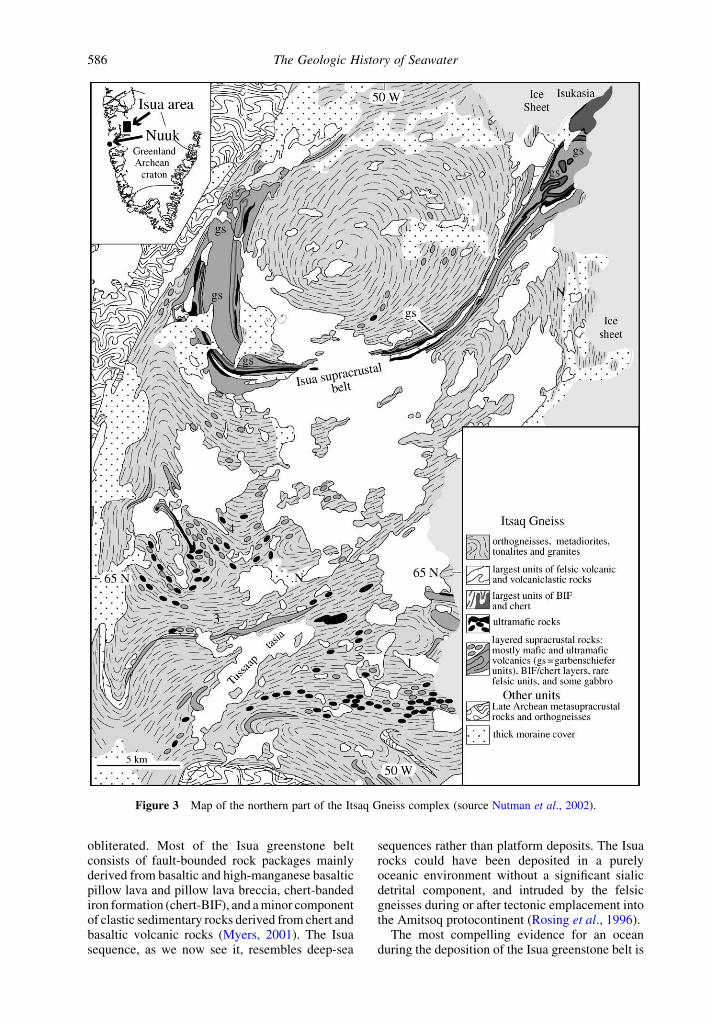
obliterated. Most of the Isua greenstone beltconsists of fault-bounded rock packages mainlyderived from basaltic and high-manganese basalticpillow lava and pillow lava breccia, chert-bandediron formation (chert-BIF), and a minor componentof clastic sedimentary rocks derived from chert andbasaltic volcanic rocks (Myers, 2001). The Isuasequence, as we now see it, resembles deep-sea
sequences rather than platform deposits. The Isuarocks could have been deposited in a purelyoceanic environment without a significant sialicdetrital component, and intruded by the felsicgneisses during or after tectonic emplacement intothe Amitsoq protocontinent (Rosing et al., 1996).
The most compelling evidence for an oceanduring the deposition of the Isua greenstone belt is
Figure 3 Map of the northern part of the Itsaq Gneiss complex (source Nutman et al., 2002).
The Geologic History of Seawater586
provided by the BIF deposits which occur in thissequence. They are highly metamorphosed. Boakand Dymek (1982) have shown that the peliticrocks in the sequence were exposed to tempera-tures of ,550 8C at pressures of ,5 kbar.Temperatures during metamorphism could nothave exceeded ,600 8C. The mineralogy and thechemistry of the iron formations have obviouslybeen altered by metamorphism, but their majorfeatures are still preserved. Magnetite-quartz BIFsare particularly common. Iron enrichment can beextensive, as shown by the presence of a two-billion ton body at the very north-easternmost limitof the supracrustal belt (Bridgewater et al., 1976).
In addition to the quartz-magnetite iron for-mation, Dymek and Klein (1988) describedmagnesian iron formation, aluminous iron for-mation, graphitic iron formation, and carbonaterich iron formation. They pointed out that thecomposition of the iron formation as a whole isvery similar to that of other Archean andProterozoic iron formations that have beenmetamorphosed to the amphibolite facies.
The source of the iron and probably much of thesilica in the BIF was almost certainly seawater thathad cycled through oceanic crust at temperaturesof several hundred degree celsius. The lowconcentration of sulfur and of the base metalsthat are always present in modern solutions of thistype indicates that these elements were removed,probably as sulfides of the base metals before thedeposition of the iron oxides and silicates of theIsua iron formations.
The molar ratio of Fe2O3/FeO in the BIFs is lessthan 1.0 in all but one of the 28 analyses of Isuairon formation reported by Dymek and Klein(1988). In the one exception the ratio is 1.17.Unless the values of this ratio were reducedsignificantly during metamorphism, the analysesindicate that magnetite was the dominant ironoxide, and that hematite was absent or very minorin these iron formations. This, in turn, shows thatsome of the hydrothermal Fe2þ was oxidized toFe3þ prior to deposition, but that not enough wasoxidized to lead to the precipitation of Fe2O3 and/or Fe3þ oxyhydroxide precursors, or that thesephases were subsequently replaced by magnetite.
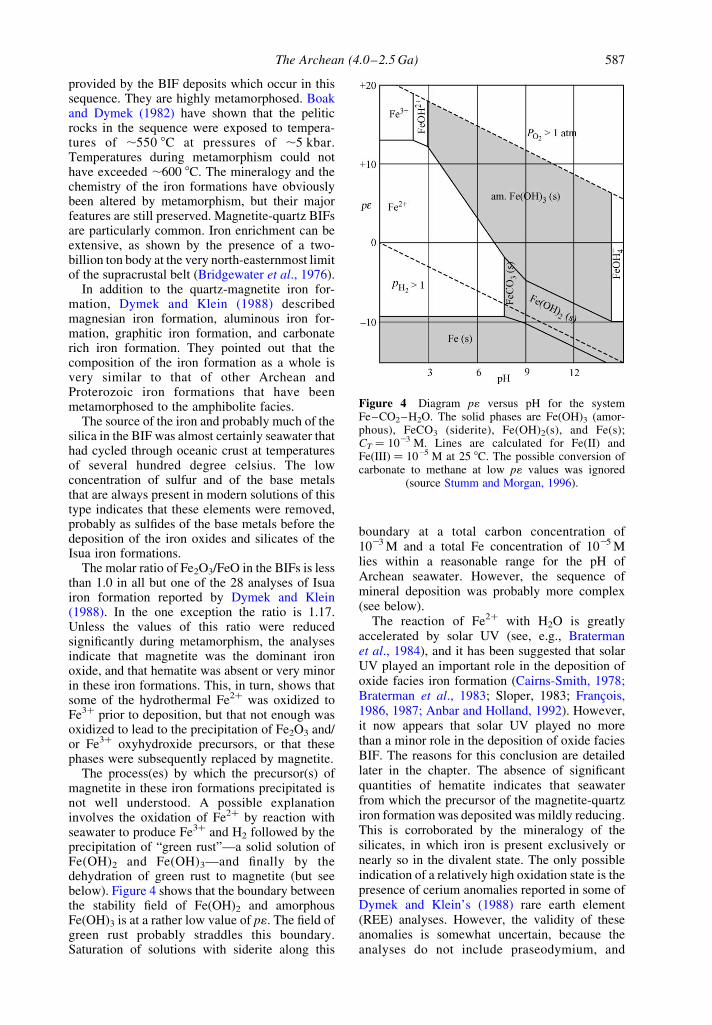
The process(es) by which the precursor(s) ofmagnetite in these iron formations precipitated isnot well understood. A possible explanationinvolves the oxidation of Fe2þ by reaction withseawater to produce Fe3þ and H2 followed by theprecipitation of “green rust”—a solid solution ofFe(OH)2 and Fe(OH)3—and finally by thedehydration of green rust to magnetite (but seebelow). Figure 4 shows that the boundary betweenthe stability field of Fe(OH)2 and amorphousFe(OH)3 is at a rather low value of p1. The field ofgreen rust probably straddles this boundary.Saturation of solutions with siderite along this
boundary at a total carbon concentration of1023 M and a total Fe concentration of 1025 Mlies within a reasonable range for the pH ofArchean seawater. However, the sequence ofmineral deposition was probably more complex(see below).
The reaction of Fe2þ with H2O is greatlyaccelerated by solar UV (see, e.g., Bratermanet al., 1984), and it has been suggested that solarUV played an important role in the deposition ofoxide facies iron formation (Cairns-Smith, 1978;Braterman et al., 1983; Sloper, 1983; Francois,1986, 1987; Anbar and Holland, 1992). However,it now appears that solar UV played no morethan a minor role in the deposition of oxide faciesBIF. The reasons for this conclusion are detailedlater in the chapter. The absence of significantquantities of hematite indicates that seawaterfrom which the precursor of the magnetite-quartziron formation was deposited was mildly reducing.This is corroborated by the mineralogy of thesilicates, in which iron is present exclusively ornearly so in the divalent state. The only possibleindication of a relatively high oxidation state is thepresence of cerium anomalies reported in some ofDymek and Klein’s (1988) rare earth element(REE) analyses. However, the validity of theseanomalies is somewhat uncertain, because theanalyses do not include praseodymium, and
Figure 4 Diagram p1 versus pH for the systemFe–CO2–H2O. The solid phases are Fe(OH)3 (amor-phous), FeCO3 (siderite), Fe(OH)2(s), and Fe(s);CT ¼ 1023 M. Lines are calculated for Fe(II) andFe(III) ¼ 1025 M at 25 8C. The possible conversion ofcarbonate to methane at low p1 values was ignored
(source Stumm and Morgan, 1996).
The Archean (4.0–2.5 Ga) 587
because neodymium measurements are lacking in anumber of cases. Fryer (1983) had earlier observedthat no significantly anomalous behavior of ceriumhas been found in any Archean iron formations, andneither Appel (1983) and Shimizu et al. (1990), norBau and Moller (1993) were able to detect ceriumanomalies in samples of the Isua iron formation.
One of the most intriguing sedimentary unitsdescribed by Dymek and Klein (1988) is thegraphitic iron formation. Four samples of this unitcontained between 0.70% and 2.98% finelydispersed graphite. Quartz, magnetite, and cum-mingtonite are their main mineral constituents.The origin of the graphite has been a matter ofconsiderable debate. Schidlowski et al. (1979)reported a range of 25.9‰ to 222.2‰ forthe d13C value of 13 samples of graphite fromIsua. They proposed that the graphite representsthe metamorphosed remains of primary Isuaorganisms, that the isotopically light carbon insome of their graphite samples reflects the isotopiccomposition of these organisms, and that theisotopically heavy carbon in some of theirgraphite samples reflects the redistribution ofcarbon isotopes between organic and carbonatecarbon during amphibolite grade metamorphism.Perry and Ahmad (1977) found d13C valuesbetween 29.3‰ and 216.3‰ in Isua supracrustalrocks and pointed out that the fractionation of thecarbon isotopes between siderite and graphite intheir samples is consistent with inorganic equili-brium of these phases at ,400–500 8C. Oehlerand Smith (1977) found graphite with d13C valuesof 211.3‰ to 217.4‰ in Isua metapelites (?)containing 150–4,800 ppm reduced carbon, andgraphite with a d13C range between 221.4‰ and226.9‰ in metasediments from the Isua ironformation which contain only trace amounts ofgraphite (4–56 ppm). The carbon in the lattersamples is thought to be due to postdepositionalcontamination.
Since then Mojzsis et al. (1996) have usedin situ ion microprobe techniques to measure theisotopic composition of carbon in Isua BIF and ina unit from the nearby Akilia Island that may beBIF. d13C in carbonaceous inclusions in the BIFranged from 223‰ to 234‰; those in carboninclusions occluded in apatite micrograins fromthe Akilia Island BIF ranged from 221‰ to249‰. Since the carbon grains embedded inapatite were small and irregular, the precision andaccuracy of the individual d13C measurementswas typically ^5‰ (1s). These measurementstend to confirm the Schidlowski et al. (1979)interpretation, and suggest that the graphite in theIsua and Akilia BIFs could well be the metamor-phosed remains of primitive organisms. However,other interpretations have been advanced veryforcefully (see, e.g., Holland, 1997; Van Zuilenet al., 2002).
Naraoka et al. (1996) have added additionald13C measurements, which fall in the same rangeas those reported previously. They emphasize thatgraphite with d13C values around 212‰ was pro-bably formed by an inorganic, rather than bya biological process. Rosing (1999) reported d13Cvalues ranging from 211.4‰ to 220.2‰ in2 –5 mm graphite globules in turbiditic andpelagic sedimentary rocks from the Isua supra-crustal belt. He suggests that the reduced carbon inthese samples represents biogenic detritus, whichwas perhaps derived from planktonic organisms.
This rather large database certainly suggeststhat life was present in the 3.7–3.9 Ga oceans, butit is probably best to treat the proposition as likelyrather than as proven. One of the argumentsagainst the presence of life before 3.8 Ga is basedon the likelihood of large extraterrestrial impactsduring a late heavy bombardment (LHB). Thecraters of the moon record an intense bombard-ment by large bodies, ending abruptly ca. 3.85 Ga(Dalrymple and Ryder, 1996; Hartmann et al.,2000; Ryder, 1990). The Earth was probablyimpacted at least as severely as the moon, andthere is a high probability that impacts largeenough to vaporize the ocean’s photic zoneoccurred as late as 3.8 Ga (Sleep et al., 1989).The environment of the early Earth, therefore,may have been extremely challenging to life(Chyba, 1993; Appel and Moorbath, 1999). Therehas, however, been little direct examination of theEarth’s surface environment during this period.The metasediments at Isua and on Akilia Islandsupply a small window on the effects ofextraterrestrial bombardment between ca. 3.8 Gaand 3.9 Ga. Anbar et al. (2002) have determinedthe concentration of iridium and platinum in threesamples of a ,5 m thick BIF chert unit and inthree samples of mafic–ultramafic flows inter-posed with BIF in a relatively undeformed sectionon Akilia Island. The iridium and platinumconcentrations in the Akilia metasediments areall extremely low. The iridium content of onlyone of the BIF/chert samples is above 3 ppt,the detection limit of the ID–ICP–MS tech-niques. The concentration of platinum isbelow the detection limit (40 ppt) in nearly all ofthe BIF/chert samples. Both elements werereadily detected in the mafic–ultramafic samples.The extremely low concentration of iridium andplatinum in the BIF/chert samples shows thattheir composition was not significantly affectedby extraterrestrial impacts. It is difficult, however,to extrapolate from these few analyses to otherenvironments between 3.8 Ga and 3.9 Ga,especially because it has been proposed thatthese rocks are not sedimentary (Fedo andWhitehouse, 2002). As Anbar et al. (2002)have pointed out, the large time gaps betweenthe large, life-threatening impact events require
The Geologic History of Seawater588
extensive sampling of the rock record for thedetection of the impact events. The slim evidencesupplied by the Anbar et al. (2002) studyencourages the view that conditions were suffi-ciently benign for the existence of life on Earthduring the deposition of the sediments at Isua andon Akilia, but optimism on this point must surelybe tempered, and it is premature to speculate onthe effects of the potential biosphere on the state ofthe oceans 3.8–3.9 Ga.
6.21.3.2 The Mesoarchean Period (3.7–3.0 Ga)
Evidence for the presence of life is abundantduring the later part of the Mesoarchean period.Unmetamorphosed carbonaceous shales with d13Cvalues that are consistent with a biological originof the contained carbon are reasonably common(see, e.g., Schidlowski et al., 1983; Strauss et al.,1992). The nature of the organisms that populatedthe Mesoarchean oceans is still hotly disputed.The description of microfossils in the 3.45 GaWarrawoona Group of Western Australia bySchopf and Packer (1987) and Schopf (1983)suggested that some of these microfossils wereprobably the remains of cyanobacteria. If so,oxygenic photosynthesis is at least as old as3.45 Ga. Brasier et al. (2002) have re-examinedthe type sections of the material described bySchidlowski et al. (1983) and have reinterpretedall of his 11 holotypes as artifacts formed fromamorphous graphite within multiple generationsof metalliferous hydrothermal vein chert andvolcanic glass. However, Schopf et al. (2002)maintain that the laser Raman imagery of thismaterial not only establishes the biogenicity of thefossils which they have studied, but also providesinsight into the chemical changes thataccompanied the metamorphism of these organ-ics. Whatever the outcome of this debate, it ismost likely that the oceans contained an upper,photic zone, that ,20% of the volcanic CO2 addedto the atmosphere was reduced and buried as aconstituent of organic water, and that the remain-ing 80% were buried as a constituent of marinecarbonates (see, e.g., Holland, 2002).
The influence of these processes on the compo-sition of Mesoarchean seawater is still unclear.De Ronde et al. (1997) have studied thefluid chemistry of what they believe areArchean seafloor hydrothermal vents, and haveexplored the implications of their analyses forthe composition of contemporary seawater. Theyestimate that seawater contained 920 mmol L21 Cl,2.25 mmol L21 Br, 2.3 mmol L21 SO4, 0.037mmol L21 I, 789 mmol L21 Na, 5.1 mmol L21
NH4, 18.9 mmol L21 K, 50.9 mmol L21 Mg,232 mmol L21 Ca, and 4.52 mmol L21 Sr. Thiscomposition, if correct, implies that Archeanseawater was rather similar to modern seawater.
Unfortunately, there is considerable doubt aboutthe correctness of these concentrations. First, thecomposition of seawater is altered significantlyduring passage through the oceanic crust, and thereconstruction of the composition of seawater fromthat of hydrothermal fluids is not straightforward.Second the charge balance of the proposedseawater is quite poor. Third, the quartz whichcontained the fluid inclusions analyzed byDe Ronde et al. (1997) is intimately associatedwith hematite and goethite. The former mineralis most unusual as an ocean floor mineral at 3.2 Ga.The latter is also unusual, because these sedimentspassed through a metamorphic event at 2.7 Gaduring which the temperature rose to .200 8C(De Ronde et al., 1994). It is not unlikelythat the inclusion fluids analyzed by De Rondeet al. were trapped more recently than 3.2 Ga,and that they are not samples of 3.2 Ga seawater(Lowe, personal communication, 2002).
The direct evidence for the composition ofMesoarchean seawater is, therefore, quite weak.For the time being it seems best to rely on indirectevidence derived from the mineralogy of sedi-ments from this period, the composition of theseminerals, and the isotopic composition of theircontained elements. The carbonate minerals inArchean sediments are particularly instructive(see, e.g., Holland, 1984, chapter 5). Calcite,aragonite, and dolomite were the dominantcarbonate minerals. Siderite was only a commonconstituent of BIFs. These observations imply thatthe Archean oceans were saturated or, more likely,supersaturated with respect to CaCO3 andCaMg(CO3)2. Translating this observation intovalues for the concentration of Ca2þ, Mg2þ,HCO3
2, and CO322 in seawater is difficult in the
absence of other information, but it can be shownthat for the likely range of values of atmosphericPCO2
(#0.03 atm; Rye et al., 1995), the pH ofseawater was probably $6.5. At saturationwith respect to calcite and dolomite at 25 8C,the ratio mMg2þ/mCa2þ in solutions is close to 1.0.This does not have to be the value of the ratio inArchean seawater. In Phanerozoic seawater (seebelow), the Mg2þ/Ca2þ ratio varied considerablyfrom values as low as 1 up to its present valueof 5.3 (Lowenstein et al., 2001; Horita et al.,2002).
A rough upper limit to the Fe2þ/Ca2þ ratio inArchean seawater can be derived from the scarcityof siderite except as a constituent of carbonate ironformations. At saturation with respect to sideriteand calcite, the ratio mFe2þ/mCa2þ is approximatelyequal to the ratio of the solubility product ofsiderite (Bruno et al., 1992) and calcite (Plummerand Busenberg, 1982):
mFe2þ
mCa2þ
<Ksid
Kcal
¼10210:8
1028:4¼ 4 £ 1023 ð1Þ
The Archean (4.0–2.5 Ga) 589
The absence of siderite from normal Archeancarbonate sequences indicates that this is areasonable upper limit for the Fe2þ/Ca2þ ratio innormal Archean seawater. An approximate lowerlimit can be set by the Fe2þcontent of limestonesand dolomites. These contain significantly moreFe2þ and Mn2þ than their Phanerozoic counter-parts (see, e.g., Veizer et al., 1989), a finding thatis consistent with a much lower O2 content in theatmosphere and in near-surface seawater thantoday.
The strongest evidence for no more than afew ppm O2 in the Archean and Early Paleopro-terozoic atmosphere is the evidence for mass-independent fractionation (MIF) of the sulfurisotopes in pre-2.47 Ga sulfides and sulfates(Farquhar et al., 2000, 2001; Pavlov and Kasting,2002; Bekker et al., 2002). In the absence of O2,solar UV interacts with SO2 and generates MIF ofthe sulfur isotopes in the reaction products. TheMIF signal is probably preserved in the sedimen-tary record, because this signal in elemental sulfurproduced by this process differs from that of thegaseous products. The fate of the elemental sulfurand sulfur gases is not well understood, but S0 maywell be deposited largely as a constituent ofsulfide minerals and the sulfur that is present as aconstituent of sulfur gases in part as a constituentof sulfates. Today very little of the MIF signal ispreserved, because all of the products are gasesthat become isotopically well mixed before theburial of their contained sulfur.
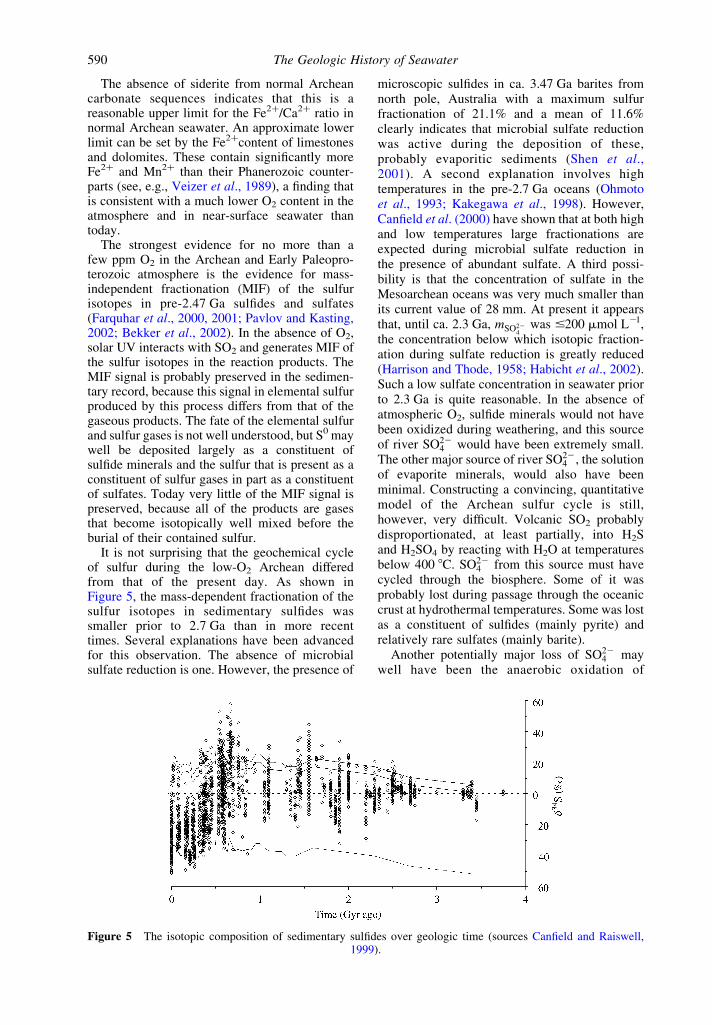
It is not surprising that the geochemical cycleof sulfur during the low-O2 Archean differedfrom that of the present day. As shown inFigure 5, the mass-dependent fractionation of thesulfur isotopes in sedimentary sulfides wassmaller prior to 2.7 Ga than in more recenttimes. Several explanations have been advancedfor this observation. The absence of microbialsulfate reduction is one. However, the presence of
microscopic sulfides in ca. 3.47 Ga barites fromnorth pole, Australia with a maximum sulfurfractionation of 21.1% and a mean of 11.6%clearly indicates that microbial sulfate reductionwas active during the deposition of these,probably evaporitic sediments (Shen et al.,2001). A second explanation involves hightemperatures in the pre-2.7 Ga oceans (Ohmotoet al., 1993; Kakegawa et al., 1998). However,Canfield et al. (2000) have shown that at both highand low temperatures large fractionations areexpected during microbial sulfate reduction inthe presence of abundant sulfate. A third possi-bility is that the concentration of sulfate in theMesoarchean oceans was very much smaller thanits current value of 28 mm. At present it appearsthat, until ca. 2.3 Ga, mSO22
4was #200 mmol L21,
the concentration below which isotopic fraction-ation during sulfate reduction is greatly reduced(Harrison and Thode, 1958; Habicht et al., 2002).Such a low sulfate concentration in seawater priorto 2.3 Ga is quite reasonable. In the absence ofatmospheric O2, sulfide minerals would not havebeen oxidized during weathering, and this sourceof river SO22
4 would have been extremely small.The other major source of river SO22
4 ; the solutionof evaporite minerals, would also have beenminimal. Constructing a convincing, quantitativemodel of the Archean sulfur cycle is still,however, very difficult. Volcanic SO2 probablydisproportionated, at least partially, into H2Sand H2SO4 by reacting with H2O at temperaturesbelow 400 8C. SO22
4 from this source must havecycled through the biosphere. Some of it wasprobably lost during passage through the oceaniccrust at hydrothermal temperatures. Some was lostas a constituent of sulfides (mainly pyrite) andrelatively rare sulfates (mainly barite).
Another potentially major loss of SO224 may
well have been the anaerobic oxidation of
Figure 5 The isotopic composition of sedimentary sulfides over geologic time (sources Canfield and Raiswell,1999).
The Geologic History of Seawater590
methane via the overall reaction
CH4 þ SO224 ! HCO3
2 þ HS2 þ H2O ð2Þ
(Iversen and Jørgensen, 1985; Hoehler andAlperin, 1996; Orphan et al., 2001). It seemslikely that the reaction is accomplished in part by aconsortium of Archaea growing in dense aggre-gates of ,100 cells, which are surrounded bysulfate-reducing bacteria (Boetius et al., 2000;De Long, 2000). In sediments rich in organicmatter SO22
4 is depleted rapidly. Below the zoneof SO22
4 depletion CH4 is produced. The gasdiffuses upward and is destroyed, largely in thetransition zone, where the concentration ofSO22
4 in the interstitial water is in the range of0.1–1 mmol kg21 (Iversen and Jørgensen, 1985).The rate of CH4 oxidation is highest where itsconcentration is equal to that of SO22
4 . In twostations studied by Iversen and Jørgensen, thetotal anaerobic methane oxidation was closeto 1 mmol m22 d21, of which 96% occurred inthe sulfate–methane transition zone. If this ratewere characteristic of the ocean floor as a whole,SO22
4 reduction within marine sediments wouldoccur at a rate of , (1£ 1014) mol yr21, whichexceeds the present-day input of volcanic SO2 byca. two orders of magnitude. The process is,therefore, potentially important for the globalgeochemistry of sulfur and carbon.
The anaerobic oxidation of CH4 also occurs inanoxic water masses. In the Black Sea only ,2%of the CH4 which escapes from sediments reachesthe atmosphere. The remainder is largely lost bysulfate reduction in the anoxic parts of the watercolumn (Reeburgh et al., 1991). In an oceancontaining #1 mmol L21 SO22
4 the rate of CH4
loss in the water column would almost certainly besmaller than in the Black Sea today, and the flux ofCH4 to the atmosphere would almost certainly begreater than today. Pavlov et al. (2000) haveshown that the residence time of CH4 in an anoxicatmosphere is ,3£104 yr, i.e., some 1,000 timeslonger than today. The combination of a higherrate of CH4 input and a longer residence time inthe atmosphere virtually assures that the partialpressure of CH4 was much higher in the Archeanatmosphere than its present value of , (1 £ 1026)atm. A CH4 pressure of 1024–1023 atm is notunlikely (Catling et al., 2001). At these levels CH4
generates a very significant greenhouse warming,enough to overcome the likely lower luminosity ofthe Sun during the early part of Earth history(Kasting et al., 2001). The recent discoveryof microbial reefs in the Black Sea fueledby the anaerobic oxidation of methane by SO22
4
(Michaelis et al., 2002) suggests that this processwas important during the Archean, and that it canaccount for some of the organic matter generatedin the oceans before the rise of atmospheric O2.
6.21.3.3 The Neoarchean (3.0–2.5 Ga)
The spread in the d34S value of sulfides andsulfates increased significantly between 3.0 Gaand 2.5 Ga. The first major increase in the d34Srange occurred ,2.7 Ga (see Figure 5). However,sulfate concentrations probably stayed well belowthe present value of 28 mmol kg21 until theNeoproterozoic. Grotzinger (1989) has reviewedthe mineralogy of Precambrian evaporites and hasshown that calcium sulfate minerals (or theirpseudomorphs) are scarce before ,1.7–1.6 Ga.Bedded or massive gypsum/anhydrite formed inevaporitic environments is absent in the Archeanand Paleoproterozoic record. A low concentrationof SO22
4 in the pre-1.7 Ga oceans is the mostreasonable explanation for these observations(Grotzinger and Kasting, 1993).
Rather interestingly, the oldest usable bio-markers in carbonaceous shales date from theNeoarchean. Molecular fossils extracted from2.5 Ga to 2.7 Ga shales of the Fortescue andHamersley groups in the Pilbara Craton, WesternAustralia, indicate that the photic zone of thewater column in the areas where these shales weredeposited was probably weakly oxygenated, andthat cyanobacteria were part of the microbialbiota (Brocks et al., 1999, 2002; Summons et al.,1999). The similarity of the timing of the rise inthe range of d34S in sediments and the earliestevidence for the presence of cyanobacteria may,however, be coincidental, because to date nosediments older than 2.7 Ga have been found thatcontain usable biomarker molecules (Brocks,personal communication, 2002).
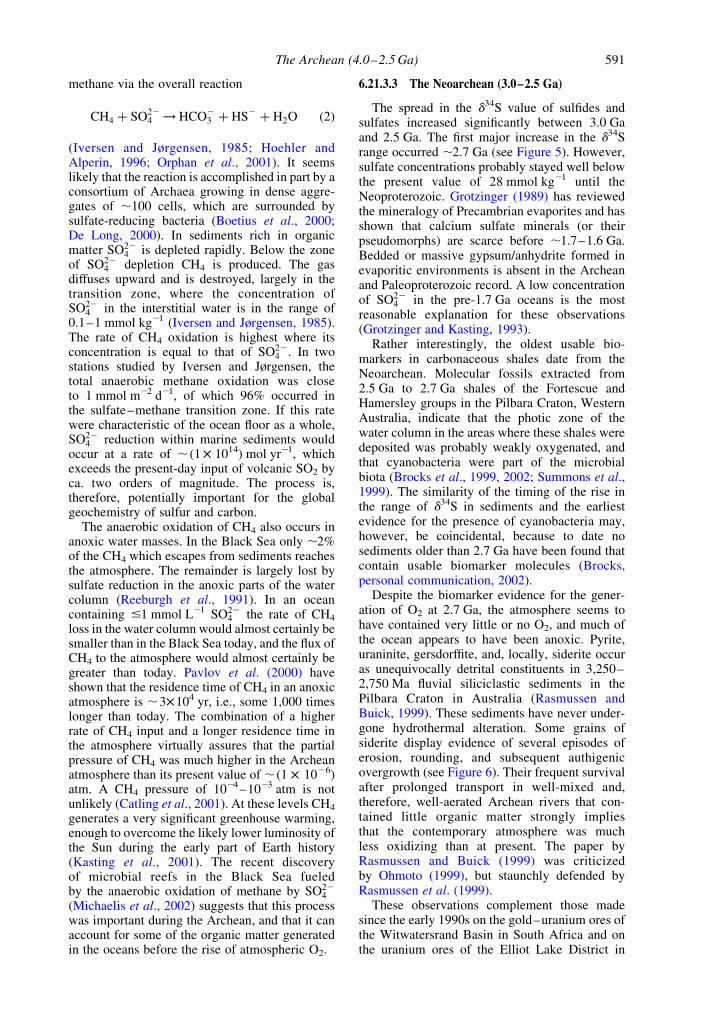
Despite the biomarker evidence for the gener-ation of O2 at 2.7 Ga, the atmosphere seems tohave contained very little or no O2, and much ofthe ocean appears to have been anoxic. Pyrite,uraninite, gersdorffite, and, locally, siderite occuras unequivocally detrital constituents in 3,250–2,750 Ma fluvial siliciclastic sediments in thePilbara Craton in Australia (Rasmussen andBuick, 1999). These sediments have never under-gone hydrothermal alteration. Some grains ofsiderite display evidence of several episodes oferosion, rounding, and subsequent authigenicovergrowth (see Figure 6). Their frequent survivalafter prolonged transport in well-mixed and,therefore, well-aerated Archean rivers that con-tained little organic matter strongly impliesthat the contemporary atmosphere was muchless oxidizing than at present. The paper byRasmussen and Buick (1999) was criticizedby Ohmoto (1999), but staunchly defended byRasmussen et al. (1999).
These observations complement those madesince the early 1990s on the gold–uranium ores ofthe Witwatersrand Basin in South Africa and onthe uranium ores of the Elliot Lake District in
The Archean (4.0–2.5 Ga) 591
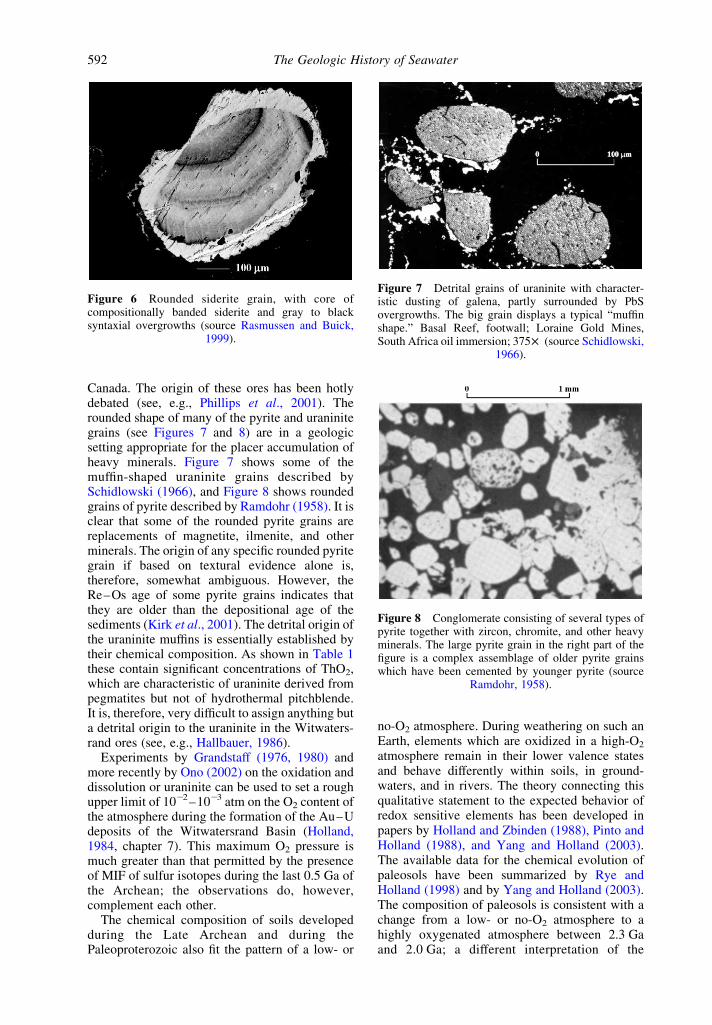
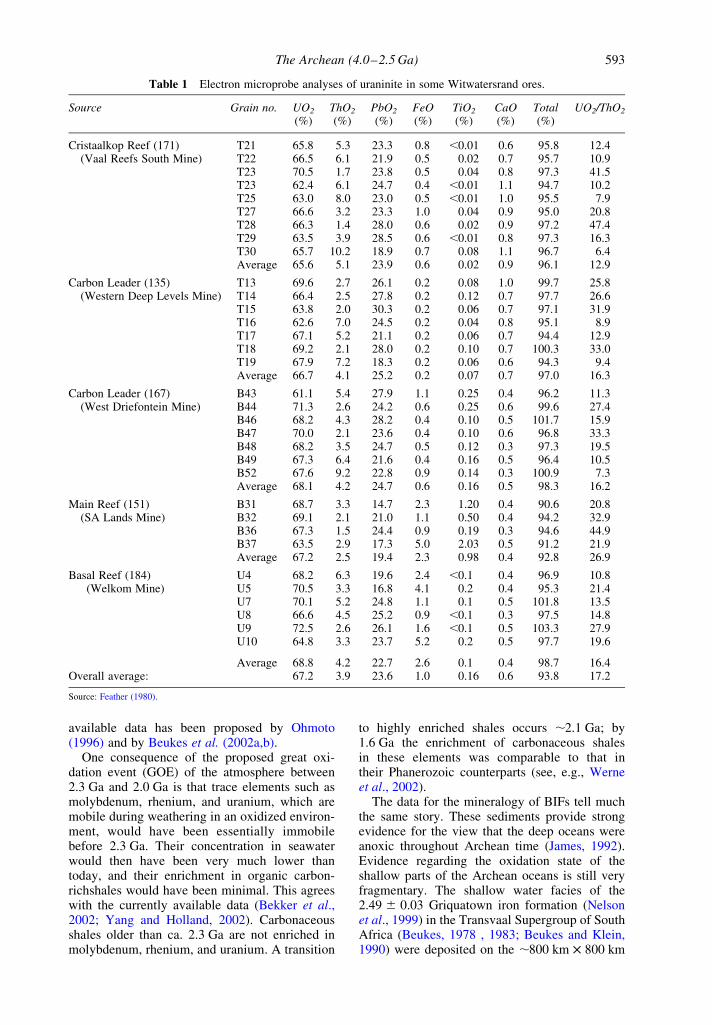
Canada. The origin of these ores has been hotlydebated (see, e.g., Phillips et al., 2001). Therounded shape of many of the pyrite and uraninitegrains (see Figures 7 and 8) are in a geologicsetting appropriate for the placer accumulation ofheavy minerals. Figure 7 shows some of themuffin-shaped uraninite grains described bySchidlowski (1966), and Figure 8 shows roundedgrains of pyrite described by Ramdohr (1958). It isclear that some of the rounded pyrite grains arereplacements of magnetite, ilmenite, and otherminerals. The origin of any specific rounded pyritegrain if based on textural evidence alone is,therefore, somewhat ambiguous. However, theRe–Os age of some pyrite grains indicates thatthey are older than the depositional age of thesediments (Kirk et al., 2001). The detrital origin ofthe uraninite muffins is essentially established bytheir chemical composition. As shown in Table 1these contain significant concentrations of ThO2,which are characteristic of uraninite derived frompegmatites but not of hydrothermal pitchblende.It is, therefore, very difficult to assign anything buta detrital origin to the uraninite in the Witwaters-rand ores (see, e.g., Hallbauer, 1986).
Experiments by Grandstaff (1976, 1980) andmore recently by Ono (2002) on the oxidation anddissolution or uraninite can be used to set a roughupper limit of 1022–1023 atm on the O2 content ofthe atmosphere during the formation of the Au–Udeposits of the Witwatersrand Basin (Holland,1984, chapter 7). This maximum O2 pressure ismuch greater than that permitted by the presenceof MIF of sulfur isotopes during the last 0.5 Ga ofthe Archean; the observations do, however,complement each other.
The chemical composition of soils developedduring the Late Archean and during thePaleoproterozoic also fit the pattern of a low- or
no-O2 atmosphere. During weathering on such anEarth, elements which are oxidized in a high-O2
atmosphere remain in their lower valence statesand behave differently within soils, in ground-waters, and in rivers. The theory connecting thisqualitative statement to the expected behavior ofredox sensitive elements has been developed inpapers by Holland and Zbinden (1988), Pinto andHolland (1988), and Yang and Holland (2003).The available data for the chemical evolution ofpaleosols have been summarized by Rye andHolland (1998) and by Yang and Holland (2003).The composition of paleosols is consistent with achange from a low- or no-O2 atmosphere to ahighly oxygenated atmosphere between 2.3 Gaand 2.0 Ga; a different interpretation of the
Figure 6 Rounded siderite grain, with core ofcompositionally banded siderite and gray to blacksyntaxial overgrowths (source Rasmussen and Buick,
1999).
Figure 7 Detrital grains of uraninite with character-istic dusting of galena, partly surrounded by PbSovergrowths. The big grain displays a typical “muffinshape.” Basal Reef, footwall; Loraine Gold Mines,South Africa oil immersion; 375£ (source Schidlowski,
1966).
Figure 8 Conglomerate consisting of several types ofpyrite together with zircon, chromite, and other heavyminerals. The large pyrite grain in the right part of thefigure is a complex assemblage of older pyrite grainswhich have been cemented by younger pyrite (source
Ramdohr, 1958).
The Geologic History of Seawater592
available data has been proposed by Ohmoto(1996) and by Beukes et al. (2002a,b).
One consequence of the proposed great oxi-dation event (GOE) of the atmosphere between2.3 Ga and 2.0 Ga is that trace elements such asmolybdenum, rhenium, and uranium, which aremobile during weathering in an oxidized environ-ment, would have been essentially immobilebefore 2.3 Ga. Their concentration in seawaterwould then have been very much lower thantoday, and their enrichment in organic carbon-richshales would have been minimal. This agreeswith the currently available data (Bekker et al.,2002; Yang and Holland, 2002). Carbonaceousshales older than ca. 2.3 Ga are not enriched inmolybdenum, rhenium, and uranium. A transition
to highly enriched shales occurs ,2.1 Ga; by1.6 Ga the enrichment of carbonaceous shalesin these elements was comparable to that intheir Phanerozoic counterparts (see, e.g., Werneet al., 2002).
The data for the mineralogy of BIFs tell muchthe same story. These sediments provide strongevidence for the view that the deep oceans wereanoxic throughout Archean time (James, 1992).Evidence regarding the oxidation state of theshallow parts of the Archean oceans is still veryfragmentary. The shallow water facies of the2.49 ^ 0.03 Griquatown iron formation (Nelsonet al., 1999) in the Transvaal Supergroup of SouthAfrica (Beukes, 1978 , 1983; Beukes and Klein,1990) were deposited on the ,800 km £ 800 km
Table 1 Electron microprobe analyses of uraninite in some Witwatersrand ores.
Source Grain no. UO2 ThO2 PbO2 FeO TiO2 CaO Total UO2/ThO2
(%) (%) (%) (%) (%) (%) (%)
Cristaalkop Reef (171) T21 65.8 5.3 23.3 0.8 ,0.01 0.6 95.8 12.4(Vaal Reefs South Mine) T22 66.5 6.1 21.9 0.5 0.02 0.7 95.7 10.9
T23 70.5 1.7 23.8 0.5 0.04 0.8 97.3 41.5T23 62.4 6.1 24.7 0.4 ,0.01 1.1 94.7 10.2T25 63.0 8.0 23.0 0.5 ,0.01 1.0 95.5 7.9T27 66.6 3.2 23.3 1.0 0.04 0.9 95.0 20.8T28 66.3 1.4 28.0 0.6 0.02 0.9 97.2 47.4T29 63.5 3.9 28.5 0.6 ,0.01 0.8 97.3 16.3T30 65.7 10.2 18.9 0.7 0.08 1.1 96.7 6.4Average 65.6 5.1 23.9 0.6 0.02 0.9 96.1 12.9
Carbon Leader (135) T13 69.6 2.7 26.1 0.2 0.08 1.0 99.7 25.8(Western Deep Levels Mine) T14 66.4 2.5 27.8 0.2 0.12 0.7 97.7 26.6
T15 63.8 2.0 30.3 0.2 0.06 0.7 97.1 31.9T16 62.6 7.0 24.5 0.2 0.04 0.8 95.1 8.9T17 67.1 5.2 21.1 0.2 0.06 0.7 94.4 12.9T18 69.2 2.1 28.0 0.2 0.10 0.7 100.3 33.0T19 67.9 7.2 18.3 0.2 0.06 0.6 94.3 9.4Average 66.7 4.1 25.2 0.2 0.07 0.7 97.0 16.3
Carbon Leader (167) B43 61.1 5.4 27.9 1.1 0.25 0.4 96.2 11.3(West Driefontein Mine) B44 71.3 2.6 24.2 0.6 0.25 0.6 99.6 27.4
B46 68.2 4.3 28.2 0.4 0.10 0.5 101.7 15.9B47 70.0 2.1 23.6 0.4 0.10 0.6 96.8 33.3B48 68.2 3.5 24.7 0.5 0.12 0.3 97.3 19.5B49 67.3 6.4 21.6 0.4 0.16 0.5 96.4 10.5B52 67.6 9.2 22.8 0.9 0.14 0.3 100.9 7.3Average 68.1 4.2 24.7 0.6 0.16 0.5 98.3 16.2
Main Reef (151) B31 68.7 3.3 14.7 2.3 1.20 0.4 90.6 20.8(SA Lands Mine) B32 69.1 2.1 21.0 1.1 0.50 0.4 94.2 32.9
B36 67.3 1.5 24.4 0.9 0.19 0.3 94.6 44.9B37 63.5 2.9 17.3 5.0 2.03 0.5 91.2 21.9Average 67.2 2.5 19.4 2.3 0.98 0.4 92.8 26.9
Basal Reef (184) U4 68.2 6.3 19.6 2.4 ,0.1 0.4 96.9 10.8(Welkom Mine) U5 70.5 3.3 16.8 4.1 0.2 0.4 95.3 21.4
U7 70.1 5.2 24.8 1.1 0.1 0.5 101.8 13.5U8 66.6 4.5 25.2 0.9 ,0.1 0.3 97.5 14.8U9 72.5 2.6 26.1 1.6 ,0.1 0.5 103.3 27.9U10 64.8 3.3 23.7 5.2 0.2 0.5 97.7 19.6
Average 68.8 4.2 22.7 2.6 0.1 0.4 98.7 16.4Overall average: 67.2 3.9 23.6 1.0 0.16 0.6 93.8 17.2
Source: Feather (1980).
The Archean (4.0–2.5 Ga) 593
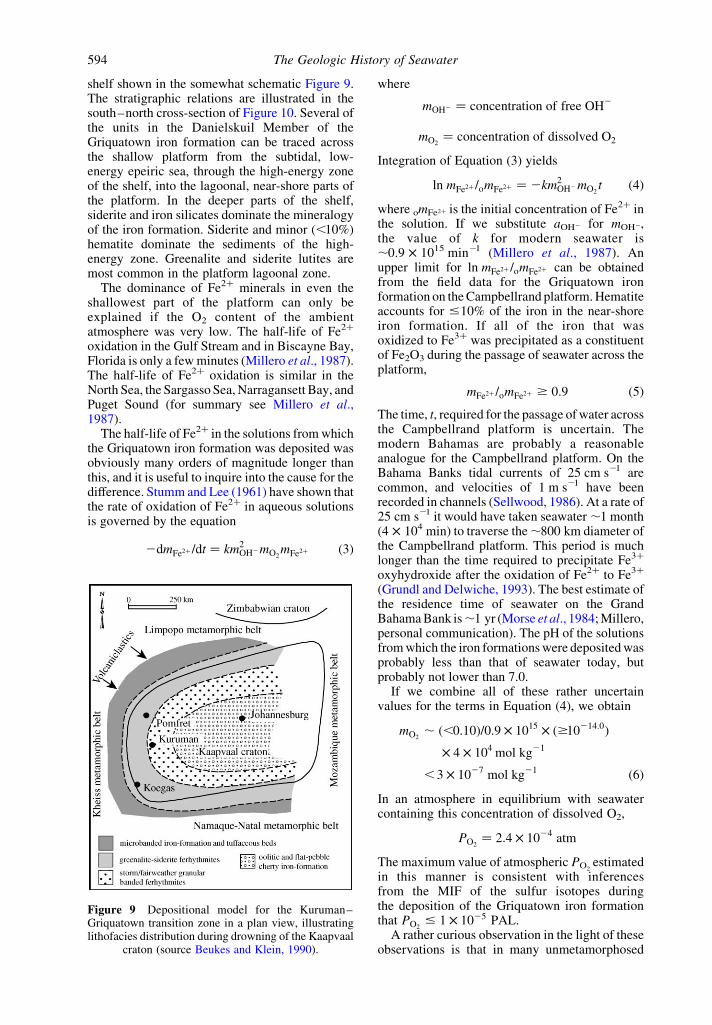
shelf shown in the somewhat schematic Figure 9.The stratigraphic relations are illustrated in thesouth–north cross-section of Figure 10. Several ofthe units in the Danielskuil Member of theGriquatown iron formation can be traced acrossthe shallow platform from the subtidal, low-energy epeiric sea, through the high-energy zoneof the shelf, into the lagoonal, near-shore parts ofthe platform. In the deeper parts of the shelf,siderite and iron silicates dominate the mineralogyof the iron formation. Siderite and minor (,10%)hematite dominate the sediments of the high-energy zone. Greenalite and siderite lutites aremost common in the platform lagoonal zone.
The dominance of Fe2þ minerals in even theshallowest part of the platform can only beexplained if the O2 content of the ambientatmosphere was very low. The half-life of Fe2þ
oxidation in the Gulf Stream and in Biscayne Bay,Florida is only a few minutes (Millero et al., 1987).The half-life of Fe2þ oxidation is similar in theNorth Sea, the Sargasso Sea, Narragansett Bay, andPuget Sound (for summary see Millero et al.,1987).
The half-life of Fe2þ in the solutions from whichthe Griquatown iron formation was deposited wasobviously many orders of magnitude longer thanthis, and it is useful to inquire into the cause for thedifference. Stumm and Lee (1961) have shown thatthe rate of oxidation of Fe2þ in aqueous solutionsis governed by the equation
2dmFe2þ =dt ¼ km2OH2mO2
mFe2þ ð3Þ
where
mOH2 ¼ concentration of free OH2
mO2¼ concentration of dissolved O2
Integration of Equation (3) yields
ln mFe2þ =omFe2þ ¼ 2km2OH2mO2
t ð4Þ
where omFe2þ is the initial concentration of Fe2þ inthe solution. If we substitute aOH2 for mOH2,the value of k for modern seawater is,0.9 £ 1015 min21 (Millero et al., 1987). Anupper limit for ln mFe2þ =omFe2þ can be obtainedfrom the field data for the Griquatown ironformation on the Campbellrand platform. Hematiteaccounts for #10% of the iron in the near-shoreiron formation. If all of the iron that wasoxidized to Fe3þ was precipitated as a constituentof Fe2O3 during the passage of seawater across theplatform,
mFe2þ =omFe2þ $ 0:9 ð5Þ
The time, t, required for the passage of water acrossthe Campbellrand platform is uncertain. Themodern Bahamas are probably a reasonableanalogue for the Campbellrand platform. On theBahama Banks tidal currents of 25 cm s21 arecommon, and velocities of 1 m s21 have beenrecorded in channels (Sellwood, 1986). At a rate of25 cm s21 it would have taken seawater ,1 month(4 £ 104 min) to traverse the ,800 km diameter ofthe Campbellrand platform. This period is muchlonger than the time required to precipitate Fe3þ
oxyhydroxide after the oxidation of Fe2þ to Fe3þ
(Grundl and Delwiche, 1993). The best estimate ofthe residence time of seawater on the GrandBahama Bank is,1 yr (Morse et al., 1984; Millero,personal communication). The pH of the solutionsfrom which the iron formations were deposited wasprobably less than that of seawater today, butprobably not lower than 7.0.
If we combine all of these rather uncertainvalues for the terms in Equation (4), we obtain
mO2, ð,0:10Þ=0:9 £ 1015 £ ð$10214:0Þ
£ 4 £ 104 mol kg21
,3 £ 1027 mol kg21 ð6Þ
In an atmosphere in equilibrium with seawatercontaining this concentration of dissolved O2,
PO2¼ 2:4 £ 1024 atm
The maximum value of atmospheric PO2estimated
in this manner is consistent with inferencesfrom the MIF of the sulfur isotopes duringthe deposition of the Griquatown iron formationthat PO2
# 1 £ 1025 PAL.A rather curious observation in the light of these
observations is that in many unmetamorphosed
Figure 9 Depositional model for the Kuruman–Griquatown transition zone in a plan view, illustratinglithofacies distribution during drowning of the Kaapvaal
craton (source Beukes and Klein, 1990).
The Geologic History of Seawater594
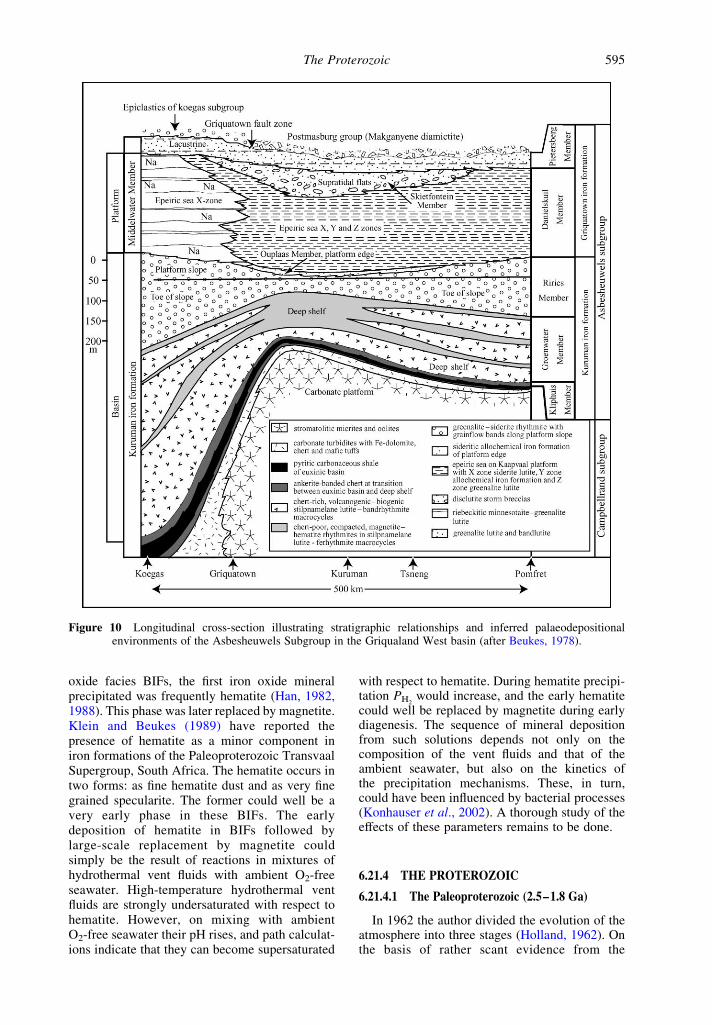
oxide facies BIFs, the first iron oxide mineralprecipitated was frequently hematite (Han, 1982,1988). This phase was later replaced by magnetite.Klein and Beukes (1989) have reported thepresence of hematite as a minor component iniron formations of the Paleoproterozoic TransvaalSupergroup, South Africa. The hematite occurs intwo forms: as fine hematite dust and as very finegrained specularite. The former could well be avery early phase in these BIFs. The earlydeposition of hematite in BIFs followed bylarge-scale replacement by magnetite couldsimply be the result of reactions in mixtures ofhydrothermal vent fluids with ambient O2-freeseawater. High-temperature hydrothermal ventfluids are strongly undersaturated with respect tohematite. However, on mixing with ambientO2-free seawater their pH rises, and path calculat-ions indicate that they can become supersaturated
with respect to hematite. During hematite precipi-tation PH2
would increase, and the early hematitecould well be replaced by magnetite during earlydiagenesis. The sequence of mineral depositionfrom such solutions depends not only on thecomposition of the vent fluids and that of theambient seawater, but also on the kinetics ofthe precipitation mechanisms. These, in turn,could have been influenced by bacterial processes(Konhauser et al., 2002). A thorough study of theeffects of these parameters remains to be done.
6.21.4 THE PROTEROZOIC
6.21.4.1 The Paleoproterozoic (2.5–1.8 Ga)
In 1962 the author divided the evolution of theatmosphere into three stages (Holland, 1962). Onthe basis of rather scant evidence from the
Figure 10 Longitudinal cross-section illustrating stratigraphic relationships and inferred palaeodepositionalenvironments of the Asbesheuwels Subgroup in the Griqualand West basin (after Beukes, 1978).
The Proterozoic 595
mineralogy of Precambrian sedimentary uraniumdeposits, it was suggested that free oxygen was notpresent in appreciable amounts until ca. 1.8 Ga,but that by the end of the Paleozoic the O2 contentof the atmosphere was already a large fraction ofits present value. In a similar vein, Cloud (1968)proposed that the atmosphere before 1.8–2.0 Gacould have contained little or no free oxygen. In1984 the author published a much more extensiveanalysis of the rise of atmospheric oxygen(Holland, 1984). Progress since 1962 had beenrather modest. After reading the section onatmospheric O2 in the Precambrian, RobertGarrels commented that this part of the book wasvery long but rather short on conclusions. Muchmore progress was reported in 1994 (Holland,1994), and the last few years have shown awidespread acceptance of his proposed “greatoxidation event” (GOE) between ca. 2.3 Ga and2.0 Ga. This acceptance has not, however, beenuniversal. Ohmoto and his group have steadfastlymaintained (Ohmoto, 1996, 1999) that the level ofatmospheric O2 has been close to its present levelduring the past 3.5–4.0 Ga.
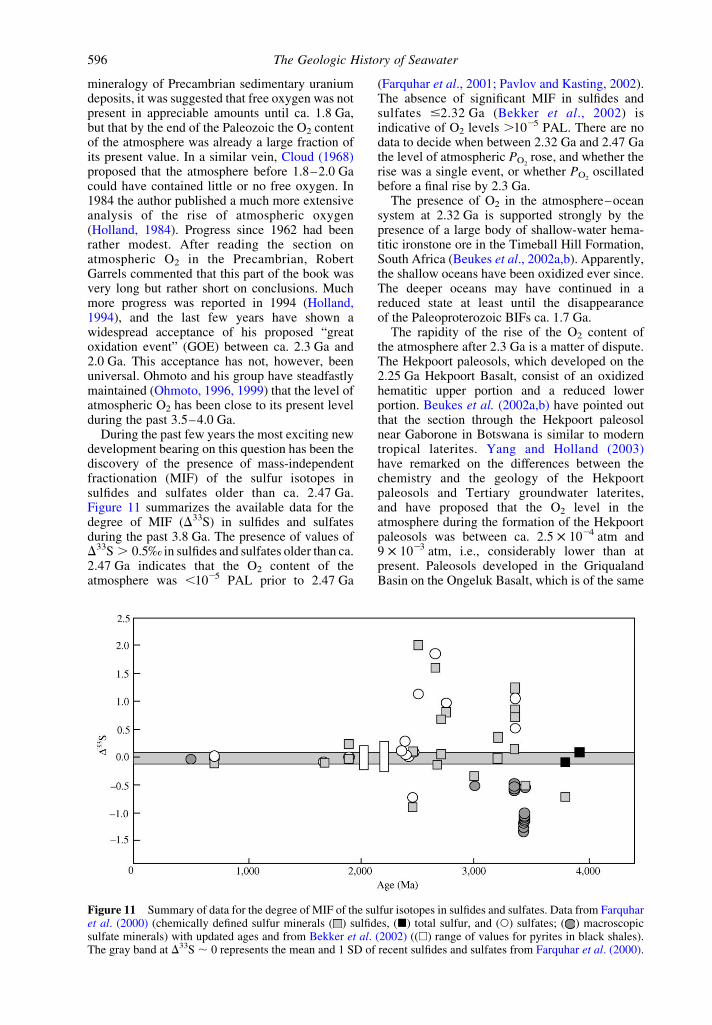
During the past few years the most exciting newdevelopment bearing on this question has been thediscovery of the presence of mass-independentfractionation (MIF) of the sulfur isotopes insulfides and sulfates older than ca. 2.47 Ga.Figure 11 summarizes the available data for thedegree of MIF (D33S) in sulfides and sulfatesduring the past 3.8 Ga. The presence of values ofD33S . 0.5‰ in sulfides and sulfates older than ca.2.47 Ga indicates that the O2 content of theatmosphere was ,1025 PAL prior to 2.47 Ga
(Farquhar et al., 2001; Pavlov and Kasting, 2002).The absence of significant MIF in sulfides andsulfates #2.32 Ga (Bekker et al., 2002) isindicative of O2 levels .1025 PAL. There are nodata to decide when between 2.32 Ga and 2.47 Gathe level of atmospheric PO2
rose, and whether therise was a single event, or whether PO2
oscillatedbefore a final rise by 2.3 Ga.
The presence of O2 in the atmosphere–oceansystem at 2.32 Ga is supported strongly by thepresence of a large body of shallow-water hema-titic ironstone ore in the Timeball Hill Formation,South Africa (Beukes et al., 2002a,b). Apparently,the shallow oceans have been oxidized ever since.The deeper oceans may have continued in areduced state at least until the disappearanceof the Paleoproterozoic BIFs ca. 1.7 Ga.
The rapidity of the rise of the O2 content ofthe atmosphere after 2.3 Ga is a matter of dispute.The Hekpoort paleosols, which developed on the2.25 Ga Hekpoort Basalt, consist of an oxidizedhematitic upper portion and a reduced lowerportion. Beukes et al. (2002a,b) have pointed outthat the section through the Hekpoort paleosolnear Gaborone in Botswana is similar to moderntropical laterites. Yang and Holland (2003)have remarked on the differences between thechemistry and the geology of the Hekpoortpaleosols and Tertiary groundwater laterites,and have proposed that the O2 level in theatmosphere during the formation of the Hekpoortpaleosols was between ca. 2.5 £ 1024 atm and9 £ 1023 atm, i.e., considerably lower than atpresent. Paleosols developed in the GriqualandBasin on the Ongeluk Basalt, which is of the same
Figure 11 Summary of data for the degree of MIF of the sulfur isotopes in sulfides and sulfates. Data from Farquharet al. (2000) (chemically defined sulfur minerals ( ) sulfides, (B) total sulfur, and (W) sulfates; ( ) macroscopicsulfate minerals) with updated ages and from Bekker et al. (2002) ((A) range of values for pyrites in black shales).The gray band at D33S , 0 represents the mean and 1 SD of recent sulfides and sulfates from Farquhar et al. (2000).
The Geologic History of Seawater596
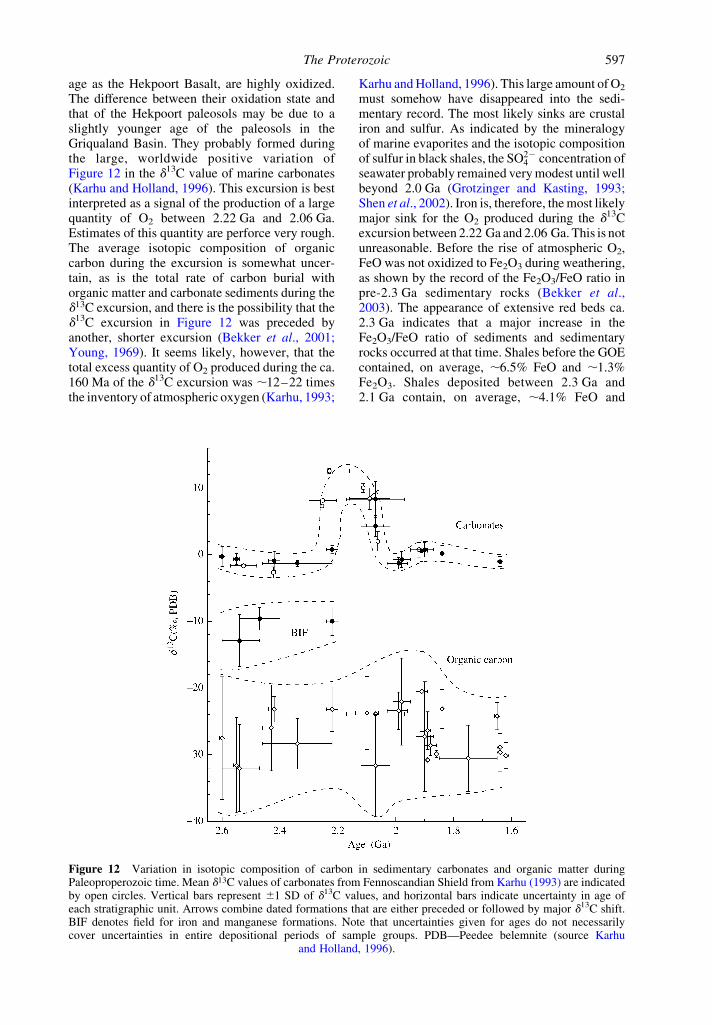
age as the Hekpoort Basalt, are highly oxidized.The difference between their oxidation state andthat of the Hekpoort paleosols may be due to aslightly younger age of the paleosols in theGriqualand Basin. They probably formed duringthe large, worldwide positive variation ofFigure 12 in the d13C value of marine carbonates(Karhu and Holland, 1996). This excursion is bestinterpreted as a signal of the production of a largequantity of O2 between 2.22 Ga and 2.06 Ga.Estimates of this quantity are perforce very rough.The average isotopic composition of organiccarbon during the excursion is somewhat uncer-tain, as is the total rate of carbon burial withorganic matter and carbonate sediments during thed13C excursion, and there is the possibility that thed13C excursion in Figure 12 was preceded byanother, shorter excursion (Bekker et al., 2001;Young, 1969). It seems likely, however, that thetotal excess quantity of O2 produced during the ca.160 Ma of the d13C excursion was ,12–22 timesthe inventory of atmospheric oxygen (Karhu, 1993;
Karhu and Holland, 1996). This large amount of O2
must somehow have disappeared into the sedi-mentary record. The most likely sinks are crustaliron and sulfur. As indicated by the mineralogyof marine evaporites and the isotopic compositionof sulfur in black shales, the SO22
4 concentration ofseawater probably remained very modest until wellbeyond 2.0 Ga (Grotzinger and Kasting, 1993;Shen et al., 2002). Iron is, therefore, the most likelymajor sink for the O2 produced during the d13Cexcursion between 2.22 Ga and 2.06 Ga. This is notunreasonable. Before the rise of atmospheric O2,FeO was not oxidized to Fe2O3 during weathering,as shown by the record of the Fe2O3/FeO ratio inpre-2.3 Ga sedimentary rocks (Bekker et al.,2003). The appearance of extensive red beds ca.2.3 Ga indicates that a major increase in theFe2O3/FeO ratio of sediments and sedimentaryrocks occurred at that time. Shales before the GOEcontained, on average, ,6.5% FeO and ,1.3%Fe2O3. Shales deposited between 2.3 Ga and2.1 Ga contain, on average, ,4.1% FeO and
Figure 12 Variation in isotopic composition of carbon in sedimentary carbonates and organic matter duringPaleoproperozoic time. Mean d13C values of carbonates from Fennoscandian Shield from Karhu (1993) are indicatedby open circles. Vertical bars represent ^1 SD of d13C values, and horizontal bars indicate uncertainty in age ofeach stratigraphic unit. Arrows combine dated formations that are either preceded or followed by major d13C shift.BIF denotes field for iron and manganese formations. Note that uncertainties given for ages do not necessarilycover uncertainties in entire depositional periods of sample groups. PDB—Peedee belemnite (source Karhu
and Holland, 1996).
The Proterozoic 597
2.5% Fe2O3. There seems to have been littlechange between 2.1 Ga and 1.0 Ga (Bekker et al.,2003). Approximately 2% of the FeO in pre-GOErocks seem to have been converted to Fe2O3 duringweathering in the course of the GOE. Since eachmole of FeO requires 0.25 mol O2 for conversion toFe2O3, ,0.08 mol O2 was used during the weath-ering of each kilogram of rock. If weathering ratesduring the GOE were comparable to current rates,some 1.6 £ 1012 mol O2 were used annually toconvert FeO to Fe2O3 during weathering in thecourse of the d13C excursion. The total O2 use was,therefore, ,2.6 £ 1020 mol, i.e., ,6 times thepresent atmospheric O2 inventory. Some of theexcess O2 was probably used to increase the redoxstate of the crustal sulfur cycle. The duration of thed13C excursion is roughly equal to the half-life ofsedimentary rocks at 2 Ga. The Fe2O3/FeO ratio ofrocks subjected to weathering at the end of the d13Cexcursion was, therefore, greater than at itsbeginning and was approaching a value typical ofMesoproterozoic sedimentary rocks. Post-d13Cexcursion weathering of sediments producedduring the d13C excursion, therefore, requiredmuch less additional O2 than the weathering ofpre-GOE rocks.
Although this is a likely explanation for the fateof most of the “extra” O2 generated during thed13C excursion between ca. 2.22 Ga and 2.06 Ga,it does not account for the GOE itself or for thecause of the d13C excursion. The appearance of O2
in the atmosphere between ca. 2.47 Ga and2.32 Ga could be explained easily if cyanobacteriaevolved at that time. However, this explanationhas been rendered very unlikely by the discoveryof biomarkers that are characteristic of cyanobac-teria and eukaryotes in 2.5–2.7 Ga sedimentaryrocks (Brocks et al., 1999). An alternativeexplanation involves a change in the redox stateof volcanic gases as the trigger for the change ofthe oxidation state of the atmosphere (Kastinget al., 1993). These authors pointed out that theloss of H2 from the top of a reducing atmosphereinto interplanetary space would have increased theoverall oxidation state of the Earth as a whole, andalmost certainly that of the mantle. This, in turn,would have led to an increase in the ƒO2
ofvolcanic gases and to a change in the redox state ofthe atmosphere.
In a more detailed analysis of this mechanism,Holland (2002) showed that the change in theaverage ƒO2
of volcanic gases required for thetransition of the atmosphere from an anoxygenicto an oxygenic state is quite small. There is noinconsistency between the required change in ƒO2
and the limits set on such changes by the data ofDelano (2001) and Canil (1997, 1999, 2002) forthe evolution of the redox state of the uppermantle during the past 4.0 Ga. The estimatedchanges in ƒO2
due to H2 loss are consistent with
the likely changes in the redox state of the uppermantle if the major control on that state is exertedby the Fe2O3/FeO buffer. In this explanation theaverage composition of volcanic gases before theGOE was such that 20% of their contained CO2
could be reduced to CH2O, and all of the sulfurgases to FeS2. Excess H2 present in the gaseswould have escaped from the atmosphere, poss-ibly via the decomposition of CH4 in the upperatmosphere. The loss of H2 would have producedan irreversible oxidation of the early Earth(Catling et al., 2001). The GOE began when thecomposition of volcanic gases had changed, sothat not enough H2 was present to convert 20% ofthe contained CO2 to CH2O and all of the sulfurgases to FeS2. Before the GOE the only, or nearlythe only, sulfate mineral deposited in sedimentsseems to have been barite. Since barium is a traceelement, its precipitation as BaSO4 accounted foronly a small fraction of the atmospheric input ofvolcanic sulfur. After the GOE a fraction ofvolcanic sulfur began to leave the atmosphere–ocean system as a constituent of other sulfateminerals as well, largely as gypsum (CaSO4·2H2O)and anhydrite (CaSO4).
During the Phanerozoic close to half of thevolcanic sulfur in volcanic gases has beenremoved as a constituent of FeS2, the other halfas a constituent of gypsum and anhydrite (see,e.g., Holland, 2002). The shift from the essen-tially complete removal of volcanic sulfur as aconstituent of FeS2 to the present state wasgradual (see below). It was probably controlledby a feedback mechanism involving an increasein the sulfur content of volcanic gases. This wasprobably the result of an increase in the rate ofsubduction of CaSO4 added to the oceanic crustby the cycling of sea water at temperatures aboveca. 200 8C.
The burial of excess organic matter during thed13C excursion between 2.22 Ga and 2.06 Gaalmost certainly required an excess of PO4
32.It seems likely that this excess was released fromrocks during weathering due to the lower pH ofsoil waters related to the generation of H2SO4 thataccompanied the oxidative weathering of sulfides.Toward the end of the d13C excursion, this excessPO4
32 was probably removed by adsorption onthe Fe3þ hydroxides and oxyhydroxides producedby the oxidative weathering of Fe2þ minerals(Colman and Holland, 2000). Although thissequence of events is reasonable, and althoughsome parts of it can be checked semiqua-ntitatively, the proposed process by which theanoxygenic atmosphere became converted to anoxygenic state should be treated with caution. Toomany pieces of the puzzle are still either missingor of questionable shape.
A most interesting and geochemically signifi-cant change in the oceans may have occurred
The Geologic History of Seawater598
ca. 1.7 Ga. BIFs ceased to be deposited. They areapparently absent from the geologic record untiltheir reappearance 1 Ga later in association withthe very large Neoproterozoic ice ages (Beukesand Klein, 1992). Three explanations have beenadvanced for the hiatus in BIF deposition between1.7 Ga and 0.7 Ga. The first proposes that thedeposition of BIF ended when the deep waters ofthe oceans became aerobic (Cloud, 1972; Holland,1984). After 1.7 Ga, Fe2þ from hydrothermalvents was oxidized to Fe3þ close to the vents andwas precipitated as Fe3þ oxides and/or oxy-hydroxides on the floor of the oceans. The secondexplanation proposes that anoxic bottom waterspersisted until well after the deposition of BIFsceased, and that an increase in the concentration ofH2S rather than the advent of oxygen wasresponsible for removing iron from deep oceanwater (Canfield, 1998). The sulfur isotope recordindicates that the concentration of oceanic sulfatebegan to increase ,2.3 Ga leading to increasingrates of sulfide production by bacterial sulfatereduction. Canfield (1998) has suggested thatsulfide production became sufficiently intense,1.7 Ga to precipitate the total hydrothermalflux of iron as a constituent of pyrite in the deepoceans. As a basis for this contention, he pointsout that the generation of aerobic deep oceanwater would have required levels of atmosphericO2 within a factor of 2 or 3 of the present level, alevel which he believes was not attained until theNeoproterozoic. However, Canfield’s (1998) ana-lysis of his three-box model of the oceans assumesthat the rate of sinking of organic matter into thedeep ocean was the same during the Paleoproter-ozoic as at present. This is unlikely. Organicmatter requires ballast to make it sink. Today mostof the ballast is supplied by siliceous andcarbonate tests (Logan et al., 1995; Armstronget al., 2002; Iglesias-Rodriguez et al., 2002;Sarmiento et al., 2002). Clays and dust seem tobe minor constituents of the ballast, although theymay have been more important before the adventof soil-binding plants. There is no evidence for theproduction of siliceous or calcareous tests in thePaleoproterozoic oceans. Inorganically precipi-tated SiO2 and/or CaCO3 could have beenimportant, but precipitation of these phasesprobably occurred mainly in shallow-water eva-poritic settings. It is, therefore, likely that ballastwas much scarcer during the Paleoproterozoicthan today, and that the quantity of particulateorganic matter (POC) transported annually fromshallow water into the deep oceans was muchsmaller than today. This, in turn, implies that theamount of dissolved O2 that was required tooxidize the rain of POC was much smaller thantoday. Evidence from paleosols suggests thatatmospheric O2 levels ca. 2.2 Ga were $15%PAL (Holland and Beukes, 1990). This implies
that the proposal for the end of BIF depositionbased on the development of oxygenated bottomwaters ca. 1.7 Ga is quite reasonable. It does not,of course, prove that the proposal is correct. Forone thing, too little is known about the mixingtime of the Paleoproterozoic oceans. Data for theoxidation state of the deep ocean since 1.7 Ga areneeded to settle the issue. The third explanationposits that no large hydrothermal inputs such asare required to produce BIFs occurred between1.7 Ga and 0.7 Ga. This seems unlikely but notimpossible.
6.21.4.2 The Mesoproterozoic (1.8–1.2 Ga)
Sedimentary rocks of the McArthur Basin inNorthern Australia provide one of the bestwindows on the chemistry of the Mesoproterozoicocean. Some 10 km of 1.6–1.7 Ga sedimentsaccumulated in this intracratonic basin (Southgateet al., 2000). In certain intervals, they containgiant strata-bound Pb–Zn–Ag mineral deposits(Jackson et al., 1987; Jackson and Raiswell, 1991;Crick, 1992). The sediments have experiencedonly low grades of metamorphism.
Shen et al. (2002) have reported data for theisotopic composition of sulfur in carbonaceousshales of the lower part of the 1.72–1.73 GaWollogorang Formation and in the lower part ofthe 1.63–1.64 Ga Reward Formation of theMcArthur Basin. These shales were probablydeposited in a euxinic intracratonic basin withconnection to the open ocean. The d34S of pyritein black shales of the Wollogorang Formationranges from 21‰ to þ6.3‰ with a mean and SDof 4.0 ^ 1.9‰ ðn ¼ 14Þ: Donnelly and Jackson(1988) reported similar values. The d34S values ofpyrite in the lower Reward Formation range fromþ18.2‰ to þ23.4‰ with an average and SD of18.4 ^ 1.8‰ ðn ¼ 10Þ: The spread of d34Svalues within each formation is relatively small.The sulfur is quite 34S-enriched compared tocompositions expected from the reduction ofseawater sulfate with a d34S of 20–25‰ (Strauss,1993). This is especially true of the sulfides in theReward Formation. Shen et al. (2002) proposethat the Reward data are best explained ifthe concentration of sulfate in the contempo-rary seawater was between 0.5 mmol kg21and2.4 mmol kg21. Sulfate concentrations in theMesoproterozoic ocean well below those of thepresent oceans have also been proposed onthe basis of the rapid change in the value of d34Sin carbonate associated sulfate of the 1.2 Ga BylotSupergroup of northeastern Canada (Lyons et al.,2002). However, the value of mSO22
4in Mesopro-
terozoic seawater is still rather uncertain.Somewhat of a cross-check on the SO22
4
concentration of seawater can be obtained fromthe evaporite relics in the McArthur Group
The Proterozoic 599
(Walker et al., 1977). Up to 40% of the measuredsections of the Amelia Dolomite consist of suchrelics in the form of carbonate pseudomorphs aftera variety of morphologies of gypsum and anhydritecrystals, chert pseudomorphs after anhydritenodules, halite casts, and microscopic remnantsof original, unaltered sulfate minerals. Muir (1979)and Jackson et al. (1987) have pointed out thesimilarity of this formation to the recent sabkhasalong the Persian Gulf coast. The pseudomorphscrosscut sedimentary features such as bedding andlaminated microbial mats, suggesting that theoriginal sulfate minerals crystallized in the hostsediments during diagenesis.
Pseudomorphs after halite are commonthroughout the McArthur Group. The haliteappears to have formed by almost completeevaporation of seawater in shallow marineenvironments and probably represents ephemeralsalt crusts. The general lack of association ofhalite and calcium sulfate minerals in thesesediments probably resulted in part from thedissolution of previously deposited halite duringsurface flooding, but also indicates that evapor-ation did not always proceed beyond the calciumsulfate facies.
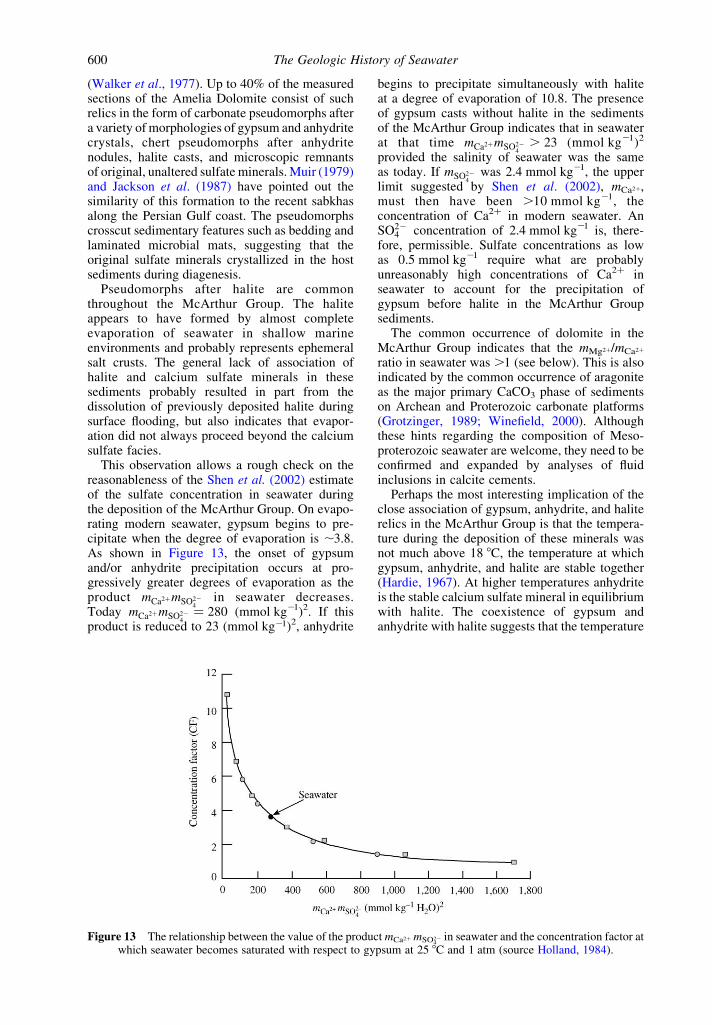
This observation allows a rough check on thereasonableness of the Shen et al. (2002) estimateof the sulfate concentration in seawater duringthe deposition of the McArthur Group. On evapo-rating modern seawater, gypsum begins to pre-cipitate when the degree of evaporation is ,3.8.As shown in Figure 13, the onset of gypsumand/or anhydrite precipitation occurs at pro-gressively greater degrees of evaporation as theproduct mCa2þmSO22
4in seawater decreases.
Today mCa2þmSO224
¼ 280 (mmol kg21)2. If thisproduct is reduced to 23 (mmol kg21)2, anhydrite
begins to precipitate simultaneously with haliteat a degree of evaporation of 10.8. The presenceof gypsum casts without halite in the sedimentsof the McArthur Group indicates that in seawaterat that time mCa2þmSO22
4. 23 (mmol kg21)2
provided the salinity of seawater was the sameas today. If mSO22
4was 2.4 mmol kg21, the upper
limit suggested by Shen et al. (2002), mCa2þ,must then have been .10 mmol kg21, theconcentration of Ca2þ in modern seawater. AnSO22
4 concentration of 2.4 mmol kg21 is, there-fore, permissible. Sulfate concentrations as lowas 0.5 mmol kg21 require what are probablyunreasonably high concentrations of Ca2þ inseawater to account for the precipitation ofgypsum before halite in the McArthur Groupsediments.
The common occurrence of dolomite in theMcArthur Group indicates that the mMg2þ/mCa2þ
ratio in seawater was .1 (see below). This is alsoindicated by the common occurrence of aragoniteas the major primary CaCO3 phase of sedimentson Archean and Proterozoic carbonate platforms(Grotzinger, 1989; Winefield, 2000). Althoughthese hints regarding the composition of Meso-proterozoic seawater are welcome, they need to beconfirmed and expanded by analyses of fluidinclusions in calcite cements.
Perhaps the most interesting implication of theclose association of gypsum, anhydrite, and haliterelics in the McArthur Group is that the tempera-ture during the deposition of these minerals wasnot much above 18 8C, the temperature at whichgypsum, anhydrite, and halite are stable together(Hardie, 1967). At higher temperatures anhydriteis the stable calcium sulfate mineral in equilibriumwith halite. The coexistence of gypsum andanhydrite with halite suggests that the temperature
Figure 13 The relationship between the value of the product mCa2þ mSO422 in seawater and the concentration factor at
which seawater becomes saturated with respect to gypsum at 25 8C and 1 atm (source Holland, 1984).
The Geologic History of Seawater600
during their deposition was possibly lower butprobably no higher than in the modern sabkhas ofthe Persian Gulf, where anhydrite is the dominantcalcium sulfate mineral in association with halite(Kinsman, 1966).
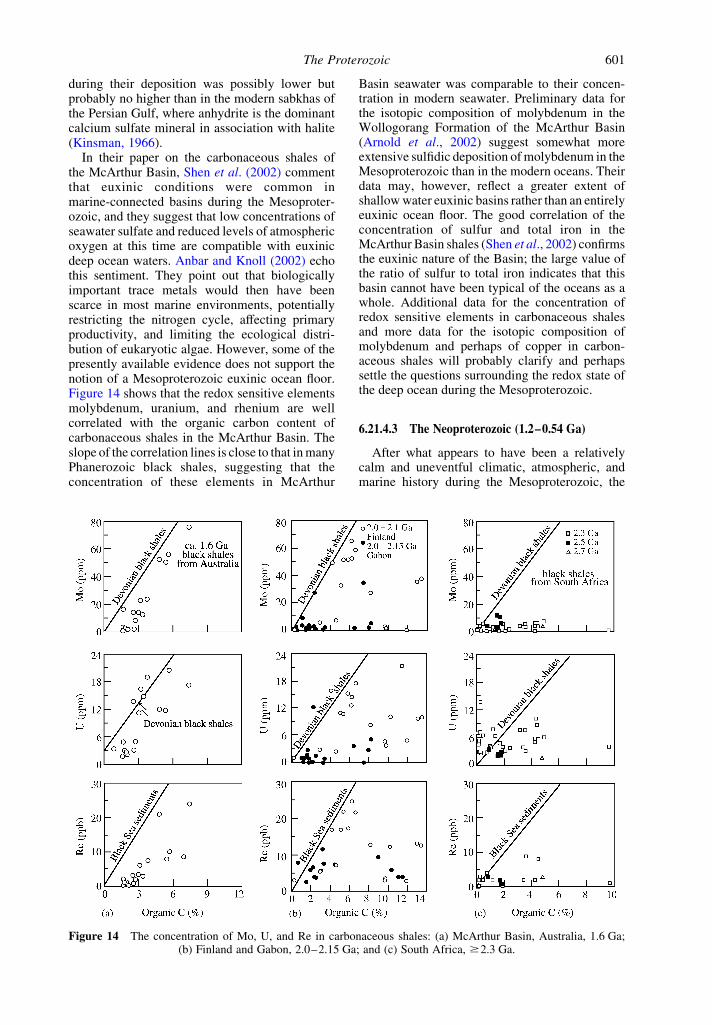
In their paper on the carbonaceous shales ofthe McArthur Basin, Shen et al. (2002) commentthat euxinic conditions were common inmarine-connected basins during the Mesoproter-ozoic, and they suggest that low concentrations ofseawater sulfate and reduced levels of atmosphericoxygen at this time are compatible with euxinicdeep ocean waters. Anbar and Knoll (2002) echothis sentiment. They point out that biologicallyimportant trace metals would then have beenscarce in most marine environments, potentiallyrestricting the nitrogen cycle, affecting primaryproductivity, and limiting the ecological distri-bution of eukaryotic algae. However, some of thepresently available evidence does not support thenotion of a Mesoproterozoic euxinic ocean floor.Figure 14 shows that the redox sensitive elementsmolybdenum, uranium, and rhenium are wellcorrelated with the organic carbon content ofcarbonaceous shales in the McArthur Basin. Theslope of the correlation lines is close to that in manyPhanerozoic black shales, suggesting that theconcentration of these elements in McArthur
Basin seawater was comparable to their concen-tration in modern seawater. Preliminary data forthe isotopic composition of molybdenum in theWollogorang Formation of the McArthur Basin(Arnold et al., 2002) suggest somewhat moreextensive sulfidic deposition of molybdenum in theMesoproterozoic than in the modern oceans. Theirdata may, however, reflect a greater extent ofshallow water euxinic basins rather than an entirelyeuxinic ocean floor. The good correlation of theconcentration of sulfur and total iron in theMcArthur Basin shales (Shen et al., 2002) confirmsthe euxinic nature of the Basin; the large value ofthe ratio of sulfur to total iron indicates that thisbasin cannot have been typical of the oceans as awhole. Additional data for the concentration ofredox sensitive elements in carbonaceous shalesand more data for the isotopic composition ofmolybdenum and perhaps of copper in carbon-aceous shales will probably clarify and perhapssettle the questions surrounding the redox state ofthe deep ocean during the Mesoproterozoic.
6.21.4.3 The Neoproterozoic (1.2–0.54 Ga)
After what appears to have been a relativelycalm and uneventful climatic, atmospheric, andmarine history during the Mesoproterozoic, the
Figure 14 The concentration of Mo, U, and Re in carbonaceous shales: (a) McArthur Basin, Australia, 1.6 Ga;(b) Finland and Gabon, 2.0–2.15 Ga; and (c) South Africa, $2.3 Ga.
The Proterozoic 601
Neoproterozoic returned to the turbulence ofthe Paleoproterozoic era. The last 300 Ma of theProterozoic were times of extraordinary globalenvironmental and biological change. Majorswings in the d13C value of marine carbonateswere accompanied by several very large glacia-tions, the sulfate content of seawater rose to valuescomparable to that of the modern oceans (Horitaet al., 2002), and the level of atmospheric O2
probably attained modern values by the time of thebiological explosion at the end of the Precambrianand the beginning of the Paleozoic. A great deal ofresearch has been done on the last few hundredmillion years of the Proterozoic, stimulated in partby the discovery of the extensive glacial episodesof this period. Nevertheless, many major ques-tions remain unanswered. The description of themajor events and particularly their causes are stillquite incomplete.
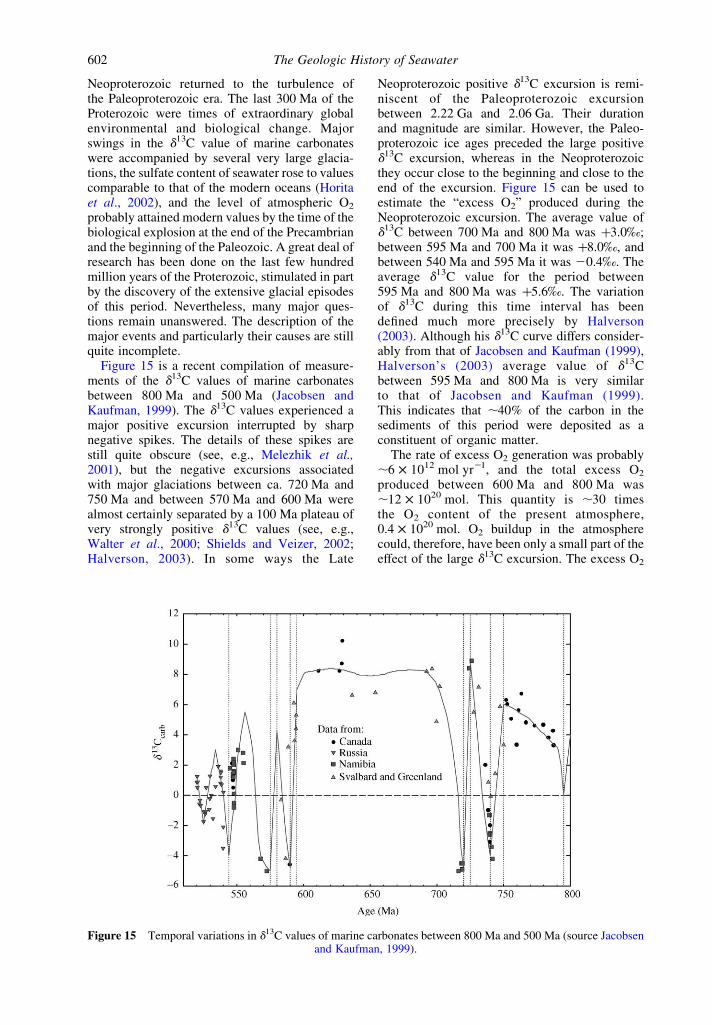
Figure 15 is a recent compilation of measure-ments of the d13C values of marine carbonatesbetween 800 Ma and 500 Ma (Jacobsen andKaufman, 1999). The d13C values experienced amajor positive excursion interrupted by sharpnegative spikes. The details of these spikes arestill quite obscure (see, e.g., Melezhik et al.,2001), but the negative excursions associatedwith major glaciations between ca. 720 Ma and750 Ma and between 570 Ma and 600 Ma werealmost certainly separated by a 100 Ma plateau ofvery strongly positive d13C values (see, e.g.,Walter et al., 2000; Shields and Veizer, 2002;Halverson, 2003). In some ways the Late
Neoproterozoic positive d13C excursion is remi-niscent of the Paleoproterozoic excursionbetween 2.22 Ga and 2.06 Ga. Their durationand magnitude are similar. However, the Paleo-proterozoic ice ages preceded the large positived13C excursion, whereas in the Neoproterozoicthey occur close to the beginning and close to theend of the excursion. Figure 15 can be used toestimate the “excess O2” produced during theNeoproterozoic excursion. The average value ofd13C between 700 Ma and 800 Ma was þ3.0‰;between 595 Ma and 700 Ma it was þ8.0‰, andbetween 540 Ma and 595 Ma it was 20.4‰. Theaverage d13C value for the period between595 Ma and 800 Ma was þ5.6‰. The variationof d13C during this time interval has beendefined much more precisely by Halverson(2003). Although his d13C curve differs consider-ably from that of Jacobsen and Kaufman (1999),Halverson’s (2003) average value of d13Cbetween 595 Ma and 800 Ma is very similarto that of Jacobsen and Kaufman (1999).This indicates that ,40% of the carbon in thesediments of this period were deposited as aconstituent of organic matter.
The rate of excess O2 generation was probably,6 £ 1012 mol yr21, and the total excess O2
produced between 600 Ma and 800 Ma was,12 £ 1020 mol. This quantity is ,30 timesthe O2 content of the present atmosphere,0.4 £ 1020 mol. O2 buildup in the atmospherecould, therefore, have been only a small part of theeffect of the large d13C excursion. The excess O2
Figure 15 Temporal variations in d13C values of marine carbonates between 800 Ma and 500 Ma (source Jacobsenand Kaufman, 1999).
The Geologic History of Seawater602
is also much larger than 0.8 £ 1020 mol, thequantity required to raise the SO22
4 concentrationof seawater from zero to its present value byoxidizing sulfide. Fortunately, additional sulfatesinks are available to account for the estimatedexcess O2: CaSO4 and CaSO4·2H2O in evaporites,CaSO4 precipitated in the oceanic crust close toMORs during the cycling of seawater at hydro-thermal temperatures, and an increase in theFe2O3/FeO ratio in sedimentary rocks. Thesesinks seem to be of the right order of magnitudeto account for the use of the excess O2. The mag-nitude of the CaSO4 reservoir in sedimentaryrocks during the last part of the Neoproterozoichas been estimated on the basis of models basedon sulfur isotope data to be (2 ^ 0.5) £ 1020 mol(Holser et al., 1989). The conversion of thisquantity of sulfur from sulfide to sulfate requires(4 ^ 1) £ 1020 mol O2.
At present the loss of CaSO4 from seawaterto the oceanic crust seems to be ,1.0 £1012 mol yr21 (Holland, 2002). At this rate theloss of SO22
4 to the oceanic crust between 600 Maand 800 Ma would have been 2 £ 1020 mol. Thetotal O2 sinks due to the sulfur cycle during thisperiod might, therefore, have amounted to,6 £ 1020 mol. The increase in the Fe2O3/FeOratio in sedimentary rocks probably required,1 £ 1020 mol O2. Given all the rather largeuncertainties and somewhat shaky assumptionswhich have been made in this mass balancecalculation, the agreement between the estimatedquantity of excess O2 and the estimated quantityof O2 required to convert the sulfur cycle from itspre-1,200 Ma state to its state at the beginning ofthe Paleozoic is quite reasonable. The logic behindthe change is also compelling. Carbon, iron, andsulfur are the three elements which dominate theredox state of the near-surface system. The carboncycle seems to have been locked into its presentstate quite early in Earth history, probably by itslinkage to the geochemical cycle of phosphorus.The iron cycle took on a more modern cast duringthe positive Paleoproterozoic d13C excursion. Itis not unreasonable to propose that the positived13C excursion during the Neoproterozoic wasresponsible for converting the sulfur cycle to itsmodern mode and for generating a further increasein the Fe2O3/FeO ratio.
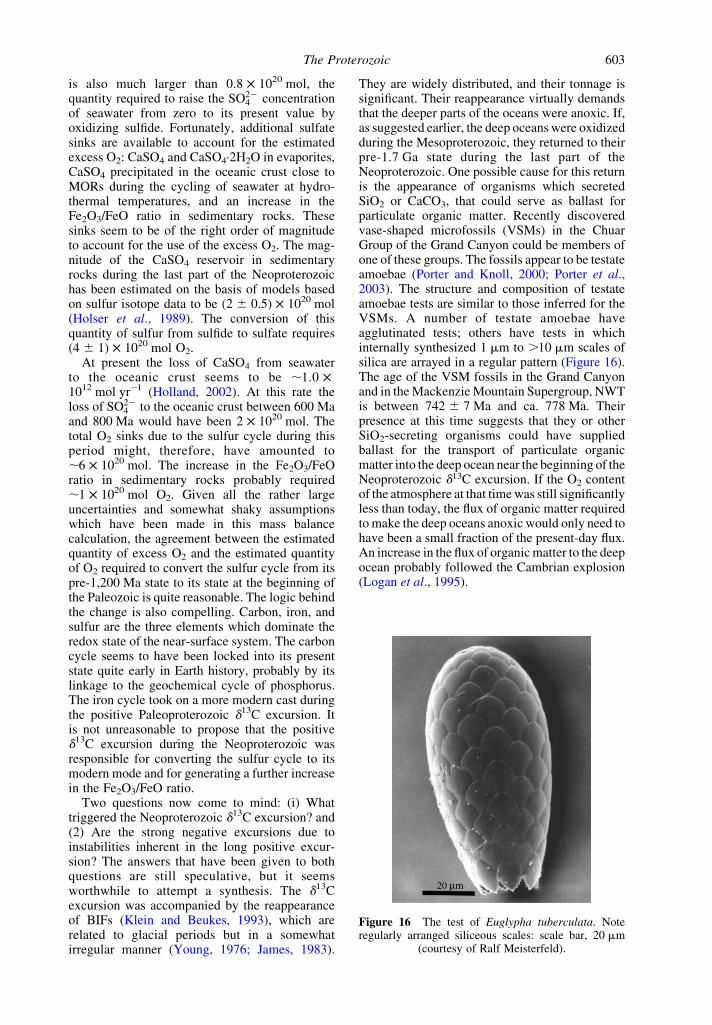
Two questions now come to mind: (i) Whattriggered the Neoproterozoic d13C excursion? and(2) Are the strong negative excursions due toinstabilities inherent in the long positive excur-sion? The answers that have been given to bothquestions are still speculative, but it seemsworthwhile to attempt a synthesis. The d13Cexcursion was accompanied by the reappearanceof BIFs (Klein and Beukes, 1993), which arerelated to glacial periods but in a somewhatirregular manner (Young, 1976; James, 1983).
They are widely distributed, and their tonnage issignificant. Their reappearance virtually demandsthat the deeper parts of the oceans were anoxic. If,as suggested earlier, the deep oceans were oxidizedduring the Mesoproterozoic, they returned to theirpre-1.7 Ga state during the last part of theNeoproterozoic. One possible cause for this returnis the appearance of organisms which secretedSiO2 or CaCO3, that could serve as ballast forparticulate organic matter. Recently discoveredvase-shaped microfossils (VSMs) in the ChuarGroup of the Grand Canyon could be members ofone of these groups. The fossils appear to be testateamoebae (Porter and Knoll, 2000; Porter et al.,2003). The structure and composition of testateamoebae tests are similar to those inferred for theVSMs. A number of testate amoebae haveagglutinated tests; others have tests in whichinternally synthesized 1 mm to .10 mm scales ofsilica are arrayed in a regular pattern (Figure 16).The age of the VSM fossils in the Grand Canyonand in the Mackenzie Mountain Supergroup, NWTis between 742 ^ 7 Ma and ca. 778 Ma. Theirpresence at this time suggests that they or otherSiO2-secreting organisms could have suppliedballast for the transport of particulate organicmatter into the deep ocean near the beginning of theNeoproterozoic d13C excursion. If the O2 contentof the atmosphere at that time was still significantlyless than today, the flux of organic matter requiredto make the deep oceans anoxic would only need tohave been a small fraction of the present-day flux.An increase in the flux of organic matter to the deepocean probably followed the Cambrian explosion(Logan et al., 1995).
Figure 16 The test of Euglypha tuberculata. Noteregularly arranged siliceous scales: scale bar, 20 mm
(courtesy of Ralf Meisterfeld).
The Proterozoic 603
Arguments can be raised against the importanceof the evolution of SiO2-secreting organisms asballast for organic matter. The VSM organismswere shallow water and benthic, not open oceanand planktonic, and the remains of SiO2-secretingorganisms have not been found in Neoproterozoicdeep-sea sediments. Alternative explanations havebeen offered for the burial of “excess” organiccarbon between 800 Ma and 600 Ma. Knoll(1992) and Hoffman et al. (1998) pointed outthat the Late Proterozoic was a time of unusual, ifnot unique, formation of rapidly subsiding exten-sional basins flooded by marine waters. Organicmatter buried with rapidly deposited sediments ispreserved more readily than in slowly depositedsediments (Suess, 1980). However, the conse-quences of this effect on the total rate of burial oforganic matter are small unless additional PO4
32
becomes available. Anoxia would tend to providethe required addition (Colman and Holland,2000). However, the evidence for anoxia is stilllimited. The reappearance of BIFs demands deep-ocean anoxia during their formation, but theNeoproterozoic BIFs are associated with themajor glaciations, which may indicate—but surelydoes not prove—that deep-water anoxia between800 Ma and 550 Ma was restricted to these coldperiods. Other indications of deep-water anoxiaare needed to define the oxidation state of deepwater and the causes of anoxia during theNeoproterozoic.
In a low-sulfate ocean, anoxia would probablyhave increased the rate of methane productionin marine sediments. Some of this methaneprobably escaped into the water column. In thedeeper, O2-free parts of the oceans, methane wasoxidized in part by organisms using SO22
4 as theoxidant. In the upper parts of the oceans, it waspartly oxidized by O2. The remainder escapedinto the atmosphere. There it was in partdecomposed and oxidized inorganically to CO2;in part it was returned to the ocean innonmethanogenic areas and was oxidized therebiologically. Some methane generated in marinesediments was probably sequestered at leasttemporarily in methane clathrates. The methaneconcentration in the Neoproterozoic atmospherecould have been as high as 100–300 ppm(Pavlov et al., 2003). If methane concentrationswere as high as this, it would have been a verysignificant greenhouse gas. At a concentrationof 100 ppm, methane could well have increasedthe surface temperature by 12 8C (Pavlov et al.,2003).
It seems strange, therefore, that the LateNeoproterozoic should have been a time ofsevere glaciations (Kirschvink, 1992). In theirreview of the snowball Earth hypothesis, Hoffmanand Schrag (2002) point out that in some sectionsa steep decline in d13C values by 10–15‰
preceded any physical evidence of glaciation orsea-level fall. The most likely explanation forsuch a sharp drop involves a major decrease inthe burial rate of organic carbon. The reason(s)for this are still obscure. It is intriguing that majorperiods of phosphogenesis coincided roughlywith the glaciations between 750 – 800 Maand ca. 620 Ma (Cook and McElhinny, 1979).The first of these appears to coincide with theappearance of Rapitan-type iron ores. The secondseems to have commenced shortly after the latestNeoproteroizc glaciation (Hambrey and Harland,1981), reached a peak during the Early Cambrian,then declined rapidly, and finally ended in theLate Mid-Cambrian (Cook and Shergold, 1984,1986). However, the time relationship betweenthe glacial and the phosphogenic events is stillnot entirely resolved. The rapid removal ofphosphate from the oceans may have begunbefore the onset of glaciation. Perhaps continen-tal extension and rifting during the Neoproter-ozoic and the creation of many shallowepicontinental seaways at low paleolatitudescreated environments that were particularlyfavorable for the deposition of phosphorites(Donnelly et al., 1990).
Some of the Neoproterozoic BIFs and associ-ated rock units are also quite enriched in P2O5. Forinstance, the P2O5 content of the Rapitan ironformation in Canada and its associated hematiticmudstones ranges from 0.49% to 2.16% (Kleinand Beukes, 1993). It can readily be shown,however, that the phosphate output from theoceans into the known phosphorites and BIFs isa small fraction of the phosphate metabolism ofthe oceans as a whole between 800 Ma and600 Ma. This observation does not eliminate thepossibility that phosphate removal into othersedimentary rocks was abnormally rapid duringthe two phosphogenic periods between 800 Maand 600 Ma. Such abnormally rapid phosphateremoval as a constituent of apatite would havedecreased the availability of phosphate fordeposition with organic matter. This would haveproduced a decrease in the d13C value ofcarbonates as observed before the onset of thesnowball Earth glaciations. It would probably alsohave reduced the rate of methane generation, themethane concentration in the atmosphere, and theglobal temperature. If this, in turn, led to the onsetof glaciation, the decrease in the rate of weath-ering would have further restricted the riverineflow of phosphate and thence to a decrease ind13Ccarb and the global temperature. This scenariois highly speculative, but it does seem to accountat least for the onset of the glaciations.
It seems very likely that the continents werelargely ice covered during the Neoproterozoicglaciations. The state of the oceans is still a matterof debate. The Hoffman–Schrag Snowball Earth
The Geologic History of Seawater604
hypothesis posits that the oceans were completely,or nearly completely, ice covered. This seemsunlikely. Leather et al. (2002) have pointed outthat the sedimentology and stratigraphy of theNeoproterozoic glacials of Arabia were more likethose of the familiar oscillatory glaciations of thePleistocene than those required by the SnowballEarth hypothesis. Similarly, Condon et al. (2002),who studied the stratigraphy and sedimentology ofsix Neoproterozoic glaciomarine successions,concluded that the Neoproterozoic seas were nottotally frozen, and that the hydrologic cycle wasfunctioning during the major glaciations. Thissuggests that the tropical oceans were ice free oronly partially ice covered. Perhaps an Earth insuch a state might be called a frostball, rather thana snowball. Chemical weathering on the con-tinents in this state would have been very minor.CO2 released from volcanoes would have built upin the atmosphere and in the oceans until its partialpressure was high enough to overcome the lowalbedo of the Earth at the height of the glacialepisodes. In the Hoffman–Schrag model, some10 Ma of CO2 buildup are needed to raise theatmospheric CO2 pressure sufficiently to over-come the low albedo of a completely ice-coveredEarth. The only test of this timescale has beenprovided by the Bowring et al. (2003) data for theduration of the Gaskiers glacial deposits inNewfoundland. This unit is often described as aVaranger-age glaciomarine deposit. It is locallyoverlain by a thin cap carbonate bed with a highlynegative carbon isotopic signature. The U–Pbgeochronology of zircons separated from ash bedsbelow, within, and above the glacial depositsindicates that these glacial deposits accumulatedin less than 1 Ma. The short duration of thisepisode may be more consistent with a frostballthan with a snowball Earth.
At the very low stand of sea level during theheights of these glaciations, the release of methanefrom clathrates might have contributed signifi-cantly to the subsequent warming and to thenegative value of d13CCARB in the ocean –atmosphere system (Kennedy et al., 2001). Intenseweathering after the retreat of the glacierswould—among other products—have releasedlarge quantities of phosphate. This might havespeeded the recovery of photosynthesis and thereturn of the d13C of marine carbonates to theirlarge positive values along the course of the 800–600 Ma positive d13C excursion.
Between the end of the positive d13C excursionand the beginning of the Cambrian, several largemarine evaporites were deposited. These are stillpreserved and offer the earliest opportunity to usethe mineralogy of marine evaporites and thecomposition of fluid inclusions in halite toreconstruct the composition of the contempora-neous seawater. Horita et al. (2002) have used
this approach to show that the sulfate concen-tration in latest Neoproterozoic seawater was,23 mmol kg21, i.e., only slightly less than inmodern seawater, and significantly greater thanduring some parts of the Phanerozoic. By thelatest Proterozoic, a new sulfur regimen had beeninstalled. The cycling of seawater through MORshad probably reached present-day levels, the S/Cratio in volcanic gases had therefore risen, and theproportion of volcanic sulfur converted to con-stituents of sulfides and sulfates had approachedunity as demanded by the composition of averagePhanerozoic volcanic gases (Holland, 2002). Theconversion of the composition of sedimentaryrocks from their pre-GOE to their moderncomposition had been nearly completed.
The level of atmospheric O2 seems to have beenthe last of the redox parameters to approachmodern values. The evidence for this comes fromthe changes in the biota that occurred between thelatest Proterozoic and the middle of the Cambrianperiod. These changes are discussed in the nextsection. Although a good deal of progress has beenmade since 1980 in our understanding of theatmosphere and oceans during the ProterozoicEra, we are still woefully ignorant of even themost basic oceanographic data for Precambrianseawater.
6.21.5 THE PHANEROZOIC
6.21.5.1 Evidence from Marine Evaporites
Our understanding of the chemical evolution ofPhanerozoic seawater has increased enormouslysince the end of World War II. Rubey’s (1951)presidential address to the Geological Society ofAmerica was aptly entitled “The geologic historyof seawater, an attempt to state the problem.”During the following year, Barth (1952)introduced the concept of the characteristic timein his analysis of the chemistry of the oceans, andthis can, perhaps, be considered the beginning ofthe application of systems analysis to marinegeochemistry. Attempts were made by theSwedish physical chemist Lars Gunnar Sillen toapply equilibrium thermodynamics to define thechemical history of seawater, but, as he pointedout, “practically everything that interests us in andaround the sea is a symptom of nonequilibrium…What we can hope is that an equilibrium modelmay give a useful first approximation to the realsystem, and that the deviations of the real systemmay be treated as disturbances” (Sillen, 1967).Similar sentiments were expressed by Mackenzieand Garrels (1966) and by Garrels and Mackenzie(1971). They proposed that there has been littlechange in seawater composition since 1.5–2 Ga,although they were concerned by the discoveryby Ault and Kulp (1959), Thode et al. (1961),
The Phanerozoic 605
Thode and Monster (1965), and Holser andKaplan (1966) of very significant fluctuations inthe isotopic composition of sulfur in seawaterduring the Phanerozoic.
A good deal of optimism regarding the con-stancy or near constancy of the composition ofseawater during the Phanerozoic was, however,permitted by the Holser (1963) discovery that theMg/Cl and Br/Cl ratios in brines extracted fromfluid inclusions in Permian halite fromHutchinson, Kansas were close to those of modernbrines. Holland (1972) published his analysis of theconstraints placed by the constancy of the earlymineral sequence in marine evaporites during thePhanerozoic. This paper showed that most of theseawater compositions permitted by the precipi-tation sequence CaCO3–CaSO4–NaCl in marineevaporites fall within roughly twice and half of theconcentration of the major ions in seawater today.These calculations were extended by Harvie et al.(1980) and Hardie (1991) to include the later, morecomplex mineral assemblages of marine evapor-ites. Their calculations explained the mineralsequence in modern evaporites, and confirmedthat the composition of Permian seawater wassimilar to that of modern seawater.
The development of a method to extract brinesfrom fluid inclusions in halite and to obtainquantitative analyses by means of ion chromato-graphy (Lazar and Holland, 1988) led to a studyof the composition of trapped brines in halitefrom several Permian marine evaporites (Horitaet al., 1991). Their results together with those ofStein and Krumhansl (1988) confirmed that thecomposition of modern seawater is similar to thatof Permian seawater, and suggested that thecomposition of seawater has been quite conser-vative during the Phanerozoic. This suggestion,however, has turned out to be far off the mark.Analyses of fluid inclusions in halite of the LateSilurian Salina Group of the Michigan Basin (Daset al., 1990), the Middle Devonian PrairieFormation in the Saskatchewan Basin (Horitaet al., 1996), and a growing number of othermarine evaporites (for a summary of the resultsof other groups, see Horita et al. (2002)) haveshown that the similarity between Permian andmodern seawater is the exception rather than therule. Only the fluid inclusions in halite of thelatest Neoproterozoic Ara Formation in Oman(Horita et al., 2002) are similar to their Permianand modern equivalents. All of the other fluidinclusions contain brines which are very signifi-cantly depleted in Mg2þ and SO22
4 relative tomodern seawater. Their composition is consistentwith the mineralogy of the associated evaporites.The difference between these inclusion fluids andtheir modern counterparts is either due tosignificant differences in the composition of theseawater from which they were derived or to
reactions which depleted the Mg2þ and SO224
content of the brines along their evaporation path.The Silurian and Devonian evaporites which westudied are associated with large carbonate plat-forms. The dolomitization of CaCO3 followed bythe deposition of gypsum and/or anhydrite duringthe passage of seawater across such platforms candeplete the evaporating brines in Mg2þ andSO22
4 . Their composition can then becomesimilar to that of the brines in the Silurian andDevonian halites. We opted for this interpretationof the fluid inclusion data, wrongly as it turnedout. An obvious test of the proposition that thedifferences were due to dolomitization andCaSO4 precipitation was to analyze fluidinclusions in halite from marine evaporiteswhich are not associated with extended carbonateplatforms. Zimmermann’s (2000) work on Ter-tiary evaporites did just that. Her analysesshowed that in progressively older Tertiaryevaporites the composition of the seawater fromwhich the brines in these evaporites developedwas progressively more depleted in Mg2þ andSO22
4 (Figure 17). As shown in Figure 18, thistrend continued into the Cretaceous and was notreversed until the Triassic or latest Permian. Thecomposition of fluid inclusion brines in marinehalite is, therefore, a reasonably good guide to thecomposition of their parent seawater. However,changes due to the reaction of evaporatingseawater with the sediments across which itpasses en route to trapping have almost certainlyoccurred and cannot be neglected.
6.21.5.2 The Mineralogy of Marine Oolites
The proposed trend of the Mg/Ca ratio ofseawater (Figure 17) during the Tertiary issupported by two independent lines of evidence:the mineralogy of marine oolites and themagnesium content of foraminifera. Sandberg(1983, 1985) discovered that the mineralogy ofmarine oolites has alternated several timesbetween dominantly calcitic and dominantlyaragonitic (see Figure 18). On this basis hedivided the Phanerozoic into periods of calciticand aragonitic seas. He suggested that the changesin mineralogy were related to changes in atmos-pheric PCO2
or to changes in the Mg/Ca ratio ofseawater. The experiments by Morse et al. (1997)have shown that changes in the Mg/Ca ratio arethe most likely cause of the changes in oolitemineralogy. The most recent switch in oolitemineralogy occurred near the base of the Tertiary(see Figures 17 and 18). Unfortunately, the Mg/Caratio of seawater at the time of this switch can bedefined only roughly, because the change in oolitemineralogy from calcite to aragonite depends ontemperature as well as on the Mg/Ca ratio of
The Geologic History of Seawater606
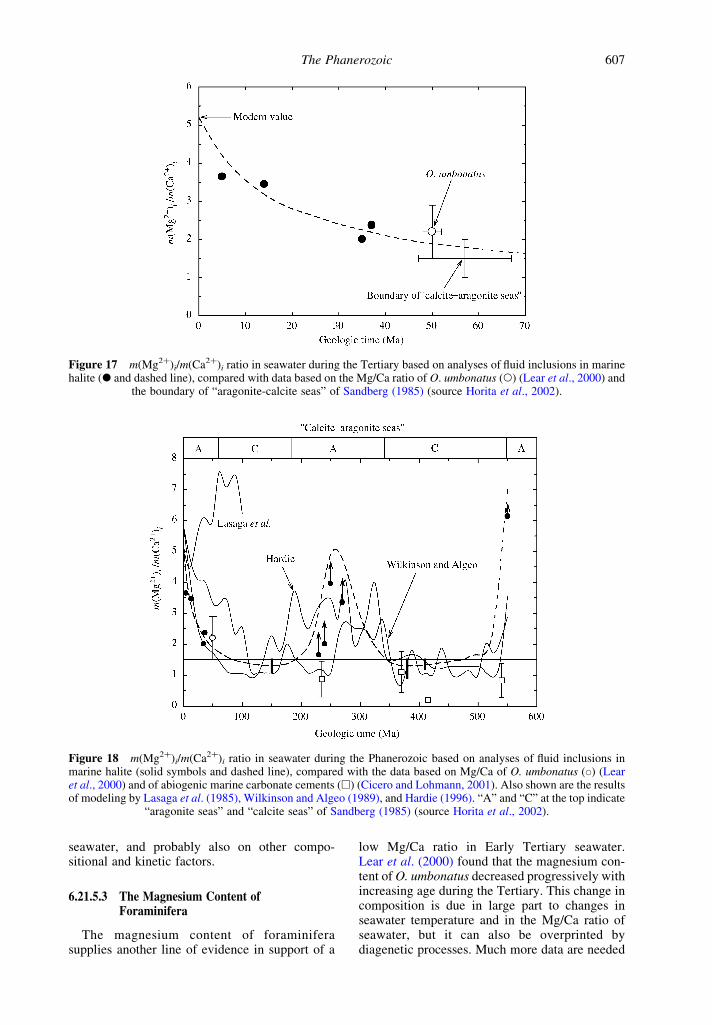
seawater, and probably also on other compo-sitional and kinetic factors.
6.21.5.3 The Magnesium Content ofForaminifera
The magnesium content of foraminiferasupplies another line of evidence in support of a
low Mg/Ca ratio in Early Tertiary seawater.Lear et al. (2000) found that the magnesium con-tent of O. umbonatus decreased progressively withincreasing age during the Tertiary. This change incomposition is due in large part to changes inseawater temperature and in the Mg/Ca ratio ofseawater, but it can also be overprinted bydiagenetic processes. Much more data are needed
Figure 18 m(Mg2þ)i/m(Ca2þ)i ratio in seawater during the Phanerozoic based on analyses of fluid inclusions inmarine halite (solid symbols and dashed line), compared with the data based on Mg/Ca of O. umbonatus (W) (Learet al., 2000) and of abiogenic marine carbonate cements (A) (Cicero and Lohmann, 2001). Also shown are the resultsof modeling by Lasaga et al. (1985), Wilkinson and Algeo (1989), and Hardie (1996). “A” and “C” at the top indicate
“aragonite seas” and “calcite seas” of Sandberg (1985) (source Horita et al., 2002).
Figure 17 m(Mg2þ)i/m(Ca2þ)i ratio in seawater during the Tertiary based on analyses of fluid inclusions in marinehalite (X and dashed line), compared with data based on the Mg/Ca ratio of O. umbonatus (W) (Lear et al., 2000) and
the boundary of “aragonite-calcite seas” of Sandberg (1985) (source Horita et al., 2002).
The Phanerozoic 607
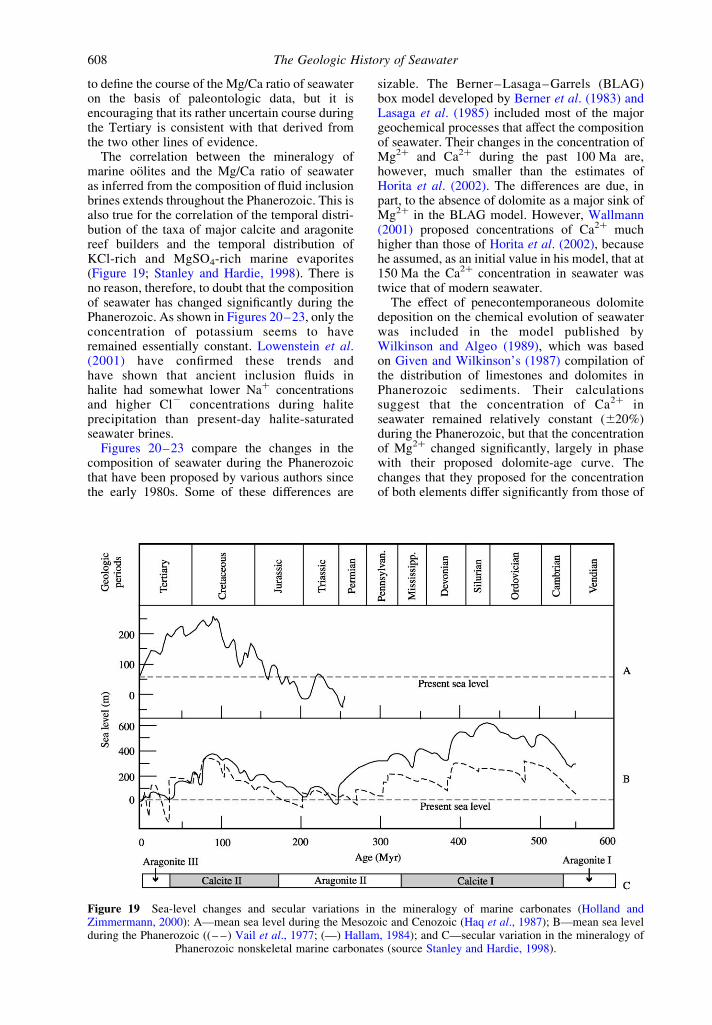
to define the course of the Mg/Ca ratio of seawateron the basis of paleontologic data, but it isencouraging that its rather uncertain course duringthe Tertiary is consistent with that derived fromthe two other lines of evidence.
The correlation between the mineralogy ofmarine oolites and the Mg/Ca ratio of seawateras inferred from the composition of fluid inclusionbrines extends throughout the Phanerozoic. This isalso true for the correlation of the temporal distri-bution of the taxa of major calcite and aragonitereef builders and the temporal distribution ofKCl-rich and MgSO4-rich marine evaporites(Figure 19; Stanley and Hardie, 1998). There isno reason, therefore, to doubt that the compositionof seawater has changed significantly during thePhanerozoic. As shown in Figures 20–23, only theconcentration of potassium seems to haveremained essentially constant. Lowenstein et al.(2001) have confirmed these trends andhave shown that ancient inclusion fluids inhalite had somewhat lower Naþ concentrationsand higher Cl2 concentrations during haliteprecipitation than present-day halite-saturatedseawater brines.
Figures 20–23 compare the changes in thecomposition of seawater during the Phanerozoicthat have been proposed by various authors sincethe early 1980s. Some of these differences are
sizable. The Berner–Lasaga–Garrels (BLAG)box model developed by Berner et al. (1983) andLasaga et al. (1985) included most of the majorgeochemical processes that affect the compositionof seawater. Their changes in the concentration ofMg2þ and Ca2þ during the past 100 Ma are,however, much smaller than the estimates ofHorita et al. (2002). The differences are due, inpart, to the absence of dolomite as a major sink ofMg2þ in the BLAG model. However, Wallmann(2001) proposed concentrations of Ca2þ muchhigher than those of Horita et al. (2002), becausehe assumed, as an initial value in his model, that at150 Ma the Ca2þ concentration in seawater wastwice that of modern seawater.
The effect of penecontemporaneous dolomitedeposition on the chemical evolution of seawaterwas included in the model published byWilkinson and Algeo (1989), which was basedon Given and Wilkinson’s (1987) compilation ofthe distribution of limestones and dolomites inPhanerozoic sediments. Their calculationssuggest that the concentration of Ca2þ inseawater remained relatively constant (^20%)during the Phanerozoic, but that the concentrationof Mg2þ changed significantly, largely in phasewith their proposed dolomite-age curve. Thechanges that they proposed for the concentrationof both elements differ significantly from those of
Figure 19 Sea-level changes and secular variations in the mineralogy of marine carbonates (Holland andZimmermann, 2000): A—mean sea level during the Mesozoic and Cenozoic (Haq et al., 1987); B—mean sea levelduring the Phanerozoic ((– –) Vail et al., 1977; (—) Hallam, 1984); and C—secular variation in the mineralogy of
Phanerozoic nonskeletal marine carbonates (source Stanley and Hardie, 1998).
The Geologic History of Seawater608
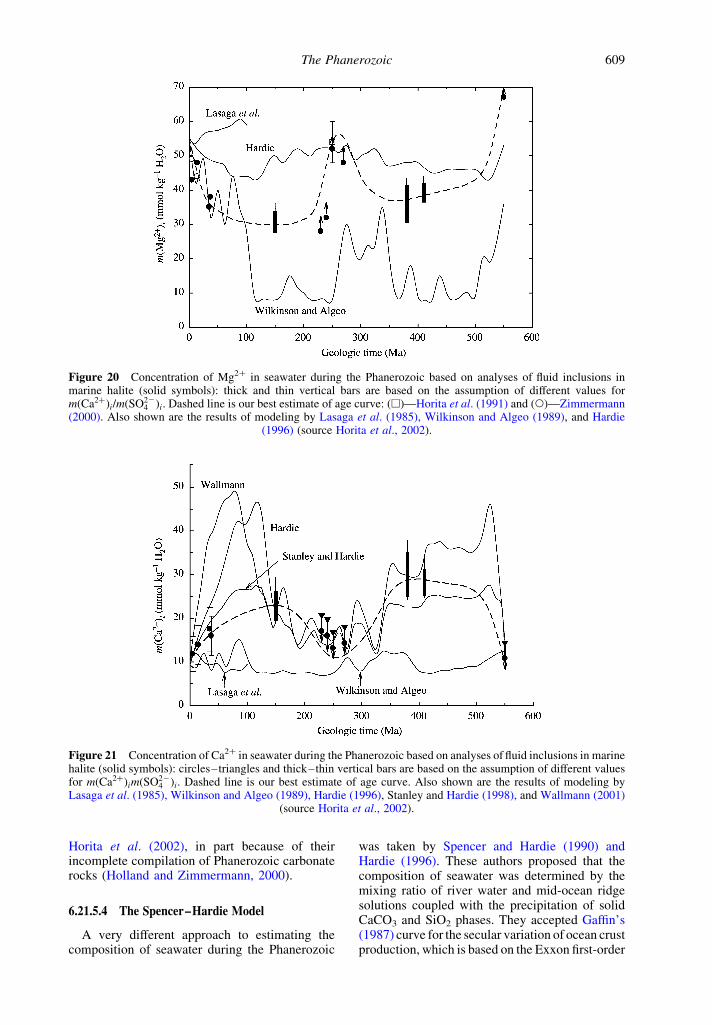
Horita et al. (2002), in part because of theirincomplete compilation of Phanerozoic carbonaterocks (Holland and Zimmermann, 2000).
6.21.5.4 The Spencer–Hardie Model
A very different approach to estimating thecomposition of seawater during the Phanerozoic
was taken by Spencer and Hardie (1990) andHardie (1996). These authors proposed that thecomposition of seawater was determined by themixing ratio of river water and mid-ocean ridgesolutions coupled with the precipitation of solidCaCO3 and SiO2 phases. They accepted Gaffin’s(1987) curve for the secular variation of ocean crustproduction, which is based on the Exxon first-order
Figure 20 Concentration of Mg2þ in seawater during the Phanerozoic based on analyses of fluid inclusions inmarine halite (solid symbols): thick and thin vertical bars are based on the assumption of different values formðCa2þÞi=mðSO22
4 Þi: Dashed line is our best estimate of age curve: (A)—Horita et al. (1991) and (W)—Zimmermann(2000). Also shown are the results of modeling by Lasaga et al. (1985), Wilkinson and Algeo (1989), and Hardie
(1996) (source Horita et al., 2002).
Figure 21 Concentration of Ca2þ in seawater during the Phanerozoic based on analyses of fluid inclusions in marinehalite (solid symbols): circles–triangles and thick–thin vertical bars are based on the assumption of different valuesfor mðCa2þÞimðSO22
4 Þi: Dashed line is our best estimate of age curve. Also shown are the results of modeling byLasaga et al. (1985), Wilkinson and Algeo (1989), Hardie (1996), Stanley and Hardie (1998), and Wallmann (2001)
(source Horita et al., 2002).
The Phanerozoic 609
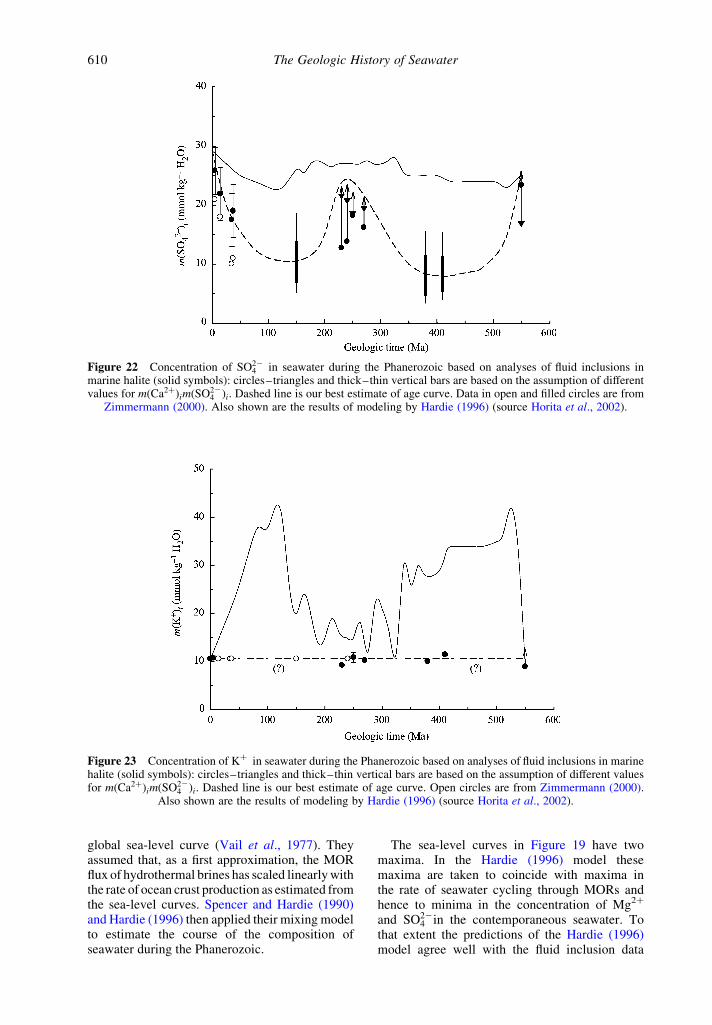
global sea-level curve (Vail et al., 1977). Theyassumed that, as a first approximation, the MORflux of hydrothermal brines has scaled linearly withthe rate of ocean crust production as estimated fromthe sea-level curves. Spencer and Hardie (1990)and Hardie (1996) then applied their mixing modelto estimate the course of the composition ofseawater during the Phanerozoic.
The sea-level curves in Figure 19 have twomaxima. In the Hardie (1996) model thesemaxima are taken to coincide with maxima inthe rate of seawater cycling through MORs andhence to minima in the concentration of Mg2þ
and SO224 in the contemporaneous seawater. To
that extent the predictions of the Hardie (1996)model agree well with the fluid inclusion data
Figure 22 Concentration of SO224 in seawater during the Phanerozoic based on analyses of fluid inclusions in
marine halite (solid symbols): circles–triangles and thick–thin vertical bars are based on the assumption of differentvalues for mðCa2þÞimðSO22
4 Þi. Dashed line is our best estimate of age curve. Data in open and filled circles are fromZimmermann (2000). Also shown are the results of modeling by Hardie (1996) (source Horita et al., 2002).
Figure 23 Concentration of Kþ in seawater during the Phanerozoic based on analyses of fluid inclusions in marinehalite (solid symbols): circles–triangles and thick–thin vertical bars are based on the assumption of different valuesfor mðCa2þÞimðSO22
4 Þi: Dashed line is our best estimate of age curve. Open circles are from Zimmermann (2000).Also shown are the results of modeling by Hardie (1996) (source Horita et al., 2002).
The Geologic History of Seawater610
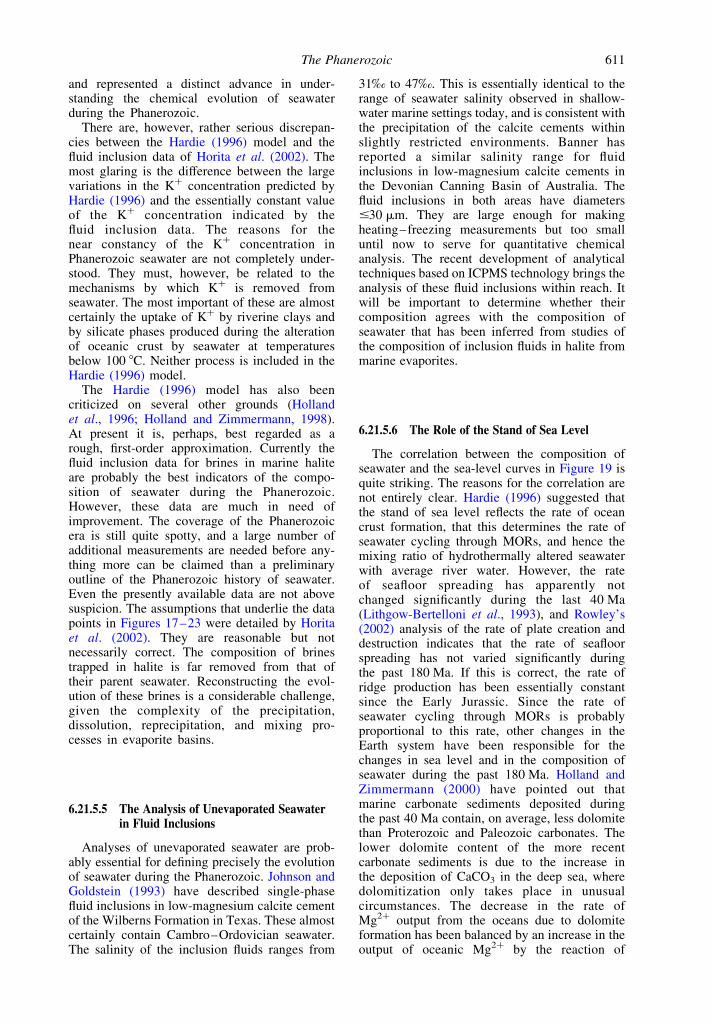
and represented a distinct advance in under-standing the chemical evolution of seawaterduring the Phanerozoic.
There are, however, rather serious discrepan-cies between the Hardie (1996) model and thefluid inclusion data of Horita et al. (2002). Themost glaring is the difference between the largevariations in the Kþ concentration predicted byHardie (1996) and the essentially constant valueof the Kþ concentration indicated by thefluid inclusion data. The reasons for thenear constancy of the Kþ concentration inPhanerozoic seawater are not completely under-stood. They must, however, be related to themechanisms by which Kþ is removed fromseawater. The most important of these are almostcertainly the uptake of Kþ by riverine clays andby silicate phases produced during the alterationof oceanic crust by seawater at temperaturesbelow 100 8C. Neither process is included in theHardie (1996) model.
The Hardie (1996) model has also beencriticized on several other grounds (Hollandet al., 1996; Holland and Zimmermann, 1998).At present it is, perhaps, best regarded as arough, first-order approximation. Currently thefluid inclusion data for brines in marine haliteare probably the best indicators of the compo-sition of seawater during the Phanerozoic.However, these data are much in need ofimprovement. The coverage of the Phanerozoicera is still quite spotty, and a large number ofadditional measurements are needed before any-thing more can be claimed than a preliminaryoutline of the Phanerozoic history of seawater.Even the presently available data are not abovesuspicion. The assumptions that underlie the datapoints in Figures 17–23 were detailed by Horitaet al. (2002). They are reasonable but notnecessarily correct. The composition of brinestrapped in halite is far removed from that oftheir parent seawater. Reconstructing the evol-ution of these brines is a considerable challenge,given the complexity of the precipitation,dissolution, reprecipitation, and mixing pro-cesses in evaporite basins.
6.21.5.5 The Analysis of Unevaporated Seawaterin Fluid Inclusions
Analyses of unevaporated seawater are prob-ably essential for defining precisely the evolutionof seawater during the Phanerozoic. Johnson andGoldstein (1993) have described single-phasefluid inclusions in low-magnesium calcite cementof the Wilberns Formation in Texas. These almostcertainly contain Cambro–Ordovician seawater.The salinity of the inclusion fluids ranges from
31‰ to 47‰. This is essentially identical to therange of seawater salinity observed in shallow-water marine settings today, and is consistent withthe precipitation of the calcite cements withinslightly restricted environments. Banner hasreported a similar salinity range for fluidinclusions in low-magnesium calcite cements inthe Devonian Canning Basin of Australia. Thefluid inclusions in both areas have diameters#30 mm. They are large enough for makingheating–freezing measurements but too smalluntil now to serve for quantitative chemicalanalysis. The recent development of analyticaltechniques based on ICPMS technology brings theanalysis of these fluid inclusions within reach. Itwill be important to determine whether theircomposition agrees with the composition ofseawater that has been inferred from studies ofthe composition of inclusion fluids in halite frommarine evaporites.
6.21.5.6 The Role of the Stand of Sea Level
The correlation between the composition ofseawater and the sea-level curves in Figure 19 isquite striking. The reasons for the correlation arenot entirely clear. Hardie (1996) suggested thatthe stand of sea level reflects the rate of oceancrust formation, that this determines the rate ofseawater cycling through MORs, and hence themixing ratio of hydrothermally altered seawaterwith average river water. However, the rateof seafloor spreading has apparently notchanged significantly during the last 40 Ma(Lithgow-Bertelloni et al., 1993), and Rowley’s(2002) analysis of the rate of plate creation anddestruction indicates that the rate of seafloorspreading has not varied significantly duringthe past 180 Ma. If this is correct, the rate ofridge production has been essentially constantsince the Early Jurassic. Since the rate ofseawater cycling through MORs is probablyproportional to this rate, other changes in theEarth system have been responsible for thechanges in sea level and in the composition ofseawater during the past 180 Ma. Holland andZimmermann (2000) have pointed out thatmarine carbonate sediments deposited duringthe past 40 Ma contain, on average, less dolomitethan Proterozoic and Paleozoic carbonates. Thelower dolomite content of the more recentcarbonate sediments is due to the increase inthe deposition of CaCO3 in the deep sea, wheredolomitization only takes place in unusualcircumstances. The decrease in the rate ofMg2þ output from the oceans due to dolomiteformation has been balanced by an increase in theoutput of oceanic Mg2þ by the reaction of
The Phanerozoic 611
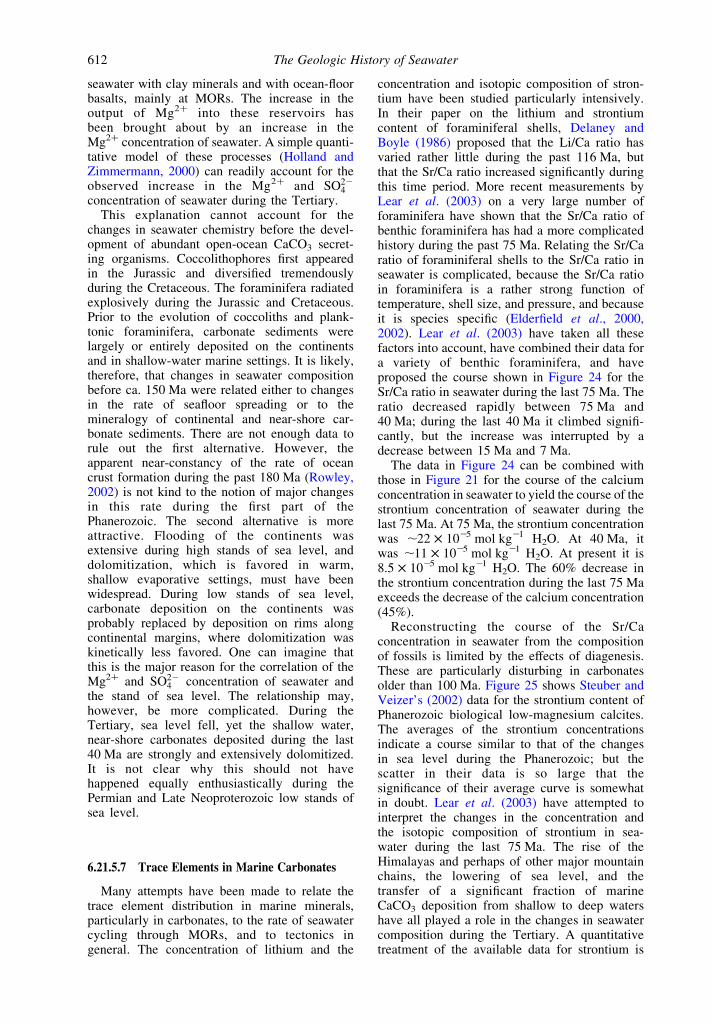
seawater with clay minerals and with ocean-floorbasalts, mainly at MORs. The increase in theoutput of Mg2þ into these reservoirs hasbeen brought about by an increase in theMg2þ concentration of seawater. A simple quanti-tative model of these processes (Holland andZimmermann, 2000) can readily account for theobserved increase in the Mg2þ and SO22
4
concentration of seawater during the Tertiary.This explanation cannot account for the
changes in seawater chemistry before the devel-opment of abundant open-ocean CaCO3 secret-ing organisms. Coccolithophores first appearedin the Jurassic and diversified tremendouslyduring the Cretaceous. The foraminifera radiatedexplosively during the Jurassic and Cretaceous.Prior to the evolution of coccoliths and plank-tonic foraminifera, carbonate sediments werelargely or entirely deposited on the continentsand in shallow-water marine settings. It is likely,therefore, that changes in seawater compositionbefore ca. 150 Ma were related either to changesin the rate of seafloor spreading or to themineralogy of continental and near-shore car-bonate sediments. There are not enough data torule out the first alternative. However, theapparent near-constancy of the rate of oceancrust formation during the past 180 Ma (Rowley,2002) is not kind to the notion of major changesin this rate during the first part of thePhanerozoic. The second alternative is moreattractive. Flooding of the continents wasextensive during high stands of sea level, anddolomitization, which is favored in warm,shallow evaporative settings, must have beenwidespread. During low stands of sea level,carbonate deposition on the continents wasprobably replaced by deposition on rims alongcontinental margins, where dolomitization waskinetically less favored. One can imagine thatthis is the major reason for the correlation of theMg2þ and SO22
4 concentration of seawater andthe stand of sea level. The relationship may,however, be more complicated. During theTertiary, sea level fell, yet the shallow water,near-shore carbonates deposited during the last40 Ma are strongly and extensively dolomitized.It is not clear why this should not havehappened equally enthusiastically during thePermian and Late Neoproterozoic low stands ofsea level.
6.21.5.7 Trace Elements in Marine Carbonates
Many attempts have been made to relate thetrace element distribution in marine minerals,particularly in carbonates, to the rate of seawatercycling through MORs, and to tectonics ingeneral. The concentration of lithium and the
concentration and isotopic composition of stron-tium have been studied particularly intensively.In their paper on the lithium and strontiumcontent of foraminiferal shells, Delaney andBoyle (1986) proposed that the Li/Ca ratio hasvaried rather little during the past 116 Ma, butthat the Sr/Ca ratio increased significantly duringthis time period. More recent measurements byLear et al. (2003) on a very large number offoraminifera have shown that the Sr/Ca ratio ofbenthic foraminifera has had a more complicatedhistory during the past 75 Ma. Relating the Sr/Caratio of foraminiferal shells to the Sr/Ca ratio inseawater is complicated, because the Sr/Ca ratioin foraminifera is a rather strong function oftemperature, shell size, and pressure, and becauseit is species specific (Elderfield et al., 2000,2002). Lear et al. (2003) have taken all thesefactors into account, have combined their data fora variety of benthic foraminifera, and haveproposed the course shown in Figure 24 for theSr/Ca ratio in seawater during the last 75 Ma. Theratio decreased rapidly between 75 Ma and40 Ma; during the last 40 Ma it climbed signifi-cantly, but the increase was interrupted by adecrease between 15 Ma and 7 Ma.
The data in Figure 24 can be combined withthose in Figure 21 for the course of the calciumconcentration in seawater to yield the course of thestrontium concentration of seawater during thelast 75 Ma. At 75 Ma, the strontium concentrationwas ,22 £ 1025 mol kg21 H2O. At 40 Ma, itwas ,11 £ 1025 mol kg21 H2O. At present it is8.5 £ 1025 mol kg21 H2O. The 60% decrease inthe strontium concentration during the last 75 Maexceeds the decrease of the calcium concentration(45%).
Reconstructing the course of the Sr/Caconcentration in seawater from the compositionof fossils is limited by the effects of diagenesis.These are particularly disturbing in carbonatesolder than 100 Ma. Figure 25 shows Steuber andVeizer’s (2002) data for the strontium content ofPhanerozoic biological low-magnesium calcites.The averages of the strontium concentrationsindicate a course similar to that of the changesin sea level during the Phanerozoic; but thescatter in their data is so large that thesignificance of their average curve is somewhatin doubt. Lear et al. (2003) have attempted tointerpret the changes in the concentration andthe isotopic composition of strontium in sea-water during the last 75 Ma. The rise of theHimalayas and perhaps of other major mountainchains, the lowering of sea level, and thetransfer of a significant fraction of marineCaCO3 deposition from shallow to deep watershave all played a role in the changes in seawatercomposition during the Tertiary. A quantitativetreatment of the available data for strontium is
The Geologic History of Seawater612
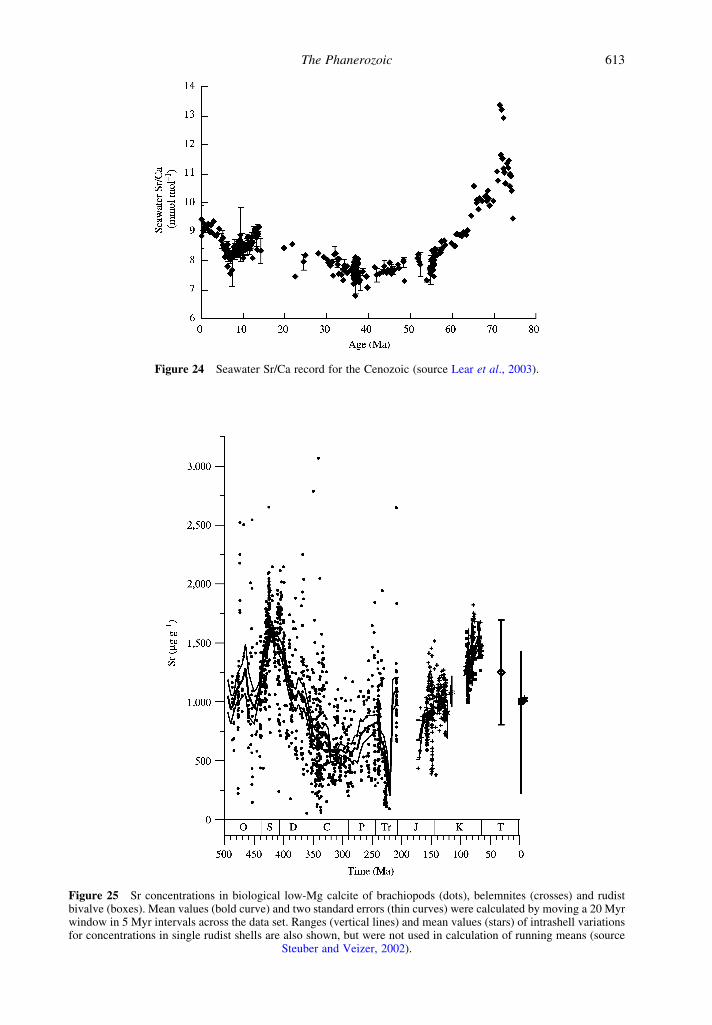
Figure 25 Sr concentrations in biological low-Mg calcite of brachiopods (dots), belemnites (crosses) and rudistbivalve (boxes). Mean values (bold curve) and two standard errors (thin curves) were calculated by moving a 20 Myrwindow in 5 Myr intervals across the data set. Ranges (vertical lines) and mean values (stars) of intrashell variationsfor concentrations in single rudist shells are also shown, but were not used in calculation of running means (source
Steuber and Veizer, 2002).
Figure 24 Seawater Sr/Ca record for the Cenozoic (source Lear et al., 2003).
The Phanerozoic 613
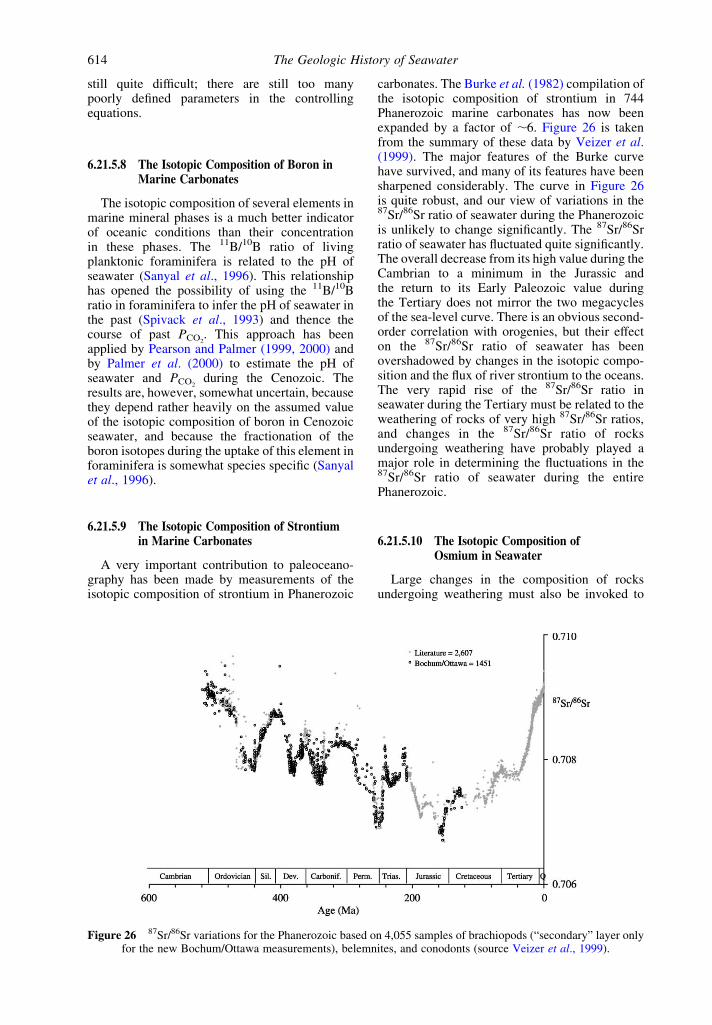
still quite difficult; there are still too manypoorly defined parameters in the controllingequations.
6.21.5.8 The Isotopic Composition of Boron inMarine Carbonates
The isotopic composition of several elements inmarine mineral phases is a much better indicatorof oceanic conditions than their concentrationin these phases. The 11B/10B ratio of livingplanktonic foraminifera is related to the pH ofseawater (Sanyal et al., 1996). This relationshiphas opened the possibility of using the 11B/10Bratio in foraminifera to infer the pH of seawater inthe past (Spivack et al., 1993) and thence thecourse of past PCO2
. This approach has beenapplied by Pearson and Palmer (1999, 2000) andby Palmer et al. (2000) to estimate the pH ofseawater and PCO2
during the Cenozoic. Theresults are, however, somewhat uncertain, becausethey depend rather heavily on the assumed valueof the isotopic composition of boron in Cenozoicseawater, and because the fractionation of theboron isotopes during the uptake of this element inforaminifera is somewhat species specific (Sanyalet al., 1996).
6.21.5.9 The Isotopic Composition of Strontiumin Marine Carbonates
A very important contribution to paleoceano-graphy has been made by measurements of theisotopic composition of strontium in Phanerozoic
carbonates. The Burke et al. (1982) compilation ofthe isotopic composition of strontium in 744Phanerozoic marine carbonates has now beenexpanded by a factor of ,6. Figure 26 is takenfrom the summary of these data by Veizer et al.(1999). The major features of the Burke curvehave survived, and many of its features have beensharpened considerably. The curve in Figure 26is quite robust, and our view of variations in the87Sr/86Sr ratio of seawater during the Phanerozoicis unlikely to change significantly. The 87Sr/86Srratio of seawater has fluctuated quite significantly.The overall decrease from its high value during theCambrian to a minimum in the Jurassic andthe return to its Early Paleozoic value duringthe Tertiary does not mirror the two megacyclesof the sea-level curve. There is an obvious second-order correlation with orogenies, but their effecton the 87Sr/86Sr ratio of seawater has beenovershadowed by changes in the isotopic compo-sition and the flux of river strontium to the oceans.The very rapid rise of the 87Sr/86Sr ratio inseawater during the Tertiary must be related to theweathering of rocks of very high 87Sr/86Sr ratios,and changes in the 87Sr/86Sr ratio of rocksundergoing weathering have probably played amajor role in determining the fluctuations in the87Sr/86Sr ratio of seawater during the entirePhanerozoic.
6.21.5.10 The Isotopic Composition ofOsmium in Seawater
Large changes in the composition of rocksundergoing weathering must also be invoked to
Figure 26 87Sr/86Sr variations for the Phanerozoic based on 4,055 samples of brachiopods (“secondary” layer onlyfor the new Bochum/Ottawa measurements), belemnites, and conodonts (source Veizer et al., 1999).
The Geologic History of Seawater614
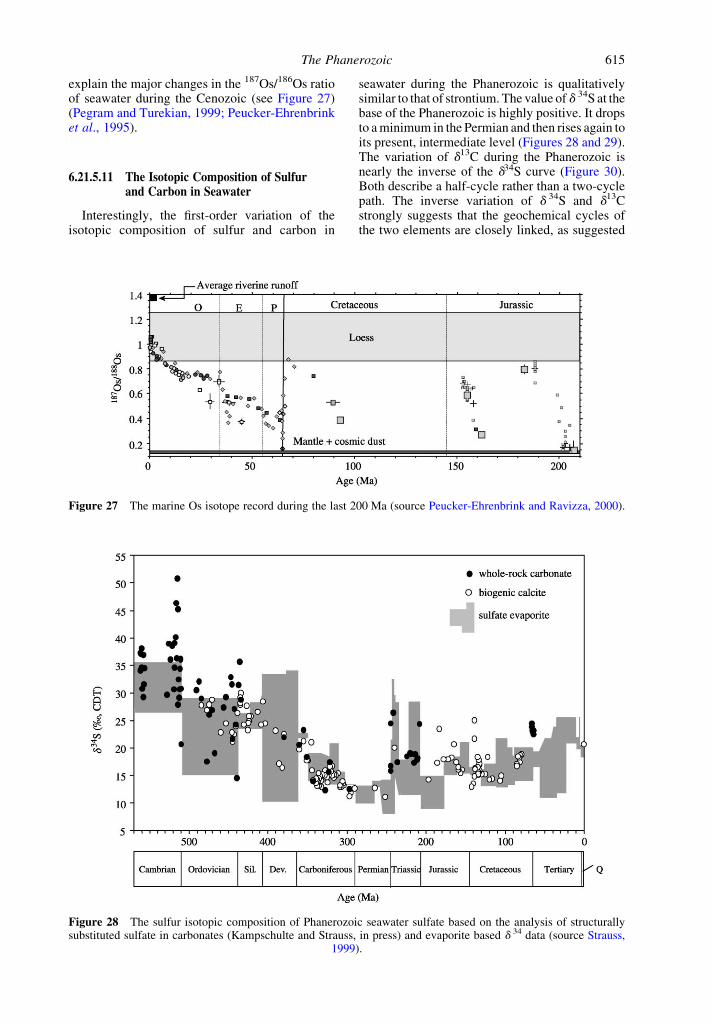
explain the major changes in the 187Os/186Os ratioof seawater during the Cenozoic (see Figure 27)(Pegram and Turekian, 1999; Peucker-Ehrenbrinket al., 1995).
6.21.5.11 The Isotopic Composition of Sulfurand Carbon in Seawater
Interestingly, the first-order variation of theisotopic composition of sulfur and carbon in
seawater during the Phanerozoic is qualitativelysimilar to that of strontium. The value of d 34S at thebase of the Phanerozoic is highly positive. It dropsto a minimum in the Permian and then rises again toits present, intermediate level (Figures 28 and 29).The variation of d13C during the Phanerozoic isnearly the inverse of the d34S curve (Figure 30).Both describe a half-cycle rather than a two-cyclepath. The inverse variation of d 34S and d13Cstrongly suggests that the geochemical cycles ofthe two elements are closely linked, as suggested
Figure 27 The marine Os isotope record during the last 200 Ma (source Peucker-Ehrenbrink and Ravizza, 2000).
Figure 28 The sulfur isotopic composition of Phanerozoic seawater sulfate based on the analysis of structurallysubstituted sulfate in carbonates (Kampschulte and Strauss, in press) and evaporite based d 34 data (source Strauss,
1999).
The Phanerozoic 615
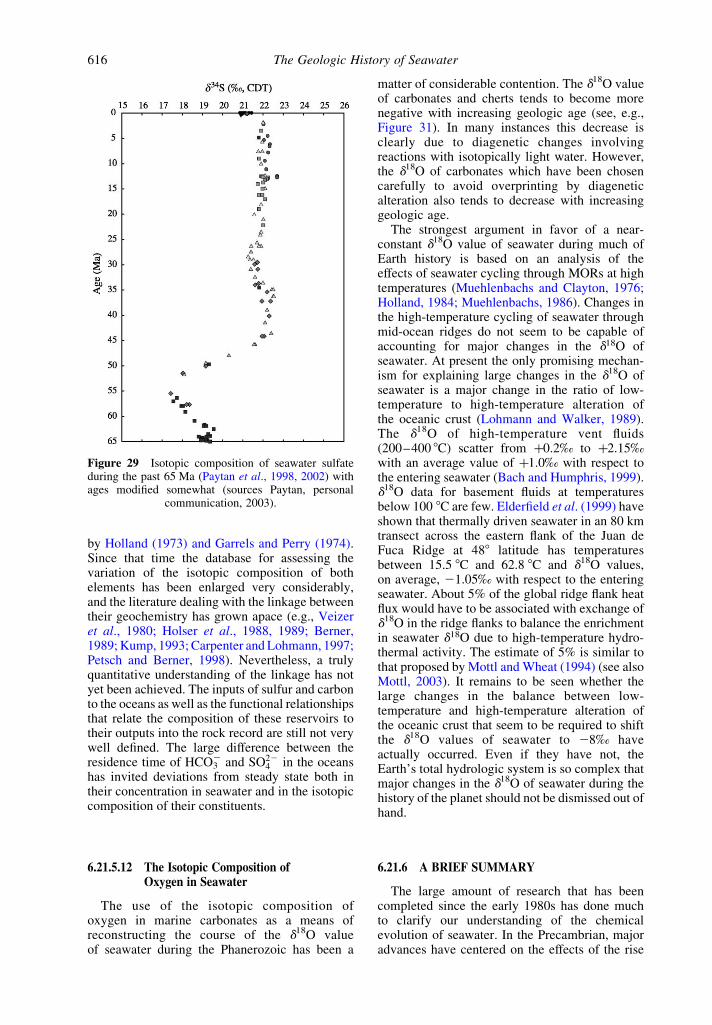
by Holland (1973) and Garrels and Perry (1974).Since that time the database for assessing thevariation of the isotopic composition of bothelements has been enlarged very considerably,and the literature dealing with the linkage betweentheir geochemistry has grown apace (e.g., Veizeret al., 1980; Holser et al., 1988, 1989; Berner,1989; Kump, 1993; Carpenter and Lohmann, 1997;Petsch and Berner, 1998). Nevertheless, a trulyquantitative understanding of the linkage has notyet been achieved. The inputs of sulfur and carbonto the oceans as well as the functional relationshipsthat relate the composition of these reservoirs totheir outputs into the rock record are still not verywell defined. The large difference between theresidence time of HCO3
2 and SO224 in the oceans
has invited deviations from steady state both intheir concentration in seawater and in the isotopiccomposition of their constituents.
6.21.5.12 The Isotopic Composition ofOxygen in Seawater
The use of the isotopic composition ofoxygen in marine carbonates as a means ofreconstructing the course of the d18O valueof seawater during the Phanerozoic has been a
matter of considerable contention. The d18O valueof carbonates and cherts tends to become morenegative with increasing geologic age (see, e.g.,Figure 31). In many instances this decrease isclearly due to diagenetic changes involvingreactions with isotopically light water. However,the d18O of carbonates which have been chosencarefully to avoid overprinting by diageneticalteration also tends to decrease with increasinggeologic age.
The strongest argument in favor of a near-constant d18O value of seawater during much ofEarth history is based on an analysis of theeffects of seawater cycling through MORs at hightemperatures (Muehlenbachs and Clayton, 1976;Holland, 1984; Muehlenbachs, 1986). Changes inthe high-temperature cycling of seawater throughmid-ocean ridges do not seem to be capable ofaccounting for major changes in the d18O ofseawater. At present the only promising mechan-ism for explaining large changes in the d18O ofseawater is a major change in the ratio of low-temperature to high-temperature alteration ofthe oceanic crust (Lohmann and Walker, 1989).The d18O of high-temperature vent fluids(200–400 8C) scatter from þ0.2‰ to þ2.15‰with an average value of þ1.0‰ with respect tothe entering seawater (Bach and Humphris, 1999).d18O data for basement fluids at temperaturesbelow 100 8C are few. Elderfield et al. (1999) haveshown that thermally driven seawater in an 80 kmtransect across the eastern flank of the Juan deFuca Ridge at 488 latitude has temperaturesbetween 15.5 8C and 62.8 8C and d18O values,on average, 21.05‰ with respect to the enteringseawater. About 5% of the global ridge flank heatflux would have to be associated with exchange ofd18O in the ridge flanks to balance the enrichmentin seawater d18O due to high-temperature hydro-thermal activity. The estimate of 5% is similar tothat proposed by Mottl and Wheat (1994) (see alsoMottl, 2003). It remains to be seen whether thelarge changes in the balance between low-temperature and high-temperature alteration ofthe oceanic crust that seem to be required to shiftthe d18O values of seawater to 28‰ haveactually occurred. Even if they have not, theEarth’s total hydrologic system is so complex thatmajor changes in the d18O of seawater during thehistory of the planet should not be dismissed out ofhand.
6.21.6 A BRIEF SUMMARY
The large amount of research that has beencompleted since the early 1980s has done muchto clarify our understanding of the chemicalevolution of seawater. In the Precambrian, majoradvances have centered on the effects of the rise
Figure 29 Isotopic composition of seawater sulfateduring the past 65 Ma (Paytan et al., 1998, 2002) withages modified somewhat (sources Paytan, personal
communication, 2003).
The Geologic History of Seawater616
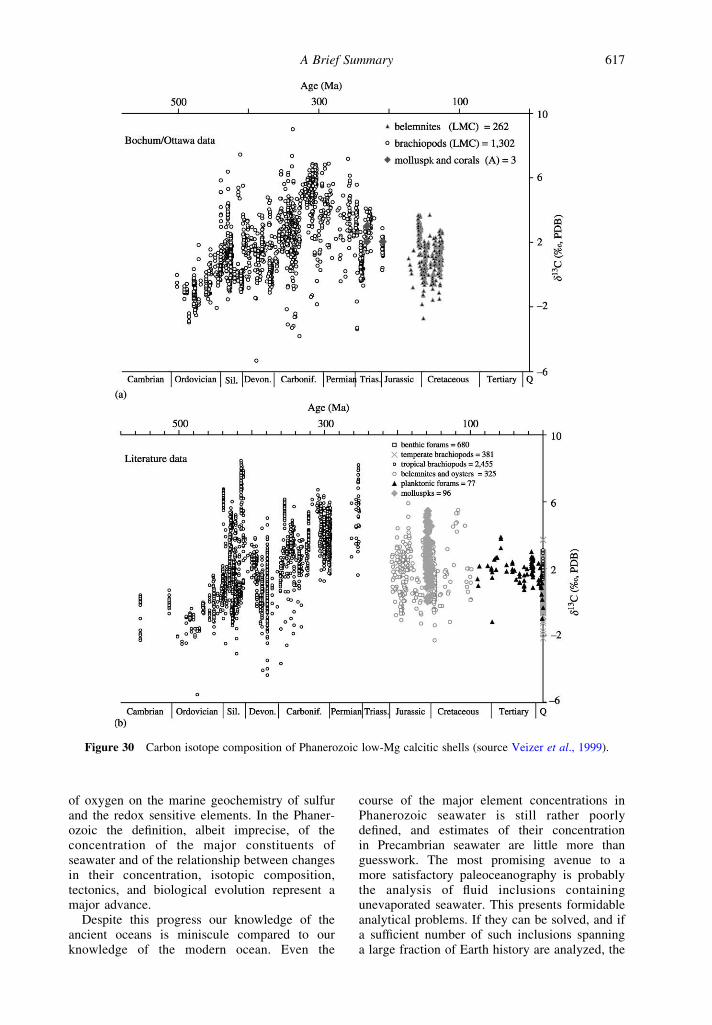
of oxygen on the marine geochemistry of sulfurand the redox sensitive elements. In the Phaner-ozoic the definition, albeit imprecise, of theconcentration of the major constituents ofseawater and of the relationship between changesin their concentration, isotopic composition,tectonics, and biological evolution represent amajor advance.
Despite this progress our knowledge of theancient oceans is miniscule compared to ourknowledge of the modern ocean. Even the
course of the major element concentrations inPhanerozoic seawater is still rather poorlydefined, and estimates of their concentrationin Precambrian seawater are little more thanguesswork. The most promising avenue to amore satisfactory paleoceanography is probablythe analysis of fluid inclusions containingunevaporated seawater. This presents formidableanalytical problems. If they can be solved, and ifa sufficient number of such inclusions spanninga large fraction of Earth history are analyzed, the
Figure 30 Carbon isotope composition of Phanerozoic low-Mg calcitic shells (source Veizer et al., 1999).
A Brief Summary 617
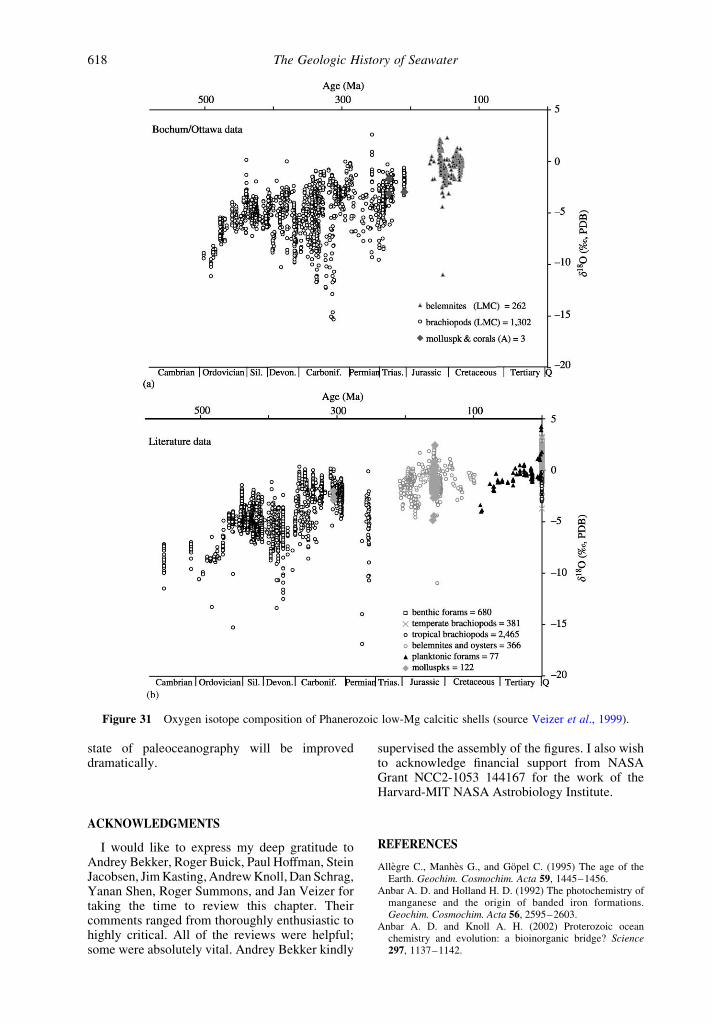
state of paleoceanography will be improveddramatically.
ACKNOWLEDGMENTS
I would like to express my deep gratitude toAndrey Bekker, Roger Buick, Paul Hoffman, SteinJacobsen, Jim Kasting, Andrew Knoll, Dan Schrag,Yanan Shen, Roger Summons, and Jan Veizer fortaking the time to review this chapter. Theircomments ranged from thoroughly enthusiastic tohighly critical. All of the reviews were helpful;some were absolutely vital. Andrey Bekker kindly
supervised the assembly of the figures. I also wishto acknowledge financial support from NASAGrant NCC2-1053 144167 for the work of theHarvard-MIT NASA Astrobiology Institute.
REFERENCES
Allegre C., Manhes G., and Gopel C. (1995) The age of theEarth. Geochim. Cosmochim. Acta 59, 1445–1456.
Anbar A. D. and Holland H. D. (1992) The photochemistry ofmanganese and the origin of banded iron formations.Geochim. Cosmochim. Acta 56, 2595–2603.
Anbar A. D. and Knoll A. H. (2002) Proterozoic oceanchemistry and evolution: a bioinorganic bridge? Science297, 1137–1142.
Figure 31 Oxygen isotope composition of Phanerozoic low-Mg calcitic shells (source Veizer et al., 1999).
The Geologic History of Seawater618
Anbar A. D., Zahnle K. J., Arnold G. L., and Mojzsis S. J.(2002) Extraterrestrial iridium, sediment accumulation andthe habitability of the early Earth’s surface. J. Geophys. Res.106, 3219–3236.
Appel P. W. U. (1983) Rare earth elements in the EarlyArchean Isua iron-formation, West Greenland. Precamb.Res. 20, 243–258.
Appel P. W. U. and Moorbath S. (1999) Exploring Earth’soldest geological record in Greenland. EOS, Trans., AGU 80,257, 261, 264.
Armstrong R. A., Lee G. F., Hedges J. I., Honjo S., andWakeham A. (2002) A new mechanistic model for organiccarbon fluxes in the ocean based on the quantitativeassociation of POC with ballast minerals. Deep-Sea Res.49, 219–236.
Arnold G. L., Anbar A. D., and Barling J. (2002) Oxygenationof Proterozoic oceans: insight from molybdenum isotopes(abstr.). Geochim. Cosmochim. Acta 66 (15A), A30(abstracts of the 12th V. M. Goldschmidt Conference,Davos, Switzerland, August 18–23, 2002).
Ault W. U. and Kulp J. L. (1959) Isotopic geochemistry ofsulfur. Geochim. Cosmochim. Acta 16, 201–235.
Bach W. and Humphris S. E. (1999) Relationship between theSr and O isotope compositions of hydrothermal fluids andthe spreading and magma-supply rates at oceanic spreadingcenters. Geology 27, 1067–1070.
Barth T. F. W. (1952) Theoretical Petrology. Wiley,New York.
Bau M. and Moller P. (1993) Rare earth element systematics ofthe chemically precipitated component in Early Precambrianiron formations and the evolution of the terrestrialatmosphere–hydrosphere– lithosphere system. Geochim.Cosmochim. Acta 57, 2239–2249.
Bekker A., Kaufman A. J., Karhu J. A., Beukes N. J., SwartQ. D., Coetzee L. L., and Eriksson K. A. (2001)Chemostratigraphy of the Paleoproterozic DuitschlandFormation, South Africa: implications for coupled climatechange and carbon cycling. Am. J. Sci. 301, 261–285.
Bekker A., Holland H. D., Rumble D., Yang W., Wang P.-L.,and Coetzee L. L. (2002) MIF of S, oolitic ironstones, redoxsensitive elements in shales, and the rise of atmosphericoxygen (abstr.). Geochim. Cosmochim. Acta 66, A64.
Bekker A., Holland H. D., Young G. M., and Nesbitt H. W.(2003) The fate of oxygen during the early Paleoproterozoiccarbon isotope excursion. Astrobiology 2(4), 477.
Berner R. A. (1989) Biogeochemical cycles of carbon andsulfur and their effect on atmospheric oxygen overPhanerozoic time. Paleogeogr. Paleoclimatol. Paleoecol.75, 97–122.
Berner R. A., Lasaga A. C., and Garrels R. M. (1983) Thecarbonate-silicate geochemical cycle and its effect onatmospheric carbon dioxide. Am. J. Sci. 283, 641–683.
Beukes N. J. (1978) Die Karbonaatgesteentes en Ysterforma-sies van die Ghaap-Groep van die Transvaal-Supergroep inNoord-Kaapland. PhD Thesis, Rand Afrikaans University.
Beukes N. J. (1983) Palaeoenvironmental setting of iron-formations in the depositional basin of the TransvaalSupergroup, South Africa. In Iron Formation: Facts andProblems (eds. A. F. Trendall and R. C. Morris). Elsevier,Amsterdam, pp. 131–209.
Beukes N. J. and Klein C. (1990) Geochemistryand sedimentology of a facies transition from micro-banded to granular iron-formation in the early ProterozoicTransvaal Supergroup, South Africa. Precamb. Res. 47,99–139.
Beukes N. J. and Klein C. (1992) Time distribution,stratigraphy, and sedimentologic setting, and geochemistryof Precambrian iron-formations. In The ProterozoicBiosphere (eds. J. W. Schopf and C. Klein). CambridgeUniversity Press, Cambridge, pp. 139–146.
Beukes N. J., Dorland H., and Gutzmer J. (2002a) Pisoliticironstone and ferricrete in the 2.22–2.4 Ga Timeball HillFormation, Transvaal Supergroup: implications for the
history of atmospheric oxygen (abstr.). 2002 Annual Meetingof the Geological Society of America, 283p.
Beukes N. J., Dorland H., Gutzmer J., Nedachi M., and OhmotoH. (2002b) Tropical laterites, life on land, and the history ofatmospheric oxygen in the Paleoproterozoic. Geology 30,491–494.
Birch T. (1756) A History of the Royal Society of London(ed. A. Millar). London, vol. 1.
Black R. C. (1966) The Younger John Winthrop. ColumbiaUniversity Press, New York.
Boak J. L. and Dymek R. F. (1982) Metamorphism of the ca. 3,800 Ma supercrustal rocks at Isua, West Greenland:implications for early Archaean crustal evolution. EarthPlanet. Sci. Lett. 59, 155–176.
Boetius A., Ravenschlag K., Schubert C. J., Rickert D., WiddelF., Gieseke A., Amann R., Jørgensen B. B., Witte U., andPfannkuche O. (2000) A marine microbial consortiummediating anaerobic oxidation of methane. Nature 407,623–626.
Bowring S. A. and Williams I. S. (1999) Priscoan (4.00–4.03)orthogneiss from northwestern Canada. Contrib. Mineral.Petrol. 134, 3–16.
Bowring S. A., Landing E., Myrow P., and Ramenzavi J.(2003) Geochronological constraints on the terminal Neo-proterozoic events and the rise of Metazoans. Astrobiology2(4), 457–458.
Brasier M. D., Green O. R., Steele A., Van Kranendonk M.,Jephcoat A. P., Kleppe A. K., Lindsay J. F., and GrassineauN. V. (2002) Questioning the evidence for Earth’s oldestfossils. In Astrobiology Science Conference, NASA AmesResearch Center, April 7–11, 2002.
Braterman P. S., Cairns-Smith A. G., and Sloper R. W. (1983)Photo-oxidation of hydrated Feþ2—significance for bandediron formations. Nature 303, 163–164.
Braterman P. S., Cairns-Smith A. G., Sloper R. W., TruscottT. G., and Craw M. (1984) Photooxidation of iron (II) inwater between pH 7.4 and 4.0. J. Chem. Soc.: Dalton Trans.,1441–1445.
Bridgewater D., Keto L., McGregor V. R., and Myers J. S.(1976) Archaean gneiss complex in Greenland. In Geology ofGreenland, Geological Survey of Greenland (eds. A. Escherand W. S. Watt). Copenhagen, pp. 20–75.
Brocks J. J., Logan G. A., Buick R., and Summons R. E. (1999)Archean molecular fossils and the early rise of Eukaryotes.Science 285, 1033–1036.
Brocks J. J., Summons R. E., Logan G. A., and Buick R. (2002)Molecular fossils in Archean Rocks: constraints onthe oxygenation of the upper water column (abstr.). InAstrobiology Science Conference, NASA Ames ResearchCenter, April 7–11, 2002.
Bruno J., Wersin P., and Stumm W. (1992) On the influence ofcarbonate in mineral dissolution: II. The stability ofFeCO3(s) at 258 and 1 atm. total pressure. Geochim.Cosmochim. Acta 56, 1149–1155.
Burke W. H., Denison R. E., Heatherington E. A., KoepnickR. B., Nelson H. F., and Otto J. B. (1982) Variation ofseawater 87Sr/86Sr throughout Phanerozoic time. Geology10, 516–519.
Cairns-Smith A. G. (1978) Precambrian solution photochem-istry-inverse segregation and banded iron formations. Nature276, 807–808.
Canfield D. E. (1998) A new model for Proterozoic oceanchemistry. Nature 396, 450–452.
Canfield D. E. (2001) Biogeochemistry of Sulfur Isotopes. InStable Isotope Geochemistry, Reviews in Mineralogy andGeochemistry (eds. J. W. Valley and D. R. Cole).Washington, DC, vol. 43, pp. 607–636.
Canfield D. E. and Raiswell R. (1999) The evolution of thesulfur cycle. Am. J. Sci. 299, 697–729.
Canfield D. E., Habicht K., and Thamdrup B. (2000) TheArchean sulfur cycle and the early history of atmosphericoxygen. Science 288, 658–661.
References 619
Canil D. (1997) Vanadium partitioning and the oxidation stateof Archaean Komatiite magmas. Nature 389, 842–845.
Canil D. (1999) Vanadium partitioning between orthopyrox-ene, spinel and silicate melt and the redox states of mantlesource regions for primary magmas. Geochim. Cosmochim.Acta 63, 557–572.
Canil D. (2002) Vanadium in peridotites, mantle redox andtectonic environments: Archean to present. Earth Planet.Sci. Lett. 195, 75–90.
Carpenter S. J. and Lohmann K. C. (1997) Carbon isotoperatios of Phanerozoic marine cements: re-evaluating theglobal carbon and sulfur systems. Geochim. Cosmochim.Acta 61, 4831–4846.
Catling D. C., Zahnle K. J., and McKay C. P. (2001) Biogenicmethane, hydrogen escape, and the irreversible oxidation ofearly Earth. Science 293, 839–843.
Chyba C. F. (1993) The violent emergence of the origin of life:progress and uncertainties. Geochim. Cosmochim. Acta 57,3351–3358.
Cicero A. D. and Lohmann K. C. (2001) Sr/Mg variationduring rock-water interaction: implications for secularchanges in the elemental chemistry of ancient seawater.Geochim. Cosmochim. Acta 65, 741–761.
Clarke F. W. (1911) The Data of Geochemistry, 2nd edn. TheGovernment Printing Office, Washington, DC.
Cloud P. E., Jr. (1968) Atmospheric and hydrosphericevolution on the primitive Earth. Science 160, 729–736.
Cloud P. E., Jr. (1972) A working model for the primitiveEarth. Am. J. Sci. 272, 537–548.
Colman A. S. and Holland H. D. (2000) The globaldiagenetic flux of phosphorus from marine sediments tothe oceans: redox sensitivity and the control of atmos-pheric oxygen levels. In Marine Authigenesis: FromGlobal to Microbiol, SEPM Special Publication No. 66(eds. C. R. Glenn, L. Prevot-Lucas, and J. Lucas). Tulsa,UK, pp. 53–75.
Compston W. and Pidgeon R. T. (1986) Jack Hills, evidence ofmore very old detrital zircons in Western Australia. Nature321, 766–769.
Condon D. J., Prave A. R., and Benn D. I. (2002)Neoproterozoic glacial-rainout intervals: observations andimplications. Geology 30, 35–38.
Conway E. J. (1943) The chemical evolution of the ocean.Proc. Roy. Irish Acad. 48B(8), 161–212.
Conway E. J. (1945) Mean losses of Na, Ca, etc. in oneweathering cycle and potassium removal from the ocean.Am. J. Sci. 243, 583–605.
Cook P. J. and McElhinny M. W. (1979) A reevaluation of thespatial and temporal distribution of sedimentary phosphatedeposits in the light of plate tectonics. Econ. Geol. 74,315–330.
Cook P. J. and Shergold J. H. (1984) Phosphorus, phosphoritesand skeletal evolution at the Precambrian–Cambrianboundary. Nature 308, 231–236.
Cook P. J. and Shergold J. H. (1986) Proterozoic and Cambrianphosphorites—nature and origins. In Phosphate Deposits ofthe World: Volume 1. Proterozoic and Cambrian Phosphor-ites (eds. P. J. Cook and J. H. Shergold). CambridgeUniversity Press, Cambridge, pp. 369–386.
Crick I. H. (1992) Petrological and maturation characteristicsof organic matter from the Middle Proterozoic McArthurBasin, Australia. Austral. J. Earth Sci. 39, 501–519.
Dalrymple G. B. and Ryder G. (1996) Argon-40/argon-39 agespectra of Apollo 17 highlands breccia samples by laser stepheating and the age of the Serenitatis basin. J. Geophys. Res.101, 26069–26084.
Das N., Horita J., and Holland H. D. (1990) Chemistry of fluidinclusions in halite from the Salina Group of the MichiganBasin: implications for Late Silurian seawater and the originof sedimentary brines. Geochim. Cosmochim. Acta 54,319–327.
Delaney M. L. and Boyle F. A. (1986) Lithiumin foraminiferal shells: implications for high-temperature
hydrothermal circulation fluxes and oceaniccrustal generation rates. Earth Planet. Sci. Lett. 80,91–105.
Delano J. W. (2001) Redox history of the Earth’s interior:implications for the origin of life. Origins Life Evol.Biosphere 31, 311–334.
De Long E. F. (2000) Resolving a methane mystery. Nature407, 577–579.
De Ronde C. E. J., de Wit M. J., and Spooner E. T. C. (1994)Early Archean (.3.2 Ga) iron-oxide-rich hydrothermaldischarge vents in the Barberton greenstone belt. SouthAfrica Geol. Soc. Am. Bull. 106, 86–104.
De Ronde C. E. J., Channer R. M., Faure de R., Bray C. J., andSpooner E. T. C. (1997) Fluid chemistry of Archean seafloorhydrothermal vents: implications for the composition ofcirca 3.2 Ga seawater. Geochim. Cosmochim. Acta 61,4025–4042.
Donnelly T. H. and Jackson M. J. (1988) Sedimentology andgeochemistry of a mid-Proterozoic lacustrine unit fromNorthern Australia. Sedim. Geol. 58, 145–169.
Donnelly T. H., Shergold J. H., Southgate P. N., and BarnesC. J. (1990) Events leading to global phosphogenesis aroundthe Proterozoic – Cambrian boundary. In PhosphoriteResearch and Development, Geological Society SpecialPublication No. 52 (eds. A. J. G. Notholt and I. Jarvis).London, pp. 273–287.
Dymek R. F. and Klein C. (1988) Chemistry, petrology andorigin of banded iron-formation lithologies from the3,800 Ma Isua supracrustal belt. West Greenland. Precamb.Res. 39, 247–302.
Elderfield H., Wheat C. G., Mottle M. J., Monnin C., andSpiro B. (1999) Fluid and geochemical transport throughoceanic crust: a transect across the eastern flank of the Juande Fuca Ridge. Earth Planet. Sci. 172, 151–165.
Elderfield H., Cooper M., and Ganssen G. (2000) Sr/Ca inmultiple species of planktonic foraminifera: implications forreconstructions of seawater Sr/Ca. Geochem. Geophys.Geosys. 1, paper number 1999GC000031.
Elderfield H., Vautravers M., and Cooper M. (2002)The relationship between cell size and Mg/Ca, Sr/Ca,d 18O and d13C of species of planktonic foraminifera.Geochem. Geophys. Geosys. 3(8), paper number 10.1029/2001GC000194.
Farquhar J., Bao H., and Thiemens M. (2000) Atmosphericinfluence of Earth’s earliest sulfur cycle. Science 289,756–758.
Farquhar J., Savarino J., Airieau S., and Thiemens M. (2001)Observation of wavelength-sensitive mass-independent sul-fur isotope effect during SO2 photolysis: implications for theearly atmosphere. J. Geophys. Res. 106, 32829–32839.
Feather C. E. (1980) Some aspects of Witwatersrandmineralization with special reference to uranium minerals:Prof. Paper. US Geol. Surv., 1161-M.
Fedo C. M. and Whitehouse M. J. (2002) Metasomatic origin ofquartz-pyroxene rock, Akilia, Greenland, and implicationsfor Earth’s earliest life. Science 296, 1448–1452.
Francois L. M. (1986) Extensive deposition of banded ironformations was possible without photosynthesis. Nature 320,352–354.
Francois L. M. (1987) Reducing power of ferrous iron in theArchean ocean: 2. Role of Fe(OH)þ photo-oxidation.Paleoceanography 2, 395–408.
Froude D. O. (1983) Ion microprobe identification of4,100–4,200 Myr old terrestrial zircons. Nature 304,616–618.
Fryer B. J. (1983) Rare-earth elements. In Iron Formation:Facts and Problems (eds. A. F. Trendall and R. C. Morris).Elsevier, Amsterdam, pp. 345–358.
Gaffin S. (1987) Ridge volume dependence on sea floorgeneration rate and inversion using long-term sea levelchange. Am. J. Sci. 287, 596–611.
Garrels R. M. and Mackenzie F. T. (1971) Evolution ofSedimentary Rocks. W.W. Norton, New York.
The Geologic History of Seawater620
Garrels R. M. and Perry E. C., Jr. (1974) Cycling of carbon,sulfur and oxygen through geologic time. In The Sea (ed.E. D. Goldberg). Wiley, New York, vol. 5, pp. 303–336.
Given R. K. and Wilkinson B. H. (1987) Dolomite abundanceand stratigraphic age: constraints on rates and mechanismsof Phanerozoic dolostone formation. J. Sedim. Petrol. 57,1068–1078.
Grandstaff D. E. (1976) A kinetic study of the dissolution ofuraninite. Econ. Geol. 71, 1493–1506.
Grandstaff D. E. (1980) Origin of uraniferous conglomerates atElliott Lake, Canada and Witwatersrand, South Africa:implications for oxygen in the Precambrian atmosphere.Precamb. Res. 13, 1–26.
Grotzinger J. P. (1989) Facies and evolution of Precambriancarbonate depositional systems: emergence of the modernplatform archetype. In Controls on Carbonate Platform andBasin Development, Special Publication No. 44 (eds. P. D.Crevello, J. L. Wilson, J. F. Sarg, and J. F. Read). TheSociety of Economic Paleontologists and Mineralogists,Tulsa, UK, pp. 79–106.
Grotzinger J. P. and Kasting J. F. (1993) New constraints onPrecambrian ocean composition. J. Geol. 101, 235–243.
Grundl T. and Delwiche J. (1993) Kinetics offerric oxyhydroxide precipitation. J. Contamin. Hydrol. 14,71–87.
Habicht K. S., Gade M., Thamdrup B., Berg P., and CanfieldD. E. (2002) Calibration of sulfate levels in Archean ocean.Science 298, 2372–2374.
Hallam A. (1984) Pre-quaternary sea level changes. Ann. Rev.Earth Planet. Sci. 12, 205–243.
Hallbauer D. K. (1986) The mineralogy and geochemistry ofWitwatersrand pyrite, gold, uranium and carbonaceousmatter. In Mineral Deposits of Southern Africa (eds. C. R.Anhaeusser and S. Maske). Geological Society of SouthAfrica, Johannesburg, SA, pp. 731–752.
Halley E. (1715) A short account of the cause of the saltness ofthe ocean, and of the several lakes that emit no rivers; with aproposal, by help thereof, to discover the Age of the World.Phil. Trans. Roy. Soc. London 29, 296–300.
Halliday A. N. (2000) Terrestrial accretion rates and the originof the Moon. Earth Planet. Sci. Lett. 176, 17–30.
Halliday A. N. (2001) In the beginning. Nature 409,144–145.
Halverson G. P. (2003) Towards an integrated stratigraphic andcarbon isotopic record for the Neoproterozoic. DoctoralDissertation, Department of Earth and Planetary Sciences,Harvard University, Cambridge, MA.
Hambrey M. J. and Harland W. B. (1981) Earth’s Pre-Pleistocene Glacial Record. Cambridge University Press,Cambridge.
Han T.-M. (1982) Iron formations of Precambrian age:hematite–magnetite relationships in some Proterozoic irondeposits—a microscopic observation. In Ore Genesis—The State of the Art (eds. G. C. Amstutz, A. E. Goresy,G. Frenzel, C. Kluth, G. Moh, A. Wauschkuhn, andR. A. Zimmermann). Springer, Berlin, pp. 451–459.
Han T.-M. (1988) Origin of magnetite in iron-formations oflow metamorphic grade. In Proceedings of the 7th Quad-rennial IAGOD Symposium, pp. 641–656.
Haq B. U., Hardenbol J., and Vail P. R. (1987) Chronology offluctuating sea levels since the Triassic. Science 235,1156–1167.
Hardie L. A. (1967) The gypsum-anhydrite equilibrium at oneatmosphere pressure. Am. Mineral. 52, 171–200.
Hardie L. A. (1991) On the significance of evaporites. Ann.Rev. Earth Planet. Sci. 19, 131–168.
Hardie L. A. (1996) Secular variation in seawater chemistry: anexplanation for the coupled variation in the mineralogies ofmarine limestones and potash evaporites over the past600 my. Geology 24, 279–283.
Harrison A. G. and Thode H. G. (1958) Mechanisms of thebacterial reduction of sulfate from isotope fractionationstudies. Trans. Faraday Soc. 53, 84–92.
Hartmann W. K., Ryder G., Grinspoon D., and Dones L. (2000)The time-dependent intense bombardment of the primordialEarth/Moon system. In Origin of the Earth and Moon (eds.R. M. Canup and K. Righter). University of Arizona Press,Tucson, pp. 493–512.
Harvie C. E., Weare J. H., Hardie L. A., and Eugster H. P.(1980) Evaporation of seawater: calculated mineralsequences. Science 208, 498–500.
Hoehler T. M. and Alperin M. J. (1996) Anaerobic methaneoxidation by a methanogen-sulfate reducer consortium:geochemical evidence and biochemical considerations. InMicrobial Growth in C1 Compounds (eds. M. E. Lindstromand F. R. Tabita). Kluwer Academic, San Diego.
Hoffman P. F. and Schrag D. P. (2002) The snowball earthhypothesis: testing the limits of global change. Terra Nova14, 129–155.
Hoffman P., Kaufman A. J., Halverson G. P., and Schrag D. P.(1998) A Neoproterozoic snowball Earth. Science 281,146–1342.
Holland H. D. (1962) Model for the evolution of the Earth’satmosphere. In Petrologic Studies: A Volume to Honor A. F.Buddington (eds. A. E. J. Engel, H. L. James, and B. F.Leonard). Geological Society of America, pp. 447–477.
Holland H. D. (1972) The geologic history of seawater: anattempt to solve the problem. Geochim. Cosmochim. Acta36, 637–651.
Holland H. D. (1973) Systematics of the isotopic compositionof sulfur in the oceans during the Phanerozoic and itsimplications for atmospheric oxygen. Geochim. Cosmochim.Acta 37, 2605–2616.
Holland H. D. (1984) The Chemical Evolution ofthe Atmosphere and Oceans. Princeton University Press,Princeton, NJ, 582p.
Holland H. D. (1994) Early Proterozoic atmosphericchange. In Early Life on Earth, Nobel Symposium 84(ed. S. Bengtson). Columbia University Press, New York,pp. 237–244.
Holland H. D. (1997) Evidence for life on Earth more than 3,850 million years ago. Science 275, 38–39.
Holland H. D. (2002) Volcanic gases, black smokers, and theGreat Oxidation Event. Geochim. Cosmochim. Acta 66,3811–3826.
Holland H. D. and Beukes N. J. (1990) A paleoweatheringprofile from Griqualand West, South Africa: evidence for adramatic rise in atmospheric oxygen between 2.2 and 1.9BYBP. Am. J. Sci. 290, 1–34.
Holland H. D. and Zbinden E. A. (1988) Paleosols and theevolution of the atmosphere: Part I. In Physicaland Chemical Weathering in Geochemical Cycles (eds.A. Lerman and M. Meybeck). Kluwer Academic, SanDiego, pp. 61–82.
Holland H. D. and Zimmermann H. (1998) On the secularvariations in the composition of Phanerozoic marine potashevaporites: Comment and reply. Geology 26, 91–92.
Holland H. D. and Zimmermann H. (2000) The dolomiteproblem revisited. Int. Geol. Rev. 42, 481–490.
Holland H. D., Horita J., and Seyfried W. E. (1996) On thesecular variations in the composition of Phanerozoic marinepotash evaporites. Geology 24, 993–996.
Holser W. T. (1963) Chemistry of brine inclusions in Permiansalt from Hutchinson, Kansas. In Symposium on Salt (First)(ed. A. C. Bersticker). Northern Ohio Geol. Soc., Cleveland,OH, pp. 86–95.
Holser W. T. and Kaplan I. R. (1966) Isotope geochemistry ofsedimentary sulfates. Chem. Geol. 1, 93–135.
Holser W. T., Schidlowski M., Mackenzie F. T., andMaynard J. B. (1988) Biogeochemical cycles ofcarbon and sulfur. In Chemical Cycles in the Evolution ofthe Earth (eds. C. B. Gregor, R. M. Garrels, F. T. Mackenzie,and J. B. Maynard). Wiley-Interscience, New York,pp. 105–173.
Holser W. T., Maynard J. B., and Cruikshank K. M. (1989)Modelling the natural cycle of sulphur through Phanerozoic
References 621
time. In Evolution of the Global BiogeochemicalSulphur Cycle (eds. P. Brimblecombe and A. Y. Lein).Wiley, New York, chap 2, pp. 21–56.
Horita J., Friedman T. J., Lazar B., and Holland H. D. (1991)The composition of Permian seawater. Geochim. Cosmo-chim. Acta 55, 417–432.
Horita J., Weinberg A., Das N., and Holland H. D. (1996) Brineinclusions in halite and the origin of the Middle DevonianPrairie Evaporites of Western Canada. J. Sedim. Res. 66,956–964.
Horita J., Zimmermann H., and Holland H. D. (2002) Thechemical evolution of seawater during the Phanerozoic:implications from the record of marine evaporites. Geochim.Cosmochim. Acta 66, 3733–3756.
Iglesias-Rodriguez M. D., Armstrong R. A., Feely R., Hood R.,Kleypas J., Milliman J. D., Sabine C., and Sarmiento J. L.(2002) Progress made in study of ocean’s calcium carbonatebudget. EOS 83, 365, 374–375.
Iversen N. and Jørgensen B. B. (1985) Anaerobic methaneoxidation rates at the sulfate-methane transition in marinesediments from Kattegat and Skagerrak (Denmark). Limnol.Oceanogr. 30, 944–955.
Jackson M. J. and Raiswell R. (1991) Sedimentology andcarbon–sulfur geochemistry of the Velkerry Formation, amid-Proterozoic potential oil source in Northern Australia.Precamb. Res. 54, 81–108.
Jackson M. J., Muir M. D., and Plumb K. A. (1987) Geology ofthe southern McArthur Basin, Northern Territory. Bureau ofMineral Resources, Geology and Geophysics. Bulletin 220.
Jacobsen S. B. and Kaufman A. J. (1999) The Sr, C, andO isotopic evolution of Neoproterozoic seawater. Chem.Geol. 161, 37–57.
James H. L. (1983) Distribution of banded iron-formation inspace and time. In Iron Formation: Facts and Problems (eds.A. F. Trendall and R. C. Morris). Elsevier, Amsterdam,pp. 471–490.
James H. L. (1992) Precambrian iron-formations: nature,origin, and mineralogical evolution from sedimentation tometamorphism. In Diagenesis III: Developments in Sedi-mentology (eds. K. H. Wolf and G. V. Chilingarian).Elsevier, Amsterdam, pp. 543–589.
Johnson W. J. and Goldstein R. H. (1993) Cambrian seawaterpreserved as inclusions in marine low-magnesium calcitecement. Nature 362, 335–337.
Joly J. (1899) An estimate of the geological age of the Earth.Sci. Trans. Roy. Dublin Soc. 7(II), 23–66.
Kakegawa T., Kawai H., and Ohmoto H. (1998) Origins ofpyrite in the .5 Ga Mt. McRae Shale, the Hamersley District,Western Australia. Geochim. Cosmochim. Acta 62,3205–3220.
Karhu J. A. (1993) Paleoproterozoic evolution of the carbonisotope ratios of sedimentary carbonates in the FennoscandianShield. Geol. Soc. Finland Bull. 371, 87.
Karhu J. A. and Holland H. D. (1996) Carbon isotopes and therise of atmospheric oxygen. Geology 24, 867–870.
Kasting J. F., Eggler D. H., and Raeburn S. P. (1993) Mantleredox evolution and the state of the Archean atmosphere.J. Geol. 101, 245–257.
Kasting J. F., Pavlov A. A., and Siefert J. L. (2001) A coupledecosystem-climate model for predicting the methane con-centration in the Archean atmosphere. Origin Life Evol.Biosphere 31, 271–285.
Kennedy M. J., Christie-Blick N., and Sohl L. E. (2001) AreProterozoic cap carbonates and isotopic excursions a recordof gas hydrate destabilization following Earth’s coldestintervals? Geology 29, 443–446.
Kinsman D. J. J. (1966) Gypsum and anhydrite of Recent age,Trucial Coast, Persian Gulf. In 2nd Symposium onSalt (ed. J. L. Rau). The Northern Ohio Geological Society,Cleveland, OH, vol. 1, pp. 302–326.
Kirk J., Ruiz J., Chesley J., Titley S., and Walshe J. (2001) Adetrital model for the origin of gold and sulfides in the
Witwatersrand basin based on Re–Os isotopes. Geochim.Cosmochim. Acta 65, 2149–2159.
Kirschvink J. L. (1992) Late Proterozoic low-latitude glacia-tion: the snowball earth. In The Proterozoic Biosphere (eds.J. W. Schopf and C. Klein). Cambridge University Press,Cambridge, pp. 51–52.
Klein C. and Beukes N. J. (1989) Geochemistry andsedimentology of a facies transition from limestoneto iron-formation deposition in the Early ProterozoicTransvaal Supergroup, South Africa. Econ. Geol. 84,1733–1774.
Klein C. and Beukes N. J. (1993) Sedimentologyand geochemistry of the glaciogenic Late Protero-zoic Rapitan iron-formation in Canada. Econ. Geol. 88,542–565.
Kleine T., Munker C., Mezger K., and Palme H. (2002) Rapidaccretion and early core formation on asteroids and theterrestrial planets from Hf–W chronometry. Nature 418,952–955.
Knoll A. H. (1992) Biological and biogeochemical preludes tothe Edeacaran radiation. In Origin and Early Evolution of theMetazoa (eds. J. H. Lipps and P. W. Signor). Plenum, NewYork, chap. 4.
Konhauser K. O., Hamade T., Raiswell R., Morris R. C., FerrisF. G., Southam G., and Canfield D. E. (2002) Could bacteriahave formed the Precambrain banded iron formations?Geology 30, 1079–1082.
Kump L. R. (1993) The coupling of the carbon and sulfurbiogeochemical cycles over Phanerozoic time. In Inter-actions of C, N, P, and S Biogeochemical Cycles and GlobalChange (eds. R. Wollast, F. T. Mackenzie, and L. Chou).Springer, pp. 475–490.
Lasaga A. C., Berner R. A., and Garrels R. M. (1985) Animproved geochemical model of atmospheric CO2 fluctu-ations over the past 100 million years. In The Carbon Cycleand Atmospheric CO2, Natural Variations Archean toPresent, Geophysical Monograph 32 (eds. E. T. Sundquistand W. S. Broecker). American Geophysical Union,Washington, DC, pp. 397–411.
Lazar B. and Holland H. D. (1988) The analysis of fluidinclusions in halite. Geochim. Cosmochim. Acta 52,485–490.
Lear C. H., Elderfield H., and Wilson P. A. (2000) Cenozoicdeep-sea temperatures and global ice volumes from Mg/Cain benthic foraminiferal calcite. Science 287, 269–272.
Lear C. H., Elderfield H., and Wilson P. A. (2003) A Cenozoicseawater Sr/Ca record from benthic foraminiferal calcite andits application in determining global weathering fluxes.Earth Planet. Sci. Lett. 208, 69–84.
Leather J., Allen P. A., Brasier M. D., and Cozzi A. (2002)Neoproterozoic snowball Earth under scrutiny: evidencefrom the Fig glaciation of Oman. Geology 30, 891–894.
Lithgow-Bertelloni C., Richards M. A., Ricard Y., O’ConnellR. J., and Engebretson D. C. (1993) Toroidal–poloidalpartitioning of plate motions since 120 Ma. Geophys. Res.Lett. 20, 375–378.
Logan G. A., Hayes J. M., Hieshima G. B., and Summons R. E.(1995) Terminal Proterozoic reorganization of biogeochem-ical cycles. Nature 376, 53–56.
Lohmann K. C. and Walker C. G. (1989) The d 18O record ofPhanerozoic abiotic marine calcite cements. Geophys. Res.Lett. 16, 319–322.
Lowenstein T. K., Timofeeff M. N., Brennan S. T., HardieL. A., and Demicco R. V. (2001) Oscillations in Phanerozoicseawater chemistry: evidence from fluid inclusions in saltdeposits. Science 294, 1086–1088.
Lugmaier G. W. and Shukolyukov A. (1998) Early solarsystem timescales according to 53Mn–53Cr systematics.Geochim. Cosmochim. Acta 62, 2863–2886.
Lyons T. W., Gellatly A. M., and Kah L. C. (2002)Paleoenvironmental significance of trace sulfate insedimentary carbonates. In Abstracts Volume, 6th Inter-national Symposium on the Geochemistry of the Earth’s
The Geologic History of Seawater622
Surface, May 20 – 24, 2002, Honolulu, Hawaii,pp. 162–165.
Mackenzie F. T. and Garrels R. M. (1966) Chemicalmass balance between rivers and oceans. Am. J. Sci. 264,507–525.
Melezhik V. A., Gorokhov I. M., Kuznetsov A. B., and FallickA. E. (2001) Chemostratigraphy of neoproterozoic carbon-ates: implications for “blind” dating. Terra Nova 13, 1–11.
Michaelis W., Seifert R., Nauhaus K., Treude T., Thiel V.,Blumenberg M., Knittel K., Gieseke A., Peterknecht K.,Pape T., Boetius A., Amann R., Jørgensen B. B., Widdel F.,Peckmann J., Pimenov N., and Gulin M. (2002) Microbialreefs in the Black Sea fueled by anaerobic oxidation ofmethane. Science 297, 1013–1015.
Millero F. J., Sotolongo S., and Izaguirre M. (1987) Theoxidation kinetics of Fe(II) in seawater. Geochim. Cosmo-chim. Acta 51, 793–801.
Mojzsis S. J., Arrhenius G., McKeegan K. D., Harrison T. M.,Nutman A. P., and Friend C. R. L. (1996) Evidence for lifeon Earth before 3,800 million years ago. Nature 384, 55–59.
Mojzsis S. J., Harrison T. M., and Pidgeon R. T. (2001)Oxygen-isotope evidence from ancient zircons for liquidwater at the Earth’s surface 4,300 Myr ago. Nature 409,178–181.
Morse J., Millero F. J., Thurmond V., Brown E., and OstlundH. G. (1984) The carbonate chemistry of Grand BahamaBank waters: after 18 years another look. J. Geophys. Res.89, 3604–3614.
Morse J. W., Wang Q., and Tsio M.-Y. (1997) Influences oftemperature and Mg : Ca ratio on CaCO3 precipitates fromseawater. Geology 25, 85–87.
Mottl M. J. (2003) Partitioning of energy and mass fluxesbetween mid-ocean ridge axes and flanks at high and lowtemperature. In Energy and Mass Transfer in MarineHydrothermal Systems (eds. P. E. Halbach, V. Tunnicliffe,and J. R. Hein). Dahlem University Press, pp. 271–286.
Mottl M. J. and Wheat C. G. (1994) Hydrothermal circulationthrough mid-ocean ridge flanks: fluxes of heat andmagnesium. Geochim. Cosmochim. Acta 58, 2225–2237.
Muehlenbachs K. (1986) Alteration of the oceanic crust and the18O history of seawater. In Stable Isotopes in HighTemperature Geological Processes, Reviews in Mineralogy(eds. J. W. Valley, H. P. Taylor, Jr., and J. R. O’Neil).Mining Society of America, Chelsea, MI, vol. 16, chap. 12,pp. 425–444.
Muehlenbachs K. and Clayton R. N. (1976) Oxygen isotopecomposition of the oceanic crust and its bearing on seawater.J. Geophys. Res. 81, 4365–4369.
Muir M. D. (1979) A sabkha model for deposition of part of theProterozoic McArthur Group of the Northern Territory, andimplications for mineralization. BMR J. Austral. Geol.Geophys. 4, 149–162.
Myers J. S. (2001) Protoliths of the 3.8–3.7 Ga Isua greenstonebelt, West Greenland. Precamb. Res. 105, 129–141.
Naraoka H., Ohtake M., Maruyama S., and Ohmoto H. (1996)Non-biogenic graphite in 3.8-Ga metamorphic rocks fromthe Isua district, Greenland. Chem. Geol. 133, 251–260.
Nelson D. R., Trendall A. F., and Altermann W. (1999)Chronological correlations between the Pilbara and Kaap-vaal cratons. Precamb. Res. 97, 165–189.
Nelson D. R., Robinson B. W., and Myers J. S. (2000) Complexgeological histories extending for $4.0 Ga deciphered fromxenocryst zircon microstructures. Earth Planet. Sci. 181,89–102.
Nutman A. P., Kinny P. D., Compston W., and Williams J. S.(1991) Shrimp U–Pb zircon geochronology of the NarryerGneiss Complex, Western Australia. Precamb. Res. 52,275–300.
Nutman A. P., McGregor V. R., Friend C. R. L., Bennett V. C.,and Kinny P. D. (1996) The Itsaq Gneiss complex ofsouthern West Greenland: the world’s most extensive recordof early crustal evolution (3,900–3,600 Ma). Precamb. Res.78, 1–39.
Nutman A. P., Bennett V. C., Friend C. R. L., and Rosing M. T.(1997) 3,710 and .3,790 Ma volcanic sequences in the Isua(Greenland) supracrustal belt: structural and Nd isotopeimplications. Chem. Geol. (Isotope Geosci.) 141, 271–287.
Nutman A. P., Friend C. R. L., and Bennett V. (2002) Evidencefor 3,650–3,600 Ma assembly of the northern end of theItsaq Gneiss Comples, Greenland: implication for earlyArchaean tectonics. Tectonics 21, 1–28.
Oehler D. Z. and Smith J. W. (1977) Isotopic composition ofreduced and oxidized carbon in early Archaean rocks fromIsua, Greenland. Precamb. Res. 5, 221–228.
Ohmoto H. (1996) Evidence in pre-2.2 Ga paleosols for theearly evolution of the atmospheric oxygen and terrestrialbiota. Geology 24, 1135–1138.
Ohmoto H. (1999) Redox state of the Archean atmosphere:evidence from detrital heavy minerals in ca. 3,250–2,750 Ma sandstones from the Pilbara Craton, Australia:Comment. Geology 27, 1151–1152.
Ohmoto H., Kakegawa T., and Lowe D. R. (1993) 3.4-billion-year-old biogenic pyrites from Barberton, South Africa:sulfur isotope evidence. Science 262, 555–557.
Ono S. (2002) Detrital uraninite and the early Earth’satmosphere: SIMS analyses of uraninite in the Elliot Lakedistrict and the dissolution kinetics of natural uraninite.Doctoral Dissertation, Pennsylvania State University, StateCollege, PA.
Orphan V. J., House C. H., Hinrichs K. U., McKeegan K. D.,and DeLong E. F. (2001) Methane-consuming archaearevealed by directly coupled isotopic and phylogeneticanalysis. Science 293, 484–487.
Palmer H. R., Pearson P. N., and Cobb S. J. (2000)Reconstructing past ocean pH-depth profiles. Science 282,1468–1471.
Pavlov A. A. and Kasting J. F. (2002) Mass-independentfractionation of sulfur isotopes in Archean sediments: strongevidence for an anoxic Archean atmosphere. Astrobiology 2,27–41.
Pavlov A. A., Kasting J. F., Brown L. L., Rages K. A., andFreedman R. (2000) Greenhouse warming by CH4 in theatmosphere of early Earth. J. Geophys. Res. 105,11981–11990.
Pavlov A. A., Hurtgen M., Kasting J. F., and Arthur M. A.(2003) A methane-rich Proterozoic atmosphere? Geology31, 87–90.
Paytan A., Kastner M., Campbell D., and Thiemens M. (1998)Sulfur isotopic composition of Cenozoic seawater sulfate.Science 282, 1459–1462.
Paytan A., Mearon S., Cobb K., and Kastner M. (2002) Originof marine barite deposits: Sr and S characterization. Geology30, 747–750.
Pearson P. N. and Palmer M. R. (1999) Middle Eoceneseawater pH and atmospheric carbon dioxide concentrations.Science 284, 1824–1826.
Pearson P. N. and Palmer M. R. (2000) Atmospheric carbondioxide concentrations over the past 60 million years. Nature406, 695–699.
Peck W. H., Valley J. W., Wilde S. A., and Geraham C. M.(2001) Oxygen isotope ratios and rare earth elements in 3.3to 4.4 Ga zircons: ion microprobe evidence for high d 18Ocontinental crust and oceans in the early Archean. Geochim.Cosmochim. Acta 65, 4215–4229.
Pegram W. J. and Turekian K. K. (1999) The Osmiumisotopic composition change of Cenozoic seawater asinferred from a deep-sea core corrected for meteoriticcontributions. Geochim. Cosmochim. Acta 63, 4053–4058.
Perry E. C., Jr. and Ahmad S. N. (1977) Carbon isotopecomposition of graphite and carbonate minerals from the3.8-AE metamorphosed sediments, Isukasia, Greenland.Earth Planet. Sci. Lett. 36, 281–284.
Petsch S. T. and Berner R. A. (1998) Coupling the geochemicalcycles of C, P, Fe, and S: the effect on atmospheric O2 andthe isotopic records of carbon and sulfur. Am. J. Sci. 298,246–262.
References 623
Peucker-Ehrenbrink B. and Ravizza G. (2000) The marineosmium isotope record. Terra Nova 12, 205–219.
Peucker-Ehrenbrink B., Ravizza G., and Hofmann A. W.(1995) The marine 187Os/186Os record of the past 80 millionyears. Earth Planet. Sci. Lett. 130, 155–167.
Phillips G. N., Law J. D. M., and Myers R. E. (2001) Is theredox state of the Archean atmosphere constrained? Soc.Econ. Geologists SEG Newslett. 47(1), 9–18.
Pinto J. P. and Holland H. D. (1988) Paleosols and the evolutionof the atmosphere: Part II. In Paleosols and WeatheringThrough Geologic Time, Geol. Soc. Am. Spec. Pap. 216(eds. J. Reinhardt and W. Sigleo), pp. 21–34.
Plummer L. N. and Busenberg E. (1982) The solubilities ofcalcite, aragonite and vaterite in CO2 –H2O solutionsbetween 08 and 908, and an evaluation of the aqueousmodel for the system CaCO3–CO2–H2O. Geochim. Cos-mochim. Acta 46, 1011–1040.
Porcelli D., Cassen P., Woolum D., and Wasserburg G. J.(1998) Acquisition and early losses of rare gases from thedeep Earth. In Origin of the Earth and Moon: LunarPlanetary Institute Contribution, Report 957, pp. 35–36.
Porter S. M. and Knoll A. H. (2000) Testate amoebae in theNeoproterozoic era: evidence from vase-shaped microfossilsin the Chuar Group, Grand Canyon. Paleobiology 26,360–385.
Porter S. M., Meisterfeld R., and Knoll, A. H. (2003) Vase-shaped microfossils from the Neoproterozoic Chuar Group,Grand Canyon: a classification guided by modern Testateamoebae. J. Paleontol. 77, 205–255.
Ramdohr P. (1958) Die Uran-und Goldlagerstatten Witwaters-rand-Blind River District-Dominion Reef-Serra de Jacobina:erzmikroskopische Untersuchungen und ein geologischerVergleich. Abh. Deutschen Akad. Wiss Berlin 3, 1–35.
Rasmussen B. and Buick R. (1999) Redox state of the Archeanatmosphere: evidence from detrital heavy minerals in ca. 3,250–2,750 Ma sandstones from the Pilbara Craton, Aus-tralia. Geology 27, 115–118.
Rasmussen B., Buick R., and Holland H. D. (1999) Redox stateof the Archean atmosphere: evidence from detrital heavyminerals in ca. 3,250–2,750 Ma sandstones from the PilbaraCraton, Australia: Reply. Geology 27, 1152.
Reeburgh W. S., Ward B. B., Whalen S. C., Sandbeck K. A.,Kilpatrick K. A., and Kerkhof L. J. (1991) Black Sea methanegeochemistry. Deep-Sea Res. 38(suppl. 2), 1189–1210.
Rosing M. T. (1999) 13C-depleted carbon microparticles in.3,700-Ma sea-floor sedimentary rocks from West Green-land. Science 283, 674–676.
Rosing M. T., Rose N. M., Bridgewater D., and Thomsen H. S.(1996) Earliest part of Earth’s stratigraphic record: areappraisal of the .3.7 Ga Isua (Greenland) supracrustalsequence. Geology 24, 43–46.
Rowley D. B. (2002) Rate of plate creation and destruction:180 Ma to present. Geol. Soc. Am. Bull. 114, 927–933.
Rubey W. W. (1951) Geologic history of seawater, an attemptto state the problem. Bull. Geol. Soc. Am. 62, 1111–1147.
Ryder G. (1990) Lunar samples, lunar accretion and the earlybombardment of the Moon. EOS, Trans., AGU 71(10), 313,322–323.
Rye R. and Holland H. D. (1998) Paleosols and the evolution ofthe atmosphere: a critical review. Am. J. Sci. 298, 621–672.
Rye R., Kuo P. H., and Holland H. D. (1995) Atmosphericcarbon dioxide concentration before 2.2 billion years ago.Nature 378, 603–605.
Sandberg P. A. (1983) An oscillating trend in Phanerozoic non-skeletal carbonate mineralogy. Nature 305, 19–22.
Sandberg P. A. (1985) Nonskeletal aragonite and pCO2 in thePhanerozoic and Proterozoic. In The Carbon Cycleand Atmospheric CO2, Natural Variations Archean toPresent, Geophysical Monograph 32 (eds. E. T. Sundquistand W. S. Broecker) American Geophysical Union,Washington, DC, pp. 585–594.
Sanyal A., Hemming N. G., Broecker W. S., Lea D. W., SperoH. J., and Hanson G. N. (1996) Oceanic pH control on the
boron isotopic composition of foraminifera: evidence fromculture experiments. Paleoceanography 11, 513–517.
Sarmiento J. L., Dunne J., Gnanadesikan A., Key R. M.,Matsumoto K., and Slater R. (2002) A new estimate of theCaCO3 to organic carbon export ratio. Global Biogeochem.Cycles 16(4), 54-1–54-12.
Sasaki S. and Nakazawa K. J. (1986) Metal–silicate fraction-ation in the growing Earth: energy source for the terrestrialMagma Ocean. J. Geophys. Res. 91, B9231–B9238.
Schidlowski M. (1966) Beitrage zur Kenntnis der radioactivenBestandteile der Witwatersrand-Konglomerate. I Uranpe-cherz in den Konglomeraten des Oranje-Freistaat-Gold-feldes. N. Jb. Miner Abh. 105, 183–202.
Schidlowski M., Appel P. W. U., Eichmann R., and Junge C. E.(1979) Carbon isotope geochemistry of the 3.7 £ 109 yr-oldIsua sediments, West Greenland: implications for theArchaean carbon and oxygen cycles. Geochim. Cosmochim.Acta 43, 189–199.
Schidlowski M., Hayes J. M., and Kaplan I. R. (1983) Isotopicinferences of ancient biochemistries: carbon, sulfur, hydro-gen, and nitrogen. In Earth’s Earliest Biosphere, Its Originand Evolution (ed. J. W. Schopf). Princeton University Press,Princeton, NJ, chap. 7, pp. 149–186.
Schopf J. W. (1983) Microfossils of the Early Archean ApexChert: new evidence for the antiquity of life. Science 260,640–646.
Schopf J. W. and Packer B. M. (1987) Early Archean (3.3-billion to 3.5-billion-year-old) microfossils from Warra-woona Group, Australia. Science 237, 70–73.
Schopf J. W., Kudryatsev A. B., Agresti D. G., Czaja A. D., andWidowiak T. J. (2002) Laser-Raman imagery of the oldestfossils on Earth. In Astrobiology Science Conference, NASAAmes Research Center, April 7–11, 2002.
Sellwood B. W. (1986) Shallow marine carbonate environ-ments. In Sedimentary Environments and Facies (ed. H. G.Reading). Blackwell, UK, chap. 10, pp. 283–342.
Shen Y., Buick R., and Canfield D. E. (2001) Isotopic evidencefor microbial sulphate reduction in the early Archaean era.Nature 410, 77–81.
Shen Y., Canfield D. E., and Knoll A. H. (2002) MiddleProterozoic ocean chemistry: evidence from the McArthurBasin, Northern Australia. Am. J. Sci. 302, 81–109.
Shields G. and Veizer J. (2002) Precambrian marine carbonateisotope database: version 1.1. Geochem. Geophys. Geosys. 3,doi: 10.1029/2001GC000266.
Shimizu H., Umemoto N., Masuda A., and Appel P. W. U.(1990) Sources of iron-formations in the Archean Isua andMalene supracrustals, West Greenland: evidence from La–Ce and Sm–Nd isotopic data and REE abundances.Geochim. Cosmochim. Acta 54, 1147–1154.
Sillen L. G. (1967) The ocean as a chemical system. Science156, 1189–1197.
Sleep N. H., Zahnle K. J., Kasting J. F., and Morowitz H. J.(1989) Annihilation of ecosystems by large asteroid impactson the early Earth. Nature 342, 139–142.
Southgate P. N., Bradshaw B. E., Domagala J., Jackson M. J.,Idnurm M., Krassay A. A., Page R. W., Sami T. T., ScottD. L., Lindsay J. F., McConachie B. A., and Tarlowski C.(2000) Chronostratigraphic basin framework for Paleopro-terozoic rocks (1,730–1,575 Ma) in northern Australia andimplications for base-metal mineralization. Austral. J. EarthSci. 47, 461–483.
Spencer R. J. and Hardie L. A. (1990) Control of seawatercomposition by mixing of river waters and mid-oceanridge hydrothermal brines. In Fluid–Mineral Interactions:A Tribute to H. P. Eugster. Special Publication 2(eds. R. J. Spencer and I.-M. Chou). Geochemical Society,San Antonio, TX, pp. 409–419.
Spivack A. J., You C.-F., and Smith H. J. (1993) For-aminiferal boron isotope ratios as a proxy for surfaceocean pH over the past 21 Myr. Nature 363, 149–151.
Stanley S. M. and Hardie L. A. (1998) Secular oscillationsin the carbonate mineralogy of reef-building and
The Geologic History of Seawater624
sediment-producing organisms driven by tectonically forcedshifts in seawater chemistry. Paleogeogr. Paleoclimatol.Paleoecol. 144, 3–19.
Stein C. L. and Krumhansl J. L. (1988) A model for theevolution of brines in salt from the lower Salado Formation,southeastern New Mexico. Geochim. Cosmochim. Acta 52,1037–1046.
Steuber T. and Veizer J. (2002) Phanerozoic record of platetectonic control of seawater chemistry and carbonatesedimentation. Geology 30, 1123–1126.
Strauss H. (1993) The sulfur isotopic record of Precambriansulfates: new data and a critical evaluation of the existingrecord. Precamb. Res. 63, 225–246.
Strauss H. (1999) Geological evolution from isotope proxysignals-sulfur. Chem. Geol. 161, 89–101.
Strauss H., DesMarais D. J., Hayes J. M., and Summons R. E.(1992) The carbon-isotopic record. In The ProterozoicBiosphere (eds. J. W. Schopf and C. Klein). CambridgeUniversity Press, Cambridge, chap. 3, pp. 117–127.
Stumm W. and Lee G. F. (1961) Oxygenation of ferrous iron.Ind. Eng. Chem. 53, 143–146.
Stumm W. and Morgan J. J. (1996) Aquatic Chemistry:Chemical Equilibria and Rates in Natural Waters. Wiley-Interscience, New York.
Suess E. (1980) Particulate organic carbon flux in the oceans—surface productivity and oxygen utilization. Nature 288,260–263.
Summons R. E., Jahnke L. L., Hope J. M., and Logan G. A.(1999) 2-methylhopanoids as biomarkers for cyanobacter-ial oxygenic photosynthesis. Nature 400, 554–557.
Thode H. G. and Monster J. (1965) Sulfur isotope geochemistryof petroleum, evaporites, and ancient seas. In Fluids inSubsurface Environments, Mem. 4. Am. Assoc. Petrol.Geol., Tulsa, OK, pp. 367–377.
Thode H. G., Monster J., and Sunford H. B. (1961)Sulfur isotope geochemistry. Geochim. Cosmochim. Acta25, 159–174.
Vail P. R., Mitchum R. W., and Thompson S. (1977) Seismicstratigraphy and global changes of sea level 4, Global cyclesof relative changes of sea level. AAPG Memoirs 26, 82–97.
Van Zuilen M. A., Lepland A., and Arrhenius G. (2002)Reassessing the evidence for the earliest traces of life.Nature 418, 627–630.
Veizer J., Holser W. T., and Wilgus C. K. (1980) Correlation of13C/12C and 34S/32S secular variations. Geochim. Cosmo-chim. Acta 44, 579–587.
Veizer J., Hoefs J., Lowe D. R., and Thurston P. C. (1989)Geochemistry of Precambrian carbonates: II. Archeangreenstone belts and Archean seawater. Geochim. Cosmo-chim. Acta 53, 859–871.
Veizer J., Ala D., Azmy K., Bruckschen P., Buhl D., BruhnF., Carden G. A. F., Diener A., Ebneth S., Godderis Y.,Jasper T., Korte C., Pawellek F., Podlaha O. G., andStrauss H. (1999) 87Sr/86Sr, d13C and d 18O evolution ofPhanerozoic seawater. Chem. Geol. 161, 59–88.
Walker J. (1966) Lectures on Geology. The University ofChicago Press, Chicago, IL.
Walker R. N., Muir M. D., Diver W. L., Williams N., andWilkins N. (1977) Evidence of major sulphate evaporite
deposits in the Proterozoic McArthur Group, NorthernTeritory, Australia. Nature 265, 526–529.
Wallmann K. (2001) Controls on the Cretaceous and Cenozoicevolution of seawater composition, atmospheric CO2 andclimate. Geochim. Cosmochim. Acta 65, 3005–3025.
Walter M. R., Veevers J. J., Calver C. R., Gorjan P., andHill A. C. (2000) Dating the 840–544 Neoproterozoicinterval by isotopes of strontium, carbon, and sulfur in
seawater and some interpretative models. Precamb. Res.100, 371–433.
Werne J. P., Sageman B. B., Lyons T. W., and Hollander D. J.(2002) An intergrated assessment of a “type euxinic”deposit: evidence for multiple controls on black shaledeposition in the Middle Devonian Oatka Creek formation.Am. J. Sci. 302, 110–143.
Wilde S. A., Valley J. W., Peck W. H., and Graham C. M.(2001) Evidence from detrital zircons for the existence of
continental crust and oceans on the Earth 4.4 Gyr ago.Nature 409, 175–178.
Wilkinson B. H. and Algeo T. J. (1989) Sedimentary carbonaterecord of calcium-magnesium cycling. Am. J. Sci. 289,1158–1194.
Winefield P. R. (2000) Development of late Paleoproterozoicaragonitic sea floor cements in the McArthur Group,Northern Australia. In Carbonate Sedimentation and
Diagenesis in the Evolving Precambrian World,SEPM Special Publication 67 (eds. J. P. Grotzinger andN. P. James). pp. 145–159.
Yang W. and Holland H. D. (2002) The redox sensitivetrace elements Mo, U, and Re in Precambrian carbon-aceous shales: indicators of the Great Oxidation Event(abstr.). Geol. Soc. Am. Ann. Mtng. 34, 382.
Yang W. and Holland H. D. (2003) The Hekpoort paleosol
profile in Strata 1 at Gaborone, Botswana: soil for-mation during the Great Oxidation Event. Am. J. Sci. 303,187–220.
Yin Q., Jacobsen S. B., Yamashita K., Blichert-Toft J., TeloukP., and Albarede F. (2002) A short timescale for terrestrialplanet formation from Hf–W chronometry of meteorites.Nature 418, 852–949.
Young G. M. (1969) Geochemistry of Early Proterozoic tillitesand argillites of the Gowganda Formation, Ontario, Canada.
Geochim. Cosmochim. Acta 33, 483–492.Young G. M. (1976) Iron-formation and glaciogenic rocks of
the Rapitan Group, Northwest Territories, Canada. Precamb.Res. 3, 137–158.
Zimmermann H. (2000) Tertiary seawater chemistry—implications from fluid inclusions in primary marine halite.Am. J. Sci. 300, 723–767.
q 2003, Elsevier Ltd. All rights reservedNo part of this publication may be reproduced, stored in a retrieval system ortransmitted in any form or by any means, electronic, mechanical, photocopying,recording or otherwise, without prior written permission of the Publisher.
Treatise on GeochemistryISBN (set): 0-08-043751-6
Volume 6; (ISBN: 0-08-044341-9); pp. 583–625
References 625