Embed Size (px)
Citation preview
Dams: Engineering in a Social & Environmental Context. Thomas Telford, London, 2012
Physical and CFD modelling of a labyrinth spillway for Penwhirn reservoir
J. ACKERS, Black & Veatch, Redhill F. BENNETT, Black & Veatch, Redhill G. KARUNARATNE, Scottish Water S. MacCARTHY, Hydrotec Consultants Ltd, Leeds C. THORNTON, Hydrotec Consultants Ltd, Leeds
SYNOPSIS A new labyrinth weir has been designed for Penwhirn Reservoir, where the dam is being raised to increase the storage capacity by a third. This paper provides an account of the weir design, using empirical equations, CFD (computational fluid dynamics) and physical modelling.
INTRODUCTION Penwhirn reservoir is situated about 11km northeast of Stranraer in Dumfries and Galloway, Scotland. It is an impounding reservoir that is retained by a clay-core embankment dam across the Penwhirn Burn – a tributary of Main Water of Luce – and was constructed in 1952–53 for the County of Wigtown. The dam is 240m long, with a maximum height of 16m.
The reservoir supplies Penwhirn water treatment works, located a short distance downstream of the dam and is one of the main sources of supply serving the Stranraer and Newton Stewart area. The reservoir extends over about 1.4km to the west of the dam and has a storage volume of 2400Ml. This is being increased by about a third by raising the impoundment level by 1.5m.
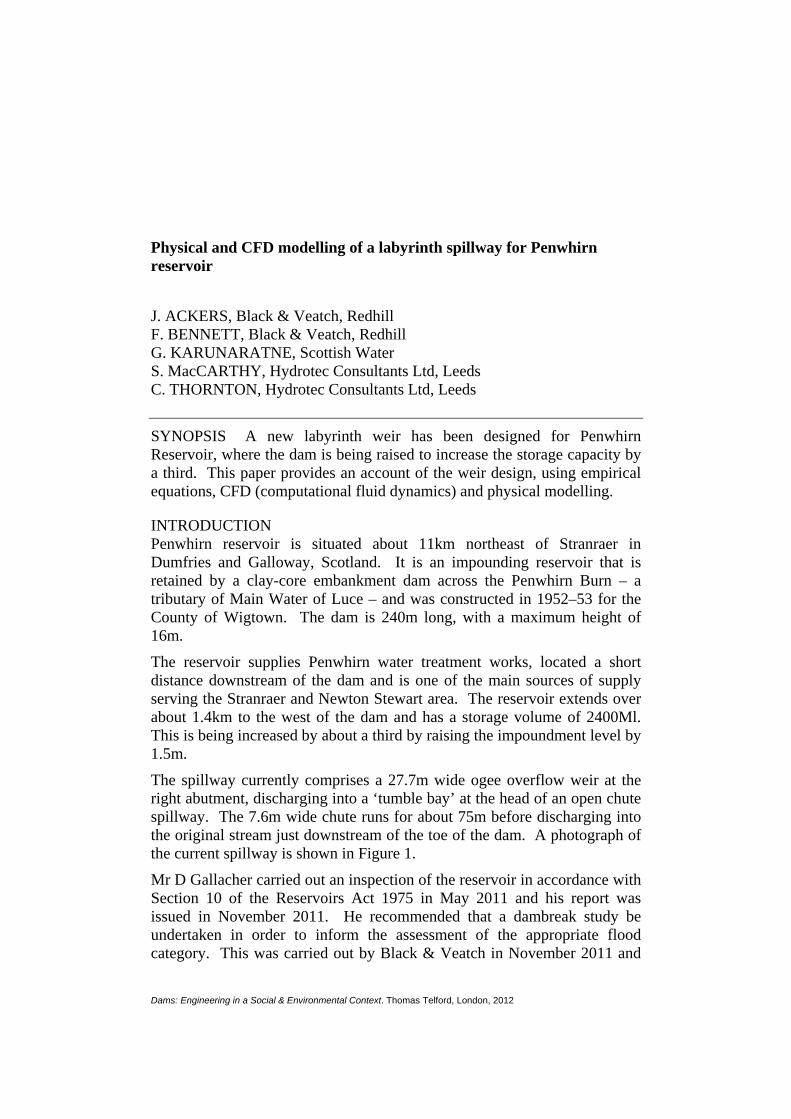
The spillway currently comprises a 27.7m wide ogee overflow weir at the right abutment, discharging into a ‘tumble bay’ at the head of an open chute spillway. The 7.6m wide chute runs for about 75m before discharging into the original stream just downstream of the toe of the dam. A photograph of the current spillway is shown in Figure 1.
Mr D Gallacher carried out an inspection of the reservoir in accordance with Section 10 of the Reservoirs Act 1975 in May 2011 and his report was issued in November 2011. He recommended that a dambreak study be undertaken in order to inform the assessment of the appropriate flood category. This was carried out by Black & Veatch in November 2011 and
DAMS: ENGINEERING IN A SOCIAL & ENVIRONMENTAL CONTEXT
supported the provisional assessment that for the design of the current works the reservoir should be placed into flood category A.
Figure 1. Current dam and spillway
In accordance with Table 1 of the ICE guide (1996), as the dam is not deemed to be resistant to prolonged overtopping, the appropriate design flood is therefore the PMF (probable maximum flood).
Based on this, a flood study was undertaken using the Flood estimation handbook (FEH) CD-ROM and the empirical rating curve for the labyrinth weir described below. A maximum reservoir inflow of 185m³/s was determined for a winter storm, with a maximum routed outflow of 166m³/s. For the purposes of the initial weir design a nominal maximum flow of 175m³/s was adopted with a target flood surcharge of 0.9m.
WEIR DESIGN In order to raise the impoundment level by 1.5m whilst limiting the required dam raising, a labyrinth weir was designed by Black & Veatch to replace the existing ogee overflow. The geometry for the labyrinth weir was established with the aid of a spreadsheet compiled to follow the calculation procedure given by Tullis et al (1995) and checked against the spreadsheet provided with the subsequent book on labyrinth weirs by Falvey (2003).

ACKERS et al
Maintaining the existing spillway width (27.74m), but allowing for additional abutment walls, the labyrinth was designed with a total width of 26.74m. The performance of a labyrinth weir depends strongly on the weir height (P) above the approach channel floor. A weir height of P = 3.0m was chosen so the new weir slab matched the existing approach level. With these two constraints, a three cycle labyrinth weir was found to be most efficient, with an angle of 8°. Figure 2 shows the plan geometry of the labyrinth weir
Figure 2. Layout of labyrinth weir (schematic)
The empirical rating curve for this weir is shown later and compared with the results of the CFD analyses. The weir crest was initially designed with a quarter round profile, although this was amended during the physical model testing to a semicircular profile.
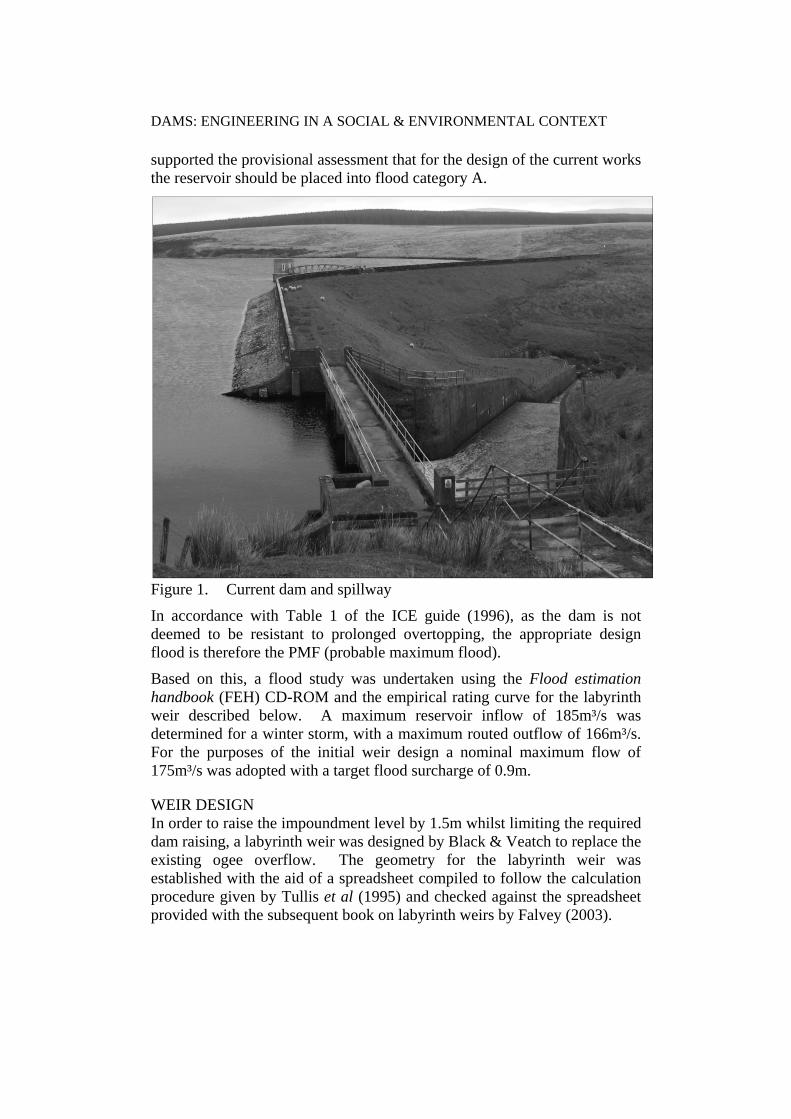
CFD MODELLING To aid the design process and give more confidence in the weir rating curve ahead of physical modelling, a CFD model was created. This included the overflow approach, labyrinth weir and spillway chute, as shown in Figure 3. The walls of the chute were artificially raised in the modelling to enable determination of how much the walls may need to be raised to contain the flow.
The modelling was undertaken using Ansys CFX version 13, with multiphase, inhomogeneous models of approximately five million elements utilising the SST turbulence model. The mesh was generally formed from tetrahedral elements, but with prismatic elements at the free surface upstream of the weir.
The inlet boundary was specified as a fluid dependent mass flow boundary with a zero gradient volume fraction. The end of the chute was set as a zero
DAMS: ENGINEERING IN A SOCIAL & ENVIRONMENTAL CONTEXT
pressure opening. The initial conditions were provided from a coarse mesh model which was itself initialised with a flat water surface at the predicted upstream water level.
Figure 3. CFD model layout and existing spillway
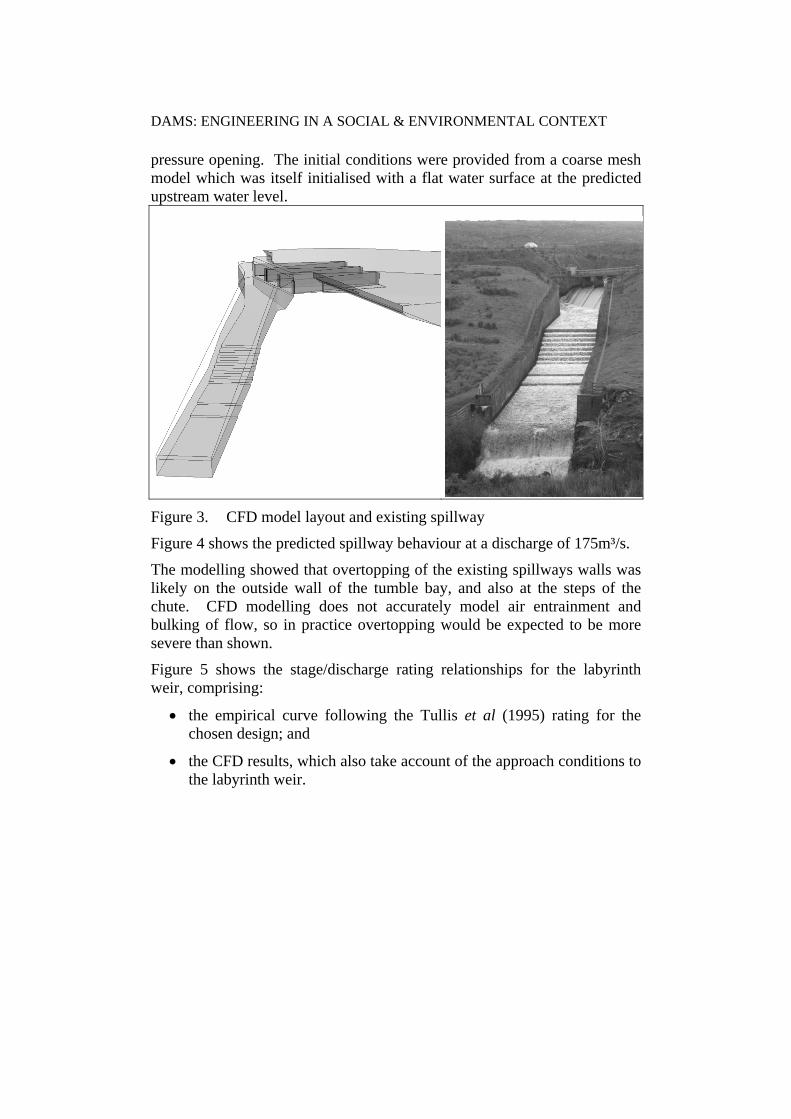
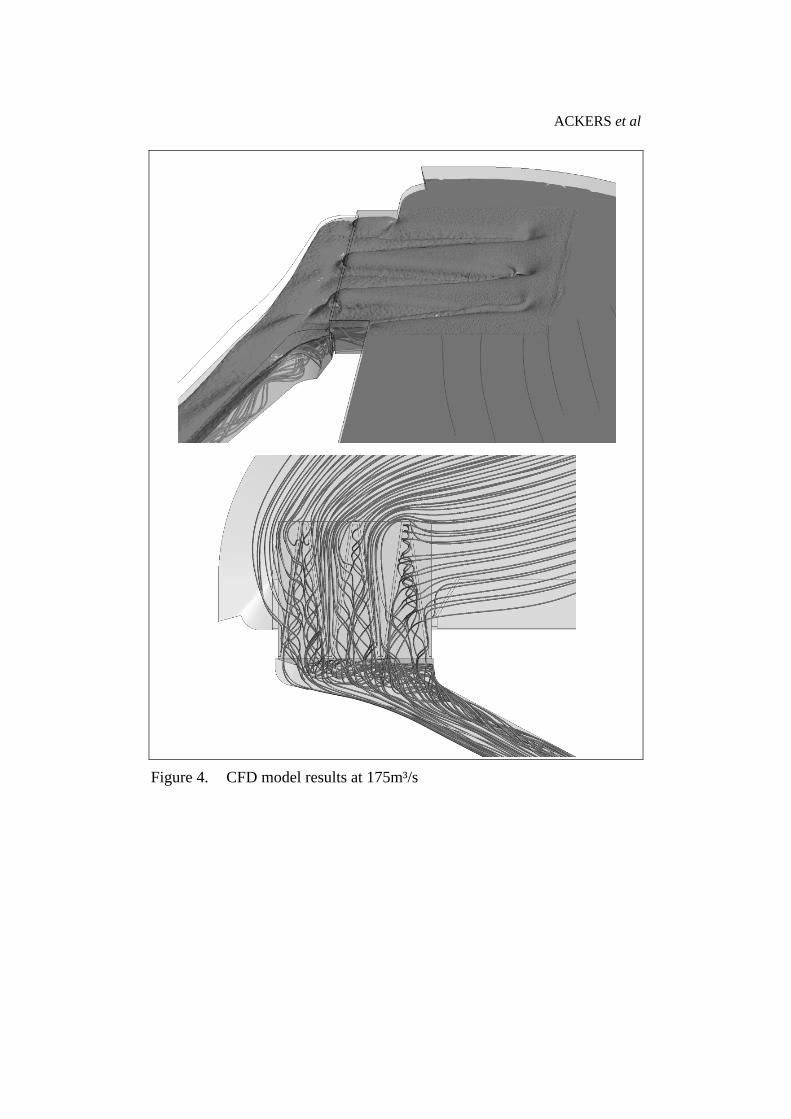
Figure 4 shows the predicted spillway behaviour at a discharge of 175m³/s.
The modelling showed that overtopping of the existing spillways walls was likely on the outside wall of the tumble bay, and also at the steps of the chute. CFD modelling does not accurately model air entrainment and bulking of flow, so in practice overtopping would be expected to be more severe than shown.
Figure 5 shows the stage/discharge rating relationships for the labyrinth weir, comprising:
• the empirical curve following the Tullis et al (1995) rating for the chosen design; and
• the CFD results, which also take account of the approach conditions to the labyrinth weir.
ACKERS et al
Figure 4. CFD model results at 175m³/s
DAMS: ENGINEERING IN A SOCIAL & ENVIRONMENTAL CONTEXT
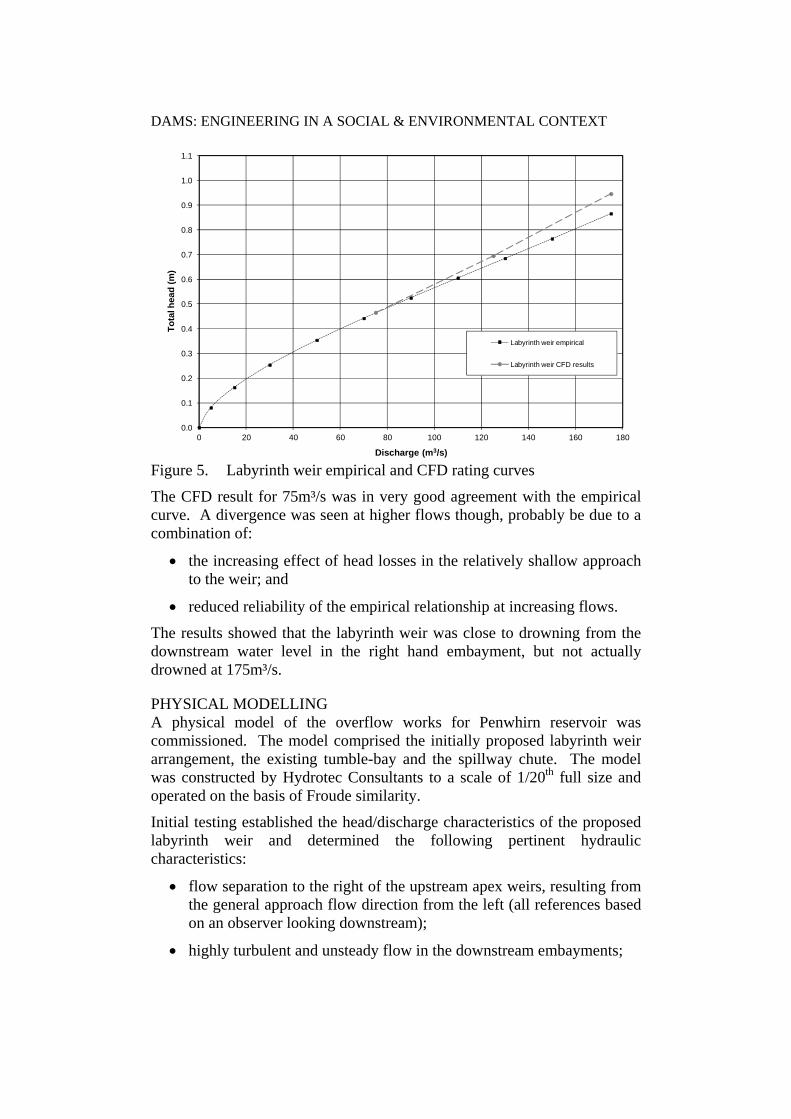
Figure 5. Labyrinth weir empirical and CFD rating curves
The CFD result for 75m³/s was in very good agreement with the empirical curve. A divergence was seen at higher flows though, probably be due to a combination of:
• the increasing effect of head losses in the relatively shallow approach to the weir; and
• reduced reliability of the empirical relationship at increasing flows.
The results showed that the labyrinth weir was close to drowning from the downstream water level in the right hand embayment, but not actually drowned at 175m³/s.
PHYSICAL MODELLING A physical model of the overflow works for Penwhirn reservoir was commissioned. The model comprised the initially proposed labyrinth weir arrangement, the existing tumble-bay and the spillway chute. The model was constructed by Hydrotec Consultants to a scale of 1/20th full size and operated on the basis of Froude similarity.
Initial testing established the head/discharge characteristics of the proposed labyrinth weir and determined the following pertinent hydraulic characteristics:
• flow separation to the right of the upstream apex weirs, resulting from the general approach flow direction from the left (all references based on an observer looking downstream);
• highly turbulent and unsteady flow in the downstream embayments;
0.0
0.1
0.2
0.3
0.4
0.5
0.6
0.7
0.8
0.9
1.0
1.1
0 20 40 60 80 100 120 140 160 180
Tota
l hea
d (m
)
Discharge (m3/s)
Labyrinth weir empirical
Labyrinth weir CFD results
ACKERS et al
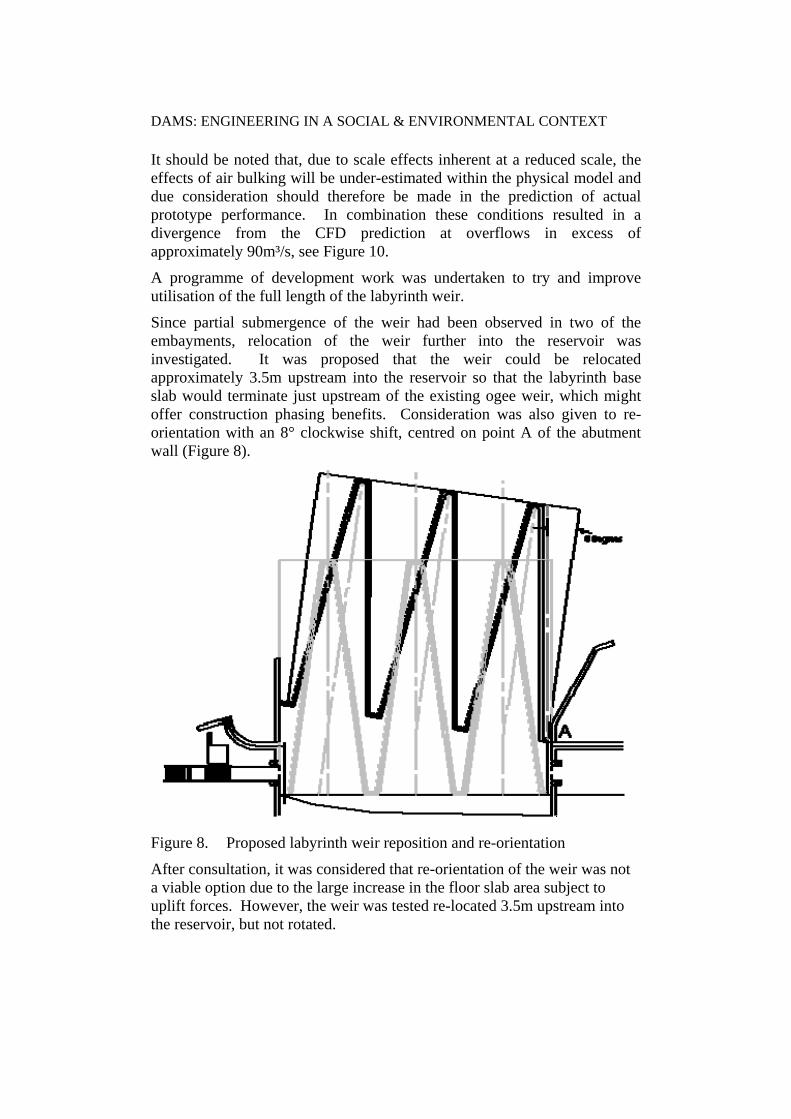
• the two outer downstream embayments approached their capacity, causing partial submergence of the upstream ends of the weirs near the top of the required flow range; and
• highly disturbed flow conditions in the tumble-bay and spillway chute, resulting in some overtopping at flows greater than approximately 75% of PMF.
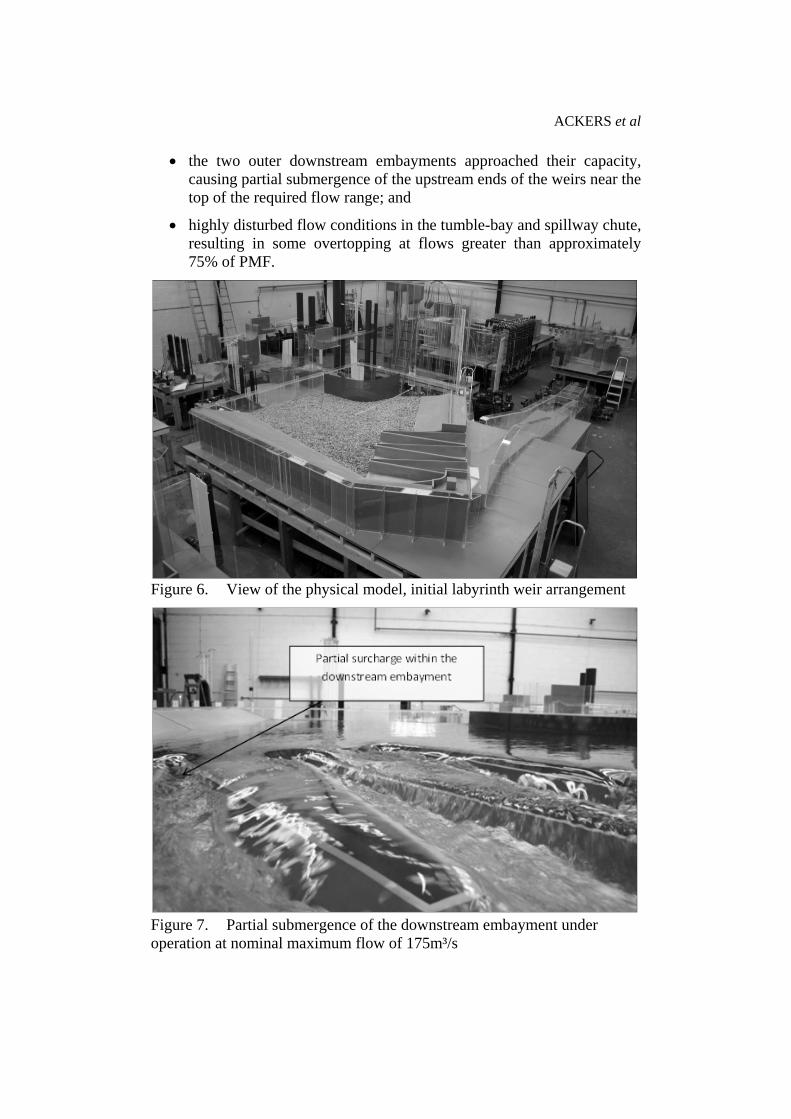
Figure 6. View of the physical model, initial labyrinth weir arrangement
Figure 7. Partial submergence of the downstream embayment under operation at nominal maximum flow of 175m³/s
DAMS: ENGINEERING IN A SOCIAL & ENVIRONMENTAL CONTEXT
It should be noted that, due to scale effects inherent at a reduced scale, the effects of air bulking will be under-estimated within the physical model and due consideration should therefore be made in the prediction of actual prototype performance. In combination these conditions resulted in a divergence from the CFD prediction at overflows in excess of approximately 90m³/s, see Figure 10.
A programme of development work was undertaken to try and improve utilisation of the full length of the labyrinth weir.
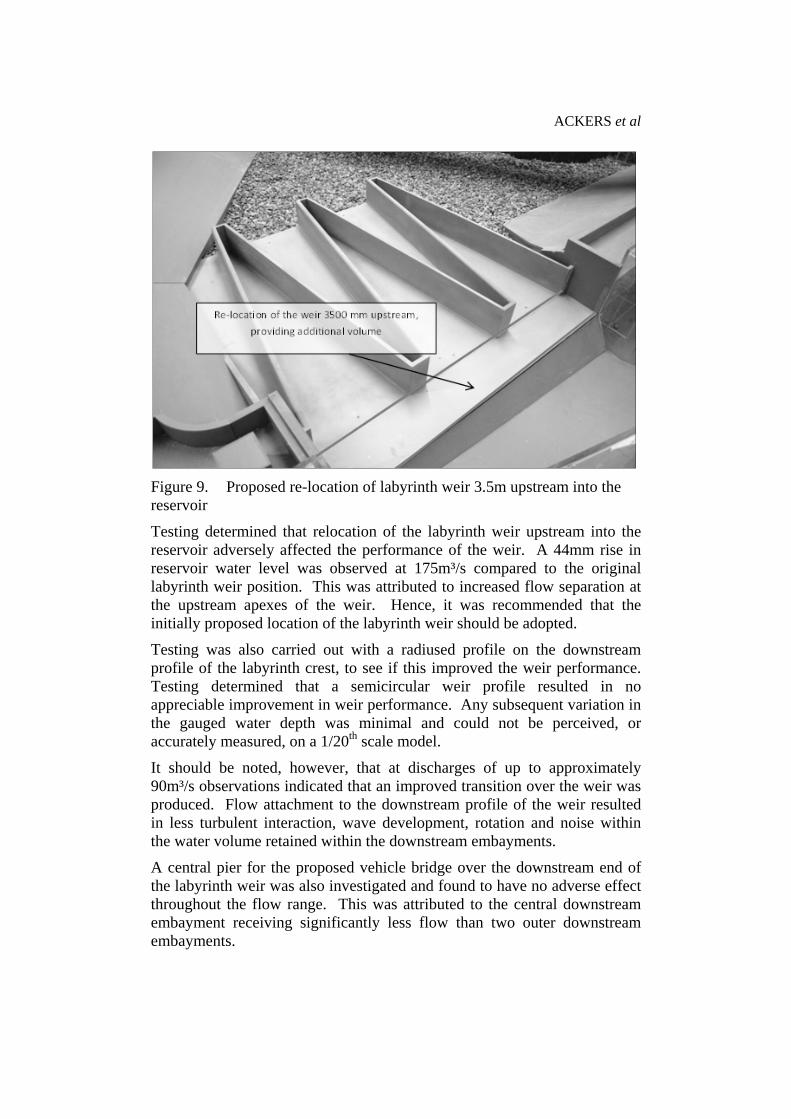
Since partial submergence of the weir had been observed in two of the embayments, relocation of the weir further into the reservoir was investigated. It was proposed that the weir could be relocated approximately 3.5m upstream into the reservoir so that the labyrinth base slab would terminate just upstream of the existing ogee weir, which might offer construction phasing benefits. Consideration was also given to re-orientation with an 8° clockwise shift, centred on point A of the abutment wall (Figure 8).
Figure 8. Proposed labyrinth weir reposition and re-orientation
After consultation, it was considered that re-orientation of the weir was not a viable option due to the large increase in the floor slab area subject to uplift forces. However, the weir was tested re-located 3.5m upstream into the reservoir, but not rotated.
ACKERS et al
Figure 9. Proposed re-location of labyrinth weir 3.5m upstream into the reservoir
Testing determined that relocation of the labyrinth weir upstream into the reservoir adversely affected the performance of the weir. A 44mm rise in reservoir water level was observed at 175m³/s compared to the original labyrinth weir position. This was attributed to increased flow separation at the upstream apexes of the weir. Hence, it was recommended that the initially proposed location of the labyrinth weir should be adopted.
Testing was also carried out with a radiused profile on the downstream profile of the labyrinth crest, to see if this improved the weir performance. Testing determined that a semicircular weir profile resulted in no appreciable improvement in weir performance. Any subsequent variation in the gauged water depth was minimal and could not be perceived, or accurately measured, on a 1/20th scale model.
It should be noted, however, that at discharges of up to approximately 90m³/s observations indicated that an improved transition over the weir was produced. Flow attachment to the downstream profile of the weir resulted in less turbulent interaction, wave development, rotation and noise within the water volume retained within the downstream embayments.
A central pier for the proposed vehicle bridge over the downstream end of the labyrinth weir was also investigated and found to have no adverse effect throughout the flow range. This was attributed to the central downstream embayment receiving significantly less flow than two outer downstream embayments.
DAMS: ENGINEERING IN A SOCIAL & ENVIRONMENTAL CONTEXT
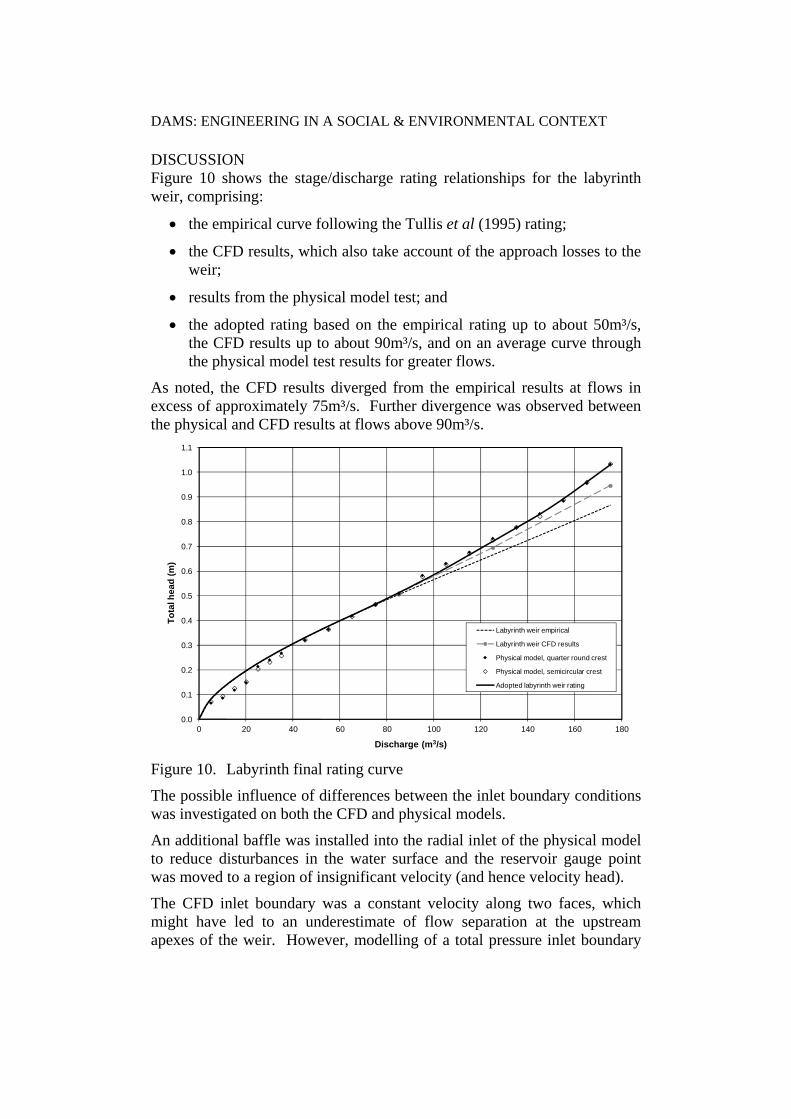
DISCUSSION Figure 10 shows the stage/discharge rating relationships for the labyrinth weir, comprising:
• the empirical curve following the Tullis et al (1995) rating;
• the CFD results, which also take account of the approach losses to the weir;
• results from the physical model test; and
• the adopted rating based on the empirical rating up to about 50m³/s, the CFD results up to about 90m³/s, and on an average curve through the physical model test results for greater flows.
As noted, the CFD results diverged from the empirical results at flows in excess of approximately 75m³/s. Further divergence was observed between the physical and CFD results at flows above 90m³/s.
Figure 10. Labyrinth final rating curve
The possible influence of differences between the inlet boundary conditions was investigated on both the CFD and physical models.
An additional baffle was installed into the radial inlet of the physical model to reduce disturbances in the water surface and the reservoir gauge point was moved to a region of insignificant velocity (and hence velocity head).
The CFD inlet boundary was a constant velocity along two faces, which might have led to an underestimate of flow separation at the upstream apexes of the weir. However, modelling of a total pressure inlet boundary
0.0
0.1
0.2
0.3
0.4
0.5
0.6
0.7
0.8
0.9
1.0
1.1
0 20 40 60 80 100 120 140 160 180
Tota
l hea
d (m
)
Discharge (m3/s)
Labyrinth weir empirical
Labyrinth weir CFD results
Physical model, quarter round crest
Physical model, semicircular crest
Adopted labyrinth weir rating
ACKERS et al
resulted in almost identical results, as did a model with a finer mesh at the weir crest and upstream apexes.
Thus, although we cannot be certain for the reasons behind this, the differences between the results of the physical and CFD analyses are probably associated with:
• the non-steady (fluctuating) nature of the flows in the physical model (and prototype), compared with the steady conditions modelled with CFD; and
• the effects of air-bulking (which is not represented in CFD) on the flow depths in the downstream embayments, causing earlier submergence of the upstream ends of the weirs.
The physical model exhibited a more pronounced variation in the weir utilisation than the CFD at flows in excess of 90m³/s. This was attributed to the unsteady effects of flow rotation, reflection and separation present due to intermittent eddy formation at the upstream apexes.
CONCLUSIONS This paper describes the design of a labyrinth weir at Penwhirn reservoir to replace the existing ogee weir. The impoundment level is being raised by 1.5m and the three cycle labyrinth enabled the dam to be raised by only half a metre – about a metre less than for a replacement ogee weir.
The weir layout was initially designed using a spreadsheet based on Tullis et al (1995). CFD modelling was undertaken to give greater confidence in the rating curve ahead of physical modelling. The CFD results diverged from the empirical results at high flows, probably due to the relatively shallow weir approach.
Further divergence was observed between the physical model and CFD results at high flows, believed to be associated with the non-steady nature of the flows in the physical model compared with the steady conditions modelled with CFD and the effects of air-bulking on the flow depths in the downstream embayments, causing earlier submergence of the weir.
REFERENCES CEH (2009) FEH CD-ROM, Version 3, Centre for Ecology & Hydrology
(Wallingford) Falvey, H.T. (2003) Hydraulic design of labyrinth weirs. ASCE Press,
Reston. Institution of Civil Engineers (1996) Floods and reservoir safety, 3rd edition.
Thomas Telford (London) Tullis, J.P., Amanian, N. and Waldron, D. (1995) Design of labyrinth
spillways. ASCE Journal of Hydraulic Engineering, vol121, N° 3.