Embed Size (px)
Citation preview

6.1BSTANDARD DEVIATION OF DISCRETE RANDOM
VARIABLES
CONTINUOUS RANDOM VARIABLES
AP Statistics

Standard Deviation of a Discrete Random VariableSince we use the mean as the measure of center for a discrete random variable, we use the standard deviation as our measure of spread. The definition of the variance of a random variable is similar to the definition of the variance for a set of quantitative data.Suppose that X is a discrete random variable whose probability distribution is
Value: x1 x2 x3 …Probability: p1 p2 p3 …
and that µX is the mean of X. The variance of X is
To get the standard deviation of a random variable, take the square root of the variance.

Standard Deviation of a Discrete Random Variable
Let X = Apgar score of a randomly selected newborn
Compute and interpret the standard deviation of the random variable X.The formula for the variance of X is
The standard deviation of X is
A randomly selected baby’s Apgar score will typically differ from
the mean (8.128) by about 1.4 units.
(2.066) 1.437x
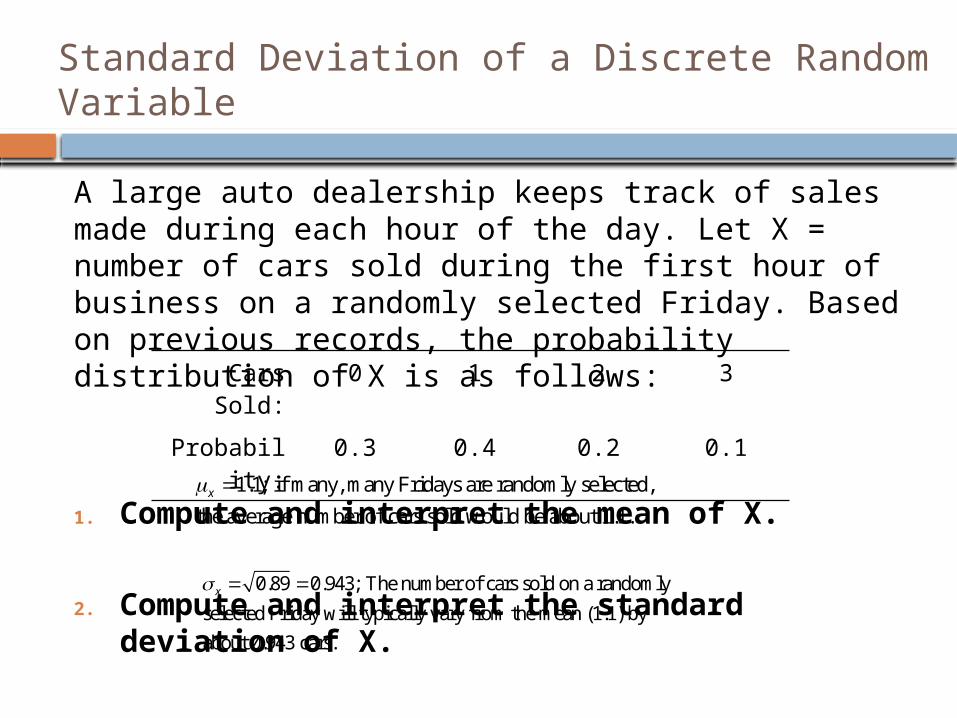
A large auto dealership keeps track of sales made during each hour of the day. Let X = number of cars sold during the first hour of business on a randomly selected Friday. Based on previous records, the probability distribution of X is as follows:
1. Compute and interpret the mean of X.
2. Compute and interpret the standard deviation of X.
Standard Deviation of a Discrete Random Variable
Cars Sold: 0 1 2 3
Probability:
0.3 0.4 0.2 0.1
1.1; if many, many Fridays are randomly selected,
the average number of cars sold would be about 1.1.x
0.89 0.943; The number of cars sold on a randomly
selected Friday will typically vary from the mean (1.1) by
about 0.943 cars.
x

Continuous Random Variables
Discrete random variables commonly arise from situations that involve counting something. Situations that involve measuring something often result in a continuous random variable.A continuous random variable X takes on all values in an interval of numbers. The probability distribution of X is described by a density curve. The probability of any event is the area under the density curve and above the values of X that make up the event.
The probability model of a discrete random variable X assigns a probability between 0 and 1 to each possible value of X.
A continuous random variable Y has infinitely many possible values. All continuous probability models assign probability 0 to every individual outcome. Only intervals of values have positive probability.

Example: Normal probability distributions
The heights of young women closely follow the Normal distribution with mean µ = 64 inches and standard deviation σ = 2.7 inches.
Now choose one young woman at random. Call her height Y.If we repeat the random choice very many times, the distribution of valuesof Y is the same Normal distribution that describes the heights of all youngwomen.
Problem: What’s the probability that the chosen woman is between 68 and 70 inches tall?

Example: Normal probability distributions
Step 1: State the distribution and the values of interest.
The height Y of a randomly chosen young woman has the N(64, 2.7) distribution. We want to find P(68 ≤ Y ≤ 70).
Step 2: Perform calculations—show your work!Find the z-scores for the two boundary values

Practice Problems
pg. 360-362, #14, 15, 17, 18, 21, 23, 25