Embed Size (px)
Citation preview
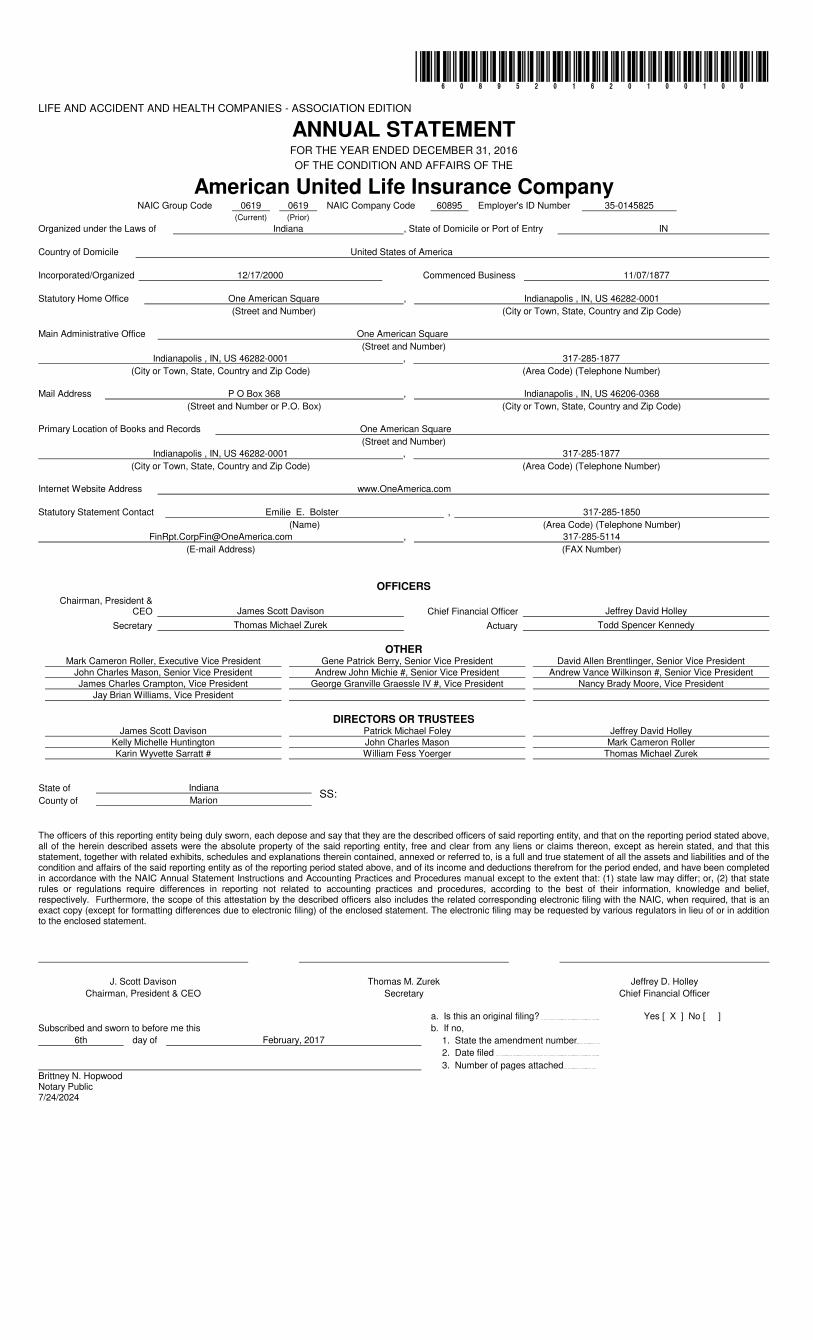
*60895201620100100*LIFE AND ACCIDENT AND HEALTH COMPANIES - ASSOCIATION EDITION
ANNUAL STATEMENTFOR THE YEAR ENDED DECEMBER 31, 2016
OF THE CONDITION AND AFFAIRS OF THE
American United Life Insurance Company NAIC Group Code 0619 0619 NAIC Company Code 60895 Employer's ID Number 35-0145825
(Current) (Prior)
Organized under the Laws of Indiana , State of Domicile or Port of Entry IN
Country of Domicile United States of America
Incorporated/Organized 12/17/2000 Commenced Business 11/07/1877
Statutory Home Office One American Square , Indianapolis , IN, US 46282-0001
(Street and Number) (City or Town, State, Country and Zip Code)
Main Administrative Office One American Square
(Street and Number)
Indianapolis , IN, US 46282-0001 , 317-285-1877
(City or Town, State, Country and Zip Code) (Area Code) (Telephone Number)
Mail Address P O Box 368 , Indianapolis , IN, US 46206-0368
(Street and Number or P.O. Box) (City or Town, State, Country and Zip Code)
Primary Location of Books and Records One American Square
(Street and Number)
Indianapolis , IN, US 46282-0001 , 317-285-1877
(City or Town, State, Country and Zip Code) (Area Code) (Telephone Number)
Internet Website Address www.OneAmerica.com
Statutory Statement Contact Emilie E. Bolster , 317-285-1850
(Name) (Area Code) (Telephone Number)
[email protected] , 317-285-5114
(E-mail Address) (FAX Number)
OFFICERS
Chairman, President & CEO James Scott Davison Chief Financial Officer Jeffrey David Holley
Secretary Thomas Michael Zurek Actuary Todd Spencer Kennedy
OTHERMark Cameron Roller, Executive Vice President Gene Patrick Berry, Senior Vice President David Allen Brentlinger, Senior Vice President
John Charles Mason, Senior Vice President Andrew John Michie #, Senior Vice President Andrew Vance Wilkinson #, Senior Vice President James Charles Crampton, Vice President George Granville Graessle IV #, Vice President Nancy Brady Moore, Vice President
Jay Brian Williams, Vice President
DIRECTORS OR TRUSTEESJames Scott Davison Patrick Michael Foley Jeffrey David Holley
Kelly Michelle Huntington John Charles Mason Mark Cameron Roller Karin Wyvette Sarratt # William Fess Yoerger Thomas Michael Zurek
SS:State of Indiana
County of Marion
The officers of this reporting entity being duly sworn, each depose and say that they are the described officers of said reporting entity, and that on the reporting period stated above, all of the herein described assets were the absolute property of the said reporting entity, free and clear from any liens or claims thereon, except as herein stated, and that this statement, together with related exhibits, schedules and explanations therein contained, annexed or referred to, is a full and true statement of all the assets and liabilities and of the condition and affairs of the said reporting entity as of the reporting period stated above, and of its income and deductions therefrom for the period ended, and have been completed in accordance with the NAIC Annual Statement Instructions and Accounting Practices and Procedures manual except to the extent that: (1) state law may differ; or, (2) that state rules or regulations require differences in reporting not related to accounting practices and procedures, according to the best of their information, knowledge and belief, respectively. Furthermore, the scope of this attestation by the described officers also includes the related corresponding electronic filing with the NAIC, when required, that is an exact copy (except for formatting differences due to electronic filing) of the enclosed statement. The electronic filing may be requested by various regulators in lieu of or in addition to the enclosed statement.
J. Scott Davison Thomas M. Zurek Jeffrey D. Holley
Chairman, President & CEO Secretary Chief Financial Officer
a. Is this an original filing? Yes [ X ] No [ ]
Subscribed and sworn to before me this b. If no,
6th day of February, 2017 1. State the amendment number
2. Date filed
3. Number of pages attached Brittney N. Hopwood Notary Public 7/24/2024
ANNUAL STATEMENT FOR THE YEAR 2016 OF THE AMERICAN UNITED LIFE INSURANCE COMPANY
ASSETSCurrent Year Prior Year
1
Assets
2
Nonadmitted Assets
3Net Admitted Assets
(Cols. 1 - 2)
4Net Admitted
Assets
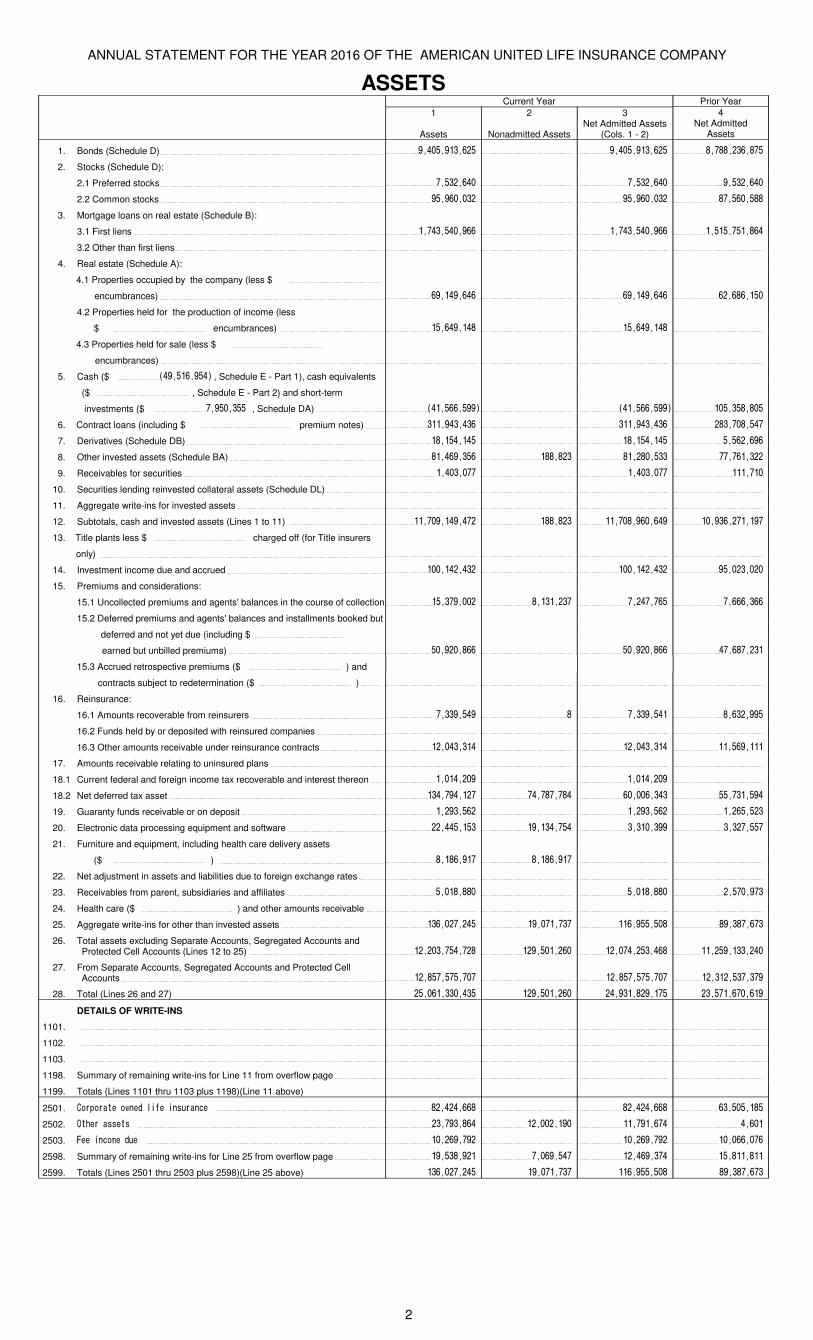
1. Bonds (Schedule D) 9,405,913,625 9,405,913,625 8,788,236,875
2. Stocks (Schedule D):
2.1 Preferred stocks 7,532,640 7,532,640 9,532,640
2.2 Common stocks 95,960,032 95,960,032 87,560,588
3. Mortgage loans on real estate (Schedule B):
3.1 First liens 1,743,540,966 1,743,540,966 1,515,751,864
3.2 Other than first liens
4. Real estate (Schedule A):
4.1 Properties occupied by the company (less $
encumbrances) 69,149,646 69,149,646 62,686,150
4.2 Properties held for the production of income (less
$ encumbrances) 15,649,148 15,649,148
4.3 Properties held for sale (less $
encumbrances)
5. Cash ($ (49,516,954) , Schedule E - Part 1), cash equivalents
($ , Schedule E - Part 2) and short-term
investments ($ 7,950,355 , Schedule DA) (41,566,599) (41,566,599) 105,358,805
6. Contract loans (including $ premium notes) 311,943,436 311,943,436 283,708,547
7. Derivatives (Schedule DB) 18,154,145 18,154,145 5,562,696
8. Other invested assets (Schedule BA) 81,469,356 188,823 81,280,533 77,761,322
9. Receivables for securities 1,403,077 1,403,077 111,710
10. Securities lending reinvested collateral assets (Schedule DL)
11. Aggregate write-ins for invested assets
12. Subtotals, cash and invested assets (Lines 1 to 11) 11,709,149,472 188,823 11,708,960,649 10,936,271,197
13. Title plants less $ charged off (for Title insurers
only)
14. Investment income due and accrued 100,142,432 100,142,432 95,023,020
15. Premiums and considerations:
15.1 Uncollected premiums and agents' balances in the course of collection 15,379,002 8,131,237 7,247,765 7,666,366
15.2 Deferred premiums and agents' balances and installments booked but
deferred and not yet due (including $
earned but unbilled premiums) 50,920,866 50,920,866 47,687,231
15.3 Accrued retrospective premiums ($ ) and
contracts subject to redetermination ($ )
16. Reinsurance:
16.1 Amounts recoverable from reinsurers 7,339,549 8 7,339,541 8,632,995
16.2 Funds held by or deposited with reinsured companies
16.3 Other amounts receivable under reinsurance contracts 12,043,314 12,043,314 11,569,111
17. Amounts receivable relating to uninsured plans
18.1 Current federal and foreign income tax recoverable and interest thereon 1,014,209 1,014,209
18.2 Net deferred tax asset 134,794,127 74,787,784 60,006,343 55,731,594
19. Guaranty funds receivable or on deposit 1,293,562 1,293,562 1,265,523
20. Electronic data processing equipment and software 22,445,153 19,134,754 3,310,399 3,327,557
21. Furniture and equipment, including health care delivery assets
($ ) 8,186,917 8,186,917
22. Net adjustment in assets and liabilities due to foreign exchange rates
23. Receivables from parent, subsidiaries and affiliates 5,018,880 5,018,880 2,570,973
24. Health care ($ ) and other amounts receivable
25. Aggregate write-ins for other than invested assets 136,027,245 19,071,737 116,955,508 89,387,673
26. Total assets excluding Separate Accounts, Segregated Accounts and Protected Cell Accounts (Lines 12 to 25) 12,203,754,728 129,501,260 12,074,253,468 11,259,133,240
27. From Separate Accounts, Segregated Accounts and Protected Cell Accounts 12,857,575,707 12,857,575,707 12,312,537,379
28. Total (Lines 26 and 27) 25,061,330,435 129,501,260 24,931,829,175 23,571,670,619
DETAILS OF WRITE-INS
1101.
1102.
1103.
1198. Summary of remaining write-ins for Line 11 from overflow page
1199. Totals (Lines 1101 thru 1103 plus 1198)(Line 11 above)
2501. Corporate owned life insurance 82,424,668 82,424,668 63,505,185
2502. Other assets 23,793,864 12,002,190 11,791,674 4,601
2503. Fee income due 10,269,792 10,269,792 10,066,076
2598. Summary of remaining write-ins for Line 25 from overflow page 19,538,921 7,069,547 12,469,374 15,811,811
2599. Totals (Lines 2501 thru 2503 plus 2598)(Line 25 above) 136,027,245 19,071,737 116,955,508 89,387,673
2

ANNUAL STATEMENT FOR THE YEAR 2016 OF THE AMERICAN UNITED LIFE INSURANCE COMPANY
LIABILITIES, SURPLUS AND OTHER FUNDS1
Current Year2
Prior Year1. Aggregate reserve for life contracts $ 9,347,282,765 (Exh. 5, Line 9999999) less $
included in Line 6.3 (including $ 59,692 Modco Reserve) 9,347,282,765 8,618,457,804 2. Aggregate reserve for accident and health contracts (including $ Modco Reserve) 150,239,239 158,064,454 3. Liability for deposit-type contracts (Exhibit 7, Line 14, Col. 1) (including $ Modco Reserve) 1,230,153,939 1,197,285,831 4. Contract claims:
4.1 Life (Exhibit 8, Part 1, Line 4.4, Col. 1 less sum of Cols. 9, 10 and 11) 24,609,672 20,883,213 4.2 Accident and health (Exhibit 8, Part 1, Line 4.4, sum of Cols. 9, 10 and 11) 29,232,089 30,719,964
5. Policyholders’ dividends $ 237,441 and coupons $ due and unpaid (Exhibit 4,
Line 10) 237,441 126,512 6. Provision for policyholders’ dividends and coupons payable in following calendar year - estimated amounts:
6.1 Dividends apportioned for payment (including $ Modco) 29,808,998 31,037,487 6.2 Dividends not yet apportioned (including $ Modco) 1,162,671 (474,723)6.3 Coupons and similar benefits (including $ Modco)
7. Amount provisionally held for deferred dividend policies not included in Line 6 8. Premiums and annuity considerations for life and accident and health contracts received in advance less
$ discount; including $ accident and health premiums (Exhibit 1,
Part 1, Col. 1, sum of lines 4 and 14) 578,086 602,453 9. Contract liabilities not included elsewhere:
9.1 Surrender values on canceled contracts 835,233 737,849 9.2 Provision for experience rating refunds, including the liability of $ accident and health
experience rating refunds of which $ is for medical loss ratio rebate per the Public Health
Service Act 9.3 Other amounts payable on reinsurance, including $ (153) assumed and $ 2,339,273
ceded 2,339,120 3,207,192 9.4 Interest maintenance reserve (IMR, Line 6) 13,356,338 15,898,205
10. Commissions to agents due or accrued-life and annuity contracts $ 5,966,958 accident and health
$ 2,545,973 and deposit-type contract funds $ 8,512,931 5,828,952 11. Commissions and expense allowances payable on reinsurance assumed 10,942,754 10,605,727 12. General expenses due or accrued (Exhibit 2, Line 12, Col. 6) 13. Transfers to Separate Accounts due or accrued (net) (including $ (8,196,136) accrued for expense
allowances recognized in reserves, net of reinsured allowances) (8,203,147) (10,063,601)14. Taxes, licenses and fees due or accrued, excluding federal income taxes (Exhibit 3, Line 9, Col. 5) 6,079,572 7,894,190 15.1 Current federal and foreign income taxes, including $ on realized capital gains (losses) 15,382,956 15.2 Net deferred tax liability 16. Unearned investment income 6,984,718 6,399,310 17. Amounts withheld or retained by company as agent or trustee 3,776,755 3,519,215 18. Amounts held for agents' account, including $ 13,119,614 agents' credit balances 13,119,614 14,229,336 19. Remittances and items not allocated 39,170,366 31,125,082 20. Net adjustment in assets and liabilities due to foreign exchange rates 21. Liability for benefits for employees and agents if not included above 22. Borrowed money $ and interest thereon $ 23. Dividends to stockholders declared and unpaid 24. Miscellaneous liabilities:
24.01 Asset valuation reserve (AVR, Line 16, Col. 7) 86,390,593 76,906,252 24.02 Reinsurance in unauthorized and certified ($ ) companies 121,341 328,212 24.03 Funds held under reinsurance treaties with unauthorized and certified ($ ) reinsurers 43,970 722,826 24.04 Payable to parent, subsidiaries and affiliates 4,135,862 3,134,310 24.05 Drafts outstanding 24.06 Liability for amounts held under uninsured plans 24.07 Funds held under coinsurance 24.08 Derivatives 10,976,265 2,724,338 24.09 Payable for securities 608,890 4,239,050 24.10 Payable for securities lending 24.11 Capital notes $ and interest thereon $
25. Aggregate write-ins for liabilities 101,304,086 89,236,581 26. Total liabilities excluding Separate Accounts business (Lines 1 to 25) 11,113,800,161 10,338,758,976 27. From Separate Accounts Statement 12,857,575,707 12,312,537,379 28. Total liabilities (Lines 26 and 27) 23,971,375,868 22,651,296,355 29. Common capital stock 5,000,000 5,000,000 30. Preferred capital stock 31. Aggregate write-ins for other than special surplus funds 32. Surplus notes 75,000,000 75,000,000 33. Gross paid in and contributed surplus (Page 3, Line 33, Col. 2 plus Page 4, Line 51.1, Col. 1) 550,000 550,000 34. Aggregate write-ins for special surplus funds 35. Unassigned funds (surplus) 879,903,307 839,824,264 36. Less treasury stock, at cost:
36.1 shares common (value included in Line 29 $ ) 36.2 shares preferred (value included in Line 30 $ )
37. Surplus (Total Lines 31+32+33+34+35-36) (including $ in Separate Accounts Statement) 955,453,307 915,374,264 38. Totals of Lines 29, 30 and 37 (Page 4, Line 55) 960,453,307 920,374,264 39. Totals of Lines 28 and 38 (Page 2, Line 28, Col. 3) 24,931,829,175 23,571,670,619
DETAILS OF WRITE-INS
2501. Accounts payable 62,565,761 54,716,084 2502. Accumulated post retirement benefits liability 14,842,379 15,624,183 2503. Pension liability 11,321,977 10,091,674 2598. Summary of remaining write-ins for Line 25 from overflow page 12,573,969 8,804,640 2599. Totals (Lines 2501 thru 2503 plus 2598)(Line 25 above) 101,304,086 89,236,581 3101.
3102.
3103.
3198. Summary of remaining write-ins for Line 31 from overflow page 3199. Totals (Lines 3101 thru 3103 plus 3198)(Line 31 above) 3401.
3402.
3403.
3498. Summary of remaining write-ins for Line 34 from overflow page 3499. Totals (Lines 3401 thru 3403 plus 3498)(Line 34 above)
3
ANNUAL STATEMENT FOR THE YEAR 2016 OF THE AMERICAN UNITED LIFE INSURANCE COMPANY
SUMMARY OF OPERATIONS1
Current Year2
Prior Year
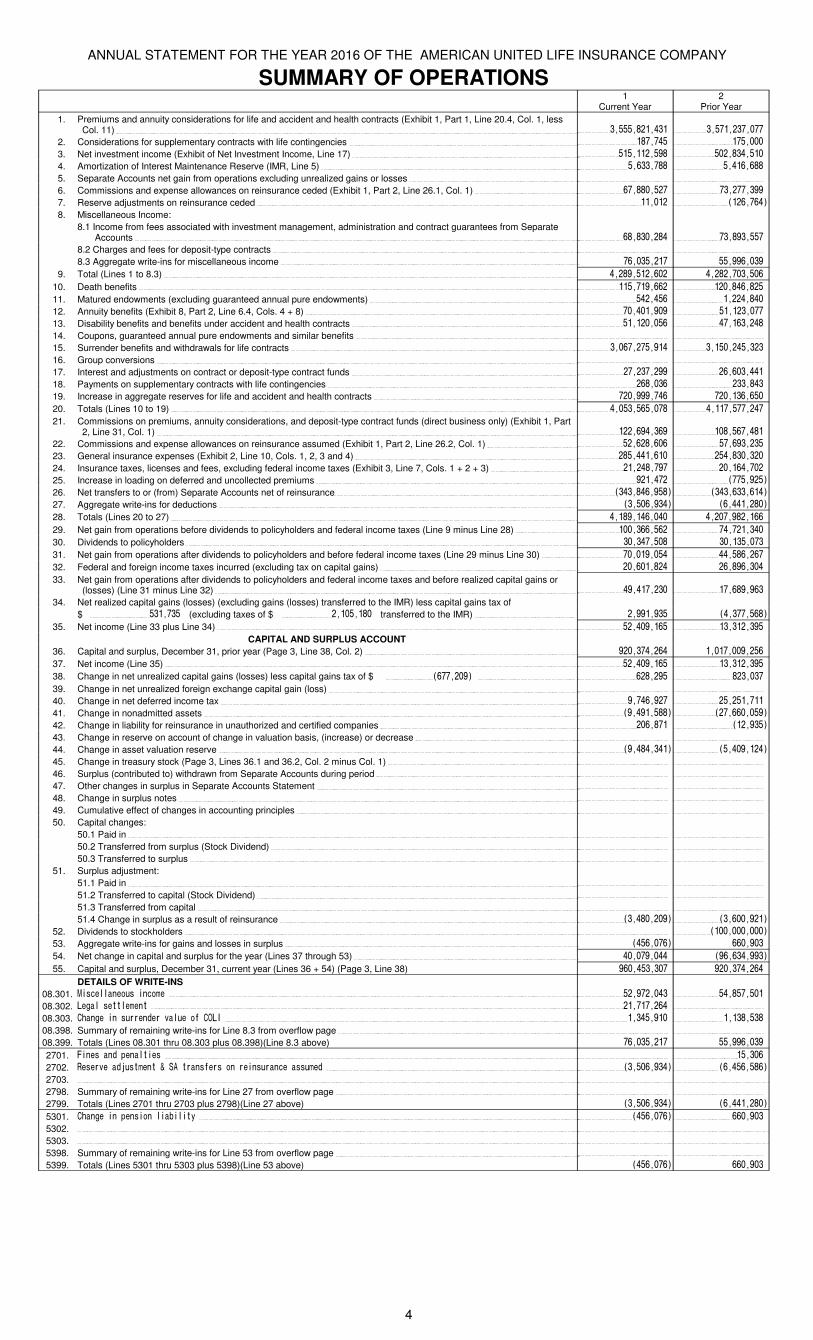
1. Premiums and annuity considerations for life and accident and health contracts (Exhibit 1, Part 1, Line 20.4, Col. 1, less Col. 11) 3,555,821,431 3,571,237,077
2. Considerations for supplementary contracts with life contingencies 187,745 175,000
3. Net investment income (Exhibit of Net Investment Income, Line 17) 515,112,598 502,834,510
4. Amortization of Interest Maintenance Reserve (IMR, Line 5) 5,633,788 5,416,688
5. Separate Accounts net gain from operations excluding unrealized gains or losses
6. Commissions and expense allowances on reinsurance ceded (Exhibit 1, Part 2, Line 26.1, Col. 1) 67,880,527 73,277,399
7. Reserve adjustments on reinsurance ceded 11,012 (126,764)
8. Miscellaneous Income:
8.1 Income from fees associated with investment management, administration and contract guarantees from Separate Accounts 68,830,284 73,893,557
8.2 Charges and fees for deposit-type contracts
8.3 Aggregate write-ins for miscellaneous income 76,035,217 55,996,039
9. Total (Lines 1 to 8.3) 4,289,512,602 4,282,703,506
10. Death benefits 115,719,662 120,846,825
11. Matured endowments (excluding guaranteed annual pure endowments) 542,456 1,224,840
12. Annuity benefits (Exhibit 8, Part 2, Line 6.4, Cols. 4 + 8) 70,401,909 51,123,077
13. Disability benefits and benefits under accident and health contracts 51,120,056 47,163,248
14. Coupons, guaranteed annual pure endowments and similar benefits
15. Surrender benefits and withdrawals for life contracts 3,067,275,914 3,150,245,323
16. Group conversions
17. Interest and adjustments on contract or deposit-type contract funds 27,237,299 26,603,441
18. Payments on supplementary contracts with life contingencies 268,036 233,843
19. Increase in aggregate reserves for life and accident and health contracts 720,999,746 720,136,650
20. Totals (Lines 10 to 19) 4,053,565,078 4,117,577,247
21. Commissions on premiums, annuity considerations, and deposit-type contract funds (direct business only) (Exhibit 1, Part 2, Line 31, Col. 1) 122,694,369 108,567,481
22. Commissions and expense allowances on reinsurance assumed (Exhibit 1, Part 2, Line 26.2, Col. 1) 52,628,606 57,693,235
23. General insurance expenses (Exhibit 2, Line 10, Cols. 1, 2, 3 and 4) 285,441,610 254,830,320
24. Insurance taxes, licenses and fees, excluding federal income taxes (Exhibit 3, Line 7, Cols. 1 + 2 + 3) 21,248,797 20,164,702
25. Increase in loading on deferred and uncollected premiums 921,472 (775,925)
26. Net transfers to or (from) Separate Accounts net of reinsurance (343,846,958) (343,633,614)
27. Aggregate write-ins for deductions (3,506,934) (6,441,280)
28. Totals (Lines 20 to 27) 4,189,146,040 4,207,982,166
29. Net gain from operations before dividends to policyholders and federal income taxes (Line 9 minus Line 28) 100,366,562 74,721,340
30. Dividends to policyholders 30,347,508 30,135,073
31. Net gain from operations after dividends to policyholders and before federal income taxes (Line 29 minus Line 30) 70,019,054 44,586,267
32. Federal and foreign income taxes incurred (excluding tax on capital gains) 20,601,824 26,896,304
33. Net gain from operations after dividends to policyholders and federal income taxes and before realized capital gains or (losses) (Line 31 minus Line 32) 49,417,230 17,689,963
34. Net realized capital gains (losses) (excluding gains (losses) transferred to the IMR) less capital gains tax of
$ 531,735 (excluding taxes of $ 2,105,180 transferred to the IMR) 2,991,935 (4,377,568)
35. Net income (Line 33 plus Line 34) 52,409,165 13,312,395
CAPITAL AND SURPLUS ACCOUNT
36. Capital and surplus, December 31, prior year (Page 3, Line 38, Col. 2) 920,374,264 1,017,009,256
37. Net income (Line 35) 52,409,165 13,312,395
38. Change in net unrealized capital gains (losses) less capital gains tax of $ (677,209) 628,295 823,037
39. Change in net unrealized foreign exchange capital gain (loss)
40. Change in net deferred income tax 9,746,927 25,251,711
41. Change in nonadmitted assets (9,491,588) (27,660,059)
42. Change in liability for reinsurance in unauthorized and certified companies 206,871 (12,935)
43. Change in reserve on account of change in valuation basis, (increase) or decrease
44. Change in asset valuation reserve (9,484,341) (5,409,124)
45. Change in treasury stock (Page 3, Lines 36.1 and 36.2, Col. 2 minus Col. 1)
46. Surplus (contributed to) withdrawn from Separate Accounts during period
47. Other changes in surplus in Separate Accounts Statement
48. Change in surplus notes
49. Cumulative effect of changes in accounting principles
50. Capital changes:
50.1 Paid in
50.2 Transferred from surplus (Stock Dividend)
50.3 Transferred to surplus
51. Surplus adjustment:
51.1 Paid in
51.2 Transferred to capital (Stock Dividend)
51.3 Transferred from capital
51.4 Change in surplus as a result of reinsurance (3,480,209) (3,600,921)
52. Dividends to stockholders (100,000,000)
53. Aggregate write-ins for gains and losses in surplus (456,076) 660,903
54. Net change in capital and surplus for the year (Lines 37 through 53) 40,079,044 (96,634,993)
55. Capital and surplus, December 31, current year (Lines 36 + 54) (Page 3, Line 38) 960,453,307 920,374,264
DETAILS OF WRITE-INS
08.301. Miscellaneous income 52,972,043 54,857,501
08.302. Legal settlement 21,717,264
08.303. Change in surrender value of COLI 1,345,910 1,138,538
08.398. Summary of remaining write-ins for Line 8.3 from overflow page
08.399. Totals (Lines 08.301 thru 08.303 plus 08.398)(Line 8.3 above) 76,035,217 55,996,039
2701. Fines and penalties 15,306
2702. Reserve adjustment & SA transfers on reinsurance assumed (3,506,934) (6,456,586)
2703.
2798. Summary of remaining write-ins for Line 27 from overflow page
2799. Totals (Lines 2701 thru 2703 plus 2798)(Line 27 above) (3,506,934) (6,441,280)
5301. Change in pension liability (456,076) 660,903
5302.
5303.
5398. Summary of remaining write-ins for Line 53 from overflow page
5399. Totals (Lines 5301 thru 5303 plus 5398)(Line 53 above) (456,076) 660,903
4
ANNUAL STATEMENT FOR THE YEAR 2016 OF THE AMERICAN UNITED LIFE INSURANCE COMPANY
CASH FLOW1
Current Year
2
Prior Year
Cash from Operations
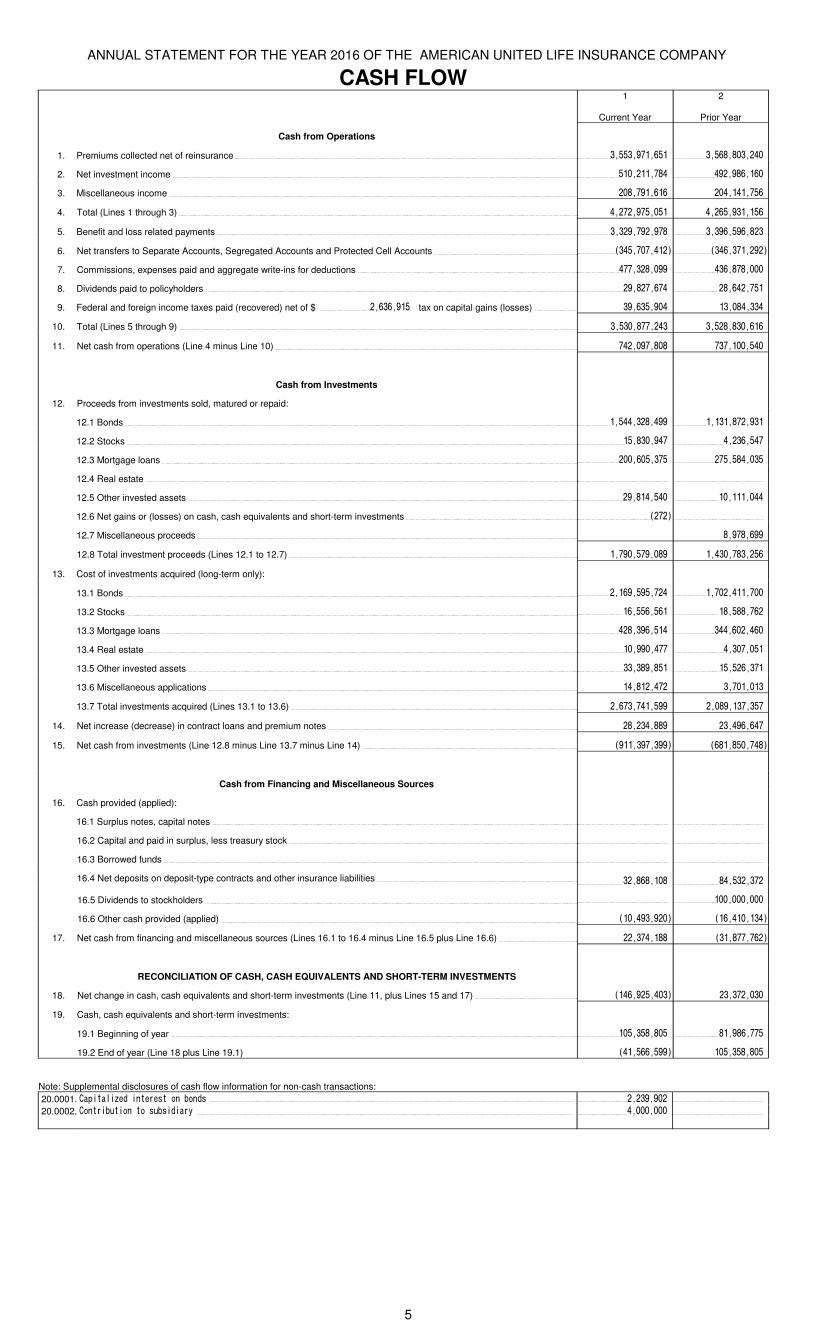
1. Premiums collected net of reinsurance 3,553,971,651 3,568,803,240
2. Net investment income 510,211,784 492,986,160
3. Miscellaneous income 208,791,616 204,141,756
4. Total (Lines 1 through 3) 4,272,975,051 4,265,931,156
5. Benefit and loss related payments 3,329,792,978 3,396,596,823
6. Net transfers to Separate Accounts, Segregated Accounts and Protected Cell Accounts (345,707,412) (346,371,292)
7. Commissions, expenses paid and aggregate write-ins for deductions 477,328,099 436,878,000
8. Dividends paid to policyholders 29,827,674 28,642,751
9. Federal and foreign income taxes paid (recovered) net of $ 2,636,915 tax on capital gains (losses) 39,635,904 13,084,334
10. Total (Lines 5 through 9) 3,530,877,243 3,528,830,616
11. Net cash from operations (Line 4 minus Line 10) 742,097,808 737,100,540
Cash from Investments
12. Proceeds from investments sold, matured or repaid:
12.1 Bonds 1,544,328,499 1,131,872,931
12.2 Stocks 15,830,947 4,236,547
12.3 Mortgage loans 200,605,375 275,584,035
12.4 Real estate
12.5 Other invested assets 29,814,540 10,111,044
12.6 Net gains or (losses) on cash, cash equivalents and short-term investments (272)
12.7 Miscellaneous proceeds 8,978,699
12.8 Total investment proceeds (Lines 12.1 to 12.7) 1,790,579,089 1,430,783,256
13. Cost of investments acquired (long-term only):
13.1 Bonds 2,169,595,724 1,702,411,700
13.2 Stocks 16,556,561 18,588,762
13.3 Mortgage loans 428,396,514 344,602,460
13.4 Real estate 10,990,477 4,307,051
13.5 Other invested assets 33,389,851 15,526,371
13.6 Miscellaneous applications 14,812,472 3,701,013
13.7 Total investments acquired (Lines 13.1 to 13.6) 2,673,741,599 2,089,137,357
14. Net increase (decrease) in contract loans and premium notes 28,234,889 23,496,647
15. Net cash from investments (Line 12.8 minus Line 13.7 minus Line 14) (911,397,399) (681,850,748)
Cash from Financing and Miscellaneous Sources
16. Cash provided (applied):
16.1 Surplus notes, capital notes
16.2 Capital and paid in surplus, less treasury stock
16.3 Borrowed funds
16.4 Net deposits on deposit-type contracts and other insurance liabilities 32,868,108 84,532,372
16.5 Dividends to stockholders 100,000,000
16.6 Other cash provided (applied) (10,493,920) (16,410,134)
17. Net cash from financing and miscellaneous sources (Lines 16.1 to 16.4 minus Line 16.5 plus Line 16.6) 22,374,188 (31,877,762)
RECONCILIATION OF CASH, CASH EQUIVALENTS AND SHORT-TERM INVESTMENTS
18. Net change in cash, cash equivalents and short-term investments (Line 11, plus Lines 15 and 17) (146,925,403) 23,372,030
19. Cash, cash equivalents and short-term investments:
19.1 Beginning of year 105,358,805 81,986,775
19.2 End of year (Line 18 plus Line 19.1) (41,566,599) 105,358,805
Note: Supplemental disclosures of cash flow information for non-cash transactions:
20.0001. Capitalized interest on bonds 2,239,902
20.0002. Contribution to subsidiary 4,000,000
5
ANNUAL STATEMENT FOR THE YEAR 2016 OF THE AMERICAN UNITED LIFE INSURANCE COMPANY
ANALYSIS OF OPERATIONS BY LINES OF BUSINESS1 2 Ordinary 6 Group Accident and Health 12
Total Industrial Life
3
Life Insurance
4
Individual Annuities
5Supplementary
Contracts
Credit Life (Group and Individual)
7Life Insurance
(a)
8
Annuities
9
Group
10Credit (Group and
Individual)
11
Other
Aggregate of All Other Lines of
Business
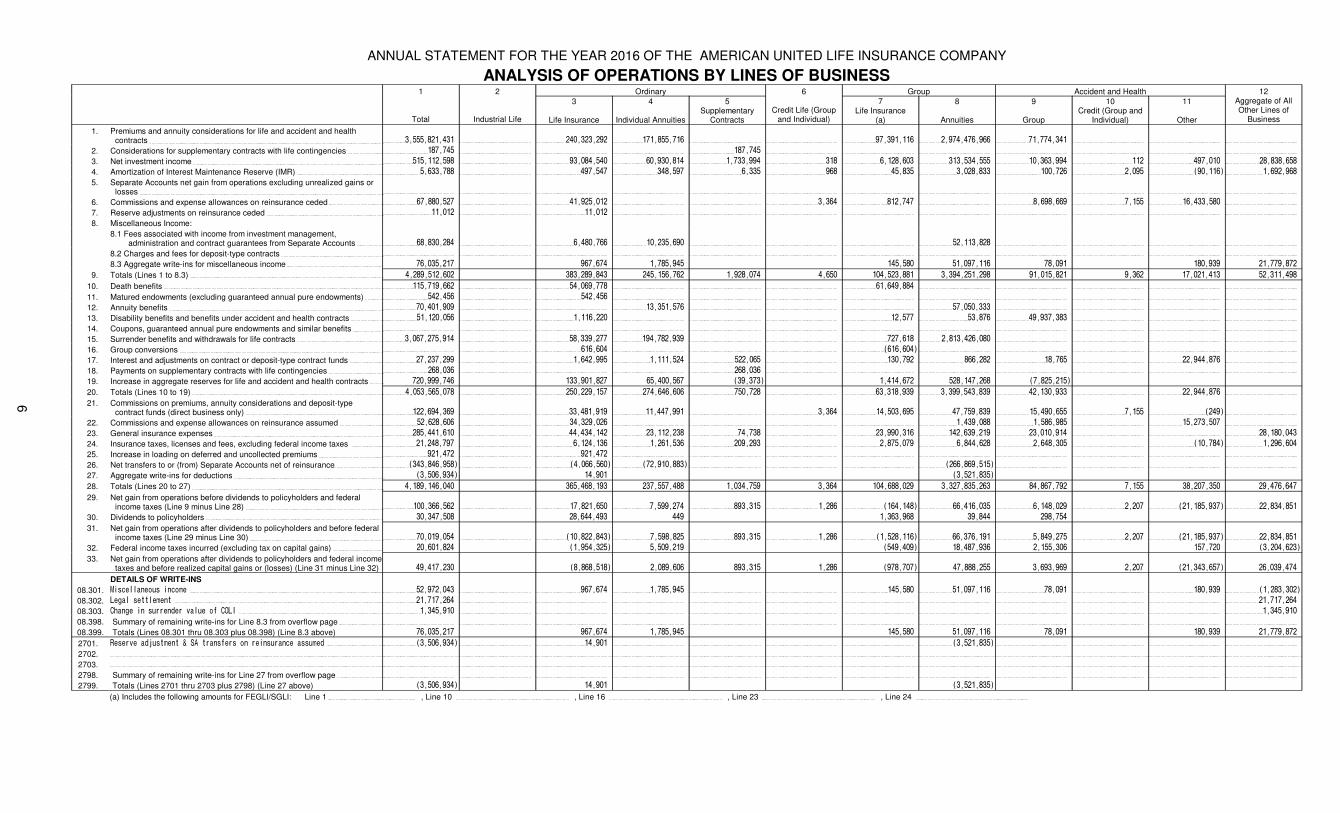
1. Premiums and annuity considerations for life and accident and health contracts 3,555,821,431 240,323,292 171,855,716 97,391,116 2,974,476,966 71,774,341
2. Considerations for supplementary contracts with life contingencies 187,745 187,745
3. Net investment income 515,112,598 93,084,540 60,930,814 1,733,994 318 6,128,603 313,534,555 10,363,994 112 497,010 28,838,658
4. Amortization of Interest Maintenance Reserve (IMR) 5,633,788 497,547 348,597 6,335 968 45,835 3,028,833 100,726 2,095 (90,116) 1,692,968
5. Separate Accounts net gain from operations excluding unrealized gains or losses
6. Commissions and expense allowances on reinsurance ceded 67,880,527 41,925,012 3,364 812,747 8,698,669 7,155 16,433,580
7. Reserve adjustments on reinsurance ceded 11,012 11,012
8. Miscellaneous Income:
8.1 Fees associated with income from investment management, administration and contract guarantees from Separate Accounts 68,830,284 6,480,766 10,235,690 52,113,828
8.2 Charges and fees for deposit-type contracts
8.3 Aggregate write-ins for miscellaneous income 76,035,217 967,674 1,785,945 145,580 51,097,116 78,091 180,939 21,779,872
9. Totals (Lines 1 to 8.3) 4,289,512,602 383,289,843 245,156,762 1,928,074 4,650 104,523,881 3,394,251,298 91,015,821 9,362 17,021,413 52,311,498
10. Death benefits 115,719,662 54,069,778 61,649,884
11. Matured endowments (excluding guaranteed annual pure endowments) 542,456 542,456
12. Annuity benefits 70,401,909 13,351,576 57,050,333
13. Disability benefits and benefits under accident and health contracts 51,120,056 1,116,220 12,577 53,876 49,937,383
14. Coupons, guaranteed annual pure endowments and similar benefits
15. Surrender benefits and withdrawals for life contracts 3,067,275,914 58,339,277 194,782,939 727,618 2,813,426,080
16. Group conversions 616,604 (616,604)
17. Interest and adjustments on contract or deposit-type contract funds 27,237,299 1,642,995 1,111,524 522,065 130,792 866,282 18,765 22,944,876
18. Payments on supplementary contracts with life contingencies 268,036 268,036
19. Increase in aggregate reserves for life and accident and health contracts 720,999,746 133,901,827 65,400,567 (39,373) 1,414,672 528,147,268 (7,825,215)
20. Totals (Lines 10 to 19) 4,053,565,078 250,229,157 274,646,606 750,728 63,318,939 3,399,543,839 42,130,933 22,944,876
21. Commissions on premiums, annuity considerations and deposit-type contract funds (direct business only) 122,694,369 33,481,919 11,447,991 3,364 14,503,695 47,759,839 15,490,655 7,155 (249)
22. Commissions and expense allowances on reinsurance assumed 52,628,606 34,329,026 1,439,088 1,586,985 15,273,507
23. General insurance expenses 285,441,610 44,434,142 23,112,238 74,738 23,990,316 142,639,219 23,010,914 28,180,043
24. Insurance taxes, licenses and fees, excluding federal income taxes 21,248,797 6,124,136 1,261,536 209,293 2,875,079 6,844,628 2,648,305 (10,784) 1,296,604
25. Increase in loading on deferred and uncollected premiums 921,472 921,472
26. Net transfers to or (from) Separate Accounts net of reinsurance (343,846,958) (4,066,560) (72,910,883) (266,869,515)
27. Aggregate write-ins for deductions (3,506,934) 14,901 (3,521,835)
28. Totals (Lines 20 to 27) 4,189,146,040 365,468,193 237,557,488 1,034,759 3,364 104,688,029 3,327,835,263 84,867,792 7,155 38,207,350 29,476,647
29. Net gain from operations before dividends to policyholders and federal income taxes (Line 9 minus Line 28) 100,366,562 17,821,650 7,599,274 893,315 1,286 (164,148) 66,416,035 6,148,029 2,207 (21,185,937) 22,834,851
30. Dividends to policyholders 30,347,508 28,644,493 449 1,363,968 39,844 298,754
31. Net gain from operations after dividends to policyholders and before federal income taxes (Line 29 minus Line 30) 70,019,054 (10,822,843) 7,598,825 893,315 1,286 (1,528,116) 66,376,191 5,849,275 2,207 (21,185,937) 22,834,851
32. Federal income taxes incurred (excluding tax on capital gains) 20,601,824 (1,954,325) 5,509,219 (549,409) 18,487,936 2,155,306 157,720 (3,204,623)
33. Net gain from operations after dividends to policyholders and federal income taxes and before realized capital gains or (losses) (Line 31 minus Line 32) 49,417,230 (8,868,518) 2,089,606 893,315 1,286 (978,707) 47,888,255 3,693,969 2,207 (21,343,657) 26,039,474
DETAILS OF WRITE-INS
08.301. Miscellaneous income 52,972,043 967,674 1,785,945 145,580 51,097,116 78,091 180,939 (1,283,302)
08.302. Legal settlement 21,717,264 21,717,264
08.303. Change in surrender value of COLI 1,345,910 1,345,910
08.398. Summary of remaining write-ins for Line 8.3 from overflow page
08.399. Totals (Lines 08.301 thru 08.303 plus 08.398) (Line 8.3 above) 76,035,217 967,674 1,785,945 145,580 51,097,116 78,091 180,939 21,779,872
2701. Reserve adjustment & SA transfers on reinsurance assumed (3,506,934) 14,901 (3,521,835)
2702.
2703.
2798. Summary of remaining write-ins for Line 27 from overflow page
2799. Totals (Lines 2701 thru 2703 plus 2798) (Line 27 above) (3,506,934) 14,901 (3,521,835)
(a) Includes the following amounts for FEGLI/SGLI: Line 1 , Line 10 , Line 16 , Line 23 , Line 24
6
ANNUAL STATEMENT FOR THE YEAR 2016 OF THE AMERICAN UNITED LIFE INSURANCE COMPANY
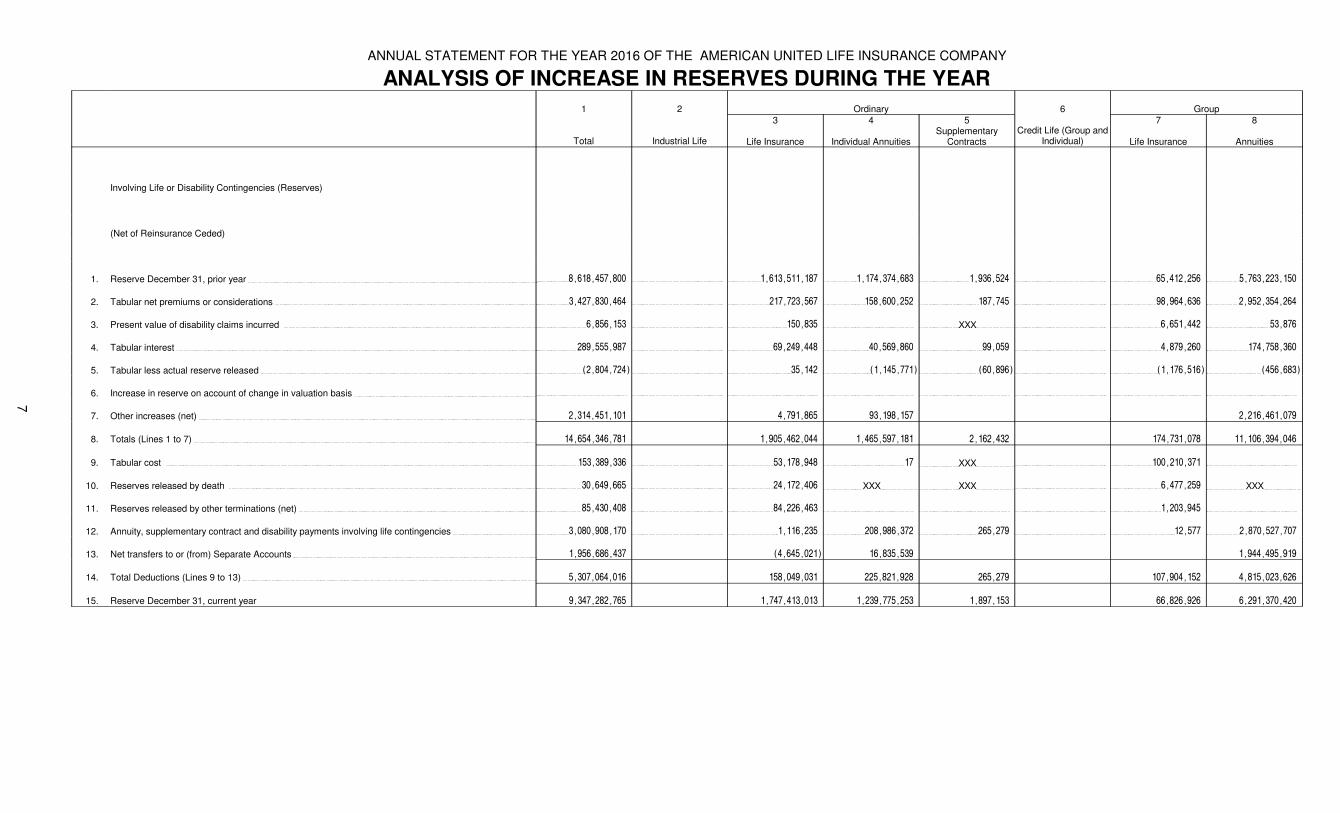
ANALYSIS OF INCREASE IN RESERVES DURING THE YEAR
1 2 Ordinary 6 Group
Total Industrial Life
3
Life Insurance
4
Individual Annuities
5Supplementary
ContractsCredit Life (Group and
Individual)
7
Life Insurance
8
Annuities
Involving Life or Disability Contingencies (Reserves)
(Net of Reinsurance Ceded)
1. Reserve December 31, prior year 8,618,457,800 1,613,511,187 1,174,374,683 1,936,524 65,412,256 5,763,223,150
2. Tabular net premiums or considerations 3,427,830,464 217,723,567 158,600,252 187,745 98,964,636 2,952,354,264
3. Present value of disability claims incurred 6,856,153 150,835 XXX 6,651,442 53,876
4. Tabular interest 289,555,987 69,249,448 40,569,860 99,059 4,879,260 174,758,360
5. Tabular less actual reserve released (2,804,724) 35,142 (1,145,771) (60,896) (1,176,516) (456,683)
6. Increase in reserve on account of change in valuation basis
7. Other increases (net) 2,314,451,101 4,791,865 93,198,157 2,216,461,079
8. Totals (Lines 1 to 7) 14,654,346,781 1,905,462,044 1,465,597,181 2,162,432 174,731,078 11,106,394,046
9. Tabular cost 153,389,336 53,178,948 17 XXX 100,210,371
10. Reserves released by death 30,649,665 24,172,406 XXX XXX 6,477,259 XXX
11. Reserves released by other terminations (net) 85,430,408 84,226,463 1,203,945
12. Annuity, supplementary contract and disability payments involving life contingencies 3,080,908,170 1,116,235 208,986,372 265,279 12,577 2,870,527,707
13. Net transfers to or (from) Separate Accounts 1,956,686,437 (4,645,021) 16,835,539 1,944,495,919
14. Total Deductions (Lines 9 to 13) 5,307,064,016 158,049,031 225,821,928 265,279 107,904,152 4,815,023,626
15. Reserve December 31, current year 9,347,282,765 1,747,413,013 1,239,775,253 1,897,153 66,826,926 6,291,370,420
7
ANNUAL STATEMENT FOR THE YEAR 2016 OF THE AMERICAN UNITED LIFE INSURANCE COMPANY
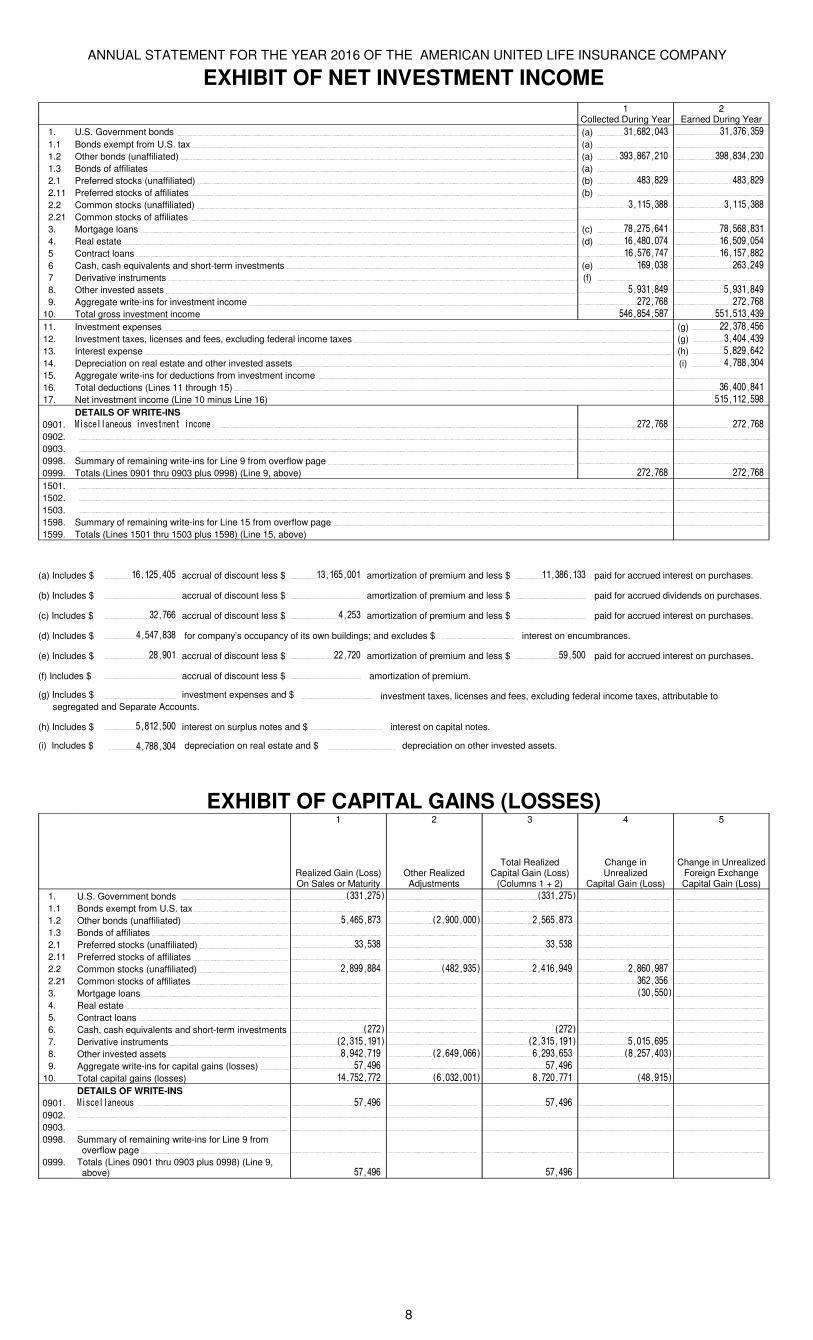
EXHIBIT OF NET INVESTMENT INCOME
1 2Collected During Year Earned During Year
1. U.S. Government bonds (a) 31,682,043 31,376,359
1.1 Bonds exempt from U.S. tax (a)
1.2 Other bonds (unaffiliated) (a) 393,867,210 398,834,230
1.3 Bonds of affiliates (a)
2.1 Preferred stocks (unaffiliated) (b) 483,829 483,829
2.11 Preferred stocks of affiliates (b)
2.2 Common stocks (unaffiliated) 3,115,388 3,115,388
2.21 Common stocks of affiliates
3. Mortgage loans (c) 78,275,641 78,568,831
4. Real estate (d) 16,480,074 16,509,054
5 Contract loans 16,576,747 16,157,882
6 Cash, cash equivalents and short-term investments (e) 169,038 263,249
7 Derivative instruments (f)
8. Other invested assets 5,931,849 5,931,849
9. Aggregate write-ins for investment income 272,768 272,768
10. Total gross investment income 546,854,587 551,513,439
11. Investment expenses (g) 22,378,456
12. Investment taxes, licenses and fees, excluding federal income taxes (g) 3,404,439
13. Interest expense (h) 5,829,642
14. Depreciation on real estate and other invested assets (i) 4,788,304
15. Aggregate write-ins for deductions from investment income
16. Total deductions (Lines 11 through 15) 36,400,841
17. Net investment income (Line 10 minus Line 16) 515,112,598
DETAILS OF WRITE-INS
0901. Miscellaneous investment income 272,768 272,768
0902.
0903.
0998. Summary of remaining write-ins for Line 9 from overflow page
0999. Totals (Lines 0901 thru 0903 plus 0998) (Line 9, above) 272,768 272,768
1501.
1502.
1503.
1598. Summary of remaining write-ins for Line 15 from overflow page
1599. Totals (Lines 1501 thru 1503 plus 1598) (Line 15, above)
(a) Includes $ 16,125,405 accrual of discount less $ 13,165,001 amortization of premium and less $ 11,386,133 paid for accrued interest on purchases.
(b) Includes $ accrual of discount less $ amortization of premium and less $ paid for accrued dividends on purchases.
(c) Includes $ 32,766 accrual of discount less $ 4,253 amortization of premium and less $ paid for accrued interest on purchases.
(d) Includes $ 4,547,838 for company’s occupancy of its own buildings; and excludes $ interest on encumbrances.
(e) Includes $ 28,901 accrual of discount less $ 22,720 amortization of premium and less $ 59,500 paid for accrued interest on purchases.
(f) Includes $ accrual of discount less $ amortization of premium.
(g) Includes $ investment expenses and $ investment taxes, licenses and fees, excluding federal income taxes, attributable tosegregated and Separate Accounts.
(h) Includes $ 5,812,500 interest on surplus notes and $ interest on capital notes.
(i) Includes $ 4,788,304 depreciation on real estate and $ depreciation on other invested assets.
EXHIBIT OF CAPITAL GAINS (LOSSES)1
Realized Gain (Loss) On Sales or Maturity
2
Other Realized Adjustments
3
Total RealizedCapital Gain (Loss)
(Columns 1 + 2)
4
Change inUnrealized
Capital Gain (Loss)
5
Change in Unrealized Foreign Exchange Capital Gain (Loss)
1. U.S. Government bonds (331,275) (331,275)
1.1 Bonds exempt from U.S. tax
1.2 Other bonds (unaffiliated) 5,465,873 (2,900,000) 2,565,873
1.3 Bonds of affiliates
2.1 Preferred stocks (unaffiliated) 33,538 33,538
2.11 Preferred stocks of affiliates
2.2 Common stocks (unaffiliated) 2,899,884 (482,935) 2,416,949 2,860,987
2.21 Common stocks of affiliates 362,356
3. Mortgage loans (30,550)
4. Real estate
5. Contract loans
6. Cash, cash equivalents and short-term investments (272) (272)
7. Derivative instruments (2,315,191) (2,315,191) 5,015,695
8. Other invested assets 8,942,719 (2,649,066) 6,293,653 (8,257,403)
9. Aggregate write-ins for capital gains (losses) 57,496 57,496
10. Total capital gains (losses) 14,752,772 (6,032,001) 8,720,771 (48,915)
DETAILS OF WRITE-INS
0901. Miscellaneous 57,496 57,496
0902.
0903.
0998. Summary of remaining write-ins for Line 9 from overflow page
0999. Totals (Lines 0901 thru 0903 plus 0998) (Line 9, above) 57,496 57,496
8
ANNUAL STATEMENT FOR THE YEAR 2016 OF THE AMERICAN UNITED LIFE INSURANCE COMPANY
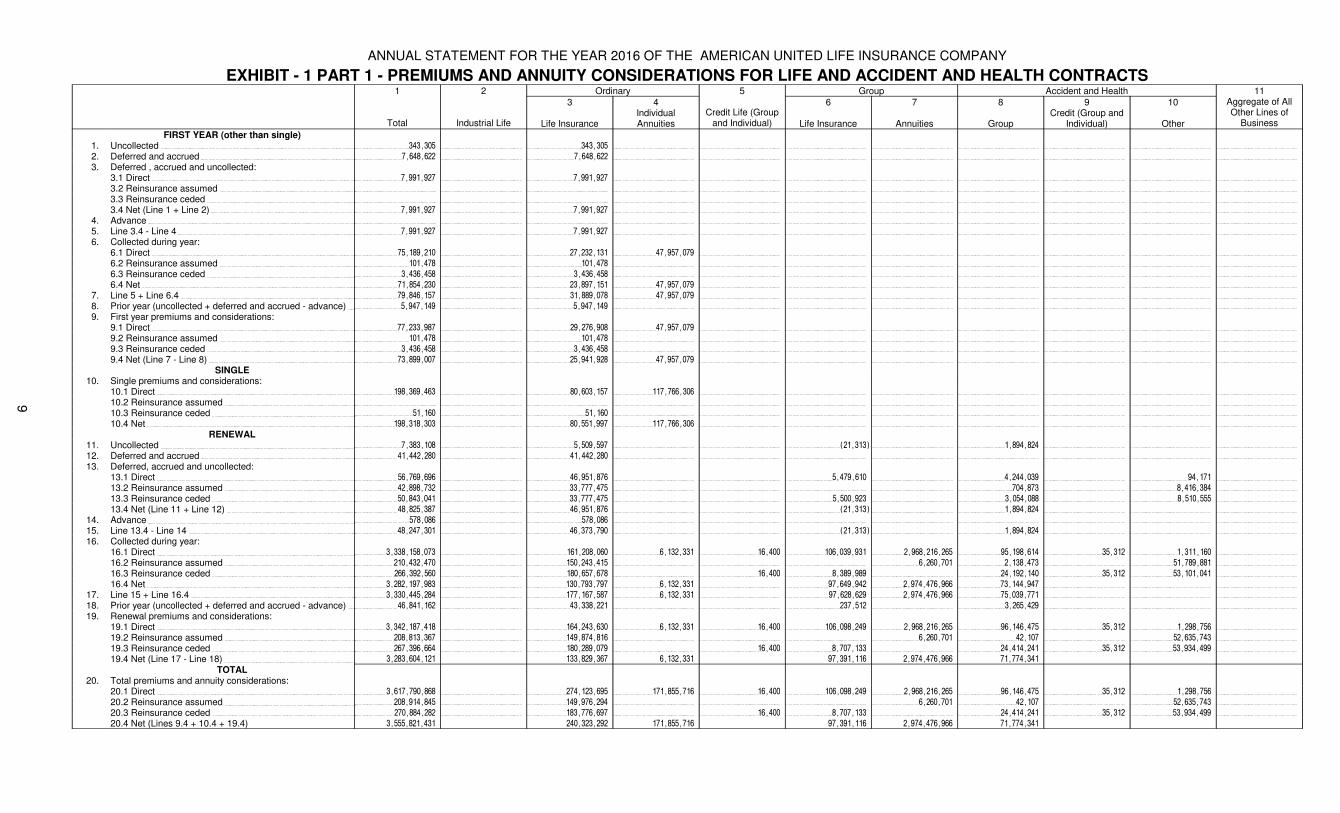
EXHIBIT - 1 PART 1 - PREMIUMS AND ANNUITY CONSIDERATIONS FOR LIFE AND ACCIDENT AND HEALTH CONTRACTS1 2 Ordinary 5 Group Accident and Health 11
Total Industrial Life
3
Life Insurance
4IndividualAnnuities
Credit Life (Group and Individual)
6
Life Insurance
7
Annuities
8
Group
9Credit (Group and
Individual)
10
Other
Aggregate of All Other Lines of
Business
FIRST YEAR (other than single)1. Uncollected 343,305 343,305
2. Deferred and accrued 7,648,622 7,648,622
3. Deferred , accrued and uncollected:3.1 Direct 7,991,927 7,991,927
3.2 Reinsurance assumed
3.3 Reinsurance ceded
3.4 Net (Line 1 + Line 2) 7,991,927 7,991,927
4. Advance
5. Line 3.4 - Line 4 7,991,927 7,991,927
6. Collected during year:6.1 Direct 75,189,210 27,232,131 47,957,079
6.2 Reinsurance assumed 101,478 101,478
6.3 Reinsurance ceded 3,436,458 3,436,458
6.4 Net 71,854,230 23,897,151 47,957,079
7. Line 5 + Line 6.4 79,846,157 31,889,078 47,957,079
8. Prior year (uncollected + deferred and accrued - advance) 5,947,149 5,947,149
9. First year premiums and considerations:9.1 Direct 77,233,987 29,276,908 47,957,079
9.2 Reinsurance assumed 101,478 101,478
9.3 Reinsurance ceded 3,436,458 3,436,458
9.4 Net (Line 7 - Line 8) 73,899,007 25,941,928 47,957,079
SINGLE10. Single premiums and considerations:
10.1 Direct 198,369,463 80,603,157 117,766,306
10.2 Reinsurance assumed
10.3 Reinsurance ceded 51,160 51,160
10.4 Net 198,318,303 80,551,997 117,766,306
RENEWAL11. Uncollected 7,383,108 5,509,597 (21,313) 1,894,824
12. Deferred and accrued 41,442,280 41,442,280
13. Deferred, accrued and uncollected:13.1 Direct 56,769,696 46,951,876 5,479,610 4,244,039 94,171
13.2 Reinsurance assumed 42,898,732 33,777,475 704,873 8,416,384
13.3 Reinsurance ceded 50,843,041 33,777,475 5,500,923 3,054,088 8,510,555
13.4 Net (Line 11 + Line 12) 48,825,387 46,951,876 (21,313) 1,894,824
14. Advance 578,086 578,086
15. Line 13.4 - Line 14 48,247,301 46,373,790 (21,313) 1,894,824
16. Collected during year:16.1 Direct 3,338,158,073 161,208,060 6,132,331 16,400 106,039,931 2,968,216,265 95,198,614 35,312 1,311,160
16.2 Reinsurance assumed 210,432,470 150,243,415 6,260,701 2,138,473 51,789,881
16.3 Reinsurance ceded 266,392,560 180,657,678 16,400 8,389,989 24,192,140 35,312 53,101,041
16.4 Net 3,282,197,983 130,793,797 6,132,331 97,649,942 2,974,476,966 73,144,947
17. Line 15 + Line 16.4 3,330,445,284 177,167,587 6,132,331 97,628,629 2,974,476,966 75,039,771
18. Prior year (uncollected + deferred and accrued - advance) 46,841,162 43,338,221 237,512 3,265,429
19. Renewal premiums and considerations:19.1 Direct 3,342,187,418 164,243,630 6,132,331 16,400 106,098,249 2,968,216,265 96,146,475 35,312 1,298,756
19.2 Reinsurance assumed 208,813,367 149,874,816 6,260,701 42,107 52,635,743
19.3 Reinsurance ceded 267,396,664 180,289,079 16,400 8,707,133 24,414,241 35,312 53,934,499
19.4 Net (Line 17 - Line 18) 3,283,604,121 133,829,367 6,132,331 97,391,116 2,974,476,966 71,774,341
TOTAL20. Total premiums and annuity considerations:
20.1 Direct 3,617,790,868 274,123,695 171,855,716 16,400 106,098,249 2,968,216,265 96,146,475 35,312 1,298,756
20.2 Reinsurance assumed 208,914,845 149,976,294 6,260,701 42,107 52,635,743
20.3 Reinsurance ceded 270,884,282 183,776,697 16,400 8,707,133 24,414,241 35,312 53,934,499
20.4 Net (Lines 9.4 + 10.4 + 19.4) 3,555,821,431 240,323,292 171,855,716 97,391,116 2,974,476,966 71,774,341
9
ANNUAL STATEMENT FOR THE YEAR 2016 OF THE AMERICAN UNITED LIFE INSURANCE COMPANY
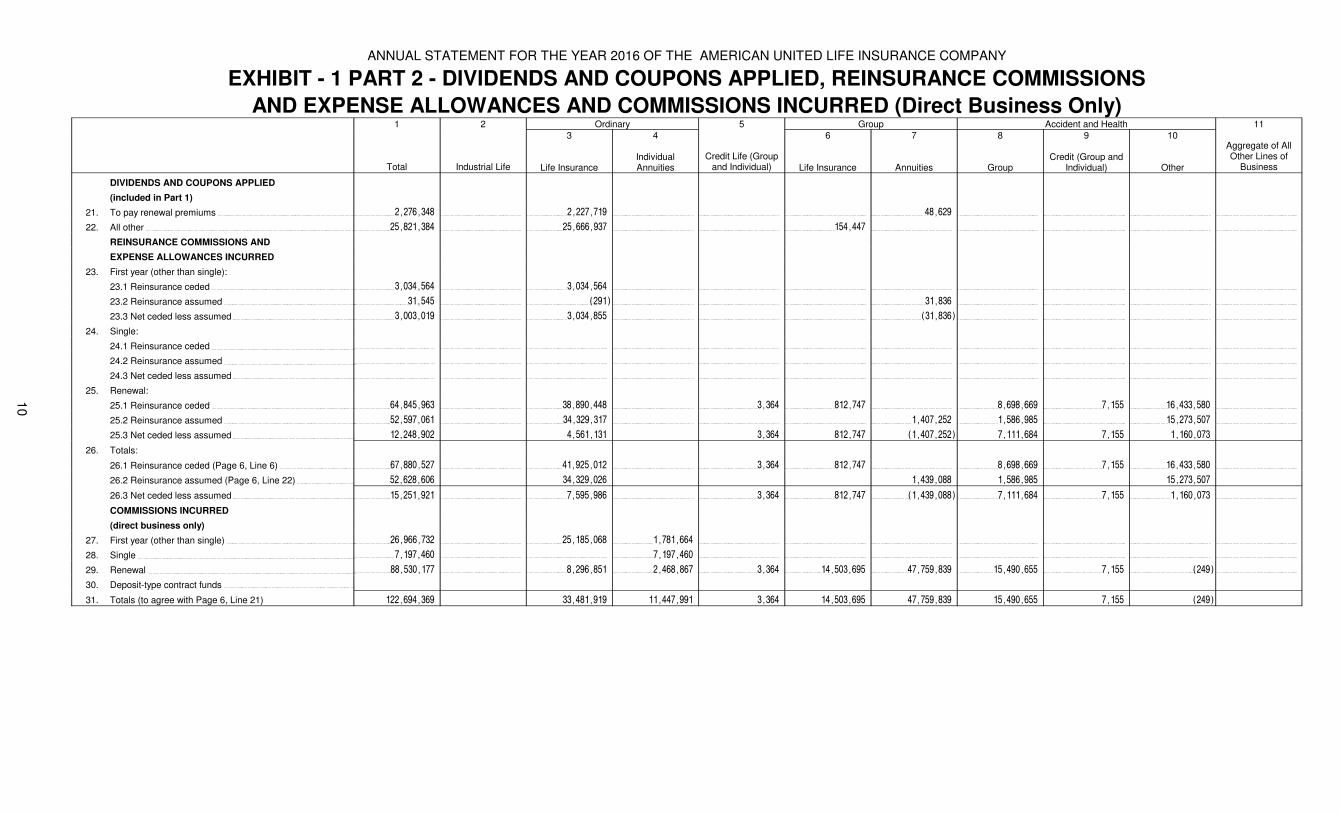
EXHIBIT - 1 PART 2 - DIVIDENDS AND COUPONS APPLIED, REINSURANCE COMMISSIONS
AND EXPENSE ALLOWANCES AND COMMISSIONS INCURRED (Direct Business Only)1 2 Ordinary 5 Group Accident and Health 11
Total Industrial Life
3
Life Insurance
4
IndividualAnnuities
Credit Life (Group and Individual)
6
Life Insurance
7
Annuities
8
Group
9
Credit (Group and Individual)
10
Other
Aggregate of All Other Lines of
Business
DIVIDENDS AND COUPONS APPLIED
(included in Part 1)
21. To pay renewal premiums 2,276,348 2,227,719 48,629
22. All other 25,821,384 25,666,937 154,447
REINSURANCE COMMISSIONS AND
EXPENSE ALLOWANCES INCURRED
23. First year (other than single):
23.1 Reinsurance ceded 3,034,564 3,034,564
23.2 Reinsurance assumed 31,545 (291) 31,836
23.3 Net ceded less assumed 3,003,019 3,034,855 (31,836)
24. Single:
24.1 Reinsurance ceded
24.2 Reinsurance assumed
24.3 Net ceded less assumed
25. Renewal:
25.1 Reinsurance ceded 64,845,963 38,890,448 3,364 812,747 8,698,669 7,155 16,433,580
25.2 Reinsurance assumed 52,597,061 34,329,317 1,407,252 1,586,985 15,273,507
25.3 Net ceded less assumed 12,248,902 4,561,131 3,364 812,747 (1,407,252) 7,111,684 7,155 1,160,073
26. Totals:
26.1 Reinsurance ceded (Page 6, Line 6) 67,880,527 41,925,012 3,364 812,747 8,698,669 7,155 16,433,580
26.2 Reinsurance assumed (Page 6, Line 22) 52,628,606 34,329,026 1,439,088 1,586,985 15,273,507
26.3 Net ceded less assumed 15,251,921 7,595,986 3,364 812,747 (1,439,088) 7,111,684 7,155 1,160,073
COMMISSIONS INCURRED
(direct business only)
27. First year (other than single) 26,966,732 25,185,068 1,781,664
28. Single 7,197,460 7,197,460
29. Renewal 88,530,177 8,296,851 2,468,867 3,364 14,503,695 47,759,839 15,490,655 7,155 (249)
30. Deposit-type contract funds
31. Totals (to agree with Page 6, Line 21) 122,694,369 33,481,919 11,447,991 3,364 14,503,695 47,759,839 15,490,655 7,155 (249)
10
ANNUAL STATEMENT FOR THE YEAR 2016 OF THE AMERICAN UNITED LIFE INSURANCE COMPANY
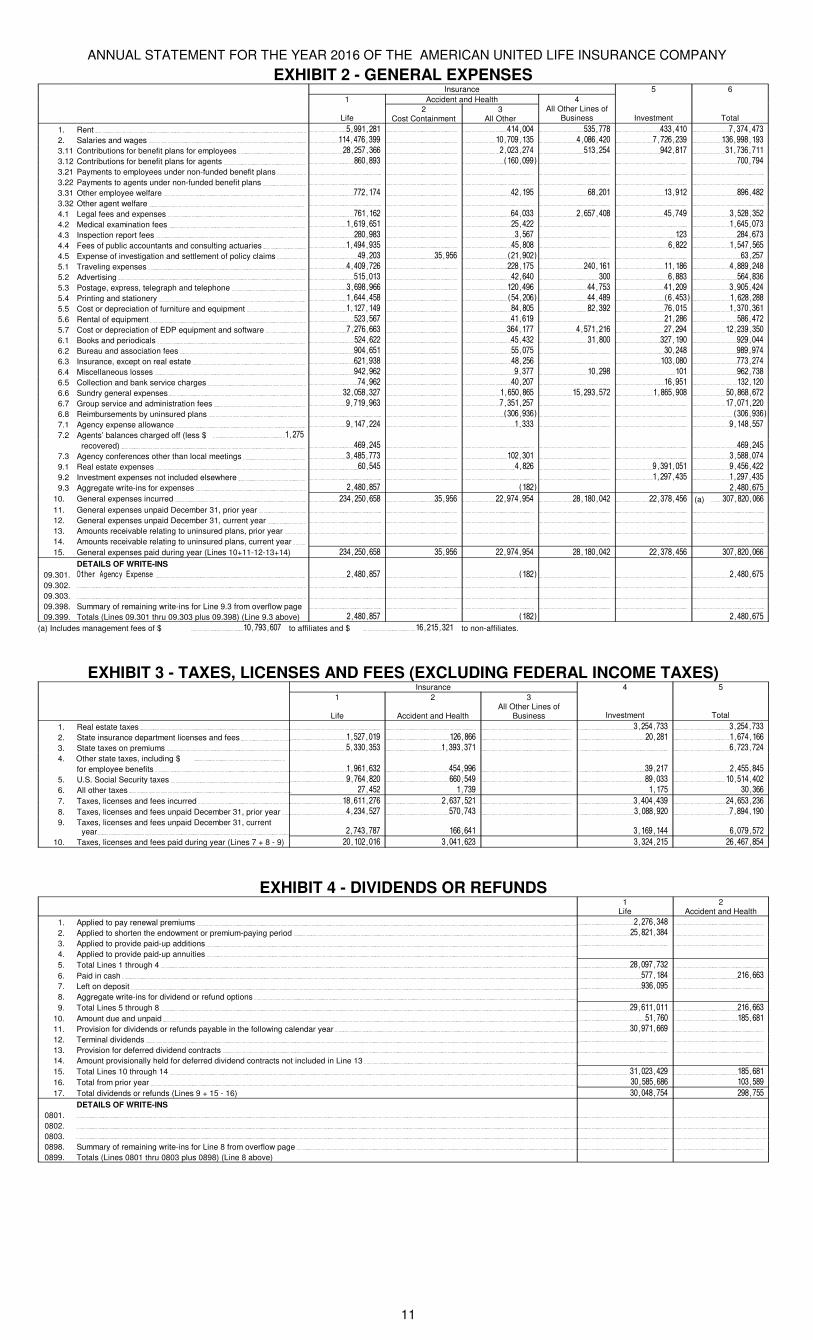
EXHIBIT 2 - GENERAL EXPENSESInsurance 5 6
1 Accident and Health 4
Life2
Cost Containment3
All Other
All Other Lines of Business Investment Total
1. Rent 5,991,281 414,004 535,778 433,410 7,374,473
2. Salaries and wages 114,476,399 10,709,135 4,086,420 7,726,239 136,998,193
3.11 Contributions for benefit plans for employees 28,257,366 2,023,274 513,254 942,817 31,736,711
3.12 Contributions for benefit plans for agents 860,893 (160,099) 700,794
3.21 Payments to employees under non-funded benefit plans
3.22 Payments to agents under non-funded benefit plans
3.31 Other employee welfare 772,174 42,195 68,201 13,912 896,482
3.32 Other agent welfare
4.1 Legal fees and expenses 761,162 64,033 2,657,408 45,749 3,528,352
4.2 Medical examination fees 1,619,651 25,422 1,645,073
4.3 Inspection report fees 280,983 3,567 123 284,673
4.4 Fees of public accountants and consulting actuaries 1,494,935 45,808 6,822 1,547,565
4.5 Expense of investigation and settlement of policy claims 49,203 35,956 (21,902) 63,257
5.1 Traveling expenses 4,409,726 228,175 240,161 11,186 4,889,248
5.2 Advertising 515,013 42,640 300 6,883 564,836
5.3 Postage, express, telegraph and telephone 3,698,966 120,496 44,753 41,209 3,905,424
5.4 Printing and stationery 1,644,458 (54,206) 44,489 (6,453) 1,628,288
5.5 Cost or depreciation of furniture and equipment 1,127,149 84,805 82,392 76,015 1,370,361
5.6 Rental of equipment 523,567 41,619 21,286 586,472
5.7 Cost or depreciation of EDP equipment and software 7,276,663 364,177 4,571,216 27,294 12,239,350
6.1 Books and periodicals 524,622 45,432 31,800 327,190 929,044
6.2 Bureau and association fees 904,651 55,075 30,248 989,974
6.3 Insurance, except on real estate 621,938 48,256 103,080 773,274
6.4 Miscellaneous losses 942,962 9,377 10,298 101 962,738
6.5 Collection and bank service charges 74,962 40,207 16,951 132,120
6.6 Sundry general expenses 32,058,327 1,650,865 15,293,572 1,865,908 50,868,672
6.7 Group service and administration fees 9,719,963 7,351,257 17,071,220
6.8 Reimbursements by uninsured plans (306,936) (306,936)
7.1 Agency expense allowance 9,147,224 1,333 9,148,557
7.2 Agents’ balances charged off (less $ 1,275
recovered) 469,245 469,245
7.3 Agency conferences other than local meetings 3,485,773 102,301 3,588,074
9.1 Real estate expenses 60,545 4,826 9,391,051 9,456,422
9.2 Investment expenses not included elsewhere 1,297,435 1,297,435
9.3 Aggregate write-ins for expenses 2,480,857 (182) 2,480,675
10. General expenses incurred 234,250,658 35,956 22,974,954 28,180,042 22,378,456 (a) 307,820,066
11. General expenses unpaid December 31, prior year
12. General expenses unpaid December 31, current year
13. Amounts receivable relating to uninsured plans, prior year
14. Amounts receivable relating to uninsured plans, current year
15. General expenses paid during year (Lines 10+11-12-13+14) 234,250,658 35,956 22,974,954 28,180,042 22,378,456 307,820,066
DETAILS OF WRITE-INS
09.301. Other Agency Expense 2,480,857 (182) 2,480,675
09.302.
09.303.
09.398. Summary of remaining write-ins for Line 9.3 from overflow page
09.399. Totals (Lines 09.301 thru 09.303 plus 09.398) (Line 9.3 above) 2,480,857 (182) 2,480,675
(a) Includes management fees of $ 10,793,607 to affiliates and $ 16,215,321 to non-affiliates.
EXHIBIT 3 - TAXES, LICENSES AND FEES (EXCLUDING FEDERAL INCOME TAXES)Insurance 4 5
1
Life
2
Accident and Health
3All Other Lines of
Business Investment Total
1. Real estate taxes 3,254,733 3,254,733
2. State insurance department licenses and fees 1,527,019 126,866 20,281 1,674,166
3. State taxes on premiums 5,330,353 1,393,371 6,723,724
4. Other state taxes, including $
for employee benefits 1,961,632 454,996 39,217 2,455,845
5. U.S. Social Security taxes 9,764,820 660,549 89,033 10,514,402
6. All other taxes 27,452 1,739 1,175 30,366
7. Taxes, licenses and fees incurred 18,611,276 2,637,521 3,404,439 24,653,236
8. Taxes, licenses and fees unpaid December 31, prior year 4,234,527 570,743 3,088,920 7,894,190
9. Taxes, licenses and fees unpaid December 31, current year 2,743,787 166,641 3,169,144 6,079,572
10. Taxes, licenses and fees paid during year (Lines 7 + 8 - 9) 20,102,016 3,041,623 3,324,215 26,467,854
EXHIBIT 4 - DIVIDENDS OR REFUNDS1
Life2
Accident and Health
1. Applied to pay renewal premiums 2,276,348
2. Applied to shorten the endowment or premium-paying period 25,821,384
3. Applied to provide paid-up additions
4. Applied to provide paid-up annuities
5. Total Lines 1 through 4 28,097,732
6. Paid in cash 577,184 216,663
7. Left on deposit 936,095
8. Aggregate write-ins for dividend or refund options
9. Total Lines 5 through 8 29,611,011 216,663
10. Amount due and unpaid 51,760 185,681
11. Provision for dividends or refunds payable in the following calendar year 30,971,669
12. Terminal dividends
13. Provision for deferred dividend contracts
14. Amount provisionally held for deferred dividend contracts not included in Line 13
15. Total Lines 10 through 14 31,023,429 185,681
16. Total from prior year 30,585,686 103,589
17. Total dividends or refunds (Lines 9 + 15 - 16) 30,048,754 298,755
DETAILS OF WRITE-INS
0801.
0802.
0803.
0898. Summary of remaining write-ins for Line 8 from overflow page
0899. Totals (Lines 0801 thru 0803 plus 0898) (Line 8 above)
11
ANNUAL STATEMENT FOR THE YEAR 2016 OF THE AMERICAN UNITED LIFE INSURANCE COMPANY
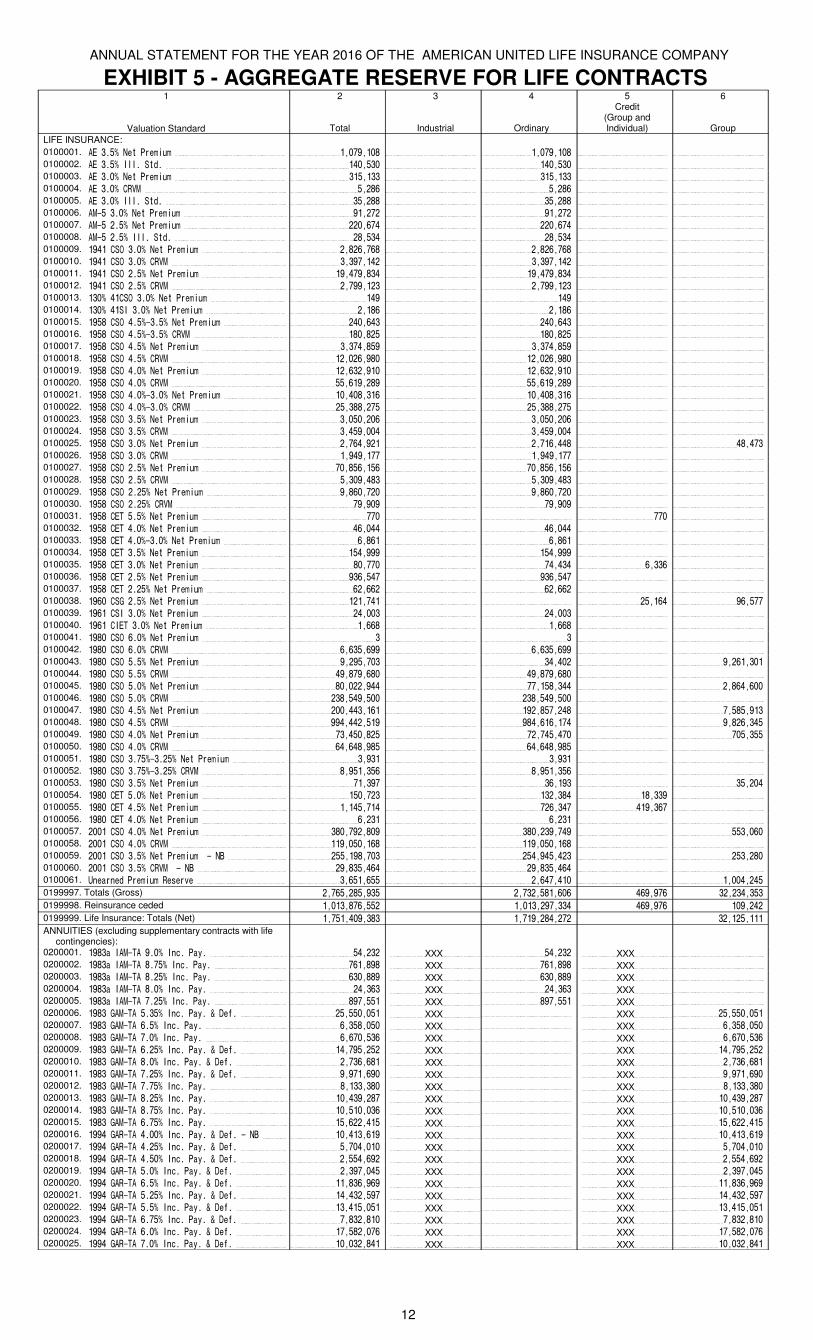
EXHIBIT 5 - AGGREGATE RESERVE FOR LIFE CONTRACTS1
Valuation Standard
2
Total
3
Industrial
4
Ordinary
5Credit
(Group and Individual)
6
Group
LIFE INSURANCE:
0100001. AE 3.5% Net Premium 1,079,108 1,079,108 0100002. AE 3.5% Ill. Std. 140,530 140,530 0100003. AE 3.0% Net Premium 315,133 315,133 0100004. AE 3.0% CRVM 5,286 5,286 0100005. AE 3.0% Ill. Std. 35,288 35,288 0100006. AM-5 3.0% Net Premium 91,272 91,272 0100007. AM-5 2.5% Net Premium 220,674 220,674 0100008. AM-5 2.5% Ill. Std. 28,534 28,534 0100009. 1941 CSO 3.0% Net Premium 2,826,768 2,826,768 0100010. 1941 CSO 3.0% CRVM 3,397,142 3,397,142 0100011. 1941 CSO 2.5% Net Premium 19,479,834 19,479,834 0100012. 1941 CSO 2.5% CRVM 2,799,123 2,799,123 0100013. 130% 41CSO 3.0% Net Premium 149 149 0100014. 130% 41SI 3.0% Net Premium 2,186 2,186 0100015. 1958 CSO 4.5%-3.5% Net Premium 240,643 240,643 0100016. 1958 CSO 4.5%-3.5% CRVM 180,825 180,825 0100017. 1958 CSO 4.5% Net Premium 3,374,859 3,374,859 0100018. 1958 CSO 4.5% CRVM 12,026,980 12,026,980 0100019. 1958 CSO 4.0% Net Premium 12,632,910 12,632,910 0100020. 1958 CSO 4.0% CRVM 55,619,289 55,619,289 0100021. 1958 CSO 4.0%-3.0% Net Premium 10,408,316 10,408,316 0100022. 1958 CSO 4.0%-3.0% CRVM 25,388,275 25,388,275 0100023. 1958 CSO 3.5% Net Premium 3,050,206 3,050,206 0100024. 1958 CSO 3.5% CRVM 3,459,004 3,459,004 0100025. 1958 CSO 3.0% Net Premium 2,764,921 2,716,448 48,473 0100026. 1958 CSO 3.0% CRVM 1,949,177 1,949,177 0100027. 1958 CSO 2.5% Net Premium 70,856,156 70,856,156 0100028. 1958 CSO 2.5% CRVM 5,309,483 5,309,483 0100029. 1958 CSO 2.25% Net Premium 9,860,720 9,860,720 0100030. 1958 CSO 2.25% CRVM 79,909 79,909 0100031. 1958 CET 5.5% Net Premium 770 770 0100032. 1958 CET 4.0% Net Premium 46,044 46,044 0100033. 1958 CET 4.0%-3.0% Net Premium 6,861 6,861 0100034. 1958 CET 3.5% Net Premium 154,999 154,999 0100035. 1958 CET 3.0% Net Premium 80,770 74,434 6,336 0100036. 1958 CET 2.5% Net Premium 936,547 936,547 0100037. 1958 CET 2.25% Net Premium 62,662 62,662 0100038. 1960 CSG 2.5% Net Premium 121,741 25,164 96,577 0100039. 1961 CSI 3.0% Net Premium 24,003 24,003 0100040. 1961 CIET 3.0% Net Premium 1,668 1,668 0100041. 1980 CSO 6.0% Net Premium 3 3 0100042. 1980 CSO 6.0% CRVM 6,635,699 6,635,699 0100043. 1980 CSO 5.5% Net Premium 9,295,703 34,402 9,261,301 0100044. 1980 CSO 5.5% CRVM 49,879,680 49,879,680 0100045. 1980 CSO 5.0% Net Premium 80,022,944 77,158,344 2,864,600 0100046. 1980 CSO 5.0% CRVM 238,549,500 238,549,500 0100047. 1980 CSO 4.5% Net Premium 200,443,161 192,857,248 7,585,913 0100048. 1980 CSO 4.5% CRVM 994,442,519 984,616,174 9,826,345 0100049. 1980 CSO 4.0% Net Premium 73,450,825 72,745,470 705,355 0100050. 1980 CSO 4.0% CRVM 64,648,985 64,648,985 0100051. 1980 CSO 3.75%-3.25% Net Premium 3,931 3,931 0100052. 1980 CSO 3.75%-3.25% CRVM 8,951,356 8,951,356 0100053. 1980 CSO 3.5% Net Premium 71,397 36,193 35,204 0100054. 1980 CET 5.0% Net Premium 150,723 132,384 18,339 0100055. 1980 CET 4.5% Net Premium 1,145,714 726,347 419,367 0100056. 1980 CET 4.0% Net Premium 6,231 6,231 0100057. 2001 CSO 4.0% Net Premium 380,792,809 380,239,749 553,060 0100058. 2001 CSO 4.0% CRVM 119,050,168 119,050,168 0100059. 2001 CSO 3.5% Net Premium - NB 255,198,703 254,945,423 253,280 0100060. 2001 CSO 3.5% CRVM - NB 29,835,464 29,835,464 0100061. Unearned Premium Reserve 3,651,655 2,647,410 1,004,245 0199997. Totals (Gross) 2,765,285,935 2,732,581,606 469,976 32,234,353 0199998. Reinsurance ceded 1,013,876,552 1,013,297,334 469,976 109,242 0199999. Life Insurance: Totals (Net) 1,751,409,383 1,719,284,272 32,125,111 ANNUITIES (excluding supplementary contracts with life
contingencies): 0200001. 1983a IAM-TA 9.0% Inc. Pay. 54,232 XXX 54,232 XXX 0200002. 1983a IAM-TA 8.75% Inc. Pay. 761,898 XXX 761,898 XXX 0200003. 1983a IAM-TA 8.25% Inc. Pay. 630,889 XXX 630,889 XXX 0200004. 1983a IAM-TA 8.0% Inc. Pay. 24,363 XXX 24,363 XXX 0200005. 1983a IAM-TA 7.25% Inc. Pay. 897,551 XXX 897,551 XXX 0200006. 1983 GAM-TA 5.35% Inc. Pay. & Def. 25,550,051 XXX XXX 25,550,051 0200007. 1983 GAM-TA 6.5% Inc. Pay. 6,358,050 XXX XXX 6,358,050 0200008. 1983 GAM-TA 7.0% Inc. Pay. 6,670,536 XXX XXX 6,670,536 0200009. 1983 GAM-TA 6.25% Inc. Pay. & Def. 14,795,252 XXX XXX 14,795,252 0200010. 1983 GAM-TA 8.0% Inc. Pay. & Def. 2,736,681 XXX XXX 2,736,681 0200011. 1983 GAM-TA 7.25% Inc. Pay. & Def. 9,971,690 XXX XXX 9,971,690 0200012. 1983 GAM-TA 7.75% Inc. Pay. 8,133,380 XXX XXX 8,133,380 0200013. 1983 GAM-TA 8.25% Inc. Pay. 10,439,287 XXX XXX 10,439,287 0200014. 1983 GAM-TA 8.75% Inc. Pay. 10,510,036 XXX XXX 10,510,036 0200015. 1983 GAM-TA 6.75% Inc. Pay. 15,622,415 XXX XXX 15,622,415 0200016. 1994 GAR-TA 4.00% Inc. Pay. & Def. - NB 10,413,619 XXX XXX 10,413,619 0200017. 1994 GAR-TA 4.25% Inc. Pay. & Def. 5,704,010 XXX XXX 5,704,010 0200018. 1994 GAR-TA 4.50% Inc. Pay. & Def. 2,554,692 XXX XXX 2,554,692 0200019. 1994 GAR-TA 5.0% Inc. Pay. & Def. 2,397,045 XXX XXX 2,397,045 0200020. 1994 GAR-TA 6.5% Inc. Pay. & Def. 11,836,969 XXX XXX 11,836,969 0200021. 1994 GAR-TA 5.25% Inc. Pay. & Def. 14,432,597 XXX XXX 14,432,597 0200022. 1994 GAR-TA 5.5% Inc. Pay. & Def. 13,415,051 XXX XXX 13,415,051 0200023. 1994 GAR-TA 6.75% Inc. Pay. & Def. 7,832,810 XXX XXX 7,832,810 0200024. 1994 GAR-TA 6.0% Inc. Pay. & Def. 17,582,076 XXX XXX 17,582,076 0200025. 1994 GAR-TA 7.0% Inc. Pay. & Def. 10,032,841 XXX XXX 10,032,841
12
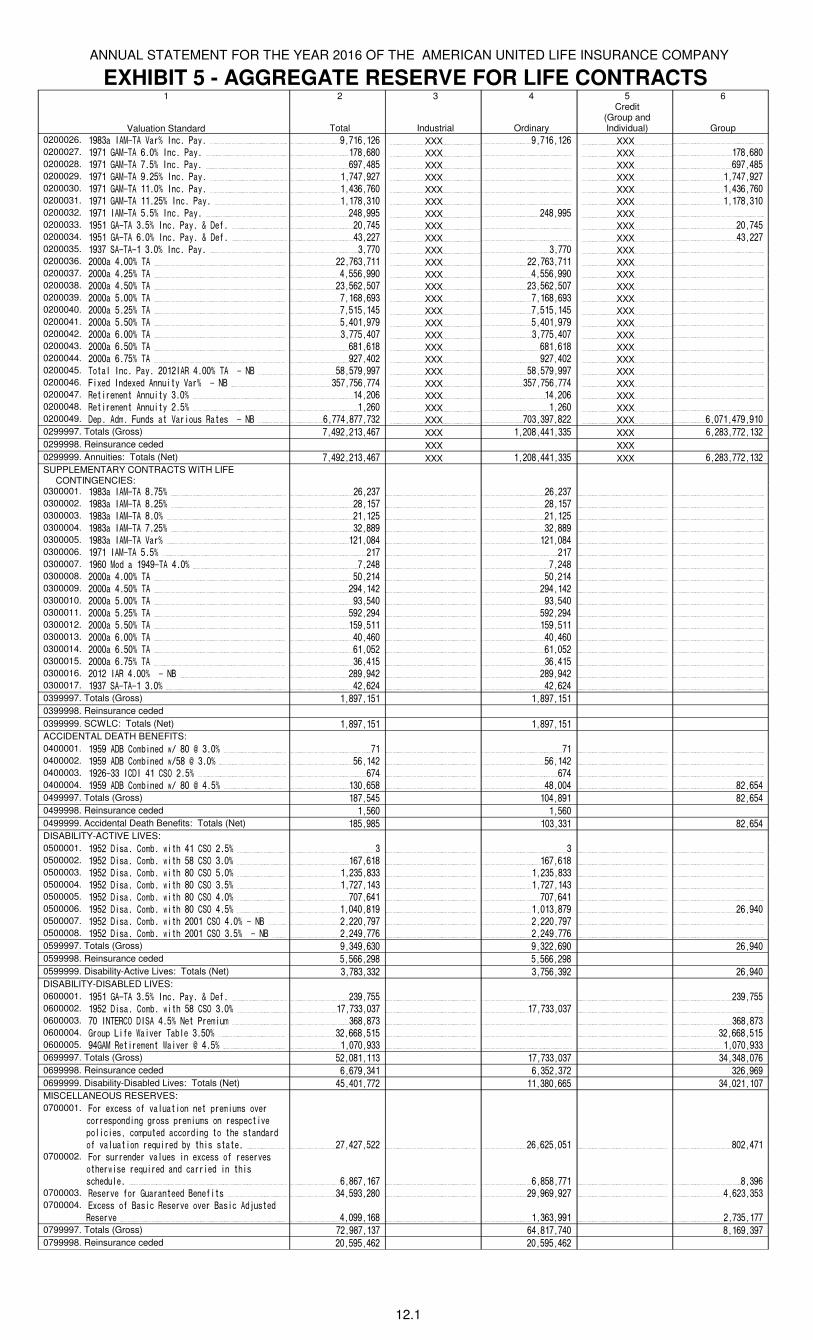
ANNUAL STATEMENT FOR THE YEAR 2016 OF THE AMERICAN UNITED LIFE INSURANCE COMPANY
EXHIBIT 5 - AGGREGATE RESERVE FOR LIFE CONTRACTS1
Valuation Standard
2
Total
3
Industrial
4
Ordinary
5Credit
(Group and Individual)
6
Group
0200026. 1983a IAM-TA Var% Inc. Pay. 9,716,126 XXX 9,716,126 XXX 0200027. 1971 GAM-TA 6.0% Inc. Pay. 178,680 XXX XXX 178,680 0200028. 1971 GAM-TA 7.5% Inc. Pay. 697,485 XXX XXX 697,485 0200029. 1971 GAM-TA 9.25% Inc. Pay. 1,747,927 XXX XXX 1,747,927 0200030. 1971 GAM-TA 11.0% Inc. Pay. 1,436,760 XXX XXX 1,436,760 0200031. 1971 GAM-TA 11.25% Inc. Pay. 1,178,310 XXX XXX 1,178,310 0200032. 1971 IAM-TA 5.5% Inc. Pay. 248,995 XXX 248,995 XXX 0200033. 1951 GA-TA 3.5% Inc. Pay. & Def. 20,745 XXX XXX 20,745 0200034. 1951 GA-TA 6.0% Inc. Pay. & Def. 43,227 XXX XXX 43,227 0200035. 1937 SA-TA-1 3.0% Inc. Pay. 3,770 XXX 3,770 XXX 0200036. 2000a 4.00% TA 22,763,711 XXX 22,763,711 XXX 0200037. 2000a 4.25% TA 4,556,990 XXX 4,556,990 XXX 0200038. 2000a 4.50% TA 23,562,507 XXX 23,562,507 XXX 0200039. 2000a 5.00% TA 7,168,693 XXX 7,168,693 XXX 0200040. 2000a 5.25% TA 7,515,145 XXX 7,515,145 XXX 0200041. 2000a 5.50% TA 5,401,979 XXX 5,401,979 XXX 0200042. 2000a 6.00% TA 3,775,407 XXX 3,775,407 XXX 0200043. 2000a 6.50% TA 681,618 XXX 681,618 XXX 0200044. 2000a 6.75% TA 927,402 XXX 927,402 XXX 0200045. Total Inc. Pay. 2012IAR 4.00% TA - NB 58,579,997 XXX 58,579,997 XXX 0200046. Fixed Indexed Annuity Var% - NB 357,756,774 XXX 357,756,774 XXX 0200047. Retirement Annuity 3.0% 14,206 XXX 14,206 XXX 0200048. Retirement Annuity 2.5% 1,260 XXX 1,260 XXX 0200049. Dep. Adm. Funds at Various Rates - NB 6,774,877,732 XXX 703,397,822 XXX 6,071,479,910 0299997. Totals (Gross) 7,492,213,467 XXX 1,208,441,335 XXX 6,283,772,132 0299998. Reinsurance ceded XXX XXX 0299999. Annuities: Totals (Net) 7,492,213,467 XXX 1,208,441,335 XXX 6,283,772,132 SUPPLEMENTARY CONTRACTS WITH LIFE
CONTINGENCIES: 0300001. 1983a IAM-TA 8.75% 26,237 26,237 0300002. 1983a IAM-TA 8.25% 28,157 28,157 0300003. 1983a IAM-TA 8.0% 21,125 21,125 0300004. 1983a IAM-TA 7.25% 32,889 32,889 0300005. 1983a IAM-TA Var% 121,084 121,084 0300006. 1971 IAM-TA 5.5% 217 217 0300007. 1960 Mod a 1949-TA 4.0% 7,248 7,248 0300008. 2000a 4.00% TA 50,214 50,214 0300009. 2000a 4.50% TA 294,142 294,142 0300010. 2000a 5.00% TA 93,540 93,540 0300011. 2000a 5.25% TA 592,294 592,294 0300012. 2000a 5.50% TA 159,511 159,511 0300013. 2000a 6.00% TA 40,460 40,460 0300014. 2000a 6.50% TA 61,052 61,052 0300015. 2000a 6.75% TA 36,415 36,415 0300016. 2012 IAR 4.00% - NB 289,942 289,942 0300017. 1937 SA-TA-1 3.0% 42,624 42,624 0399997. Totals (Gross) 1,897,151 1,897,151 0399998. Reinsurance ceded 0399999. SCWLC: Totals (Net) 1,897,151 1,897,151 ACCIDENTAL DEATH BENEFITS:
0400001. 1959 ADB Combined w/ 80 @ 3.0% 71 71 0400002. 1959 ADB Combined w/58 @ 3.0% 56,142 56,142 0400003. 1926-33 ICDI 41 CSO 2.5% 674 674 0400004. 1959 ADB Combined w/ 80 @ 4.5% 130,658 48,004 82,654 0499997. Totals (Gross) 187,545 104,891 82,654 0499998. Reinsurance ceded 1,560 1,560 0499999. Accidental Death Benefits: Totals (Net) 185,985 103,331 82,654 DISABILITY-ACTIVE LIVES:
0500001. 1952 Disa. Comb. with 41 CSO 2.5% 3 3 0500002. 1952 Disa. Comb. with 58 CSO 3.0% 167,618 167,618 0500003. 1952 Disa. Comb. with 80 CSO 5.0% 1,235,833 1,235,833 0500004. 1952 Disa. Comb. with 80 CSO 3.5% 1,727,143 1,727,143 0500005. 1952 Disa. Comb. with 80 CSO 4.0% 707,641 707,641 0500006. 1952 Disa. Comb. with 80 CSO 4.5% 1,040,819 1,013,879 26,940 0500007. 1952 Disa. Comb. with 2001 CSO 4.0% - NB 2,220,797 2,220,797 0500008. 1952 Disa. Comb. with 2001 CSO 3.5% - NB 2,249,776 2,249,776 0599997. Totals (Gross) 9,349,630 9,322,690 26,940 0599998. Reinsurance ceded 5,566,298 5,566,298 0599999. Disability-Active Lives: Totals (Net) 3,783,332 3,756,392 26,940 DISABILITY-DISABLED LIVES:
0600001. 1951 GA-TA 3.5% Inc. Pay. & Def. 239,755 239,755 0600002. 1952 Disa. Comb. with 58 CSO 3.0% 17,733,037 17,733,037 0600003. 70 INTERCO DISA 4.5% Net Premium 368,873 368,873 0600004. Group Life Waiver Table 3.50% 32,668,515 32,668,515 0600005. 94GAM Retirement Waiver @ 4.5% 1,070,933 1,070,933 0699997. Totals (Gross) 52,081,113 17,733,037 34,348,076 0699998. Reinsurance ceded 6,679,341 6,352,372 326,969 0699999. Disability-Disabled Lives: Totals (Net) 45,401,772 11,380,665 34,021,107 MISCELLANEOUS RESERVES:
0700001. For excess of valuation net premiums over
corresponding gross premiums on respective
policies, computed according to the standard
of valuation required by this state. 27,427,522 26,625,051 802,471 0700002. For surrender values in excess of reserves
otherwise required and carried in this
schedule. 6,867,167 6,858,771 8,396 0700003. Reserve for Guaranteed Benefits 34,593,280 29,969,927 4,623,353 0700004. Excess of Basic Reserve over Basic Adjusted
Reserve 4,099,168 1,363,991 2,735,177 0799997. Totals (Gross) 72,987,137 64,817,740 8,169,397 0799998. Reinsurance ceded 20,595,462 20,595,462
12.1
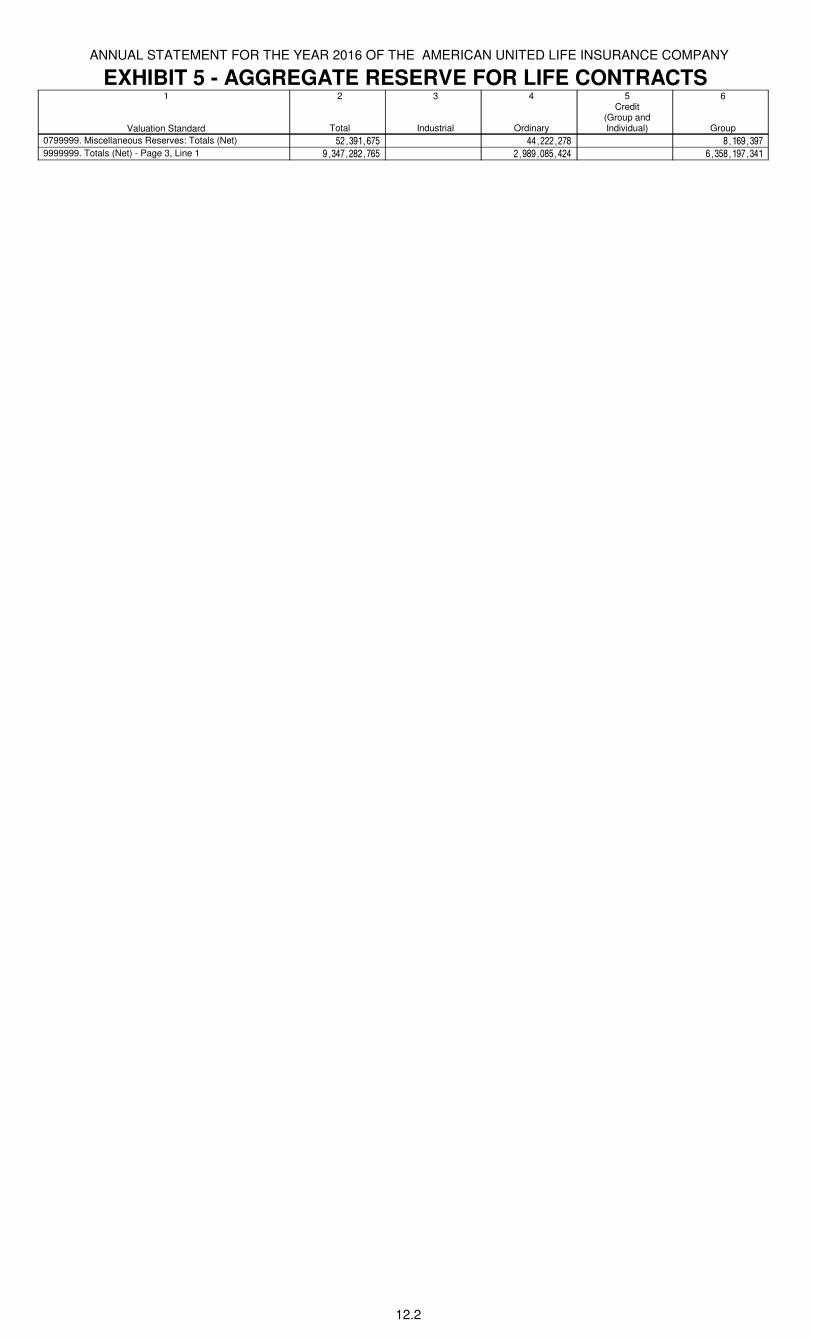
ANNUAL STATEMENT FOR THE YEAR 2016 OF THE AMERICAN UNITED LIFE INSURANCE COMPANY
EXHIBIT 5 - AGGREGATE RESERVE FOR LIFE CONTRACTS1
Valuation Standard
2
Total
3
Industrial
4
Ordinary
5Credit
(Group and Individual)
6
Group
0799999. Miscellaneous Reserves: Totals (Net) 52,391,675 44,222,278 8,169,397
9999999. Totals (Net) - Page 3, Line 1 9,347,282,765 2,989,085,424 6,358,197,341
12.2
ANNUAL STATEMENT FOR THE YEAR 2016 OF THE AMERICAN UNITED LIFE INSURANCE COMPANY
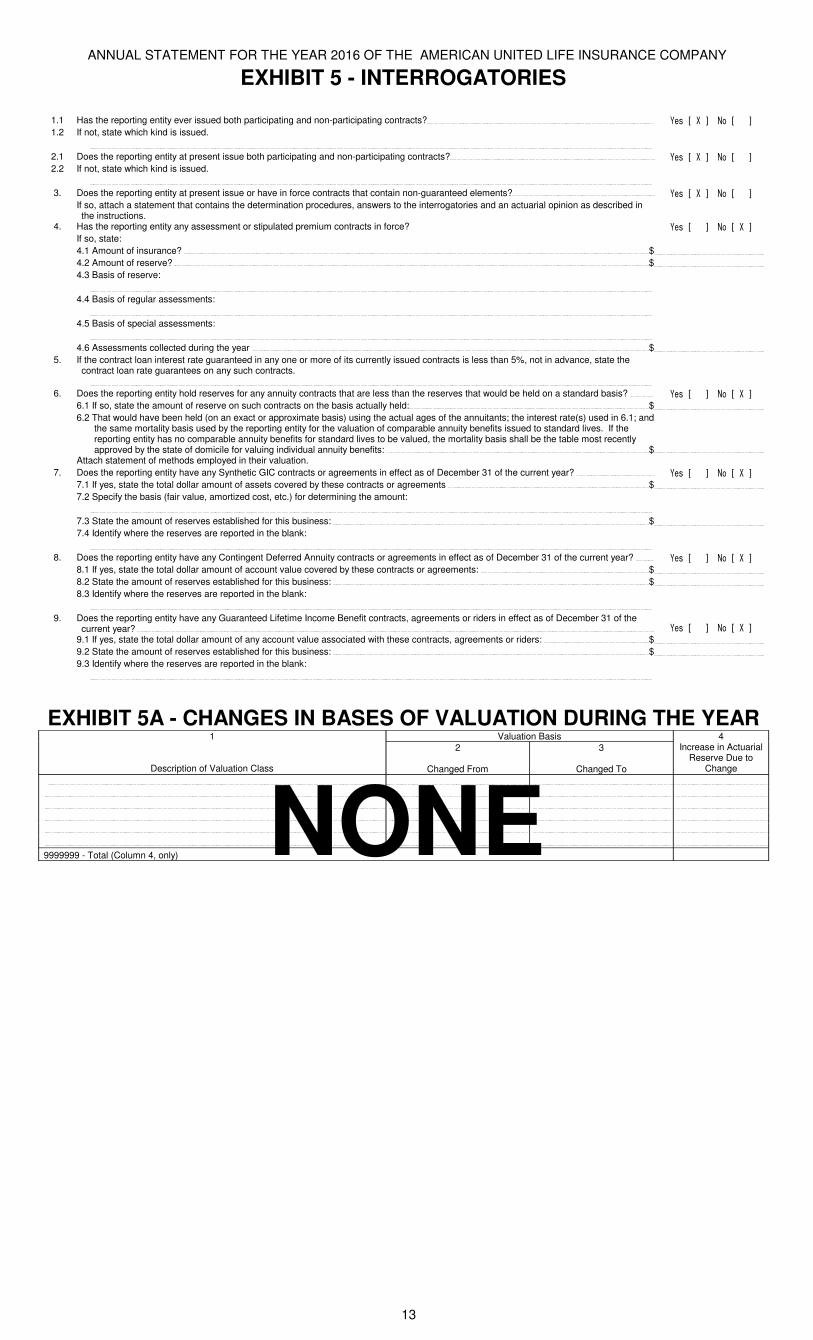
EXHIBIT 5 - INTERROGATORIES
1.1 Has the reporting entity ever issued both participating and non-participating contracts? Yes [ X ] No [ ]
1.2 If not, state which kind is issued.
2.1 Does the reporting entity at present issue both participating and non-participating contracts? Yes [ X ] No [ ]
2.2 If not, state which kind is issued.
3. Does the reporting entity at present issue or have in force contracts that contain non-guaranteed elements? Yes [ X ] No [ ]
If so, attach a statement that contains the determination procedures, answers to the interrogatories and an actuarial opinion as described in the instructions.
4. Has the reporting entity any assessment or stipulated premium contracts in force? Yes [ ] No [ X ]
If so, state:
4.1 Amount of insurance? $
4.2 Amount of reserve? $
4.3 Basis of reserve:
4.4 Basis of regular assessments:
4.5 Basis of special assessments:
4.6 Assessments collected during the year $
5. If the contract loan interest rate guaranteed in any one or more of its currently issued contracts is less than 5%, not in advance, state the contract loan rate guarantees on any such contracts.
6. Does the reporting entity hold reserves for any annuity contracts that are less than the reserves that would be held on a standard basis? Yes [ ] No [ X ]
6.1 If so, state the amount of reserve on such contracts on the basis actually held: $
6.2 That would have been held (on an exact or approximate basis) using the actual ages of the annuitants; the interest rate(s) used in 6.1; and the same mortality basis used by the reporting entity for the valuation of comparable annuity benefits issued to standard lives. If the reporting entity has no comparable annuity benefits for standard lives to be valued, the mortality basis shall be the table most recently approved by the state of domicile for valuing individual annuity benefits: $
Attach statement of methods employed in their valuation.
7. Does the reporting entity have any Synthetic GIC contracts or agreements in effect as of December 31 of the current year? Yes [ ] No [ X ]
7.1 If yes, state the total dollar amount of assets covered by these contracts or agreements $
7.2 Specify the basis (fair value, amortized cost, etc.) for determining the amount:
7.3 State the amount of reserves established for this business: $
7.4 Identify where the reserves are reported in the blank:
8. Does the reporting entity have any Contingent Deferred Annuity contracts or agreements in effect as of December 31 of the current year? Yes [ ] No [ X ]
8.1 If yes, state the total dollar amount of account value covered by these contracts or agreements: $
8.2 State the amount of reserves established for this business: $
8.3 Identify where the reserves are reported in the blank:
9. Does the reporting entity have any Guaranteed Lifetime Income Benefit contracts, agreements or riders in effect as of December 31 of the current year? Yes [ ] No [ X ]
9.1 If yes, state the total dollar amount of any account value associated with these contracts, agreements or riders: $
9.2 State the amount of reserves established for this business: $
9.3 Identify where the reserves are reported in the blank:
EXHIBIT 5A - CHANGES IN BASES OF VALUATION DURING THE YEAR1 Valuation Basis 4
Description of Valuation Class
2
Changed From
3
Changed To
Increase in Actuarial Reserve Due to
Change
9999999 - Total (Column 4, only) NONE
13
ANNUAL STATEMENT FOR THE YEAR 2016 OF THE AMERICAN UNITED LIFE INSURANCE COMPANY
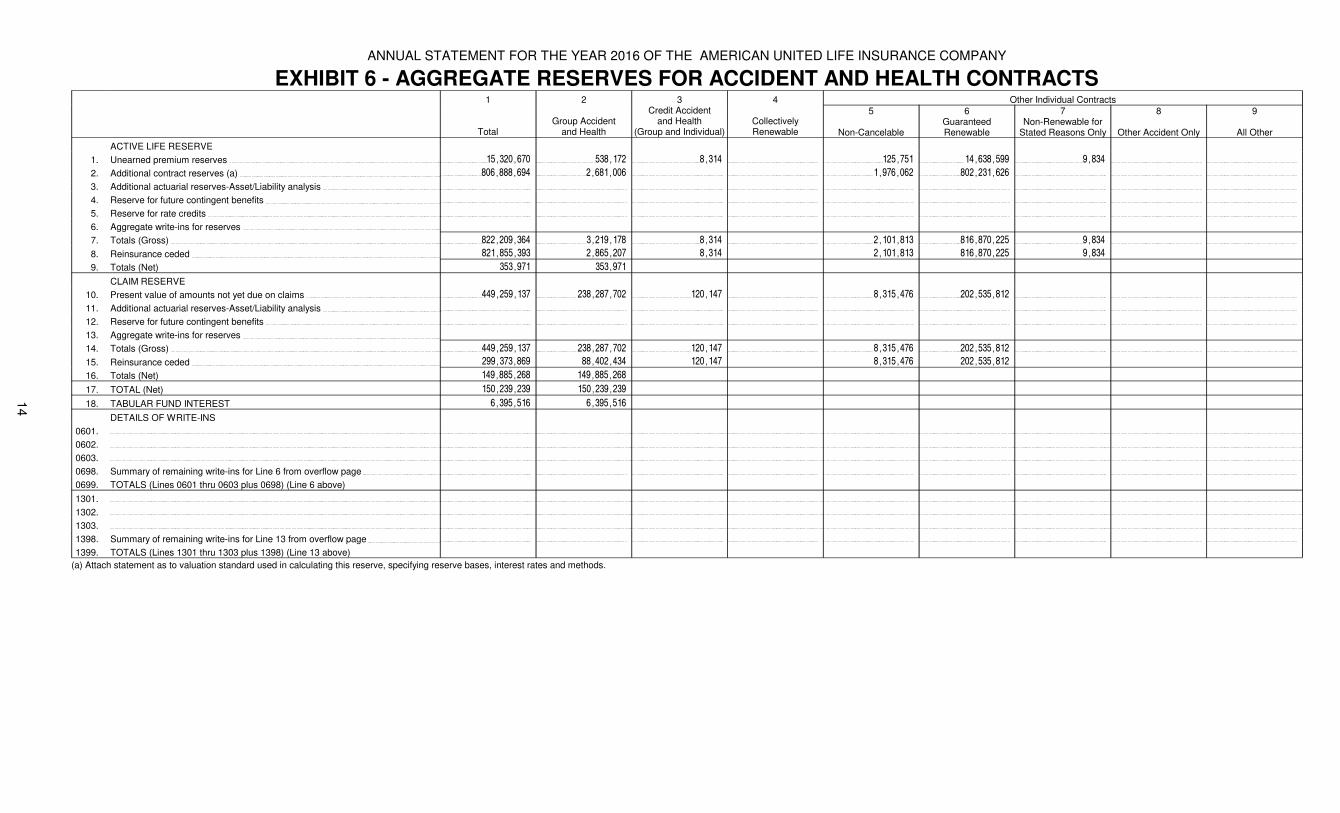
EXHIBIT 6 - AGGREGATE RESERVES FOR ACCIDENT AND HEALTH CONTRACTS1 2 3 4 Other Individual Contracts
TotalGroup Accident
and Health
Credit Accidentand Health
(Group and Individual)CollectivelyRenewable
5
Non-Cancelable
6Guaranteed Renewable
7Non-Renewable for
Stated Reasons Only
8
Other Accident Only
9
All Other
ACTIVE LIFE RESERVE
1. Unearned premium reserves 15,320,670 538,172 8,314 125,751 14,638,599 9,834
2. Additional contract reserves (a) 806,888,694 2,681,006 1,976,062 802,231,626
3. Additional actuarial reserves-Asset/Liability analysis
4. Reserve for future contingent benefits
5. Reserve for rate credits
6. Aggregate write-ins for reserves
7. Totals (Gross) 822,209,364 3,219,178 8,314 2,101,813 816,870,225 9,834
8. Reinsurance ceded 821,855,393 2,865,207 8,314 2,101,813 816,870,225 9,834
9. Totals (Net) 353,971 353,971
CLAIM RESERVE
10. Present value of amounts not yet due on claims 449,259,137 238,287,702 120,147 8,315,476 202,535,812
11. Additional actuarial reserves-Asset/Liability analysis
12. Reserve for future contingent benefits
13. Aggregate write-ins for reserves
14. Totals (Gross) 449,259,137 238,287,702 120,147 8,315,476 202,535,812
15. Reinsurance ceded 299,373,869 88,402,434 120,147 8,315,476 202,535,812
16. Totals (Net) 149,885,268 149,885,268
17. TOTAL (Net) 150,239,239 150,239,239
18. TABULAR FUND INTEREST 6,395,516 6,395,516
DETAILS OF WRITE-INS
0601.
0602.
0603.
0698. Summary of remaining write-ins for Line 6 from overflow page
0699. TOTALS (Lines 0601 thru 0603 plus 0698) (Line 6 above)
1301.
1302.
1303.
1398. Summary of remaining write-ins for Line 13 from overflow page
1399. TOTALS (Lines 1301 thru 1303 plus 1398) (Line 13 above)
(a) Attach statement as to valuation standard used in calculating this reserve, specifying reserve bases, interest rates and methods.
14
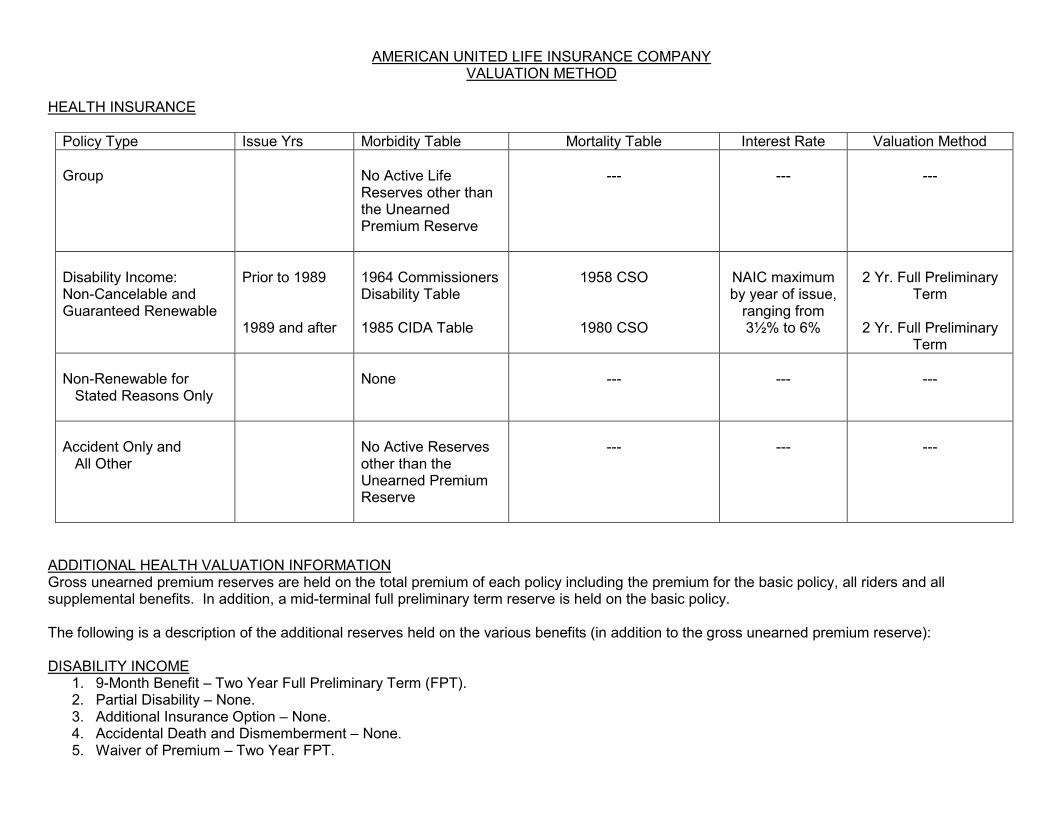
AMERICAN UNITED LIFE INSURANCE COMPANY VALUATION METHOD
HEALTH INSURANCE
Policy Type Issue Yrs Morbidity Table Mortality Table Interest Rate Valuation Method
Group
No Active Life Reserves other than the Unearned Premium Reserve
---
---
---
Disability Income: Non-Cancelable and Guaranteed Renewable
Prior to 1989 1989 and after
1964 Commissioners Disability Table 1985 CIDA Table
1958 CSO
1980 CSO
NAIC maximum by year of issue,
ranging from 3½% to 6%
2 Yr. Full Preliminary
Term
2 Yr. Full Preliminary Term
Non-Renewable for Stated Reasons Only
None
---
---
---
Accident Only and All Other
No Active Reserves other than the Unearned Premium Reserve
---
---
---
ADDITIONAL HEALTH VALUATION INFORMATION Gross unearned premium reserves are held on the total premium of each policy including the premium for the basic policy, all riders and all supplemental benefits. In addition, a mid-terminal full preliminary term reserve is held on the basic policy. The following is a description of the additional reserves held on the various benefits (in addition to the gross unearned premium reserve): DISABILITY INCOME
1. 9-Month Benefit – Two Year Full Preliminary Term (FPT). 2. Partial Disability – None. 3. Additional Insurance Option – None. 4. Accidental Death and Dismemberment – None. 5. Waiver of Premium – Two Year FPT.
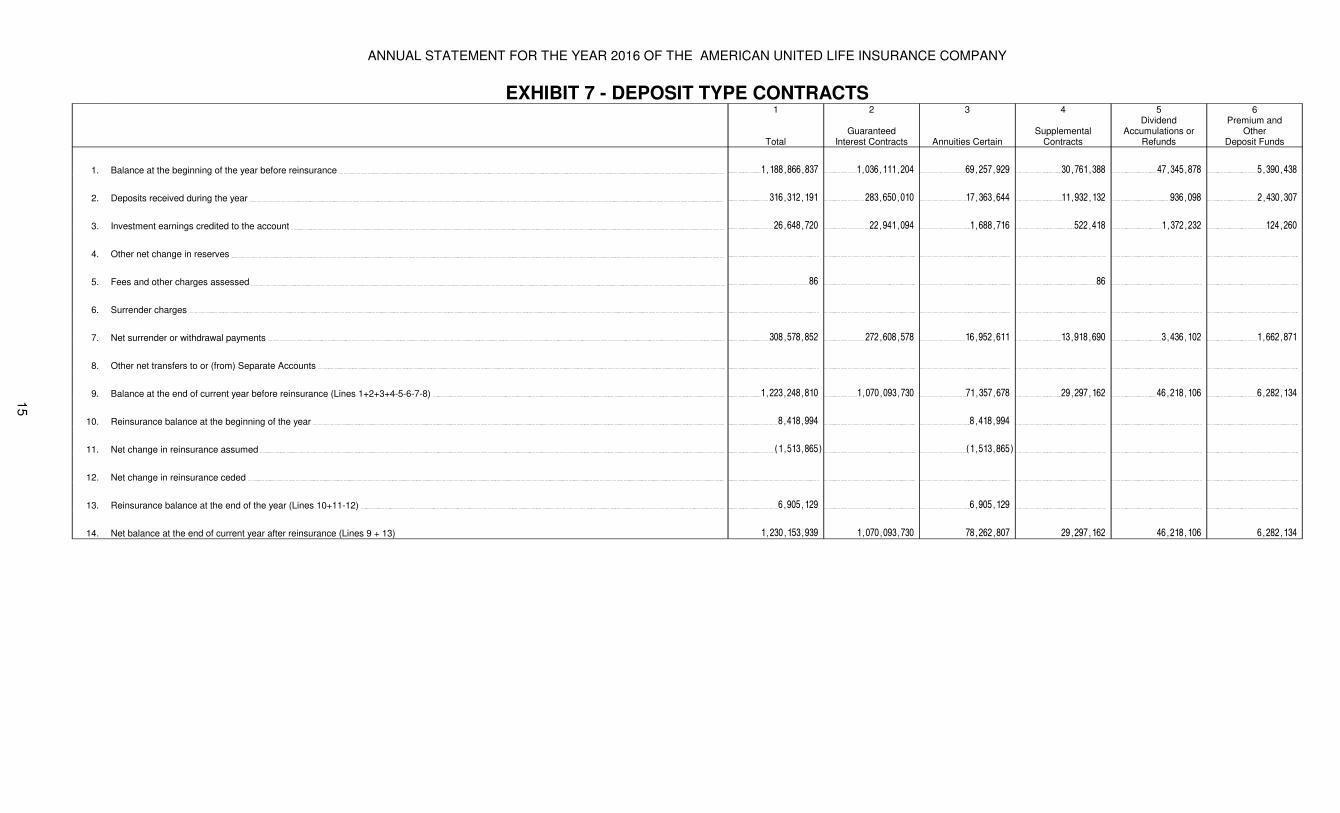
ANNUAL STATEMENT FOR THE YEAR 2016 OF THE AMERICAN UNITED LIFE INSURANCE COMPANY
EXHIBIT 7 - DEPOSIT TYPE CONTRACTS1
Total
2
GuaranteedInterest Contracts
3
Annuities Certain
4
Supplemental Contracts
5Dividend
Accumulations or Refunds
6Premium and
OtherDeposit Funds
1. Balance at the beginning of the year before reinsurance 1,188,866,837 1,036,111,204 69,257,929 30,761,388 47,345,878 5,390,438
2. Deposits received during the year 316,312,191 283,650,010 17,363,644 11,932,132 936,098 2,430,307
3. Investment earnings credited to the account 26,648,720 22,941,094 1,688,716 522,418 1,372,232 124,260
4. Other net change in reserves
5. Fees and other charges assessed 86 86
6. Surrender charges
7. Net surrender or withdrawal payments 308,578,852 272,608,578 16,952,611 13,918,690 3,436,102 1,662,871
8. Other net transfers to or (from) Separate Accounts
9. Balance at the end of current year before reinsurance (Lines 1+2+3+4-5-6-7-8) 1,223,248,810 1,070,093,730 71,357,678 29,297,162 46,218,106 6,282,134
10. Reinsurance balance at the beginning of the year 8,418,994 8,418,994
11. Net change in reinsurance assumed (1,513,865) (1,513,865)
12. Net change in reinsurance ceded
13. Reinsurance balance at the end of the year (Lines 10+11-12) 6,905,129 6,905,129
14. Net balance at the end of current year after reinsurance (Lines 9 + 13) 1,230,153,939 1,070,093,730 78,262,807 29,297,162 46,218,106 6,282,134
15
ANNUAL STATEMENT FOR THE YEAR 2016 OF THE AMERICAN UNITED LIFE INSURANCE COMPANY
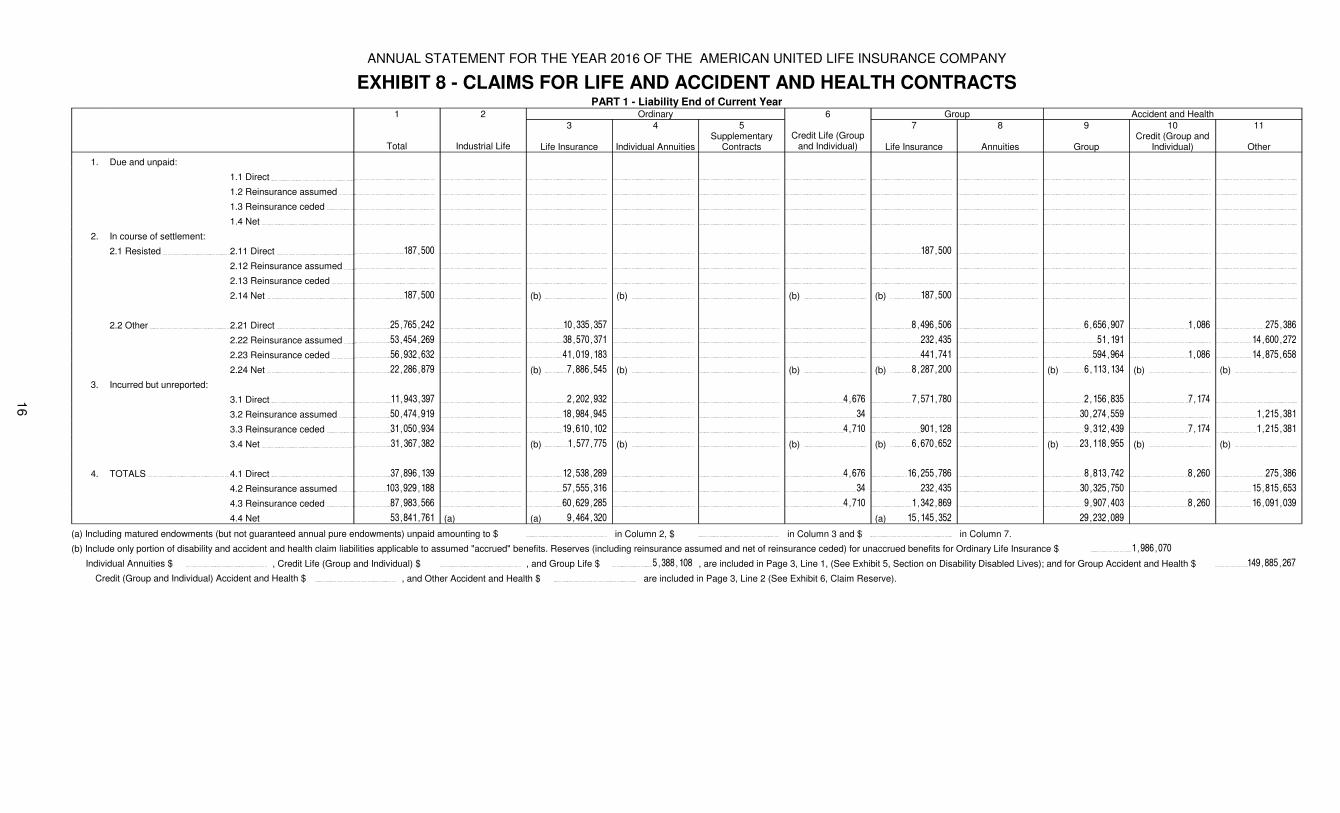
EXHIBIT 8 - CLAIMS FOR LIFE AND ACCIDENT AND HEALTH CONTRACTSPART 1 - Liability End of Current Year
1 2 Ordinary 6 Group Accident and Health
Total Industrial Life
3
Life Insurance
4
Individual Annuities
5Supplementary
ContractsCredit Life (Group
and Individual)
7
Life Insurance
8
Annuities
9
Group
10Credit (Group and
Individual)
11
Other
1. Due and unpaid:
1.1 Direct
1.2 Reinsurance assumed
1.3 Reinsurance ceded
1.4 Net
2. In course of settlement:
2.1 Resisted 2.11 Direct 187,500 187,500
2.12 Reinsurance assumed
2.13 Reinsurance ceded
2.14 Net 187,500 (b) (b) (b) (b) 187,500
2.2 Other 2.21 Direct 25,765,242 10,335,357 8,496,506 6,656,907 1,086 275,386
2.22 Reinsurance assumed 53,454,269 38,570,371 232,435 51,191 14,600,272
2.23 Reinsurance ceded 56,932,632 41,019,183 441,741 594,964 1,086 14,875,658
2.24 Net 22,286,879 (b) 7,886,545 (b) (b) (b) 8,287,200 (b) 6,113,134 (b) (b)
3. Incurred but unreported:
3.1 Direct 11,943,397 2,202,932 4,676 7,571,780 2,156,835 7,174
3.2 Reinsurance assumed 50,474,919 18,984,945 34 30,274,559 1,215,381
3.3 Reinsurance ceded 31,050,934 19,610,102 4,710 901,128 9,312,439 7,174 1,215,381
3.4 Net 31,367,382 (b) 1,577,775 (b) (b) (b) 6,670,652 (b) 23,118,955 (b) (b)
4. TOTALS 4.1 Direct 37,896,139 12,538,289 4,676 16,255,786 8,813,742 8,260 275,386
4.2 Reinsurance assumed 103,929,188 57,555,316 34 232,435 30,325,750 15,815,653
4.3 Reinsurance ceded 87,983,566 60,629,285 4,710 1,342,869 9,907,403 8,260 16,091,039
4.4 Net 53,841,761 (a) (a) 9,464,320 (a) 15,145,352 29,232,089
(a) Including matured endowments (but not guaranteed annual pure endowments) unpaid amounting to $ in Column 2, $ in Column 3 and $ in Column 7.
(b) Include only portion of disability and accident and health claim liabilities applicable to assumed "accrued" benefits. Reserves (including reinsurance assumed and net of reinsurance ceded) for unaccrued benefits for Ordinary Life Insurance $ 1,986,070
Individual Annuities $ , Credit Life (Group and Individual) $ , and Group Life $ 5,388,108 , are included in Page 3, Line 1, (See Exhibit 5, Section on Disability Disabled Lives); and for Group Accident and Health $ 149,885,267
Credit (Group and Individual) Accident and Health $ , and Other Accident and Health $ are included in Page 3, Line 2 (See Exhibit 6, Claim Reserve).
16
ANNUAL STATEMENT FOR THE YEAR 2016 OF THE AMERICAN UNITED LIFE INSURANCE COMPANY
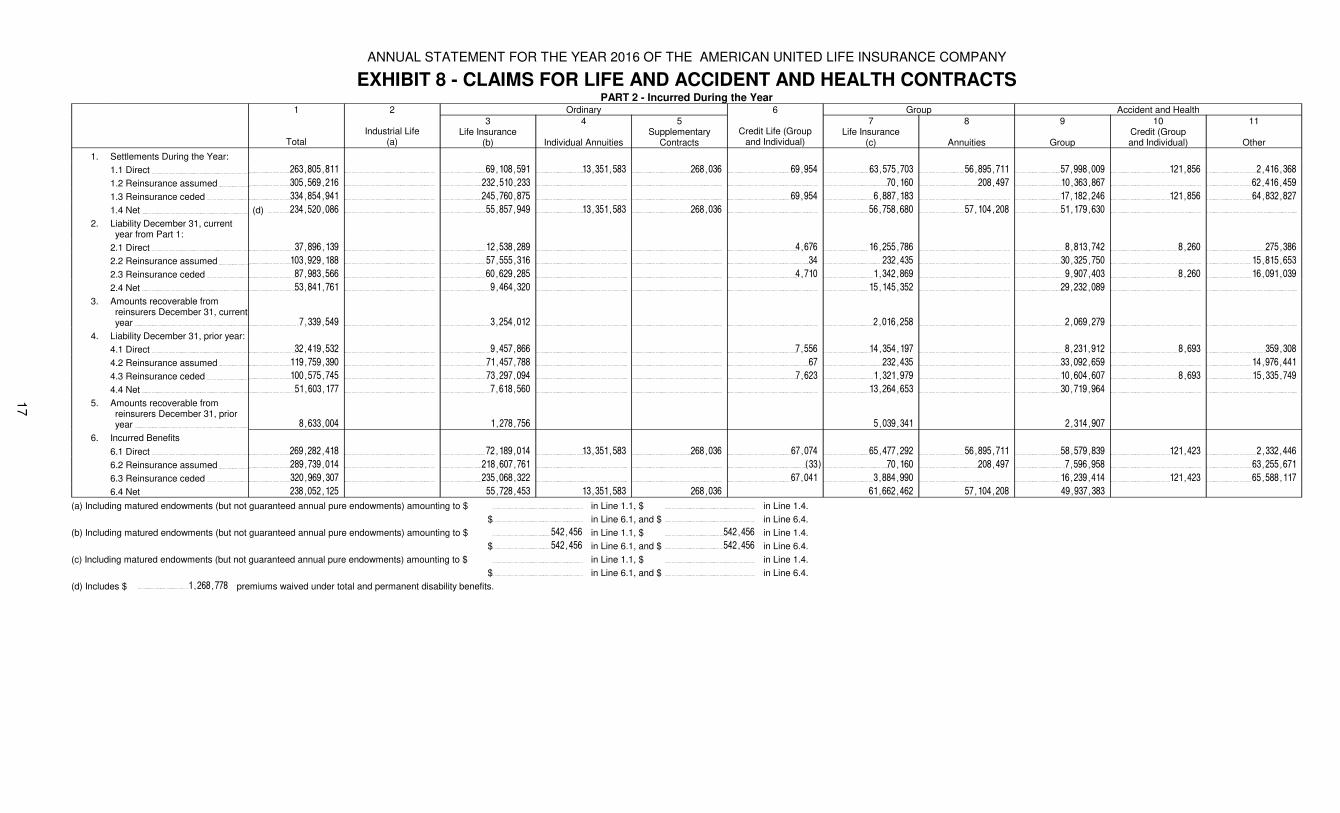
EXHIBIT 8 - CLAIMS FOR LIFE AND ACCIDENT AND HEALTH CONTRACTSPART 2 - Incurred During the Year
1 2 Ordinary 6 Group Accident and Health
TotalIndustrial Life
(a)
3Life Insurance
(b)
4
Individual Annuities
5Supplementary
ContractsCredit Life (Group
and Individual)
7Life Insurance
(c)
8
Annuities
9
Group
10Credit (Groupand Individual)
11
Other
1. Settlements During the Year:
1.1 Direct 263,805,811 69,108,591 13,351,583 268,036 69,954 63,575,703 56,895,711 57,998,009 121,856 2,416,368
1.2 Reinsurance assumed 305,569,216 232,510,233 70,160 208,497 10,363,867 62,416,459
1.3 Reinsurance ceded 334,854,941 245,760,875 69,954 6,887,183 17,182,246 121,856 64,832,827
1.4 Net (d) 234,520,086 55,857,949 13,351,583 268,036 56,758,680 57,104,208 51,179,630
2. Liability December 31, current year from Part 1:
2.1 Direct 37,896,139 12,538,289 4,676 16,255,786 8,813,742 8,260 275,386
2.2 Reinsurance assumed 103,929,188 57,555,316 34 232,435 30,325,750 15,815,653
2.3 Reinsurance ceded 87,983,566 60,629,285 4,710 1,342,869 9,907,403 8,260 16,091,039
2.4 Net 53,841,761 9,464,320 15,145,352 29,232,089
3. Amounts recoverable from reinsurers December 31, current year 7,339,549 3,254,012 2,016,258 2,069,279
4. Liability December 31, prior year:
4.1 Direct 32,419,532 9,457,866 7,556 14,354,197 8,231,912 8,693 359,308
4.2 Reinsurance assumed 119,759,390 71,457,788 67 232,435 33,092,659 14,976,441
4.3 Reinsurance ceded 100,575,745 73,297,094 7,623 1,321,979 10,604,607 8,693 15,335,749
4.4 Net 51,603,177 7,618,560 13,264,653 30,719,964
5. Amounts recoverable from reinsurers December 31, prior year 8,633,004 1,278,756 5,039,341 2,314,907
6. Incurred Benefits
6.1 Direct 269,282,418 72,189,014 13,351,583 268,036 67,074 65,477,292 56,895,711 58,579,839 121,423 2,332,446
6.2 Reinsurance assumed 289,739,014 218,607,761 (33) 70,160 208,497 7,596,958 63,255,671
6.3 Reinsurance ceded 320,969,307 235,068,322 67,041 3,884,990 16,239,414 121,423 65,588,117
6.4 Net 238,052,125 55,728,453 13,351,583 268,036 61,662,462 57,104,208 49,937,383
(a) Including matured endowments (but not guaranteed annual pure endowments) amounting to $ in Line 1.1, $ in Line 1.4.
$ in Line 6.1, and $ in Line 6.4.
(b) Including matured endowments (but not guaranteed annual pure endowments) amounting to $ 542,456 in Line 1.1, $ 542,456 in Line 1.4.
$ 542,456 in Line 6.1, and $ 542,456 in Line 6.4.
(c) Including matured endowments (but not guaranteed annual pure endowments) amounting to $ in Line 1.1, $ in Line 1.4.
$ in Line 6.1, and $ in Line 6.4.
(d) Includes $ 1,268,778 premiums waived under total and permanent disability benefits.
17
ANNUAL STATEMENT FOR THE YEAR 2016 OF THE AMERICAN UNITED LIFE INSURANCE COMPANY
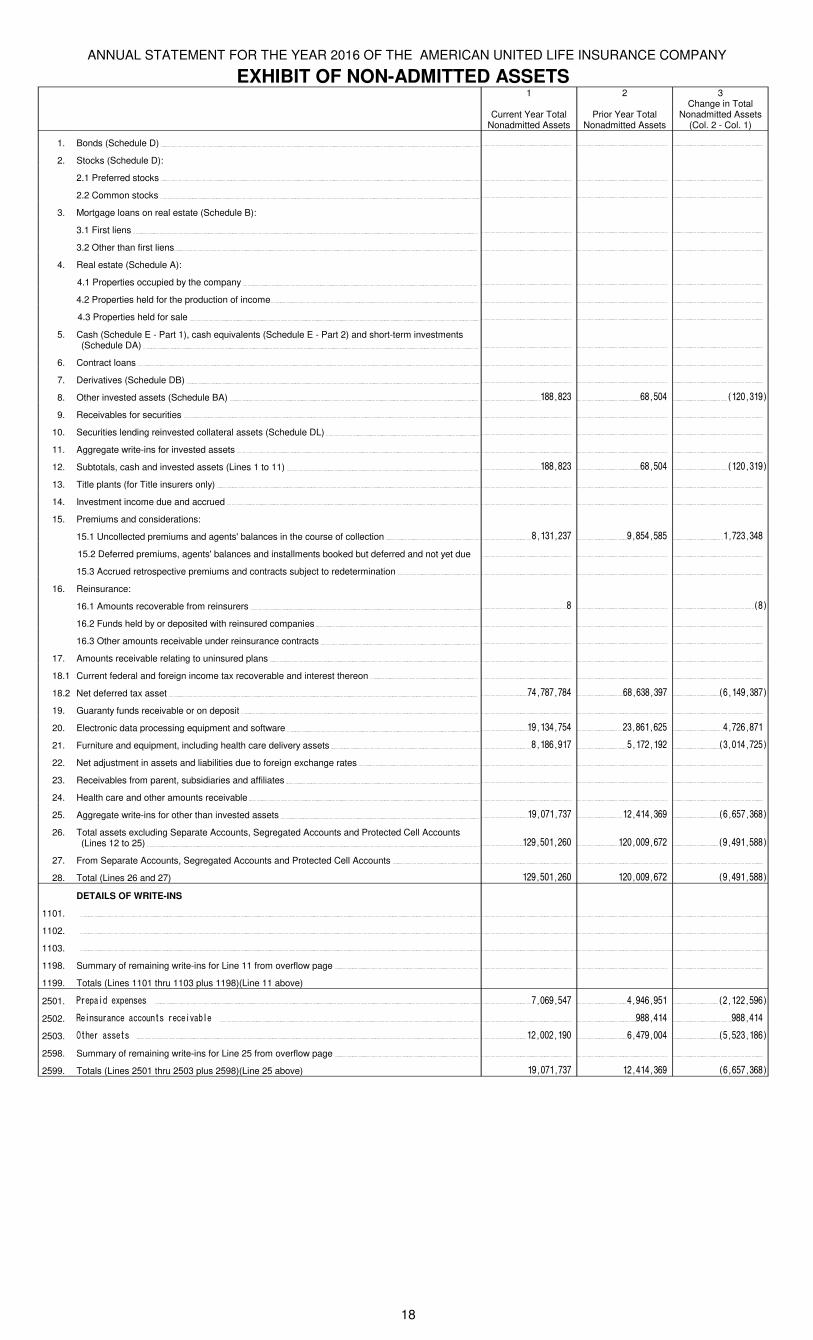
EXHIBIT OF NON-ADMITTED ASSETS1
Current Year Total Nonadmitted Assets
2
Prior Year Total Nonadmitted Assets
3Change in Total
Nonadmitted Assets (Col. 2 - Col. 1)
1. Bonds (Schedule D)
2. Stocks (Schedule D):
2.1 Preferred stocks
2.2 Common stocks
3. Mortgage loans on real estate (Schedule B):
3.1 First liens
3.2 Other than first liens
4. Real estate (Schedule A):
4.1 Properties occupied by the company
4.2 Properties held for the production of income
4.3 Properties held for sale
5. Cash (Schedule E - Part 1), cash equivalents (Schedule E - Part 2) and short-term investments (Schedule DA)
6. Contract loans
7. Derivatives (Schedule DB)
8. Other invested assets (Schedule BA) 188,823 68,504 (120,319)
9. Receivables for securities
10. Securities lending reinvested collateral assets (Schedule DL)
11. Aggregate write-ins for invested assets
12. Subtotals, cash and invested assets (Lines 1 to 11) 188,823 68,504 (120,319)
13. Title plants (for Title insurers only)
14. Investment income due and accrued
15. Premiums and considerations:
15.1 Uncollected premiums and agents' balances in the course of collection 8,131,237 9,854,585 1,723,348
15.2 Deferred premiums, agents' balances and installments booked but deferred and not yet due
15.3 Accrued retrospective premiums and contracts subject to redetermination
16. Reinsurance:
16.1 Amounts recoverable from reinsurers 8 (8)
16.2 Funds held by or deposited with reinsured companies
16.3 Other amounts receivable under reinsurance contracts
17. Amounts receivable relating to uninsured plans
18.1 Current federal and foreign income tax recoverable and interest thereon
18.2 Net deferred tax asset 74,787,784 68,638,397 (6,149,387)
19. Guaranty funds receivable or on deposit
20. Electronic data processing equipment and software 19,134,754 23,861,625 4,726,871
21. Furniture and equipment, including health care delivery assets 8,186,917 5,172,192 (3,014,725)
22. Net adjustment in assets and liabilities due to foreign exchange rates
23. Receivables from parent, subsidiaries and affiliates
24. Health care and other amounts receivable
25. Aggregate write-ins for other than invested assets 19,071,737 12,414,369 (6,657,368)
26. Total assets excluding Separate Accounts, Segregated Accounts and Protected Cell Accounts (Lines 12 to 25) 129,501,260 120,009,672 (9,491,588)
27. From Separate Accounts, Segregated Accounts and Protected Cell Accounts
28. Total (Lines 26 and 27) 129,501,260 120,009,672 (9,491,588)
DETAILS OF WRITE-INS
1101.
1102.
1103.
1198. Summary of remaining write-ins for Line 11 from overflow page
1199. Totals (Lines 1101 thru 1103 plus 1198)(Line 11 above)
2501. Prepaid expenses 7,069,547 4,946,951 (2,122,596)
2502. Reinsurance accounts receivable 988,414 988,414
2503. Other assets 12,002,190 6,479,004 (5,523,186)
2598. Summary of remaining write-ins for Line 25 from overflow page
2599. Totals (Lines 2501 thru 2503 plus 2598)(Line 25 above) 19,071,737 12,414,369 (6,657,368)
18
ANNUAL STATEMENT FOR THE YEAR 2016 OF THE AMERICAN UNITED LIFE INSURANCE COMPANY
19
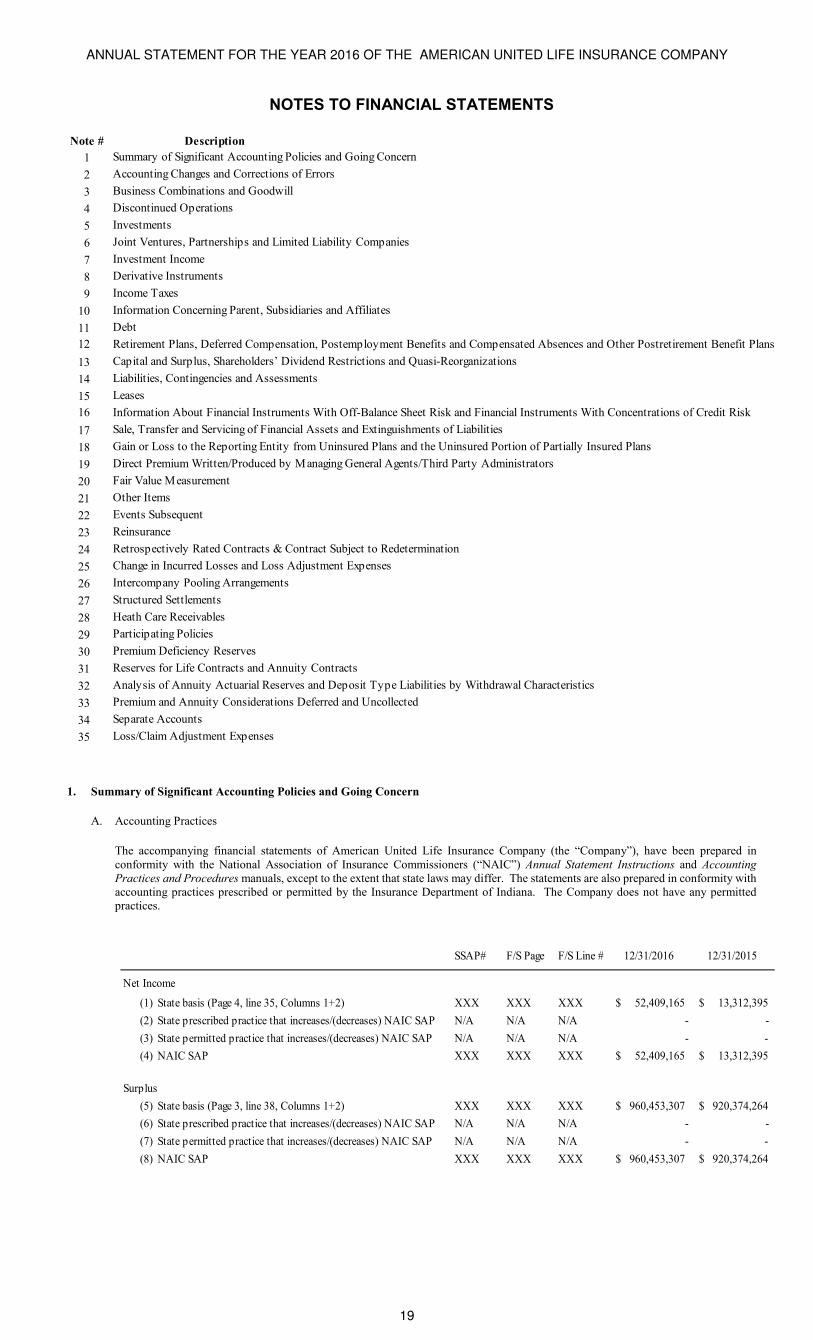
NOTES TO FINANCIAL STATEMENTS
Note # Description
1
2
3
4
5
6
7
8
9
10
11
12
13
14
15
16
17
18
19
20
21
22
23
24
25
26
27
28
29
30
31
32
33
34
35
Information About Financial Instruments With Off-Balance Sheet Risk and Financial Instruments With Concentrations of Credit Risk
Debt
Capital and Surplus, Shareholders’ Dividend Restrictions and Quasi-Reorganizations
Liabilities, Contingencies and Assessments
Summary of Significant Accounting Policies and Going Concern
Accounting Changes and Corrections of Errors
Business Combinations and Goodwill
Discontinued Operations
Investments
Joint Ventures, Partnerships and Limited Liability Companies
Leases
Investment Income
Derivative Instruments
Income Taxes
Information Concerning Parent, Subsidiaries and Affiliates
Retirement Plans, Deferred Compensation, Postemployment Benefits and Compensated Absences and Other Postretirement Benefit Plans
Intercompany Pooling Arrangements
Structured Settlements
Heath Care Receivables
Sale, Transfer and Servicing of Financial Assets and Extinguishments of Liabilities
Gain or Loss to the Reporting Entity from Uninsured Plans and the Uninsured Portion of Partially Insured Plans
Direct Premium Written/Produced by Managing General Agents/Third Party Administrators
Fair Value Measurement
Other Items
Events Subsequent
Reinsurance
Change in Incurred Losses and Loss Adjustment Expenses
Retrospectively Rated Contracts & Contract Subject to Redetermination
Loss/Claim Adjustment Expenses
Participating Policies
Premium Deficiency Reserves
Reserves for Life Contracts and Annuity Contracts
Analysis of Annuity Actuarial Reserves and Deposit Type Liabilities by Withdrawal Characteristics
Premium and Annuity Considerations Deferred and Uncollected
Separate Accounts
1. Summary of Significant Accounting Policies and Going Concern
A. Accounting Practices
The accompanying financial statements of American United Life Insurance Company (the “Company”), have been prepared in conformity with the National Association of Insurance Commissioners (“NAIC”) Annual Statement Instructions and Accounting
Practices and Procedures manuals, except to the extent that state laws may differ. The statements are also prepared in conformity with accounting practices prescribed or permitted by the Insurance Department of Indiana. The Company does not have any permitted practices.
SSAP# F/S Page F/S Line # 12/31/2016 12/31/2015
(1) State basis (Page 4, line 35, Columns 1+2) XXX XXX XXX 52,409,165$ 13,312,395$
(2) State prescribed practice that increases/(decreases) NAIC SAP N/A N/A N/A - -
(3) State permitted practice that increases/(decreases) NAIC SAP N/A N/A N/A - -
(4) NAIC SAP XXX XXX XXX 52,409,165$ 13,312,395$
Surplus
(5) State basis (Page 3, line 38, Columns 1+2) XXX XXX XXX 960,453,307$ 920,374,264$
(6) State prescribed practice that increases/(decreases) NAIC SAP N/A N/A N/A - -
(7) State permitted practice that increases/(decreases) NAIC SAP N/A N/A N/A - -
(8) NAIC SAP XXX XXX XXX 960,453,307$ 920,374,264$
Net Income
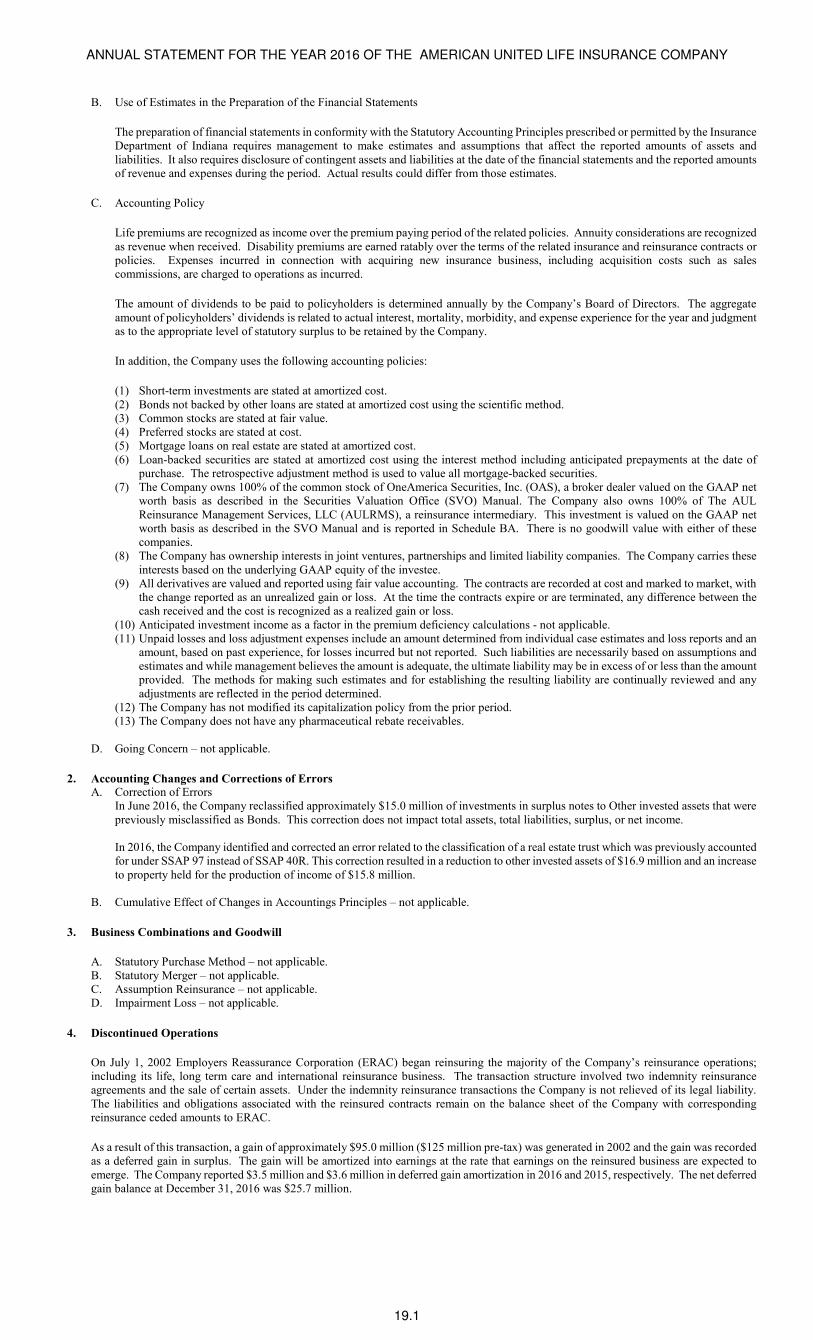
ANNUAL STATEMENT FOR THE YEAR 2016 OF THE AMERICAN UNITED LIFE INSURANCE COMPANY
19.1
B. Use of Estimates in the Preparation of the Financial Statements
The preparation of financial statements in conformity with the Statutory Accounting Principles prescribed or permitted by the Insurance Department of Indiana requires management to make estimates and assumptions that affect the reported amounts of assets and liabilities. It also requires disclosure of contingent assets and liabilities at the date of the financial statements and the reported amounts of revenue and expenses during the period. Actual results could differ from those estimates.
C. Accounting Policy
Life premiums are recognized as income over the premium paying period of the related policies. Annuity considerations are recognized as revenue when received. Disability premiums are earned ratably over the terms of the related insurance and reinsurance contracts or policies. Expenses incurred in connection with acquiring new insurance business, including acquisition costs such as sales commissions, are charged to operations as incurred.
The amount of dividends to be paid to policyholders is determined annually by the Company’s Board of Directors. The aggregate amount of policyholders’ dividends is related to actual interest, mortality, morbidity, and expense experience for the year and judgment as to the appropriate level of statutory surplus to be retained by the Company.
In addition, the Company uses the following accounting policies:
(1) Short-term investments are stated at amortized cost. (2) Bonds not backed by other loans are stated at amortized cost using the scientific method. (3) Common stocks are stated at fair value. (4) Preferred stocks are stated at cost. (5) Mortgage loans on real estate are stated at amortized cost. (6) Loan-backed securities are stated at amortized cost using the interest method including anticipated prepayments at the date of
purchase. The retrospective adjustment method is used to value all mortgage-backed securities. (7) The Company owns 100% of the common stock of OneAmerica Securities, Inc. (OAS), a broker dealer valued on the GAAP net
worth basis as described in the Securities Valuation Office (SVO) Manual. The Company also owns 100% of The AUL Reinsurance Management Services, LLC (AULRMS), a reinsurance intermediary. This investment is valued on the GAAP net worth basis as described in the SVO Manual and is reported in Schedule BA. There is no goodwill value with either of these companies.
(8) The Company has ownership interests in joint ventures, partnerships and limited liability companies. The Company carries these interests based on the underlying GAAP equity of the investee.
(9) All derivatives are valued and reported using fair value accounting. The contracts are recorded at cost and marked to market, with the change reported as an unrealized gain or loss. At the time the contracts expire or are terminated, any difference between the cash received and the cost is recognized as a realized gain or loss.
(10) Anticipated investment income as a factor in the premium deficiency calculations - not applicable. (11) Unpaid losses and loss adjustment expenses include an amount determined from individual case estimates and loss reports and an
amount, based on past experience, for losses incurred but not reported. Such liabilities are necessarily based on assumptions and estimates and while management believes the amount is adequate, the ultimate liability may be in excess of or less than the amount provided. The methods for making such estimates and for establishing the resulting liability are continually reviewed and any adjustments are reflected in the period determined.
(12) The Company has not modified its capitalization policy from the prior period. (13) The Company does not have any pharmaceutical rebate receivables.
D. Going Concern – not applicable.
2. Accounting Changes and Corrections of Errors
A. Correction of Errors In June 2016, the Company reclassified approximately $15.0 million of investments in surplus notes to Other invested assets that were previously misclassified as Bonds. This correction does not impact total assets, total liabilities, surplus, or net income. In 2016, the Company identified and corrected an error related to the classification of a real estate trust which was previously accounted for under SSAP 97 instead of SSAP 40R. This correction resulted in a reduction to other invested assets of $16.9 million and an increase to property held for the production of income of $15.8 million.
B. Cumulative Effect of Changes in Accountings Principles – not applicable.
3. Business Combinations and Goodwill
A. Statutory Purchase Method – not applicable. B. Statutory Merger – not applicable. C. Assumption Reinsurance – not applicable. D. Impairment Loss – not applicable.
4. Discontinued Operations
On July 1, 2002 Employers Reassurance Corporation (ERAC) began reinsuring the majority of the Company’s reinsurance operations; including its life, long term care and international reinsurance business. The transaction structure involved two indemnity reinsurance agreements and the sale of certain assets. Under the indemnity reinsurance transactions the Company is not relieved of its legal liability. The liabilities and obligations associated with the reinsured contracts remain on the balance sheet of the Company with corresponding reinsurance ceded amounts to ERAC.
As a result of this transaction, a gain of approximately $95.0 million ($125 million pre-tax) was generated in 2002 and the gain was recorded as a deferred gain in surplus. The gain will be amortized into earnings at the rate that earnings on the reinsured business are expected to emerge. The Company reported $3.5 million and $3.6 million in deferred gain amortization in 2016 and 2015, respectively. The net deferred gain balance at December 31, 2016 was $25.7 million.
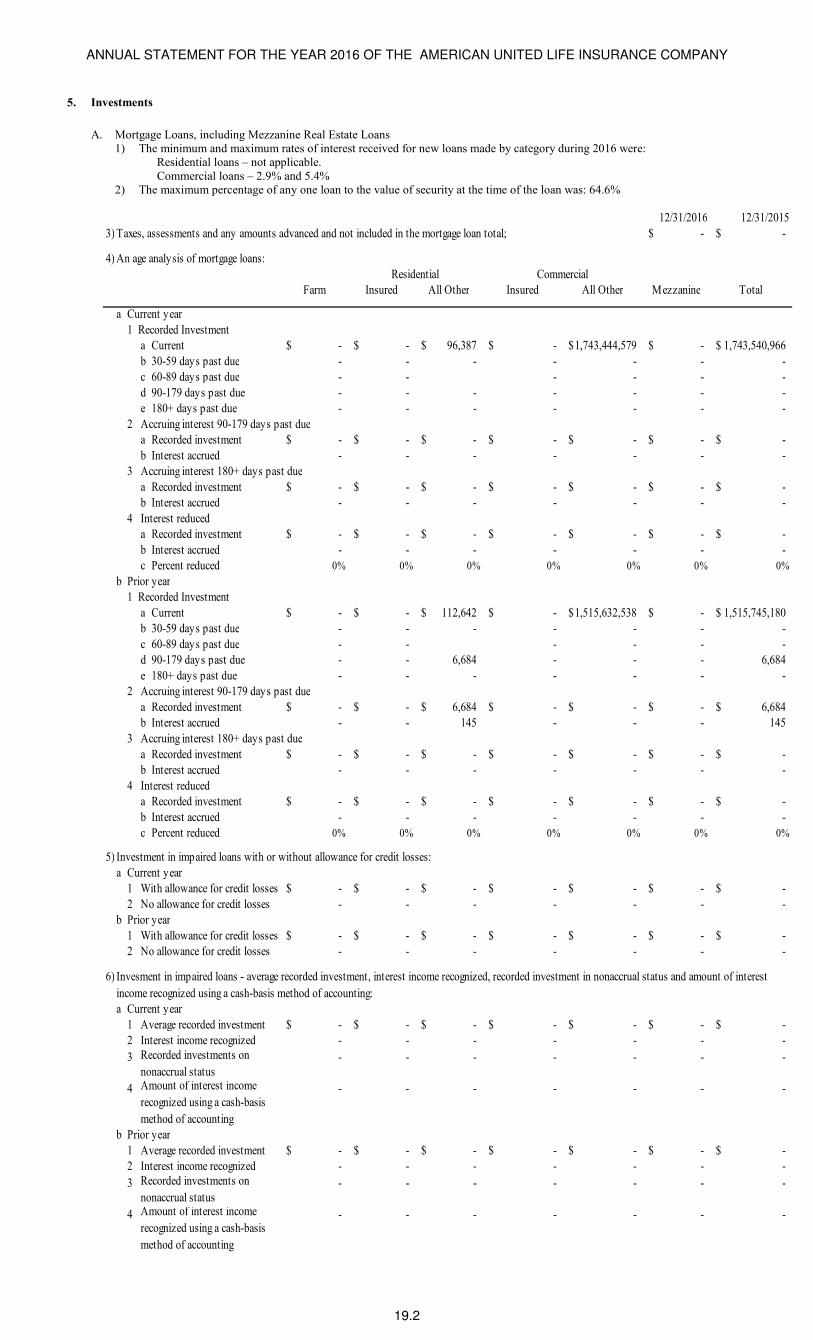
ANNUAL STATEMENT FOR THE YEAR 2016 OF THE AMERICAN UNITED LIFE INSURANCE COMPANY
19.2
5. Investments
A. Mortgage Loans, including Mezzanine Real Estate Loans 1) The minimum and maximum rates of interest received for new loans made by category during 2016 were:
Residential loans – not applicable. Commercial loans – 2.9% and 5.4%
2) The maximum percentage of any one loan to the value of security at the time of the loan was: 64.6%
12/31/2016 12/31/2015
3) Taxes, assessments and any amounts advanced and not included in the mortgage loan total; -$ -$
4) An age analysis of mortgage loans:
Farm Insured All Other Insured All Other Mezzanine Total
a Current year
1 Recorded Investment
a Current -$ -$ 96,387$ -$ 1,743,444,579$ -$ 1,743,540,966$
b 30-59 days past due - - - - - - -
c 60-89 days past due - - - - - -
d 90-179 days past due - - - - - - -
e 180+ days past due - - - - - - -
2 Accruing interest 90-179 days past due
a Recorded investment -$ -$ -$ -$ -$ -$ -$
b Interest accrued - - - - - - -
3 Accruing interest 180+ days past due
a Recorded investment -$ -$ -$ -$ -$ -$ -$
b Interest accrued - - - - - - -
4 Interest reduced
a Recorded investment -$ -$ -$ -$ -$ -$ -$
b Interest accrued - - - - - - -
c Percent reduced 0% 0% 0% 0% 0% 0% 0%
b Prior year
1 Recorded Investment
a Current -$ -$ 112,642$ -$ 1,515,632,538$ -$ 1,515,745,180$
b 30-59 days past due - - - - - - -
c 60-89 days past due - - - - - -
d 90-179 days past due - - 6,684 - - - 6,684
e 180+ days past due - - - - - - -
2 Accruing interest 90-179 days past due
a Recorded investment -$ -$ 6,684$ -$ -$ -$ 6,684$
b Interest accrued - - 145 - - - 145
3 Accruing interest 180+ days past due
a Recorded investment -$ -$ -$ -$ -$ -$ -$
b Interest accrued - - - - - - -
4 Interest reduced
a Recorded investment -$ -$ -$ -$ -$ -$ -$
b Interest accrued - - - - - - -
c Percent reduced 0% 0% 0% 0% 0% 0% 0%
5) Investment in impaired loans with or without allowance for credit losses:
a Current year
1 Recorded InvestmentWith allowance for credit losses -$ -$ -$ -$ -$ -$ -$
2 No allowance for credit losses - - - - - - -
b Prior year
1 Recorded InvestmentWith allowance for credit losses -$ -$ -$ -$ -$ -$ -$
2 No allowance for credit losses - - - - - - -
6)
a Current year
1 Recorded InvestmentAverage recorded investment -$ -$ -$ -$ -$ -$ -$
2 Interest income recognized - - - - - - -
3 - - - - - - -
4 - - - - - - -
b Prior year
1 Recorded InvestmentAverage recorded investment -$ -$ -$ -$ -$ -$ -$
2 Interest income recognized - - - - - - -
3 - - - - - - -
4 - - - - - - -
Residential
Invesment in impaired loans - average recorded investment, interest income recognized, recorded investment in nonaccrual status and amount of interest
income recognized using a cash-basis method of accounting:
Commercial
Amount of interest income
recognized using a cash-basis
method of accounting
Recorded investments on
nonaccrual status
Recorded investments on
nonaccrual statusAmount of interest income
recognized using a cash-basis
method of accounting
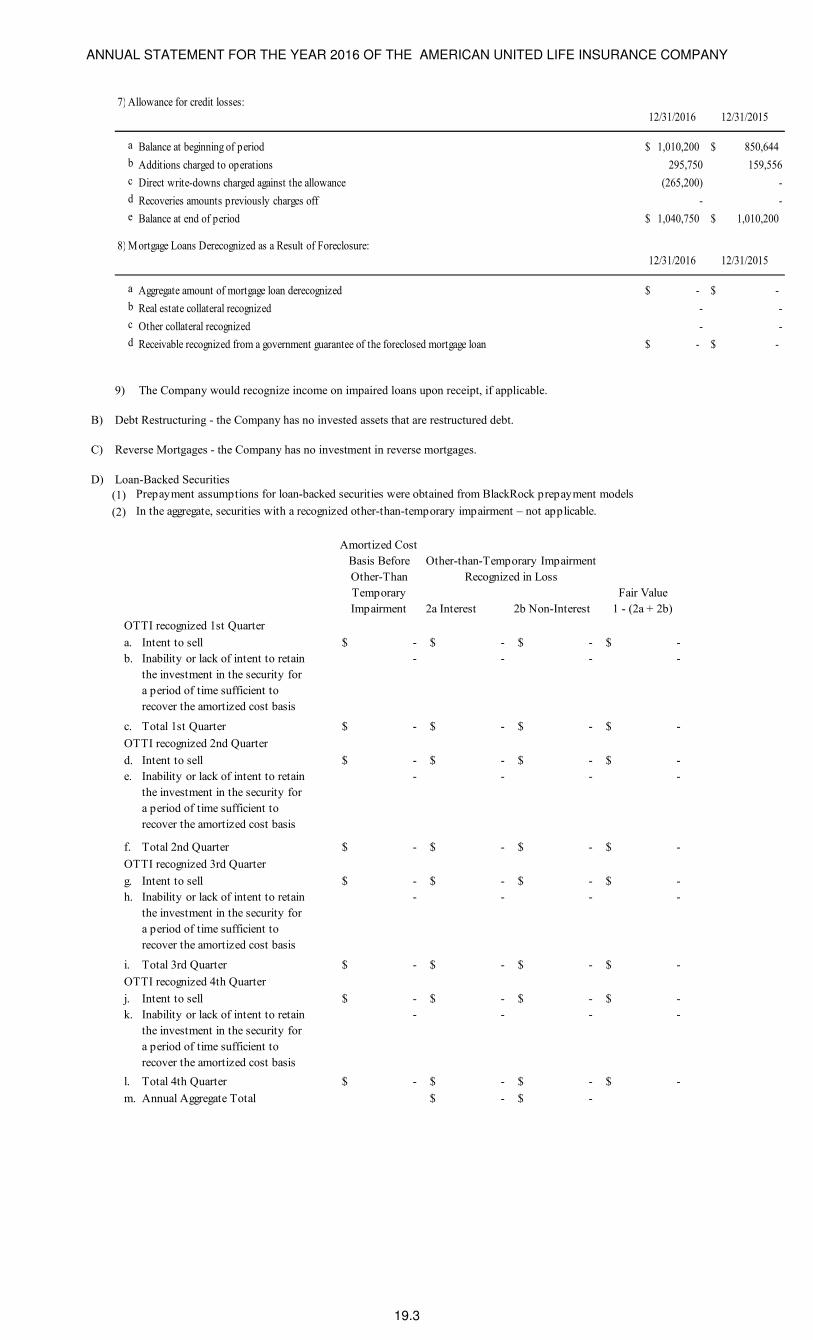
ANNUAL STATEMENT FOR THE YEAR 2016 OF THE AMERICAN UNITED LIFE INSURANCE COMPANY
19.3
7) Allowance for credit losses:
12/31/2016 12/31/2015
a
)
Balance at beginning of period 1,010,200$ 850,644$
b
) Additions charged to operations 295,750 159,556
c
)
Direct write-downs charged against the allowance (265,200) -
d
) Recoveries amounts previously charges off - -
e
) Balance at end of period 1,040,750$ 1,010,200$
8) Mortgage Loans Derecognized as a Result of Foreclosure:
12/31/2016 12/31/2015
a
) Aggregate amount of mortgage loan derecognized -$ -$
b
)
Real estate collateral recognized - -
c
) Other collateral recognized - -
d
)
Receivable recognized from a government guarantee of the foreclosed mortgage loan -$ -$
9) The Company would recognize income on impaired loans upon receipt, if applicable.
B) Debt Restructuring - the Company has no invested assets that are restructured debt.
C) Reverse Mortgages - the Company has no investment in reverse mortgages.
D) Loan-Backed Securities
(1) Prepayment assumptions for loan-backed securities were obtained from BlackRock prepayment models
(2) In the aggregate, securities with a recognized other-than-temporary impairment – not applicable.
Amortized Cost
Basis Before
Other-Than
Other-than-Temporary Impairment
Recognized in Loss
Temporary
Impairment 2a Interest 2b Non-Interest
Fair Value
1 - (2a + 2b)
OTTI recognized 1st Quarter
a. Intent to sell -$ -$ -$ -$
b. Inability or lack of intent to retain
the investment in the security for
a period of time sufficient to
recover the amortized cost basis
- - - -
c. Total 1st Quarter -$ -$ -$ -$
OTTI recognized 2nd Quarter
d. Intent to sell -$ -$ -$ -$
e. Inability or lack of intent to retain
the investment in the security for
a period of time sufficient to
recover the amortized cost basis
- - - -
f. Total 2nd Quarter -$ -$ -$ -$
OTTI recognized 3rd Quarter
g. Intent to sell -$ -$ -$ -$
h. Inability or lack of intent to retain
the investment in the security for
a period of time sufficient to
recover the amortized cost basis
- - - -
i. Total 3rd Quarter -$ -$ -$ -$
OTTI recognized 4th Quarter
j. Intent to sell -$ -$ -$ -$
k. Inability or lack of intent to retain
the investment in the security for
a period of time sufficient to
recover the amortized cost basis
- - - -
l. Total 4th Quarter -$ -$ -$ -$
m. Annual Aggregate Total -$ -$
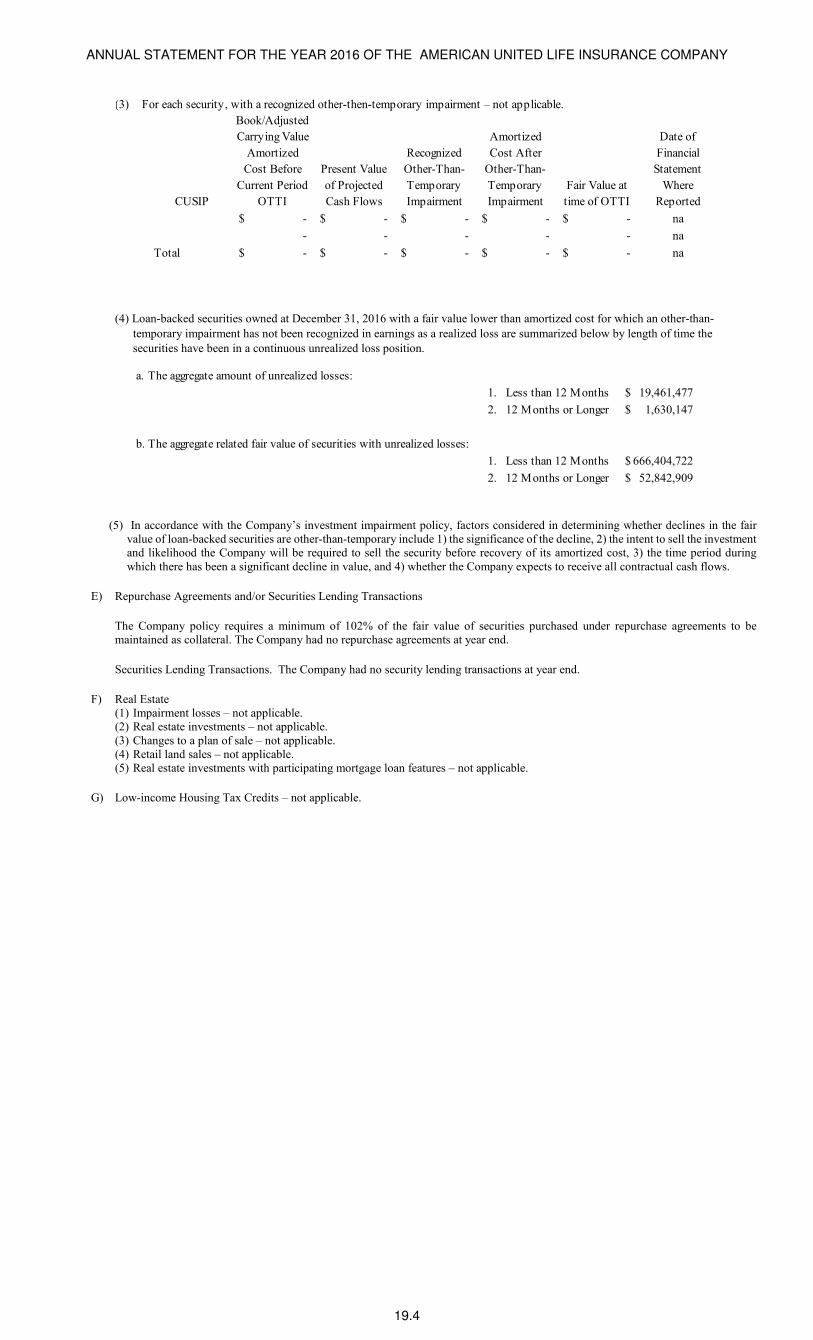
ANNUAL STATEMENT FOR THE YEAR 2016 OF THE AMERICAN UNITED LIFE INSURANCE COMPANY
19.4
(3) For each security, with a recognized other-then-temporary impairment – not applicable.
CUSIP
Book/Adjusted
Carrying Value
Amortized
Cost Before
Current Period
OTTI
Present Value
of Projected
Cash Flows
Recognized
Other-Than-
Temporary
Impairment
Amortized
Cost After
Other-Than-
Temporary
Impairment
Fair Value at
time of OTTI
Date of
Financial
Statement
Where
Reported
-$ -$ -$ -$ -$ na
- - - - - na
Total -$ -$ -$ -$ -$ na
(4) Loan-backed securities owned at December 31, 2016 with a fair value lower than amortized cost for which an other-than-
temporary impairment has not been recognized in earnings as a realized loss are summarized below by length of time the
securities have been in a continuous unrealized loss position.
a.
1. Less than 12 Months 19,461,477$
2. 12 Months or Longer 1,630,147$
b.
1. Less than 12 Months 666,404,722$
2. 12 Months or Longer 52,842,909$
The aggregate amount of unrealized losses:
The aggregate related fair value of securities with unrealized losses:
(5) In accordance with the Company’s investment impairment policy, factors considered in determining whether declines in the fair value of loan-backed securities are other-than-temporary include 1) the significance of the decline, 2) the intent to sell the investment and likelihood the Company will be required to sell the security before recovery of its amortized cost, 3) the time period during which there has been a significant decline in value, and 4) whether the Company expects to receive all contractual cash flows.
E) Repurchase Agreements and/or Securities Lending Transactions
The Company policy requires a minimum of 102% of the fair value of securities purchased under repurchase agreements to be maintained as collateral. The Company had no repurchase agreements at year end.
Securities Lending Transactions. The Company had no security lending transactions at year end.
F) Real Estate (1) Impairment losses – not applicable. (2) Real estate investments – not applicable. (3) Changes to a plan of sale – not applicable. (4) Retail land sales – not applicable. (5) Real estate investments with participating mortgage loan features – not applicable.
G) Low-income Housing Tax Credits – not applicable.
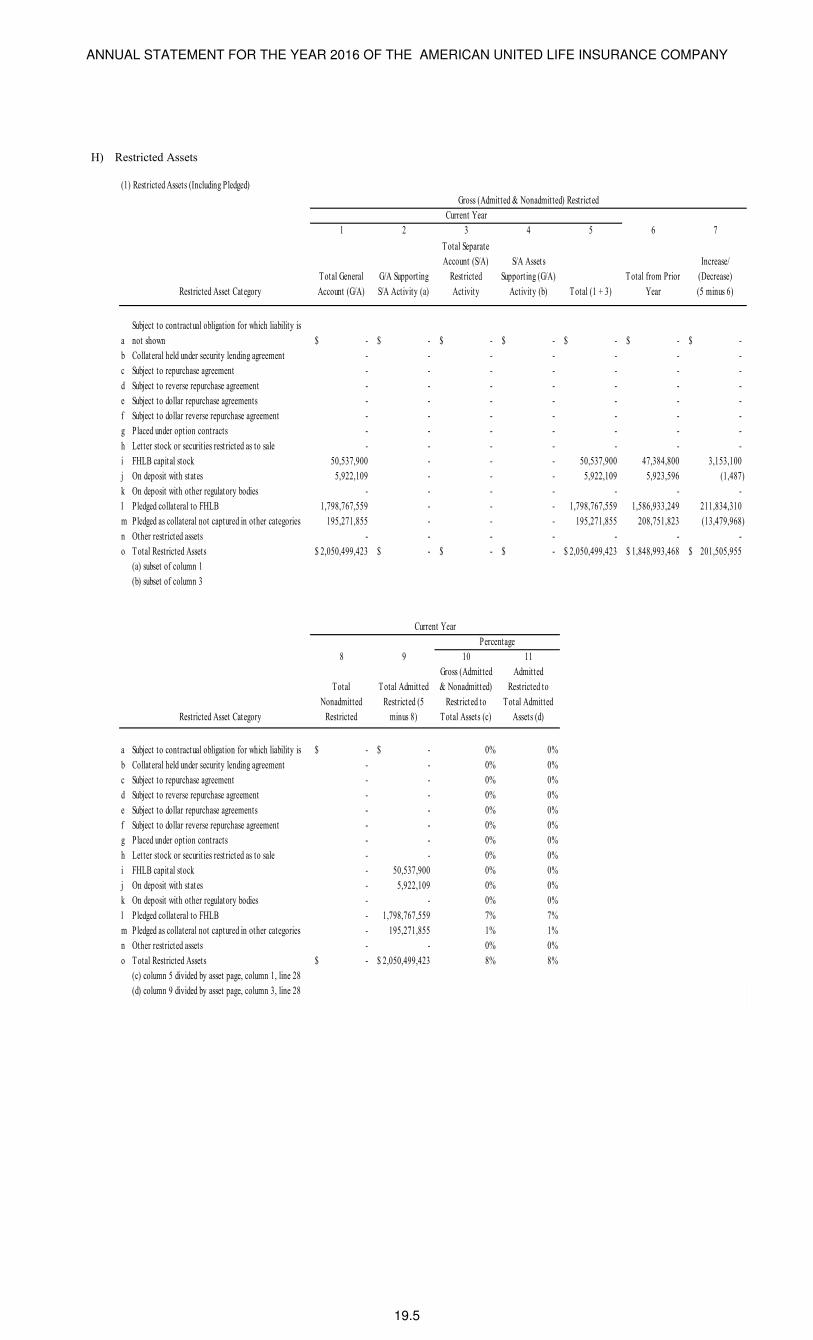
ANNUAL STATEMENT FOR THE YEAR 2016 OF THE AMERICAN UNITED LIFE INSURANCE COMPANY
19.5
H) Restricted Assets
(1) Restricted Assets (Including Pledged)
1 2 3 4 5 6 7
Restricted Asset Category
Total General
Account (G/A)
G/A Support ing
S/A Activity (a)
Total Separate
Account (S/A)
Restricted
Act ivity
S/A Assets
Support ing (G/A)
Activity (b) Total (1 + 3)
Total from Prior
Year
Increase/
(Decrease)
(5 minus 6)
a
Subject to contractual obligation for which liability is
not shown -$ -$ -$ -$ -$ -$ -$
b Collateral held under security lending agreement - - - - - - -
c Subject to repurchase agreement - - - - - - -
d Subject to reverse repurchase agreement - - - - - - -
e Subject to dollar repurchase agreements - - - - - - -
f Subject to dollar reverse repurchase agreement - - - - - - -
g Placed under option contracts - - - - - - -
h Let ter stock or securities restricted as to sale - - - - - - -
i FHLB capital stock 50,537,900 - - - 50,537,900 47,384,800 3,153,100
j On deposit with states 5,922,109 - - - 5,922,109 5,923,596 (1,487)
k On deposit with other regulatory bodies - - - - - - -
l Pledged collateral to FHLB 1,798,767,559 - - - 1,798,767,559 1,586,933,249 211,834,310
m Pledged as collateral not captured in other categories 195,271,855 - - - 195,271,855 208,751,823 (13,479,968)
n Other restricted assets - - - - - - -
o Total Restricted Assets 2,050,499,423$ -$ -$ -$ 2,050,499,423$ 1,848,993,468$ 201,505,955$
(a) subset of column 1
(b) subset of column 3
8 9 10 11
Restricted Asset Category
Total
Nonadmitted
Restricted
Total Admit ted
Restricted (5
minus 8)
Gross (Admit ted
& Nonadmitted)
Restricted to
Total Assets (c)
Admitted
Restricted to
Total Admitted
Assets (d)
a Subject to contractual obligation for which liability is -$ -$ 0% 0%
b Collateral held under security lending agreement - - 0% 0%
c Subject to repurchase agreement - - 0% 0%
d Subject to reverse repurchase agreement - - 0% 0%
e Subject to dollar repurchase agreements - - 0% 0%
f Subject to dollar reverse repurchase agreement - - 0% 0%
g Placed under option contracts - - 0% 0%
h Letter stock or securities restricted as to sale - - 0% 0%
i FHLB capital stock - 50,537,900 0% 0%
j On deposit with states - 5,922,109 0% 0%
k On deposit with other regulatory bodies - - 0% 0%
l Pledged collateral to FHLB - 1,798,767,559 7% 7%
m Pledged as collateral not captured in other categories - 195,271,855 1% 1%
n Other restricted assets - - 0% 0%
o Total Restricted Assets -$ 2,050,499,423$ 8% 8%
(c) column 5 divided by asset page, column 1, line 28
(d) column 9 divided by asset page, column 3, line 28
Current Year
Gross (Admitted & Nonadmit ted) Restricted
Percentage
Current Year
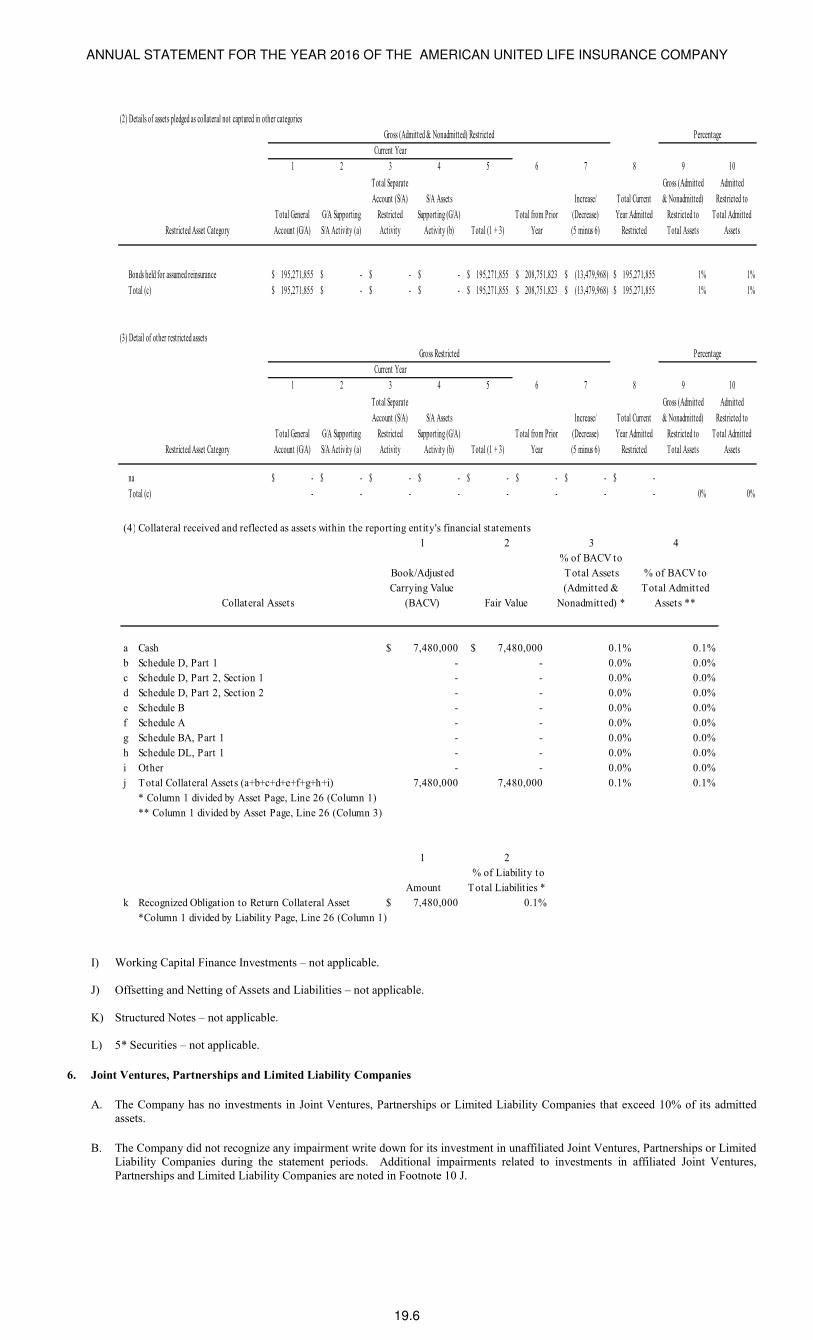
ANNUAL STATEMENT FOR THE YEAR 2016 OF THE AMERICAN UNITED LIFE INSURANCE COMPANY
19.6
(2) Details of assets pledged as collateral not captured in other categories
1 2 3 4 5 6 7 8 9 10
Restricted Asset Category
Total General
Account (G/A)
G/A Supporting
S/A Activity (a)
Total Separate
Account (S/A)
Restricted
Activity
S/A Assets
Support ing (G/A)
Activity (b) Total (1 + 3)
T otal from Prior
Year
Increase/
(Decrease)
(5 minus 6)
Total Current
Year Admitted
Restricted
Gross (Admitted
& Nonadmitted)
Restricted to
Total Assets
Admitted
Restricted to
Total Admitted
Assets
Bonds held for assumed reinsurance 195,271,855$ -$ -$ -$ 195,271,855$ 208,751,823$ (13,479,968)$ 195,271,855$ 1% 1%
Total (c) 195,271,855$ -$ -$ -$ 195,271,855$ 208,751,823$ (13,479,968)$ 195,271,855$ 1% 1%
(3) Detail of other restricted assets
1 2 3 4 5 6 7 8 9 10
Restricted Asset Category
Total General
Account (G/A)
G/A Supporting
S/A Activity (a)
Total Separate
Account (S/A)
Restricted
Activity
S/A Assets
Support ing (G/A)
Activity (b) Total (1 + 3)
T otal from Prior
Year
Increase/
(Decrease)
(5 minus 6)
Total Current
Year Admitted
Restricted
Gross (Admitted
& Nonadmitted)
Restricted to
Total Assets
Admitted
Restricted to
Total Admitted
Assets
na -$ -$ -$ -$ -$ -$ -$ -$
Total (c) - - - - - - - - 0% 0%
Gross Restricted Percentage
Current Year
Gross (Admitted & Nonadmitted) Restricted Percentage
Current Year
(4) Detail of other restricted assetsCollateral received and reflected as assets within the report ing entity's financial statements
1 2 3 4
Collateral Assets
Book/Adjusted
Carrying Value
(BACV) Fair Value
% of BACV to
Total Assets
(Admitted &
Nonadmitted) *
% of BACV to
Total Admitted
Assets **
a Cash 7,480,000$ 7,480,000$ 0.1% 0.1%
b Schedule D, Part 1 - - 0.0% 0.0%
c Schedule D, Part 2, Section 1 - - 0.0% 0.0%
d Schedule D, Part 2, Section 2 - - 0.0% 0.0%
e Schedule B - - 0.0% 0.0%
f Schedule A - - 0.0% 0.0%
g Schedule BA, Part 1 - - 0.0% 0.0%
h Schedule DL, Part 1 - - 0.0% 0.0%
i Other - - 0.0% 0.0%
j Total Collateral Assets (a+b+c+d+e+f+g+h+i) 7,480,000 7,480,000 0.1% 0.1%
* Column 1 divided by Asset Page, Line 26 (Column 1)
** Column 1 divided by Asset Page, Line 26 (Column 3)
1 2
Amount
% of Liability to
Total Liabilit ies *
k Recognized Obligation to Return Collateral Asset 7,480,000$ 0.1%
*Column 1 divided by Liability Page, Line 26 (Column 1)
I) Working Capital Finance Investments – not applicable.
J) Offsetting and Netting of Assets and Liabilities – not applicable. K) Structured Notes – not applicable.
L) 5* Securities – not applicable.
6. Joint Ventures, Partnerships and Limited Liability Companies
A. The Company has no investments in Joint Ventures, Partnerships or Limited Liability Companies that exceed 10% of its admitted assets.
B. The Company did not recognize any impairment write down for its investment in unaffiliated Joint Ventures, Partnerships or Limited Liability Companies during the statement periods. Additional impairments related to investments in affiliated Joint Ventures, Partnerships and Limited Liability Companies are noted in Footnote 10 J.
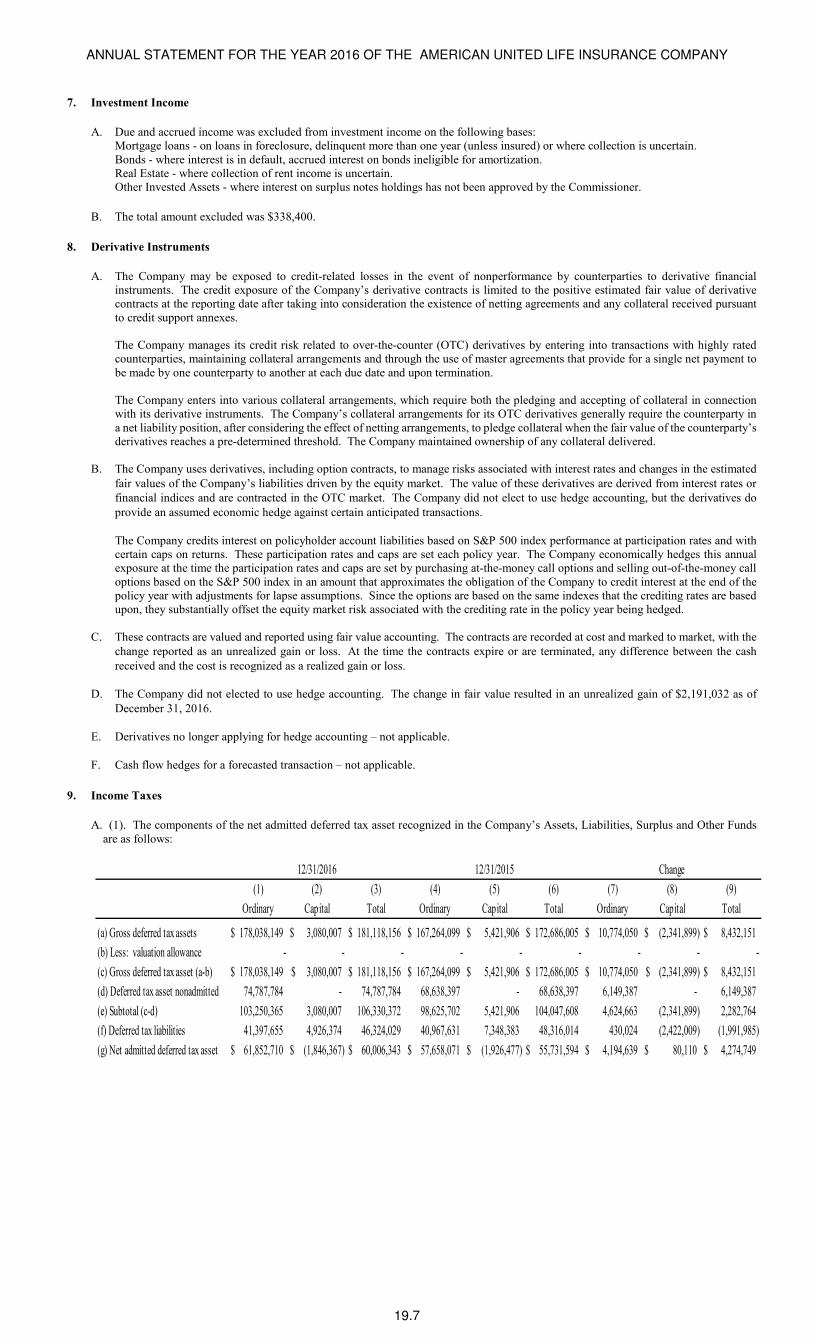
ANNUAL STATEMENT FOR THE YEAR 2016 OF THE AMERICAN UNITED LIFE INSURANCE COMPANY
19.7
7. Investment Income
A. Due and accrued income was excluded from investment income on the following bases: Mortgage loans - on loans in foreclosure, delinquent more than one year (unless insured) or where collection is uncertain. Bonds - where interest is in default, accrued interest on bonds ineligible for amortization. Real Estate - where collection of rent income is uncertain. Other Invested Assets - where interest on surplus notes holdings has not been approved by the Commissioner.
B. The total amount excluded was $338,400.
8. Derivative Instruments
A. The Company may be exposed to credit-related losses in the event of nonperformance by counterparties to derivative financial instruments. The credit exposure of the Company’s derivative contracts is limited to the positive estimated fair value of derivative contracts at the reporting date after taking into consideration the existence of netting agreements and any collateral received pursuant to credit support annexes. The Company manages its credit risk related to over-the-counter (OTC) derivatives by entering into transactions with highly rated counterparties, maintaining collateral arrangements and through the use of master agreements that provide for a single net payment to be made by one counterparty to another at each due date and upon termination. The Company enters into various collateral arrangements, which require both the pledging and accepting of collateral in connection with its derivative instruments. The Company’s collateral arrangements for its OTC derivatives generally require the counterparty in a net liability position, after considering the effect of netting arrangements, to pledge collateral when the fair value of the counterparty’s derivatives reaches a pre-determined threshold. The Company maintained ownership of any collateral delivered.
B. The Company uses derivatives, including option contracts, to manage risks associated with interest rates and changes in the estimated
fair values of the Company’s liabilities driven by the equity market. The value of these derivatives are derived from interest rates or
financial indices and are contracted in the OTC market. The Company did not elect to use hedge accounting, but the derivatives do
provide an assumed economic hedge against certain anticipated transactions.
The Company credits interest on policyholder account liabilities based on S&P 500 index performance at participation rates and with certain caps on returns. These participation rates and caps are set each policy year. The Company economically hedges this annual exposure at the time the participation rates and caps are set by purchasing at-the-money call options and selling out-of-the-money call options based on the S&P 500 index in an amount that approximates the obligation of the Company to credit interest at the end of the policy year with adjustments for lapse assumptions. Since the options are based on the same indexes that the crediting rates are based upon, they substantially offset the equity market risk associated with the crediting rate in the policy year being hedged.
C. These contracts are valued and reported using fair value accounting. The contracts are recorded at cost and marked to market, with the
change reported as an unrealized gain or loss. At the time the contracts expire or are terminated, any difference between the cash
received and the cost is recognized as a realized gain or loss.
D. The Company did not elected to use hedge accounting. The change in fair value resulted in an unrealized gain of $2,191,032 as of
December 31, 2016.
E. Derivatives no longer applying for hedge accounting – not applicable.
F. Cash flow hedges for a forecasted transaction – not applicable.
9. Income Taxes
A. (1). The components of the net admitted deferred tax asset recognized in the Company’s Assets, Liabilities, Surplus and Other Funds are as follows:
(1) (2) (3) (4) (5) (6) (7) (8) (9)
Ordinary Capital Total Ordinary Capital Total Ordinary Capital Total
(a) Gross deferred tax assets 178,038,149$ 3,080,007$ 181,118,156$ 167,264,099$ 5,421,906$ 172,686,005$ 10,774,050$ (2,341,899)$ 8,432,151$
(b) Less: valuation allowance - - - - - - - - -
(c) Gross deferred tax asset (a-b) 178,038,149$ 3,080,007$ 181,118,156$ 167,264,099$ 5,421,906$ 172,686,005$ 10,774,050$ (2,341,899)$ 8,432,151$
(d) Deferred tax asset nonadmitted 74,787,784 - 74,787,784 68,638,397 - 68,638,397 6,149,387 - 6,149,387
(e) Subtotal (c-d) 103,250,365 3,080,007 106,330,372 98,625,702 5,421,906 104,047,608 4,624,663 (2,341,899) 2,282,764
(f) Deferred tax liabilities 41,397,655 4,926,374 46,324,029 40,967,631 7,348,383 48,316,014 430,024 (2,422,009) (1,991,985)
(g) Net admitted deferred tax asset 61,852,710$ (1,846,367)$ 60,006,343$ 57,658,071$ (1,926,477)$ 55,731,594$ 4,194,639$ 80,110$ 4,274,749$
Change12/31/201512/31/2016
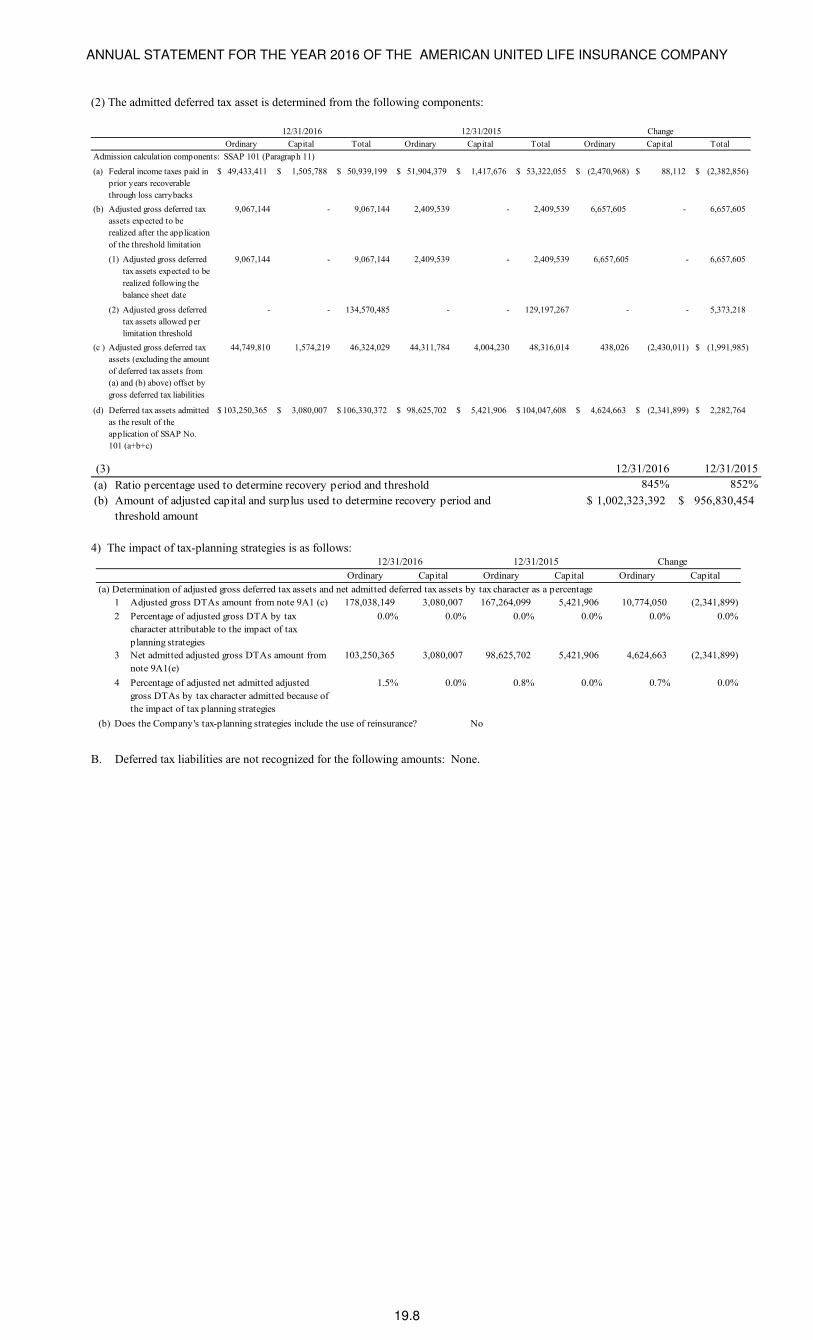
ANNUAL STATEMENT FOR THE YEAR 2016 OF THE AMERICAN UNITED LIFE INSURANCE COMPANY
19.8
(2) The admitted deferred tax asset is determined from the following components:
Ordinary Capital Total Ordinary Capital Total Ordinary Capital Total
Admission calculation components: SSAP 101 (Paragraph 11)
(a) 49,433,411$ 1,505,788$ 50,939,199$ 51,904,379$ 1,417,676$ 53,322,055$ (2,470,968)$ 88,112$ (2,382,856)$
(b) 9,067,144 - 9,067,144 2,409,539 - 2,409,539 6,657,605 - 6,657,605
(1) 9,067,144 - 9,067,144 2,409,539 - 2,409,539 6,657,605 - 6,657,605
(2) - - 134,570,485 - - 129,197,267 - - 5,373,218
(c ) 44,749,810 1,574,219 46,324,029 44,311,784 4,004,230 48,316,014 438,026 (2,430,011) (1,991,985)$
(d) 103,250,365$ 3,080,007$ 106,330,372$ 98,625,702$ 5,421,906$ 104,047,608$ 4,624,663$ (2,341,899)$ 2,282,764$
Change12/31/2016 12/31/2015
Federal income taxes paid in
prior years recoverable
through loss carrybacks
Adjusted gross deferred tax
assets expected to be
realized after the application
of the threshold limitation
Adjusted gross deferred
tax assets expected to be
realized following the
balance sheet date
Adjusted gross deferred
tax assets allowed per
limitation threshold
Adjusted gross deferred tax
assets (excluding the amount
of deferred tax assets from
(a) and (b) above) offset by
gross deferred tax liabilities
Deferred tax assets admitted
as the result of the
application of SSAP No.
101 (a+b+c)
(3) 12/31/2016 12/31/2015
(a) 845% 852%
(b) 1,002,323,392$ 956,830,454$
Ratio percentage used to determine recovery period and threshold
Amount of adjusted capital and surplus used to determine recovery period and
threshold amount
4) The impact of tax-planning strategies is as follows:
Ordinary Capital Ordinary Capital Ordinary Capital
(a) Determination of adjusted gross deferred tax assets and net admitted deferred tax assets by tax character as a percentage
1 178,038,149 3,080,007 167,264,099 5,421,906 10,774,050 (2,341,899)
2 0.0% 0.0% 0.0% 0.0% 0.0% 0.0%
3 103,250,365 3,080,007 98,625,702 5,421,906 4,624,663 (2,341,899)
4 1.5% 0.0% 0.8% 0.0% 0.7% 0.0%
(b) Does the Company's tax-planning strategies include the use of reinsurance? No
Change
Adjusted gross DTAs amount from note 9A1 (c)
Percentage of adjusted gross DTA by tax
character attributable to the impact of tax
planning strategies
Net admitted adjusted gross DTAs amount from
note 9A1(e)
Percentage of adjusted net admitted adjusted
gross DTAs by tax character admitted because of
the impact of tax planning strategies
12/31/2016 12/31/2015
B. Deferred tax liabilities are not recognized for the following amounts: None.
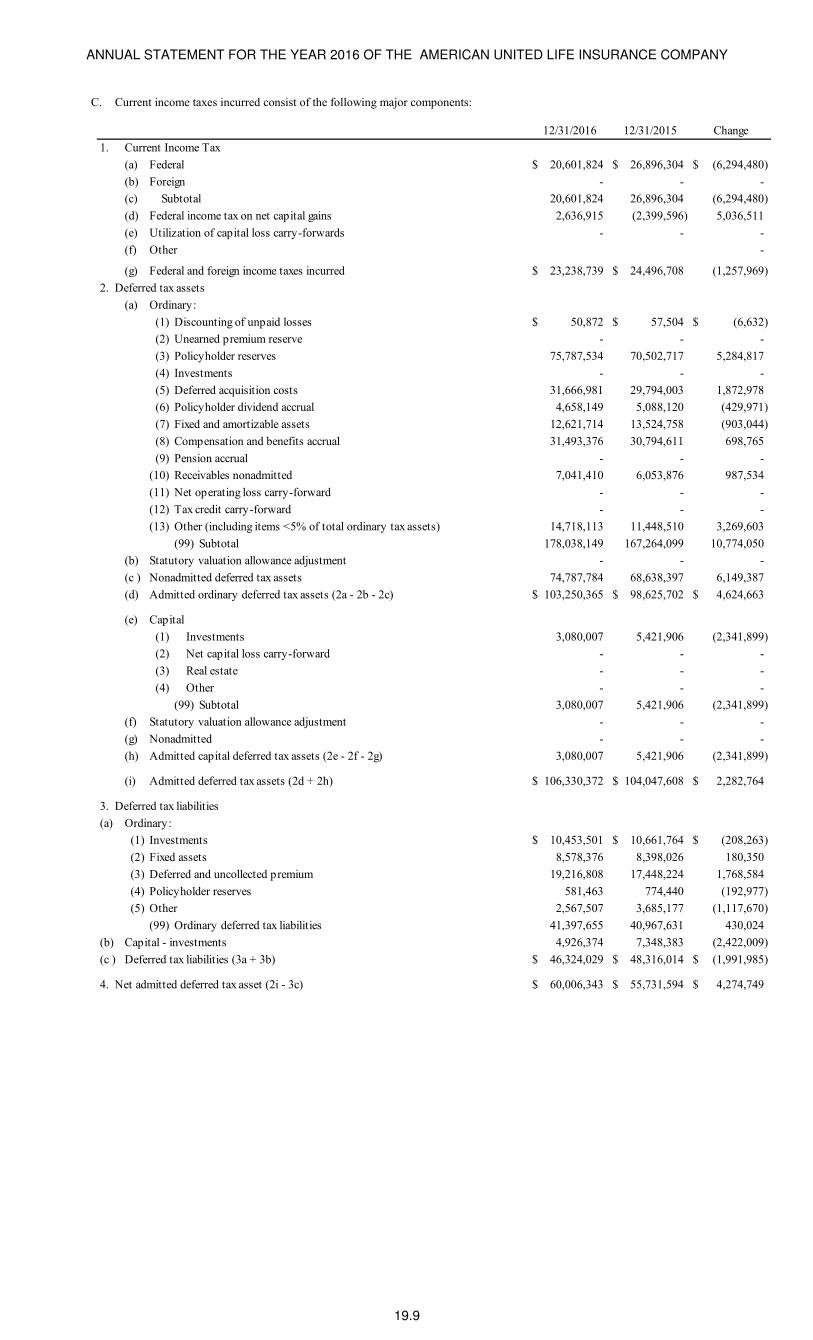
ANNUAL STATEMENT FOR THE YEAR 2016 OF THE AMERICAN UNITED LIFE INSURANCE COMPANY
19.9
C. Current income taxes incurred consist of the following major components:
12/31/2016 12/31/2015 Change
1. Current Income Tax
(a) Federal 20,601,824$ 26,896,304$ (6,294,480)$
(b) Foreign - - -
(c) Subtotal 20,601,824 26,896,304 (6,294,480)
(d) Federal income tax on net capital gains 2,636,915 (2,399,596) 5,036,511
(e) Utilization of capital loss carry-forwards - - -
(f) Other -
(g) Federal and foreign income taxes incurred 23,238,739$ 24,496,708$ (1,257,969)
2. Deferred tax assets
(a) Ordinary:
(1) Discounting of unpaid losses 50,872$ 57,504$ (6,632)$
(2) Unearned premium reserve - - -
(3) Policyholder reserves 75,787,534 70,502,717 5,284,817
(4) Investments - - -
(5) Deferred acquisition costs 31,666,981 29,794,003 1,872,978
(6) Policyholder dividend accrual 4,658,149 5,088,120 (429,971)
(7) Fixed and amortizable assets 12,621,714 13,524,758 (903,044)
(8) Compensation and benefits accrual 31,493,376 30,794,611 698,765
(9) Pension accrual - - -
(10) Receivables nonadmitted 7,041,410 6,053,876 987,534
(11) Net operating loss carry-forward - - -
(12) Tax credit carry-forward - - -
(13) Other (including items <5% of total ordinary tax assets) 14,718,113 11,448,510 3,269,603
(99) Subtotal 178,038,149 167,264,099 10,774,050
(b) Statutory valuation allowance adjustment - - -
(c ) Nonadmitted deferred tax assets 74,787,784 68,638,397 6,149,387
(d) Admitted ordinary deferred tax assets (2a - 2b - 2c) 103,250,365$ 98,625,702$ 4,624,663$
(e) Capital
(1) Investments 3,080,007 5,421,906 (2,341,899)
(2) Net capital loss carry-forward - - -
(3) Real estate - - -
(4) Other - - -
(99) Subtotal 3,080,007 5,421,906 (2,341,899)
(f) Statutory valuation allowance adjustment - - -
(g) Nonadmitted - - -
(h) Admitted capital deferred tax assets (2e - 2f - 2g) 3,080,007 5,421,906 (2,341,899)
(i) Admitted deferred tax assets (2d + 2h) 106,330,372$ 104,047,608$ 2,282,764$
3. Deferred tax liabilities
(a) Ordinary:
(1) Investments 10,453,501$ 10,661,764$ (208,263)$
(2) Fixed assets 8,578,376 8,398,026 180,350
(3) Deferred and uncollected premium 19,216,808 17,448,224 1,768,584
(4) Policyholder reserves 581,463 774,440 (192,977)
(5) Other 2,567,507 3,685,177 (1,117,670)
(99) Ordinary deferred tax liabilities 41,397,655 40,967,631 430,024
(b) Capital - investments 4,926,374 7,348,383 (2,422,009)
(c ) Deferred tax liabilities (3a + 3b) 46,324,029$ 48,316,014$ (1,991,985)$
60,006,343$ 55,731,594$ 4,274,749$ 4. Net admitted deferred tax asset (2i - 3c)
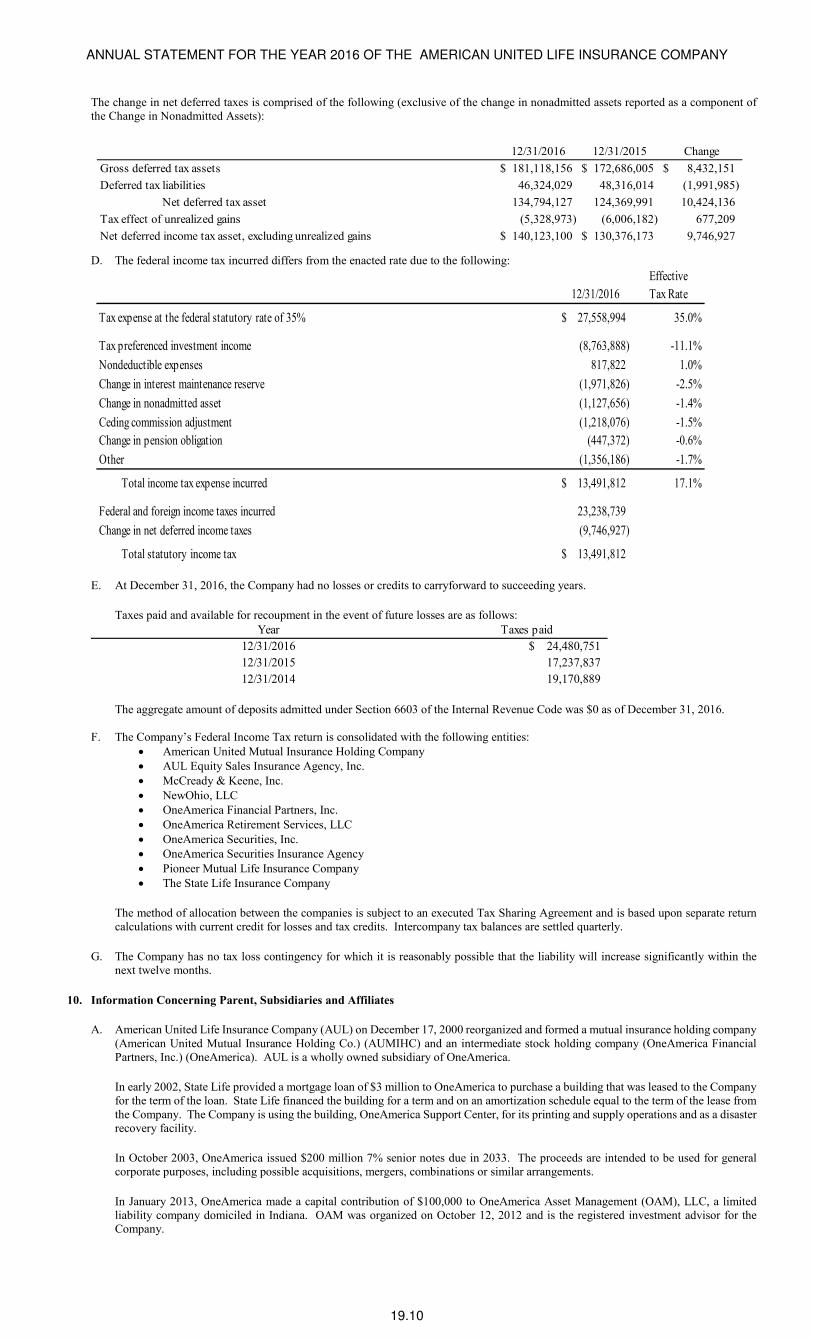
ANNUAL STATEMENT FOR THE YEAR 2016 OF THE AMERICAN UNITED LIFE INSURANCE COMPANY
19.10
The change in net deferred taxes is comprised of the following (exclusive of the change in nonadmitted assets reported as a component of the Change in Nonadmitted Assets):
12/31/2016 12/31/2015 Change
Gross deferred tax assets 181,118,156$ 172,686,005$ 8,432,151$
Deferred tax liabilities 46,324,029 48,316,014 (1,991,985)
Net deferred tax asset 134,794,127 124,369,991 10,424,136
Tax effect of unrealized gains (5,328,973) (6,006,182) 677,209
140,123,100$ 130,376,173$ 9,746,927Net deferred income tax asset, excluding unrealized gains
D. The federal income tax incurred differs from the enacted rate due to the following:
Effective
12/31/2016 Tax Rate
Tax expense at the federal statutory rate of 35% 27,558,994$ 35.0%
Tax preferenced investment income (8,763,888) -11.1%
Nondeductible expenses 817,822 1.0%
Change in interest maintenance reserve (1,971,826) -2.5%
Change in nonadmitted asset (1,127,656) -1.4%
Ceding commission adjustment (1,218,076) -1.5%
Change in pension obligation (447,372) -0.6%
Other (1,356,186) -1.7%
Total income tax expense incurred 13,491,812$ 17.1%
Federal and foreign income taxes incurred 23,238,739
Change in net deferred income taxes (9,746,927)
Total statutory income tax 13,491,812$
E. At December 31, 2016, the Company had no losses or credits to carryforward to succeeding years.
Taxes paid and available for recoupment in the event of future losses are as follows:
24,480,751$
17,237,837
19,170,88912/31/2014
Year Taxes paid
12/31/2016
12/31/2015
The aggregate amount of deposits admitted under Section 6603 of the Internal Revenue Code was $0 as of December 31, 2016.
F. The Company’s Federal Income Tax return is consolidated with the following entities:
• American United Mutual Insurance Holding Company
• AUL Equity Sales Insurance Agency, Inc.
• McCready & Keene, Inc.
• NewOhio, LLC
• OneAmerica Financial Partners, Inc.
• OneAmerica Retirement Services, LLC
• OneAmerica Securities, Inc.
• OneAmerica Securities Insurance Agency
• Pioneer Mutual Life Insurance Company
• The State Life Insurance Company
The method of allocation between the companies is subject to an executed Tax Sharing Agreement and is based upon separate return calculations with current credit for losses and tax credits. Intercompany tax balances are settled quarterly.
G. The Company has no tax loss contingency for which it is reasonably possible that the liability will increase significantly within the next twelve months.
10. Information Concerning Parent, Subsidiaries and Affiliates
A. American United Life Insurance Company (AUL) on December 17, 2000 reorganized and formed a mutual insurance holding company (American United Mutual Insurance Holding Co.) (AUMIHC) and an intermediate stock holding company (OneAmerica Financial Partners, Inc.) (OneAmerica). AUL is a wholly owned subsidiary of OneAmerica.
In early 2002, State Life provided a mortgage loan of $3 million to OneAmerica to purchase a building that was leased to the Company for the term of the loan. State Life financed the building for a term and on an amortization schedule equal to the term of the lease from the Company. The Company is using the building, OneAmerica Support Center, for its printing and supply operations and as a disaster recovery facility.
In October 2003, OneAmerica issued $200 million 7% senior notes due in 2033. The proceeds are intended to be used for general corporate purposes, including possible acquisitions, mergers, combinations or similar arrangements.
In January 2013, OneAmerica made a capital contribution of $100,000 to OneAmerica Asset Management (OAM), LLC, a limited liability company domiciled in Indiana. OAM was organized on October 12, 2012 and is the registered investment advisor for the Company.
ANNUAL STATEMENT FOR THE YEAR 2016 OF THE AMERICAN UNITED LIFE INSURANCE COMPANY
19.11
In 2015, the Company formed MRO-A, LLC in order to facilitate the transfer of management and the potential sale of the mineral rights portfolios.
B. In September 2015, the Company paid a $100,000,000 ordinary dividend to OneAmerica. The company did not pay a dividend to OneAmerica in 2016.
C. Amount of transactions – refer to 10 B above.
D. At December 31, 2016, the Company reported $863,000 net due from affiliates. AUL owes $3,373,000, $473,000, $154,000, $132,000, and $23,000 to AULRMS, McCready, Pioneer Mutual, the Ohio LLCs, and Oneamerica, respectively. The receivable includes $3,075,000, $1,383,000, $533,000, $27,000, and $1,000 to OARS, State Life, OAM, OAS, HO Benefit Plan, respectively.
At December 31, 2015, the Company reported $563,000 net due to affiliates. AUL owes $1,934,000, $1,023,000, $100,000, $50,000 and $27,000 to AULRMS, McCready, the HO Benefit Plan, MRO-A, LLC, and OneAmerica, respectively. The receivable includes $1,185,000, $681,000, $345,000, $184,000, $112,000, $47,000, and $17,000 from State Life, OARS, Pioneer Mutual, the Ohio LLCs, OAM, OAS, and the Agent Benefit Plan, respectively.
The settlement terms require these balances to be settled monthly.
E. The Company guarantees the insurance liabilities of The State Life Insurance Company and Pioneer Mutual Life Insurance Company to its policyholders in the event either company becomes unable to honor such insurance liabilities. See Footnote 10 G for details of these relationships as well as the related disclosure in Footnote 14.
F. The Company has agreements with State Life, Pioneer Mutual, AULRMS, McCready and Keene, OAS and OARS to provide administrative and management services for a fee.
OAM is the registered investment advisor for the Company. The Company pays an investment management fee to OAM monthly.
G. All 50,000 shares issued and outstanding of AUL were issued to AUMIHC through OneAmerica. AUMIHC will at all times, in accordance with the Indiana Mutual Holding Company Law, control at least a majority of the voting shares of the capital stock of AUL. Policyholder membership rights exist at AUMIHC while the policyholder contract rights remain with AUL.
In 2002, Pioneer Mutual Life Insurance Company of Fargo, North Dakota, a stock insurance company, joined American United Mutual Insurance Holding Company as a wholly-owned subsidiary of OneAmerica Financial Partners, Inc.
In December 2004, The State Life Insurance Company reorganized as a wholly owned subsidiary of OneAmerica. Simultaneous with the reorganization, State Life converted to a stock insurance company. The original affiliation between AUL and State Life dates back to 1994 when the two entered into a Strategic Alliance.
H. No shares of OneAmerica Financial Partners, Inc. are held by AUL.
I. The Company does not hold any SCA investments exceeding 10% of admitted assets.
J. In 2016, the Company recognized an impairment of $4,543,411 on its investment in AULRMS. This impairment is recorded as a realized loss in the Exhibit of Capital Gains and Losses.
K. The Company does not have an investment in a foreign insurance subsidiary.
L. The Company does not hold an investment in a downstream noninsurance holding company.
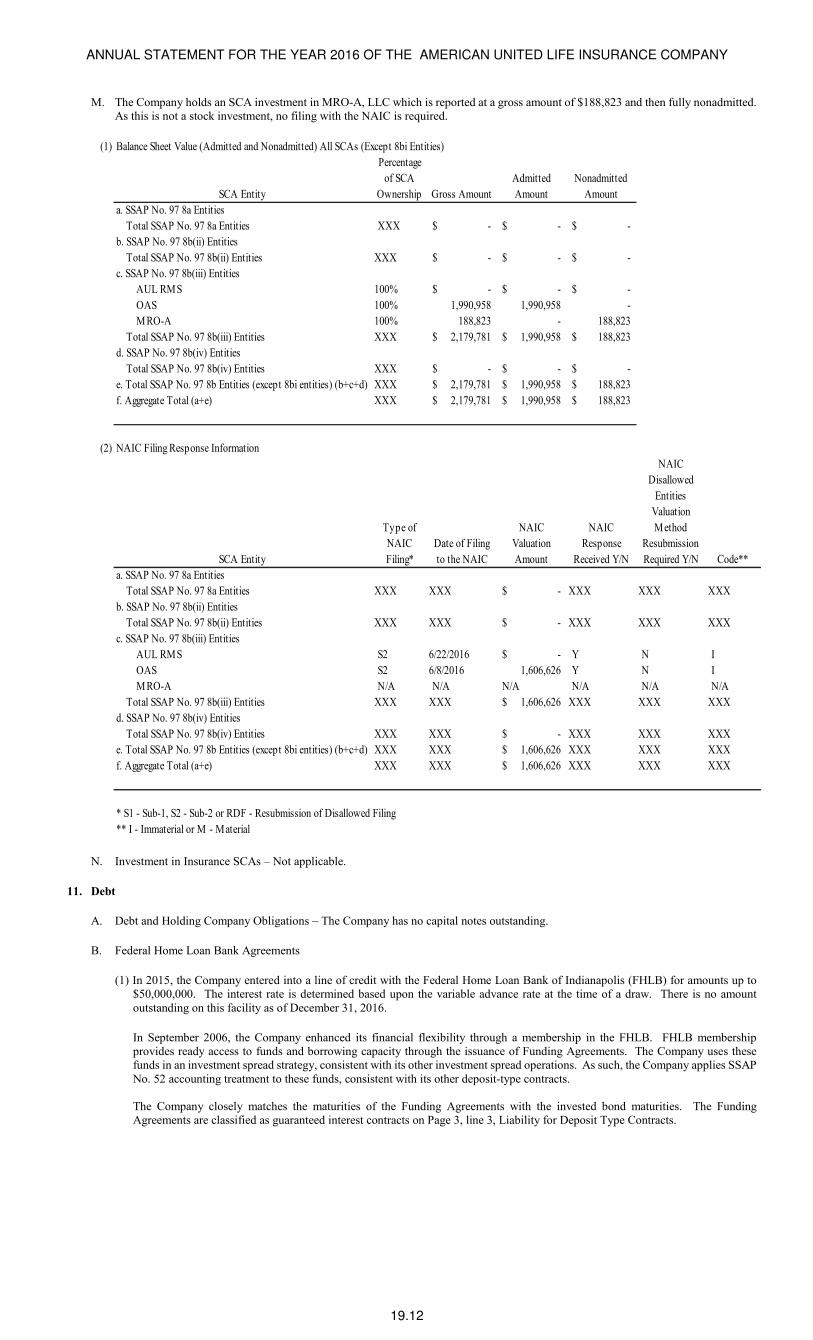
ANNUAL STATEMENT FOR THE YEAR 2016 OF THE AMERICAN UNITED LIFE INSURANCE COMPANY
19.12
M. The Company holds an SCA investment in MRO-A, LLC which is reported at a gross amount of $188,823 and then fully nonadmitted. As this is not a stock investment, no filing with the NAIC is required.
(1) Balance Sheet Value (Admitted and Nonadmitted) All SCAs (Except 8bi Entities)
SCA Entity
Percentage
of SCA
Ownership Gross Amount
Admitted
Amount
Nonadmitted
Amount
a. SSAP No. 97 8a Entities
Total SSAP No. 97 8a Entities XXX -$ -$ -$
b. SSAP No. 97 8b(ii) Entities
Total SSAP No. 97 8b(ii) Entities XXX -$ -$ -$
c. SSAP No. 97 8b(iii) Entities
AUL RMS 100% -$ -$ -$
OAS 100% 1,990,958 1,990,958 -
MRO-A 100% 188,823 - 188,823
Total SSAP No. 97 8b(iii) Entities XXX 2,179,781$ 1,990,958$ 188,823$
d. SSAP No. 97 8b(iv) Entities
Total SSAP No. 97 8b(iv) Entities XXX -$ -$ -$
e. Total SSAP No. 97 8b Entities (except 8bi entities) (b+c+d) XXX 2,179,781$ 1,990,958$ 188,823$
f. Aggregate Total (a+e) XXX 2,179,781$ 1,990,958$ 188,823$
(2) NAIC Filing Response Information
SCA Entity
Type of
NAIC
Filing*
Date of Filing
to the NAIC
NAIC
Valuation
Amount
NAIC
Response
Received Y/N
NAIC
Disallowed
Entities
Valuation
Method
Resubmission
Required Y/N Code**
a. SSAP No. 97 8a Entities
Total SSAP No. 97 8a Entities XXX XXX -$ XXX XXX XXX
b. SSAP No. 97 8b(ii) Entities
Total SSAP No. 97 8b(ii) Entities XXX XXX -$ XXX XXX XXX
c. SSAP No. 97 8b(iii) Entities
AUL RMS S2 6/22/2016 -$ Y N I
OAS S2 6/8/2016 1,606,626 Y N I
MRO-A N/A N/A N/A N/A N/A N/A
Total SSAP No. 97 8b(iii) Entities XXX XXX 1,606,626$ XXX XXX XXX
d. SSAP No. 97 8b(iv) Entities
Total SSAP No. 97 8b(iv) Entities XXX XXX -$ XXX XXX XXX
e. Total SSAP No. 97 8b Entities (except 8bi entities) (b+c+d) XXX XXX 1,606,626$ XXX XXX XXX
f. Aggregate Total (a+e) XXX XXX 1,606,626$ XXX XXX XXX
* S1 - Sub-1, S2 - Sub-2 or RDF - Resubmission of Disallowed Filing
** I - Immaterial or M - Material
N. Investment in Insurance SCAs – Not applicable.
11. Debt
A. Debt and Holding Company Obligations – The Company has no capital notes outstanding.
B. Federal Home Loan Bank Agreements
(1) In 2015, the Company entered into a line of credit with the Federal Home Loan Bank of Indianapolis (FHLB) for amounts up to $50,000,000. The interest rate is determined based upon the variable advance rate at the time of a draw. There is no amount outstanding on this facility as of December 31, 2016.
In September 2006, the Company enhanced its financial flexibility through a membership in the FHLB. FHLB membership provides ready access to funds and borrowing capacity through the issuance of Funding Agreements. The Company uses these funds in an investment spread strategy, consistent with its other investment spread operations. As such, the Company applies SSAP No. 52 accounting treatment to these funds, consistent with its other deposit-type contracts.
The Company closely matches the maturities of the Funding Agreements with the invested bond maturities. The Funding Agreements are classified as guaranteed interest contracts on Page 3, line 3, Liability for Deposit Type Contracts.
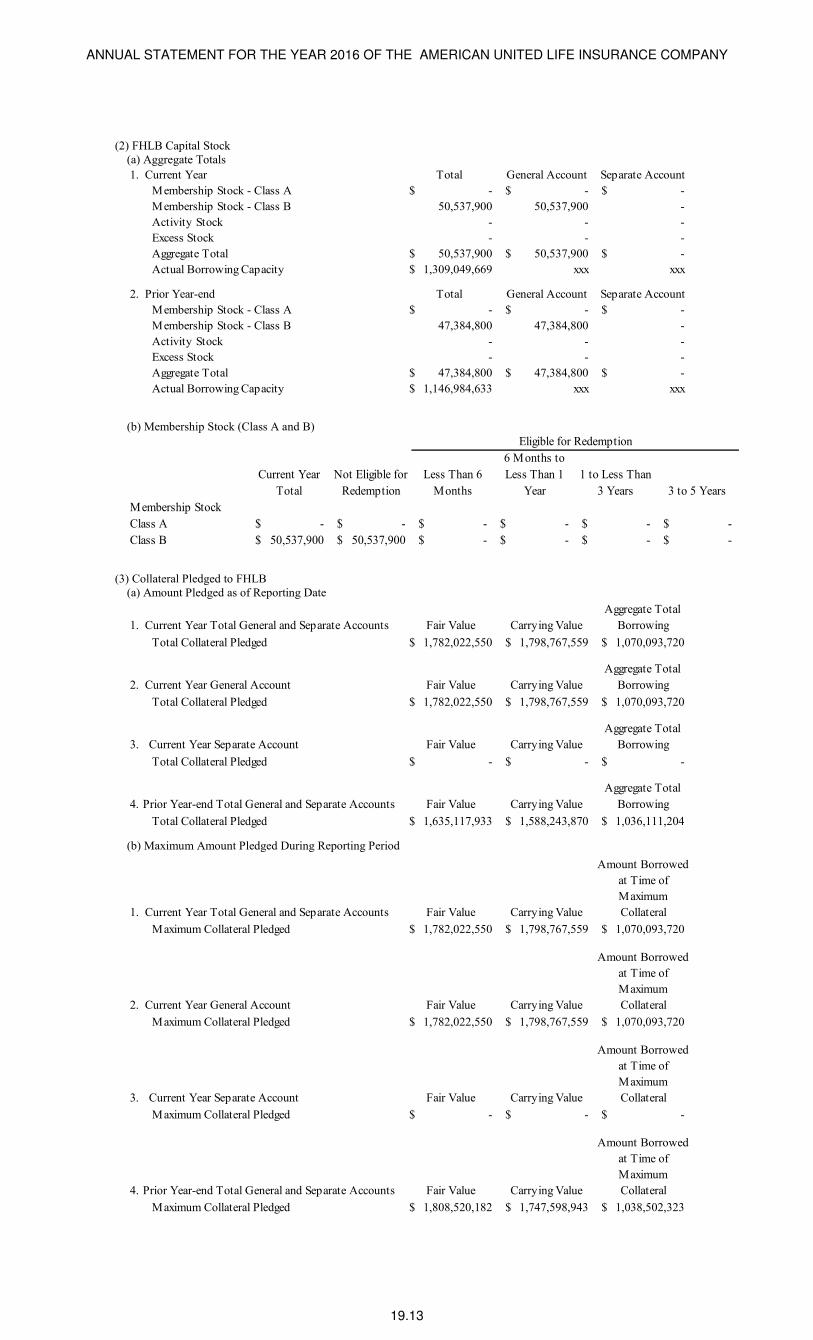
ANNUAL STATEMENT FOR THE YEAR 2016 OF THE AMERICAN UNITED LIFE INSURANCE COMPANY
19.13
(2) FHLB Capital Stock (a) Aggregate Totals
Total General Account Separate Account
Membership Stock - Class A -$ -$ -$
Membership Stock - Class B 50,537,900 50,537,900 -
Activity Stock - - -
Excess Stock - - -
Aggregate Total 50,537,900$ 50,537,900$ -$
Actual Borrowing Capacity 1,309,049,669$ xxx xxx
Total General Account Separate Account
Membership Stock - Class A -$ -$ -$
Membership Stock - Class B 47,384,800 47,384,800 -
Activity Stock - - -
Excess Stock - - -
Aggregate Total 47,384,800$ 47,384,800$ -$
Actual Borrowing Capacity 1,146,984,633$ xxx xxx
2. Prior Year-end
1. Current Year
(b) Membership Stock (Class A and B)
Current Year
Total
Not Eligible for
Redemption
Less Than 6
Months
6 Months to
Less Than 1
Year
1 to Less Than
3 Years 3 to 5 Years
Membership Stock
Class A -$ -$ -$ -$ -$ -$
Class B 50,537,900$ 50,537,900$ -$ -$ -$ -$
Eligible for Redemption
(3) Collateral Pledged to FHLB
(a) Amount Pledged as of Reporting Date
Fair Value Carrying Value
Aggregate Total
Borrowing
Total Collateral Pledged 1,782,022,550$ 1,798,767,559$ 1,070,093,720$
Fair Value Carrying Value
Aggregate Total
Borrowing
Total Collateral Pledged 1,782,022,550$ 1,798,767,559$ 1,070,093,720$
Fair Value Carrying Value
Aggregate Total
Borrowing
Total Collateral Pledged -$ -$ -$
Fair Value Carrying Value
Aggregate Total
Borrowing
Total Collateral Pledged 1,635,117,933$ 1,588,243,870$ 1,036,111,204$
1. Current Year Total General and Separate Accounts
2. Current Year General Account
3. Current Year Separate Account
4. Prior Year-end Total General and Separate Accounts
(b) Maximum Amount Pledged During Reporting Period
Fair Value Carrying Value
Amount Borrowed
at Time of
Maximum
Collateral
Maximum Collateral Pledged 1,782,022,550$ 1,798,767,559$ 1,070,093,720$
Fair Value Carrying Value
Amount Borrowed
at Time of
Maximum
Collateral
Maximum Collateral Pledged 1,782,022,550$ 1,798,767,559$ 1,070,093,720$
Fair Value Carrying Value
Amount Borrowed
at Time of
Maximum
Collateral
Maximum Collateral Pledged -$ -$ -$
Fair Value Carrying Value
Amount Borrowed
at Time of
Maximum
Collateral
Maximum Collateral Pledged 1,808,520,182$ 1,747,598,943$ 1,038,502,323$
1. Current Year Total General and Separate Accounts
2. Current Year General Account
3. Current Year Separate Account
4. Prior Year-end Total General and Separate Accounts
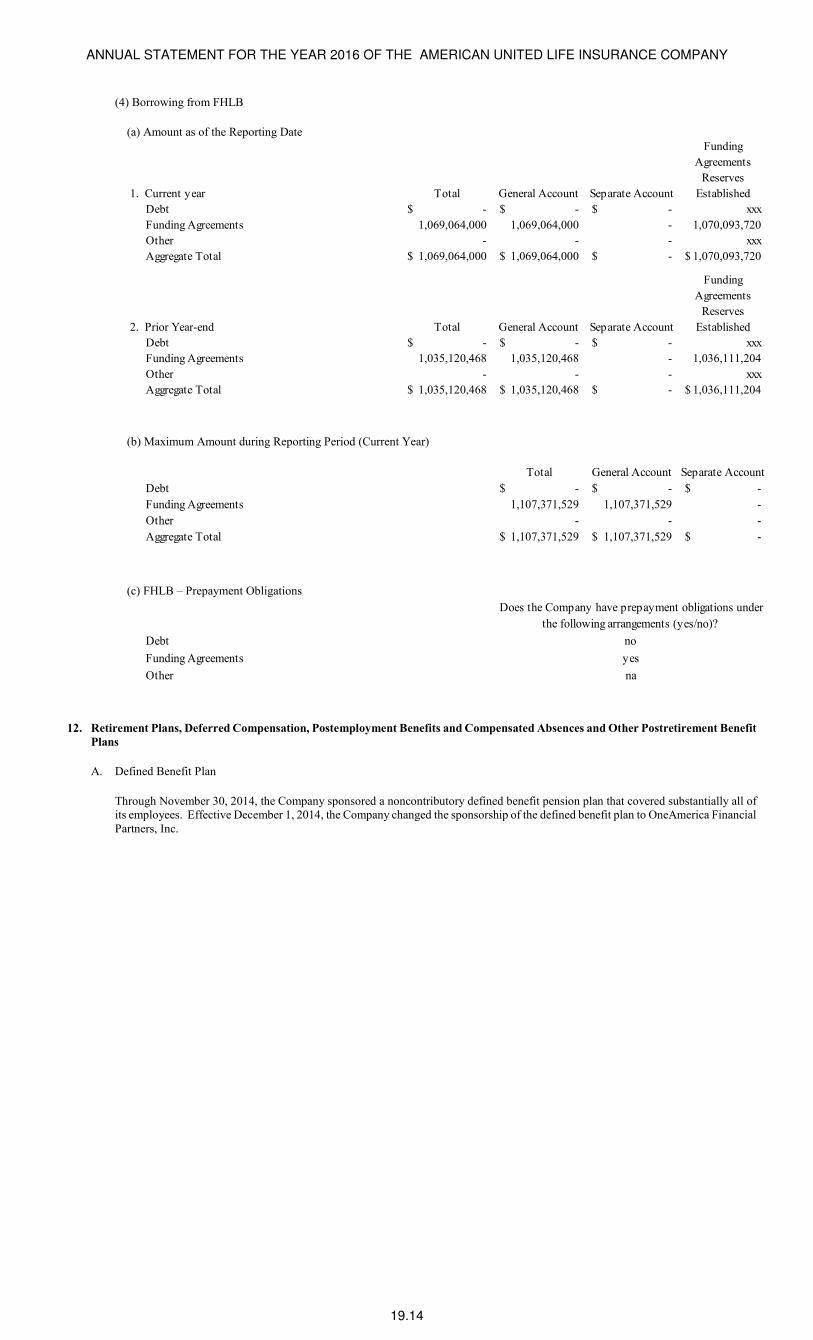
ANNUAL STATEMENT FOR THE YEAR 2016 OF THE AMERICAN UNITED LIFE INSURANCE COMPANY
19.14
(4) Borrowing from FHLB
(a) Amount as of the Reporting Date
1. Current year Total General Account Separate Account
Funding
Agreements
Reserves
Established
Debt -$ -$ -$ xxx
Funding Agreements 1,069,064,000 1,069,064,000 - 1,070,093,720
Other - - - xxx
Aggregate Total 1,069,064,000$ 1,069,064,000$ -$ 1,070,093,720$
2. Prior Year-end Total General Account Separate Account
Funding
Agreements
Reserves
Established
Debt -$ -$ -$ xxx
Funding Agreements 1,035,120,468 1,035,120,468 - 1,036,111,204
Other - - - xxx
Aggregate Total 1,035,120,468$ 1,035,120,468$ -$ 1,036,111,204$
(b) Maximum Amount during Reporting Period (Current Year)
Total General Account Separate Account
Debt -$ -$ -$
Funding Agreements 1,107,371,529 1,107,371,529 -
Other - - -
Aggregate Total 1,107,371,529$ 1,107,371,529$ -$
(c) FHLB – Prepayment Obligations
Debt
Funding Agreements
Other
Does the Company have prepayment obligations under
the following arrangements (yes/no)?
no
yes
na
12. Retirement Plans, Deferred Compensation, Postemployment Benefits and Compensated Absences and Other Postretirement Benefit
Plans
A. Defined Benefit Plan
Through November 30, 2014, the Company sponsored a noncontributory defined benefit pension plan that covered substantially all of its employees. Effective December 1, 2014, the Company changed the sponsorship of the defined benefit plan to OneAmerica Financial Partners, Inc.
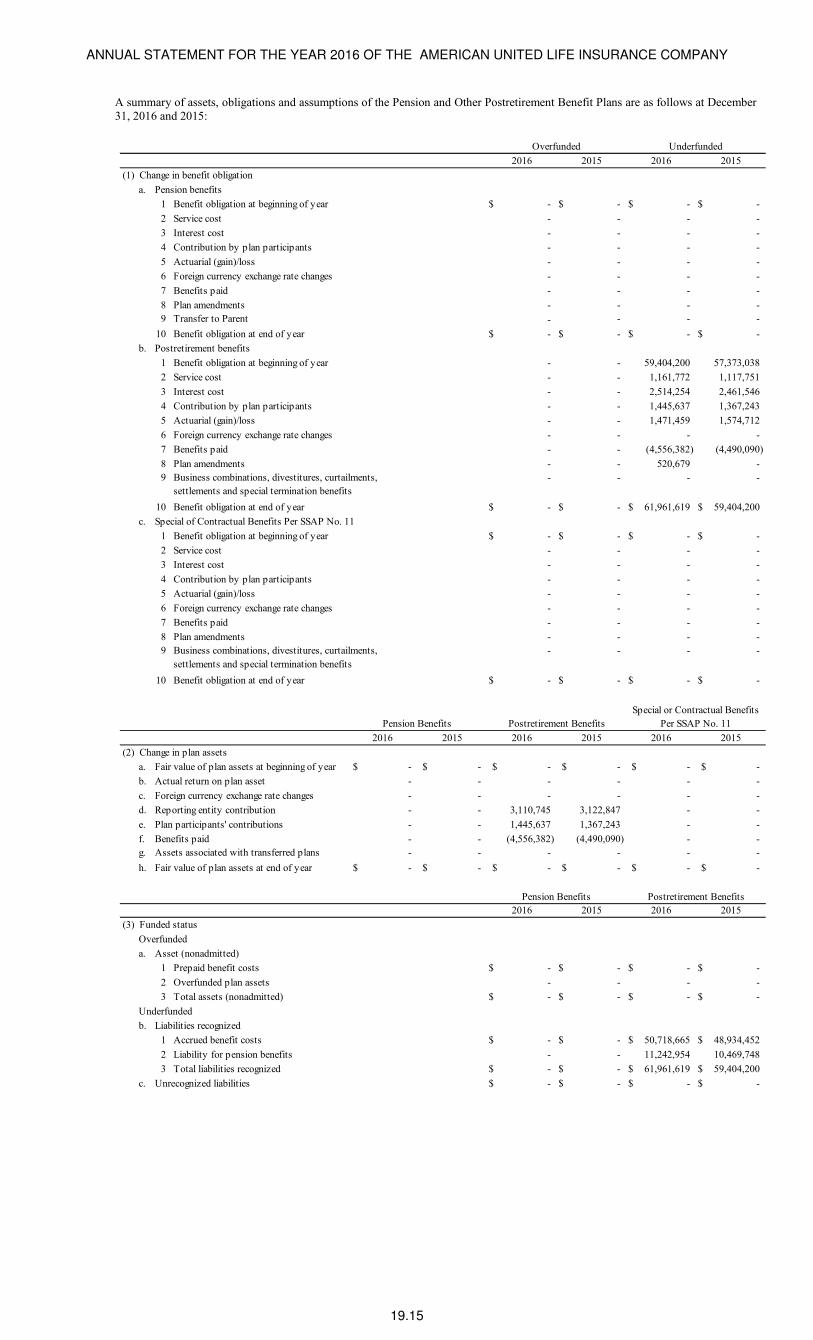
ANNUAL STATEMENT FOR THE YEAR 2016 OF THE AMERICAN UNITED LIFE INSURANCE COMPANY
19.15
A summary of assets, obligations and assumptions of the Pension and Other Postretirement Benefit Plans are as follows at December 31, 2016 and 2015:
2016 2015 2016 2015
(1) Change in benefit obligation
a. Pension benefits
1 Benefit obligation at beginning of year -$ -$ -$ -$
2 Service cost - - - -
3 Interest cost - - - -
4 Contribution by plan participants - - - -
5 Actuarial (gain)/loss - - - -
6 Foreign currency exchange rate changes - - - -
7 Benefits paid - - - -
8 Plan amendments - - - -
9 - - - -
10 Benefit obligation at end of year -$ -$ -$ -$
b. Postretirement benefits
1 Benefit obligation at beginning of year - - 59,404,200 57,373,038
2 Service cost - - 1,161,772 1,117,751
3 Interest cost - - 2,514,254 2,461,546
4 Contribution by plan participants - - 1,445,637 1,367,243
5 Actuarial (gain)/loss - - 1,471,459 1,574,712
6 Foreign currency exchange rate changes - - - -
7 Benefits paid - - (4,556,382) (4,490,090)
8 Plan amendments - - 520,679 -
9 - - - -
10 Benefit obligation at end of year -$ -$ 61,961,619$ 59,404,200$
c. Special of Contractual Benefits Per SSAP No. 11
1 Benefit obligation at beginning of year -$ -$ -$ -$
2 Service cost - - - -
3 Interest cost - - - -
4 Contribution by plan participants - - - -
5 Actuarial (gain)/loss - - - -
6 Foreign currency exchange rate changes - - - -
7 Benefits paid - - - -
8 Plan amendments - - - -
9 - - - -
10 Benefit obligation at end of year -$ -$ -$ -$
2016 2015 2016 2015 2016 2015
(2) Change in plan assets
a. Fair value of plan assets at beginning of year -$ -$ -$ -$ -$ -$
b. Actual return on plan asset - - - - - -
c. Foreign currency exchange rate changes - - - - - -
d. Reporting entity contribution - - 3,110,745 3,122,847 - -
e. Plan participants' contributions - - 1,445,637 1,367,243 - -
f. Benefits paid - - (4,556,382) (4,490,090) - -
g. - - - - - -
h. Fair value of plan assets at end of year -$ -$ -$ -$ -$ -$
2016 2015 2016 2015
(3) Funded status
Overfunded
a. Asset (nonadmitted)
1 Prepaid benefit costs -$ -$ -$ -$
2 Overfunded plan assets - - - -
3 Total assets (nonadmitted) -$ -$ -$ -$
Underfunded
b. Liabilities recognized
1 Accrued benefit costs -$ -$ 50,718,665$ 48,934,452$
2 Liability for pension benefits - - 11,242,954 10,469,748
3 Total liabilities recognized -$ -$ 61,961,619$ 59,404,200$
c. Unrecognized liabilities -$ -$ -$ -$
Overfunded Underfunded
Transfer to Parent
Business combinations, divestitures, curtailments,
settlements and special termination benefits
Business combinations, divestitures, curtailments,
settlements and special termination benefits
Pension Benefits
Pension Benefits Postretirement Benefits
Assets associated with transferred plans
Postretirement Benefits
Special or Contractual Benefits
Per SSAP No. 11
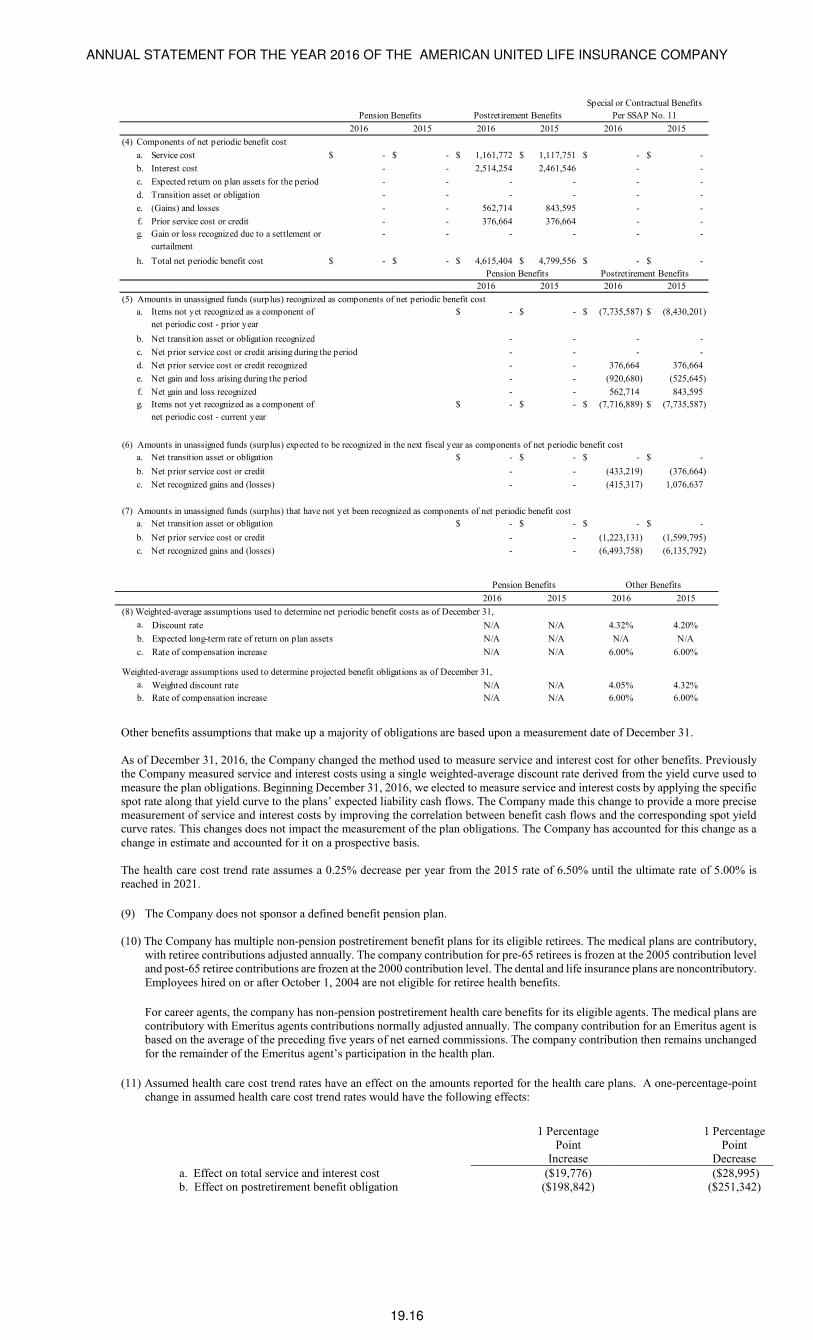
ANNUAL STATEMENT FOR THE YEAR 2016 OF THE AMERICAN UNITED LIFE INSURANCE COMPANY
19.16
2016 2015 2016 2015 2016 2015
(4) Components of net periodic benefit cost
a. -$ -$ 1,161,772$ 1,117,751$ -$ -$
b. - - 2,514,254 2,461,546 - -
c. - - - - - -
d. - - - - - -
e. - - 562,714 843,595 - -
f. - - 376,664 376,664 - -
g. - - - - - -
h. -$ -$ 4,615,404$ 4,799,556$ -$ -$
2016 2015 2016 2015
(5) Amounts in unassigned funds (surplus) recognized as components of net periodic benefit cost
a. -$ -$ (7,735,587)$ (8,430,201)$
b. - - - -
c. - - - -
d. - - 376,664 376,664
e. - - (920,680) (525,645)
f. - - 562,714 843,595
g. -$ -$ (7,716,889)$ (7,735,587)$
(6) Amounts in unassigned funds (surplus) expected to be recognized in the next fiscal year as components of net periodic benefit cost
a. -$ -$ -$ -$
b. - - (433,219) (376,664)
c. - - (415,317) 1,076,637
(7) Amounts in unassigned funds (surplus) that have not yet been recognized as components of net periodic benefit cost
a. -$ -$ -$ -$
b. - - (1,223,131) (1,599,795)
c. - - (6,493,758) (6,135,792)
Net transition asset or obligation
Net prior service cost or credit
Net recognized gains and (losses)
Items not yet recognized as a component of
net periodic cost - current year
Net transition asset or obligation
Net prior service cost or credit
Net recognized gains and (losses)
Items not yet recognized as a component of
net periodic cost - prior year
Net transition asset or obligation recognized
Net prior service cost or credit recognized
Net gain and loss arising during the period
Net gain and loss recognized
Net prior service cost or credit arising during the period
Prior service cost or credit
Gain or loss recognized due to a settlement or
curtailment
Total net periodic benefit cost
Special or Contractual Benefits
Per SSAP No. 11Pension Benefits Postretirement Benefits
Service cost
Interest cost
Expected return on plan assets for the period
Transition asset or obligation
(Gains) and losses
Pension Benefits Postretirement Benefits
2016 2015 2016 2015
a. Discount rate N/A N/A 4.32% 4.20%
b. Expected long-term rate of return on plan assets N/A N/A N/A N/A
c. Rate of compensation increase N/A N/A 6.00% 6.00%
a. Weighted discount rate N/A N/A 4.05% 4.32%
b. Rate of compensation increase N/A N/A 6.00% 6.00%
Pension Benefits Other Benefits
(8) Weighted-average assumptions used to determine net periodic benefit costs as of December 31,
Weighted-average assumptions used to determine projected benefit obligations as of December 31,
Other benefits assumptions that make up a majority of obligations are based upon a measurement date of December 31. As of December 31, 2016, the Company changed the method used to measure service and interest cost for other benefits. Previously the Company measured service and interest costs using a single weighted-average discount rate derived from the yield curve used to measure the plan obligations. Beginning December 31, 2016, we elected to measure service and interest costs by applying the specific spot rate along that yield curve to the plans’ expected liability cash flows. The Company made this change to provide a more precise measurement of service and interest costs by improving the correlation between benefit cash flows and the corresponding spot yield curve rates. This changes does not impact the measurement of the plan obligations. The Company has accounted for this change as a change in estimate and accounted for it on a prospective basis. The health care cost trend rate assumes a 0.25% decrease per year from the 2015 rate of 6.50% until the ultimate rate of 5.00% is reached in 2021.
(9) The Company does not sponsor a defined benefit pension plan. (10) The Company has multiple non-pension postretirement benefit plans for its eligible retirees. The medical plans are contributory,
with retiree contributions adjusted annually. The company contribution for pre-65 retirees is frozen at the 2005 contribution level and post-65 retiree contributions are frozen at the 2000 contribution level. The dental and life insurance plans are noncontributory. Employees hired on or after October 1, 2004 are not eligible for retiree health benefits.
For career agents, the company has non-pension postretirement health care benefits for its eligible agents. The medical plans are contributory with Emeritus agents contributions normally adjusted annually. The company contribution for an Emeritus agent is based on the average of the preceding five years of net earned commissions. The company contribution then remains unchanged for the remainder of the Emeritus agent’s participation in the health plan.
(11) Assumed health care cost trend rates have an effect on the amounts reported for the health care plans. A one-percentage-point change in assumed health care cost trend rates would have the following effects:
1 Percentage Point
Increase
1 Percentage Point
Decrease
a. Effect on total service and interest cost ($19,776) ($28,995) b. Effect on postretirement benefit obligation ($198,842) ($251,342)
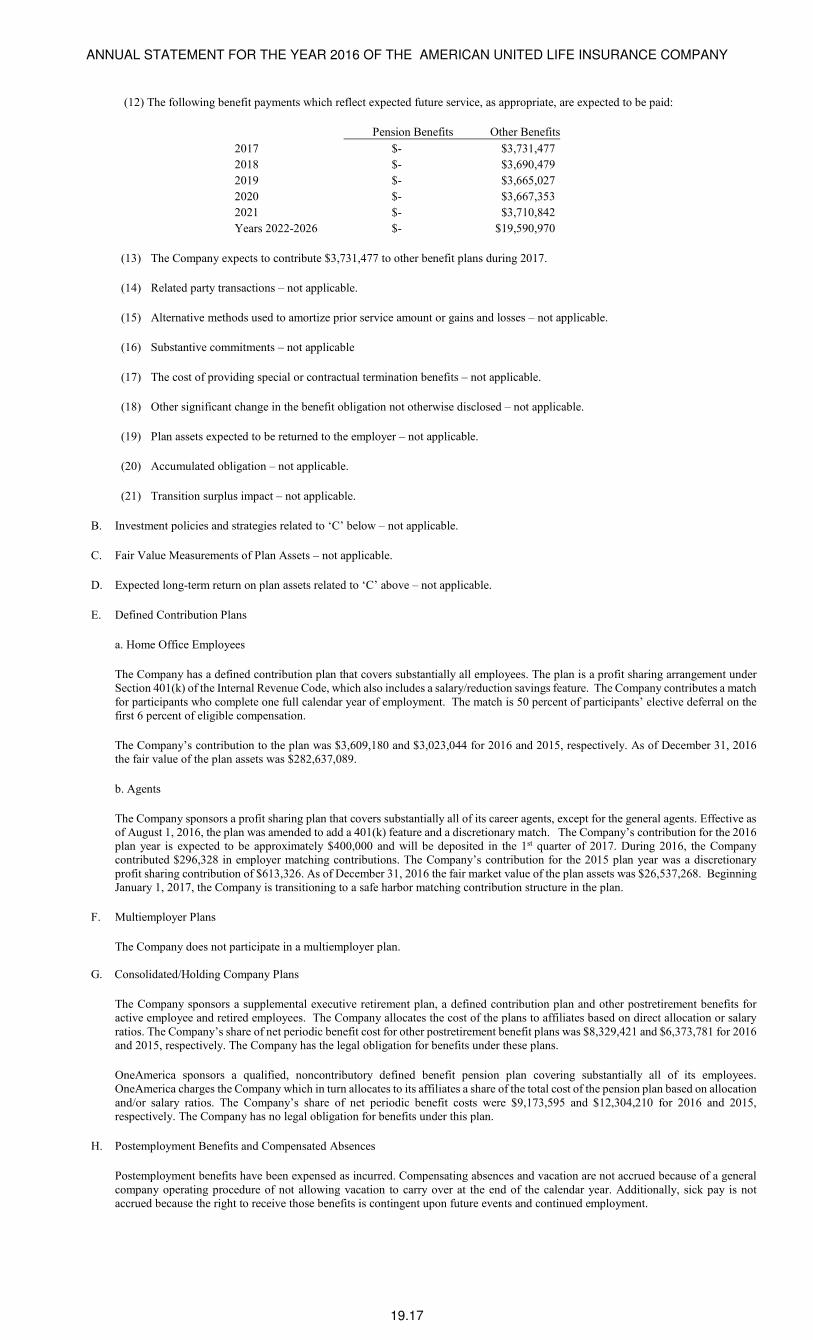
ANNUAL STATEMENT FOR THE YEAR 2016 OF THE AMERICAN UNITED LIFE INSURANCE COMPANY
19.17
(12) The following benefit payments which reflect expected future service, as appropriate, are expected to be paid:
Pension Benefits Other Benefits
2017 $- $3,731,477
2018 $- $3,690,479
2019 $- $3,665,027
2020 $- $3,667,353
2021 $- $3,710,842
Years 2022-2026 $- $19,590,970
(13) The Company expects to contribute $3,731,477 to other benefit plans during 2017.
(14) Related party transactions – not applicable.
(15) Alternative methods used to amortize prior service amount or gains and losses – not applicable.
(16) Substantive commitments – not applicable
(17) The cost of providing special or contractual termination benefits – not applicable.
(18) Other significant change in the benefit obligation not otherwise disclosed – not applicable.
(19) Plan assets expected to be returned to the employer – not applicable.
(20) Accumulated obligation – not applicable.
(21) Transition surplus impact – not applicable.
B. Investment policies and strategies related to ‘C’ below – not applicable.
C. Fair Value Measurements of Plan Assets – not applicable.
D. Expected long-term return on plan assets related to ‘C’ above – not applicable.
E. Defined Contribution Plans
a. Home Office Employees
The Company has a defined contribution plan that covers substantially all employees. The plan is a profit sharing arrangement under Section 401(k) of the Internal Revenue Code, which also includes a salary/reduction savings feature. The Company contributes a match for participants who complete one full calendar year of employment. The match is 50 percent of participants’ elective deferral on the first 6 percent of eligible compensation.
The Company’s contribution to the plan was $3,609,180 and $3,023,044 for 2016 and 2015, respectively. As of December 31, 2016 the fair value of the plan assets was $282,637,089.
b. Agents
The Company sponsors a profit sharing plan that covers substantially all of its career agents, except for the general agents. Effective as of August 1, 2016, the plan was amended to add a 401(k) feature and a discretionary match. The Company’s contribution for the 2016 plan year is expected to be approximately $400,000 and will be deposited in the 1st quarter of 2017. During 2016, the Company contributed $296,328 in employer matching contributions. The Company’s contribution for the 2015 plan year was a discretionary profit sharing contribution of $613,326. As of December 31, 2016 the fair market value of the plan assets was $26,537,268. Beginning January 1, 2017, the Company is transitioning to a safe harbor matching contribution structure in the plan.
F. Multiemployer Plans
The Company does not participate in a multiemployer plan.
G. Consolidated/Holding Company Plans
The Company sponsors a supplemental executive retirement plan, a defined contribution plan and other postretirement benefits for active employee and retired employees. The Company allocates the cost of the plans to affiliates based on direct allocation or salary ratios. The Company’s share of net periodic benefit cost for other postretirement benefit plans was $8,329,421 and $6,373,781 for 2016 and 2015, respectively. The Company has the legal obligation for benefits under these plans.
OneAmerica sponsors a qualified, noncontributory defined benefit pension plan covering substantially all of its employees. OneAmerica charges the Company which in turn allocates to its affiliates a share of the total cost of the pension plan based on allocation and/or salary ratios. The Company’s share of net periodic benefit costs were $9,173,595 and $12,304,210 for 2016 and 2015, respectively. The Company has no legal obligation for benefits under this plan.
H. Postemployment Benefits and Compensated Absences
Postemployment benefits have been expensed as incurred. Compensating absences and vacation are not accrued because of a general company operating procedure of not allowing vacation to carry over at the end of the calendar year. Additionally, sick pay is not accrued because the right to receive those benefits is contingent upon future events and continued employment.
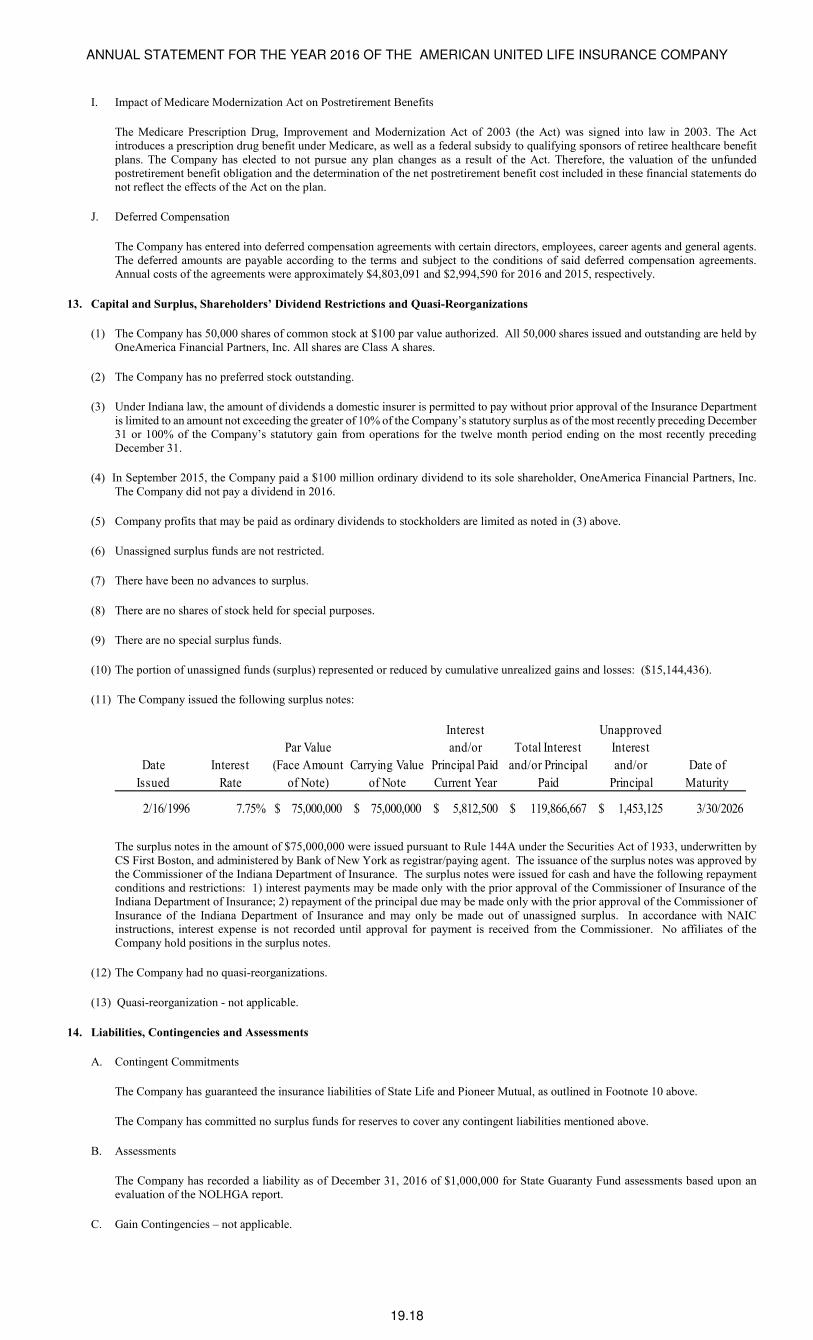
ANNUAL STATEMENT FOR THE YEAR 2016 OF THE AMERICAN UNITED LIFE INSURANCE COMPANY
19.18
I. Impact of Medicare Modernization Act on Postretirement Benefits
The Medicare Prescription Drug, Improvement and Modernization Act of 2003 (the Act) was signed into law in 2003. The Act introduces a prescription drug benefit under Medicare, as well as a federal subsidy to qualifying sponsors of retiree healthcare benefit plans. The Company has elected to not pursue any plan changes as a result of the Act. Therefore, the valuation of the unfunded postretirement benefit obligation and the determination of the net postretirement benefit cost included in these financial statements do not reflect the effects of the Act on the plan.
J. Deferred Compensation
The Company has entered into deferred compensation agreements with certain directors, employees, career agents and general agents. The deferred amounts are payable according to the terms and subject to the conditions of said deferred compensation agreements. Annual costs of the agreements were approximately $4,803,091 and $2,994,590 for 2016 and 2015, respectively.
13. Capital and Surplus, Shareholders’ Dividend Restrictions and Quasi-Reorganizations
(1) The Company has 50,000 shares of common stock at $100 par value authorized. All 50,000 shares issued and outstanding are held by OneAmerica Financial Partners, Inc. All shares are Class A shares.
(2) The Company has no preferred stock outstanding.
(3) Under Indiana law, the amount of dividends a domestic insurer is permitted to pay without prior approval of the Insurance Department is limited to an amount not exceeding the greater of 10% of the Company’s statutory surplus as of the most recently preceding December 31 or 100% of the Company’s statutory gain from operations for the twelve month period ending on the most recently preceding December 31.
(4) In September 2015, the Company paid a $100 million ordinary dividend to its sole shareholder, OneAmerica Financial Partners, Inc. The Company did not pay a dividend in 2016.
(5) Company profits that may be paid as ordinary dividends to stockholders are limited as noted in (3) above.
(6) Unassigned surplus funds are not restricted.
(7) There have been no advances to surplus.
(8) There are no shares of stock held for special purposes.
(9) There are no special surplus funds.
(10) The portion of unassigned funds (surplus) represented or reduced by cumulative unrealized gains and losses: ($15,144,436).
(11) The Company issued the following surplus notes:
Date
Issued
Interest
Rate
Par Value
(Face Amount
of Note)
Carrying Value
of Note
Interest
and/or
Principal Paid
Current Year
Total Interest
and/or Principal
Paid
Unapproved
Interest
and/or
Principal
Date of
Maturity
2/16/1996 7.75% 75,000,000$ 75,000,000$ 5,812,500$ 119,866,667$ 1,453,125$ 3/30/2026
The surplus notes in the amount of $75,000,000 were issued pursuant to Rule 144A under the Securities Act of 1933, underwritten by CS First Boston, and administered by Bank of New York as registrar/paying agent. The issuance of the surplus notes was approved by the Commissioner of the Indiana Department of Insurance. The surplus notes were issued for cash and have the following repayment conditions and restrictions: 1) interest payments may be made only with the prior approval of the Commissioner of Insurance of the Indiana Department of Insurance; 2) repayment of the principal due may be made only with the prior approval of the Commissioner of Insurance of the Indiana Department of Insurance and may only be made out of unassigned surplus. In accordance with NAIC instructions, interest expense is not recorded until approval for payment is received from the Commissioner. No affiliates of the Company hold positions in the surplus notes.
(12) The Company had no quasi-reorganizations.
(13) Quasi-reorganization - not applicable.
14. Liabilities, Contingencies and Assessments
A. Contingent Commitments
The Company has guaranteed the insurance liabilities of State Life and Pioneer Mutual, as outlined in Footnote 10 above.
The Company has committed no surplus funds for reserves to cover any contingent liabilities mentioned above.
B. Assessments
The Company has recorded a liability as of December 31, 2016 of $1,000,000 for State Guaranty Fund assessments based upon an evaluation of the NOLHGA report.
C. Gain Contingencies – not applicable.
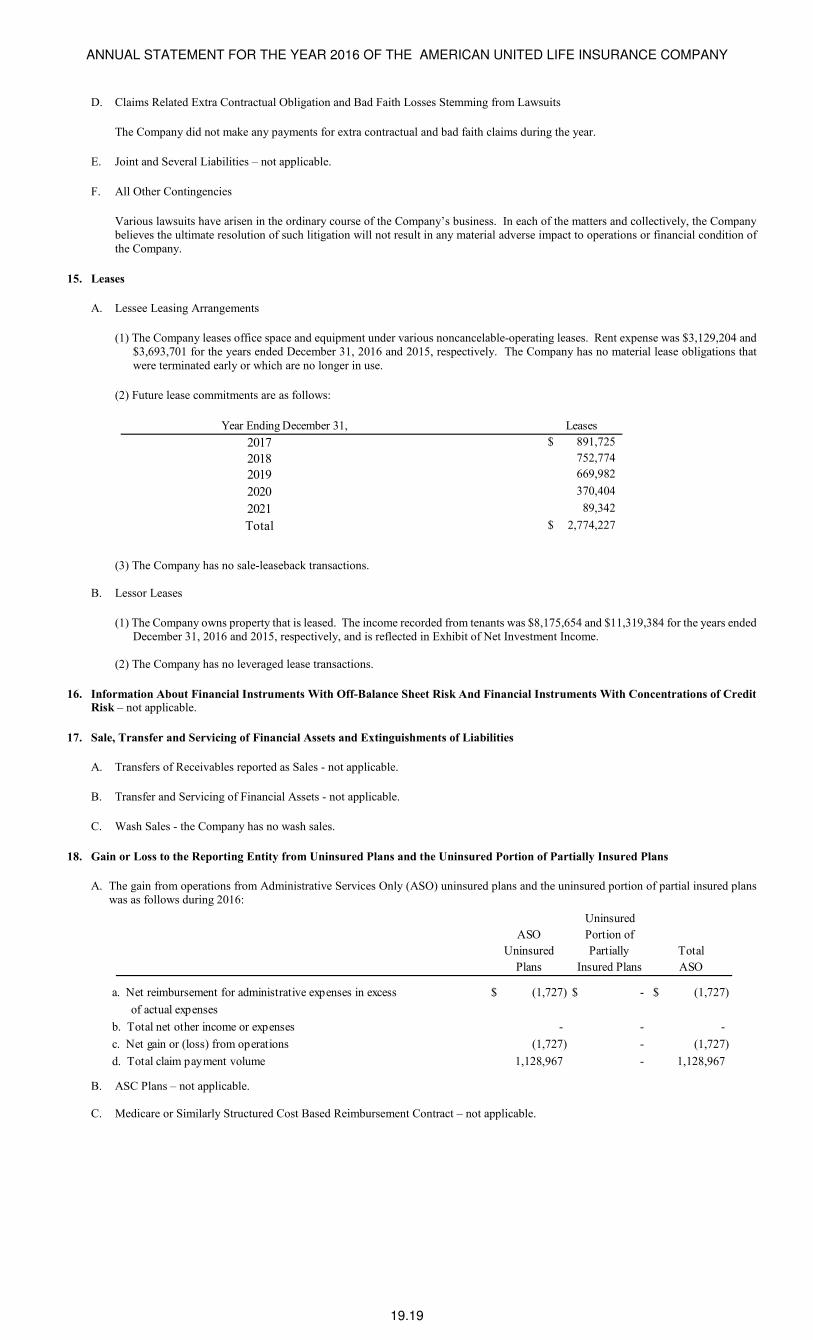
ANNUAL STATEMENT FOR THE YEAR 2016 OF THE AMERICAN UNITED LIFE INSURANCE COMPANY
19.19
D. Claims Related Extra Contractual Obligation and Bad Faith Losses Stemming from Lawsuits
The Company did not make any payments for extra contractual and bad faith claims during the year.
E. Joint and Several Liabilities – not applicable.
F. All Other Contingencies
Various lawsuits have arisen in the ordinary course of the Company’s business. In each of the matters and collectively, the Company believes the ultimate resolution of such litigation will not result in any material adverse impact to operations or financial condition of the Company.
15. Leases
A. Lessee Leasing Arrangements
(1) The Company leases office space and equipment under various noncancelable-operating leases. Rent expense was $3,129,204 and $3,693,701 for the years ended December 31, 2016 and 2015, respectively. The Company has no material lease obligations that were terminated early or which are no longer in use.
(2) Future lease commitments are as follows:
Year Ending December 31, Leases
2017 891,725$
2018 752,774
2019 669,982
2020 370,404
2021 89,342
Total 2,774,227$
(3) The Company has no sale-leaseback transactions.
B. Lessor Leases
(1) The Company owns property that is leased. The income recorded from tenants was $8,175,654 and $11,319,384 for the years ended December 31, 2016 and 2015, respectively, and is reflected in Exhibit of Net Investment Income.
(2) The Company has no leveraged lease transactions.
16. Information About Financial Instruments With Off-Balance Sheet Risk And Financial Instruments With Concentrations of Credit
Risk – not applicable.
17. Sale, Transfer and Servicing of Financial Assets and Extinguishments of Liabilities
A. Transfers of Receivables reported as Sales - not applicable.
B. Transfer and Servicing of Financial Assets - not applicable.
C. Wash Sales - the Company has no wash sales.
18. Gain or Loss to the Reporting Entity from Uninsured Plans and the Uninsured Portion of Partially Insured Plans
A. The gain from operations from Administrative Services Only (ASO) uninsured plans and the uninsured portion of partial insured plans was as follows during 2016:
ASO
Uninsured
Plans
Uninsured
Portion of
Partially
Insured Plans
Total
ASO
a. Net reimbursement for administrative expenses in excess (1,727)$ -$ (1,727)$
of actual expenses
b. Total net other income or expenses - - -
c. Net gain or (loss) from operations (1,727) - (1,727)
d. Total claim payment volume 1,128,967 - 1,128,967
B. ASC Plans – not applicable. C. Medicare or Similarly Structured Cost Based Reimbursement Contract – not applicable.
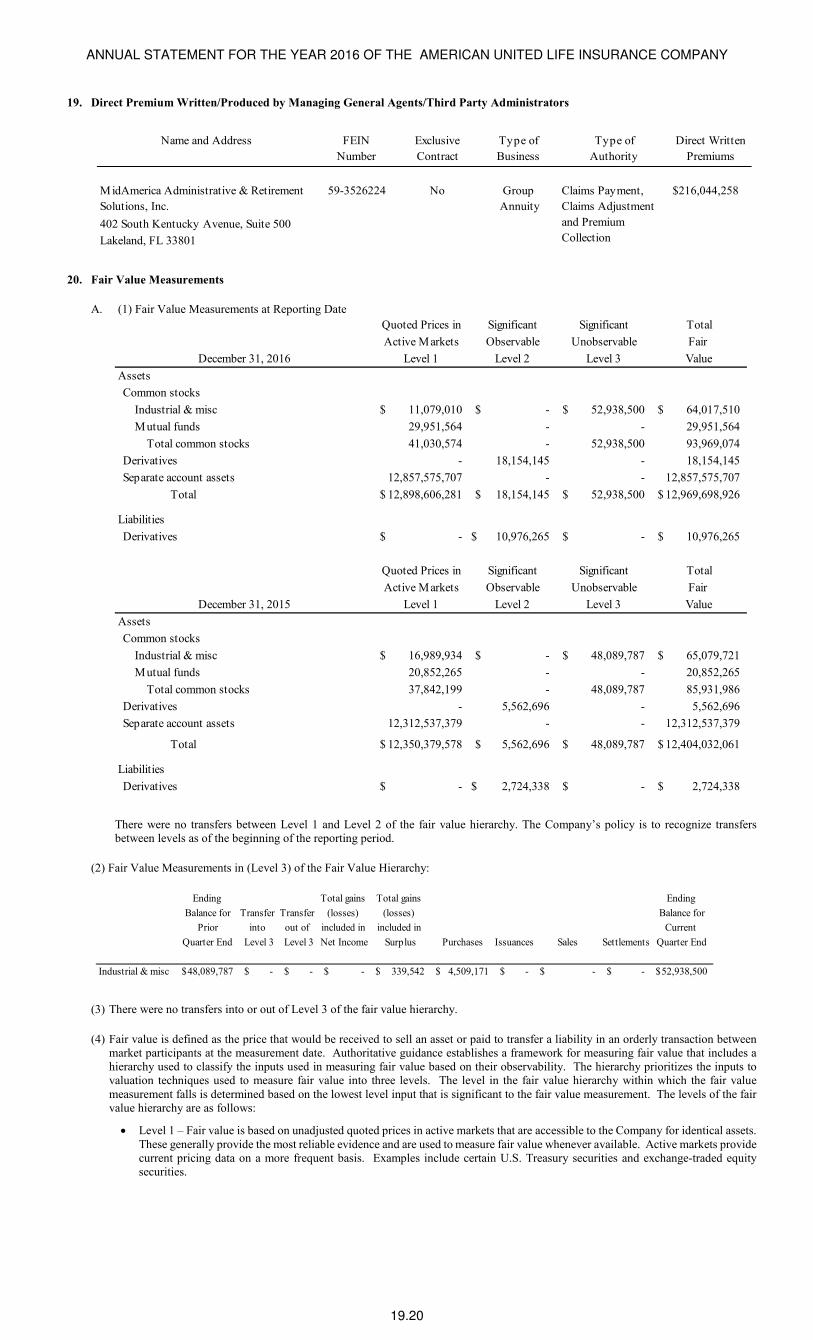
ANNUAL STATEMENT FOR THE YEAR 2016 OF THE AMERICAN UNITED LIFE INSURANCE COMPANY
19.20
19. Direct Premium Written/Produced by Managing General Agents/Third Party Administrators
Name and Address FEIN
Number
Exclusive
Contract
Type of
Business
Type of
Authority
Direct Written
Premiums
MidAmerica Administrative & Retirement
Solutions, Inc.
59-3526224 No Group
Annuity
$216,044,258
402 South Kentucky Avenue, Suite 500
Lakeland, FL 33801
Claims Payment,
Claims Adjustment
and Premium
Collection
20. Fair Value Measurements
A. (1) Fair Value Measurements at Reporting Date
Quoted Prices in Significant Significant Total
Active Markets Observable Unobservable Fair
Level 1 Level 2 Level 3 Value
Assets
Common stocks
Industrial & misc 11,079,010$ -$ 52,938,500$ 64,017,510$
Mutual funds 29,951,564 - - 29,951,564
Total common stocks 41,030,574 - 52,938,500 93,969,074
Derivatives - 18,154,145 - 18,154,145
Separate account assets 12,857,575,707 - - 12,857,575,707
Total 12,898,606,281$ 18,154,145$ 52,938,500$ 12,969,698,926$
Liabilities
Derivatives -$ 10,976,265$ -$ 10,976,265$
Quoted Prices in Significant Significant Total
Active Markets Observable Unobservable Fair
Level 1 Level 2 Level 3 Value
Assets
Common stocks
Industrial & misc 16,989,934$ -$ 48,089,787$ 65,079,721$
Mutual funds 20,852,265 - - 20,852,265
Total common stocks 37,842,199 - 48,089,787 85,931,986
Derivatives - 5,562,696 - 5,562,696
Separate account assets 12,312,537,379 - - 12,312,537,379
Total 12,350,379,578$ 5,562,696$ 48,089,787$ 12,404,032,061$
Liabilities
Derivatives -$ 2,724,338$ -$ 2,724,338$
December 31, 2016
December 31, 2015
There were no transfers between Level 1 and Level 2 of the fair value hierarchy. The Company’s policy is to recognize transfers between levels as of the beginning of the reporting period.
(2) Fair Value Measurements in (Level 3) of the Fair Value Hierarchy:
Ending Total gains Total gains Ending
Balance for Transfer Transfer (losses) (losses) Balance for
Prior into out of included in included in Current
Quarter End Level 3 Level 3 Net Income Surplus Purchases Issuances Sales Settlements Quarter End
Industrial & misc 48,089,787$ -$ -$ -$ 339,542$ 4,509,171$ -$ -$ -$ 52,938,500$
(3) There were no transfers into or out of Level 3 of the fair value hierarchy.
(4) Fair value is defined as the price that would be received to sell an asset or paid to transfer a liability in an orderly transaction between market participants at the measurement date. Authoritative guidance establishes a framework for measuring fair value that includes a hierarchy used to classify the inputs used in measuring fair value based on their observability. The hierarchy prioritizes the inputs to valuation techniques used to measure fair value into three levels. The level in the fair value hierarchy within which the fair value measurement falls is determined based on the lowest level input that is significant to the fair value measurement. The levels of the fair value hierarchy are as follows:
• Level 1 – Fair value is based on unadjusted quoted prices in active markets that are accessible to the Company for identical assets. These generally provide the most reliable evidence and are used to measure fair value whenever available. Active markets provide current pricing data on a more frequent basis. Examples include certain U.S. Treasury securities and exchange-traded equity securities.
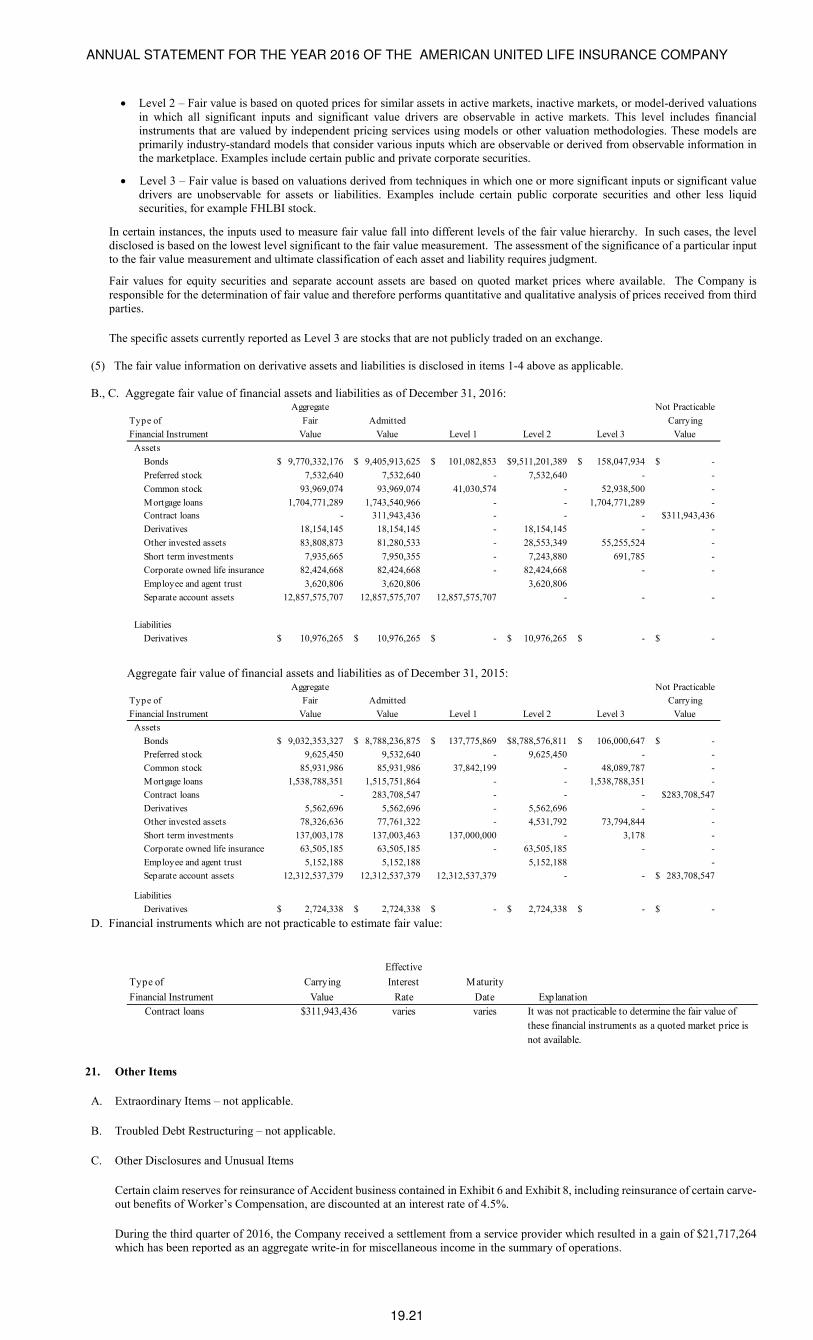
ANNUAL STATEMENT FOR THE YEAR 2016 OF THE AMERICAN UNITED LIFE INSURANCE COMPANY
19.21
• Level 2 – Fair value is based on quoted prices for similar assets in active markets, inactive markets, or model-derived valuations in which all significant inputs and significant value drivers are observable in active markets. This level includes financial instruments that are valued by independent pricing services using models or other valuation methodologies. These models are primarily industry-standard models that consider various inputs which are observable or derived from observable information in the marketplace. Examples include certain public and private corporate securities.
• Level 3 – Fair value is based on valuations derived from techniques in which one or more significant inputs or significant value drivers are unobservable for assets or liabilities. Examples include certain public corporate securities and other less liquid securities, for example FHLBI stock.
In certain instances, the inputs used to measure fair value fall into different levels of the fair value hierarchy. In such cases, the level disclosed is based on the lowest level significant to the fair value measurement. The assessment of the significance of a particular input to the fair value measurement and ultimate classification of each asset and liability requires judgment.
Fair values for equity securities and separate account assets are based on quoted market prices where available. The Company is responsible for the determination of fair value and therefore performs quantitative and qualitative analysis of prices received from third parties.
The specific assets currently reported as Level 3 are stocks that are not publicly traded on an exchange.
(5) The fair value information on derivative assets and liabilities is disclosed in items 1-4 above as applicable. B., C. Aggregate fair value of financial assets and liabilities as of December 31, 2016:
Aggregate Not Practicable
Fair Admitted Carrying
Financial Instrument Value Value Level 1 Level 2 Level 3 Value
Assets
Bonds 9,770,332,176$ 9,405,913,625$ 101,082,853$ 9,511,201,389$ 158,047,934$ -$
Preferred stock 7,532,640 7,532,640 - 7,532,640 - -
Common stock 93,969,074 93,969,074 41,030,574 - 52,938,500 -
Mortgage loans 1,704,771,289 1,743,540,966 - - 1,704,771,289 -
Contract loans - 311,943,436 - - - $311,943,436
Derivatives 18,154,145 18,154,145 - 18,154,145 - -
Other invested assets 83,808,873 81,280,533 - 28,553,349 55,255,524 -
Short term investments 7,935,665 7,950,355 - 7,243,880 691,785 -
Corporate owned life insurance 82,424,668 82,424,668 - 82,424,668 - -
Employee and agent trust 3,620,806 3,620,806 3,620,806
Separate account assets 12,857,575,707 12,857,575,707 12,857,575,707 - - -
Liabilities
Derivatives 10,976,265$ 10,976,265$ -$ 10,976,265$ -$ -$
Type of
Aggregate fair value of financial assets and liabilities as of December 31, 2015: Aggregate Not Practicable
Fair Admitted Carrying
Financial Instrument Value Value Level 1 Level 2 Level 3 Value
Assets
Bonds 9,032,353,327$ 8,788,236,875$ 137,775,869$ 8,788,576,811$ 106,000,647$ -$
Preferred stock 9,625,450 9,532,640 - 9,625,450 - -
Common stock 85,931,986 85,931,986 37,842,199 - 48,089,787 -
Mortgage loans 1,538,788,351 1,515,751,864 - - 1,538,788,351 -
Contract loans - 283,708,547 - - - $283,708,547
Derivatives 5,562,696 5,562,696 - 5,562,696 - -
Other invested assets 78,326,636 77,761,322 - 4,531,792 73,794,844 -
Short term investments 137,003,178 137,003,463 137,000,000 - 3,178 -
Corporate owned life insurance 63,505,185 63,505,185 - 63,505,185 - -
Employee and agent trust 5,152,188 5,152,188 5,152,188 -
Separate account assets 12,312,537,379 12,312,537,379 12,312,537,379 - - 283,708,547$
Liabilities
Derivatives 2,724,338$ 2,724,338$ -$ 2,724,338$ -$ -$
Type of
D. Financial instruments which are not practicable to estimate fair value:
Effective
Carrying Interest Maturity
Financial Instrument Value Rate Date Explanation
Contract loans $311,943,436 varies varies
Type of
It was not practicable to determine the fair value of
these financial instruments as a quoted market price is
not available.
21. Other Items
A. Extraordinary Items – not applicable.
B. Troubled Debt Restructuring – not applicable.
C. Other Disclosures and Unusual Items
Certain claim reserves for reinsurance of Accident business contained in Exhibit 6 and Exhibit 8, including reinsurance of certain carve-out benefits of Worker’s Compensation, are discounted at an interest rate of 4.5%.
During the third quarter of 2016, the Company received a settlement from a service provider which resulted in a gain of $21,717,264 which has been reported as an aggregate write-in for miscellaneous income in the summary of operations.
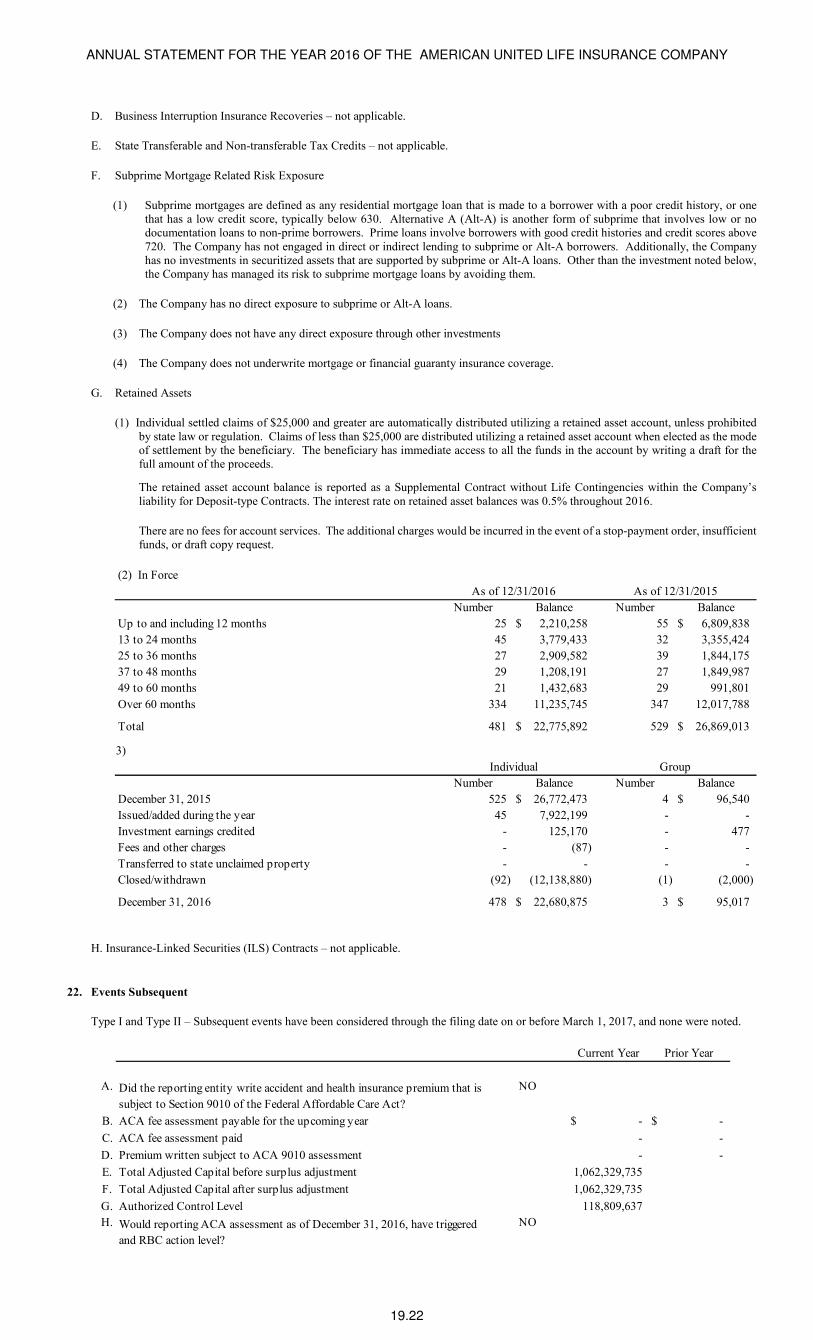
ANNUAL STATEMENT FOR THE YEAR 2016 OF THE AMERICAN UNITED LIFE INSURANCE COMPANY
19.22
D. Business Interruption Insurance Recoveries – not applicable.
E. State Transferable and Non-transferable Tax Credits – not applicable.
F. Subprime Mortgage Related Risk Exposure
(1) Subprime mortgages are defined as any residential mortgage loan that is made to a borrower with a poor credit history, or one that has a low credit score, typically below 630. Alternative A (Alt-A) is another form of subprime that involves low or no documentation loans to non-prime borrowers. Prime loans involve borrowers with good credit histories and credit scores above 720. The Company has not engaged in direct or indirect lending to subprime or Alt-A borrowers. Additionally, the Company has no investments in securitized assets that are supported by subprime or Alt-A loans. Other than the investment noted below, the Company has managed its risk to subprime mortgage loans by avoiding them.
(2) The Company has no direct exposure to subprime or Alt-A loans.
(3) The Company does not have any direct exposure through other investments
(4) The Company does not underwrite mortgage or financial guaranty insurance coverage.
G. Retained Assets
(1) Individual settled claims of $25,000 and greater are automatically distributed utilizing a retained asset account, unless prohibited by state law or regulation. Claims of less than $25,000 are distributed utilizing a retained asset account when elected as the mode of settlement by the beneficiary. The beneficiary has immediate access to all the funds in the account by writing a draft for the full amount of the proceeds.
The retained asset account balance is reported as a Supplemental Contract without Life Contingencies within the Company’s liability for Deposit-type Contracts. The interest rate on retained asset balances was 0.5% throughout 2016.
There are no fees for account services. The additional charges would be incurred in the event of a stop-payment order, insufficient funds, or draft copy request.
(2) In Force
Number Balance Number Balance
Up to and including 12 months 25 2,210,258$ 55 6,809,838$
13 to 24 months 45 3,779,433 32 3,355,424
25 to 36 months 27 2,909,582 39 1,844,175
37 to 48 months 29 1,208,191 27 1,849,987
49 to 60 months 21 1,432,683 29 991,801
Over 60 months 334 11,235,745 347 12,017,788
Total 481 22,775,892$ 529 26,869,013$
(3)
Number Balance Number Balance
December 31, 2015 525 26,772,473$ 4 96,540$
Issued/added during the year 45 7,922,199 - -
Investment earnings credited - 125,170 - 477
Fees and other charges - (87) - -
Transferred to state unclaimed property - - - -
Closed/withdrawn (92) (12,138,880) (1) (2,000)
December 31, 2016 478 22,680,875$ 3 95,017$
As of 12/31/2015As of 12/31/2016
Individual Group
H. Insurance-Linked Securities (ILS) Contracts – not applicable.
22. Events Subsequent
Type I and Type II – Subsequent events have been considered through the filing date on or before March 1, 2017, and none were noted.
Current Year Prior Year
A. NO
B. ACA fee assessment payable for the upcoming year -$ -$
C. ACA fee assessment paid - -
D. Premium written subject to ACA 9010 assessment - -
E. Total Adjusted Capital before surplus adjustment 1,062,329,735
F. Total Adjusted Capital after surplus adjustment 1,062,329,735
G. Authorized Control Level 118,809,637
H. NO
Did the reporting entity write accident and health insurance premium that is
subject to Section 9010 of the Federal Affordable Care Act?
Would reporting ACA assessment as of December 31, 2016, have triggered
and RBC action level?
ANNUAL STATEMENT FOR THE YEAR 2016 OF THE AMERICAN UNITED LIFE INSURANCE COMPANY
19.23
23. Reinsurance
A. Ceded Reinsurance Report Section 1 - General Interrogatories 1. Are any of the reinsurers, listed in Schedule S as non-affiliated, owned in excess of 10% or controlled, either directly or indirectly, by
the company or by any representative, officer, trustee, or director of the company? Yes [ ] No [X] If yes, give full details.
2. Have any policies issued by the company been reinsured with a company chartered in a country other than the United States (excluding U.S. Branches of such companies) which is owned in excess of 10% or controlled directly or indirectly by an insured, a beneficiary, a creditor of an insured or any other person not primarily engaged in the insurance business? Yes [] No [X] If yes, give full details.
Section 2 - Ceded Reinsurance Report - Part A
1. Does the company have any reinsurance agreements in effect under which reinsurer may unilaterally cancel any reinsurance for reasons
other than for nonpayment of premium or other similar credits? Yes [] No [X] a. If yes, what is the estimated amount of the aggregate reduction in surplus of a unilateral cancellation by the reinsurer as of the
date of this statement, for those agreements in which cancellation results in a net obligation of the company to the reinsurer, and for which such obligation is not presently accrued? Where necessary, the company may consider the current or anticipated experience of the business reinsured in making this estimate. $0
b. What is the total amount of reinsurance credits taken, whether as an asset or as a reduction of liability, for these agreements in this
statement? $0
2. Does the company have any reinsurance agreements in effect such that the amount of losses paid or accrued through the statement date may result in a payment to the reinsurer of amounts which, in aggregate and allowing for offset of mutual credits from other reinsurance agreements with the same reinsurer, exceed the total direct premium collected under the reinsured policies? Yes [ ] No [X] If yes, give full details.
Section 3 - Ceded Reinsurance Report - Part B
1. What is the estimated amount of the aggregate reduction in surplus, for agreements not reflected in Section 2 above, of termination of
all reinsurance agreements, by either party, as of the date of this statement? Where necessary, the company may consider the current or anticipated experience of the business reinsured in making this estimate. $0
2. Have any new agreements been executed or existing agreements amended, since January 1 of the year of this statement, to include policies or contracts which were in-force or which had existing reserves established by the company as of the effective date of the agreement? Yes [X] No [] If yes, what is the amount of reinsurance credits, whether an asset or a reduction of liability, taken for such new agreements or amendments? $0
B. Uncollectible Reinsurance
The Company has written off $8 of uncollectible reinsurance during the year.
C. Commutation of Ceded Reinsurance
There was one ceded commutation booked in quarter 1 of which the Company’s share were no material commutations of ceded reinsurance in 2016 or 2015.
D. Certified Reinsurer Rating Downgraded or Status Subject to Revocation – not applicable.
E. Reinsurance of variable annuity contracts – not applicable.
F. Reinsurance agreements with an affiliated captive reinsurer – not applicable.
G. Ceding Entities That Utilize Captive Reinsurers to Assume Reserves Subject to the XXX/AXXX Captive Framework – not applicable.
24. Retrospectively Rated Contracts & Contracts Subject to Redetermination
A. The Company estimates accrued retrospective premium adjustments for its group health insurance business through a mathematical approach using an algorithm of the Company’s underwriting rules and experience rating practices.
B. The Company records accrued retrospective premium as an adjustment to earned premium.
C. The amount of net premiums written by the Company at December 31, 2016 that are subject to retrospective rating features was approximately $9.1 million, representing approximately 5.4% of the total net premiums written for group health and life.
D. Medical loss ratio rebates – not applicable.
E. Risk-Sharing Provisions of the Affordable Care Act – not applicable.
25. Change in Incurred Losses and Loss Adjustment Expenses
Reserves for incurred losses and associated loss adjustment expenses are determined at the product-line level using current data, current assumptions, and various actuarial techniques. Loss provisions for prior-year events were not materially changed in 2016. Loss
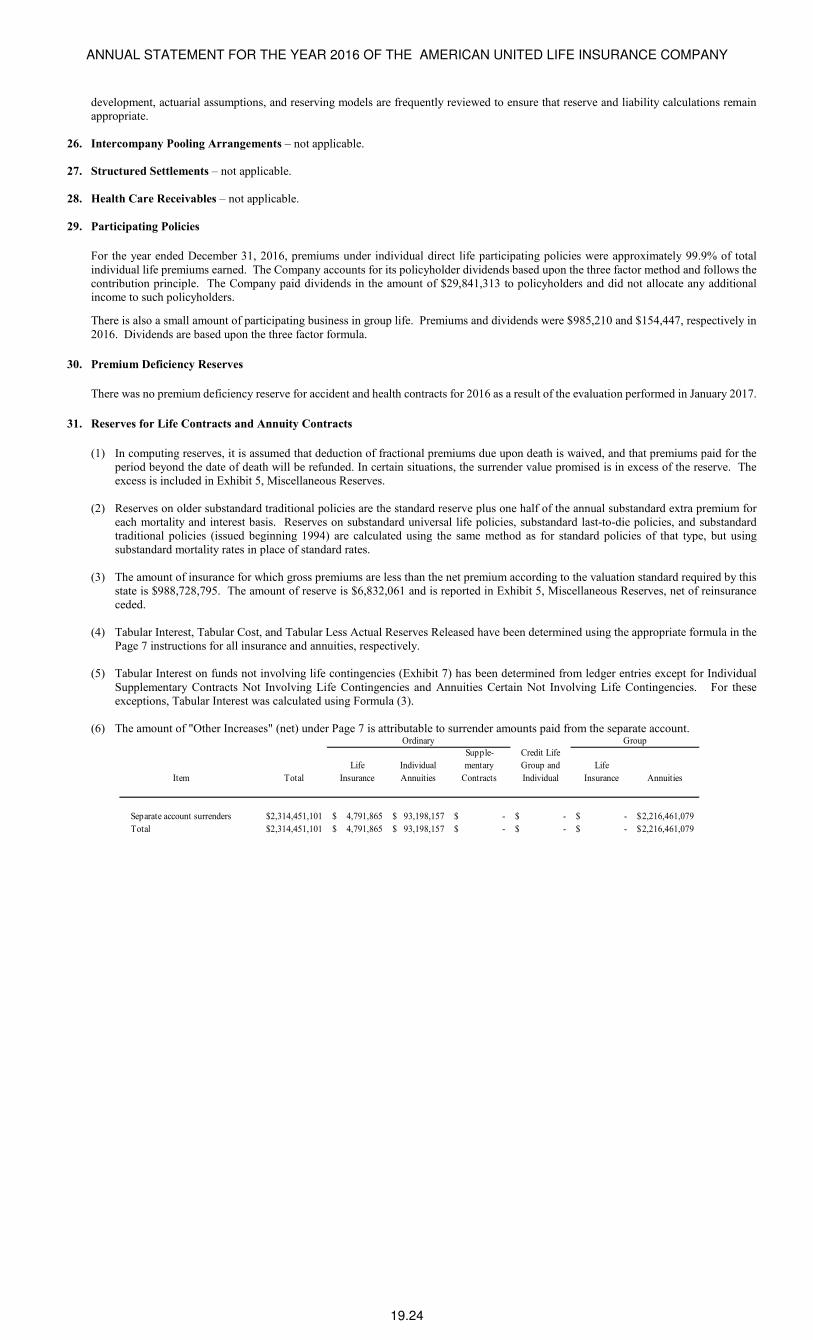
ANNUAL STATEMENT FOR THE YEAR 2016 OF THE AMERICAN UNITED LIFE INSURANCE COMPANY
19.24
development, actuarial assumptions, and reserving models are frequently reviewed to ensure that reserve and liability calculations remain appropriate.
26. Intercompany Pooling Arrangements – not applicable. 27. Structured Settlements – not applicable.
28. Health Care Receivables – not applicable.
29. Participating Policies
For the year ended December 31, 2016, premiums under individual direct life participating policies were approximately 99.9% of total individual life premiums earned. The Company accounts for its policyholder dividends based upon the three factor method and follows the contribution principle. The Company paid dividends in the amount of $29,841,313 to policyholders and did not allocate any additional income to such policyholders.
There is also a small amount of participating business in group life. Premiums and dividends were $985,210 and $154,447, respectively in 2016. Dividends are based upon the three factor formula.
30. Premium Deficiency Reserves
There was no premium deficiency reserve for accident and health contracts for 2016 as a result of the evaluation performed in January 2017.
31. Reserves for Life Contracts and Annuity Contracts
(1) In computing reserves, it is assumed that deduction of fractional premiums due upon death is waived, and that premiums paid for the period beyond the date of death will be refunded. In certain situations, the surrender value promised is in excess of the reserve. The excess is included in Exhibit 5, Miscellaneous Reserves.
(2) Reserves on older substandard traditional policies are the standard reserve plus one half of the annual substandard extra premium for each mortality and interest basis. Reserves on substandard universal life policies, substandard last-to-die policies, and substandard traditional policies (issued beginning 1994) are calculated using the same method as for standard policies of that type, but using substandard mortality rates in place of standard rates.
(3) The amount of insurance for which gross premiums are less than the net premium according to the valuation standard required by this state is $988,728,795. The amount of reserve is $6,832,061 and is reported in Exhibit 5, Miscellaneous Reserves, net of reinsurance ceded.
(4) Tabular Interest, Tabular Cost, and Tabular Less Actual Reserves Released have been determined using the appropriate formula in the Page 7 instructions for all insurance and annuities, respectively.
(5) Tabular Interest on funds not involving life contingencies (Exhibit 7) has been determined from ledger entries except for Individual Supplementary Contracts Not Involving Life Contingencies and Annuities Certain Not Involving Life Contingencies. For these exceptions, Tabular Interest was calculated using Formula (3).
(6) The amount of "Other Increases" (net) under Page 7 is attributable to surrender amounts paid from the separate account.
Item Total
Life
Insurance
Individual
Annuities
Supple-
mentary
Contracts
Life
Insurance Annuities
Separate account surrenders 2,314,451,101$ 4,791,865$ 93,198,157$ -$ -$ -$ 2,216,461,079$
Total 2,314,451,101$ 4,791,865$ 93,198,157$ -$ -$ -$ 2,216,461,079$
Group
Credit Life
Group and
Individual
Ordinary
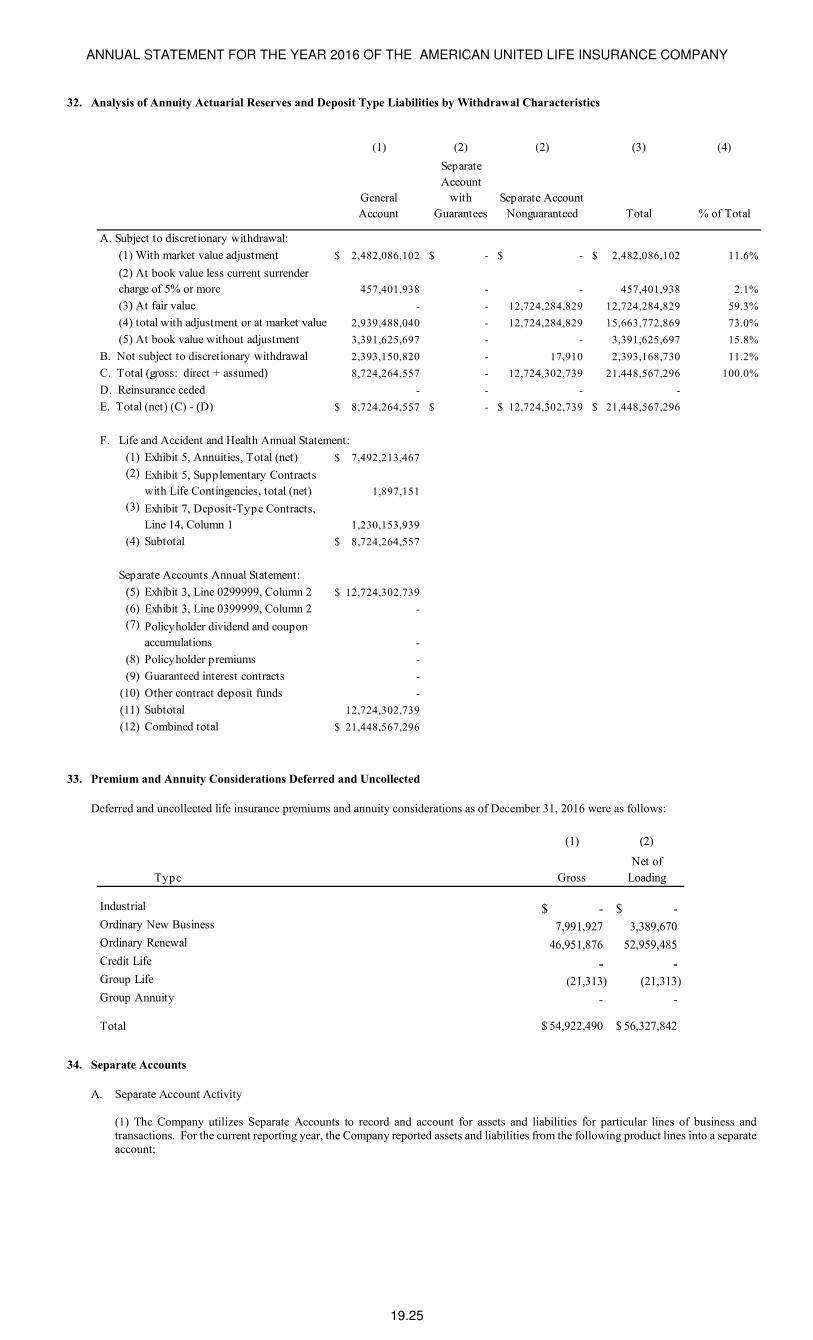
ANNUAL STATEMENT FOR THE YEAR 2016 OF THE AMERICAN UNITED LIFE INSURANCE COMPANY
19.25
32. Analysis of Annuity Actuarial Reserves and Deposit Type Liabilities by Withdrawal Characteristics
(1) (2) (2) (3) (4)
General
Account
Separate
Account
with
Guarantees
Separate Account
Nonguaranteed Total % of Total
A. Subject to discretionary withdrawal:
(1) With market value adjustment 2,482,086,102$ -$ -$ 2,482,086,102$ 11.6%
457,401,938 - - 457,401,938 2.1%
(3) At fair value - - 12,724,284,829 12,724,284,829 59.3%
(4) total with adjustment or at market value 2,939,488,040 - 12,724,284,829 15,663,772,869 73.0%
(5) At book value without adjustment 3,391,625,697 - - 3,391,625,697 15.8%
B. Not subject to discretionary withdrawal 2,393,150,820 - 17,910 2,393,168,730 11.2%
C. Total (gross: direct + assumed) 8,724,264,557 - 12,724,302,739 21,448,567,296 100.0%
D. Reinsurance ceded - - - -
E. Total (net) (C) - (D) 8,724,264,557$ -$ 12,724,302,739$ 21,448,567,296$
F. Life and Accident and Health Annual Statement:
(1) Exhibit 5, Annuities, Total (net) 7,492,213,467$
(2)
1,897,151
(3)
1,230,153,939
(4) Subtotal 8,724,264,557$
Separate Accounts Annual Statement:
(5) Exhibit 3, Line 0299999, Column 2 12,724,302,739$
(6) Exhibit 3, Line 0399999, Column 2 -
(7)
-
(8) Policyholder premiums -
(9) Guaranteed interest contracts -
(10) Other contract deposit funds -
(11) Subtotal 12,724,302,739
(12) Combined total 21,448,567,296$
(2) At book value less current surrender
charge of 5% or more
Exhibit 5, Supplementary Contracts
with Life Contingencies, total (net)
Exhibit 7, Deposit-Type Contracts,
Line 14, Column 1
Policyholder dividend and coupon
accumulations
33. Premium and Annuity Considerations Deferred and Uncollected
Deferred and uncollected life insurance premiums and annuity considerations as of December 31, 2016 were as follows:
(1) (2)
Gross
Net of
Loading
-$ -$
7,991,927 3,389,670
46,951,876 52,959,485
- -
(21,313) (21,313)
- -
54,922,490$ 56,327,842$
Type
Total
Industrial
Ordinary New Business
Ordinary Renewal
Credit Life
Group Life
Group Annuity
34. Separate Accounts
A. Separate Account Activity (1) The Company utilizes Separate Accounts to record and account for assets and liabilities for particular lines of business and transactions. For the current reporting year, the Company reported assets and liabilities from the following product lines into a separate account;
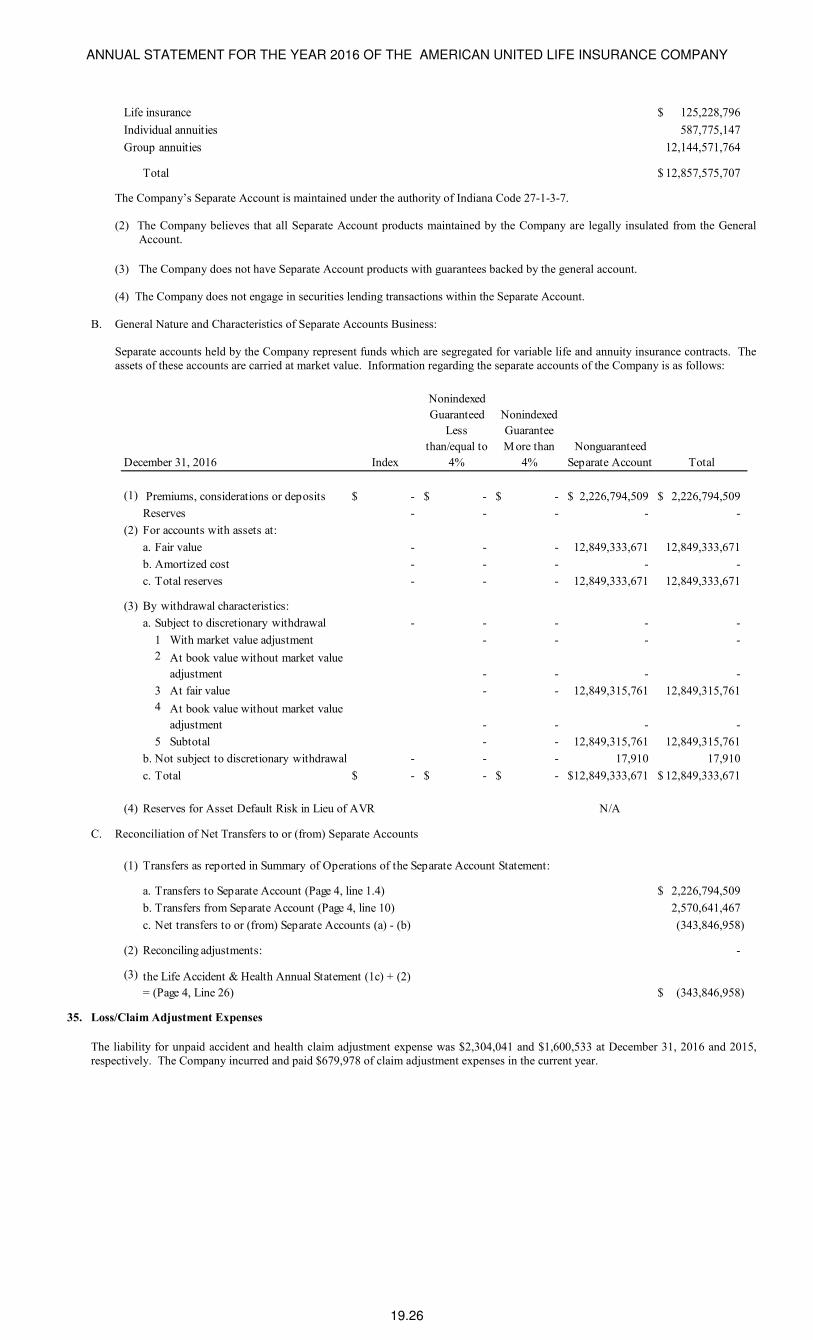
ANNUAL STATEMENT FOR THE YEAR 2016 OF THE AMERICAN UNITED LIFE INSURANCE COMPANY
19.26
Life insurance 125,228,796$
Individual annuities 587,775,147
Group annuities 12,144,571,764
Total 12,857,575,707$
The Company’s Separate Account is maintained under the authority of Indiana Code 27-1-3-7. (2) The Company believes that all Separate Account products maintained by the Company are legally insulated from the General
Account.
(3) The Company does not have Separate Account products with guarantees backed by the general account. (4) The Company does not engage in securities lending transactions within the Separate Account.
B. General Nature and Characteristics of Separate Accounts Business: Separate accounts held by the Company represent funds which are segregated for variable life and annuity insurance contracts. The assets of these accounts are carried at market value. Information regarding the separate accounts of the Company is as follows:
Index
Nonindexed
Guaranteed
Less
than/equal to
4%
Nonindexed
Guarantee
More than
4%
Nonguaranteed
Separate Account Total
(1) -$ -$ -$ 2,226,794,509$ 2,226,794,509$
Reserves - - - - -
(2) For accounts with assets at:
a. Fair value - - - 12,849,333,671 12,849,333,671
b. Amortized cost - - - - -
c. Total reserves - - - 12,849,333,671 12,849,333,671
(3) By withdrawal characteristics:
a. Subject to discretionary withdrawal - - - - -
1 With market value adjustment - - - -
2
- - - -
3 At fair value - - 12,849,315,761 12,849,315,761
4
- - - -
5 Subtotal - - 12,849,315,761 12,849,315,761
b. Not subject to discretionary withdrawal - - - 17,910 17,910
c. Total -$ -$ -$ 12,849,333,671$ 12,849,333,671$
(4) Reserves for Asset Default Risk in Lieu of AVR N/A
Premiums, considerations or deposits
December 31, 2016
At book value without market value
adjustment
At book value without market value
adjustment
C. Reconciliation of Net Transfers to or (from) Separate Accounts
(1) Transfers as reported in Summary of Operations of the Separate Account Statement:
a. Transfers to Separate Account (Page 4, line 1.4) 2,226,794,509$
b. Transfers from Separate Account (Page 4, line 10) 2,570,641,467
c. Net transfers to or (from) Separate Accounts (a) - (b) (343,846,958)
(2) Reconciling adjustments: -
(3)
(343,846,958)$
the Life Accident & Health Annual Statement (1c) + (2)
= (Page 4, Line 26)
35. Loss/Claim Adjustment Expenses
The liability for unpaid accident and health claim adjustment expense was $2,304,041 and $1,600,533 at December 31, 2016 and 2015, respectively. The Company incurred and paid $679,978 of claim adjustment expenses in the current year.
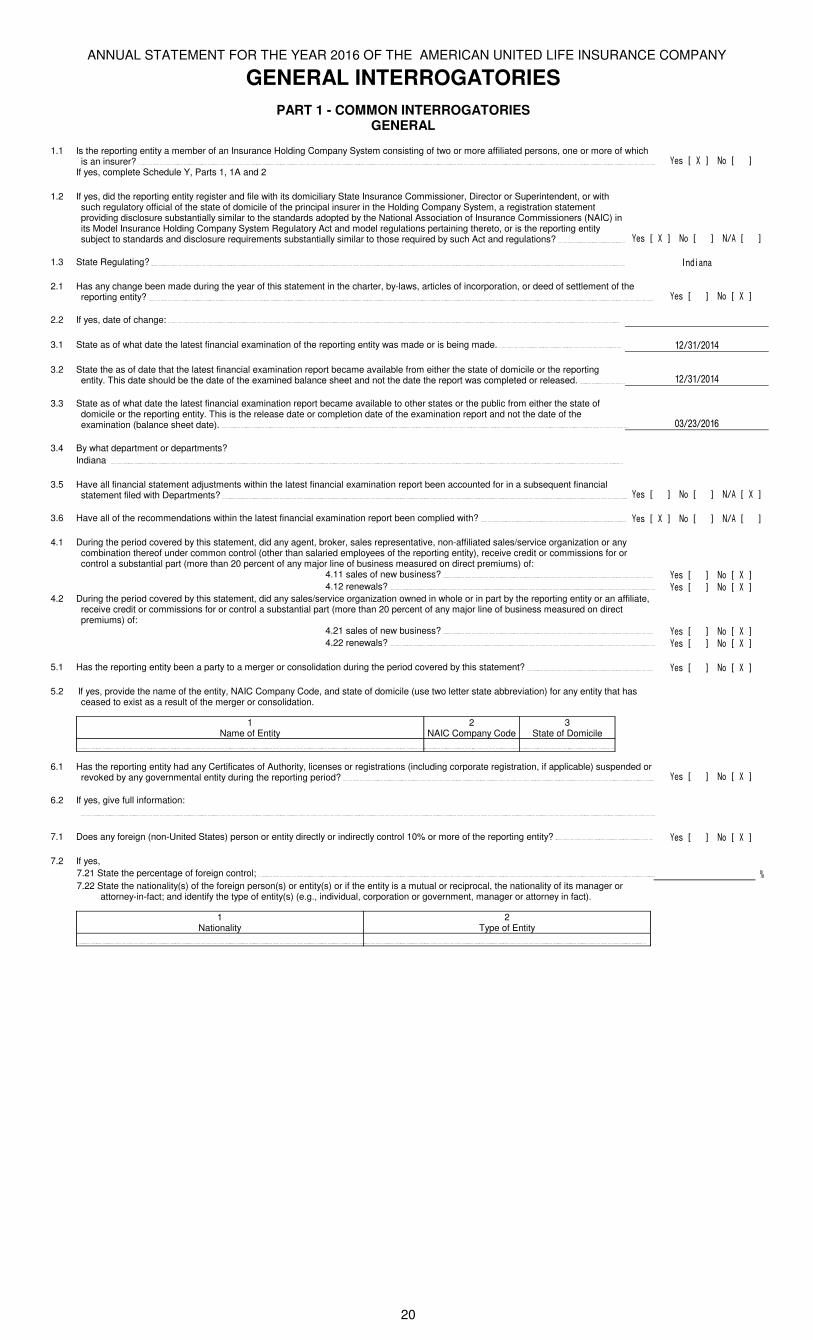
ANNUAL STATEMENT FOR THE YEAR 2016 OF THE AMERICAN UNITED LIFE INSURANCE COMPANY
GENERAL INTERROGATORIES
PART 1 - COMMON INTERROGATORIESGENERAL
1.1 Is the reporting entity a member of an Insurance Holding Company System consisting of two or more affiliated persons, one or more of which is an insurer? Yes [ X ] No [ ]
If yes, complete Schedule Y, Parts 1, 1A and 2
1.2 If yes, did the reporting entity register and file with its domiciliary State Insurance Commissioner, Director or Superintendent, or with such regulatory official of the state of domicile of the principal insurer in the Holding Company System, a registration statement providing disclosure substantially similar to the standards adopted by the National Association of Insurance Commissioners (NAIC) in its Model Insurance Holding Company System Regulatory Act and model regulations pertaining thereto, or is the reporting entity subject to standards and disclosure requirements substantially similar to those required by such Act and regulations? Yes [ X ] No [ ] N/A [ ]
1.3 State Regulating? Indiana
2.1 Has any change been made during the year of this statement in the charter, by-laws, articles of incorporation, or deed of settlement of the reporting entity? Yes [ ] No [ X ]
2.2 If yes, date of change:
3.1 State as of what date the latest financial examination of the reporting entity was made or is being made. 12/31/2014
3.2 State the as of date that the latest financial examination report became available from either the state of domicile or the reporting entity. This date should be the date of the examined balance sheet and not the date the report was completed or released. 12/31/2014
3.3 State as of what date the latest financial examination report became available to other states or the public from either the state of domicile or the reporting entity. This is the release date or completion date of the examination report and not the date of the examination (balance sheet date). 03/23/2016
3.4 By what department or departments?
Indiana
3.5 Have all financial statement adjustments within the latest financial examination report been accounted for in a subsequent financial statement filed with Departments? Yes [ ] No [ ] N/A [ X ]
3.6 Have all of the recommendations within the latest financial examination report been complied with? Yes [ X ] No [ ] N/A [ ]
4.1 During the period covered by this statement, did any agent, broker, sales representative, non-affiliated sales/service organization or any combination thereof under common control (other than salaried employees of the reporting entity), receive credit or commissions for or control a substantial part (more than 20 percent of any major line of business measured on direct premiums) of:
4.11 sales of new business? Yes [ ] No [ X ]
4.12 renewals? Yes [ ] No [ X ]
4.2 During the period covered by this statement, did any sales/service organization owned in whole or in part by the reporting entity or an affiliate, receive credit or commissions for or control a substantial part (more than 20 percent of any major line of business measured on direct premiums) of:
4.21 sales of new business? Yes [ ] No [ X ]
4.22 renewals? Yes [ ] No [ X ]
5.1 Has the reporting entity been a party to a merger or consolidation during the period covered by this statement? Yes [ ] No [ X ]
5.2 If yes, provide the name of the entity, NAIC Company Code, and state of domicile (use two letter state abbreviation) for any entity that has ceased to exist as a result of the merger or consolidation.
1Name of Entity
2NAIC Company Code
3State of Domicile
6.1 Has the reporting entity had any Certificates of Authority, licenses or registrations (including corporate registration, if applicable) suspended or revoked by any governmental entity during the reporting period? Yes [ ] No [ X ]
6.2 If yes, give full information:
7.1 Does any foreign (non-United States) person or entity directly or indirectly control 10% or more of the reporting entity? Yes [ ] No [ X ]
7.2 If yes,
7.21 State the percentage of foreign control; %
7.22 State the nationality(s) of the foreign person(s) or entity(s) or if the entity is a mutual or reciprocal, the nationality of its manager or attorney-in-fact; and identify the type of entity(s) (e.g., individual, corporation or government, manager or attorney in fact).
1Nationality
2Type of Entity
20
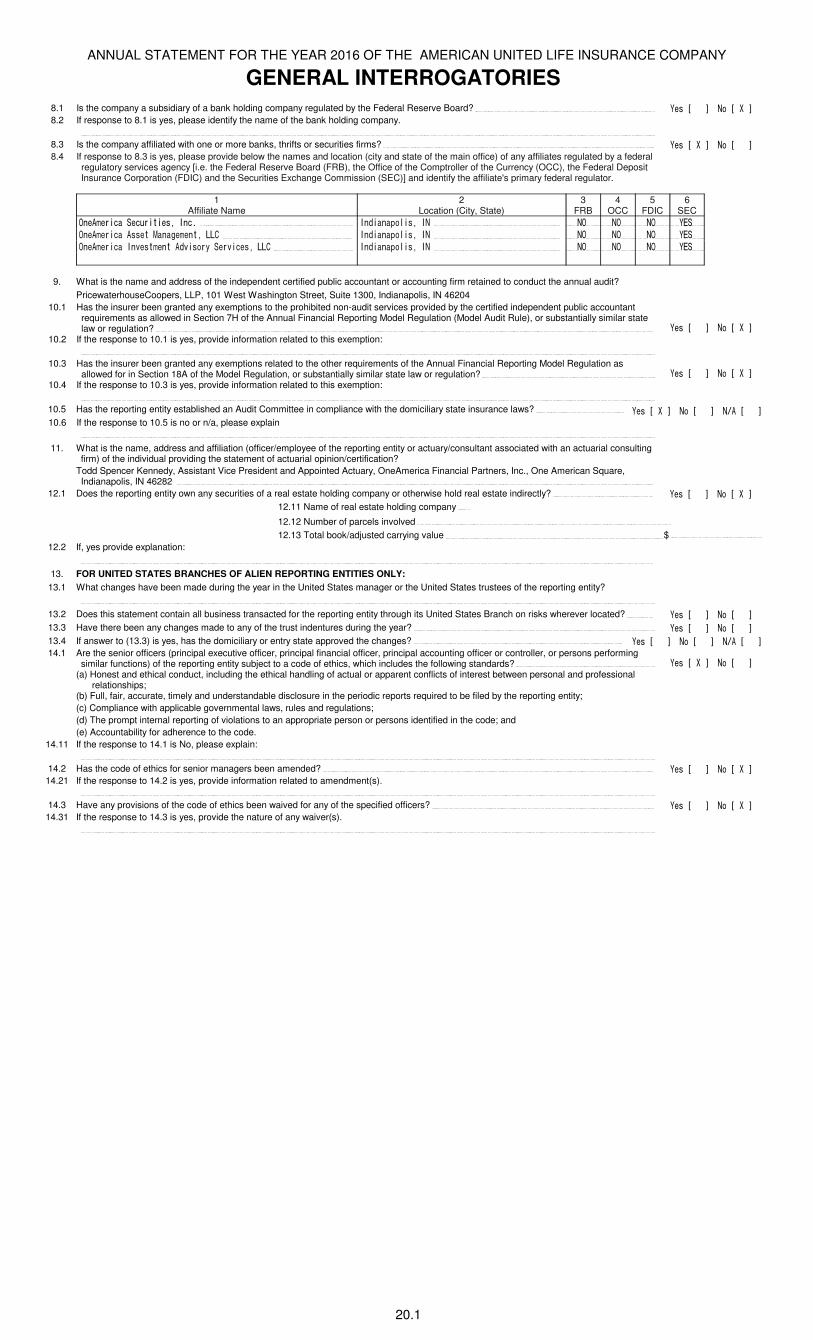
ANNUAL STATEMENT FOR THE YEAR 2016 OF THE AMERICAN UNITED LIFE INSURANCE COMPANY
GENERAL INTERROGATORIES
8.1 Is the company a subsidiary of a bank holding company regulated by the Federal Reserve Board? Yes [ ] No [ X ]8.2 If response to 8.1 is yes, please identify the name of the bank holding company.
8.3 Is the company affiliated with one or more banks, thrifts or securities firms? Yes [ X ] No [ ]8.4 If response to 8.3 is yes, please provide below the names and location (city and state of the main office) of any affiliates regulated by a federal
regulatory services agency [i.e. the Federal Reserve Board (FRB), the Office of the Comptroller of the Currency (OCC), the Federal Deposit Insurance Corporation (FDIC) and the Securities Exchange Commission (SEC)] and identify the affiliate's primary federal regulator.
1Affiliate Name
2Location (City, State)
3FRB
4OCC
5FDIC
6SEC
OneAmerica Securities, Inc. Indianapolis, IN NO NO NO YES
OneAmerica Asset Management, LLC Indianapolis, IN NO NO NO YES
OneAmerica Investment Advisory Services, LLC Indianapolis, IN NO NO NO YES
9. What is the name and address of the independent certified public accountant or accounting firm retained to conduct the annual audit?
PricewaterhouseCoopers, LLP, 101 West Washington Street, Suite 1300, Indianapolis, IN 46204
10.1 Has the insurer been granted any exemptions to the prohibited non-audit services provided by the certified independent public accountant requirements as allowed in Section 7H of the Annual Financial Reporting Model Regulation (Model Audit Rule), or substantially similar state law or regulation? Yes [ ] No [ X ]
10.2 If the response to 10.1 is yes, provide information related to this exemption:
10.3 Has the insurer been granted any exemptions related to the other requirements of the Annual Financial Reporting Model Regulation as allowed for in Section 18A of the Model Regulation, or substantially similar state law or regulation? Yes [ ] No [ X ]
10.4 If the response to 10.3 is yes, provide information related to this exemption:
10.5 Has the reporting entity established an Audit Committee in compliance with the domiciliary state insurance laws? Yes [ X ] No [ ] N/A [ ]10.6 If the response to 10.5 is no or n/a, please explain
11. What is the name, address and affiliation (officer/employee of the reporting entity or actuary/consultant associated with an actuarial consulting firm) of the individual providing the statement of actuarial opinion/certification?
Todd Spencer Kennedy, Assistant Vice President and Appointed Actuary, OneAmerica Financial Partners, Inc., One American Square, Indianapolis, IN 46282
12.1 Does the reporting entity own any securities of a real estate holding company or otherwise hold real estate indirectly? Yes [ ] No [ X ]
12.11 Name of real estate holding company
12.12 Number of parcels involved
12.13 Total book/adjusted carrying value $
12.2 If, yes provide explanation:
13. FOR UNITED STATES BRANCHES OF ALIEN REPORTING ENTITIES ONLY:
13.1 What changes have been made during the year in the United States manager or the United States trustees of the reporting entity?
13.2 Does this statement contain all business transacted for the reporting entity through its United States Branch on risks wherever located? Yes [ ] No [ ]
13.3 Have there been any changes made to any of the trust indentures during the year? Yes [ ] No [ ]
13.4 If answer to (13.3) is yes, has the domiciliary or entry state approved the changes? Yes [ ] No [ ] N/A [ ]14.1 Are the senior officers (principal executive officer, principal financial officer, principal accounting officer or controller, or persons performing
similar functions) of the reporting entity subject to a code of ethics, which includes the following standards? Yes [ X ] No [ ](a) Honest and ethical conduct, including the ethical handling of actual or apparent conflicts of interest between personal and professional
relationships;(b) Full, fair, accurate, timely and understandable disclosure in the periodic reports required to be filed by the reporting entity;
(c) Compliance with applicable governmental laws, rules and regulations;
(d) The prompt internal reporting of violations to an appropriate person or persons identified in the code; and
(e) Accountability for adherence to the code.
14.11 If the response to 14.1 is No, please explain:
14.2 Has the code of ethics for senior managers been amended? Yes [ ] No [ X ]14.21 If the response to 14.2 is yes, provide information related to amendment(s).
14.3 Have any provisions of the code of ethics been waived for any of the specified officers? Yes [ ] No [ X ]14.31 If the response to 14.3 is yes, provide the nature of any waiver(s).
20.1
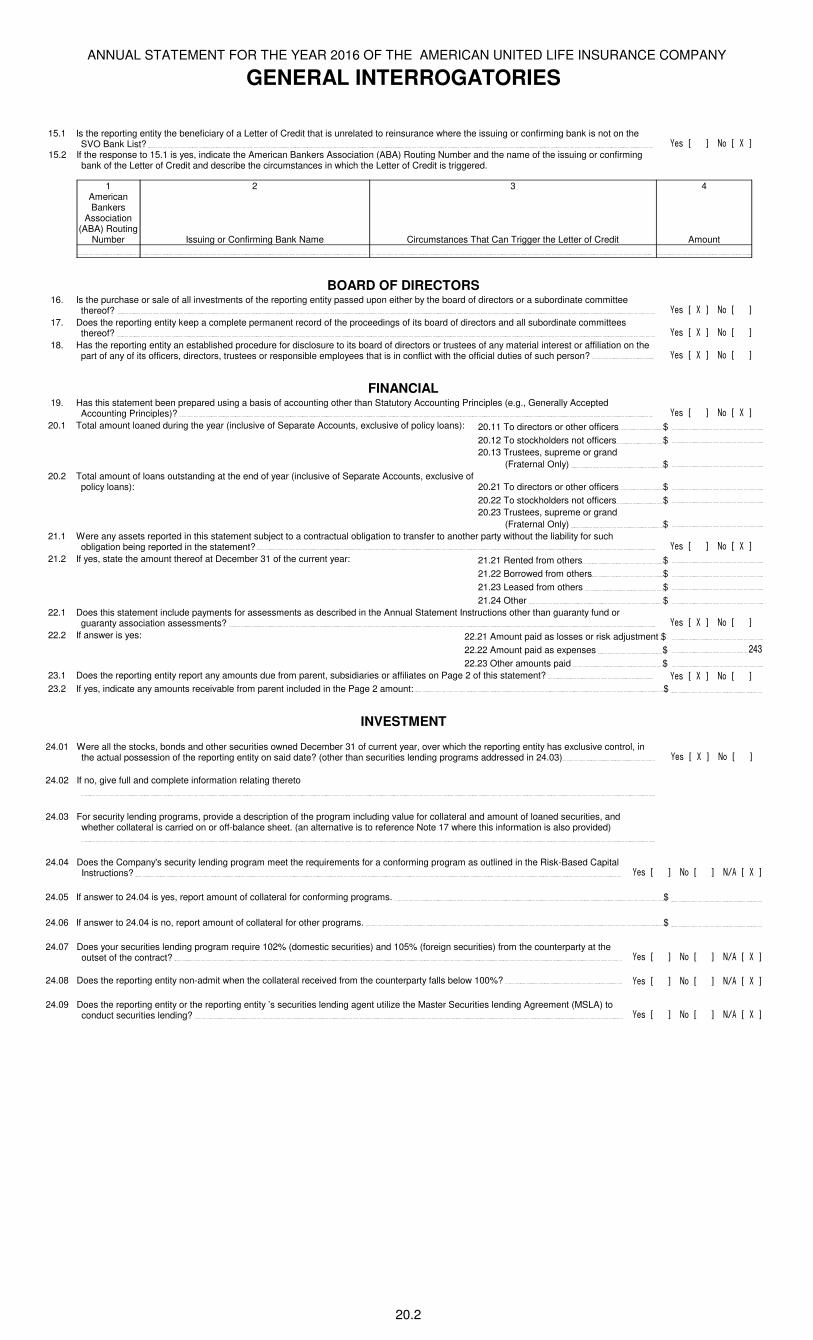
ANNUAL STATEMENT FOR THE YEAR 2016 OF THE AMERICAN UNITED LIFE INSURANCE COMPANY
GENERAL INTERROGATORIES
15.1 Is the reporting entity the beneficiary of a Letter of Credit that is unrelated to reinsurance where the issuing or confirming bank is not on the SVO Bank List? Yes [ ] No [ X ]
15.2 If the response to 15.1 is yes, indicate the American Bankers Association (ABA) Routing Number and the name of the issuing or confirming bank of the Letter of Credit and describe the circumstances in which the Letter of Credit is triggered.
1American Bankers
Association (ABA) Routing
Number
2
Issuing or Confirming Bank Name
3
Circumstances That Can Trigger the Letter of Credit
4
Amount
BOARD OF DIRECTORS16. Is the purchase or sale of all investments of the reporting entity passed upon either by the board of directors or a subordinate committee
thereof? Yes [ X ] No [ ]
17. Does the reporting entity keep a complete permanent record of the proceedings of its board of directors and all subordinate committees thereof? Yes [ X ] No [ ]
18. Has the reporting entity an established procedure for disclosure to its board of directors or trustees of any material interest or affiliation on the part of any of its officers, directors, trustees or responsible employees that is in conflict with the official duties of such person? Yes [ X ] No [ ]
FINANCIAL19. Has this statement been prepared using a basis of accounting other than Statutory Accounting Principles (e.g., Generally Accepted
Accounting Principles)? Yes [ ] No [ X ]
20.1 Total amount loaned during the year (inclusive of Separate Accounts, exclusive of policy loans): 20.11 To directors or other officers $
20.12 To stockholders not officers $
20.13 Trustees, supreme or grand
(Fraternal Only) $
20.2 Total amount of loans outstanding at the end of year (inclusive of Separate Accounts, exclusive of policy loans): 20.21 To directors or other officers $
20.22 To stockholders not officers $
20.23 Trustees, supreme or grand
(Fraternal Only) $
21.1 Were any assets reported in this statement subject to a contractual obligation to transfer to another party without the liability for such obligation being reported in the statement? Yes [ ] No [ X ]
21.2 If yes, state the amount thereof at December 31 of the current year: 21.21 Rented from others $
21.22 Borrowed from others $
21.23 Leased from others $
21.24 Other $
22.1 Does this statement include payments for assessments as described in the Annual Statement Instructions other than guaranty fund or guaranty association assessments? Yes [ X ] No [ ]
22.2 If answer is yes: 22.21 Amount paid as losses or risk adjustment $
22.22 Amount paid as expenses $ 243
22.23 Other amounts paid $
23.1 Does the reporting entity report any amounts due from parent, subsidiaries or affiliates on Page 2 of this statement? Yes [ X ] No [ ]
23.2 If yes, indicate any amounts receivable from parent included in the Page 2 amount: $
INVESTMENT
24.01 Were all the stocks, bonds and other securities owned December 31 of current year, over which the reporting entity has exclusive control, in the actual possession of the reporting entity on said date? (other than securities lending programs addressed in 24.03) Yes [ X ] No [ ]
24.02 If no, give full and complete information relating thereto
24.03 For security lending programs, provide a description of the program including value for collateral and amount of loaned securities, and whether collateral is carried on or off-balance sheet. (an alternative is to reference Note 17 where this information is also provided)
24.04 Does the Company's security lending program meet the requirements for a conforming program as outlined in the Risk-Based Capital Instructions? Yes [ ] No [ ] N/A [ X ]
24.05 If answer to 24.04 is yes, report amount of collateral for conforming programs. $
24.06 If answer to 24.04 is no, report amount of collateral for other programs. $
24.07 Does your securities lending program require 102% (domestic securities) and 105% (foreign securities) from the counterparty at the outset of the contract? Yes [ ] No [ ] N/A [ X ]
24.08 Does the reporting entity non-admit when the collateral received from the counterparty falls below 100%? Yes [ ] No [ ] N/A [ X ]
24.09 Does the reporting entity or the reporting entity ’s securities lending agent utilize the Master Securities lending Agreement (MSLA) to conduct securities lending? Yes [ ] No [ ] N/A [ X ]
20.2
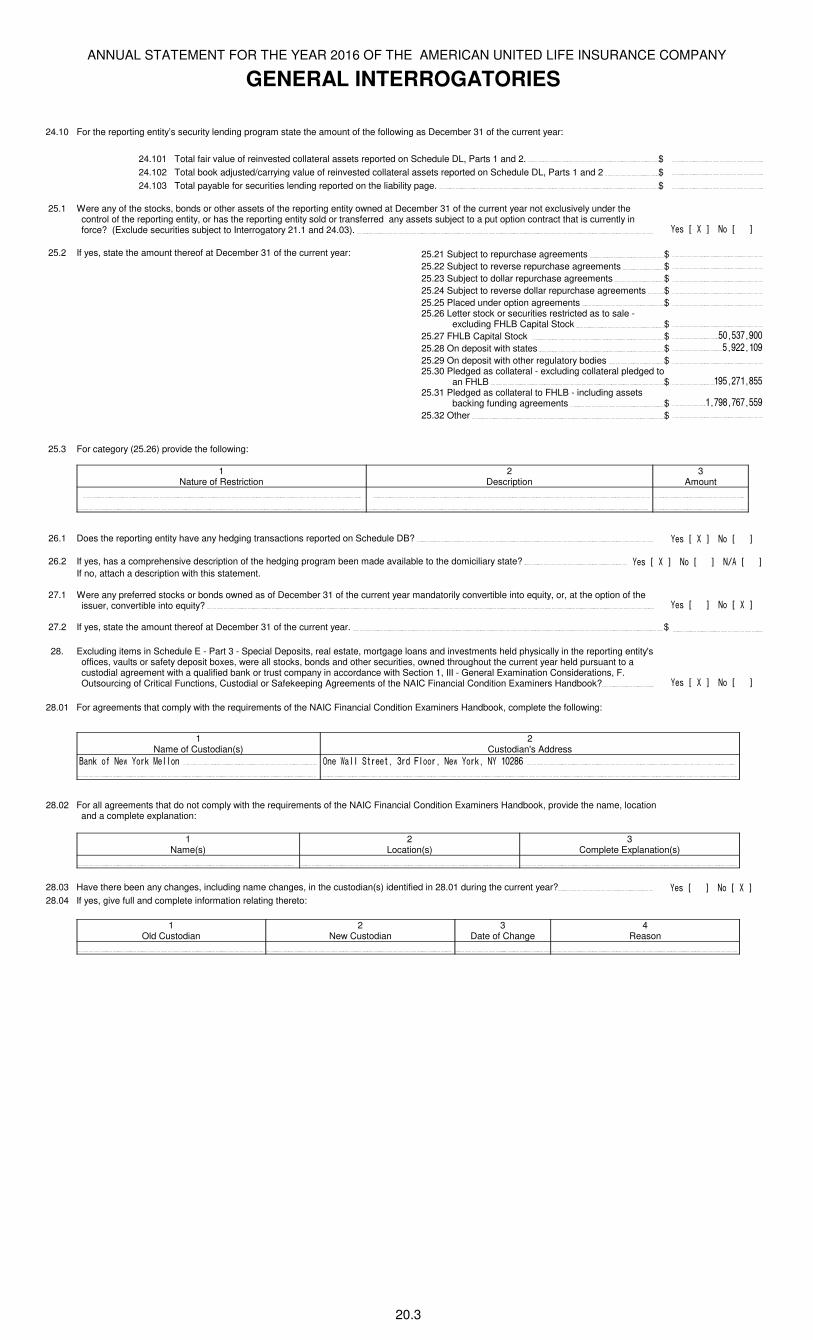
ANNUAL STATEMENT FOR THE YEAR 2016 OF THE AMERICAN UNITED LIFE INSURANCE COMPANY
GENERAL INTERROGATORIES
24.10 For the reporting entity’s security lending program state the amount of the following as December 31 of the current year:
24.101 Total fair value of reinvested collateral assets reported on Schedule DL, Parts 1 and 2. $
24.102 Total book adjusted/carrying value of reinvested collateral assets reported on Schedule DL, Parts 1 and 2 $
24.103 Total payable for securities lending reported on the liability page. $
25.1 Were any of the stocks, bonds or other assets of the reporting entity owned at December 31 of the current year not exclusively under the control of the reporting entity, or has the reporting entity sold or transferred any assets subject to a put option contract that is currently in force? (Exclude securities subject to Interrogatory 21.1 and 24.03). Yes [ X ] No [ ]
25.2 If yes, state the amount thereof at December 31 of the current year: 25.21 Subject to repurchase agreements $
25.22 Subject to reverse repurchase agreements $
25.23 Subject to dollar repurchase agreements $
25.24 Subject to reverse dollar repurchase agreements $
25.25 Placed under option agreements $ 25.26 Letter stock or securities restricted as to sale -
excluding FHLB Capital Stock $
25.27 FHLB Capital Stock $ 50,537,900
25.28 On deposit with states $ 5,922,109
25.29 On deposit with other regulatory bodies $ 25.30 Pledged as collateral - excluding collateral pledged to
an FHLB $ 195,271,855 25.31 Pledged as collateral to FHLB - including assets
backing funding agreements $ 1,798,767,559
25.32 Other $
25.3 For category (25.26) provide the following:
1Nature of Restriction
2Description
3Amount
26.1 Does the reporting entity have any hedging transactions reported on Schedule DB? Yes [ X ] No [ ]
26.2 If yes, has a comprehensive description of the hedging program been made available to the domiciliary state? Yes [ X ] No [ ] N/A [ ]If no, attach a description with this statement.
27.1 Were any preferred stocks or bonds owned as of December 31 of the current year mandatorily convertible into equity, or, at the option of the issuer, convertible into equity? Yes [ ] No [ X ]
27.2 If yes, state the amount thereof at December 31 of the current year. $
28. Excluding items in Schedule E - Part 3 - Special Deposits, real estate, mortgage loans and investments held physically in the reporting entity's offices, vaults or safety deposit boxes, were all stocks, bonds and other securities, owned throughout the current year held pursuant to a custodial agreement with a qualified bank or trust company in accordance with Section 1, III - General Examination Considerations, F. Outsourcing of Critical Functions, Custodial or Safekeeping Agreements of the NAIC Financial Condition Examiners Handbook? Yes [ X ] No [ ]
28.01 For agreements that comply with the requirements of the NAIC Financial Condition Examiners Handbook, complete the following:
1Name of Custodian(s)
2Custodian's Address
Bank of New York Mellon One Wall Street, 3rd Floor, New York, NY 10286
28.02 For all agreements that do not comply with the requirements of the NAIC Financial Condition Examiners Handbook, provide the name, location and a complete explanation:
1Name(s)
2Location(s)
3Complete Explanation(s)
28.03 Have there been any changes, including name changes, in the custodian(s) identified in 28.01 during the current year? Yes [ ] No [ X ]
28.04 If yes, give full and complete information relating thereto:
1Old Custodian
2New Custodian
3Date of Change
4Reason
20.3
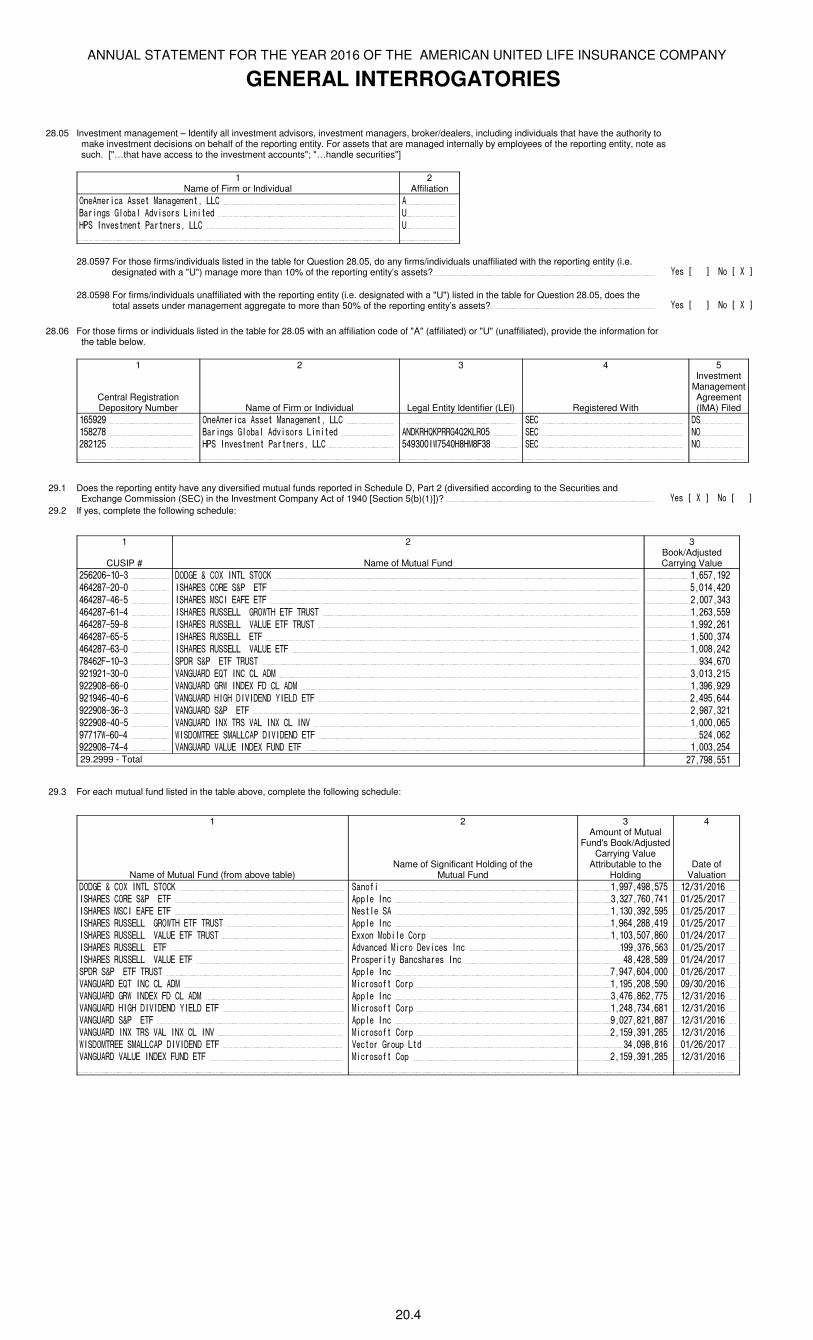
ANNUAL STATEMENT FOR THE YEAR 2016 OF THE AMERICAN UNITED LIFE INSURANCE COMPANY
GENERAL INTERROGATORIES
28.05 Investment management – Identify all investment advisors, investment managers, broker/dealers, including individuals that have the authority to make investment decisions on behalf of the reporting entity. For assets that are managed internally by employees of the reporting entity, note as such. ["…that have access to the investment accounts"; "…handle securities"]
1Name of Firm or Individual
2Affiliation
OneAmerica Asset Management, LLC A
Barings Global Advisors Limited U
HPS Investment Partners, LLC U
28.0597 For those firms/individuals listed in the table for Question 28.05, do any firms/individuals unaffiliated with the reporting entity (i.e. designated with a "U") manage more than 10% of the reporting entity’s assets? Yes [ ] No [ X ]
28.0598 For firms/individuals unaffiliated with the reporting entity (i.e. designated with a "U") listed in the table for Question 28.05, does the total assets under management aggregate to more than 50% of the reporting entity’s assets? Yes [ ] No [ X ]
28.06 For those firms or individuals listed in the table for 28.05 with an affiliation code of "A" (affiliated) or "U" (unaffiliated), provide the information for the table below.
1
Central Registration Depository Number
2
Name of Firm or Individual
3
Legal Entity Identifier (LEI)
4
Registered With
5Investment
Management Agreement (IMA) Filed
165929 OneAmerica Asset Management, LLC SEC DS
158278 Barings Global Advisors Limited ANDKRHQKPRRG4Q2KLR05 SEC NO
282125 HPS Investment Partners, LLC 549300IW7540H8HM8F38 SEC NO
29.1 Does the reporting entity have any diversified mutual funds reported in Schedule D, Part 2 (diversified according to the Securities and Exchange Commission (SEC) in the Investment Company Act of 1940 [Section 5(b)(1)])? Yes [ X ] No [ ]
29.2 If yes, complete the following schedule:
1
CUSIP #
2
Name of Mutual Fund
3Book/Adjusted Carrying Value
256206-10-3 DODGE & COX INTL STOCK 1,657,192
464287-20-0 ISHARES CORE S&P ETF 5,014,420
464287-46-5 ISHARES MSCI EAFE ETF 2,007,343
464287-61-4 ISHARES RUSSELL GROWTH ETF TRUST 1,263,559
464287-59-8 ISHARES RUSSELL VALUE ETF TRUST 1,992,261
464287-65-5 ISHARES RUSSELL ETF 1,500,374
464287-63-0 ISHARES RUSSELL VALUE ETF 1,008,242
78462F-10-3 SPDR S&P ETF TRUST 934,670
921921-30-0 VANGUARD EQT INC CL ADM 3,013,215
922908-66-0 VANGUARD GRW INDEX FD CL ADM 1,396,929
921946-40-6 VANGUARD HIGH DIVIDEND YIELD ETF 2,495,644
922908-36-3 VANGUARD S&P ETF 2,987,321
922908-40-5 VANGUARD INX TRS VAL INX CL INV 1,000,065
97717W-60-4 WISDOMTREE SMALLCAP DIVIDEND ETF 524,062
922908-74-4 VANGUARD VALUE INDEX FUND ETF 1,003,254 29.2999 - Total 27,798,551
29.3 For each mutual fund listed in the table above, complete the following schedule:
1
Name of Mutual Fund (from above table)
2
Name of Significant Holding of theMutual Fund
3Amount of Mutual
Fund's Book/Adjusted Carrying Value
Attributable to the Holding
4
Date of Valuation
DODGE & COX INTL STOCK Sanofi 1,997,498,575 12/31/2016
ISHARES CORE S&P ETF Apple Inc 3,327,760,741 01/25/2017
ISHARES MSCI EAFE ETF Nestle SA 1,130,392,595 01/25/2017
ISHARES RUSSELL GROWTH ETF TRUST Apple Inc 1,964,288,419 01/25/2017
ISHARES RUSSELL VALUE ETF TRUST Exxon Mobile Corp 1,103,507,860 01/24/2017
ISHARES RUSSELL ETF Advanced Micro Devices Inc 199,376,563 01/25/2017
ISHARES RUSSELL VALUE ETF Prosperity Bancshares Inc 48,428,589 01/24/2017
SPDR S&P ETF TRUST Apple Inc 7,947,604,000 01/26/2017
VANGUARD EQT INC CL ADM Microsoft Corp 1,195,208,590 09/30/2016
VANGUARD GRW INDEX FD CL ADM Apple Inc 3,476,862,775 12/31/2016
VANGUARD HIGH DIVIDEND YIELD ETF Microsoft Corp 1,248,734,681 12/31/2016
VANGUARD S&P ETF Apple Inc 9,027,821,887 12/31/2016
VANGUARD INX TRS VAL INX CL INV Microsoft Corp 2,159,391,285 12/31/2016
WISDOMTREE SMALLCAP DIVIDEND ETF Vector Group Ltd 34,098,816 01/26/2017
VANGUARD VALUE INDEX FUND ETF Microsoft Cop 2,159,391,285 12/31/2016
20.4
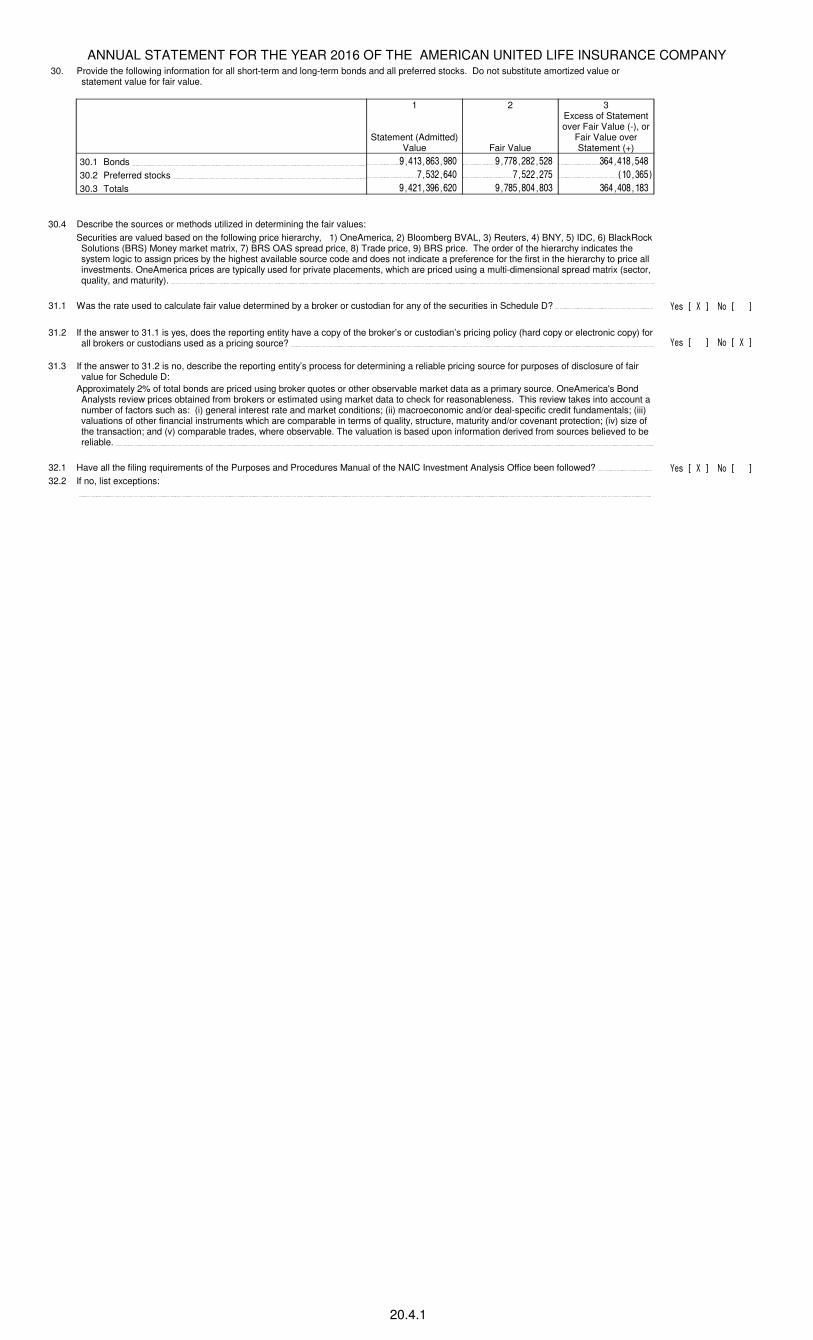
ANNUAL STATEMENT FOR THE YEAR 2016 OF THE AMERICAN UNITED LIFE INSURANCE COMPANY30. Provide the following information for all short-term and long-term bonds and all preferred stocks. Do not substitute amortized value or
statement value for fair value.
1
Statement (Admitted) Value
2
Fair Value
3Excess of Statement over Fair Value (-), or
Fair Value over Statement (+)
30.1 Bonds 9,413,863,980 9,778,282,528 364,418,548
30.2 Preferred stocks 7,532,640 7,522,275 (10,365)
30.3 Totals 9,421,396,620 9,785,804,803 364,408,183
30.4 Describe the sources or methods utilized in determining the fair values:
Securities are valued based on the following price hierarchy, 1) OneAmerica, 2) Bloomberg BVAL, 3) Reuters, 4) BNY, 5) IDC, 6) BlackRock Solutions (BRS) Money market matrix, 7) BRS OAS spread price, 8) Trade price, 9) BRS price. The order of the hierarchy indicates the system logic to assign prices by the highest available source code and does not indicate a preference for the first in the hierarchy to price all investments. OneAmerica prices are typically used for private placements, which are priced using a multi-dimensional spread matrix (sector, quality, and maturity).
31.1 Was the rate used to calculate fair value determined by a broker or custodian for any of the securities in Schedule D? Yes [ X ] No [ ]
31.2 If the answer to 31.1 is yes, does the reporting entity have a copy of the broker’s or custodian’s pricing policy (hard copy or electronic copy) for all brokers or custodians used as a pricing source? Yes [ ] No [ X ]
31.3 If the answer to 31.2 is no, describe the reporting entity’s process for determining a reliable pricing source for purposes of disclosure of fair value for Schedule D:
Approximately 2% of total bonds are priced using broker quotes or other observable market data as a primary source. OneAmerica's Bond Analysts review prices obtained from brokers or estimated using market data to check for reasonableness. This review takes into account a number of factors such as: (i) general interest rate and market conditions; (ii) macroeconomic and/or deal-specific credit fundamentals; (iii) valuations of other financial instruments which are comparable in terms of quality, structure, maturity and/or covenant protection; (iv) size of the transaction; and (v) comparable trades, where observable. The valuation is based upon information derived from sources believed to be reliable.
32.1 Have all the filing requirements of the Purposes and Procedures Manual of the NAIC Investment Analysis Office been followed? Yes [ X ] No [ ]
32.2 If no, list exceptions:
20.4.1
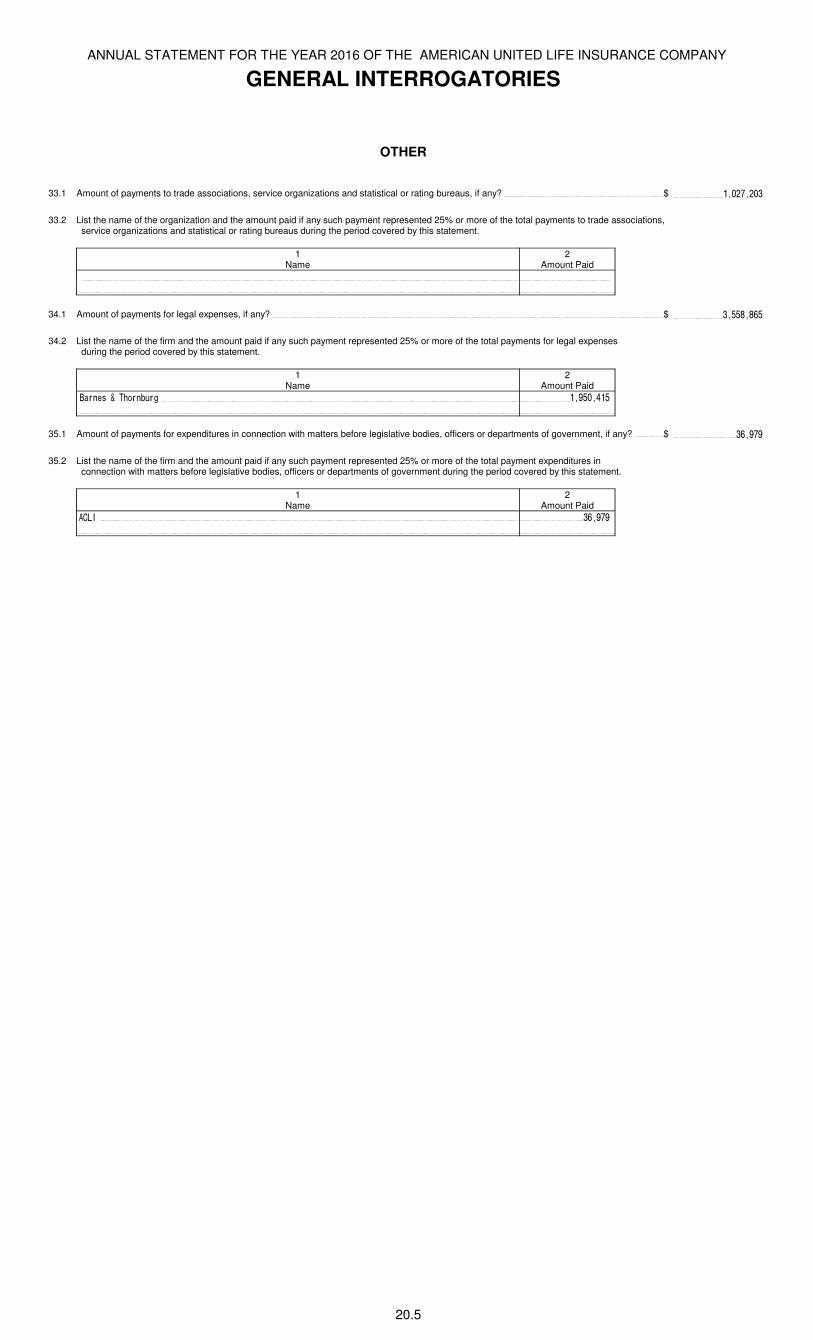
ANNUAL STATEMENT FOR THE YEAR 2016 OF THE AMERICAN UNITED LIFE INSURANCE COMPANY
GENERAL INTERROGATORIES
OTHER
33.1 Amount of payments to trade associations, service organizations and statistical or rating bureaus, if any? $ 1,027,203
33.2 List the name of the organization and the amount paid if any such payment represented 25% or more of the total payments to trade associations, service organizations and statistical or rating bureaus during the period covered by this statement.
1Name
2Amount Paid
34.1 Amount of payments for legal expenses, if any? $ 3,558,865
34.2 List the name of the firm and the amount paid if any such payment represented 25% or more of the total payments for legal expenses during the period covered by this statement.
1Name
2Amount Paid
Barnes & Thornburg 1,950,415
35.1 Amount of payments for expenditures in connection with matters before legislative bodies, officers or departments of government, if any? $ 36,979
35.2 List the name of the firm and the amount paid if any such payment represented 25% or more of the total payment expenditures in connection with matters before legislative bodies, officers or departments of government during the period covered by this statement.
1Name
2Amount Paid
ACLI 36,979
20.5
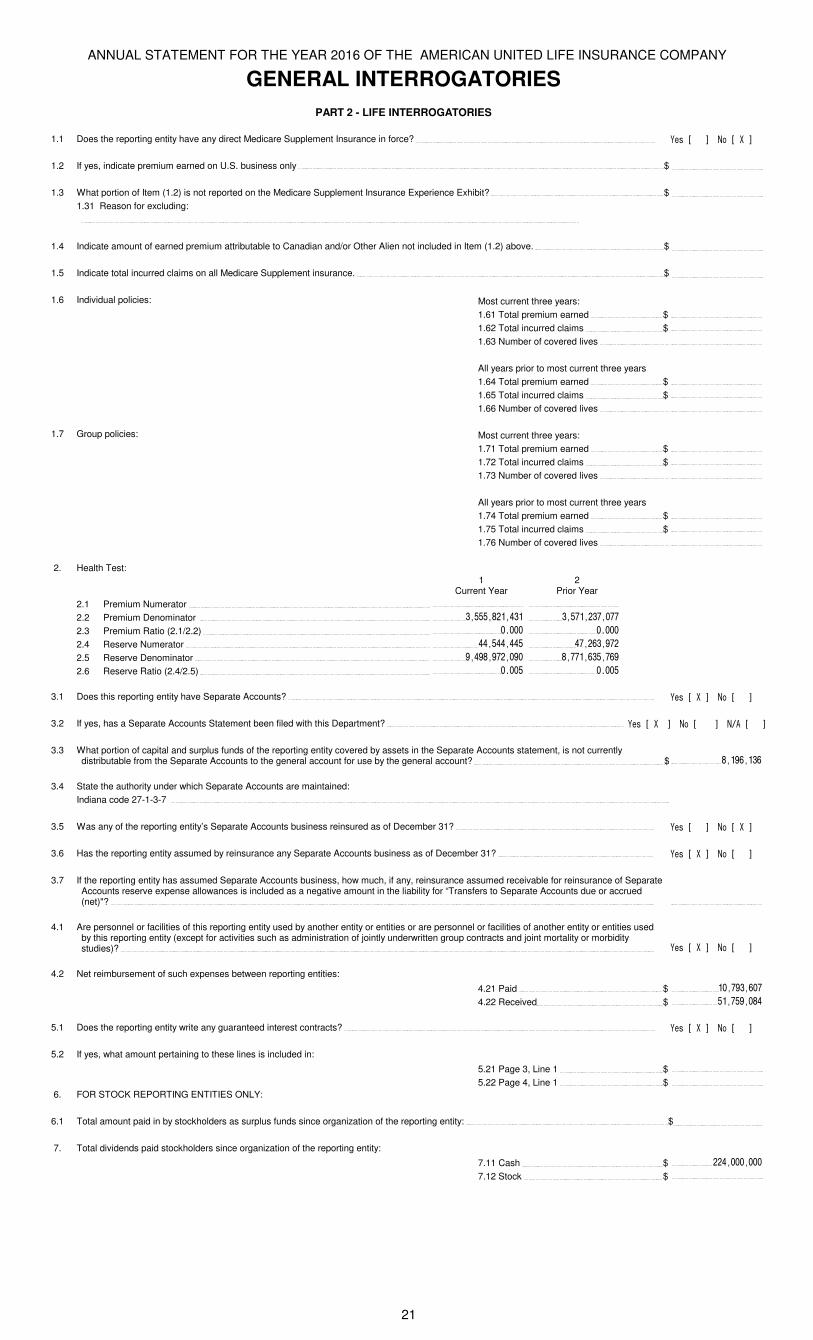
ANNUAL STATEMENT FOR THE YEAR 2016 OF THE AMERICAN UNITED LIFE INSURANCE COMPANY
GENERAL INTERROGATORIES
PART 2 - LIFE INTERROGATORIES
1.1 Does the reporting entity have any direct Medicare Supplement Insurance in force? Yes [ ] No [ X ]
1.2 If yes, indicate premium earned on U.S. business only $
1.3 What portion of Item (1.2) is not reported on the Medicare Supplement Insurance Experience Exhibit? $
1.31 Reason for excluding:
1.4 Indicate amount of earned premium attributable to Canadian and/or Other Alien not included in Item (1.2) above. $
1.5 Indicate total incurred claims on all Medicare Supplement insurance. $
1.6 Individual policies: Most current three years:
1.61 Total premium earned $
1.62 Total incurred claims $
1.63 Number of covered lives
All years prior to most current three years
1.64 Total premium earned $
1.65 Total incurred claims $
1.66 Number of covered lives
1.7 Group policies: Most current three years:
1.71 Total premium earned $
1.72 Total incurred claims $
1.73 Number of covered lives
All years prior to most current three years
1.74 Total premium earned $
1.75 Total incurred claims $
1.76 Number of covered lives
2. Health Test:
1Current Year
2Prior Year
2.1 Premium Numerator
2.2 Premium Denominator 3,555,821,431 3,571,237,077
2.3 Premium Ratio (2.1/2.2) 0.000 0.000
2.4 Reserve Numerator 44,544,445 47,263,972
2.5 Reserve Denominator 9,498,972,090 8,771,635,769
2.6 Reserve Ratio (2.4/2.5) 0.005 0.005
3.1 Does this reporting entity have Separate Accounts? Yes [ X ] No [ ]
3.2 If yes, has a Separate Accounts Statement been filed with this Department? Yes [ X ] No [ ] N/A [ ]
3.3 What portion of capital and surplus funds of the reporting entity covered by assets in the Separate Accounts statement, is not currently distributable from the Separate Accounts to the general account for use by the general account? $ 8,196,136
3.4 State the authority under which Separate Accounts are maintained:
Indiana code 27-1-3-7
3.5 Was any of the reporting entity’s Separate Accounts business reinsured as of December 31? Yes [ ] No [ X ]
3.6 Has the reporting entity assumed by reinsurance any Separate Accounts business as of December 31? Yes [ X ] No [ ]
3.7 If the reporting entity has assumed Separate Accounts business, how much, if any, reinsurance assumed receivable for reinsurance of Separate Accounts reserve expense allowances is included as a negative amount in the liability for “Transfers to Separate Accounts due or accrued (net)"?
4.1 Are personnel or facilities of this reporting entity used by another entity or entities or are personnel or facilities of another entity or entities used by this reporting entity (except for activities such as administration of jointly underwritten group contracts and joint mortality or morbidity studies)? Yes [ X ] No [ ]
4.2 Net reimbursement of such expenses between reporting entities:
4.21 Paid $ 10,793,607
4.22 Received $ 51,759,084
5.1 Does the reporting entity write any guaranteed interest contracts? Yes [ X ] No [ ]
5.2 If yes, what amount pertaining to these lines is included in:
5.21 Page 3, Line 1 $
5.22 Page 4, Line 1 $
6. FOR STOCK REPORTING ENTITIES ONLY:
6.1 Total amount paid in by stockholders as surplus funds since organization of the reporting entity: $
7. Total dividends paid stockholders since organization of the reporting entity:
7.11 Cash $ 224,000,000
7.12 Stock $
21
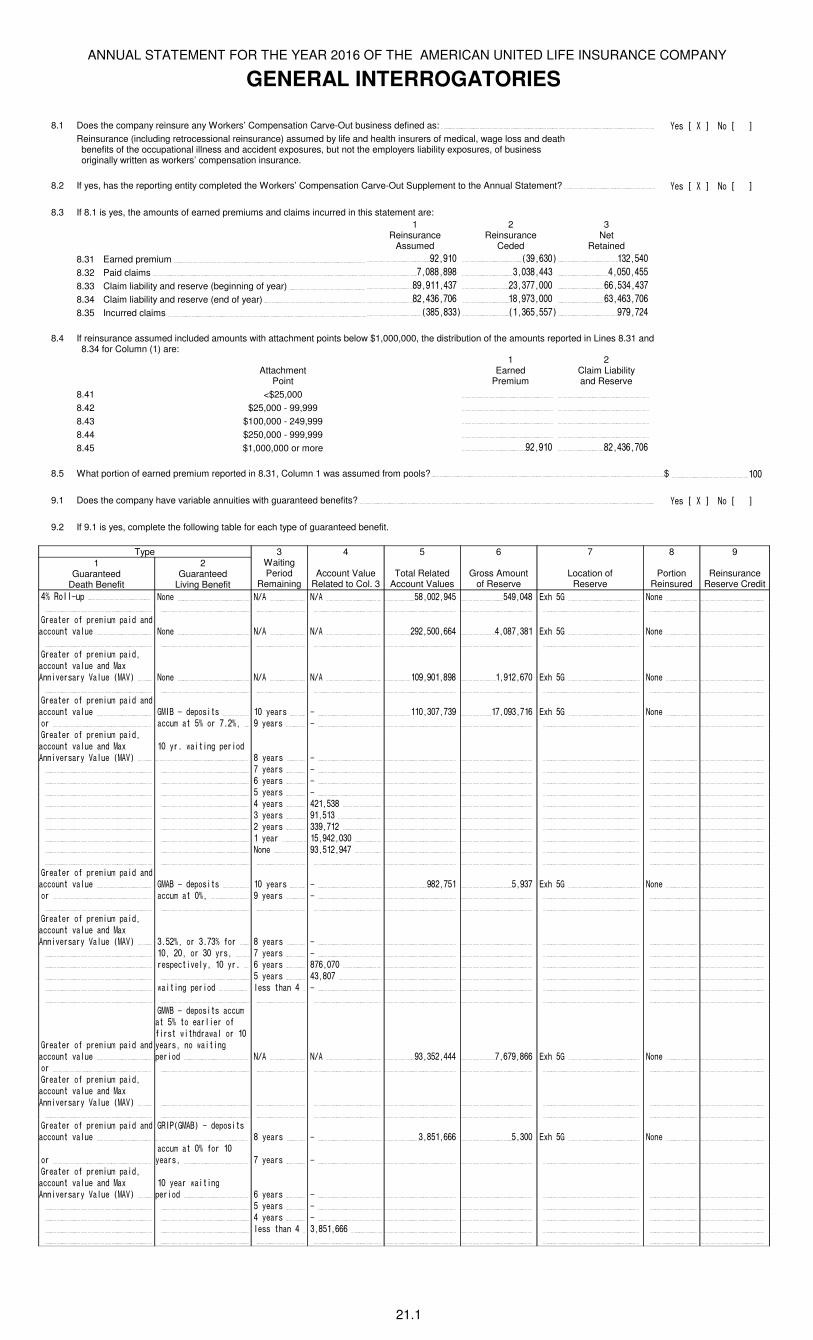
ANNUAL STATEMENT FOR THE YEAR 2016 OF THE AMERICAN UNITED LIFE INSURANCE COMPANY
GENERAL INTERROGATORIES
8.1 Does the company reinsure any Workers’ Compensation Carve-Out business defined as: Yes [ X ] No [ ]
Reinsurance (including retrocessional reinsurance) assumed by life and health insurers of medical, wage loss and death benefits of the occupational illness and accident exposures, but not the employers liability exposures, of business originally written as workers’ compensation insurance.
8.2 If yes, has the reporting entity completed the Workers’ Compensation Carve-Out Supplement to the Annual Statement? Yes [ X ] No [ ]
8.3 If 8.1 is yes, the amounts of earned premiums and claims incurred in this statement are:
1Reinsurance
Assumed
2Reinsurance
Ceded
3Net
Retained
8.31 Earned premium 92,910 (39,630) 132,540
8.32 Paid claims 7,088,898 3,038,443 4,050,455
8.33 Claim liability and reserve (beginning of year) 89,911,437 23,377,000 66,534,437
8.34 Claim liability and reserve (end of year) 82,436,706 18,973,000 63,463,706
8.35 Incurred claims (385,833) (1,365,557) 979,724
8.4 If reinsurance assumed included amounts with attachment points below $1,000,000, the distribution of the amounts reported in Lines 8.31 and 8.34 for Column (1) are:
AttachmentPoint
1Earned
Premium
2Claim Liabilityand Reserve
8.41 <$25,000
8.42 $25,000 - 99,999
8.43 $100,000 - 249,999
8.44 $250,000 - 999,999
8.45 $1,000,000 or more 92,910 82,436,706
8.5 What portion of earned premium reported in 8.31, Column 1 was assumed from pools? $ 100
9.1 Does the company have variable annuities with guaranteed benefits? Yes [ X ] No [ ]
9.2 If 9.1 is yes, complete the following table for each type of guaranteed benefit.
Type 3 4 5 6 7 8 91
GuaranteedDeath Benefit
2Guaranteed
Living Benefit
WaitingPeriod
RemainingAccount Value
Related to Col. 3Total Related
Account ValuesGross Amount
of ReserveLocation of
ReservePortion
ReinsuredReinsurance
Reserve Credit
4% Roll-up None N/A N/A 58,002,945 549,048 Exh 5G None
Greater of premium paid and
account value None N/A N/A 292,500,664 4,087,381 Exh 5G None
Greater of premium paid,
account value and Max
Anniversary Value (MAV) None N/A N/A 109,901,898 1,912,670 Exh 5G None
Greater of premium paid and
account value GMIB - deposits 10 years - 110,307,739 17,093,716 Exh 5G None
or accum at 5% or 7.2%, 9 years -
Greater of premium paid,
account value and Max
Anniversary Value (MAV)
10 yr. waiting period
8 years -
7 years -
6 years -
5 years -
4 years 421,538
3 years 91,513
2 years 339,712
1 year 15,942,030
None 93,512,947
Greater of premium paid and
account value GMAB - deposits 10 years - 982,751 5,937 Exh 5G None
or accum at 0%, 9 years -
Greater of premium paid,
account value and Max
Anniversary Value (MAV) 3.52%, or 3.73% for 8 years -
10, 20, or 30 yrs, 7 years -
respectively, 10 yr. 6 years 876,070
5 years 43,807
waiting period less than 4 -
Greater of premium paid and
account value
GMWB - deposits accum
at 5% to earlier of
first withdrawal or 10
years, no waiting
period N/A N/A 93,352,444 7,679,866 Exh 5G None
or
Greater of premium paid,
account value and Max
Anniversary Value (MAV)
Greater of premium paid and
account value
GRIP(GMAB) - deposits
8 years - 3,851,666 5,300 Exh 5G None
or
accum at 0% for 10
years, 7 years -
Greater of premium paid,
account value and Max
Anniversary Value (MAV)
10 year waiting
period 6 years -
5 years -
4 years -
less than 4 3,851,666
21.1
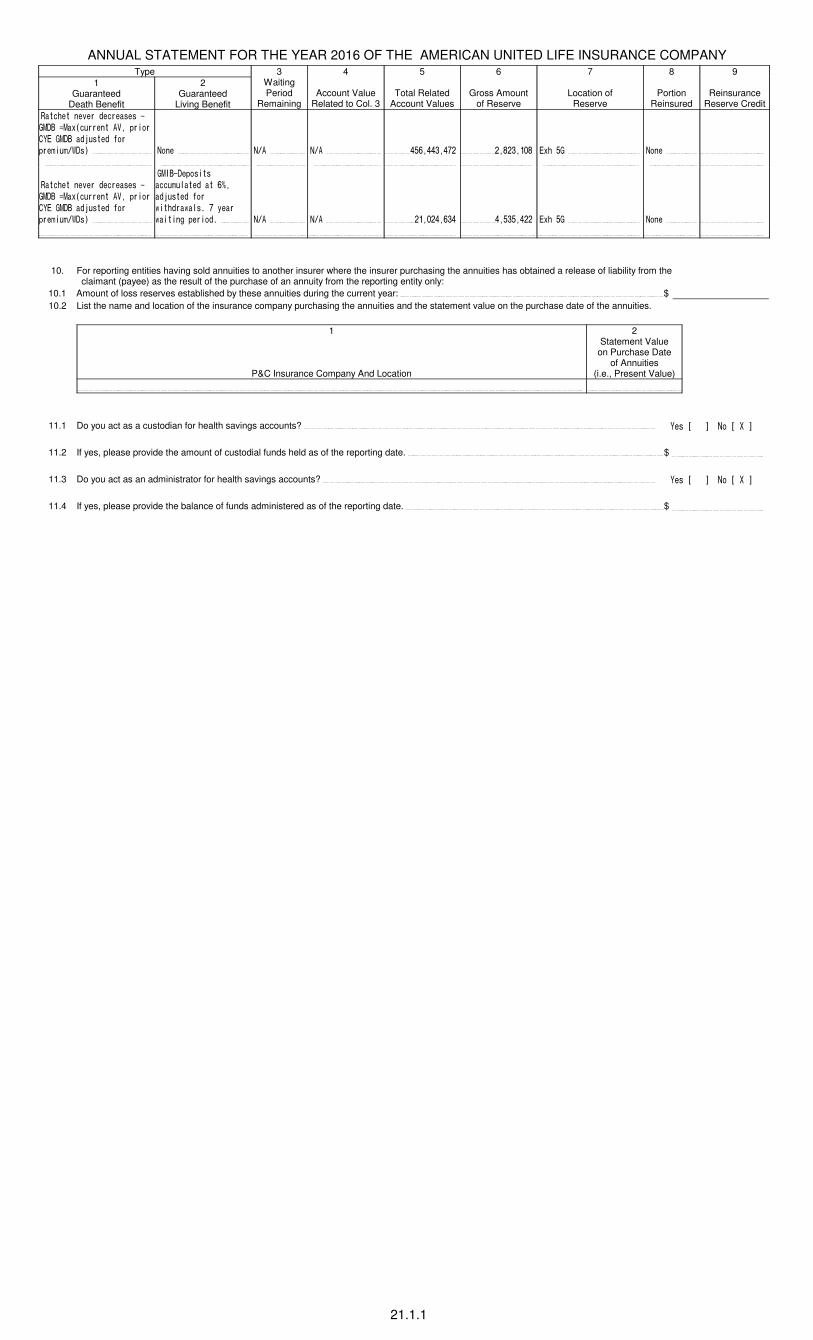
ANNUAL STATEMENT FOR THE YEAR 2016 OF THE AMERICAN UNITED LIFE INSURANCE COMPANYType 3 4 5 6 7 8 9
1Guaranteed
Death Benefit
2Guaranteed
Living Benefit
WaitingPeriod
RemainingAccount Value
Related to Col. 3Total Related
Account ValuesGross Amount
of ReserveLocation of
ReservePortion
ReinsuredReinsurance
Reserve Credit
Ratchet never decreases -
GMDB =Max(current AV, prior
CYE GMDB adjusted for
premium/WDs) None N/A N/A 456,443,472 2,823,108 Exh 5G None
Ratchet never decreases -
GMDB =Max(current AV, prior
CYE GMDB adjusted for
premium/WDs)
GMIB-Deposits
accumulated at 6%,
adjusted for
withdrawals. 7 year
waiting period. N/A N/A 21,024,634 4,535,422 Exh 5G None
10. For reporting entities having sold annuities to another insurer where the insurer purchasing the annuities has obtained a release of liability from the claimant (payee) as the result of the purchase of an annuity from the reporting entity only:
10.1 Amount of loss reserves established by these annuities during the current year: $
10.2 List the name and location of the insurance company purchasing the annuities and the statement value on the purchase date of the annuities.
1
P&C Insurance Company And Location
2Statement Value
on Purchase Dateof Annuities
(i.e., Present Value)
11.1 Do you act as a custodian for health savings accounts? Yes [ ] No [ X ]
11.2 If yes, please provide the amount of custodial funds held as of the reporting date. $
11.3 Do you act as an administrator for health savings accounts? Yes [ ] No [ X ]
11.4 If yes, please provide the balance of funds administered as of the reporting date. $
21.1.1
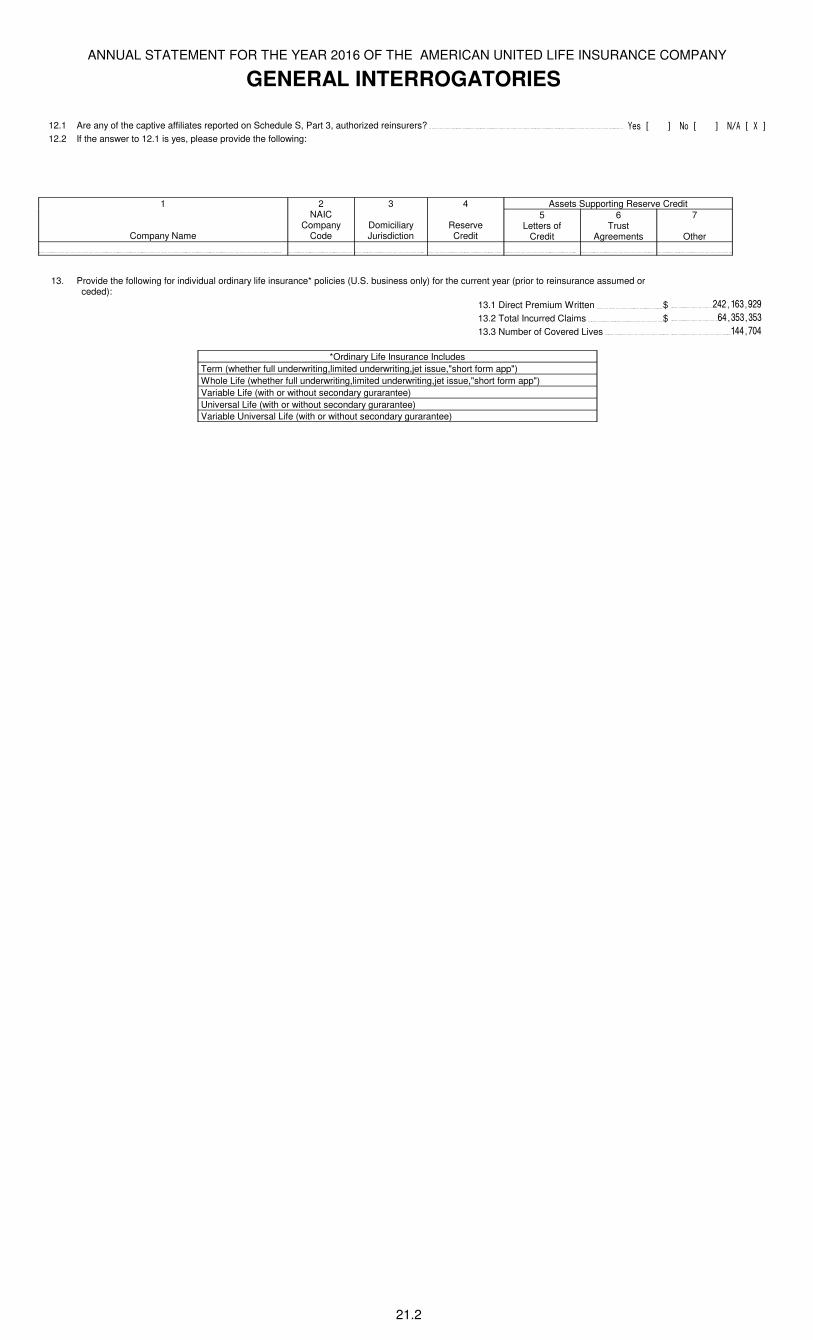
ANNUAL STATEMENT FOR THE YEAR 2016 OF THE AMERICAN UNITED LIFE INSURANCE COMPANY
GENERAL INTERROGATORIES
12.1 Are any of the captive affiliates reported on Schedule S, Part 3, authorized reinsurers? Yes [ ] No [ ] N/A [ X ]
12.2 If the answer to 12.1 is yes, please provide the following:
1 2 3 4 Assets Supporting Reserve Credit
Company Name
NAICCompany
CodeDomiciliary Jurisdiction
ReserveCredit
5Letters of
Credit
6Trust
Agreements
7
Other
13. Provide the following for individual ordinary life insurance* policies (U.S. business only) for the current year (prior to reinsurance assumed or ceded):
13.1 Direct Premium Written $ 242,163,929
13.2 Total Incurred Claims $ 64,353,353
13.3 Number of Covered Lives 144,704
*Ordinary Life Insurance Includes
Term (whether full underwriting,limited underwriting,jet issue,"short form app")
Whole Life (whether full underwriting,limited underwriting,jet issue,"short form app")
Variable Life (with or without secondary gurarantee)
Universal Life (with or without secondary gurarantee)
Variable Universal Life (with or without secondary gurarantee)
21.2
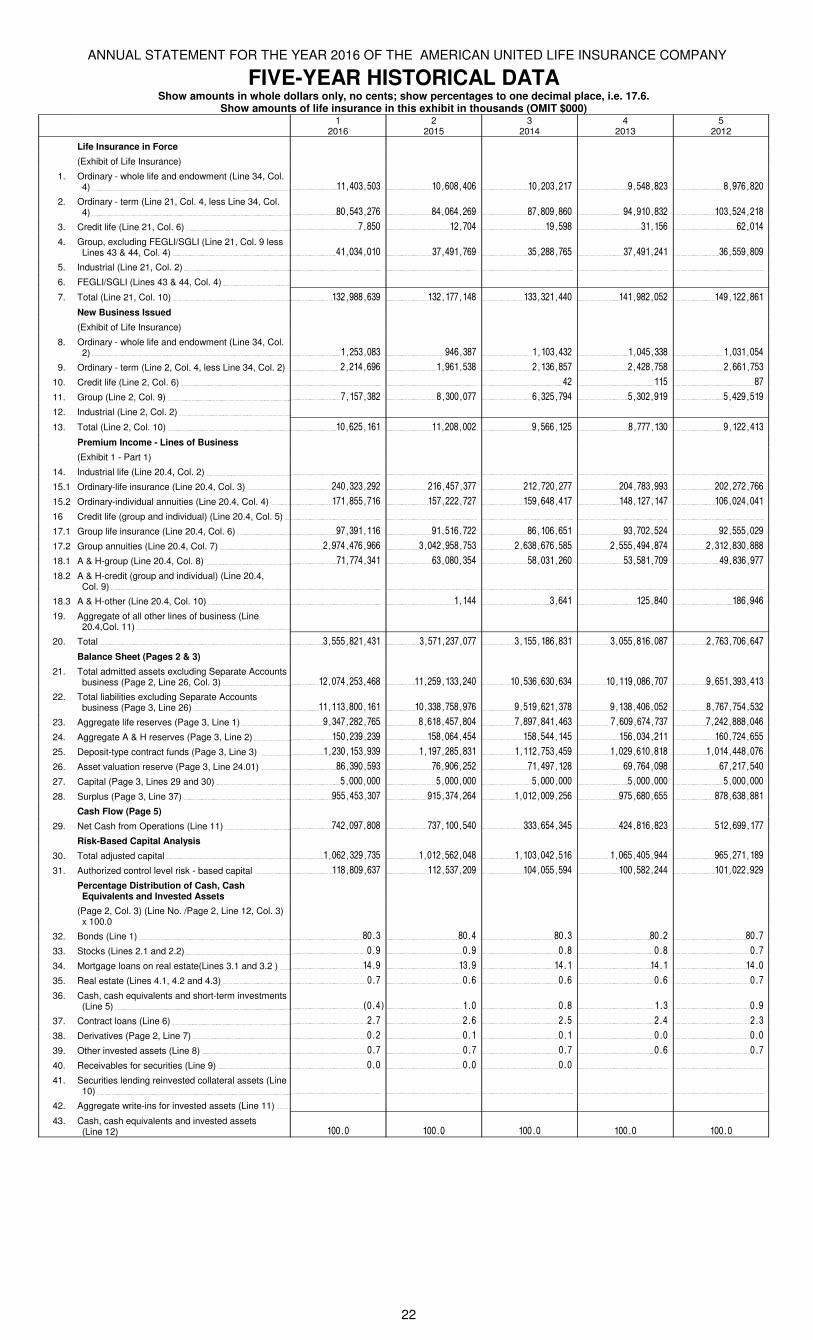
ANNUAL STATEMENT FOR THE YEAR 2016 OF THE AMERICAN UNITED LIFE INSURANCE COMPANY
FIVE-YEAR HISTORICAL DATAShow amounts in whole dollars only, no cents; show percentages to one decimal place, i.e. 17.6.
Show amounts of life insurance in this exhibit in thousands (OMIT $000)1
20162
20153
20144
20135
2012
Life Insurance in Force
(Exhibit of Life Insurance)
1. Ordinary - whole life and endowment (Line 34, Col. 4) 11,403,503 10,608,406 10,203,217 9,548,823 8,976,820
2. Ordinary - term (Line 21, Col. 4, less Line 34, Col. 4) 80,543,276 84,064,269 87,809,860 94,910,832 103,524,218
3. Credit life (Line 21, Col. 6) 7,850 12,704 19,598 31,156 62,014
4. Group, excluding FEGLI/SGLI (Line 21, Col. 9 less Lines 43 & 44, Col. 4) 41,034,010 37,491,769 35,288,765 37,491,241 36,559,809
5. Industrial (Line 21, Col. 2)
6. FEGLI/SGLI (Lines 43 & 44, Col. 4)
7. Total (Line 21, Col. 10) 132,988,639 132,177,148 133,321,440 141,982,052 149,122,861
New Business Issued
(Exhibit of Life Insurance)
8. Ordinary - whole life and endowment (Line 34, Col. 2) 1,253,083 946,387 1,103,432 1,045,338 1,031,054
9. Ordinary - term (Line 2, Col. 4, less Line 34, Col. 2) 2,214,696 1,961,538 2,136,857 2,428,758 2,661,753
10. Credit life (Line 2, Col. 6) 42 115 87
11. Group (Line 2, Col. 9) 7,157,382 8,300,077 6,325,794 5,302,919 5,429,519
12. Industrial (Line 2, Col. 2)
13. Total (Line 2, Col. 10) 10,625,161 11,208,002 9,566,125 8,777,130 9,122,413
Premium Income - Lines of Business
(Exhibit 1 - Part 1)
14. Industrial life (Line 20.4, Col. 2)
15.1 Ordinary-life insurance (Line 20.4, Col. 3) 240,323,292 216,457,377 212,720,277 204,783,993 202,272,766
15.2 Ordinary-individual annuities (Line 20.4, Col. 4) 171,855,716 157,222,727 159,648,417 148,127,147 106,024,041
16 Credit life (group and individual) (Line 20.4, Col. 5)
17.1 Group life insurance (Line 20.4, Col. 6) 97,391,116 91,516,722 86,106,651 93,702,524 92,555,029
17.2 Group annuities (Line 20.4, Col. 7) 2,974,476,966 3,042,958,753 2,638,676,585 2,555,494,874 2,312,830,888
18.1 A & H-group (Line 20.4, Col. 8) 71,774,341 63,080,354 58,031,260 53,581,709 49,836,977
18.2 A & H-credit (group and individual) (Line 20.4, Col. 9)
18.3 A & H-other (Line 20.4, Col. 10) 1,144 3,641 125,840 186,946
19. Aggregate of all other lines of business (Line 20.4,Col. 11)
20. Total 3,555,821,431 3,571,237,077 3,155,186,831 3,055,816,087 2,763,706,647
Balance Sheet (Pages 2 & 3)
21. Total admitted assets excluding Separate Accounts business (Page 2, Line 26, Col. 3) 12,074,253,468 11,259,133,240 10,536,630,634 10,119,086,707 9,651,393,413
22. Total liabilities excluding Separate Accounts business (Page 3, Line 26) 11,113,800,161 10,338,758,976 9,519,621,378 9,138,406,052 8,767,754,532
23. Aggregate life reserves (Page 3, Line 1) 9,347,282,765 8,618,457,804 7,897,841,463 7,609,674,737 7,242,888,046
24. Aggregate A & H reserves (Page 3, Line 2) 150,239,239 158,064,454 158,544,145 156,034,211 160,724,655
25. Deposit-type contract funds (Page 3, Line 3) 1,230,153,939 1,197,285,831 1,112,753,459 1,029,610,818 1,014,448,076
26. Asset valuation reserve (Page 3, Line 24.01) 86,390,593 76,906,252 71,497,128 69,764,098 67,217,540
27. Capital (Page 3, Lines 29 and 30) 5,000,000 5,000,000 5,000,000 5,000,000 5,000,000
28. Surplus (Page 3, Line 37) 955,453,307 915,374,264 1,012,009,256 975,680,655 878,638,881
Cash Flow (Page 5)
29. Net Cash from Operations (Line 11) 742,097,808 737,100,540 333,654,345 424,816,823 512,699,177
Risk-Based Capital Analysis
30. Total adjusted capital 1,062,329,735 1,012,562,048 1,103,042,516 1,065,405,944 965,271,189
31. Authorized control level risk - based capital 118,809,637 112,537,209 104,055,594 100,582,244 101,022,929
Percentage Distribution of Cash, Cash Equivalents and Invested Assets
(Page 2, Col. 3) (Line No. /Page 2, Line 12, Col. 3) x 100.0
32. Bonds (Line 1) 80.3 80.4 80.3 80.2 80.7
33. Stocks (Lines 2.1 and 2.2) 0.9 0.9 0.8 0.8 0.7
34. Mortgage loans on real estate(Lines 3.1 and 3.2 ) 14.9 13.9 14.1 14.1 14.0
35. Real estate (Lines 4.1, 4.2 and 4.3) 0.7 0.6 0.6 0.6 0.7
36. Cash, cash equivalents and short-term investments (Line 5) (0.4) 1.0 0.8 1.3 0.9
37. Contract loans (Line 6) 2.7 2.6 2.5 2.4 2.3
38. Derivatives (Page 2, Line 7) 0.2 0.1 0.1 0.0 0.0
39. Other invested assets (Line 8) 0.7 0.7 0.7 0.6 0.7
40. Receivables for securities (Line 9) 0.0 0.0 0.0
41. Securities lending reinvested collateral assets (Line 10)
42. Aggregate write-ins for invested assets (Line 11)
43. Cash, cash equivalents and invested assets (Line 12) 100.0 100.0 100.0 100.0 100.0
22
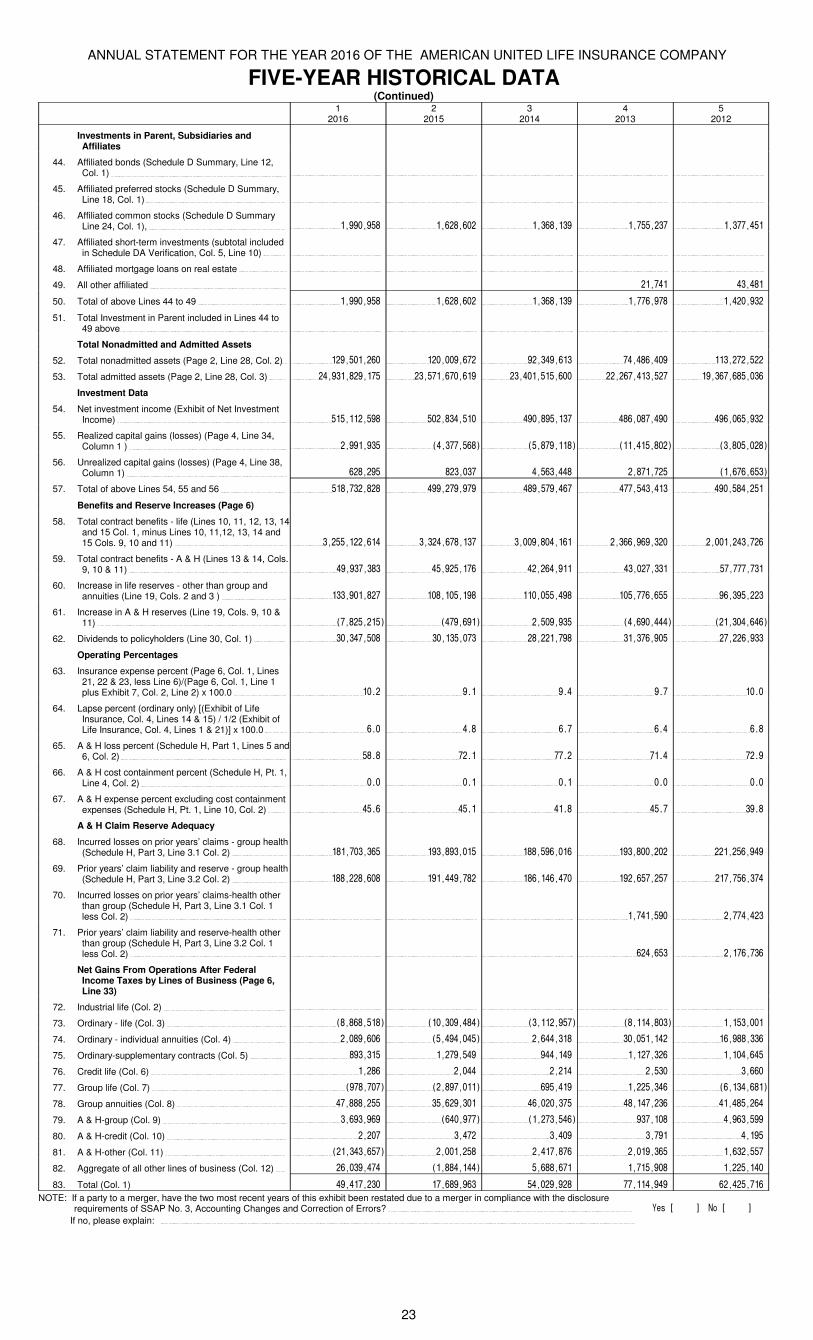
ANNUAL STATEMENT FOR THE YEAR 2016 OF THE AMERICAN UNITED LIFE INSURANCE COMPANY
FIVE-YEAR HISTORICAL DATA(Continued)
12016
22015
32014
42013
52012
Investments in Parent, Subsidiaries and Affiliates
44. Affiliated bonds (Schedule D Summary, Line 12, Col. 1)
45. Affiliated preferred stocks (Schedule D Summary, Line 18, Col. 1)
46. Affiliated common stocks (Schedule D Summary Line 24, Col. 1), 1,990,958 1,628,602 1,368,139 1,755,237 1,377,451
47. Affiliated short-term investments (subtotal included in Schedule DA Verification, Col. 5, Line 10)
48. Affiliated mortgage loans on real estate
49. All other affiliated 21,741 43,481
50. Total of above Lines 44 to 49 1,990,958 1,628,602 1,368,139 1,776,978 1,420,932
51. Total Investment in Parent included in Lines 44 to 49 above
Total Nonadmitted and Admitted Assets
52. Total nonadmitted assets (Page 2, Line 28, Col. 2) 129,501,260 120,009,672 92,349,613 74,486,409 113,272,522
53. Total admitted assets (Page 2, Line 28, Col. 3) 24,931,829,175 23,571,670,619 23,401,515,600 22,267,413,527 19,367,685,036
Investment Data
54. Net investment income (Exhibit of Net Investment Income) 515,112,598 502,834,510 490,895,137 486,087,490 496,065,932
55. Realized capital gains (losses) (Page 4, Line 34, Column 1 ) 2,991,935 (4,377,568) (5,879,118) (11,415,802) (3,805,028)
56. Unrealized capital gains (losses) (Page 4, Line 38, Column 1) 628,295 823,037 4,563,448 2,871,725 (1,676,653)
57. Total of above Lines 54, 55 and 56 518,732,828 499,279,979 489,579,467 477,543,413 490,584,251
Benefits and Reserve Increases (Page 6)
58. Total contract benefits - life (Lines 10, 11, 12, 13, 14 and 15 Col. 1, minus Lines 10, 11,12, 13, 14 and 15 Cols. 9, 10 and 11) 3,255,122,614 3,324,678,137 3,009,804,161 2,366,969,320 2,001,243,726
59. Total contract benefits - A & H (Lines 13 & 14, Cols. 9, 10 & 11) 49,937,383 45,925,176 42,264,911 43,027,331 57,777,731
60. Increase in life reserves - other than group and annuities (Line 19, Cols. 2 and 3 ) 133,901,827 108,105,198 110,055,498 105,776,655 96,395,223
61. Increase in A & H reserves (Line 19, Cols. 9, 10 & 11) (7,825,215) (479,691) 2,509,935 (4,690,444) (21,304,646)
62. Dividends to policyholders (Line 30, Col. 1) 30,347,508 30,135,073 28,221,798 31,376,905 27,226,933
Operating Percentages
63. Insurance expense percent (Page 6, Col. 1, Lines 21, 22 & 23, less Line 6)/(Page 6, Col. 1, Line 1 plus Exhibit 7, Col. 2, Line 2) x 100.0 10.2 9.1 9.4 9.7 10.0
64. Lapse percent (ordinary only) [(Exhibit of Life Insurance, Col. 4, Lines 14 & 15) / 1/2 (Exhibit of Life Insurance, Col. 4, Lines 1 & 21)] x 100.0 6.0 4.8 6.7 6.4 6.8
65. A & H loss percent (Schedule H, Part 1, Lines 5 and 6, Col. 2) 58.8 72.1 77.2 71.4 72.9
66. A & H cost containment percent (Schedule H, Pt. 1, Line 4, Col. 2) 0.0 0.1 0.1 0.0 0.0
67. A & H expense percent excluding cost containment expenses (Schedule H, Pt. 1, Line 10, Col. 2) 45.6 45.1 41.8 45.7 39.8
A & H Claim Reserve Adequacy
68. Incurred losses on prior years’ claims - group health (Schedule H, Part 3, Line 3.1 Col. 2) 181,703,365 193,893,015 188,596,016 193,800,202 221,256,949
69. Prior years’ claim liability and reserve - group health (Schedule H, Part 3, Line 3.2 Col. 2) 188,228,608 191,449,782 186,146,470 192,657,257 217,756,374
70. Incurred losses on prior years’ claims-health other than group (Schedule H, Part 3, Line 3.1 Col. 1 less Col. 2) 1,741,590 2,774,423
71. Prior years’ claim liability and reserve-health other than group (Schedule H, Part 3, Line 3.2 Col. 1 less Col. 2) 624,653 2,176,736
Net Gains From Operations After Federal Income Taxes by Lines of Business (Page 6, Line 33)
72. Industrial life (Col. 2)
73. Ordinary - life (Col. 3) (8,868,518) (10,309,484) (3,112,957) (8,114,803) 1,153,001
74. Ordinary - individual annuities (Col. 4) 2,089,606 (5,494,045) 2,644,318 30,051,142 16,988,336
75. Ordinary-supplementary contracts (Col. 5) 893,315 1,279,549 944,149 1,127,326 1,104,645
76. Credit life (Col. 6) 1,286 2,044 2,214 2,530 3,660
77. Group life (Col. 7) (978,707) (2,897,011) 695,419 1,225,346 (6,134,681)
78. Group annuities (Col. 8) 47,888,255 35,629,301 46,020,375 48,147,236 41,485,264
79. A & H-group (Col. 9) 3,693,969 (640,977) (1,273,546) 937,108 4,963,599
80. A & H-credit (Col. 10) 2,207 3,472 3,409 3,791 4,195
81. A & H-other (Col. 11) (21,343,657) 2,001,258 2,417,876 2,019,365 1,632,557
82. Aggregate of all other lines of business (Col. 12) 26,039,474 (1,884,144) 5,688,671 1,715,908 1,225,140
83. Total (Col. 1) 49,417,230 17,689,963 54,029,928 77,114,949 62,425,716
NOTE: If a party to a merger, have the two most recent years of this exhibit been restated due to a merger in compliance with the disclosure requirements of SSAP No. 3, Accounting Changes and Correction of Errors? Yes [ ] No [ ]
If no, please explain:
23
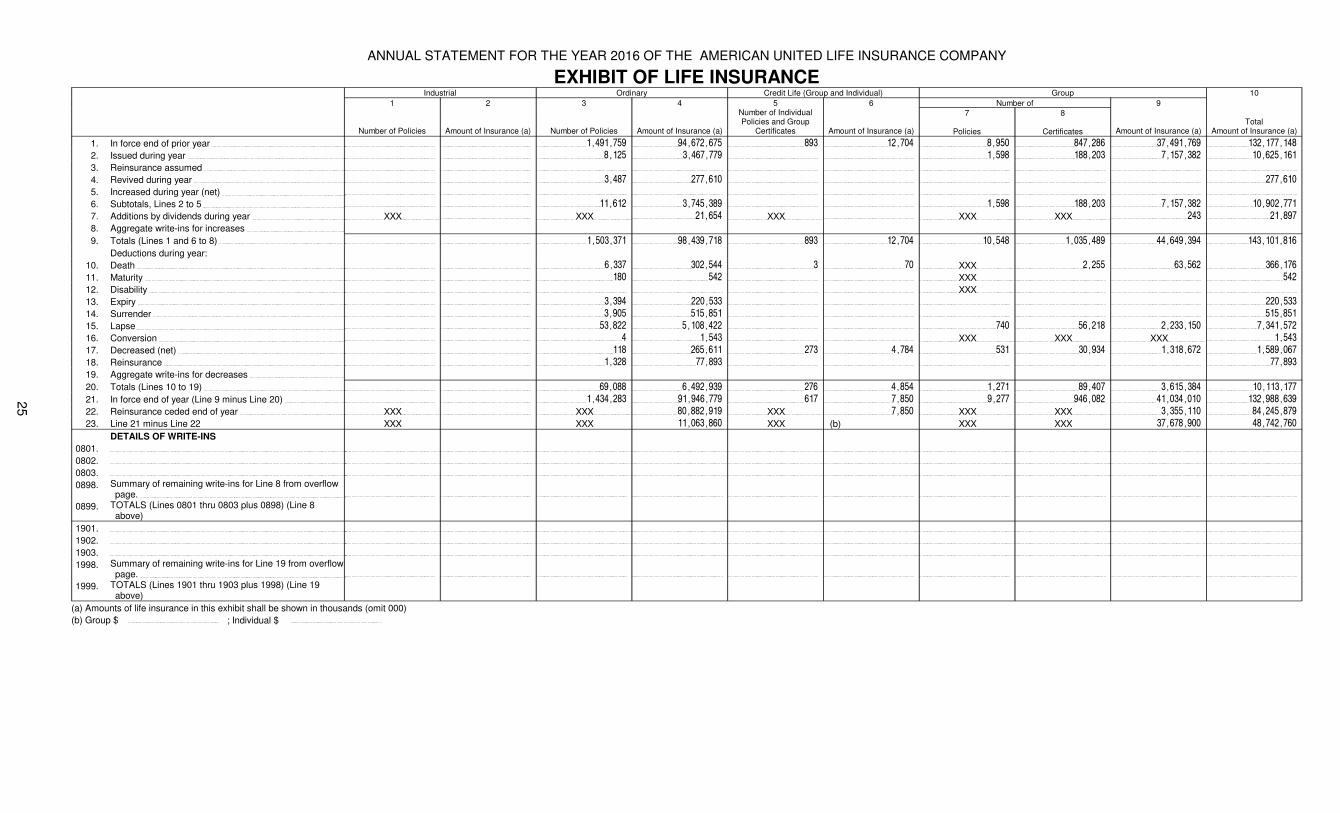
ANNUAL STATEMENT FOR THE YEAR 2016 OF THE AMERICAN UNITED LIFE INSURANCE COMPANY
EXHIBIT OF LIFE INSURANCEIndustrial Ordinary Credit Life (Group and Individual) Group 10
1 2 3 4 5 6 Number of 9
Number of Policies Amount of Insurance (a) Number of Policies Amount of Insurance (a)
Number of Individual Policies and Group
Certificates Amount of Insurance (a)
7
Policies
8
Certificates Amount of Insurance (a)Total
Amount of Insurance (a)
1. In force end of prior year 1,491,759 94,672,675 893 12,704 8,950 847,286 37,491,769 132,177,148
2. Issued during year 8,125 3,467,779 1,598 188,203 7,157,382 10,625,161
3. Reinsurance assumed
4. Revived during year 3,487 277,610 277,610
5. Increased during year (net)
6. Subtotals, Lines 2 to 5 11,612 3,745,389 1,598 188,203 7,157,382 10,902,771
7. Additions by dividends during year XXX XXX 21,654 XXX XXX XXX 243 21,897
8. Aggregate write-ins for increases
9. Totals (Lines 1 and 6 to 8) 1,503,371 98,439,718 893 12,704 10,548 1,035,489 44,649,394 143,101,816
Deductions during year:
10. Death 6,337 302,544 3 70 XXX 2,255 63,562 366,176
11. Maturity 180 542 XXX 542
12. Disability XXX
13. Expiry 3,394 220,533 220,533
14. Surrender 3,905 515,851 515,851
15. Lapse 53,822 5,108,422 740 56,218 2,233,150 7,341,572
16. Conversion 4 1,543 XXX XXX XXX 1,543
17. Decreased (net) 118 265,611 273 4,784 531 30,934 1,318,672 1,589,067
18. Reinsurance 1,328 77,893 77,893
19. Aggregate write-ins for decreases
20. Totals (Lines 10 to 19) 69,088 6,492,939 276 4,854 1,271 89,407 3,615,384 10,113,177
21. In force end of year (Line 9 minus Line 20) 1,434,283 91,946,779 617 7,850 9,277 946,082 41,034,010 132,988,639
22. Reinsurance ceded end of year XXX XXX 80,882,919 XXX 7,850 XXX XXX 3,355,110 84,245,879
23. Line 21 minus Line 22 XXX XXX 11,063,860 XXX (b) XXX XXX 37,678,900 48,742,760
DETAILS OF WRITE-INS
0801.
0802.
0803.
0898. Summary of remaining write-ins for Line 8 from overflow page.
0899. TOTALS (Lines 0801 thru 0803 plus 0898) (Line 8 above)
1901.
1902.
1903.
1998. Summary of remaining write-ins for Line 19 from overflow page.
1999. TOTALS (Lines 1901 thru 1903 plus 1998) (Line 19 above)
(a) Amounts of life insurance in this exhibit shall be shown in thousands (omit 000)
(b) Group $ ; Individual $
25
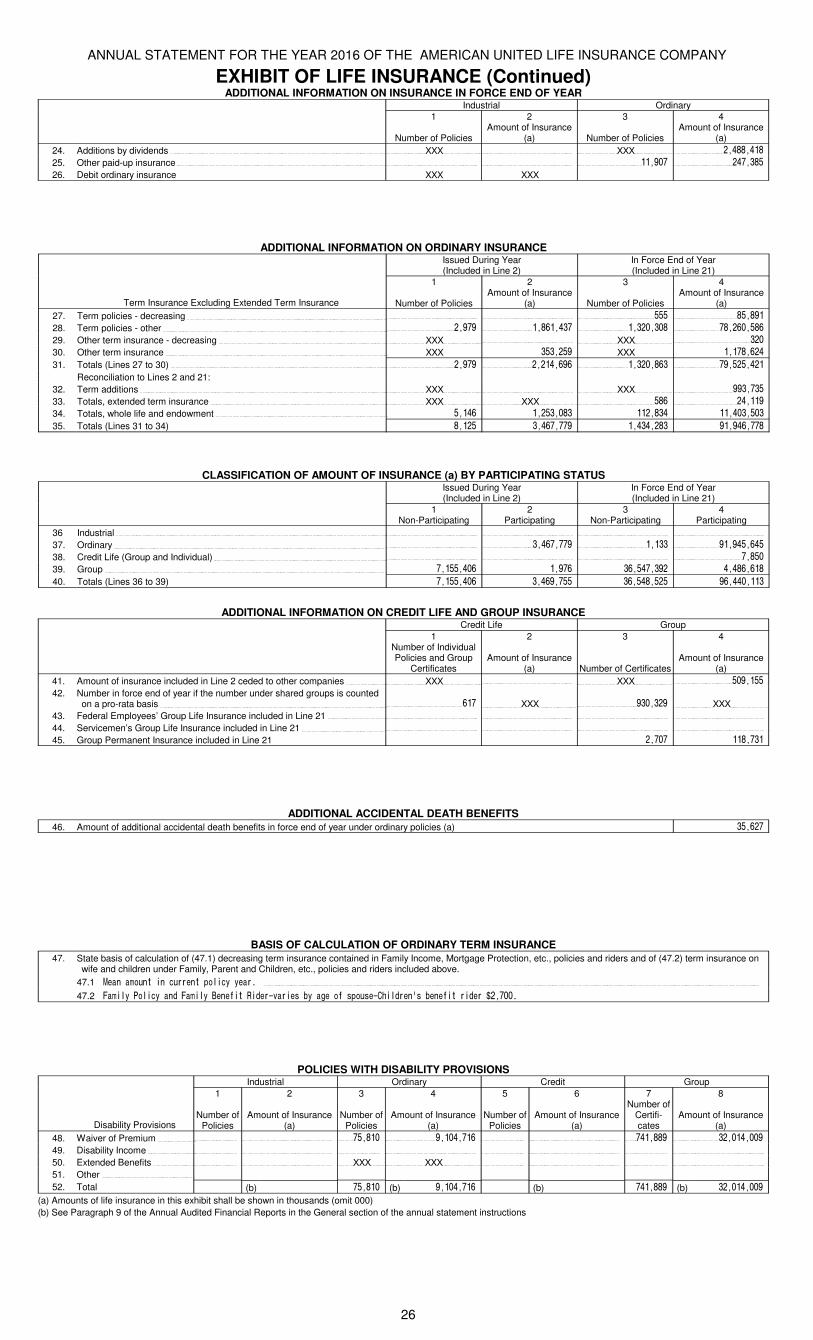
ANNUAL STATEMENT FOR THE YEAR 2016 OF THE AMERICAN UNITED LIFE INSURANCE COMPANY
EXHIBIT OF LIFE INSURANCE (Continued)ADDITIONAL INFORMATION ON INSURANCE IN FORCE END OF YEAR
Industrial Ordinary1
Number of Policies
2Amount of Insurance
(a)
3
Number of Policies
4Amount of Insurance
(a)
24. Additions by dividends XXX XXX 2,488,418
25. Other paid-up insurance 11,907 247,385
26. Debit ordinary insurance XXX XXX
ADDITIONAL INFORMATION ON ORDINARY INSURANCEIssued During Year(Included in Line 2)
In Force End of Year(Included in Line 21)
Term Insurance Excluding Extended Term Insurance
1
Number of Policies
2Amount of Insurance
(a)
3
Number of Policies
4Amount of Insurance
(a)
27. Term policies - decreasing 555 85,891
28. Term policies - other 2,979 1,861,437 1,320,308 78,260,586
29. Other term insurance - decreasing XXX XXX 320
30. Other term insurance XXX 353,259 XXX 1,178,624
31. Totals (Lines 27 to 30) 2,979 2,214,696 1,320,863 79,525,421
Reconciliation to Lines 2 and 21:
32. Term additions XXX XXX 993,735
33. Totals, extended term insurance XXX XXX 586 24,119
34. Totals, whole life and endowment 5,146 1,253,083 112,834 11,403,503
35. Totals (Lines 31 to 34) 8,125 3,467,779 1,434,283 91,946,778
CLASSIFICATION OF AMOUNT OF INSURANCE (a) BY PARTICIPATING STATUSIssued During Year(Included in Line 2)
In Force End of Year(Included in Line 21)
1Non-Participating
2Participating
3Non-Participating
4Participating
36 Industrial
37. Ordinary 3,467,779 1,133 91,945,645
38. Credit Life (Group and Individual) 7,850
39. Group 7,155,406 1,976 36,547,392 4,486,618
40. Totals (Lines 36 to 39) 7,155,406 3,469,755 36,548,525 96,440,113
ADDITIONAL INFORMATION ON CREDIT LIFE AND GROUP INSURANCECredit Life Group
1Number of Individual Policies and Group
Certificates
2
Amount of Insurance(a)
3
Number of Certificates
4
Amount of Insurance(a)
41. Amount of insurance included in Line 2 ceded to other companies XXX XXX 509,155
42. Number in force end of year if the number under shared groups is counted on a pro-rata basis 617 XXX 930,329 XXX
43. Federal Employees’ Group Life Insurance included in Line 21
44. Servicemen’s Group Life Insurance included in Line 21
45. Group Permanent Insurance included in Line 21 2,707 118,731
ADDITIONAL ACCIDENTAL DEATH BENEFITS46. Amount of additional accidental death benefits in force end of year under ordinary policies (a) 35,627
BASIS OF CALCULATION OF ORDINARY TERM INSURANCE47. State basis of calculation of (47.1) decreasing term insurance contained in Family Income, Mortgage Protection, etc., policies and riders and of (47.2) term insurance on
wife and children under Family, Parent and Children, etc., policies and riders included above.
47.1 Mean amount in current policy year.
47.2 Family Policy and Family Benefit Rider-varies by age of spouse-Children's benefit rider $2,700.
POLICIES WITH DISABILITY PROVISIONSIndustrial Ordinary Credit Group
Disability Provisions
1
Number of Policies
2
Amount of Insurance(a)
3
Number of Policies
4
Amount of Insurance(a)
5
Number of Policies
6
Amount of Insurance(a)
7Number of
Certifi-cates
8
Amount of Insurance(a)
48. Waiver of Premium 75,810 9,104,716 741,889 32,014,009
49. Disability Income
50. Extended Benefits XXX XXX
51. Other
52. Total (b) 75,810 (b) 9,104,716 (b) 741,889 (b) 32,014,009
(a) Amounts of life insurance in this exhibit shall be shown in thousands (omit 000)
(b) See Paragraph 9 of the Annual Audited Financial Reports in the General section of the annual statement instructions
26
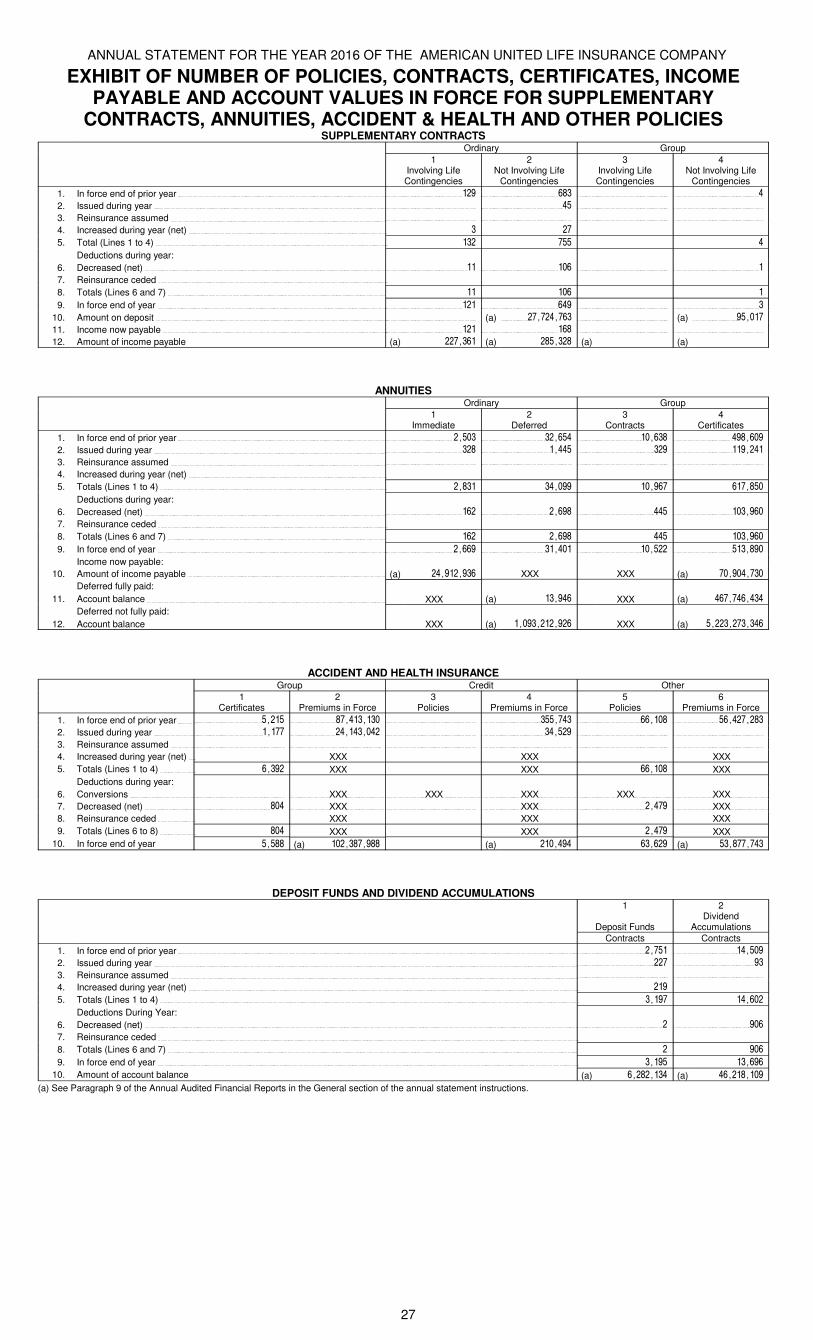
ANNUAL STATEMENT FOR THE YEAR 2016 OF THE AMERICAN UNITED LIFE INSURANCE COMPANY
EXHIBIT OF NUMBER OF POLICIES, CONTRACTS, CERTIFICATES, INCOME PAYABLE AND ACCOUNT VALUES IN FORCE FOR SUPPLEMENTARY
CONTRACTS, ANNUITIES, ACCIDENT & HEALTH AND OTHER POLICIESSUPPLEMENTARY CONTRACTS
Ordinary Group
1Involving Life Contingencies
2Not Involving Life
Contingencies
3Involving Life Contingencies
4Not Involving Life
Contingencies
1. In force end of prior year 129 683 4
2. Issued during year 45
3. Reinsurance assumed
4. Increased during year (net) 3 27
5. Total (Lines 1 to 4) 132 755 4
Deductions during year:
6. Decreased (net) 11 106 1
7. Reinsurance ceded
8. Totals (Lines 6 and 7) 11 106 1
9. In force end of year 121 649 3
10. Amount on deposit (a) 27,724,763 (a) 95,017
11. Income now payable 121 168
12. Amount of income payable (a) 227,361 (a) 285,328 (a) (a)
ANNUITIESOrdinary Group
1Immediate
2Deferred
3Contracts
4Certificates
1. In force end of prior year 2,503 32,654 10,638 498,609
2. Issued during year 328 1,445 329 119,241
3. Reinsurance assumed
4. Increased during year (net)
5. Totals (Lines 1 to 4) 2,831 34,099 10,967 617,850
Deductions during year:
6. Decreased (net) 162 2,698 445 103,960
7. Reinsurance ceded
8. Totals (Lines 6 and 7) 162 2,698 445 103,960
9. In force end of year 2,669 31,401 10,522 513,890
Income now payable:
10. Amount of income payable (a) 24,912,936 XXX XXX (a) 70,904,730
Deferred fully paid:
11. Account balance XXX (a) 13,946 XXX (a) 467,746,434
Deferred not fully paid:
12. Account balance XXX (a) 1,093,212,926 XXX (a) 5,223,273,346
ACCIDENT AND HEALTH INSURANCEGroup Credit Other
1Certificates
2Premiums in Force
3Policies
4Premiums in Force
5Policies
6Premiums in Force
1. In force end of prior year 5,215 87,413,130 355,743 66,108 56,427,283
2. Issued during year 1,177 24,143,042 34,529
3. Reinsurance assumed
4. Increased during year (net) XXX XXX XXX
5. Totals (Lines 1 to 4) 6,392 XXX XXX 66,108 XXX
Deductions during year:
6. Conversions XXX XXX XXX XXX XXX
7. Decreased (net) 804 XXX XXX 2,479 XXX
8. Reinsurance ceded XXX XXX XXX
9. Totals (Lines 6 to 8) 804 XXX XXX 2,479 XXX
10. In force end of year 5,588 (a) 102,387,988 (a) 210,494 63,629 (a) 53,877,743
DEPOSIT FUNDS AND DIVIDEND ACCUMULATIONS1
Deposit Funds
2Dividend
AccumulationsContracts Contracts
1. In force end of prior year 2,751 14,509
2. Issued during year 227 93
3. Reinsurance assumed
4. Increased during year (net) 219
5. Totals (Lines 1 to 4) 3,197 14,602
Deductions During Year:
6. Decreased (net) 2 906
7. Reinsurance ceded
8. Totals (Lines 6 and 7) 2 906
9. In force end of year 3,195 13,696
10. Amount of account balance (a) 6,282,134 (a) 46,218,109
(a) See Paragraph 9 of the Annual Audited Financial Reports in the General section of the annual statement instructions.
27
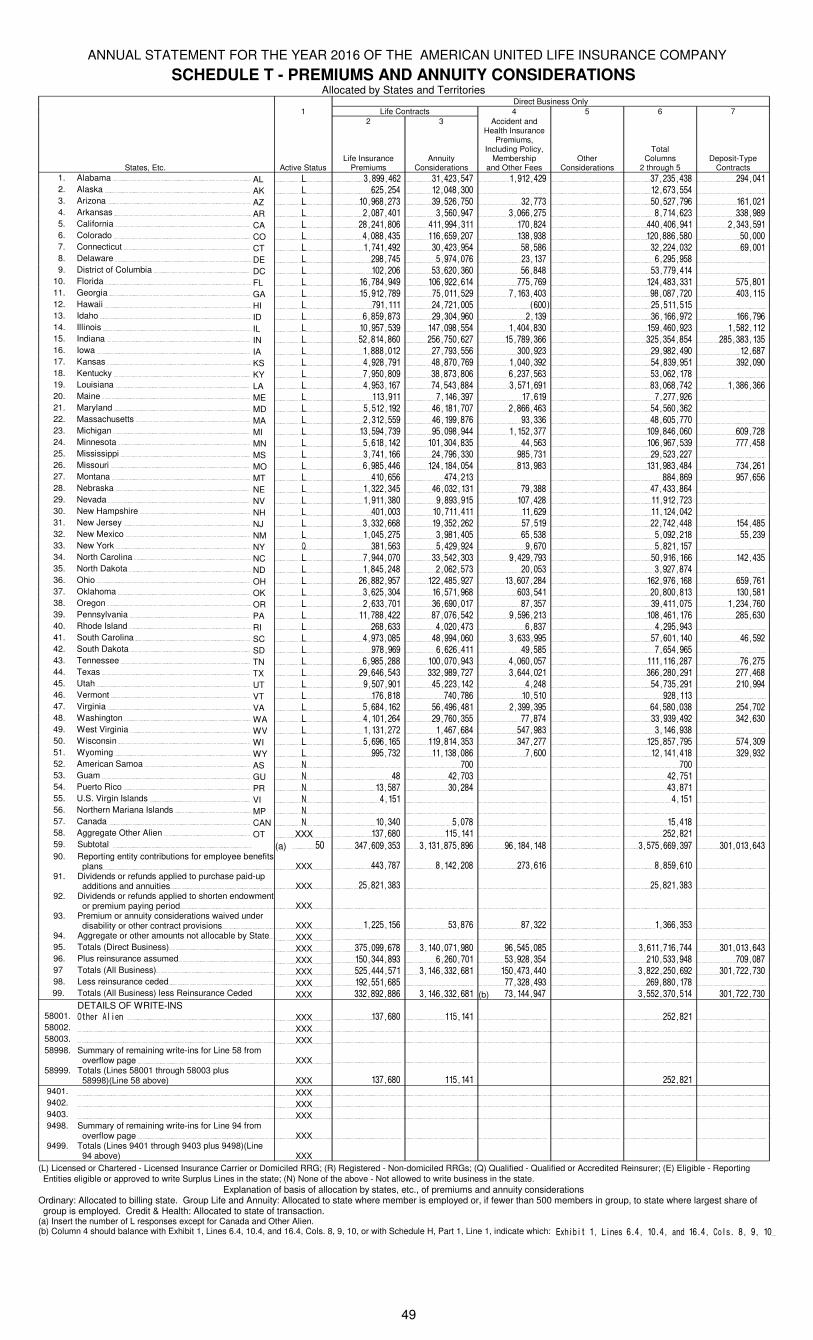
ANNUAL STATEMENT FOR THE YEAR 2016 OF THE AMERICAN UNITED LIFE INSURANCE COMPANY
SCHEDULE T - PREMIUMS AND ANNUITY CONSIDERATIONSAllocated by States and Territories
Direct Business Only
1 Life Contracts 4 5 6 7
States, Etc. Active Status
2
Life InsurancePremiums
3
AnnuityConsiderations
Accident and Health Insurance
Premiums, Including Policy,
Membershipand Other Fees
OtherConsiderations
TotalColumns
2 through 5Deposit-Type
Contracts
1. Alabama AL L 3,899,462 31,423,547 1,912,429 37,235,438 294,041 2. Alaska AK L 625,254 12,048,300 12,673,554 3. Arizona AZ L 10,968,273 39,526,750 32,773 50,527,796 161,021 4. Arkansas AR L 2,087,401 3,560,947 3,066,275 8,714,623 338,989 5. California CA L 28,241,806 411,994,311 170,824 440,406,941 2,343,591 6. Colorado CO L 4,088,435 116,659,207 138,938 120,886,580 50,000 7. Connecticut CT L 1,741,492 30,423,954 58,586 32,224,032 69,001 8. Delaware DE L 298,745 5,974,076 23,137 6,295,958 9. District of Columbia DC L 102,206 53,620,360 56,848 53,779,414
10. Florida FL L 16,784,949 106,922,614 775,769 124,483,331 575,801 11. Georgia GA L 15,912,789 75,011,529 7,163,403 98,087,720 403,115 12. Hawaii HI L 791,111 24,721,005 (600) 25,511,515 13. Idaho ID L 6,859,873 29,304,960 2,139 36,166,972 166,796 14. Illinois IL L 10,957,539 147,098,554 1,404,830 159,460,923 1,582,112 15. Indiana IN L 52,814,860 256,750,627 15,789,366 325,354,854 285,383,135 16. Iowa IA L 1,888,012 27,793,556 300,923 29,982,490 12,687 17. Kansas KS L 4,928,791 48,870,769 1,040,392 54,839,951 392,090 18. Kentucky KY L 7,950,809 38,873,806 6,237,563 53,062,178 19. Louisiana LA L 4,953,167 74,543,884 3,571,691 83,068,742 1,386,366 20. Maine ME L 113,911 7,146,397 17,619 7,277,926 21. Maryland MD L 5,512,192 46,181,707 2,866,463 54,560,362 22. Massachusetts MA L 2,312,559 46,199,876 93,336 48,605,770 23. Michigan MI L 13,594,739 95,098,944 1,152,377 109,846,060 609,728 24. Minnesota MN L 5,618,142 101,304,835 44,563 106,967,539 777,458 25. Mississippi MS L 3,741,166 24,796,330 985,731 29,523,227 26. Missouri MO L 6,985,446 124,184,054 813,983 131,983,484 734,261 27. Montana MT L 410,656 474,213 884,869 957,656 28. Nebraska NE L 1,322,345 46,032,131 79,388 47,433,864 29. Nevada NV L 1,911,380 9,893,915 107,428 11,912,723 30. New Hampshire NH L 401,003 10,711,411 11,629 11,124,042 31. New Jersey NJ L 3,332,668 19,352,262 57,519 22,742,448 154,485 32. New Mexico NM L 1,045,275 3,981,405 65,538 5,092,218 55,239 33. New York NY Q 381,563 5,429,924 9,670 5,821,157 34. North Carolina NC L 7,944,070 33,542,303 9,429,793 50,916,166 142,435 35. North Dakota ND L 1,845,248 2,062,573 20,053 3,927,874 36. Ohio OH L 26,882,957 122,485,927 13,607,284 162,976,168 659,761 37. Oklahoma OK L 3,625,304 16,571,968 603,541 20,800,813 130,581 38. Oregon OR L 2,633,701 36,690,017 87,357 39,411,075 1,234,760 39. Pennsylvania PA L 11,788,422 87,076,542 9,596,213 108,461,176 285,630 40. Rhode Island RI L 268,633 4,020,473 6,837 4,295,943 41. South Carolina SC L 4,973,085 48,994,060 3,633,995 57,601,140 46,592 42. South Dakota SD L 978,969 6,626,411 49,585 7,654,965 43. Tennessee TN L 6,985,288 100,070,943 4,060,057 111,116,287 76,275 44. Texas TX L 29,646,543 332,989,727 3,644,021 366,280,291 277,468 45. Utah UT L 9,507,901 45,223,142 4,248 54,735,291 210,994 46. Vermont VT L 176,818 740,786 10,510 928,113 47. Virginia VA L 5,684,162 56,496,481 2,399,395 64,580,038 254,702 48. Washington WA L 4,101,264 29,760,355 77,874 33,939,492 342,630 49. West Virginia WV L 1,131,272 1,467,684 547,983 3,146,938 50. Wisconsin WI L 5,696,165 119,814,353 347,277 125,857,795 574,309 51. Wyoming WY L 995,732 11,138,086 7,600 12,141,418 329,932 52. American Samoa AS N 700 700 53. Guam GU N 48 42,703 42,751 54. Puerto Rico PR N 13,587 30,284 43,871 55. U.S. Virgin Islands VI N 4,151 4,151 56. Northern Mariana Islands MP N 57. Canada CAN N 10,340 5,078 15,418 58. Aggregate Other Alien OT XXX 137,680 115,141 252,821 59. Subtotal (a) 50 347,609,353 3,131,875,896 96,184,148 3,575,669,397 301,013,643 90. Reporting entity contributions for employee benefits
plans XXX 443,787 8,142,208 273,616 8,859,610 91. Dividends or refunds applied to purchase paid-up
additions and annuities XXX 25,821,383 25,821,383 92. Dividends or refunds applied to shorten endowment
or premium paying period XXX 93. Premium or annuity considerations waived under
disability or other contract provisions XXX 1,225,156 53,876 87,322 1,366,353 94. Aggregate or other amounts not allocable by State XXX 95. Totals (Direct Business) XXX 375,099,678 3,140,071,980 96,545,085 3,611,716,744 301,013,643 96. Plus reinsurance assumed XXX 150,344,893 6,260,701 53,928,354 210,533,948 709,087 97 Totals (All Business) XXX 525,444,571 3,146,332,681 150,473,440 3,822,250,692 301,722,730 98. Less reinsurance ceded XXX 192,551,685 77,328,493 269,880,178 99. Totals (All Business) less Reinsurance Ceded XXX 332,892,886 3,146,332,681 (b) 73,144,947 3,552,370,514 301,722,730
DETAILS OF WRITE-INS58001. Other Alien XXX 137,680 115,141 252,821 58002. XXX58003. XXX58998. Summary of remaining write-ins for Line 58 from
overflow page XXX 58999. Totals (Lines 58001 through 58003 plus
58998)(Line 58 above) XXX 137,680 115,141 252,821
9401. XXX9402. XXX9403. XXX9498. Summary of remaining write-ins for Line 94 from
overflow page XXX 9499. Totals (Lines 9401 through 9403 plus 9498)(Line
94 above) XXX
(L) Licensed or Chartered - Licensed Insurance Carrier or Domiciled RRG; (R) Registered - Non-domiciled RRGs; (Q) Qualified - Qualified or Accredited Reinsurer; (E) Eligible - Reporting
Entities eligible or approved to write Surplus Lines in the state; (N) None of the above - Not allowed to write business in the state.
Explanation of basis of allocation by states, etc., of premiums and annuity considerationsOrdinary: Allocated to billing state. Group Life and Annuity: Allocated to state where member is employed or, if fewer than 500 members in group, to state where largest share of group is employed. Credit & Health: Allocated to state of transaction.
(a) Insert the number of L responses except for Canada and Other Alien.(b) Column 4 should balance with Exhibit 1, Lines 6.4, 10.4, and 16.4, Cols. 8, 9, 10, or with Schedule H, Part 1, Line 1, indicate which: Exhibit 1, Lines 6.4, 10.4, and 16.4, Cols. 8, 9, 10
49
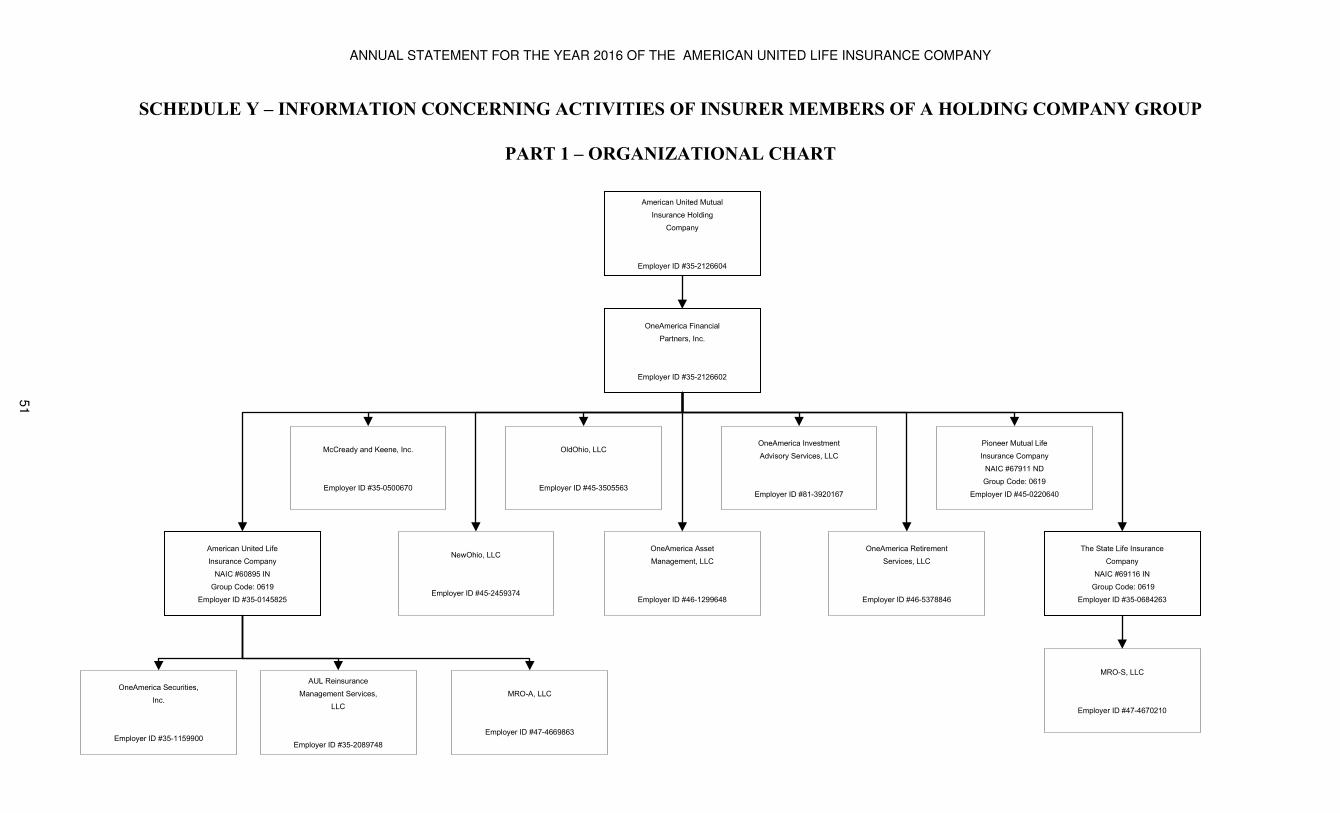
ANNUAL STATEMENT FOR THE YEAR 2016 OF THE AMERICAN UNITED LIFE INSURANCE COMPANY
51
American United Mutual
Insurance Holding
Company
Employer ID #35-2126604
OneAmerica Financial
Partners, Inc.
Employer ID #35-2126602
American United Life
Insurance Company
NAIC #60895 IN
Group Code: 0619
Employer ID #35-0145825
AUL Reinsurance
Management Services,
LLC
Employer ID #35-2089748
MRO-A, LLC
Employer ID #47-4669863
OneAmerica Securities,
Inc.
Employer ID #35-1159900
McCready and Keene, Inc.
Employer ID #35-0500670
NewOhio, LLC
Employer ID #45-2459374
OldOhio, LLC
Employer ID #45-3505563
OneAmerica Asset
Management, LLC
Employer ID #46-1299648
OneAmerica Investment
Advisory Services, LLC
Employer ID #81-3920167
OneAmerica Retirement
Services, LLC
Employer ID #46-5378846
Pioneer Mutual Life
Insurance Company
NAIC #67911 ND
Group Code: 0619
Employer ID #45-0220640
The State Life Insurance
Company
NAIC #69116 IN
Group Code: 0619
Employer ID #35-0684263
MRO-S, LLC
Employer ID #47-4670210
SCHEDULE Y – INFORMATION CONCERNING ACTIVITIES OF INSURER MEMBERS OF A HOLDING COMPANY GROUP
PART 1 – ORGANIZATIONAL CHART
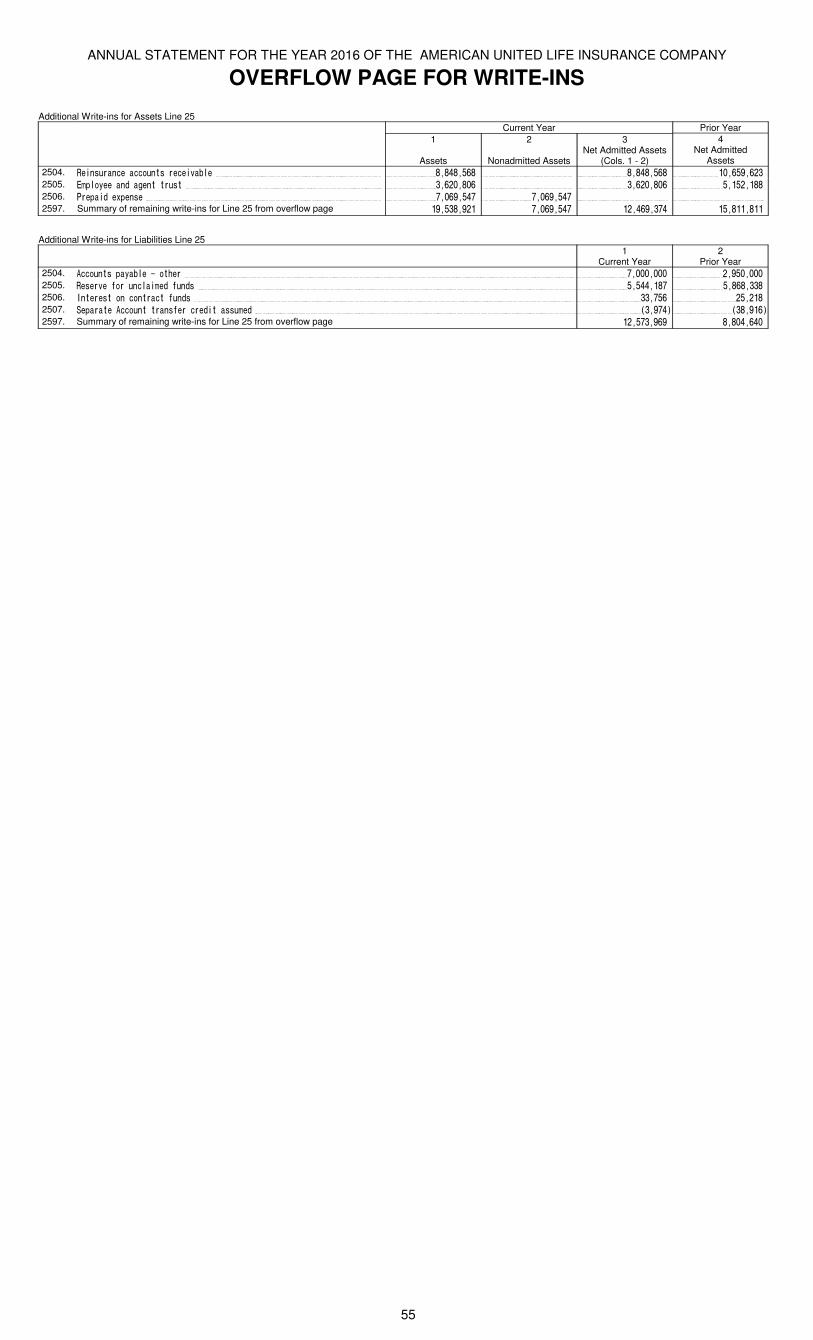
ANNUAL STATEMENT FOR THE YEAR 2016 OF THE AMERICAN UNITED LIFE INSURANCE COMPANY
OVERFLOW PAGE FOR WRITE-INS
Additional Write-ins for Assets Line 25Current Year Prior Year
1
Assets
2
Nonadmitted Assets
3Net Admitted Assets
(Cols. 1 - 2)
4Net Admitted
Assets
2504. Reinsurance accounts receivable 8,848,568 8,848,568 10,659,623 2505. Employee and agent trust 3,620,806 3,620,806 5,152,188 2506. Prepaid expense 7,069,547 7,069,547 2597. Summary of remaining write-ins for Line 25 from overflow page 19,538,921 7,069,547 12,469,374 15,811,811
Additional Write-ins for Liabilities Line 251
Current Year2
Prior Year2504. Accounts payable - other 7,000,000 2,950,000 2505. Reserve for unclaimed funds 5,544,187 5,868,338 2506. Interest on contract funds 33,756 25,218 2507. Separate Account transfer credit assumed (3,974) (38,916)2597. Summary of remaining write-ins for Line 25 from overflow page 12,573,969 8,804,640
55
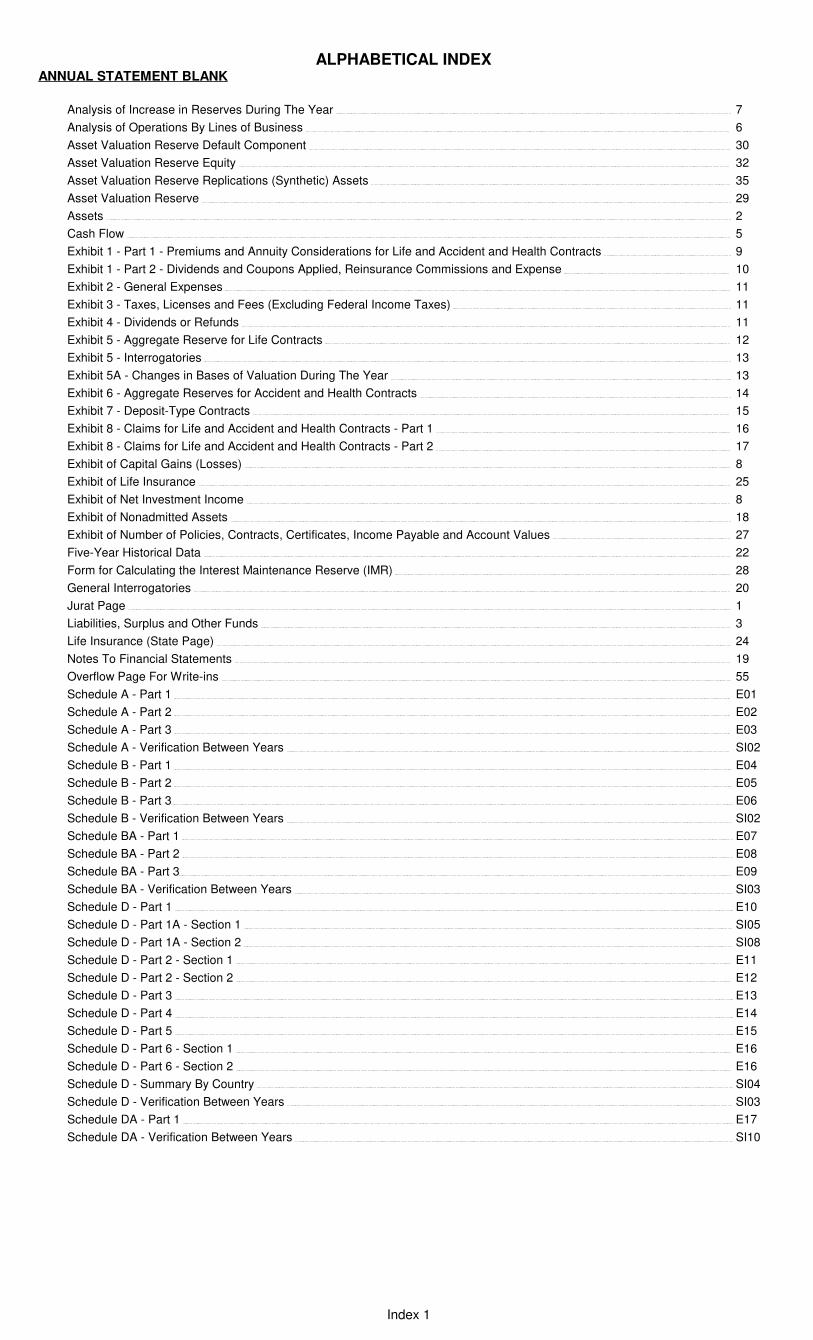
ALPHABETICAL INDEXANNUAL STATEMENT BLANK
Analysis of Increase in Reserves During The Year 7
Analysis of Operations By Lines of Business 6
Asset Valuation Reserve Default Component 30
Asset Valuation Reserve Equity 32
Asset Valuation Reserve Replications (Synthetic) Assets 35
Asset Valuation Reserve 29
Assets 2
Cash Flow 5
Exhibit 1 - Part 1 - Premiums and Annuity Considerations for Life and Accident and Health Contracts 9
Exhibit 1 - Part 2 - Dividends and Coupons Applied, Reinsurance Commissions and Expense 10
Exhibit 2 - General Expenses 11
Exhibit 3 - Taxes, Licenses and Fees (Excluding Federal Income Taxes) 11
Exhibit 4 - Dividends or Refunds 11
Exhibit 5 - Aggregate Reserve for Life Contracts 12
Exhibit 5 - Interrogatories 13
Exhibit 5A - Changes in Bases of Valuation During The Year 13
Exhibit 6 - Aggregate Reserves for Accident and Health Contracts 14
Exhibit 7 - Deposit-Type Contracts 15
Exhibit 8 - Claims for Life and Accident and Health Contracts - Part 1 16
Exhibit 8 - Claims for Life and Accident and Health Contracts - Part 2 17
Exhibit of Capital Gains (Losses) 8
Exhibit of Life Insurance 25
Exhibit of Net Investment Income 8
Exhibit of Nonadmitted Assets 18
Exhibit of Number of Policies, Contracts, Certificates, Income Payable and Account Values 27
Five-Year Historical Data 22
Form for Calculating the Interest Maintenance Reserve (IMR) 28
General Interrogatories 20
Jurat Page 1
Liabilities, Surplus and Other Funds 3
Life Insurance (State Page) 24
Notes To Financial Statements 19
Overflow Page For Write-ins 55
Schedule A - Part 1 E01
Schedule A - Part 2 E02
Schedule A - Part 3 E03
Schedule A - Verification Between Years SI02
Schedule B - Part 1 E04
Schedule B - Part 2 E05
Schedule B - Part 3 E06
Schedule B - Verification Between Years SI02
Schedule BA - Part 1 E07
Schedule BA - Part 2 E08
Schedule BA - Part 3 E09
Schedule BA - Verification Between Years SI03
Schedule D - Part 1 E10
Schedule D - Part 1A - Section 1 SI05
Schedule D - Part 1A - Section 2 SI08
Schedule D - Part 2 - Section 1 E11
Schedule D - Part 2 - Section 2 E12
Schedule D - Part 3 E13
Schedule D - Part 4 E14
Schedule D - Part 5 E15
Schedule D - Part 6 - Section 1 E16
Schedule D - Part 6 - Section 2 E16
Schedule D - Summary By Country SI04
Schedule D - Verification Between Years SI03
Schedule DA - Part 1 E17
Schedule DA - Verification Between Years SI10
Index 1
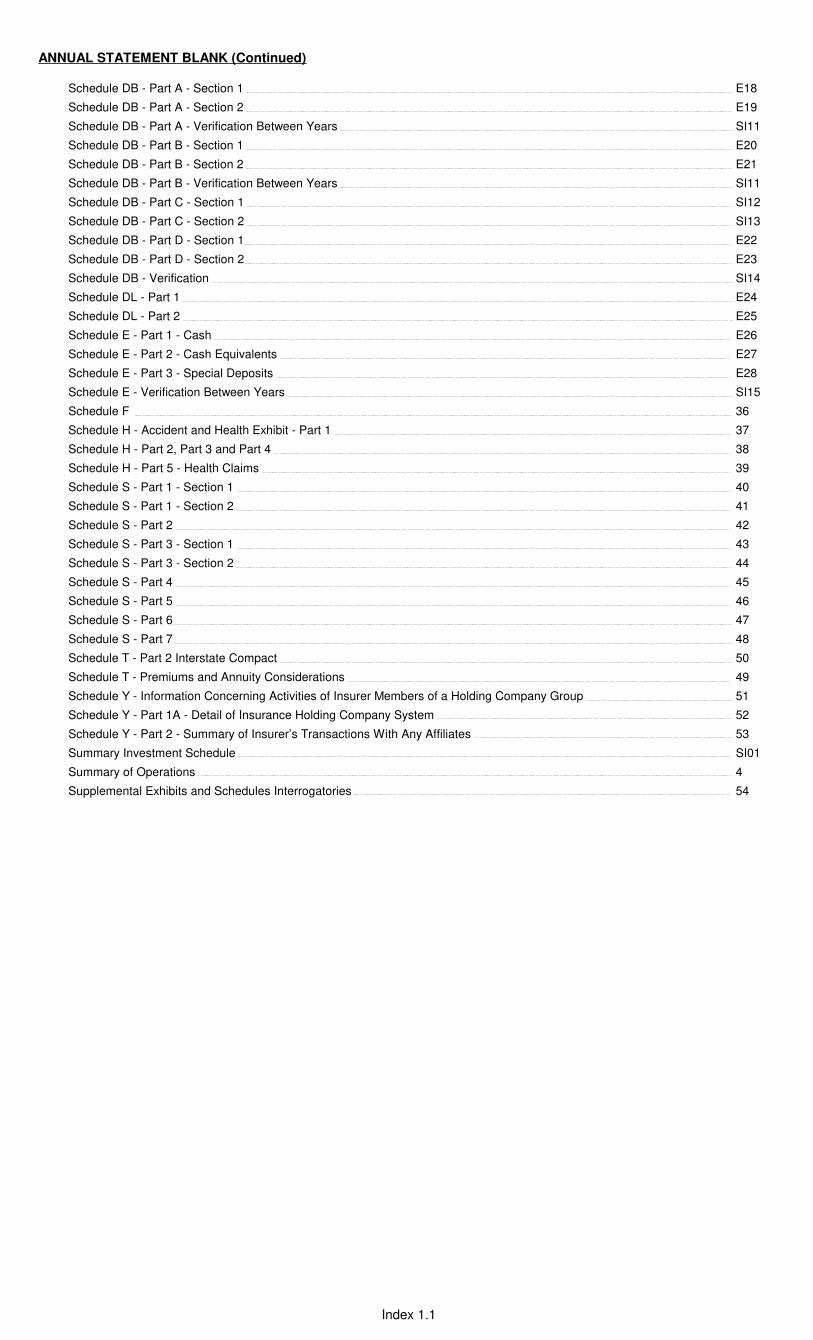
ANNUAL STATEMENT BLANK (Continued)
Schedule DB - Part A - Section 1 E18
Schedule DB - Part A - Section 2 E19
Schedule DB - Part A - Verification Between Years SI11
Schedule DB - Part B - Section 1 E20
Schedule DB - Part B - Section 2 E21
Schedule DB - Part B - Verification Between Years SI11
Schedule DB - Part C - Section 1 SI12
Schedule DB - Part C - Section 2 SI13
Schedule DB - Part D - Section 1 E22
Schedule DB - Part D - Section 2 E23
Schedule DB - Verification SI14
Schedule DL - Part 1 E24
Schedule DL - Part 2 E25
Schedule E - Part 1 - Cash E26
Schedule E - Part 2 - Cash Equivalents E27
Schedule E - Part 3 - Special Deposits E28
Schedule E - Verification Between Years SI15
Schedule F 36
Schedule H - Accident and Health Exhibit - Part 1 37
Schedule H - Part 2, Part 3 and Part 4 38
Schedule H - Part 5 - Health Claims 39
Schedule S - Part 1 - Section 1 40
Schedule S - Part 1 - Section 2 41
Schedule S - Part 2 42
Schedule S - Part 3 - Section 1 43
Schedule S - Part 3 - Section 2 44
Schedule S - Part 4 45
Schedule S - Part 5 46
Schedule S - Part 6 47
Schedule S - Part 7 48
Schedule T - Part 2 Interstate Compact 50
Schedule T - Premiums and Annuity Considerations 49
Schedule Y - Information Concerning Activities of Insurer Members of a Holding Company Group 51
Schedule Y - Part 1A - Detail of Insurance Holding Company System 52
Schedule Y - Part 2 - Summary of Insurer’s Transactions With Any Affiliates 53
Summary Investment Schedule SI01
Summary of Operations 4
Supplemental Exhibits and Schedules Interrogatories 54
Index 1.1


![2016 Annual Report - Alberta Automobile Insurance Rate Board · AUTOMOBILE INSURANCE RATE BOARD 201 Annual Report pg i [Original signed by Allan Cleiren] LETTER OF TRANSMITTAL AND](https://img.pdfslide.us/doc/110x75/5b7e93cb7f8b9abe0e8de080/2016-annual-report-alberta-automobile-insurance-rate-automobile-insurance.jpg)