Embed Size (px)
Citation preview

FROM :UI DEPT. OF JUSTICE
JRN 30 '97 04: 47PM OOP RISKSTATE OF WISCONSINDEPARTMENT OF ADMINISTRATIONTOMMY G. THOMMOPGOVERNORMAIKD.BUCHEKSECHETAHY
608 267 2223 1997,01-30 16:02 8015 P . 02/02
Mailing Address:Post Office Box 7844Madison, Wl 53707-78*4
January 30, 1997
Matthew MankowskiRemedial Project ManagerOffice of SupcrfundMichigan/Wisconsin Remedial Response BranchU.S. Environmental Protection Agency, Region V77 West Jackson BoulevardChicago, Illinois 60604
RE: Tomah Armory LandfillTransmittal of the Phase n Remedial Investigation Report
Dear Matt:
Attached is the Phase II Remedial Investigation Report for the Tomah Armory Landfill site. This Phase nRemedial Investigation (RI) Report has been prepared in accordance with the "Statement of Work (SOW)for Continuing Remedial Investigation Activities and Conducting a Feasibility Study (FS) at the TomahArmory Landfill Site, Monroe County, Wisconsin" approved by the U.S. EPA in July 1995. The Phase IIRI Report incorporates the agreed upon voluntary actions as described in the Wisconsin Department ofJustice letter to Matthew J. Mankowski (U.S. EPA) and Wcndy Anderson (WDNR) dated August 1,1996.This letter is attached for your reference and incorporated into the Phase n RI Report in Section 7.
The Phase II RI Report has been revised as described in the January 10, 1997 State of Wisconsin DraftResponse to EPA and WDNR Comments on the May 1996 Draft Phase II RI Report. This Phase II RIReport is being submitted for delivery to the U.S. EPA by January 31,1997 as required in the U.S. EPAletter to Charles R. Larsen dated January 6,1997.
If you have any questions concerning this Phase II RI Report, please contact Lynn Laszewski at (608) 261-6634. Thank you for your continued assistance with this matter.
Sincerely,
Lynry^aszewskiEnvironmental Compliance Manager
cc: Gary Edebtein, WDNRDoug Joseph, WDNRKathy Niesen, Gcraghty and Miller, Inc.
Assistant Attorney General

STATE OF WISCC .SINDEPARTMENT OF JUSTICE
JAMES E. DOYLEATTORNEY GENERAL
Burneatta L. BridgeDeputy Attorney General
August 1, 1996
123 West Washington AvenueP.O. Box 7857Madison, Wl 53707-7857
Charles R. LarsenAssistant Attorney General608/266-1765FAX 608/267-2223TTY 608/267-8902
f-r.f
.-'VY i': iVCiLLLTrl. i.MC.
Mr. Matthew J. MankowskiRemedial Project ManagerUnited States EPA, Region 577 West Jackson BoulevardChicago, IL 60604-3590
Ms. Wendy AndersonEnvironmental EngineerWisconsin Department of Natural ResourcesWestern District Headquarters1300 West Clairemont AvenuePost Office Box 4001Eau Claire, WI 64702-4001
Re: Tomah Armory LandfillMonroe County, Tomah, Wisconsin
Dear Matt and Wendy:
Following receipt of Matt's letter of July 15, 1996, withwhich was enclosed U.S. EPA and WDNR comments on Wisconsin's DraftPhase II RI Report, we have participated in several telephone callson July 24, 29 and 30. During our conversation on July 30, Ibelieve that we reached agreement with respect to what the State ofWisconsin is in a position, and proposes, to do in order to bringthis matter to a conclusion. I write now for the purpose ofmemorializing what I believe our understanding to be.
At the outset, it is apparent that the State cannot meet thetwo week deadline requested in paragraph 1 of the general comments.We have therefore requested an extension of time, which Iunderstand does not present a problem for either U.S. EPA or WDNR.Aside from the problems which the State faces in addressingparagraph 2 of the general comments (which I address in detailhereinafter) , it had been our initial thought that we wouldn't needmore that a couple of additional weeks. Now, however, in order toavoid the necessity of re-doing the Draft RI more than once, it ismy understanding that the State will undertake the changessuggested in all of the paragraphs under the headings of generaland specific comments, except paragraph 2 of the general comments,and will keep you advised of our progress, but will not attempt toincorporate any changes into the Draft RI until we are in aposition to prepare the final draft.

Mr. Matthew J. Mankowski and Ms. Wendy AndersonAugust 1, 1996Page 2
With respect to paragraph 2 of the general comments, it is theState's proposal to voluntarily undertake measures which willassure compliance with State Applicable or Relevant and AppropriateRequirements (ARARs). In addressing the specific requirements, Irefer to the Draft Phase II RI, Figure 4-3.
First, with respect to the property owned by the State ofWisconsin, identified on Figure 4-3 as the Wisconsin ArmoryNational Guard property, the State proposes to place restrictionson the title, commonly referred to as deed restrictions, which willassure that the part of the property which includes the oldlandfill will not be excavated at any time in the future withoutcompliance with WDNR regulations.
Second, with respect to the property owned by the City ofTomah, identified on Figure 4-3 as parcel 2, and colored green, theState proposes to attempt to obtain the city's agreement to placedeed restrictions on that part of the property where the oldlandfill exists, which will assure that the property will not beexcavated at any time in the future without compliance with WDNRregulations.
Third, with respect to the property owned by David Filkins,identified on Figure 4-3 as parcel 3, and colored green, the Stateproposes to attempt to obtain permission from the owner to eitherremove and dispose of material which is shown to be a part of theold landfill pursuant to Draft Phase II RI, sec. 7.4, page 7-3, orprovide for a barrier pursuant to Draft Phase II RI, sec. 7.3, page7-2, together with the imposition of deed restrictions which will,assure that the part of the property which includes the oldlandfill will not be excavated in the future without compliancewith WDNR regulations. It is expected that the more likely actionwill be removal and disposal.
Fourth, with respect to the property owned by the Harris AlienTelecommunication Museum, identified on Figure 4-3 as parcel 1, andcolored green, the State proposes to attempt to obtain permissionfrom the owner to either remove and dispose of material which isshown to be a part of the old landfill pursuant to Draft Phase IIRI, sec. 7.4, page 7-3, or provide for a barrier pursuant to DraftPhase II RI, sec. 7.3, page 7-2, together with the imposition ofdeed restrictions which will assure that the part of the propertywhich includes the old landfill will not be excavated in the futurewithout compliance with WDNR regulations. It is expected that themore likely action will be the providing of a barrier together withdeed restrictions.
It is our understanding that the foregoing would be consideredby U.S. EPA and WDNR to be fully satisfactory, timely and

Mr. Matthew J. Mankowski and Ms. Wendy AndersonAugust 1, 1996Page 3
appropriate action on the part of the State, and that if the Stateis able to obtain the necessary permission from the landownersinvolved, and does in fact take the action suggested, a "no furtheraction" proposed plan and record of decision could be written, andan FS would be unnecessary. In the meantime, the State will not beconsidered to be out of compliance with any of the terms of theAdministrative Order on Consent and Statement of Work as a resultof its pursuit of the efforts described in this letter.
I would very much appreciate it if you would both let me knowif the foregoing meets with your approval.
Very
Assistant Attorney General
CRL
C : Ms. Lynn LaszewskiEnvironmental Compliance ManagerWisconsin Department of Administration
Ms. Kathleen Niesen, P.E.Geraghty & Miller, Inc.
Mr. Jonathon E. JacobsonWisconsin Department of Military Affairs

PHASE IIREMEDIAL INVESTIGATION REPORT
TOMAH ARMORY LANDFILL SITETOMAH, WISCONSIN
VOLUME I OF H
January 1997
Prepared for
State of WisconsinDepartment of Administration
101 East Wilson StreetMadison, Wisconsin 53707
Prepared by
Geraghty & Miller, Inc.126 North Jefferson Street
Milwaukee, Wisconsin 53202(414) 276-7742

PHASE IIREMEDIAL INVESTIGATION REPORT
TOMAH ARMORY LANDFILL SITETOMAH, WISCONSIN
January 31,1997
Prepared by GERAGHTY & MILLER, INC
TedPowell,P.G.Staff Sdentist/Hydrogeologist
JeenNiesen,P.EPrincipal Engineer/Regional Manager, Wisconsin
GERAGHTY & MILLER, INC.

VOLUME I
CONTENTSPage
1. INTRODUCTION.......................................,^
l.lGOALOFTHEPHASEnRI,.....,..,..,..,,,,,.,,,,.,.,,,,,.,,.,,.,,.,.,,,..,, 1-11.2 ORGANIZATION OF THE PHASE ERI,,,,. ...................................................... 1-3
2. TOMAH ARMORY LANDFILL SITE BACKGROUND ..................................................... 2-1
2.1 LOCATION AND DESCRIPTION.,,,,,,,, ........................................................ .2-12.2 HISTORY.......,,.,,......,..,...,,...,.,,.. .......................................................... .........2-2
2.2.1 Summary of Previous TALS Investigations..,,,,,,.,...,,.,,,,,,.,,,,.. 2-42.2.2 Summary of Preexisting She Chemical Data .............................................. 2-62.2.3 Summary of Existing She Physical Data.... ................................................. 2-7
2.4 GEOLOGY..,.,,...........,...,.,.,,.,,,..,,,,,,,,,,,,.,,,,,,.,,,,...,,,.,,.. .,,.2-82.5 HYDROGEOLOGY ............................................... .................................................. 2-82.6 CLIMATE ................................................................................................................. 2-92.7 DOMESTIC, MUNICIPAL, AND INDUSTRIAL WATER SUPPLY
WELLS SURVEY....,,,..,,,,,,.,,,,,,,,,,,,,,,,,.,,,,,,,,,.,.,,,,,, 2-9
3.1 DETERMINATION OF LANDFILL EXTENT ...................................................... 3-2
3.1.1 Geophysical Background Information,.,,, ,,,„,„,„,„,,,,,,.,,,,,„ 3-33.1.2 Geophysical Investigation.,,,,,,,,,,,,,,,,,,,,,,,,,,,,,,,,,,,,, 3-3
3.1.2.1 Terrain Conductivity Survey,,, ,„,„,,,,, ................ ,,„.,,„ 3-43. 1.2.2 Magnetic Survey,,,,,,,,,,,,,,,,,,,,,,,,,,,,,,,,,,,,. 3-5
3. 1.3 Test Pits,,,,,,,,,,,,,,,,,,,,,,,,,,, ................................................ 3-6
3.2 SURFACE SOIL SAMPLING.,.,,,,,,,,,,,,,,,,,,,,,,,,,,,,,,,,,,,,,,, 3-7
3.2.1 Background Surface Soil Sample Collection,,, ............ ,,„,„,,,,,„, 3-73.2.2 Landfill Cover Surface Soil Sample Collection..... ...................................... 3-83.2.3 Geotechnical Sampling,,,,.,,,,,,,,, „„,„„„,„„„„„„„„ 3-8
GERAGHTY & MILLER. INC.
CONTENTS (continued)
3.3 SOIL BORING AND SAMPLE COLLECTION..................................................... 3-93.4 MONITORING WELL INSTALLATION......................................................... 3-103.5 MONITORING WELL DEVELOPMENT........................................................... 3-113.6 STAFF GAUGE INSTALLATION........................................................................ 3-113.7 WATER-LEVEL MEASUREMENTS................................................................... 3-123.8 LOCATION AND ELEVATION SURVEY.......................................................... 3-123.9 GROUNDWATER SAMPLING............................................................................ 3-133.10 DATA VALIDATION.......................................................................................... 3-14
4. RESULTS OF THE PHASE nRI.......................................................................................... 4-1
4.1 RESULTS OF PHYSICAL TESTING..................................................................... 4-1
4.1.1 Geotechnical Results.................................................................................. 4-14.1.2 Geophysical Investigation........................................................................... 4-24.1.3 Test Pit Completion....................................................................................4-4
4.2 RESULTS OF CHEMICAL TESTING.................................................................... 4-4
4.2.1 Soil Sample Analytical Results................................................................... 4-44.2.2 Groundwater Sample Analytical Results.................................................... 4-7
4.3 HYDROGEOLOGICAL ASSESSMENT................................................................ 4-8
4.3.1 Geology...................................................................................................... 4-84.3.2 Hydrogeology............................................................................................. 4-9
4.4 INTERPRETATION OF RI RESULTS................................................................. 4-10
4.4.1 Extent of Fill............................................................................................. 4-104.4.2 Geology and Hydrogeology.....................................................................4-104.4.3 Soil Quality............................................................................................... 4-114.4.4 Groundwater Quality................................................................................ 4-124.4.5 Landfill Gas.............................................................................................. 4-12
5. SCREENING RISK ASSESSMENT...................................................................................... 5-1
5.1DATAEVALUATION.............................................................................................5-2
GERAGHTY & MILLER. INC.

IllCONTENTS (continued)
Page
5.1.1 Constituents of Potential Concern.......... .................................................... 5-25. 1.2 Exposure Point Concentrations .................................................................. 5-3
5.1.2.1 Surface Soil...............................................................................5.1.2.2 Subsurface Soil ........................................................................... 5-5
5.2 TOXICITY ASSESSMENT ..................................................................................... 5-5
5.2.1 Noncartinogenic Effects........................... .................................................. 5-55.2.2 Carcinogenic Effects.. ................................................................................. 5-65.2.3 Adult Lead Cleanup Model ....................................................................... .5-8
5.3 EXPOSURE ASSESSMENT ................................................................................... 5-8
5.3.1 Land Use .................................................................................................... 5-9
5. 3. 1.1 Property Location and Description............................................. 5-9
5.3.2 Topographical Considerations.................................................................. 5-105. 3.3 Potential Exposure Pathways and Receptors............................................ 5-105.3.4 She Conceptual Exposure Model............................................................ 5-125.3.5 Summary .................................................................................................. 5-13
5.4 RISK CHARACTERIZATION .............................................................................. 5-14
5.4.1 Results...................................................................................................... 5-14
5.4.1.1 Surface Soil.......................................................................... .....5-145.4.1.2 Subsurface Soil ......................................................................... 5-15
5.4.2 Conclusions.............................................................................................. 5-16
5.5 UNCERTAINTY AND LIMITATIONS................................................................ 5-18
5.5.1 Sampling and Analysis.............................................................................. 5-195.5.2 Exposure Assessment............... ................................................................ 5-19
6. VOLUNTARY ACTION AGREEMENT .............................................................................. 6-17. SCREENING OF APPLICABLE OR RELEVANT AND APPROPRIATE
REQUIREMENTS (ARARS)....................................... .................................................. 7-1
GERAGHTY & MILLER, INC.
IVCONTENTS (continued!
7.1 CHEMICAL - SPECIFIC ARARS........................................................................... 7-17.2 LOCATION - SPECIFIC ARARS............................................................................ 7-17.3 ACTION-SPECIFIC ARARS.................................................................................7-2
8. SCREENING OF AGREED-UPON VOLUNTARY ACTIONS...........................................8-1
8.1 ALTERNATIVE 1 -GROUNDWATER................................................................. 8-18.2 ALTERNATIVE 2 - INSTITUTIONAL - DEED RESTRICTION........................ 8-18.3 ALTERNATIVES-BARRIER-SOIL COVER..................................................... 8-18.4 ALTERNATIVE 4-REMOVAL AND DISPOSAL............................................... 8-2
9. CONCLUSIONS .................................................................................10. RECOMMENDATIONS..................................................................................................... 10-111. REFERENCES.................................................................................................................... 11-1
TABLES
2-1. Annual Temperature Data from Station No. 47-7997, Sparta, Wisconsin.
2-2. Annual Precipitation Data from Station No. 47-7997, Sparta, Wisconsin.
2-3. Domestic, Municipal, and Industrial Water Supply Wells Within a 2-mile Radius of theTomah Armory Landfill She, Tomah, Wisconsin.
3-1. Well Construction Details and Groundwater and Surface-water Elevation Data, TomahArmory Landfill Site, Tomah, Wisconsin.
4-1. Summary of Sampling and Analysts Program, Tomah Armory Landfill Site, Tomah,Wisconsin.
4-2. Summary of Geotechnical Characteristics of Landfill Cover Material, Tomah ArmoryLandfill Site, Tomah, Wisconsin.
4-3. Surface Soil Quality Data, Tomah Armory Landfill Site, Tomah, Wisconsin.
4-4. Soil Sample Total Organic Carbon (TOC) Results, Tomah Armory Landfill Site, Tomah,Wisconsin.
GERAGHTY & MILLER, INC.

TABLES (continued)
4-5. Groundwater Quality Data, November 1995, Volatile Organic Compounds and Inorganics,Tomah Armory Landfill Site, Tomah, Wisconsin.
4-6. Groundwater Quality Data, February 1996, Volatile Organic Compounds and Inorganics,Tomah Armory Landfill Site, Tomah, Wisconsin.
5-1. Occurrence Summary of Surface Soil Samples, Tomah Armory Landfill Site, Tomah,Wisconsin.
5-2. Occurrence Summary of Subsurface Soil Samples for Armory and Museum Areas, TomahArmory Landfill She, Tomah, Wisconsin.
5-3. Oral Reference Doses, Inhalation Reference Concentrations, Target Sites, and ConfidenceLevels for COPCs, Tomah Armory Landfill Site, Tomah, Wisconsin.
5-4. Oral Cancer Slope Factors, Inhalation Unit Risks, Tumor Sites, and USEPA CancerClassifications for COPCs, Tomah Armory Landfill Site, Tomah, Wisconsin.
5-5. Comparison of Surface Soil Data to Background Concentrations and Risk-BasedGuidelines, Tomah Armory Landfill She, Tomah, Wisconsin.
5-6. Comparison of Subsurface Soil Data to Background Concentrations and Risk-BasedGuidelines, Tomah Armory Landfill Site, Tomah, Wisconsin.
6-1. Chemical Specific ARARs - Soil, Tomah Armory Landfill Site, Tomah, Wisconsin.
6-2. Action Specific ARARs, Tomah Armory Landfill Site, Tomah, Wisconsin.
FIGURES
2-1. Site Location Map, Tomah Armory Landfill Site, Tomah, Wisconsin.
2-2. Site Map, Tomah Armory Landfill Site, Tomah, Wisconsin.
2-3. Phase IRI Sampling Locations, Tomah Armory Landfill Site, Tomah, Wisconsin.
2-4. Domestic, Municipal, and Industrial Wells Located Within a 2-mile Radius, TomahArmory Landfill Site, Tomah, Wisconsin.
GERAGHTY & MILLER. INC.

VI
FIGURES (continued)
3-1. Geophysical Survey and Surface Soil Sampling Grid, Toman Armory Landfill Site, Tomah,Wisconsin.
3-2. Test Pit Locations, Tomah Armory Landfill Site, Tomah, Wisconsin.
3-3. Landfill Cover and Background Surface Soil Sampling Locations, Tomah Armory LandfillSite, Tomah, Wisconsin.
3-4. Concentrations of Benzo(a)pyrene Detected in Surface Soil Samples, Tomah ArmoryLandfill Site, Tomah, Wisconsin.
3-5. Concentrations of Lead Detected in Surface Soil Samples, Tomah Armory Landfill She,Tomah, Wisconsin.
3-6. Monitoring Well and Staff Gauge Location Map, Tomah Armory Landfill Site, Tomah,Wisconsin.
4-1. EM-31 Terrain Conductivity, Tomah Armory Landfill Site, Tomah, Wisconsin.
4-2. Total Magnetic Field Intensity, Tomah Armory Landfill Site, Tomah, Wisconsin.
4-3. Extent of Filled Area in Relation to Existing Property Boundaries, Tomah Armory LandfillSite, Tomah, Wisconsin.
4-4. Volatile Organic Compounds Detected in Groundwater, November 2, 1995, TomahArmory Landfill Site, Tomah, Wisconsin.
4-5. Volatile Organic Compounds Detected in Groundwater, February 13, 1996, TomahArmory Landfill Site, Tomah, Wisconsin.
4-6. Geologic Cross Section Location Map, Tomah Armory Landfill Site, Tomah, Wisconsin.
4-7. Geological Cross Section A-A', Tomah Armory Landfill Site, Tomah, Wisconsin.
4-8. Geologic Cross Section B-B', Tomah Armory Landfill Site, Tomah, Wisconsin.
4-9. Water-Table Configuration, February 13, 1996, Tomah Armory Landfill Site, Tomah,Wisconsin.
5-1. Site Conceptual Exposure Model, Tomah Armory Landfill Site, Tomah, Wisconsin.
GERAGHTY & MILLER, INC

Vll
FIGURES (continued)
6-1. Flood Plain Boundaries and Identified Wetland, Tomah Armory Landfill Site, Tomah,Wisconsin.
VOLUME nAPPENDICES
A. Legal Description and Chain of Title.
B. Field Notes: Tornah Armory, ERD, Argonne National Lab.
C. Tomah Armory Site Inspection Report.
D. Hazardous Ranking System.
E. Well Construction Record for Public, Private, and Industrial Wells.
F. Background Surface Soil Analytical Results,
G. Landfill cover Surface Soil Analytical Results.
H. Geotechnical Sampling Results.
I. Borings Logs.
J. Monitoring Well Construction Forms.
K. Monitoring Well Development Forms.
L. Groundwater Sampling Logs.
M. Data Validation Report.
N. Groundwater Analytical Results.
O. Adult Lead Cleanup Model.
GERAGHTY & MILLER, INC.
Vlll
APPENDICES (continued)
P. Supporting Documents Lemonweir River Floodplain.
Q. Bureau of Endangered Resources and Wisconsin State Historical Society Correspondence.
GERAGHTY & MILLER, INC

PHASE IIREMEDIAL INVESTIGATION REPORT
TOMAH ARMORY LANDFILL SITETOMAH, WISCONSIN
1. INTRODUCTION
The Tomah Armory Landfill Site (TALS) was added to the Comprehensive EnvironmentalResponse, Compensation, and Liability Act (CERCLA) National Priorities List (NPL) by theUnited States Environmental Protection Agency (USEPA) in 1987. A limited Phase I Remedial
Investigation (RI) was completed at the TALs by the USEPA in December 1994 to evaluate thenature and extent of contamination and identify exposure risks. This Phase n RI has been designedand executed to identify data gaps in the Phase I RI and conduct an investigative program that willconfirm or expand existing knowledge regarding physical and chemical characteristics andenvironmental risk.
Geraghty & Miller, Inc. has prepared this Phase n RI Report for the TALS in accordancewith the "Statement of Work (SOW) for Continuing Remedial Investigation Activities and
Conducting a Feasibility Study (FS) at the Tomah Armory Landfill Site, Monroe County,
Wisconsin" (USEPA 1995a).
1.1 GOAL OF THE PHASE HRI
The goal of the Phase n RI is to obtain additional site data, including physical and chemicalcharacteristics, so that data gaps existing after completion of the Phase I RI will be eliminated.
With Wisconsin Department of Natural Resources (WDNR) and USEPA approval and
participation, this Phase n RI is being conducted in a streamlined manner to accelerate the RI/FSprocess. The objectives of the Phase n RI, as discussed in the approved Phase Di Work Plan
(Geraghty & Miller, Inc. 1995) are as follows:
GERAGHTY & MILLER, INC.
1-2
• To determine the lateral extent of the filled area.
• To determine the extent of shallow (0 to 1 feet below land surface [bis]) surfacesoil contamination.
• To delineate the vertical and horizontal extent of groundwater contaminationattributable to the TALS.
• To determine the direction of shallow groundwater flow beneath the TALS.
• To determine the horizontal and vertical hydraulic gradients at the site.
• To evaluate the need for collecting water samples from industrial, municipal, orresidential wells located in the hydraulic downgradient direction from the TALS.
• To determine background chemical characteristics of surface soils andgroundwater.
• To conduct a screening human health risk assessment (RA) based on potential
exposure to site soil and groundwater.
In addition, a preliminary Applicable or Relevant and Appropriate Requirements (ARARs)screening and a preliminary remedial alternative screening have been completed and presented
within this document so that an effective final remedy may be selected expeditiously.
GERAGHTY & MILLER, INC. O

1-3
1.2 ORGANIZATION OF THE PHASE HRI
This Phase n RI Report is organized into 10 sections and includes supporting tables,figures, and appendices. Section 1.0 consists of a brief introduction and presents the goal ofthe Phase H RI.
Section 2, Tomah Armory Landfill Site Background, provides a description of theTomah Armory property as listed on the NPL, summarizes the previous site investigations,and presents an overview of the site physical characteristics.
Section 3, Data Collection Activities, describes the procedures used to complete the
Phase H RI.
Section 4, Results of the Phase II RI, presents the results of the physical and chemicaltesting and an interpretation of those results.
Section 5, Screening Risk Assessment, presents a screening-level human health risk
assessment comprised of data evaluation, exposure assessment, toxicity assessment, and riskcharacterization.
Section 6, Screening of ARARs, identifies the chemical-specific, location-specific, andcertain action-specific ARARs that may pertain to the TALS.
Section 7, Preliminary Remedial Alternative Screening, presents a basic evaluation offour general remedial alternatives that may be applicable to the TALS.
GERAGHTY & MILLER, INC.

1-4
Section 8, Conclusions, summarizes of the physical and chemical findings of the
Phase n RI, and the conclusions of the screening RA, the ARARs analysis, and thepreliminary remedial alternatives analysis.
Section 9, Recommendations, provides preliminary recommendations for remedialaction and the development of a streamlined FS.
Section 10, References, presents the references cited and used in the RI developmentand completion.
GERAGHTY & MILLER, INC

2. TOMAH ARMORY LANDFILL SITE BACKGROUND
The TALS is located in central Monroe County in the city of Tomah (City), Wisconsin.The following sections provide a discussion of the TALS location; site boundaries; historicalownership, land uses, and known waste disposal practices; a summary of the preexisting analyticaldata related to the TALS; a summary of response actions conducted by local, state, and/or privateparties; and a description of geology, physiography, hydrogeology and climate.
2.1 LOCATION AND DESCRIPTION
The TALS, as described in USEPA's Phase IRI Report, is located in the northwest V4 ofthe southeast V* of Section 33, Township 18 North, Range 1 West, in Monroe County, Wisconsin
(Figure 2-1). The TALS covers a 10-acre rectangular area approximately 1,000-feet long by 500-feet wide in the northeastern section of the City. The TALS is bordered on the north by the Citysewage disposal facility, to the east by Mill Street and a residential area, to the south by ArthurStreet and a sand/gravel storage facility, and to the west by Woodard Avenue that separates thesite from open fields and an apartment building further to the west. Access to the TALS is not
restricted.
The legal description of the Tomah Armory property is presented below, and supporting
documentation is presented in Appendix A:
Legal DescriptionA part of the Southwest Vi of the Northeast Vi, Section 33, Township 18 North, Range 1
West, a part of Outlet 49 of the Assessor's Plat of the City of Tomah, Monroe County,Wisconsin, described as follows: Commencing at the Southeast comer of Block 4 ofRichardson's Subdivision in the said City of Tomah; thence East along the North line of
Arthur Street 66.00 feet; thence North parallel to the East line of said Block 4 ofRichardson's Subdivision 350.00 feet to the point of beginning; thence continuing Northalong same line 450.00 feet; thence East parallel to the North line of Arthur Street 523.55
GERAGHTY & MILLER, INC.

2-2
feet; thence South parallel to the East line of said Block 4 of Richardson's Subdivision550.00 feet; thence West parallel with the North line of Arthur Street 223.55 feet; thenceNorth parallel to the East fine of said Block 4 of Richardson's Subdivision 100.00 feet;thence West parallel with the said North line of Arthur Street 300.00 feet to the point ofbeginning.
This site description applies only to the Tomah Armory property, the limits of fill do notcoincide with the property boundaries of the Tomah Armory, as described above. However, theexisting Administrative Order on Consent (AOC) between the USEPA and the State indicates thatthe landfill is confined to a small area in the northwest section of the Tomah Armory property.
2.2 HISTORY
A chronological site ownership/land use summary was developed based on informationprovided in the following reports:
USEPA Field Inspection Team (FIT) Site Inspection Report dated September1984.
USEPA FIT Hazardous Ranking Score Package dated July 1985.
USEPA Phase IRI Report, Revision 2 dated December 1994.
The chronological history of the Tomah Armory property is presented below.
Prior to 1950: The property was owned by Goodyear Sawmill Company. No detailedinformation was available regarding activities at the property during this
period.
GERAGHTY & MILLER, INC.

2-3
19SO to 1955: The property was owned by the City and served as a disposal site prior tothe development of the Municipal Landfill. The City's landfill practices arereported to have included excavation of 6 to 8 feet of surface soil,landfilling disposal materials directly into the excavated areas (without aliner), replacement of the excavated surface soil to form a cover over thelandfill, and a final grading process. According to the Phase IRI Report,some of the disposal materials may have been burned prior to placement inthe landfill, but disposal records indicating this practice or the quantity ofwaste landfilled were not generated.
1955 to 1968: The City maintained ownership of the property, but landfilling activitiesapparently ceased some time between 1955 and 1960.
1968 to Present: The Wisconsin Army National Guard (ARNG) purchased the propertyfrom the City on July 11, 1968. The property is currently used to support
Wisconsin ARNG activities associated with the administration, logisticalsupport, and readiness of the unit. The following facilities are currentlylocated on the property: one main brick structure of approximately 19,000
square feet, containing an assembly hall, classrooms, offices, storagefacilities, a kitchen, and locker rooms; a metal storage shed located to thewest of the main structure; a gravel-surfaced vehicle storage area located tothe north and west of the main structure; and two large storage boxes(which house compressed gas cylinders) located to the northwest of the
main structure. Figure 2-2 presents the TALS layout. According to "Field
Notes: Tomah Armory Landfill, Installation 55340, Tomah, Wisconsin," a
study of the property conducted in 1989 by the Environmental Research
Division, Argonne National Laboratory, none of the current or past
GERAGHTY & MILLER. INC.

2-4
activities associated with operation of the Wisconsin ARNG havecontributed to the environmental conditions detected at the TALS. Thereport indicates past use of the property by the City as a landfill thatreceived waste inks and industrial solvents from a local industry(Appendix B). (Subsequent to this report the accuracy of the informationregarding disposal of inks and solvents has come into question).
2.2.1 Summary of Previous TALS Investigations
Several investigations have been conducted in recent years, to evaluate the landfill'spossible impacts to soil, sediment or groundwater at the TALS. They are summarized below.
• August 1984 - The USEPA FIT conducted a visual site inspection and then inSeptember 1984 published the Site Inspection Report presented in Appendix C.
July 1985 - Based on the findings of the FIT site inspection, the USEPA scored thesite using the Hazard Ranking System (HRS). The mean HRS score for the TALSwas 30.91. Supporting documentation for the HRS evaluation at this site ispresented in Appendix D.
July 1987 - The TALS was placed on the NPL on July 21, 1987 based on the HRSscore.
1988 - The Wisconsin Department of Public Health (WDPH) prepared aPreliminary Health Assessment for the site. The health assessment identified anumber of potential exposure pathways for soil and groundwater, includingingestion, dermal contact, and inhalation.
GERAGHTY & MILLER, INC. IJ
2-5
August 1991 - The \VDNR conducted a preliminary assessment of the TALS. Soiland groundwater samples were collected and analyzed for a variety of constituentsincluding volatile organic compounds (VOCs), semi-volatile organic compounds(SVOCs), pesticides, poiychlorinated biphenyls (PCBs), and inorganic constituents.
February 1992 - The USEPA Technical Assistance Team (TAT) collected soilsamples at the TALS from the estimated former location of hazardous substancedisposal activities. None of the samples indicated constituent concentrations abovestate or federal action levels.
July 1993 - The USEPA and WDNR conducted the Phase IRI to investigate and
characterize the extent of soil and groundwater contamination at the TALS. ThePhase I RI procedures and results were summarized in the Phase I RI Report(USEPA 1994a). The Phase I RI consisted of a geophysical survey, groundwater
sampling, and split-spoon subsurface soil sampling, Groundwater samples werecollected using a hydraulically powered Geoprobe sampler driven at variouslocations to depths ranging from 9 to 15 ft bis (the reported approximate depth ofthe water table). Soil samples were collected at boreholes located throughout theestimated area of the landfill, using a split-spoon sampler at continuous intervals tothe bottom of the borehole. Figure 2-3 illustrates the Phase I RI samplinglocations.
August 1995 - Geraghty & Miller performed a site inspection to verify physicalfeatures including the location of utilities, the location of restricted access areas, thesurface-water runoff route(s), and the nature and state of vegetative cover. Inaddition, Geraghty & Miller identified areas^hat could potentially require access
controls. The information gathered during this site inspection was utilized for thepreparation of the Phase H RI Work Plan (Geraghty & Miller, Inc. 1995).
GERAGHTY & MILLER, INC.

2-6
2.2.2 Summary of Preexisting Site Chemical Data
The Phase IRI was the most comprehensive data collection event conducted at the TALSup to that date. The physical and chemical soil and groundwater data collected during the Phase IRI (July 1993) are summarized in the Phase I RI Report (USEPA 1994a). The soil andgroundwater data collected during the Phase I RI were compared to background levels andestablished health or screening standards and risk concentrations, as available. The Phase I RIReport provides a detailed description of the comparison parameters.
During the Phase I RI 10 groundwater samples were collected at the TALS at depthsranging from 9 to 15 ft bis. The groundwater samples were collected along the site perimeter in anattempt to determine the extent of any groundwater contamination and to assess whether any areasof the landfill were leaching chemicals into groundwater. The following compounds were detectedin site groundwater samples at levels that exceeded one or more of the state or federal drinkingwater or risk-based standards: trichloroethene, chloroform, bis(2-ethylhexyl)phthalate, aluminum,arsenic, iron, lead, manganese, and nickel. No off-site groundwater samples were collected during
the Phase I RI for comparison to detected she groundwater constituents.
During the Phase I RI 14 subsurface soil samples were collected at the site from discretedepth intervals: 3 to 5 ft bis and 9 to 11 ft bis. The soil samples were collected from severalborings in and around the landfill area in an attempt to determine the nature and extent of anycontamination within that area. However, the full extent of the filled area was not delineated
during the Phase I RI. The analysis of VOCs, SVOCs, and inorganics during the Phase I RIidentified the following compounds in TALS soil samples at levels that exceeded one or more ofthe state or federal soil screening or risk-based standards: methylene chloride, arsenic, barium,beryllium, chromium, lead, manganese, nickel, and thallium. As discussed in the Phase I RI Reportthe detected concentrations of methylene chloride may be attributable to laboratory contamination
GERAGHTY & MILLER, INC. W

2-7
and, therefore, may not be representative of actual concentrations in the TALS soil. In addition,arsenic, beryllium, and thallium also were detected in the background soil samples at levels thatexceeded one or more of the state or federal soil screening or risk-based standards. The followinginformation was noted on the soil boring logs: visual staining, soil moisture, thickness and type of
waste, and outgassing as measured with a photoionization detector.
2.2.3 Summary of Existing Site Physical Data
The TALS is located in an urbanized and predominantly residential area. The WDPH
Preliminary Health Assessment estimated that there are 2,000 residents within 1A mile of the site(WDPH 1988). The majority of the City residents and a few unincorporated areas on the outskirtsof the City are serviced by the municipal water supply, while the remaining unincorporated areasrely on private drinking water wells. The following sections provide a summary of physical sitecharacteristics including physiography, geology, hydrogeology, and climate.
2.3 PHYSIOGRAPHY
The topography in the area of the TALS is predominantly flat, at an elevation ofapproximately 950-feet above mean sea level (msl). The TALS is located on alluvial and lacustrinedeposits of sand, silt, and clay in valley bottomland. The TALS lies in the Lower Wisconsin Riverbasin and the Little Lemonweir River watershed (Lower Wisconsin River Basin, Water Quality
Management Plan 1993). Nearby perennial surface bodies include the south fork of theLemonweir River located approximately 300 feet to the northeast, and Lake Tomah locatedapproximately 1 mile to the southwest. Surface-water drainage at the TALS tends to flow to the
north-northeast toward the south fork of the Lemonweir River.
GERAGHTY & MILLER, INC.

2-8
2.4 GEOLOGY
According to the Wisconsin Soil Conservation Service and well log data, soils at the TALSare characterized by recently formed sand and sandy loams on the floodplain. The soils are of theEntisol order, which tend to form in low-lying or drainage areas. Typically, this type of soil ishighly permeable with low surface runoff!
The regional geology of Monroe County consists of the following geologic formations:Late Upper Cambrian (Potsdam) Sandstone in the northern half of the county and LowerMagnesian Limestone overlying the Cambrian Sandstone in the southern half of the county. TheCambrian and Magnesian formations lie above the Pre-cambrian crystalline basement (locatedapproximately 320 ft bis) and are covered with a sequence of alluvial and lacustrine deposits ofsand, silt, and clay (the thickness of which ranges from 10 to 59 feet). Drilling log data for wells inthe vicinity of the TALS indicate that the Cambrian sandstone, which is the primary source ofdrinking water for both private and City supply, is moderately permeable, consisting of fine- tocoarse-grained sandstone with thin layers of shale present approximately 200 ft bis.
2.5 HYDROGEOLOGY
The primary aquifer for drinking water supply in the vicinity of the TALS is the previouslymentioned Cambrian Sandstone, which varies in thickness from 50 to 200 feet across the region.The regional groundwater flow in the vicinity of the City trends to the east-northeast toward thesouth fork of the Lemonweir River (Sanitary Landfill Abandonment Report 1976). The shallowgroundwater flow direction across the TALS is interpreted to be to the north-northwest.
GERAGHTY & MILLER, INC.

2-9
2.6 CLIMATE
The region in which the TALS is located is subject to a wide fluctuation in temperatures
throughout the year. Table 2-1 presents average monthly and average annual temperature datameasured at the regional weather station in Sparta, Wisconsin, approximately 15 miles to the
southwest of the City. As shown in Table 2-1, the Sparta weather station recorded an averagemonthly low temperature of-1.7 degrees Fahrenheit (°F) in January 1977, and an average monthly
high temperature of 77.3°F in July 195S. The average annual temperature (calculated fromaverage monthly temperatures) in the area of the City is 44.9 °F.
On average, the area receives 29.7 inches of precipitation each year. Table 2-2 presents
average monthly and average annual precipitation data measured at the regional weather station inSparta, Wisconsin. As shown in Table 2-2, the Sparta weather station recorded an average
monthly low precipitation of 0 inches several times from 1987 through 1993, and an average
monthly high precipitation of 12.43 inches in August 1980.
2.7 DOMESTIC, MUNICIPAL, AND INDUSTRIAL WATER SUPPLY WELLS
SURVEY
Geraghty & Miller performed a survey of all domestic, municipal, and industrial watersupply wells located within a 2-mile radius of the site. As illustrated in Table 2-3, 58 wells were
identified in this area: 41 domestic, 6 municipal, and 11 industrial wells. Figure 2-4 illustrates the
locations of the identified wells. Well construction details for the identified wells are presented in
Appendix E. No water-quality data were available for these identified wells.
GERAGHTY & MILLER, INC.

3. DATA COLLECTION ACTIVITIES
This section describes the investigative methods used during the data collection for thePhase n RI at the TALS. The data collection activities and methods were presented in the workplan prepared by Geraghty & Miller entitled "Phase n Remedial Investigation Work Plan, TomahArmory Landfill, Tomah, Wisconsin" (Geraghty & Miller, Inc. 1995) and subsequently approvedby the WDNR and the USEPA. Primary data collection activities completed during the Phase HRI included the following:
• Completion of a geophysical survey using the magnetic and terrain conductivitymethods to delineate the extent of the landfilled area.
• Completion of 16 shallow test pits to confirm the geophysical data interpretation
and thereby verify the horizontal extent of the landfilled area.
• Collection of 38 shallow (0 to 1 foot bis) surface soil samples from within theboundaries of the filled area to determine if the indicator constituents, lead andbenzo(a)pyrene, are present in the cover material at concentrations that may pose athreat to human health or the environment.
• Collection of six background shallow surface soil samples from outside the
identified filled area to compare existing background constituent concentrationswith concentrations present in the filled area cover material.
• Collection of five shallow subsurface (3 to 5 feet bis) soil samples and four surfacesoil samples for the analysis of total organic carbon (TOC).
GERAGHTY & MILLER, INC. IJ

3-2
• Installation of six groundwater monitoring wells (four water-table wells and two
piezometers) to evaluate the hydraulic flow characteristics of the upperunconsolidated aquifer.
• Installation of two staff gauges in separate surface water bodies adjacent to theTALS to evaluate the shallow groundwater/surface-water relationships.
• Collection and chemical analysis of two rounds of groundwater samples to evaluategroundwater quality.
3.1 DETERMINATION OF LANDFILL EXTENT
Several investigative methods and evaluations were conducted as part of the Phase n RI todetermine the horizontal extent and boundaries of the filled area. These investigations wereconducted in accordance with procedures presented in the USEPA-approved Phase n RI WorkPlan (Geraghty & Miller, Inc. 1995). The following tasks were completed:
• A literature review of existing documentation and informal interviews with privateindividuals familiar with historical filling practices.
• A geophysical investigation consisting of magnetic and terrain conductivitysurveys.
• A series of shallow test pits to verify results obtained in the geophysical surveys.
Completion of these tasks allowed an accurate definition to be made of the horizontalextent of the filled area. The methodologies and procedures used to complete the tasks are
described in the following sections.
GERAGHTY & MILLER, INC.

3-3
3.1.1 Geophysical Background Information
Prior to conducting the geophysical survey and excavating test pits, a records review of theexisting Tornah ARNG documentation was conducted. On August 8, 1995 Geraghty & Millerpersonnel conducted a literature review and a construction document review of records madeavailable by the ARNG. Logs of geotechnical borings completed on the property prior toconstruction of the buildings were reviewed to ascertain general locations of the filled areas. Inaddition, several ARNG personnel who were stationed at the Armory during construction wereinterviewed to gain a qualitative understanding of the type and locations of encountered landfilledmaterial. Information obtained from existing records and construction documentation, inconjunction with personal recollection of construction activities, was used in the initial
establishment of the geophysical survey grid.
3.1.2 Geophysical Investigation
Magnetic (magnetometer) and electromagnetic surveys were conducted at the Site onOctober 2 through 4, 1995. The survey area consisted of approximately 10 acres of primarilygrass and asphalt-covered terrain. The objective of the geophysical survey was to attempt todelineate the boundary of the filled area by utilizing non-intrusive techniques. A previousgeophysical survey was performed during Phase I field activities to identify locations in thefilled area that might potentially pose a hazard to drilling equipment.
Successful geophysical surveys require that some physical property (such as metal
content or bulk conductivity) of the fill material be different from that of the surrounding soilsand overburden. Generally, material that has been landfilled has a different bulk conductivitywith respect to the surrounding, undisturbed overburden. Consequently, if sufficiently
GERAGHTY & MILLER, INC. 19

3-4
detailed conductivity measurements are acquired, the texture of the resulting conductivity mapcan be used to define the landfilled area.
Prior to recording any of the geophysical data, a survey grid was established across theTALS using a right angle prism, a survey wheel, and plastic pin flags. This facilitated theaccurate measurement and collection of data along and between the markers. The survey linespacing was 10-feet across the survey area. A licensed land surveyor was contracted to locatemarkers at the corners of each survey area in the event that the pin flags would be missing andthat relocation of a coordinate system within the grid would become necessary at a later time.The geophysical survey grid is shown on Figure 3-1.
3.1.2.1 Terrain Conductivity Survey
An EM-31 electromagnetic survey instrument manufactured by Geonics of Toronto,
Canada was used to record the electromagnetic data. The EM-31 provides a measure of thebulk conductivity of the ground (terrain conductivity). The instrument has two modes of
operation, one called the "vertical" dipole mode and the other called the "horizontal" dipolemode. The vertical dipole mode measures the bulk conductivity of the ground to a depth ofapproximately 15 feet. The horizontal dipole mode measures the bulk conductivity of theground to about one-half of that depth. For this survey all of the data were recorded using thevertical dipole mode, giving an exploration depth of about 15 feet.
Terrain conductivity is influenced by the presence of buried metal in the ground and bythe natural conductivity of the near-surface soil material. Soil conductivity is influenced by
the moisture content and salinity in the soil pores and by the presence of clay material.
The EM-31 measurements were recorded every 5 feet along the survey lines, with the
boom of the instrument pointing north-south and parallel to the survey lines. The conductivity
GERAGHTY & MILLER, INC.

3-5
data were stored in the EM-31 internal computer memory and subsequently downloaded to acomputer for data reduction and analysis.
The EM-31 conductivity data, downloaded to a computer was inspected to verify theaccuracy of the coordinates that had been assigned to each data point by the data logger. Thedata was then processed, contoured, and color-plotted using a two-dimensionalmapping/plotting computer software written by Geosoft, Inc.
3.1.2.2 Magnetic Survey
The magnetic data were recorded using a GSM-19 magnetometer/gradiometerinstrument manufactured by GEM Systems, Inc. of Ontario, Canada. The GSM-19 is a
proton precession magnetometer that measures the strength of the earth's magnetic field atany point. The magnetometer was equipped with a high-speed data recording option (a"walking magnetometer"). A second GSM-19 magnetometer was used as a base station tomonitor the diurnal changes in the strength of .he earth's magnetic field throughout the courseof the magnetic survey. The walking magnetometer consisted of two sensing heads connectedto a microprocessor and a digital display unit that was carried by the operator. These twosensors calculated the vertical gradient of the total field. Both the base station sensor and thelower walking magnetometer sensor recorded the total magnetic field intensity.
Prior to beginning the magnetic survey, the walking magnetometer and base stationmagnetometer were time-synchronized to each other. The magnetic data collected from thebase station magnetometer were used to correct for diurnal variations in the earth's magneticfield so that a diurnal correction could be applied to the data collected by the walkingmagnetometer.
GERAGHTY & MILLER. INC.

3-6
Magnetic field measurements were collected with the walking magnetometer at therate of two readings per second. At a normal walking speed, this yields one reading for
approximately every 2 feet along each survey line. The base station magnetometer, which waslocated in a quiet area away from any cultural influences, measured and recorded magnetic
field data every 10 seconds.
The magnetometer data were downloaded to a computer and processed by reviewingthe base station data to determine the range of the diurnal changes from the start to the end ofthe day. For each day, the data from the walking magnetometer were corrected for minor
diurnal changes then combined into one file. Geosoft software was used to grid, contour, and
color-plot the total magnetic field data.
3.1.3 Test Pits
Sixteen test pits were completed, on and adjacent to, the TALS on October 16 and 17,
1995. The test pits were excavated to confirm the results of geophysical testing and to accurately
delineate the extent and boundaries of the filled area. Brady Excavating of Tomah, Wisconsin was
retained to perform test pit excavation activities. A Case Model 580C backhoe with a 3-foot wide
bucket was used to excavate test pits. At test pit locations where fill material was encountered, the
material was placed back into the excavation and covered with excavated soil material. At test pitlocations where fill was not encountered the natural subsurface materials were replaced and
recompacted. All test pit activities were supervised by a Geraghty & Miller geologist. In addition,a WDNR staff member was present on October 17, 1996 to oversee test pit activities. Test pit
locations are shown on Figure 3-2.
GERAGHTY # MILLER, INC.

3-7
3.2 SURFACE SOIL SAMPLING
On October 18 and 19 and November 3, 199S, a total of 44 surface (0 to 1 foot bis) soilsamples of the landfill cover and background surface soil were collected. The surface soil sampleswere collected at the intersection points of the magnetic survey grid (see Figure 3-1). All landfillcover samples were collected inside the limits of the filled area as determined by the geophysicalinvestigations and confirmed by the test pit observations. All background samples were collectedoutside the limits of the filled area. A Geraghty & Miller geologist collected all surface soilsamples. The locations of the filled area cover and background surface soil samples are illustratedon Figure 3-3.
Each surface soil sample was collected using a stainless-steel hand auger, spoon, andspatula. Dedicated surgical-type gloves were worn by the field staff during the collection of thesurface soil samples. The soil sampling tools (hand auger, spatula, and spoon) were cleaned in the
field between each use by washing in a mixture of potable water and Micro™ laboratory-grade
detergent followed by a thorough rinse in potable water.
3.2.1 Background Surface Soil Sample Collection
Six background shallow surface soil samples were collected from outside the identifiedfilled area to compare existing background constituent concentrations with concentrations presentin the cover material. Each background surface soil sample was placed in a 4-ounce (oz) sterilizedand unpreserved laboratory-supplied glass jar for subsequent benzo(a)pyrene and lead analyses.The surface soil samples were placed on ice immediately after packing and shipped under chain-of-
custody protocol to Quanterra Environmental Services of North Canton, Ohio for analyses. Thebackground surface soil sampling locations (sample designation BKSS-) are presented onFigure 3-3. Analytical results for the background surface soil samples are shown on Figures 3-4
and 3-5. Laboratory analytical reports are included in Appendix F.
GERAGHTY 6? MILLER. INC.

3-8
3.2.2 Landfill Cover Surface Soil Sample Collection
Thirty-eight shallow surface soil samples were collected from within the boundaries of thefilled area to determine if the indicator constituents, lead and benzo(a)pyrene, are present in thecover material at concentrations that may pose a threat to human health or the environment. Eachlandfill cover surface soil sample was placed in a 4 oz sterilized and unpreserved laboratory-supplied glass jar for subsequent benzo(a)pyrene and lead analyses. The surface soil samples wereplaced on ice immediately after packing and shipped under chain-of-custody protocol to QuanterraEnvironmental Services, North Canton, Ohio for analyses. The lead and benzo(a)pyrene analyticalresults for the landfill cover surface soil samples are shown on Figure 3-4 and Figures 3-5respectively. Laboratory results are included in Appendix G.
In addition to the above analyses, five of the landfill cover surface soil samples weresubmitted for TOC analysis to evaluate the chemical absorption potential of the cover material.Laboratory results are presented in Table 4-4.
3.2.3 Gcotechnical Sampling
Soil samples were collected for geotechnical analysis to determine the physicalproperties of the existing landfill cover material. Five soil samples were collected at thelocations shown on Figure 3-3. The samples were analyzed for the following parameters:
Dry unit weight by Method American Society for Testing Methods (ASTM)-D2166.Grain-size analysis by Method ASTM-D422.Moisture content by Method ASTM-D2216.
Flexible wall permeability-falling head by method ASTM-D-5084
GERAGHTY & MILLER, INC.

3-9
Samples were submitted to Giles Engineering Associates, Inc. of Waukesha,Wisconsin for analysis. Results of the geotechnical sampling are included in Appendix H.
3.3 SOIL BORING AND SAMPLE COLLECTION
From October 23 to 25, 1995, six monitoring wells, consisting of four shallow water-tablemonitoring wells (SB/MW-01 through SB/MW-04) and two deep piezometers (SB/PZ-01 andSB/PZ-02), were installed in sofl borings completed around the perimeter of the TALS. Allborings were completed outside the limits of the filled area as determined by the geophysicalinvestigations. Boart Longyear, Inc. of Schofield, Wisconsin was retained to perform drilling andwell installation activities. The locations of the newly completed soil borings and monitoring wellsare illustrated on Figure 3-6.
The soil borings were advanced using conventional hollow-stem auger drilling techniques.Each boring was completed using 4'/i-inch inside diameter augers, which resulted in an 8-inchnominal diameter borehole. Soil samples were collected continuously from each borehole using a2-foot long by 2-inch diameter split-spoon sampler. Upon retrieval from the borehole, each split-spoon was opened, and the soil sample was field-screened for the potential presence of totalionizable VOCs using a Foxboro™ Organic Vapor Analyzer (OVA). Each split-spoon sample wasdescribed and logged in the field by a Geraghty & Miller geologist. The OVA readingscorresponding to sample depth are shown on the sample/core logs for each borehole. Thesample/core logs are included in Appendix I.
Dedicated surgical-type gloves were worn by the field staff during the collection of the soilsamples. Prior to commencing drilling activities at each location, all drilling and soil samplingequipment was steam-cleaned to minimize the potential for cross-contamination betweenboreholes. Spilt-spoons were cleaned in the field between each use by washing in a mixture of
potable water and Micro™ laboratory-grade detergent followed by a thorough rinse in potable
GERAGHTY & MILLER. INC.

3-10
water. Water-table monitoring well borings were advanced to 13 feet bis. The screens of thepiezometers were placed at the bedrock unconsolidated interface. Piezometer PZ-01 was placed ata depth of 35 feet bis and Piezometer PZ-02 was placed at 33 feet bis. The soil cuttings generatedby the drilling activities were spread out on the ground near each well.
Four shallow subsurface soil samples were collected from the monitoring well borings andsubmitted for TOO analysis to evaluate the chemical absorption potential. One soil sample wascollected from each of the water-table monitoring well borings (MW-01, MW-02, MW-03, andMW-04). The soil samples selected for laboratory analyses were collected from the soil columndirectly above the water table at 3 to 5 feet bis.
Each soil sample was placed in a 4-oz. sterilized and unpreserved laboratory-supplied glassjar for TOG analysis. The soil samples were placed on ice immediately after packing and shippedunder cnain-of-custody protocol to Quanterra Environmental Services, North Canton, Ohio foranalyses.
3.4 MONITORING WELL INSTALLATION
To facilitate collection of physical and chemical groundwater data, six monitoring wells(four water-table monitoring wells and two piezometers) were completed at the TALS. Followingadvancement of each borehole, each monitoring well was constructed inside the hollow-stemaugers as the augers were slowly removed from the boring. The water-table monitoring wellsconsisted of a 2-inch diameter Schedule 40 polyvinyl chloride (PVC) riser with a 2-inch diameter
Schedule 40 PVC well screen positioned to intercept the water table. The 0.010-inch factory-slotted well screen is 10 feet in length. The deep piezometers were constructed of 5-foot wellscreens with 0.010-inch factory-cut slots. The monitoring wells were constructed in accordancewith the requirements of Chapter NR141 of the Wisconsin Administrative Code (WAC).
GERAGHTY & MILLER, INC.

3-11
Upon positioning the wefl riser and screen, the annular space between the well screen andsoil borehole was filled with a dean silica sand filter pack from the bottom of the boring to 2 feetabove the top of the screen. Approximately, 2 feet of fine sand was placed above the coarse sandpack, and a bentonite seal consisting of Holeplug™ bentonite chips was installed to 1 feet bis.
Each flush-mount monitoring wdl was completed with a locking water-tight expandable well capand lock to prevent surface runoff from entering the well. A flush-mount protective cover wassealed into place with a concrete pad at five of the six well locations (Monitoring Well MW-4 wascompleted as a stick-up well). Installation of details the monitoring wells and piezometers aresummarized on the WDNR Monitoring Well Construction Log Form 4400-113 A, included in
Appendix J. Locations of the monitoring wells are shown on Figure 3-6.
3.5 MONITORING WELL DEVELOPMENT
Monitoring Wells MW-01 through MW-04 were developed by alternatively surging and
bailing using a new, clean disposable polyethylene bailer and new dedicated polyethylene rope.The monitoring wells were then purged using a frequency-regulated Grunfos Rediflo-2 submersiblepump. Dedicated poly-tubing was used as a discharge line at each well. Each well was purgeduntil the discharge was clear of all sediments and fine particles. After each development, the pumpwas cleaned by washing with a solution of Micro™ laboratory-grade detergent and distilled water,followed by a thorough rinse with distilled water. Approximately 90 to 100 gallons of water werepurged from each well, removing the 10 well volumes required by Chapter NR 141.21 of theWAC. The WDNR Monitoring Wdl Devdopment Form 4400-113B for each monitoring well isincluded in Appendix K. All development purge water was disposed on the ground near each well.
3.6 STAFF GAUGE INSTALLATION
Two staff gauges (SG-01 and SG-02) were installed on October 26, 1995. Staff gaugeSG-01 was installed in the Lemonweir River, next to Monitoring Well MW-04. Staff Gauge
GERAGHTY & MILLER. INC.

3-12
SG-02 was installed in the drainage ditch next to Monitoring Well MW-03. The staff gauges were
installed to determine if the adjacent surface water bodies are in hydraulic connection with theshallow water table at the site. The information will indicate if the streams are influent or effluent.
Influent streams have a lower head than the water table and, therefore, receive water from thewater table. Effluent streams have a higher head than the water table, thereby contributing water tothe adjacent water table.
3.7 WATER-LEVEL MEASUREMENTS
On October 2, 3, and 20, 1995 and on February 13, 1996 static groundwater levels were
measured in the four monitoring wells and two piezometers. The water levels were taken threetimes due to excessive recharge which was introduced to the underlying system by a storm in earlyOctober. Groundwater levels were measured from a consistent point on each well at the northern
side of the top of casing, utilizing a clean water-level measuring tape (Sample PRO™ Water LevelMeter, Model 6000, manufactured by Q.E.D. Environmental Systems, Inc.). Groundwater levelswere measured to an accuracy of 0.01 fooi. Groundwater level data collected from the monitoringwells are summarized in Table 3-1.
3.8 LOCATION AND ELEVATION SURVEY
To facilitate the accurate measurement of water levels in the monitoring wells and at each
staff gauge location, the elevation of each well and staff gauge was surveyed by FeddersonEngineering and Surveying of Tomah, Wisconsin on November 22, 1995. Vertical elevations weremeasured at the ground surface adjacent to each well, and at the measuring point (northside of thetop of casing). Staff gauges were measured at the top of each staff gauge. The vertical elevations
recorded to the nearest 0.01 foot were referenced to feet above msl using a local benchmark. The
horizontal location of each well and staff gauge was surveyed to the nearest foot to establishproper spatial relationships to site features.
GERAGHTY & MILLER, INC. *•9

3-13
3.9 GROUNDWATER SAMPLING
Two rounds of groundwater samples were collected and submitted for laboratory analysisduring the Phase n field activities. Groundwater samples were collected from the four shallowmonitoring wells (MW-01 through MW-04) and the two piezometers (PZ-01 and PZ-02) onNovember 2,1995 and February 13,1996. Prior to sampling, at least three well casing volumes ofwater were purged from each weJL The purging and sampling activities were completed usingnew, clean, and disposable bottom filling polyethylene bailers removed from factory-sealed bags.Each new bailer was attached to new, dedicated polyethylene rope. Bailers were used to sampleone well only. Surgical-type gloves were worn by the sampling personnel and discarded betweensampling locations. The monitoring well sampling logs are included in Appendix L.
After purging each well, groundwater samples were collected and placed in laboratory-supplied and certified clean containers. Groundwater samples were analyzed for select VOCsusing USEPA Method 8021 and dissolved lead and dissolved arsenic using USEPA Method6010A. Samples for VOCs were collected without headspace in three 40 milliliter (mL) glass vials
containing 2 mL of hydrochloric acid (HC1) preservative. Samples collected for dissolved lead andarsenic analyses were placed in 500 mL plastic containers. The groundwater samples for dissolved
lead and arsenic analyses were field-filtered using a syringe and a 0.45 micron QED Quick Filter™and preserved with nitric acid (HNQj). Additional groundwater was collected from each well andanalyzed in the field for pH, temperature, and specific conductance (Tables 4-5 and 4-6). Inaddition, equipment blanks were collected during sampling to indicate if sampling methodsinfluenced the groundwater analytical results.
Immediately after collection, equipment blanks and groundwater samples were placed onice and shipped via express mail with chain-of-custody documentation to Quanterra EnvironmentalServices, North Canton, Ohio.
GERAGHTY6? MILLER. INC.

3-14
3.10 DATA VALIDATION
Analytical results for samples collected during the Phase n RI field activities were validatedfollowing guidelines set forth in the "Functional Guidelines for Evaluating Inorganics Analysis"(USEPA 1994b) and "Functional Guidelines for Evaluating Organics Analysis" (USEPA 1994c).Additional pertinent information was also obtained from the project laboratory for review. Thedata validator's professional judgment and experience were utilized when evaluating the reliabilityof the data. Samples were collected from the following matrices and analyzed following protocolscontained in the USEPA-approved Phase H Work Plan (Geraghty & Miller, Inc. 1995):
• Surface soils from the landfilled area cover material.
• Background surface soils from locations outside the limits of the filled area.
• Groundwater samples collected from monitoring wells located outside the limits ofthe filled area.
To summarize the results of the validation process, data qualifiers are placed on theanalytical data tables in this report to document the quality of the laboratory results. With theexception of some minor variances, no significant quality assurance problems exist with the sampleanalyses. The soil-quality data appear to be mostly affected by matrix interferences or natural soilcomplexities. A large number of the parameter concentrations are qualified as estimated based on
the review of the analytical data. However, variability of data is typical in soil samples. Due to the
reported high levels of TOC and the complex soil matrices, the TOC data are considered estimated.In addition, no other quality assurance data related to the TOC results were available for review.Overall, the soil and groundwater data are acceptable for project use as qualified. No data were
GERAGHTY & MILLER, INC.

3-15
disqualified based on the review process. The analytical data validation report is included inAppendix M
GERAGHTY & MILLER, INC.

4. RESULTS OF THE PHASE n RI
As part of the Phase n RI field activities, physical and chemical analyses were conducted toevaluate the chemical concentrations of select indicator parameters identified following review ofthe Phase I RI. A summary of the Phase n RI Sampling and Analysis program is presented inTable 4-1. A discussion of the results obtained from the physical and chemical testing follows.
4.1 RESULTS OF PHYSICAL TESTING
The following sections describe the results of physical testing, including geotechnicalanalysis of surface and subsurface soil material, geophysical investigations, and test pit excavation.
These activities were completed as part of Phase n field activities to gain a better understanding ofthe physical character of the filled material at the TALS and its relationship to various media.
4.1.1 Geotechnical Results
The results of the geotechnical testing have allowed physical characterization of thefilled area cover material. Appendix H contains the results of individual analyses for the five
soil samples analyzed for geotechnical parameters. The analytical results are summarized inTable 4-2.
All samples submitted for analysis were classified as sands containing variableproportions of silt, based on the grain-size distribution curves. The curves show that the
samples are predominantly sand and silt, although a large proportion of gravel is present inSample, SS-29. With the exception of Sample SS-29, all samples were poorly graded anddominated by fine-grained sand and silt. Sample SS-29 was a more evenly graded samplecontaining approximately even quantities of sand and gravel and a smaller proportion of silt.
Moisture contents in the samples varied from 5.8 percent to 58.1 percent. In general,coarser deposits had lower moisture contents while finer-grained deposits, which are more
GERAGHTY & MILLER, INC.

4-2
capable of retaining water, had higher levels. Dry unit weights ranged from 59.9 to 110.1pounds per cubic foot and generally increased with coarseness.
Hydraulic conductivities, calculated by falling head permeameter tests, ranged between7.0 x 10"s centimeters per second (cm/sec) and 7.3 x 10"4 cm/sec. The highest values werenoted in Samples SS-14 and SS-35, which were predominantly sand. Hydraulic conductivitieswere lower for samples containing proportionately less sand and more silt. The lowesthydraulic conductivity value was obtained for Sample SS-07, which contained greater than 35percent silt.
4.1.2 Geophysical Investigation
To identify the extent of waste material and to delineate the landfill boundary (filledarea) utilizing non-intrusive techniques, a geophysical investigation consisting of magnetic
(magnetometer) and electromagnetic (EM-31) surveys was conducted at the Site. Thesurveys were completed on October 4, 1995. Data reduction and analysis followingcompletion of the field surveys enabled the construction of detailed color-coded maps
illustrating the terrain conductivity (Figure 4-1) and total magnetic field (Figure 4-2). Thedata contained in the figures revealed interpretable terrain conductivity and magnetic featuresacross the area of investigation. A brief discussion of the interpretation of the terrainconductivity and magnetic data follows.
The terrain conductivity data are shown on Figure 4-1. Review of the data indicatesan area of contrasting high and low conductivity values. The area of variable electrical
conductivity is interpreted to represent the filled area and disturbed soil region.
Outside the filled area, the terrain conductivity values appear to be fairly low. Thisarea of low conductivity is interpreted to represent background soil conductivity. Review of
GERAGHTY & MILLER, INC.

4-3
the terrain conductivity data indicates that the extent of the filled area is defined, except at thenorthwestern and southwestern corners of the TALS. The terrain conductivity in thenorthwestern corner is influenced by the presence of a 6-foot high chain-link fence. However,anomalous electrical conductivity values are present up to the fence boundary in thenorthwestern comer indicating that fill material may extend to the north from thenorthwestern corner of the TALS. In the northeastern area, background-range conductivityvalues are observed to the south of the fence line, indicating that fill material does not exist inthat area. The southwestern comer of the TALS is also not well bounded by the geophysicaldata. The terrain conductivities in this area appear to be close to background at coordinates200E to 300E and 100N to 150N, but the presence of cultural features that affect theinstrument readings are numerous. The conductivity values indicated on the eastern andsoutheastern boundaries are the result of known cultural features (buried and aboveground
utilities, a metal flag pole, and a building foundation).
Total magnetic field intensity data are plotted on Figure 4-2. The area within the blackoutline displays variable magnetic field intensity and is interpreted to be the landfilled materialcontaining ferrous metal debris. Outside the boundary, the total magnetic field appears to bein the range of observed background magnetic field intensity (based on readings obtained atthe base station with the total field magnetometer). Consistent with the terrain conductivitydata, the boundary of the filled area appears to be well-defined except in the northwesternarea of the TALS. The magnetic influence of the fence is evident across the northernboundary. Additionally, the southwestern corner of the TALS is not well-defined due to theinfluence of surface (and possibly subsurface) features in this area. The magnetic fieldintensity in the areas to the east and southeast are the result of cultural influence.
Correlation between the EM-31 terrain conductivity and the total magnetic field datais very good. Nearly identical results with respect to the interpreted extent of fill wereobtained through interpretation of each of the geophysical methods.
GERAGHTY & MILLER, INC.

4-4
4.1.3 Test Pit Completion
To confirm the results of the geophysical testing and to delineate the boundaries of thefilled area, a series of shallow test pits were completed on October 16 and 17, 1995. The locationsof the test pits are shown on Figure 3-2. A strong correlation exists between the filled areaboundaries that were identified by the geophysical surveys and the filled area boundaries identifiedby completion of the test pits. Test pits completed at the southwestern and northwestern portionsof the TALS confirmed that the indicated magnetic and conductivity anomalies were the result ofburied refuse and not cultural influence. To the southwest and northwest, test pits were completedin a "stepping out" manner until the limit of fill was defined. The extent of the filled area, asinterpreted from the geophysical surveys and confirmed during test pit completion, is illustrated onFigure 4-3.
4.2 RESULTS OF CHEMICAL TESTING
4.2.1 Soil Sample Analytical Results
The following sections discuss the results of the benzo(a)pyrene and lead analysescarried out on the 48 surface soil samples taken in the vicinity of the TALS. Laboratoryanalytical results for the background surface soils samples and the filled area cover surface soilsamples are contained in Appendices F and G. The data are summarized in Table 4-3. The
concentration of benzo(a)pyrene detected in surface soil samples is shown on Figure 3-4. Theconcentration of lead in surface soil samples is shown on Figure 3-5. In addition, five of thesurface soil samples and four of the subsurface soil samples were analyzed for TOC.
Benzo(a)pyrene concentrations observed in the surface soil samples vary widely.Concentrations in samples taken at the six background locations (designated as BKSS-) were
GERAGHTY & MILLER, INC.
4-5
below detection limits, although a duplicate sample taken at location BKSS-02 detected
benzo(a)pyrene at an estimated concentration of 77 micrograms per kilogram (ug/kg).
Benzo(a)pyrene was not detected in 22 of the 41 landfilled area cover soil samples. In
the samples where benzo(a)pyrene was detected, estimated concentrations ranged from 48
Hg/kg to 3,900 ng/kg. Levels in 13 samples were above the USEPA Region HI Risk BasedConcentrations (RBC) for residential soil. Of these 13 samples, two containedbenzo(a)pyrene at concentrations that were greater than the RBC for industrial soils
(780 ^g/kg).
Samples containing benzo(a)pyrene were obtained primarily from the central andwestern areas of the TALS. Samples containing benzo(a)pyrene at levels above the RBC forresidential soil are scattered. The two samples with levels above the RBC for industrial soilwere taken from the center of the filled area.
Lead concentrations in the six background samples (designated as BKSS-) rangedfrom 5.7 mg/kg to 26.1 milligrams per kilogram (mg/kg). Estimated concentrations in the
landfilled area cover material (i.e. surface soil) ranged from 4.5 mg/kg to 422 mg/kg. Leadconcentrations in 21 of the 41 landfill cover material samples were within the concentrationrange observed in the background samples.
Of the 20 landfill cover surface soil samples that contained lead at concentrations
greater than the background soil levels, two had levels above the USEPA Region EQ RBC forresidential soils of 400 mg/kg; Sample SS-07 contained 421 mg/kg, and Sample SS-17contained 422 mg/kg. Levels in all samples were below the lead RBC for industrial soils of
1,000 mg/kg.
GERAGHTY& MILLER, INC.

4-6
Filled area cover surface soil samples containing lead in concentrations above thoseobserved in background samples were primarily concentrated in the western and southernareas of the TALS, although slightly elevated levels were noted on the eastern side of theTALS. Concentrations were highest at Samples SS-17 and SS-07, which are located in thewooded area north of the telephone museum.
The TOC analytical results of surface soil samples (Table 4-4) revealed TOCconcentrations ranging from 0.11 percent to 5.5 percent. In general, TOC concentrationsgreater than 1 percent are typical of organic material or topsoil. The TOC concentrationsgreater than 1 percent generally result in a high degree of retardation for polar organicmolecules, such as benzo(a)pyrene. The high TOC concentrations identified in the surface soilsamples are indicative of very high retardation and low dissolved contaminant mobility. TheTOC concentrations identified in the surface soil samples were spatially variable the highestvalue (5.5 percent in soil sample SS-07) was detected in the southwest portion of the TALSand the lowest value (0.11 percent in soil sample SS-27) was detected in the central portion ofthe TALS).
The TOC analytical results of shallow subsurface soil samples (Table 4-4) revealedTOC concentrations ranging from 0.034 percent to 0.23 percent. These TOC concentrationsare commonly encountered in silt-sized materials (Domenico & Schwartz, 1990). Although
these TOC levels are lower than those found in the surface soils, they are still high enough tocause significant retardation. The TOC concentrations identified in the shallow subsurface
soil samples were spatially variable. The highest value (0.23 percent in soil sample SB01/5)was detected in the northeast portion of the TALS and the lowest value (0.034 percent in soilsample SB02/5) was detected in the southwest portion of the TALS).
GERAGHTY & MILLER, INC.

4-7
4.2.2 Groundwater Sample Analytical Results
Two rounds of groundwater sampling were conducted during Phase n RI fieldactivities. The laboratory analytical reports are contained in Appendix N. The analytical dataare summarized in Tables 4-5 and 4-6. The detected compounds are presented for theNovember 1995 and February 1996 sampling events on Figures 4-4 and 4-5.
A total of the 14 groundwater samples, including two duplicate samples, werecollected and submitted for chemical analysis during the Phase n RI. Chlorinated VOCs weredetected in three of the four water-table wells and in both piezometers. Three VOCs weredetected: 1,2-dichloroethane (1,2-DCA); trichloroethene (TCE); and 1,2 dichloroethene-total(1,2-DCE). Samples obtained from Monitoring Well MW-1 that is located downgradient, did
contain no detectable concentrations of VOCs. The following may be stated about each of thecompounds detected.
• 1,2-DCA was detected only in the groundwater samples collected from thehydraulically upgradient water-table Monitoring Well MW-2 in February 1996.
Detected concentrations ranged from below the laboratory detection limit of0.01 micrograms per liter (ug/L) to an estimated concentration of 6.4 u,g/L.
• The highest concentrations of TCE were detected in samples collected fromupgradient Monitoring Well MW-2 and the upgradient Piezometer PZ-2 in
November 1995 and February 1996. TCE levels range from below the
practical quantitation limit of 1.0 ug/L to an estimated concentration of
160 u,g/L. TCE levels in groundwater samples collected from the wellsdowngradient of Monitoring Well MW-2 were generally half those observed
in Monitoring Well MW-2,
GERAGHTY^ MILLER, INC.

4-8
• The highest concentrations of 1,2-DCE were detected in upgradientMonitoring Well MW-2. Levels of 1,2-DCE ranged from below the detection
limit of 1.0 ug/L to an estimated concentration of 32 ug/L. Samples collected
from the downgradient wells contained the compound at approximately halfthe concentration observed in Monitoring Well MW-2.
Arsenic was not detected in any of the samples collected during either sampling event.Lead was detected at 4.7 ppb in a single ground water sample collected from Monitoring WellMW-4 during the February 1996 sampling event.
4.3 HYDROGEOLOGICAL ASSESSMENT
4.3.1 Geology
The geology of the area of investigation has been characterized using the data from thesix Phase II RI boreholes. Two geologic ci oss-sections have been constructed through theSite to illustrate the distribution and relationships between the deposits encountered.Figure 4-6 presents the cross section locations. The geologic cross sections are shown onFigures 4-7 and 4-8. A brief description of each unit encountered during Phase II RI boreholecompletion follows.
• Bedrock: The two deep boreholes, Piezometers PZ-1 and PZ-2, encounteredbedrock at approximately 35 feet bis. The bedrock is a white, very fine, soft
and friable sandstone.
• Sand: A light green to yellowish brown, medium-grain, quartz sand, containingtrace amounts of silt and gravel and occasional lenses of silty sand overlies the
GERAGHTY & MILLER, INC.
4-9
bedrock. The sand is between 9 and 23 feet thick and was encountered atevery borehole location.
• Silt and Sand: A dark brown to green unit of medium sand and silt containingvariable amounts of coarse sand and organic material was encountered in mostboreholes. This unit is thickest in the northeastern and southwestern areas andthins out to the northwest. Based on the available data, the sand and silt unit issuspected to underlie the Landfill.
• Refuse: Refuse was not encountered in the Phase II RI boreholes. However,based on the results of geophysical investigations and subsequent test pitcompletion, the limits of fill have been determined. The filled area is estimatedto be as thick as 4 feet.
• Topsoil/Blacktop/Gravel Fill: The area of investigation is covered with topsoil,blacktop, and/or gravel fill at the surface to a depth of approximately 2 feet.
4.3.2 Hvdrogeology
To adequately characterize the physical groundwater flow regime within the upperunconsolidated material across the TALS, depth-to-water measurements were obtained from eachof the newly installed Phase n RI monitoring wells (MW-1 through MW-4) and piezometers (PZ-1and PZ-2). Relative water-level elevations were calculated at each monitoring well using UnitedStates Geological Survey (USGS) datum-referenced survey data. Water-level measurements were
obtained on November 2, 3, and 20,1995 and on February 13, 1996. Well construction details and
groundwater-elevation data are provided in Table 3-1. The water-table configuration showing theinferred direction of shallow groundwater flow on February 13, 1996 is illustrated on Figure 4-9.Shallow groundwater flow beneath the Site is to the north-northwest. The horizontal hydraulic
GERAGHTYcr' MILLER, INC.

4-10
gradient calculated between inferred equipotentials extending through Monitoring Wells MW-2and MW-4 is 0.0030. The vertical hydraulic gradients calculated at Wefl Nests MW-l/PZ-1 andMW-2/PZ-2 are -0.014 and -0.027, respectively, resulting in an average downward verticalhydraulic gradient of -0.021.
4.4 INTERPRETATION OF RI RESULTS
4.4.1 Extent of Fill
Prior to completion of the Phase II RI, the horizontal extent of the filled area had notbeen defined. Completion of soil borings, test pits, and a geophysical survey during the Phase
II RI has resulted in delineation of the filled area. As shown on Figure 4-3, the filled areaextends throughout a large portion of the TALS, as well as onto three adjacent properties tothe north, west, and south. However, construction of Woodard Avenue pre-dates the landfill.Thus, the limits of fill depicted in Figure 4-3 as extending through Woodard Avenue should
be interpreted as excluding the area of the road itself. With this notable exception, a highconfidence exists that the limits of fill are accurately illustrated on Figure 4-3.
4.4.2 Geology and Hvdrogcologv
Results of soil borings and test pit completions indicate that the filled area is overlainby up to 2 feet of cover materials (variably; soil, asphalt, or gravel) in most places. Native siltand sand-sized materials are interpreted to underlay the landfill materials to approximately35 feet bis, where sandstone bedrock is present. Geotechnical analysis of filled surface soilsindicate that the landfill soil cover is composed primarily of silt and sand-sized materials.
Collection of groundwater-level measurements during the Phase II RI activitiesindicates that groundwater is present beneath the TALS at depths typically ranging from 2 to
GERAGHTY & MILLER, INC.

4-11
7 feet bis. The shallow groundwater across the TALS exhibits a north-northwest horizontalflow direction with a slight downward vertical gradient.
4.4.3 SoU Quality
Surface soil samples were collected from the TALS and analyzed for the twochemicals of concern, benzo(a)pyrene and lead. (Additional surface and subsurface soilconstituents were analyzed during the Phase IRI. Benzo(a)pyrene and lead were deemed tobe appropriate indicator parameters, by the WDNR and the USEPA based on the Phase I RIresults.) Collection and analysis of the surface soil samples during the Phase n RI revealeddetectable concentrations of both constituents, apparently indicating that some filled areacover surface soils are affected by constituents from the landfilled material.
The lead concentrations detected in the soil samples were highly variable and spatiallyrandom. Approximately 50 percent of the soil samples exhibited lead concentrations withinbackground ranges. No soil sample lead concentrations exceeded the RBC for industrial soils.Only two sample concentrations (SS-07 at 421 mg/kg; SS-17 at 422 mg/kg) exceeded the
RBC for residential soils (400 mg/kg). Consequently, it is interpreted that only some limitedareas of cover surface soils may have been affected by landfilled constituents.
The benzo(a)pyrene concentrations detected in the soil samples were also highlyvariable and spatially random. Greater than 50 percent of the soil samples did not exhibitdetectable concentrations; however, 13 soil samples exhibited concentrations above the forresidential soils (90 ug/kg) and two of these 13 sample concentrations (SS-24 at 1,300 ug/kg;
SS-35 at 3,900 ug/kg) exceeded the RBC for industrial soils (780 |ig/kg). It is interpretedthat some surface soils may have been influenced by landfilled materials. However, it shouldbe noted that benzo(a)pyrene is a common constituent in asphalt, and other sources could be
responsible for the observed concentrations of this constituent.
GERAGHTY^ MILLER, INC.

4-12
4.4.4 Groundwater Quality
Groundwater samples were collected from the site and analyzed for 13 chemicals ofconcern. These chemicals include 11 chlorinated VOC constituents, arsenic, and lead.(Additional analytical constituents were analyzed during the Phase IRI but were not deemedby the WDNR and the USEPA to be of further concern based on the Phase I RI results.)Chemical analysis of groundwater samples revealed that the highest concentrations wereidentified in groundwater samples from monitoring wells located hydraulically upgradient ofthe filled area indicating that the detected constituents are not likely related to the landfillmaterials.
The chlorinated VOC constituents that were detected in groundwater at the Siteinclude 1,2 DC A, TCE and 1,2-DCE. As previously mentioned, the highest concentration ofthese compounds, during both rounds of sample collection, were collected from groundwatermonitoring wells (Monitoring Well MW-2 and Piezometer PZ-2) located hydraulicallyupgradient of the filled area. Generally, the constituent concentrations in downgradient wellswere less than one-half the concentration exhibited in groundwater samples from upgradientwells. Consequently, the detectable VOC concentrations at the TALS are not attributable toconstituents of the landfilled materials. Results of groundwater analytical results for lead andarsenic revealed only one detectable concentration of lead, and this concentration was belowthe Wisconsin groundwater Enforcement Standard (ES), indicating that neither of theseconstituents are of concern at the Site.
4.4.5 Landfill Gas
Landfill gas was not deemed to be a potential concern at the site based on fieldscreening results obtained with an OVA and an organic vapor meter (OVM) during
GERAGHTY & MILLER, INC.

4-13
completion of soil borings and test pits, respectively. All field screening results wereconsistent with background ambient air concentrations with the exception of the boringadvanced during completion of Piezometer PZ-1. The splitspoon sample obtained form theinterval of IS to 17 feet below land surface (ft bis) at PZ-1 exhibited VOCs at a concentrationof 48 parts per million per volume (ppmv) as measured with the OVA. The depth interval thatthis sample was collected from is much greater than the reported maximum fill depth ofapproximately 8 ft bis. The location of PZ-1 is outside the limits of fill as indicated by thegeophysical surveys and confirmed during test pit completion. No refuse was encountered ineither the boring at Monitoring Well MW-1 or PZ-1. It is therefore believed that the origin ofthe VOCs detected during advancement of Piezometer PZ-1 was likely attributable tonaturally occurring organic material and not the result of methanogeneses due to the biologicbreak-down of waste material.
GERAGHTY & MILLER. INC. O

5. SCREENING RISK ASSESSMENT
This Risk Assessment was performed to assess potential impacts to human healthassociated with current or future direct exposures to constituents detected in soil at theTALS. As discussed in Section 4.4.4, the constituents detected in groundwater downgradient
from the TALS cannot be attributed to the landfilled materials. Therefore, risk to humanhealth from groundwater exposure or the potential for groundwater to discharge to surfacewater was not addressed in this RA. Ecological risks are not expected to be significantbecause the TALS is located in an urban setting and soil is the primary exposure medium ofconcern. Therefore, ecological risk also is not included in this RA.
Under CERCLA, the RI/FS and related RA are viewed as flexible processes thatshould be tailored to site-specific circumstances (USEPA 1989). The USEPA Superfundguidance was written to address the most complex sites, and as a result, not all steps andprocedures of the Superfund human health evaluation process described in the USEPA manualneed apply to all sites (USEPA 1989). RAs are site-specific and, therefore, may vary in bothdetail and the extent to which qualitative and quantitative analyses are used. In a logicalextension of this view, the USEPA has made a policy decision to use, wherever appropriate,standardized approaches to achieve the goal of streamlined assessment. Such was the
approach utilized for this RA.
The history of the TALS indicates that disposal of solid waste was the primaryactivity. Based on the results of the Phase IRI Report and discussions with the WDNR andthe USEPA, the list of Constituents of Potential Concern (COPCs) for soil are limited.Therefore, the RA focused on these selected COPCs in soil and on the potential human
receptors to this medium. The RA considered realistic current and future land uses andutilized a semi-quantitative screening evaluation which compared measured concentrations of
COPCs to published risk-based levels. Published risk-based levels are not available for lead.Therefore a site-specific lead comparison value was calculated utilizing the adult lead cleanup
GERAGHTY & MILLER, INC.

5-2
model (USEPA 1994e). The results of this RA will be used to help determine the appropriate
remedial action strategy.
The guidance documents used to prepare this RA included the following:
• Risk Assessment Guidance for Superfund (RAGS) (USEPA 1989)• Risk Based Concentration (RBC) (USEPA 1996a)• Soil Screening Guidance (USEPA 1994d)
• Lead Soil Cleanup Guidance (USEPA 1994e)
The basic framework of this RA includes data evaluation, toxicity assessment,
exposure assessment, risk characterization, and uncertainty analysis. These elements for thescreening RA are discussed in the following sections.
5.1 DATA EVALUATION
The nature and extent of soil contamination at the TALS is discussed in Section 4.0.Surface soil data was collected during Phase II RI activities, while subsurface soil data wascollected during Phase I. Figure 3-3 shows the surface soil sampling locations. Analyticaldata for the surface soil samples are presented in Table 4-3 and are shown on Figures 3-4 and3-5.
5.1.1 Constituents of Potential Concern
As agreed to by the WDNR and the USEPA, the COPCs at this site arebenzo(a)pyrene and lead for surface soils. For subsurface soils, the COPCs arebenzo(a)pyrene and the detected inorganic constituents that include arsenic, barium, beryllium,
chromium, lead, manganese, nickel, and thallium.
GERAGHTY & MILLER, INC.

5-3
For this RA, the potential for risk to human health was evaluated by utilizing aconservative, semi-quantitative screening methodology. This methodology includedcomparison of COPC exposure point concentrations (EPCs) for soil to site-specificbackground concentrations and published RBCs for soil, or soil screening levels (SSLs).Methods used to determine EPCs are presented below.
5.1.2 Exposure Point Concentrations
For soil, EPCs were estimated by calculating the 95 percent upper confidence limit(UCL) of the mean. The UCL is defined as the value, when calculated repeatedly for randomlydrawn subsets of data, equals or exceeds the true mean 95 percent of the time. It is used in RAswhen there is limited data because it is not possible to know the true mean of a data set withouthaving a very large amount of data. Therefore, the UCL accounts for uncertainties due to limiteddata. However, it provides reasonable confidence that the true site average will not beunderestimated or overestimated, therefore, the true site risk will neither be underestimated or beoverly conservative. The following equation was used to calculate the UCLs (USEPA 1992).
UCL = x + t(s/Jn)
where:
UCL = 95 percent upper confidence limit of the arithmetic mean
x = mean of the untransformed data
5 = standard deviation of the untransformed data/ = Student-/ statisticn - number of samples
GERAGHTY & MILLER. INC.

5-4
When the UCL exceeded the maximum detected value of a given COPC, then themaximum detected value was used as the EPC in this RA. This approach ensures that siteCOPC data comparisons to risk-based guidelines were conservative (i.e., protective of humanhealth). Comparisons of EPCs to risk-based screening levels are provided in Section 5.4 -Risk Characterization.
5.1.2.1 Surface Soil
The area evaluated includes all property within the limits of fill. This area is currentlyowned by four separate entities and is zoned light industrial and residential. The ARNGoccupies a large portion of the evaluation area (approximately 6.2 acres). The Harris AlienTelecommunications Museum occupies approximately 2.5 acres and consists of a largebuilding that houses the museum exhibits and offices, a parking lot, and an L-shaped grass-covered area. The museum area is not fenced. The third parcel is the City-operated sewagetreatment plant located to the north of the ARNG and east of Woodard Avenue. The sewagetreatment plant is fenced. To the west of Woodard Avenue is a small parcel of undevelopedprivately owned land, which constitutes the fourth parcel.
One main brick structure (containing an assembly hall, classrooms, offices, storagefacilities, a kitchen, and locker rooms), several storage sheds, and two primarily gravel-surfaced vehicle storage areas are located to the north and west of the main brick structure atthe ARNG property. The landfilled areas adjacent to the buildings are slightly mounded,grass-covered, open fields that are currently not used for recreation, storage, or any otherpurpose. Except for the vehicle storage areas that are fenced, access to the ARNG is notrestricted.
Since current land use differs in various areas that have been filled, there is a potential
for different receptors to be exposed at these respective locations. Therefore, the site surface
GERAGHTY & MILLER, INC.

5-5
soil data was divided into four areas; the Museum area, Armory area, Sewage Treatment Plantarea, and the Trespassing area (to the West of Woodard Avenue and the wooded area to theNorth of the museum). Table 5-1 presents the occurrence summary (i.e., the calculation ofthe EPC) of surface soil data for each of these four defined areas.
5.1.2.2 Subsurface Soil
Subsurface soil data was collected from the Armory and Museum areas during the Phase IRI. Like the surface soil, these two areas were evaluated separately. One soil samplecollected from the Museum area. This sample had the highest detected concentration of lead(4059.8 mg/kg = 4060) at the TALS. Table 5-2 shows the occurrence summary and EPCs forsubsurface COPCs in these two areas.
5.2 TOXICTTY ASSESSMENT
This section discusses the two general categories of toxic effects, noncarcinogenic andcarcinogenic, for the site COPCs. The information contained in this section on
noncarcinogenic and carcinogenic effects were obtained using the Integrated Risk InformationSystem (IRIS) (USEPA 1996b) and the Health Effects Assessment Summary Tables
(HEAST) (USEPA 1995b). Also in this section is a brief discussion on the adult cleanup
model for lead (USEPA 1994e).
5.2.1 Noncarcinogenic Effects
For many noncarcinogenic effects, protective mechanisms must be overcome beforethe effect is manifested. Therefore, a finite dose (threshold), below which adverse effects willnot occur, is believed to exist for noncarcinogens. A single compound might elicit several
adverse effects depending on the dose, the exposure route, and the duration of exposure. For
GERAGHTY & MILLER, INC.

5-6
a given chemical, the dose that elicits the no observed adverse efifect level (NOAEL) whenevaluating the most sensitive response (the adverse efifect which occurs at the lowest dose) inthe most sensitive species tested is used to establish a reference dose (RfD).
The RfD is an estimate of a daily exposure level that is unlikely to causenoncarcinogenic health effects. Thus, exposure levels below the RfD are unlikely to producetoxic effects in even sensitive subpopulations. Chronic RfDs are used to assess long-termexposures ranging from 7 years to a lifetime; subchronic RfDs evaluate the potential ofadverse health effects associated with exposure to chemicals during a period of a few days to7 years. RfDs are derived by the USEPA by dividing the NOAELs by uncertainty factorstypically ranging from 10 to 10,000 depending on the suitability and quality of the availabledatabase. RfDs that are sanctioned by the USEPA are called verified RfDs for oral exposureor reference concentrations (RfCs) for inhalation exposure. Table 5-3 presents the RfDs forthe COPCs in this RA. Although not directly used in this RA, the RfDs shown in Table 5-3
illustrate comparative and systemic toxicities of COPCs for the TALS. Target sites affectedby each COPC are shown in the table for oral exposures. The confidence value anduncertainty factors associated with the RfDs also are listed. The uncertainty factor representsa specific area of uncertainty inherent in the extrapolation from the available data. The
confidence levels (low, medium, high) assess the degree of confidence the USEPA has in theextrapolation of available data from animals to humans.
5.2.2 Carcinogenic Effects
Constituents are classified as known, probable, or possible human carcinogens basedon the USEPA weight-of-evidence scheme in which chemicals are systematically evaluated fortheir ability to cause cancer in humans or laboratory animals. The USEPA classificationscheme (USEPA 1989) contains six classes, based on the weight of available evidence, as
follows:
GERAGHTY & MILLER, INC.

5-7
A Known human carcinogen.
B1 Probable human carcinogen — limited evidence in humans.
B2 Probable human carcinogen — sufficient evidence in animals and
inadequate data in humans.
C Possible human carcinogen — limited evidence in animals.
D Inadequate evidence to classify.
E Evidence of non-carcinogenicity.
Constituents in Classes A, Bl, B2, and C generally are included in RAs as potentialhuman carcinogens; however, Class C carcinogens may be evaluated on a case-by-case basis(USEPA 1989).
The USEPA currently uses the linearized multistage model for extrapolating cancerrisk from high doses associated with occupational exposure or laboratory animal studies tolow doses typically associated with environmental exposures to humans. The model providesa 95 percent upper-bound estimate of cancer incidence at a given dose. The slope of theextrapolated curve, called the cancer slope factor (CSF), is used to calculate the probability ofcancer associated with the exposure dose.
CSFs are derived from the assumption that any dose level has a probability of causingcancer. The cumulative dose, regardless of the exposure period, determines the risk;
therefore, separate CSFs are not derived for subchronic and chronic exposure periods. Table
GERAGHTY & MILLER, INC.

5-8
5-4 presents the CSFs for the COPCs at the TALS. Although not utilized quantitatively in thisscreening RA, the information shown in Table 5-4 is useful from a comparative sense. Targetsites affected by carcinogens are also shown in Table 5-4 for the oral route. USEPA cancerclassifications for COPCs are also listed in Table 5-4.
5.2.3 Adult Lead Cleanup Model
The adult lead cleanup model was used to calculate an adult lead exposure value thatwas site-specific for the Site. The calculation and the model used, as well as the exposureparameters used in the calculation, are presented in Appendix O. Most of the defaultparameters presented by USEPA Region VI were used in the calculation. The site-specific
input parameters used were an exposure frequency of 28 days per year, and an assumed intakeof 12.5 milligrams per day (mg/d) for the soil ingestion and inhalation dust rates. Theseparameter values were assumed based on the most likely exposure scenarios (see Section 5.3).The calculated value was determined to be 36,000 (35,733 mg/kg).
5.3 EXPOSURE ASSESSMENT
An exposure pathway describes how a chemical constituent present at, or originatingfrom, a contaminated area can reach a receptor. A complete exposure pathway must containfive elements for an exposure to occur, because an incomplete exposure pathway will notresult in exposure. These elements include the following:
• A source.
• A mechanism of chemical release to the environment.
• An environmental transport medium for the released chemical.
GERAGHTY & MILLER, INC.

5-9
• A point of potential human contact with the medium and thereceptors located at these points.
• An uptake route involving intake of media containing COPCs at thepoint of exposure.
Only complete exposure pathways were evaluated in this screening RA becausewithout a complete pathway there is no risk.
5.3.1 Land Use
Evaluation of the land uses in the area of the TALS allows for the activities andactivity patterns of a given population to be defined. From this information, the potentially
exposed receptor population(s) and pathway(s) of exposure can be identified.
5.3.1.1 Property Location and Description
As previously discussed, the TALS is located in central Monroe County in the City of
Tomah, (City) Wisconsin. The TALS covers approximately 10 acres in the northeastern
section of the City (Figure 2-1). The TALS is bordered on the north by the City sewagetreatment plant facility; to the east by Mill Street and a residential area; to the south by ArthurStreet and a sand/gravel storage facility, and to the west by Woodard Avenue, whichseparates the TALS from open fields and an apartment building further to the west. The
Armory property is zoned light industrial but is located adjacent to residential areas.
The future land use for the TALS is expected to remain consistent with its current
light industrial zoning. In addition, restrictions to land use of closed landfills could be
GERAGHTY & MILLER. INC.

5-10
imposed under Chapter NR506.08 of the WAC. These restrictions would prohibitdevelopment from occurring on the filled area. The surrounding areas are expected to remainresidential/commercial.
5.3.2 Topographical Considerations
The TALS lies in the Lower Wisconsin River basin and the Little Lemonweir Riverwatershed. Nearby perennial surface water bodies include the south fork of the LemonweirRiver, approximately 300 feet to the north, and Lake Tomah located approximately 1 mile tothe southwest of the TALS. Surface drainage patterns at the TALS are to the north-northeasttoward the Lemonweir River. During the August 1995 site visit by Geraghty & Miller
personnel, surface water runoff was identified to be from the ARNG parking lots to the stormdrains that are located along the eastern property boundary. Also identified during the sitevisit was a drainage ditch located along the western property boundary. It is likely, therefore,that these ditches represent the locations where surface water runoff collects. It is notexpected that surface runoff will be a concern at the TALS considering topography,vegetation, and the nature and extent of contamination.
5.3.3 Potential Exposure Pathways and Receptors
Current land use varies over different areas of the filled area. Therefore, differentreceptors may be exposed at these areas. To accommodate this variability in receptors, thesite was divided into land parcels to be evaluated in the RA (see Section 5.1- Data Evaluation
and Figure 5-1). Receptors were selected for each of the areas based on the following
rationale:
ARNG Area - Based on the description presented in Section 5.1, the population of
potential receptors at the TALS would primarily be ARNG personnel, office workers, and
GERAGHTY & MILLER, INC.

5-11
maintenance workers. The two vehicle storage areas are fenced which would prevent easyaccess by trespassers. Most of the areas within the fenced vehicle storage areas are gravel-covered, while some portions are grass-covered (primarily around the periphery of the fencedareas). Some bare areas of soil also exist. Surface soil not covered by grass has the potentialto create an exposure route by emitting soil particulates that become airborne and could beinhaled.
Some portions of the ARNG area are paved, which would prevent surface soilexposures. The large grassy area in the western portion of the ARNG area is lustily coveredwith grass. Although a grass cover alone will not prevent an exposure from occurring, it canreduce surface soil emissions and potential dermal contact and ingestion exposure. Also,because none of the COPCs are VOCs, ARNG personnel would not be expected to beexposed.
Therefore, the most likely receptor would be a maintenance worker mowing the lawn.Wisconsin has long winters, and snow is likely to cover the ground from mid-Novemberthrough early April. Therefore, the lawn maintenance season would last approximately 7months. It is assumed that the grass would be mowed once a week, and the exposurefrequency for the lawn maintenance person would be 28 days per year. This exposurefrequency is considerably less than what would be encountered under a typical industrial
worker scenario (i.e, 250 days per year).
Museum and Trespasser Areas - The lawn portion of this area is lushly covered withgrass. The museum property is not fenced. Receptors in this area could include visitors to themuseum, museum personnel, and maintenance workers. Using the same rationale as for theARNG area, it is assumed that the most likely receptor in this area would also be amaintenance worker mowing the lawn. However, unlike the ARNG area, trespassers could
have easy access to the museum area and to the area that is located to the west of Woodard
GERAGHTY & MILLER. INC.

5-12
Avenue. It was assumed that the most likely trespasser receptor for exposure in these areaswould be a child, 6 to IS years old. The frequency of trespassing was assumed to be once aweek from mid-April to mid-November equaling 28 days per year.
Sewage Treatment Plant Area - This area is the sewage treatment plant for the City. Itis completely fenced, restricting easy access. Therefore, it is assumed the potential receptorsin this area would be sewage treatment plant workers. However, the most likely of thesereceptors would be a maintenance person mowing the lawn. Additionally, it is assumed thatthis worker would also mow the area outside of the fenced area to the west of the plant.Exposure frequencies would be assumed to be the same as for the Museum and ARNG areas.
Subsurface Soil Receptors - As previously mentioned, the subsurface area was brokenup into two exposure evaluation areas, the Armory area and the Museum area (see
Section 5.1). For a future hypothetical scenario, construction activities would be the only
exposure scenario for these two areas, and the most likely receptor to the subsurface soilwould be a future hypothetical construction worker. No other receptors to subsurface soil areanticipated at the TALS.
5.3.4 Site Conceptual Exposure Model
The site conceptual exposure model (SCEM) is a tool used to obtain an understanding ofsite exposure pathway dynamics and illustrates a summary of the exposure media, receptors, andcomplete exposure pathways to be evaluated in the RA The SCEM depicts the potential sourcesof COPCs, chemical release and transport mechanisms, affected media, known and potential routesof migration, and potential human and ecological receptor populations. Based on the informationpresented in Sections 5.1 through 5.3, a SCEM for the TALS is presented on Figure 5-1.
GERAGHTY & MILLER. INC.

5-13
The SCEM shows that for the TALS, the chemical source is soil affected by pastlandfilling activities; the primary mechanism of chemical release to the environment is mowinggrass that may disrupt the surface soil, a child playing on the grass and digging at the surfacesoil, or a construction/excavation worker scenario that would disrupt subsurface soils; theenvironmental transport medium for the released COPCs would most likely be particulates ordirect contact with soil; the point of potential human contact with the medium and thereceptors located at these points would be the soil while an adult is mowing the grass, while achild is playing on the grass and in the soil, or during a construction/excavation scenario; theexposure routes most likely to have an impact are soil ingestion, dermal contact, and soilpaniculate inhalation.
5.3.5 Summary
In summary, the most likely receptors and complete exposure pathways at this site for
current exposures to surficial soils were identified as follows:
• The on-site maintenance worker for a grass-mowing scenario (ARNG, museum,
sewage treatment plant areas).
• A trespasser (i.e., a child of 6 to IS years old) playing on the grass and digging inthe soils (Trespasser area).
For a hypothetical future exposure of the subsurface soil, the most likely receptor andcomplete exposure pathway was identified as follows:
• An on-site construction worker excavating the soil (museum and ARNG areas).
GERAGHTY & MILLER, INC.

5-14
5.4 RISK CHARACTERIZATION
For this screening RA, the potential for risk to human health was evaluated by utilizing
a conservative, semi-quantitative screening methodology. COPCs and EPCs for surface andsubsurface soils were compared to background concentrations, RBCs, and SSLs forresidential and industrial soils, and a calculated industrial value for lead (36,000 mg/kg), basedon the adult lead cleanup model. The RBCs and SSLs are guidelines developed for soilingestion and/or particulate or vapor inhalation from soils.
5.4.1 Results
5.4.1.1 Surface Soil
The results of the surface soil evaluations for the Museum area, Armory area, Sewageplant area, and the Trespasser area are presented on Table 5-5. This table summarizes thecomparison of the EPCs to background concentrations, RBCs, SSLs, and the calculated adultlead cleanup level. Because of the type of activities that occur at the Museum, Armory, and
Sewage Treatment Plant exposure evaluation areas, surficial soil EPCs for the COPCs werecompared to industrial value guidelines and only to residential value guidelines if industrial
values were not available for a given COPC. For the Trespasser area comparisons, residentialvalues were used.
For the Museum, Armory, and Sewage Treatment Plant exposure evaluation areas, theEPC for both benzo(a)pyrene (0.72 mg/kg) and lead (260 mg/kg) exceeded the backgroundconcentrations of 0.067 mg/kg for benzo(a)pyrene and 36 mg/kg for lead. However, in
comparison to the RBC for industrial soil ingestion, the benzo(a)pyrene EPC for all areas fellbelow the acceptable excess lifetime cancer risk (ELCR) level of 10"6 (0.78 mg/kg).
Additionally, for all exposure evaluation areas, the lead EPCs are considerably below the
GERAGHTY & MILLER. INC.
5-15
calculated adult lead cleanup level of 36,000 mg/kg. Benzo(a)pyrene concentrations do notexceed the SSL for constituent transfer of soil to air for a residential scenario (11 mg/kg) forall three exposure evaluation areas.
For the Trespasser area, the EPC for both benzo(a)pyrene (0.49 mg/kg) and lead(190 mg/kg) exceed background concentrations. However, in comparison to the RBC forresidential soil ingestion, the benzo(a)pyrene EPC lies between the Iff6 (0.088 mg/kg) and10"5 (0.88 mg/kg) ELCR levels. The EPC for benzo(a)pyrene (0.49 mg/kg) does not exceedthe SSL transfer from soil to air value (11 mg/kg). The lead EPC (190 mg/kg) is considerablybelow the lead residential SSL for soil ingestion (400 mg/kg).
Data from all 38 surface soil sampling locations were also combined to calculate anEPC to assess a conservative hypothetical future scenario (one receptor for either industrial orresidential exposure). The EPC for benzo(a)pyrene was calculated to be 0.4 mg/kg, the EPCand for lead was 79 mg/kg. The lead value fell below the adult industrial lead cleanup level of36,000 mg/kg and the residential SSL of 400 mg/kg for a child. The EPC value forbenzo(a)pyrene fell between the acceptable residential ELCR levels of 10"* (0.088 mg/kg) andlO'5 (0.88 mg/kg) and the industrial ELCR levels of W6 (0.78 mg/kg) and 10'5 (7.8 mg/kg).
5.4.1.2 Subsurface Soil
The results of the subsurface soil comparisons to risk-based guidelines are presentedon Table 5-6. This table summarizes the comparison of the EPCs to backgroundconcentrations, RBCs, SSLs, and the calculated adult lead cleanup value. Of all inorganicsevaluated for the subsurface soils (arsenic, barium, beryllium, chromium, lead, manganese,nickel, and thallium), the only EPC that does not exceed background concentrations isthallium. Therefore, thallium was not further evaluated. Of the remaining inorganic COPCs,
GERAGHTY & MILLER, INC.

5-16
arsenic, beryllium, chromium (conservatively assumed to be in the +VI state) and nickel (asrefinery dust) are carcinogens. Chromium and nickel are carcinogens via inhalation.
At the Armory area, benzo(a)pyrene, beryllium, and chromium EPCs fell below theupper-bound (10"*) acceptable ELCR levels for industrial exposures. The arsenic EPC(8.8. mg/kg) fell between the acceptable industrial ELCR levels of 10"* (3.8 mg/kg) and 10'5
(38 mg/kg). None of the inorganics exceeded their respective RBCs for noncarcinogeniceffects or the SSLs for transfer from soil to air.
At the Museum area, benzo(a)pyrene, beryllium, and chromium EPCs fell below theupper-bound (10"6) acceptable ELCR levels for industrial exposures. The arsenic EPC(21 mg/kg) fell between the acceptable industrial ELCR levels of 10"* (3.8 mg/kg) and 10'5
(38 mg/kg). Additionally, the 4,060 mg/kg lead concentration fell considerably below the site-specific RBC (calculated using USEPA's adult lead cleanup model) of 36,000 mg/kg. None ofthe inorganics exceeded their respective RBCs for noncarcinogenic effects or the SSLs fortransfer from soil to air
5.4.2 Conclusions
Land use varies over of the landfilled area; i.e, light industrial, commercial, andresidential. Future land use at this TALS is anticipated to remain the same. Because of thedifferent land uses, the potential exists for different receptors to be exposed. Therefore, thesurface soil was evaluated by dividing the site into four exposure evaluation areas. These
areas include the Museum area, Armory area, Sewage Treatment Plant area, and theTrespasser area. The most likely receptor identified for the Museum, Armory, and SewageTreatment plant areas was determined to be a maintenance worker mowing the lawn. For theTrespasser area it was assumed that a child, 6 to 15 years old, would be the most likely
GERAGHTY & MILLER, INC. O
5-17
receptor. The surface soil for the entire TALS was also evaluated for a future scenario, withthe likely receptor being a hypothetical maintenance worker mowing the entire area.
Additionally, the subsurface soil data set was broken up into two exposure evaluationareas, the Armory area and the Museum area. The most likely receptor to the subsurface soilwould be a future hypothetical construction worker. No other receptors to subsurface soil areanticipated at the TALS.
EPCs for surficial and subsurface soil COPCs, with the exception of lead, werecompared to background concentrations and guideline values (RBCs and SSLs) for residential
and industrial soils. Lead concentrations were compared to a value calculated for lead basedon the adult lead cleanup model (USEPA 1994e). All COPC fell below guideline values fornoncarcinogenic effects, or fell below or within the acceptable ELCR levels for carcinogens.Furthermore, the high lead level detected in the museum area (4060 mg/kg) did not exceed thecalculated adult lead cleanup value of 36,000 mg/kg for an industrial exposure. It should alsobe noted that the guidelines used to compare with COPCs at this site are based onconservative exposure assumptions relative to the assumptions made for the most likely
receptors at the TALS. In particular, the exposure frequencies used in the guidelines assumea frequency of 250 days per year for an industrial setting and 350 days per year for a
residential setting. Based on site-specific conditions, it was assumed that the most probableexposure frequency for the mower and trespasser receptors would only be 28 days per year.Consequently, the guideline values used for soil ingestion and paniculate inhalation in this
assessment are overly conservative when applied to the TALS.
The RBCs and SSLs do not account for dermal contact exposure. For most
inorganics, dermal contact is not the most important exposure route as far as causing adversehealth effects, because inorganics do not readily absorb through the skin. Therefore, dermal
contact exposure is usually the less significant exposure route relative to soil ingestion (e.g.,
GERAGHTY & MILLER, INC

5-18
arsenic) or the inhalation of participates for inorganics (e.g., chromium +V1). Therefore, anycontribution to potential risk at this site from dermal contact with inorganics would beinsignificant in comparison to the ingestion or inhalation exposure routes. However, for mostpolynuclear aromatic hydrocarbons (PAHs), including benzo(a)pyrene, carcinogenesis can beinduced at the point of exposure. Because benzo(a)pyrene is the only carcinogenic COPC atthis site where dermal contact may be an issue, and the concentrations detected are low, it isnot anticipated that the risk contribution from dermal contact exposure would significantlyadd to the total risk due to exposure to benzo(a)pyrene through soil ingestion or paniculateinhalation.
Additionally, it is not expected that surface runoff will be a concern considering thelimited nature and extent of contamination of soils at the TALS.
Based on this assessment, a condition of no significant risk to human health has been
concluded for current and future conditions due to soil exposure at the TALS.
5.5 UNCERTAINTY AND LIMITATIONS
The quality of the available data and the completeness of information about existing
conditions and future circumstances, as well as other factors discussed below, contribute touncertainties and limitations at the TALS. This section discusses the uncertainties andlimitations associated with this screening level RA.
The uncertainties and limitations of this RA can be classified in the followingcategories:
• Sampling and analysis.
GERAGHTY & MILLER, INC.

5-19
• Exposure assessment.
5.5.1 Sampling and Analysis
Data evaluated for use in this human health RA included all appropriate and relevantavailable data. It is assumed that samples collected were representative of actual conditions.However, subsurface soil data for the TALS was limited. To account for the uncertainty ofthe small sample set (i.e., determining the upper bound of the EPCs), the UCL was calculatedfor the COPCs (this is discussed in Section 5.5.2). There are also uncertainties associatedwith the precision and accuracy of laboratory analyses. These uncertainties are random andmay lead to an over- or under-estimation of risks.
5.5.2 Exposure Assessment
RAs require assumptions to assess potential human exposure. This risk assessmentincludes assumptions about general characteristics and potential patterns of human exposureof the populations at the TALS which were based on the guidance provided in the USEP ARisk Assessment Guidance (USEPA 1989), and on site-specific information and professionaljudgment.
In this RA, the UCL estimates were used to provide some measure of the potential"reasonable maximum" exposures and were developed to provide an upper bound onexposure. Because UCL estimates are based on a combination of conservative assumptions,the estimates are unlikely to reflect exposures that could be encountered on the TALS,
especially if institutional controls such as fencing or deed restrictions would be utilized.
Additionally, the conservativeness concerning the assumptions used in the calculations
of the RBCs, SSLs, and the adult lead cleanup value must also be considered.
GERAGHTY & MILLER, INC.
5-20
RBCs are basically the values of RAs run in reverse. For a single contaminant in asingle medium, under standard default exposure assumptions, the RBC corresponds to theELCR of 10"6 or the hazard quotient of 1 for noncarcinogens. For the TALS, residential andindustrial RBCs or SSLs were used. The residential soil ingestion RBC for benzo(a)pyrene, acarcinogen, is based on combined childhood and adult exposure. It assumes that a person isexposed over a 30-year period for 350 days per year. Noncarcinogenic RBCs are based onchildhood exposure only (1 to 6 year olds) for 350 days per year. Clearly, these conservativeexposure parameters are not applicable for a trespasser scenario for the TALS.
The industrial soil ingestion RBC for benzo(a)pyrene and the inorganic COPCs are
based on adult occupational exposure, including the assumption that 50 percent of total soil
ingestion is work-related (i.e., 50 milligrams per day). Additionally, the RBC assumes anexposure frequency of 250 days per year for an exposure duration of 25 years. Therefore, theRBC calculated for an exposure frequency of 250 days per year at 50 milligrams per day (e.g.,for a construction worker) would overestimate intake in comparison to the types of activities
anticipated to occur at this Site (i.e., mowing the lawn for 28 days per year with a low
potential of exposure to soil). Subsurface soil exposure is not expected to occur and, even ifit would, it would be of a short duration (i.e., 3 to 6 months) not 25 years.
Soil screening levels have been developed for the ingestion and inhalation exposureroutes for a residential scenario based on an ELCR of 10"6 or a hazard quotient of 1. Even
though these values are not directly applicable, they serve as a form of evaluation with thereasoning that if COPCs fall below the residential values they will also be protective of acommercial/industrial exposure scenario and a child trespasser scenario.
The soil ingestion SSLs are also calculated based on conservative exposure
assumptions. That is, carcinogens are evaluated by using an exposure frequency of 350 days
GERAGHTY& MILLER, INC.

5-21
per year for a duration of 30 years for an adult; and noncarcinogenic constituents SSLs arecalculated for a child ingesting 200 milligrams per day of soil at an exposure frequency of 350days per year for 6 years. Inhalation SSLs are calculated based on conservative exposureassumptions for adults using an exposure frequency of 350 days per year for a duration of 30years. These guidance values overestimate intake in comparison to what a child could beexposed to at the TALS. Therefore, the risk-based conclusion for the TALS is based on
conservative assumptions.
GERAGHTY & MILLER, INC

6. VOLUNTARY ACTION AGREEMENT
Based on review of the draft RI Report and results of the Screening Risk Assessment(Section 5.0), the State of Wisconsin has agreed with the U.S. EPA and WDNR to pursuecertain voluntary actions at the TALS. Those voluntary actions are detailed in a letter fromCharles R. Larsen (Wisconsin DOJ) to Matthew J. Mankowski (USEPA) dated August 1,1996. (See RI Report transmittal letter).
The following sections examine applicable or relevant and appropriate requirements(ARARs) for these voluntary actions and examine the expected effects of the actions at theTALS.
GERAGHTY & MILLER, INC.

7. SCREENING OF APPLICABLE OR RELEVANT AND APPROPRIATE
REQUIREMENTS (ARARS)
ARARs of environmental laws applicable to the agreed upon voluntary actions for thelandfilled area have been reviewed. The ARARs found to be pertinent are subdivided intothree categories:
7.1 CHEMICAL-SPECIFIC ARARS
Chemical-specific ARARs are usually technology- or risk-based numerical limitationsor methodologies, that, when applied to site-specific conditions, result in the establishment of
acceptable concentrations of a chemical that may be found in or discharged to the ambientenvironment (USEPA 1991). Chemical specific ARARs have been examined for soil.ARARs for groundwater were not examined as groundwater quality has not been affected by
landfill activities.
Potential ARARs for soil are listed in Table 7-1. Standards are listed for the twoindicator constituents in residential and industrial settings.
7.2 LOCATION-SPECIFIC ARARS
Location-specific ARARs are the restrictions placed on the concentration of hazardoussubstances or the conduct of activities solely because they are in special locations(USEPA 1991). The following location specific ARARs were examined for the TALS.
• Floodplains: Federal Emergency Management Agency (FEMA) floodplainmaps were consulted to determine whether the TALS was part of theLemonweir River 100-year floodplain. The maps indicate that the northern
part of the TALS is part of the floodplain. The areas of the TALS within 100-
GERAGHTY & MILLER. INC
7-2
year and 500 year floodplains are illustrated in Figure 6-1. Supportingdocuments for the floodplain determinations are presented in Appendix P.
• Wetland: A review of WDNR wetland inventory maps was carried out toascertain whether the TALS contained wetlands. The maps indicated that theTALS contained a single wetland of less than 2 acres (Figure 6-1). CFR 330.4and 33 CFR 330.5 provide allowances for remedial activities which may impactwetlands that are incorporated into CERCLA remedial actions.
• Inquiries were made of the Bureau of Endangered Resources and theWisconsin State Historical Society. The Bureau of Endangered Resources
indicated there are no records of endangered, threatened, or special concern
species or natural communities within a 1 mile radius of the site. TheHistorical Society indicated that there are not historic places or properties inthe area of the TALS. See Appendix Q.
7.3 ACTION - SPECIFIC ARARS
Action-specific ARARs are usually technology- or activity-based requirements orlimitations on actions taken with respect to hazardous substances (USEPA 1991). Action-specific ARARs have been examined for the agreed upon voluntary actions for the TALS.
Agreed upon voluntary actions at the TALS include the following:
• No Action for groundwater.
• Institutional Controls in the form of a deed restriction for buried waste.
• A barrier in the form of a soil cover for filled areas at the museum property.
GERAGHTY & MILLER, INC.
7-3
• Excavation and disposal of the filled areas on the property west of WoodardAvenue.
ARARs are listed with comments in Table 7-2. Although certain hazardous wastelandfill requirements are often considered as ARARs at NPL sites, the TALS was a solid wastelandfill, thus making hazardous waste regulations overly protective as ARARs.
GERAGHTY & MILLER. INC

8. SCREENING OF AGREED-UPON VOLUNTARY ACTIONS
The purpose of this section is to screen agreed upon voluntary actions for theirexpected effects at the TALS. This section summarizes and discusses the agreed upon actionsfor targeted areas. Voluntary actions include (1) No Action for groundwater; (2) InstitutionalControls in the form of a deed restriction for buried waste; (3) A barrier in the form of a soilcover for filled areas at the museum property in the Museum area; and (4) Excavation anddisposal of the filled area on the property west of Woodard Avenue.
8.1 ALTERNATIVE 1 - GROUNDWATER
Based on the results of field data (Section S.O), no further action is required forgroundwater at the TALS as it is unaffected by the fill. Results of the Phase II RI indicatethat surface soils over the filled area are affected to a limited degree by chemical constituentsfrom historical disposal activities. The screening RA confirmed that, based on reasonableexposure scenarios, no action is required for groundwater of the TALS.
8.2 ALTERNATIVE 2 - INSTITUTIONAL - DEED RESTRICTION
Risk from exposure to chemical hazards in surface and subsurface soils was not foundto be present above human health screening levels. However the state has agreed to endeavor
to place institutional controls on areas of buried waste left in place if owner concurrence canbe obtained. These institutional controls could limit access and reduce exposure to potentialphysical nuisance hazards such as exhumed debris.
8.3 ALTERNATIVE 3 - BARRIER - SOIL COVER
Based on the voluntary action agreement the undeveloped portion of the museumproperty is a candidate for an augmented soil cover. Physical nuisance contact would be
GERAGHTY & MILLER, INC.

8-2
minimized or eliminated by the placement of soil cover. The cover could be seeded with grassto minimize soil erosion. Owner concurrence will be required.
8.4 ALTERNATIVE 4-REMOVAL AND DISPOSAL
Excavation and disposal of soil and waste from the TALS area west of WoodardAvenue has been agreed to as a voluntary action. Based on the RI soil analytical results andas confirmed in discussions with the WDNR, excavated fill from these areas can be disposedas a solid (nonhazardous) waste. Excavation will be conducted in limited areas where currentor future land use is inconsistent with leaving landfilled material in place.
GERAGHTY & MILLER, INC.

9. CONCLUSIONS
The Phase n RI results support the following conclusions:
Limits of fill have been defined and are as shown on Figure 4-3. Based on these limitsof fill the "Tomah Armory Landfill Site" includes more land area than is owned by the Stateand more than originally defined as the site in the AOC. The filled area extends ontoproperties owned by three other persons or entities: The City of Tomah, the Harris AlienTelecommunications Museum, and Mr. David Filkens for the property to the west of
Woodard Avenue.
Groundwater at the TALS is apparently unaffected by chemical constituents from the
fill. This conclusion is based on the higher chemical constituent concentrations identified in
monitoring wells located hydraulically upgradient of the filled area.
The landfill cover soil (i.e., surface soil) has been affected by chemical constituents ofthe underlying fill in limited areas. Specifically notable levels of lead have been detected in the
subsurface soil near the Museum area. Additionally, fill material is exposed in certain limitedareas, and in these areas, physical nuisance hazards (e.g. pottery scraps, metal, etc.) exist.
From time to time nuisance material may also work its way through the soil cover.
Future land use for the TALS is expected to remain consistent with its current light
industrial zoning, and the surrounding areas of the site are expected to remain
residential/commercial. Additionally, restrictions on land use of closed landfills as imposedunder Chapter NR506.08 of the WAC have been incorporated into a voluntary actionagreement by the state. These restrictions would restrict development on the filled area.
Using the agreed upon voluntary institutional controls to prevent exposure toconstituents in the soils is a conservative (i.e., protective) action, because even with current
GERAGHTY & MILLER, INC. O

9-2
land use scenarios and at existing contaminant levels, adverse health effects are not expectedto occur to an industrial receptor or to a residential trespassing child.
A limited area west of Woodard Avenue has been targeted for a voluntary excavationand disposal of fill materials pending owner concurrence.
GERAGHTY & MILLER, INC

10. RECOMMENDATIONS
The following recommendations for the filled area have been developed based on theresults of the Phase II RI, RA, ARARs, and the state voluntary action agreement.Recommendations for remedial action include the following:
• Take no action on groundwater because no impact can be attributed to thelandfill.
• Voluntarily implement institutional controls (i.e., deed restriction as perChapter NR 506 of the WAC) to limit fixture development and subsurfaceaccess to areas where landfilled material remains in place.
• Voluntarily take action to limit access to, or remove exposed material and
debris. This recommended act'.on includes (1) cover of areas where physicalnuisance hazards are evident; (2) excavation of limited areas where cover or
institutional controls are impractical.
\vidptadm\wi0486\phaseii\reports\phiiri.doc
GERAGHTY & MILLER. INC.

11. REFERENCES
Argonne National Laboratory, 1993, Environmental Research Division, Field Notes: TomahArmory, Installation 55340, Tomah, Wisconsin. August 1993.
Domenico & Schwartz, 1990, Physical and Chemical Hydrogeology, John Wiley & Sons, Inc.,New York, New York, 824 pp.
Geraghty & Miller, Inc., 1995. Phase n Remedial Investigation Work Plan, Tomah ArmorySuperfund Site, Tomah, Wisconsin.
USEPA 1987. Data Quality Objectives for Remedial Response Activities. OSWER Directive9335.0-7B. (Also called DQO Guidance.) USEPA, Washington, D.C.
USEPA 1989. Risk Assessment Guidance for Superfund, Volume I, Human HealthEvaluation Manual (Part A), Interim Final. Office of Emergency and RemedialResponse, Washington, D.C., EPA/540/1-89/002.
USEPA 1991. Conducting Remedial Investigations/Feasibility Studies for CERCLA MunicipalLandfill Sites. February 1991.
USEPA 1992. Supplemental Guidance to RAGS: Calculating the Concentration Term. Officeof Solid Waste and Emergency Response., Pub. 9285.7-081.
USEPA 1994a. Phase I Remedial Investigation (RT) Report Tomah Armory and TomahFairgrounds Landfills, Monroe County, Wisconsin, Revision 2. December 1994.
USEPA 1994b. Functional Guidelines for Evaluation Inorganics Analysis.
USEPA 1994c. Functional Guidelines for Evaluation Organic Analysis.
USEPA 1994d. Soil Screening Guidance. Office of Solid Waste and Emergency Response.EPA/540/R-94/101.
USEPA, 1994e. Draft Superfund Guidance. Adult Lead Cleanup Level. Region VI.
USEPA 1995a. Statement of Work for Continuing Remedial Investigation Activities andConducting a Feasibility Study at the Tomah Armory Landfill Site, Monroe County,Wisconsin. July 1995.
USEPA 1995b. Health Effects Assessment Summary Tables (HEAST). Office of SolidWaste and Emergency Response. OERR 9200.6-303.
GERAGHTY & MILLER, INC.

11-2
USEPA 1996a. Memorandum, Risk-Based Concentration Table. Region III.
USEPA 1996b. Integrated Risk Information System (IRIS). On-line.
USEPA Field Inspection Team, 1984. Site Inspection Report. August 1984.
USEPA Field Inspection Team, 1985. Hazard Ranking System Report. July 1985.
WDNR1976. Sanitary Landfill Abandonment Plan.
WDNR1993. Lower Wisconsin River Basin Water Quality Management Plan.
Wisconsin Department of Public Health, 1988. Preliminary Health Assessment.
\vidptadm\wi0486\phaseii\reports\phiiri.cloc
GERAGHTY& MILLER, INC.

03mCO
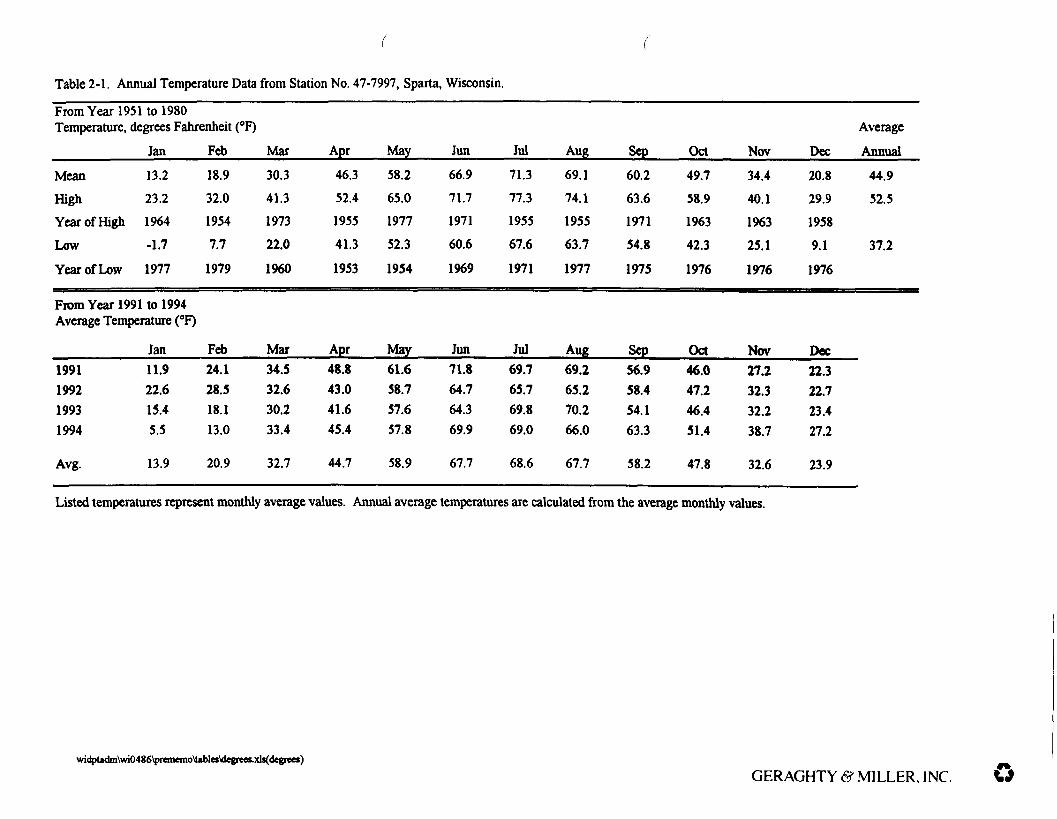
Table 2-1. Annual Temperature Data from Station No. 47-7997, Sparta, Wisconsin.
From Year 1951 to 1980Temperature, degrees Fahrenheit (°F)
JanMean 13.2High 23.2Year of High 1964Low -1.7Year of Low 1977
From Year 1991 to 1994Average Temperature (°F)
Jan1991 11.91992 22.61993 15.41994 5.5
Avg. 13.9
Feb18.932.019547.7
1979
Feb24.128.518.113.0
20.9
Mar30.341.3197322.0
1960
Mar34.532.630.233.4
32.7
Apr46.352.4195541.3
1953
Apr48.843.041.645.4
44.7
May58.265.0197752.3
1954
May61.658.757.657.8
58.9
Jun66.971.7197160.61969
Jun71.864.764.369.9
67.7
Jul
71.377.3195567.6
1971
Jul69.765.769.869.0
68.6
Aug
69.174.1195563.7
1977
Aug69.265.270.266.0
67.7
Sep60.263.6197154.8
1975
Sep56.958.454.163.3
58.2
Oct49.758.9196342.3
1976
Oct46.047.246.451.4
47.8
NOT34.440.1196325.1
1976
Nov27.232.332.238.7
32.6
Dec20.829.91958
9.1
1976
Dec22.322.723.427.2
23.9
AverageAnnual
44.952.5
37.2
Listed temperatures represent monthly average values. Annual average temperatures are calculated from the average monthly values.
widpUdm\wi0486\prememo\tablesVdegrees.xl9(<legrees)GERAGHTY & MILLER, INC.

Table 2-2. Annual Precipitation Data from Station No. 47-7997, Sparta, Wisconsin.
Averages: 1975-1994Total Precipitation, Inches (in.)
MeanHigh-YearLow-Year
Jan0.671.96
19800.00
Feb0.702.6019850.00
1987/88 1988/90/91/93
Mar1.784.1919770.311978
Apr3.436.9919941.541979
May3.926.7619931.481981
Jun3.799.5919931.491983
Jul4.939.4819782.031976
Aug4.5912.4319800.861976
Sep4.569.0119920.331979
Oct2.224.1019840.331992
Nov2.654.8419820.031976
Dec1.002.9619820.001989
Annual2.856.24
0.70
From Year 1990 to 1994Total
19901991199219931994Avg.
Precipitation (in.)JanNANA
0.12NANA
0.024
Feb0.000.000.680.000.470.23
Mar2.762.551.640.650.49
1.618
AprNA3.994.633.116.99
3.744
May5.375.842.056.761.96
4.396
Jun6.951.692.269.594.35
4.968
JulNA5.713.845.145.50
4.038
Aug8.892.923.714.374.234.82
SepNA5.039.012.038.985.01
Oct2.452.320.331.922.07
1.818
Nov1.194.514.750.942.49
2.776
DecNA0.871.601.060.520.81
NA Not Available
widptadm\wi0486\prememo\tables\precip2.xlsws
GERAGHTY & MILLER, INC.

Table 2-3. Domestic, Municipal, and Industrial Water Supply Wells Within a 2-mile Radius of the Tomah Armory Landfill Site, Tomah, Wisconsin.Page 1 of 2
Owner
Thomas SchmidtAl SimonsonLeRoy BjerkeSteve WilderDave OlsonLudwig Carl OlsonMr. HenryLynette MartinHoward BloomJesse SchultzTed MoskonasRobert StolmanMr. WendorfMarlen MartinMartha AlienStan ZdrojowyRobert JacksonLowel HuntTomah Fair AssociationRay MadisonForest MasonMerle ClayLewis MizeDonald AndersonJoseph BubnickPaul WegnerMargaret MurryEugene OverbySouth Side Lumber Co.William FannerJess SchultzGolden Garber Night ClubRobert Boehm
WellNo.*
123456789101112131415161718192021222324252627282930313233
ApproximateAddress
R2, Tomah, WIR2,TomahAWITomah, WIRR1, Tomah, WINorwalk, WIRl, Tomah, WITomah, WIRl Box 451, Tomah, WIR2, Tomah, WIR2, Tomah, WITomah, WITomah, WITomah, WIRR4, Tomah, WIRo^Tomah, WIR4,Box449,TomahtWIRR1, Tomah, WIRl, Tomah, WITomah, WITomah, WIRl, Tomah, WITomah, WIRl, Tomah, WIRl, Tomah, WITomah, WIRL Tomah, WITomah, WITomah, WITomah, WIR2, Tomah, WITomah, WIR3jromah,WIRR1, Tomah, WI
Township,and Section
T18N, R1W, S32 - ME 1/4 OF SE 1/4T18N, R1W, S32 - NE 1/4 OF SW 1/4T18N, R1W, S32 - SW 1/4 OF SW 1/4T18N.R1W.S32-NW1/4T18N, Rl W, S32 - SE 1/4 OF NW 1/4T18N, R1W, S33 - SW 1/4 OF NW 1/4T18N, R1W, S32-NE1/4T18N, R1W, S33 - NW 1/4 OFNW 1/4T18N, Rl Wt S33 - NW 1/4 OF NW 1/4T18N, Rl W, S33 - NW 1/4 OF NW 1/4T18N, R1W, S33 - NE 1/4 OF NW 1/4T18N, Rl W, S35 - SW 1/4 OF SE 1/4T17N, R1W, S10 - NW 1/4 OFNW 1/4T17N, R1W, S3 - SE 1/4 OF SW 1/4T18N, R1W, S34 - NE 1/4 OF NW 1/4T18N, Rl W, S33 - SE 1/4 OF NW 1/4T18N, R1W, S29 - SE 1/4 OF NE 1/4T18N, R1W, S29 - NE 1/4 OF NEW 1/4T17N, R1W, S5 - SE 1/4 OF SE 1/4T18N, R1W, S22 - NW 1/4 OF SW 1/4T18N, R1W, S28 - SW 1/4 OF NE 1/4T18N, R1W, S29 - NE 1/4 OF SW 1/4T18N. R1W, S28 - NW 1/4 OF NW 1/4T18N, R1W, S28 - NW 1/4 OF SW 1/4T18N, R1W, S28 - SE 1/4 OF NW 1/4T18N, Rl W, S28 - NE 1/4 OF NW 1/4T18N, Rl W, S28 - NE 1/4 OF NW 1/4T18N, Rl W, S28 - SW 1/4 OF SE 1/4T17N, R1W, S5 - NW 1/4 OF NE 1/4T17N, R1W, S5 - NW 1/4 OF NE 1/4T17N, R1W, S3 - SE 1/4 OF SE 1/4T17N, R1W, S2 - SW 1/4 OF SW 1/4T18N, R1W. S29 - SE 1/4 OF SW 1/4
WellDepth
(ft)
55606061606075507080684010536080507050140145709560907070506080100586560
ScreenedInterval
(ft)
OpenOpenOpenOpenOpenOpenOpenOpenOpenOpenOpenOpenOpenOpenOpenOpenOpenOpenOpenOpenOpenOpenOpenOpenOpenOpenOpenOpenOpenOpenOpenOpenOpen
WellType
CCCCCCCCCCCCCCCCCCCCCCCCCCCCCCCCC
WellUse
DomesticDomesticDomesticDomesticDomesticDomesticDomesticDomesticDomesticDomesticDomesticDomesticIndustrialDomesticDomesticDomesticDomesticDomesticIndustrialIndustrialDomesticDomesticDomesticDomesticIndustrialIndustrialDomesticDomesticDomesticDomesticDomesticIndustrialDomestic
GERAGHTY & MILLER, INC.

Table 2-3. Domestic, Municipal, and Industrial Water Supply Wells Within a 2-mile Radius of the Tomah Armory Landfill Site, Toman, Wisconsin.Page 2 of 2
OwnerCity of Tomah (No. 8)C&R ConstructionThomas PoppVanpak Products, Inc.Gale AldermanValeria WacvnskiRex WorthingtonC&R ConstnictionGary WagnerMrs. George RitterJohn PleussCity of Tomah (East Well)City of Tomah (Standby East Well)City of Tomah (West Well)City of Tomah (South Well)City of Tomah (North Well)Veterans Administration (No. 1)Veterans Administration (No. 2)Veterans Administration (No. 3)Veterans Administration (No. 4)Tom PleussFrank BialekWilder Design HomesLinda JohnsonRickRadcliff
WellNo.*34353637383940414243444546474849505152535455565758
ApproximateAddress
McAdams Drive, Lot 9 7 10R2, Tomah, WITomah, WI501 WilliamsR4, Tomah, WITomah, WIR3, Tomah, WIR2, Tomah, WIRR1 Box 96, Tomah, WIR4, Tomah, WITomah, WIInt. of Juneau St. & East Ave.200 ft NE of East Well (No. 45)1 Blk W. of Hollister near PackardHoward St., W. of Superior Ave.Harrison St., at BallparkTomah VA HospitalTomah VA HospitalTomah VA HospitalTomah VA HospitalRR1, Tomah, WITomah, WITomah, WIRR1, Tomah, WIRl, Box 446, Tomah, WI
Township,and Section
T17NJUW^S9 - SE 1/4 OF NW 1/4T18N, R1W, S29 - SW 1/4 OF NW 1/4T18NJUW..S29-NE1/4T17N, Rl W, S4 - N 1/2 OF NW 1/4T17N, Rl W, S5 - NW 1/4 OF SW 1/4THN.RlW^Se-NElMT17N, R1W, S2 - SW 1/4 OF SW 1/4T18N, R1W, S29 - SW 1/4 OF NW 1/4T18N, Rl W, S29 - NE 1/4 OF NE 1/4T18N.R1W, S30-SE1/4T18N, Rl W, S32 - NE 1/4 OF NE 1/4T17N.R1W, S4-SE 1/4T17N, R1W, S4 - SE 1/4T17N,RlW,S4-NWl/4T17N.R1W, S9-NW1/4T18N, R1W, S33 - SE 1/4T18N, R1W, S27 - SW 1/4T18N, R1W, S27 - SW 1/4T18NJUWJS27 - SW 1/4T18N, R1W^S27 - SW 1/4T18N, R1W, S32-NE 1/4T18N, R1W, S32-NE 1/4T18N.R1W.S32-SE1/4T18NJUE, S33-SW 1/4 OF NW 1/4T18N, R1W, S33-NW 1/4
WellDepth
(ft)2477060154507566705015565252NA33028232025125624134960185857082
ScreenedInterval
(ft)OpenOpenOpenOpenOpenOpenOpenOpenOpenOpenOpenOpenNA
OpenOpenOpenOpenOpenOpenOpenOpenOpenOpenOpenOpen
WellType
CCCCCCCCCCCC
NACCCCCCCCCCCC
WellUse
MunicipalDomesticDomesticIndustrialDomesticDomesticDomesticDomesticDomesticDomesticDomesticMunicipalMunicipalMunicipalMunicipalMunicipalIndustrialIndustrialIndustrialIndustrialDomesticDomesticDomesticDomesticDomestic
NARefer to Figure 2-4 and Appendix D for well locations and construction logs, respectively.No available information.
widptadm\wi0486\prememo\tables\tomahwel.xlsjs
GERAGHTY & MILLER, INC.

Page 1 of 2
Table 3-1. Well Construction Details and Groundwater and Surface-water Elevation Data, Tomah Armory Landfill Site, Toman, Wisconsin.
MeasurementLocation
MW-01
PZ-01
MW-02
PZ-02
MW-03
MW-04
SG-01
SG-02
LandSurface
Elevation(ftmsl)
949.0
948.9
949.9
949.9
950.6
948.6
NA
NA
ReferencePoint
Elevation(t)
(ftmsl)
948.76
948.62
949.43
949.51
950.22
952.58
944.94
947.54
TotalSoundedDepth
(ftblrp)
12.6
33.9
12.3
32.6
12.4
16.8
NA
NA
pproximateScreenedInterval(ft bis)
3-13
30-35
3-13
28-33
3-13
3-13
NA
NA
Depth toWater0"'(ft bl rp)(11/2/95)
2.32
2.18
2.27
1.15
4.10
6.90
NM
1.66
Water LevelElevation(ftmsl)
(11/2/95)
946.44
946.44
947.16
948.36
946.12
945.68
NA
945.88
Depth toWater
(ft bl rp)(11/3/95)
2.54
2.37
2.31
1.29
4.29
8.96
1.83
2.48
Water LevelElevation(ftmsl)
(11/3/95)
946.22
946.25
947.12
948.22
945.93
943.62
943.11
945.06
(g) The reference point for the monitoring wells is the northern-side of the top-of-casing. The reference point for the staff gauges is the top of thestaff gauge (3.33 ft).
^ Depth to water at each staff gauge is equal to 3.33 ft minus the observed water level.Surveyed elevations are referenced to a local United States Geological Survey benchmark.All measurements are reported in feet.NA Not Applicable.NM Not Measured; measuring point was beneath water.ft bl rp Feet below reference pointft bis Feet below land surface. widptadm\wi0486\phaseii\tables\gwswlev.xls/S
GERAGHTY & MILLER, INC.

Page 2 of 2
Table 3-1. Well Construction Details and Groundwater and Surface-water Elevation Data, Toman Armory Landfill Site, Tomah, Wisconsin.
MeasurementLocation
MW-01
PZ-01
MW-02
PZ-02
MW-03
MW-04
SG-01
SG-02
Depth toWater
(ftblrp)(11/20/95)
3.35
3.00
2.79
2.04
4.61
9.55
2.25
2.43
Water LevelElevation(ftmsl)
(11/20/95)
945.41
945.62
946.64
947.47
945.61
943.03
942.69
945.11
Depth toWater
(ftblrp)(2/13/96)
3.86
3.38
2.98
2.45
5.14
9.34
1.87
2.43
Water LevelElevation(ftmsl)
(2/13/96)
944.90
945.24
946.45
947.06
945.08
943.24
943.07
945.11
(a) The reference point for the monitoring wells is the northern-side of the top-of-casing. The reference point for the staff gauges is the top of thestaff gauge (3.33 ft).
^ Depth to water at each staff gauge is equal to 3.33 ft minus the observed water level.Surveyed elevations are referenced to a local United States Geological Survey benchmark.All measurements are reported in feet.NA Not Applicable.MM Not Measured; measuring point was beneath water.ft bl rp Feet below reference pointft bis Feet below land surface. widptadm\wi0486\phaseii\tables\gwswlev.xls/S
GERAGHTY & MILLER, INC.

Table 4-1. Summary of the Sampling and Analysis Program, Tomah Armory Landfill Site, Toman, Wisconsin.
Sample Matrix
GROUNDWATER(6 monitoring wells, tworounds of sample collection)
SURFACE SOIL(38 surface soil and6 background surface soil)
SUBSURFACE SOIL
FieldMeasurements
pH, specificconductance,temperature,water levels
OVA Screening
OVA Screening
Laboratory Parameters
AL
Benzo (a) pyreneLeadGeotechnical Parametcrs(2)
Total Organic Carbon (TOC)
TOC
DQO(1)
AnalyticalLevel
V
VV——
V
NumberOf
Samples
12
444454
5
Numberof Field
Replicates
2
4401
1
Number ofEquipment
Blanks
2
0000
0
Numberof TripBlanks
2
0000
0
Number ofMatrix Spikes
and MatrixSpike Duplicate
2
0000
0
TotalNumber of
Matrix
20
484855
6
(1) Analytical levels are defined in Section 1.6 of the Phase IQAPP.(2) Geotechnical parameters included grain-size analysis, dry unit weight, moisture content, and permeability.OVA Organic Vapor Analyzer.AL Abbreviated list of compounds based on the analytical results from Phase I sampling.V Data Quality Objective (DQO) Level V (USEPA March 1987)
\vidptadm\wi0486\workplan\tables\suin4.xlsJs
GERAGHTY & MILLER, INC.

Table 4-2. Summary of Geotechnical Characteristics of Landfill Cover Material, Tomah Armory Landfill Site, Toman, Wisconsin.
Sample Grain Size Analysis*D60 P200
* Analytical Methods
Grain-Size AnalysisDry Unit WeightMoisture ContentPermeability
ASTMD2166ASTM D422ASTMD2216ASTMD5084
Dry Unit Weight*(PCF)
Moisture Content* Permeability*(%) (cm/sec)
Description
SS-07SS-20SS-35SS-14SS-29
0.19860.22510.29960.23325.8037
38.320.39.511.114.6
59.993.3102.8104.7110.1
58.116.16.78.55.8
3.00E-047.00E-057.30E-047.30E-043.10E-04
Black silty sandBlack silty sandDark brown sand with siltDark brown sand with siltSilty sand with gravel
widptadm\wi0486\phaseii\tables\gtechtab.xlsw
GERAGHTY & MILLER, INC.
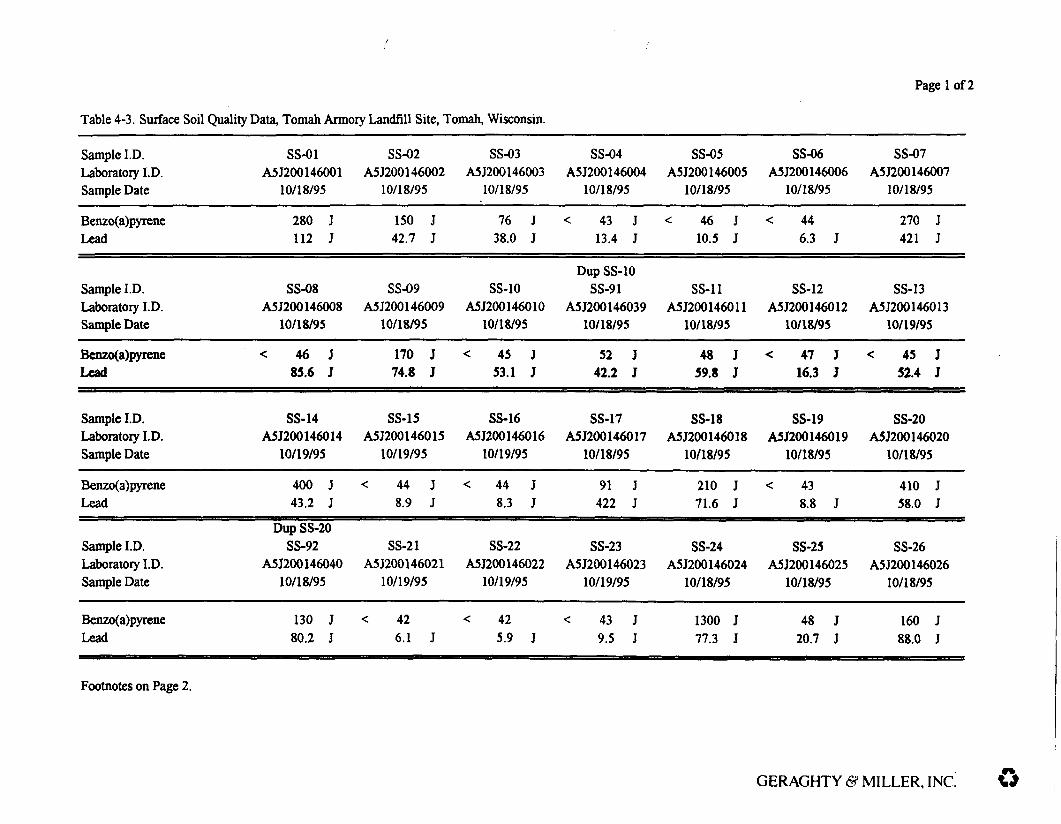
Page 1 of2
Table 4-3. Surface Soil Quality Data, Tomah Armoiy Landfill Site, Tomah, Wisconsin.
Sample I.D.Laboratory I.D.Sample Date
Benzo(a)pyreneLead
Sample I.D.Laboratory I.D.Sample Date
Benzo(a)pyreneLead
Sample I.D.Laboratory I.D.Sample Date
Benzo(a)pyreneLead
Sample I.D.Laboratory I.D.Sample Date
Benzo(a)pyreneLead
SS-01A5J200146001
10/18/95
280 J112 J
SS-08A5J200146008
10/18/95
< 46 J85.6 J
SS-14A5J200146014
10/19/95
400 J43.2 J
Dup SS-20SS-92
A5J20014604010/18/95
130 J80.2 J
SS-02A5J200 146002
10/18/95
150 J42.7 J
SS-09A5J200146009
10/18/95
170 J74.8 J
SS-15A5J200146015
10/19/95
< 44 J8.9 J
SS-21A5J200 146021
10/19/95
< 426.1 J
SS-03A5J200 146003
10/18/95
76 J38.0 J
SS-10A5J200146010
10/18/95
< 45 J53.1 J
SS-16A5J200146016
10/19/95
< 44 J8.3 J
SS-22A5J200146022
10/19/95
< 425.9 J
SS-04A5J200146004
10/18/95
< 43 J13.4 J
Dup SS-10SS-91
A5J20014603910/18/95
52 J42.2 J
SS-17A5J200146017
10/18/95
91 J422 J
SS-23A5J200146023
10/19/95
< 43 J9.5 J
SS-05A5J200146005
10/18/95
< 46 J10.5 J
SS-11A5J200146011
10/18/95
48 J59.8 J
SS-18A5J200146018
10/18/95
210 J71.6 J
SS-24A5J200146024
10/18/95
1300 J77.3 J
SS-06A5J200146006
10/18/95
< 446.3 J
SS-12A5J200146012
10/18/95
< 47 J16.3 J
SS-19A5J200146019
10/18/95
< 438.8 J
SS-25A5J200146025
10/18/95
48 J20.7 J
SS-07A5J200 146007
10/18/95
270 J421 J
SS-13A5J200146013
10/19/95
< 45 J52.4 J
SS-20A5J200 146020
10/18/95
410 J58.0 J
SS-26A5J200146026
10/18/95
160 J88.0 J
Footnotes on Page 2.
GERAGHTY & MILLER, INC o

Page 2 of 2
Table 4-3. Surface Soil Quality Data, Tomah Armory Landfill Site, Tomah, Wisconsin.
Sample I.D.Laboratory I.D.Sample Date
Benzo(a)pyreneLead
Sample I.D.Laboratory I.D.Sample Date
Benzo(a)pyreneLead
Sample I.D.Laboratory I.D.Sample Date
Benzo(a)pyreneLead
SS-27A5J200146027
10/18/95
81 J3.6 J
SS-33A5J200146033
10/18/95
< 45 J19.4 J
KSS-01A5K040 107009
11/03/95
< 4626.1
SS-28A5J200 146028
10/19/95
< 4311.1 J
SS-34A5J200 146034
10/18/95
< 47 J33.7 J
KSS-02A5K040107010
11/03/95
< 180 J16.8
SS-29A5J200146029
10/19/95
< 435.3 J
SS-35A5J200146035
10/19/95
3900 J33.8 J
Dup BKSS-02KSS-99
A5K04010701411/03/95
77 J19.2
Dup SS-30SS-30
A5J20014603010/19/95
< 45 J11.3 J
SS-36A5J200 146036
10/19/95
< 424.5 J
KSS-03A5K040107011
11/03/95
< 4720.5
SS-93A5J200146041
10/19/95
< 44 J18.7 J
SS-37A5J200146037
10/18/95
83 J12.5 J
KSS-04A5K040107012
11/03/95
< 435.7
SS-31A5J200146031
10/18/95
< 44 J14.9 J
SS-38A5J200146038
10/18/95
110 J12.7 J
KSS-05A5K100175001
11/03/95
< 52 J16.2
SS-32A5J200 146032
10/18/95
< 45 J13.9 J
KSS-06A5K040107013
11/03/95
< 5420.2
Concentrations of Lead are reported in mg/kg (milligrams per kilogram).Concentrations of Benzo(a)pyrene are reported in ng/kg (micrograms per kilogram).J Data validation qualifier indicates an estimated value.< Compound was not detected at the reported practical quantitation limit.
\vpdptadm\wi0486\phaseii\data\toolbox\tables\surfsoil.xls/k

Table 4-4. Soil Sample Total Organic Carbon (TOC) Results, Tomah ArmoryLandfill Site, Tomah, Wisconsin.
Sample I.D. Sample Date TOC(mg/kg) TOC (%
mg/kg Milligrams per kilogram
widptadm\wi(M86\phaseii\tables\tocdata.xls/S
SURFACE SOIL SAMPLESSS-7SS-14SS-20SS-20 (Duplicate)SS-27SS-35
SHALLOW SUBSURFACESB01/5SB02/5SB03/5SB03/5 (Duplicate)SB04/5
10-18-9510-19-9510-18-9510-18-9510-19-9510-19-95
SOIL SAMPLES10-23-9510-24-9510-25-9510-25-9510-25-95
55,00022,00028,00036,0001,10016,000
2,300340
1,5001,300880
5.52.22.83.6
0.111.6
0.230.0340.150.130.088
GERAGHTY & MILLER, INC.

Table 4-5. Groundwater Quality Data, November 1995, Volatile Organic Compounds (VOCs) and Inorganics1, Tomah Armory Landfill Site, Tomah, Wisconsin.
Sample I.D.Laboratory I.D.Sample Date
VOCsChloroformChloromethane1,1-Dichloroethane1 ,2-Dichloroethane1 , 1 -DichloroetheneTetrachloroethene1,1,1 -Trichloroethane1 , 1 ,2-TrichloroethaneTrichloroetheneVinyl chloride1,2-Dichloroethene (total)
INORGANCSArsenic -DissolvedLead -Dissolved
FIELD PARAMETERSPH2
Specific Conductance (uS)Temperature (°C)
Upgradient
MW-02A5K040107002
11/02/95
< 5.0< 5.0< 5.0< 5.0< 5.0< 2.5< 5.0< 3.0
160< 2.5
32
< 5.0< 3.0
6.655010
JJJJJJJJJJJ
PZ-02A5K040107006
1/02/95
< 1.0< 1.0< 1.0< 1.0< 1.0< 0.50< 1.0< 0.60
26< 0.50
6.2
< 5.0< 3.0
5.7330
9
Downgradient
MW-01A5K040107001
1/02/95
< 1.0< 1.0< 1.0< 1.0< 1.0< 0.50< 1.0< 0.60< 1.0< 0.50< 1.0
< 5.0< 3.0
7.828011
Dup MW-01MW-99
A5K040 10700711/02/95
< 1.0< 1.0< 1.0< 1.0< 1.0< 0.50< 1.0< 0.60< 1.0< 0.50< 1.0
< 5.0< 3.0
7.828011
PZ-01A5K040 107005
11/02/95
< 1.0< 1.0< 1.0< 1.0< 1.0< 0.50< 1.0< 0.60
11< 0.50
5.4
< 5.0< 3.0
7.544011
MW-03A5K040107003
11/02/95
< 1.0< 1.0< 1.0< 1.0< 1.0< 0.50< 1.0< 0.60
1.9< 0.50< 1.0
< 5.0< 3.0
6.0270
11
MW-04A5K040 107004
11/02/95
< 1.0< 1.0< 1.0< 1.0< 1.0< 0.50< 1.0< 0.60
2.5< 0.50< 1.0
< 5.0< 3.0
6.668011
1 All concentrations are reported in ug/L (micrograms per liter).2 pH measured in standard pH units.J Estimated concentration.
widptadm\wi0486\pahseii\tables\nov95.xlswsj
GERAGHTY & MILLER, INC. o

Table 4-6. Groundwater Quality Data, February 1996, Volatile Organic Compounds (VOCs) and Inorganics', Tomah Armory Landfill Site, Tomah, Wisconsin
Sample I.D.Laboratory I.D.Sample Date
VOCsChloroformChloromethane1,1-Dichloroethane1 ,2-Dichloroethane1 , 1 -DichloroetheneTetrachloroetheneU.l-Trichloroethanfr1 , 1 ,2-TrichloroethaneTrichloroethene-Vinyl chloride1,2-Dichloroethene (total)
INORGANCSArsenic -DissolvedLead -Dissolved
FIELD PARAMETERSPH2
Specific Conductance (uS)Temperature (°C)
Upgradient
Dup MW-02MW-02 MW-98 PZ-02
A6B140133003 A6B140133008 A6B14013300402/13/96 2/13/96 02/13/96
< 3.3 J < 3.3 J < 2 J< 3.3 J < 3.3 J < 2.0 J< 3.3 J < 3.3 J < 2.0 J
6.4 J 5.7 J < 2.0 J< 3.3 J < 3.3 J < 2.0 J< 1.7 J < 1.7 J < 1.0 J< 3.3 J < 3.3 J < 2.0 J< 2.0 J < 2.0 J < 1.2 J
94 J 83 J 48 J< 1.7 J < 1.7 J < 1.0 J
24 J 18 J 14 J
< 5.0 < 5.0 < 5.0< 3.0 < 3.0 < 3.0
7.7 7.7 7.3670 670 4605.8 5.8 7.6
Downgradient
MW-01 PZ-01 MW-03 MW-04A6B140133001 A6B140133002 A6B140133005 A6B140133006
2/13/96 02/13/96 02/13/96 02/13/96
< 1.0 < 2.0 J < 1.0 < 1.0< 1.0 < 2.0 J < 1.0 < 1.0< 1.0 < 2.0 J < 1.0 < 1.0< 1.0 < 2.0 J < 1.0 < 1.0< 1.0 < 2.0 J < 1.0 < 1.0< 0.50 < 1.0 J < 0.50 < 0.50< 1.0 < 2.0 J < 1.0 < 1.0< 0.60 < 1.2 J < 0.60 < 0.60< 1.0 | 48 |j 2.4 2.4< 0.50 < 1.0 J < 0.50 < 0< 1.0 8.0 J < 1.0 1
< 5.0 < 5.0 < 5.0 < 5< 3.0 < 3.0 < 3.0 4
50.1
.0
.7
8.4 8.3 7.5 7.3330 570 960 9704.5 8.3 6.4 7.3
1 All concentrations are reported in fig/L (micrograms per liter).2 pH measured in standard pH units.J Estimated concentration.
Downgradient concentration greater than background level.
widptadm\\vi0486\pahseii\tables\waterqly.xlswsjGERAGHTY & MILLER, INC.

Table 5-1. Occurrence Summary of Surface Soil Samples, Phase I/Phase II RI, Tomah Armory Landfill Site, Tomah, Wisconsin.
COPC
Armory Area
Benzo(a)pyreneLead
Museum AreaBenzo(a)pyreneLead
Sewage Plant AreaBenzo(a)pyreneLead
Trespasser AreaBenzo(a)pyreneLead
All Surface SoilsBenzo(a)pyreneLead
All concentrations are
FrequencyDetects / Total
7 / 1 212/12
5 /88 / 8
3 / 99 / 9
8/1212/12
18/3838 /38
reported in milligrams per
Range of SQLsMin-Max
0.044 - 0.047- - -
0.044 - 0.046- - -
0.043 - 0.045" - -
0.043 - 0.046. _ _
0.042 - 0.047- - -
kilogram (mg/kg).
Range of Detects AverageMin -
0.048 -3.6 -
0.21 -6.3 -
0.076 -8.3 -
0.048 -6.3 -
0.048 -3.6 -
Max
0.4180.2
1.3422
0.4052.4
1.3422
3.9422
Detect
0.1433
0.63140
0.2126
0.41110
0.4453
Mean
0.08933
0.4140
0.08426
0.28110
0.2253
UCL
0.1547
0.72260
0.1637
0.49190
0.479
EPC
0.1547
0.72260
0.1637
0.49187
0.479
COPC Constituents of potential concern.Indicates
EPC Exposurethat COPC was detected in all samples.point concentration; lesser of the UCL and the maximum detected concentration rounded to two significant numbers
Mean Arithmetic average of the total number of samples, using proxy concentrations for non-detects.SQLs PracticalUCL The uppe
sample quantitation limits for the non-detects.r 95 percent one-tailed confidence interval on the mean for normalb/ distributed data.
widptadm\wi0486\phaseii\tables\mow-2.xlsj ( GERAGHTY & MILLER, INC
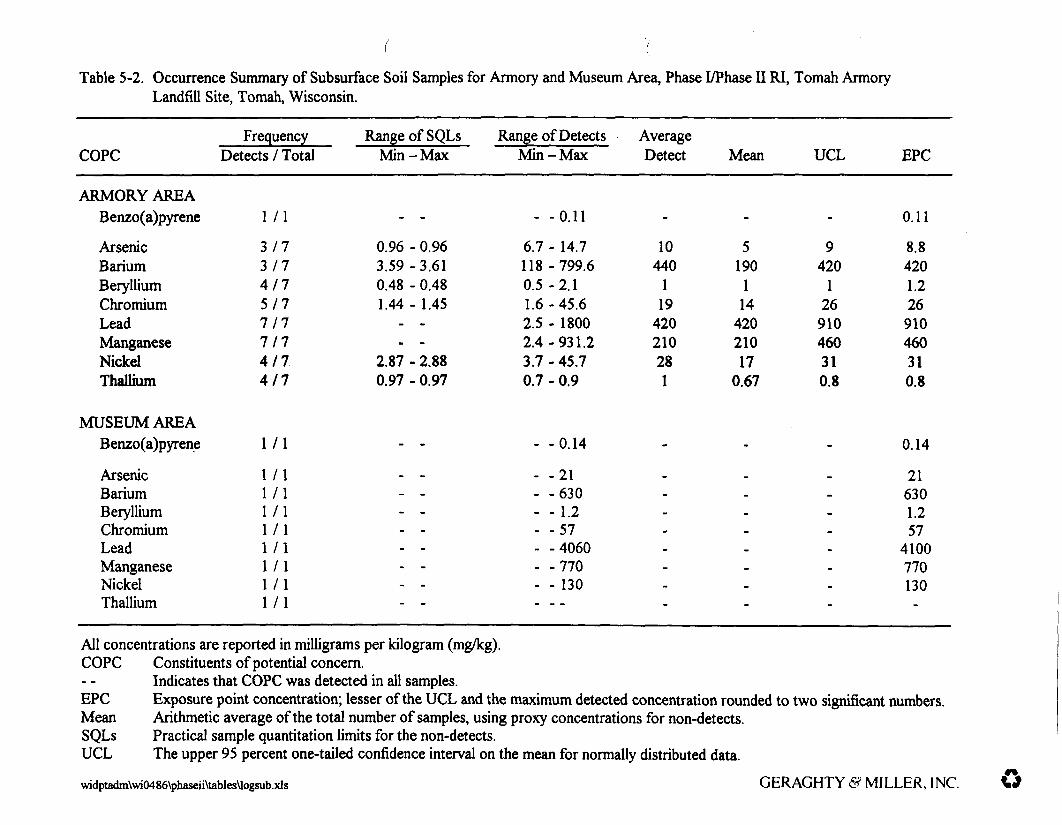
Table 5-2. Occurrence Summary of Subsurface Soil Samples for Armory and Museum Area, Phase I/Phase II RI, Tomah ArmoryLandfill Site, Tomah, Wisconsin.
Frequency Range of SQLs Range of DetectsCOPC Detects / Total Min - Max
ARMORY AREABenzo(a)pyrene 1/1 - -
Arsenic 3 / 7 0.96 - 0.96Barium 3/7 3.59-3.61Beryllium 4/7 0.48-0.48Chromium 5/7 1.44-1.45Lead 7/7Manganese 7/7 - -Nickel 4 / 7 2.87 - 2.88Thallium 4/7 0.97-0.97
MUSEUM AREABenzo(a)pyrene 1/1 - -
Arsenic 1/1 - -Barium 1/1 - -Beryllium 1/1 - -Chromium 1/1 - -Lead 1/1Manganese 1/1 - -Nickel 1/1Thallium 1/1
All concentrations are reported in milligrams per kilogram (mg/kg).COPC Constituents of potential concern.
Indicates that COPC was detected in all samples.EPC Exposure point concentration; lesser of the UCL and theMean Arithmetic average of the total number of samples, usingSQLs Practical sample quantitation limits for the non-detects.
Min -Max
- -0.11
6.7 - 14.7118 -799.60.5 -2.11.6-45.62.5 - 18002.4-931.23.7 - 45.70.7 - 0.9
- -0.14
- -21- -630- - 1.2- -57- -4060- -770- -130...
maximum detected
AverageDetect
-
10440
119
420210281
-
_.----.-
Mean
-
5190
114
42021017
0.67
-_.-._-_-
concentration rounded
UCL
-
9420
126910460310.8
-
__----.-
to two significant
EPC
0.11
8.84201.226910460310.8
0.14
216301.257
4100770130-
numbers.proxy concentrations for non-detects.
UCL The upper 95 percent one-tailed confidence interval on the mean for normally distributed data.\vidptadm\wi0486\phaseii\tables\logsub.xls GERAGHTY & MILLER, INC.
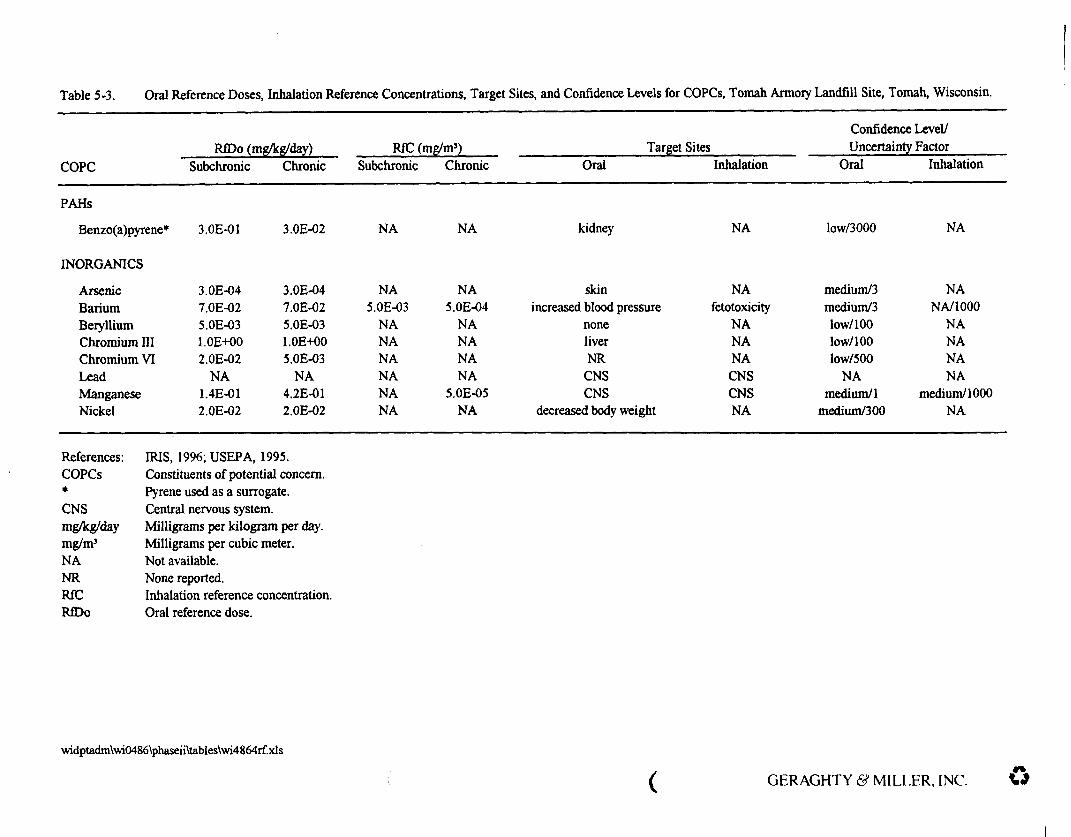
Table 5-3. Oral Reference Doses, Inhalation Reference Concentrations, Target Sites, and Confidence Levels for COPCs, Tomah Armory Landfill Site, Tomah, Wisconsin.
Confidence Level/RfDo (mg/kg/day)
COPC Subchronic Chronic
PAHsBenzo(a)pyrene* 3.0E-01 3.0E-02
INORGANICS
Arsenic 3.0E-04 3.0E-04Barium 7.0E-02 7.0E-02Beryllium 5.0E-03 5.0E-03Chromium III 1.0E-K)0 l.OE+00Chromium VI 2.0E-02 5.0E-03Lead NA NAManganese 1.4E-01 4.2E-01Nickel 2.0E-02 2.0E-02
References: IRIS, 1996; USEPA, 1995.COPCs Constituents of potential concern.* Pyrene used as a surrogate.CNS Central nervous system.mg/kg/day Milligrams per kilogram per day.mg/m3 Milligrams per cubic meter.NA Not available.NR None reported.RfC Inhalation reference concentration.RfDo Oral reference dose.
RfC (mg/mj)Subchronic
NA
NA5.0E-03
NANANANANANA
Chronic
NA
NA5.0E-04
NANANANA
5.0E-05NA
TargetOral
kidney
skinincreased blood pressure
noneliverNRCNSCNS
decreased body weight
SitesInhalation
NA
NAfetotoxicity
NANANACNSCNSNA
Uncertainty FactorOral
low/3000
medium/3medium/3low/100low/100low/500
NAmedium/ 1
medium/300
Inhalation
NA
NANA/1000
NANANANA
medium/1000NA
widptadm\wi0486\phaseii\tables\wi4864rf.xls
GERAGHTY & MILLER, INC.
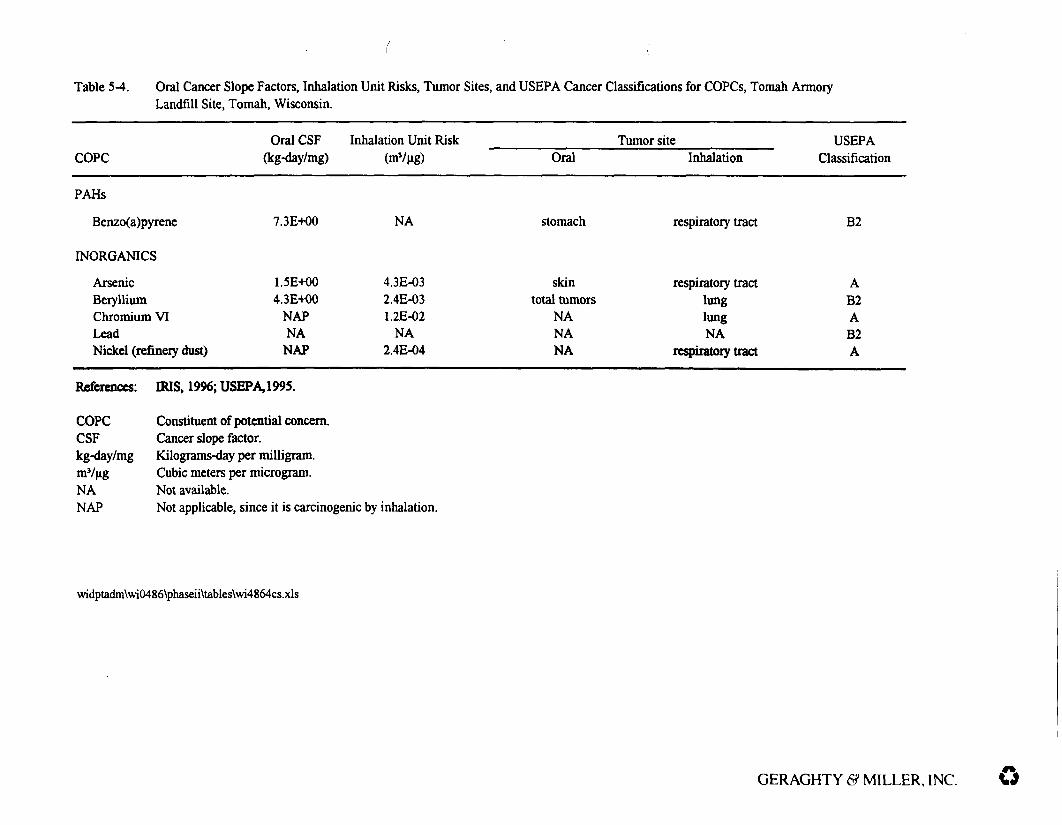
Table 5-4. Oral Cancer Slope Factors, Inhalation Unit Risks, Tumor Sites, and USEPA Cancer Classifications for COPCs, Tomah ArmoryLandfill Site, Tomah, Wisconsin.
COPCOral CSF Inhalation Unit Risk
(kg-day/mg) (mVug)Tumor site
Oral InhalationUSEPA
Classification
PAHs
Benzo(a)pyrene
INORGANICS
7.3E+00 NA stomach
\vidptadm\wi0486\phaseii\tables\wi4864cs.xls
respiratory tract B2
Arsenic 1.5E-K)0Beryllium 4.3E-KH)Chromium VI NAPLead NANickel (refinery dust) NAP
References: IRIS, 1996; USEPA, 1995.
COPC Constituent of potential concern.CSF Cancer slope factor,kg-day/mg Kilograms-day per milligram.mVug Cubic meters per microgram.NA Not available.NAP Not applicable, since it is carcinogenic
4.3E-032.4E-031.2E-02
NA2.4E-04
by inhalation.
skintotal tumors
NANANA
respiratory tractlunglungNA
respiratory tract
AB2AB2A
GERAGHTY & MILLER, INC.

Table 5-5. Comparison of Surface Soil Data to Background Concentrations and Risk-Based Guidelines, Tomah Armory Landfill Site, Tomah, Wisconsin.
BackgroundSource Parameter EPC(1) Concentration^
Museum Benzo(a)pyrenew 0.72 0.067Lead 260 36
Armory Benzo^pyrene^ 0.15 0.067Lead 47 36
Sewage Plant Benzo(a)pyrene(a) 0.16 0.067Lead 37 36
All Surficial Soils Benzo(a)pyrene(*) 0.4 0.067Lead 79 36
BackgroundSource Parameter EPC(1) Concentration0'
Trespasser Benzo(a)pyrene(*) 0.49 0.067Lead 190 36
NA Not applicable.ND Not determined.mg/Kg Milligrams per kilogram.(a) Carcinogen.(1) Exposure Point Concentration.
RBC Industrial^10"6 10'5 ID"4
0.78 7.8 78ND ND ND
0.78 7.8 78ND ND ND
0.78 7.8 78ND ND ND
0.78 7.8 78ND ND ND
RBC Residential^10"6 10'5 10""
0.088 0.88 8.8ND ND ND
Adult LeadCleanup Level(4)
NA36,000
NA36,000
NA36,000
NA36,000
ResidentialSSL(5)
0.09400
SSL(5) TransferFrom Soil to Air
„(«
ND
H(6)
ND
n(6)
ND
U<6)
ND
SSL(5) TransferFrom Soil to Air
n(6)
ND
(2) Concentrations are the average background concentrations times two. Background samples include: BKSS-01 thru BKSS-06.Benzo(a)pyrene was detected in the duplicate of BK22-02.
(3) Risk-Based Concentration, Industrial Soil Ingestion (USEPA, 1996).(4) Adult lead cleanup level calculated using a frequency of 28 d/yr exposure (USEPA, Region VI, 1 995).(5) Soil Screening Level (USEPA, 1994).(6) Soil Saturation Limit.(7) Risk-Based Concentration, Residential Soil Ingestion (USEPA, 1996).
widptadm\wi0486\ptuMu\Ubla\table6-2\<uificial.xb
GERAGHTY & MILLER, INC.

Page 1 of2Table 5-6. Comparison of Subsurface Soil Data to Background Concentradons and Risk-Based Guidelines, Tomah Armory Landfill
Site, Tomah, Wisconsin.
COPC
Armory AreaCarcinogens
Inorganics
mg/kg
***NDNANEEPC
a(1)
(2)(3)(4)
Background RBC Industrial®EPC Concentration0' 10^ 10'5 10"4
Benzo(a)pyrene 0.11 -- 0.78 7.8 78Arsenic 8.8 3.2 3.8 38 380Beryllium 1.2 0.7 1.3 13 130Chromium* 26 6.1 10,000* 100,000* 1,000,000*Nickel** 31 5.8 ND ND ND
Barium 420 8.2 NA NA NALead 910 6.6 ND ND NDNickel 31 5.8 NA NA NAManganese 460 24.6 NA NA NAThallium 0.8 1.2 NA NA NA
Milligrams per kilogram.Not detected.Value is for chromium VI.Nickel is a carcinogen via refinery dust inhalation, this is not applicable to this site.Not determined.Not applicable.Not established.
RBC IndustrialNoncarcinogenic
Effects
NE610NE
10,00041,000
140,00036,000(4)
41,00010,000
ND
SSL^ TransfersFrom Soil to Air
l la380690140
6,900
350,000ND
6,900NDND
Exposure point concentration; lesser of the UCL and the maximum detected concentrationsrounded to two significant numbers.Soil saturation soil.Concentrations are the average background concentrations times two.Background samples include: B19DB (3-5 ft) and B19DB (9-11 ft).Risk-Based Concentration, Industrial Soil Ingestion (USEPA, Region HI, 1996).Soil Screening Levels, Residential Values (USEPA, 1994).Adult lead cleanup level calculated using a frequency of 28 d/yr exposure (USEPA, Region IV, 1995).
widptadm\wi0486\phaseii\tables\table6-2\soil.xls
GERAGHTY & MILLER, INC.

Page 2 of 2
Table 5-6. Comparison of Subsurface Soil Data to Background Concentrations and Risk-Based Guidelines, Tomah Armory LandfillSite, Tomah, Wisconsin.
COPC
Museum AreaCarcinogens
Inorganic
mg/kg
***NDNANEEPC
a(1)
(2)(3)(4)
Background RBC Industrial^EPC Concentration0' 10* 10° 10"4
Benzo(a)pyrene 0.14 -- 0.78 7.8 78Arsenic 21 3.2 3.8 38 380Beryllium 1.2 0.7 1.3 13 130Chromium* 57 6.1 10,000* 100,000* 1,000,000*Nickel** 130 5.8 ND ND ND
Barium 630 8.2 NA NA NALead 4100 6.6 ND ND NDManganese 760 24.6 NA NA NANickel 130 5.8 NA NA NAThallium -- 1.2 NA NA NA
Milligrams per kilogram.Not detected.Value is for chromium VI.Nickel is a carcinogen via refinery dust inhalation, this is not applicable to this site.Not determined.Not applicable.Not established.
RBC IndustrialNoncarcinogenic
Effects
NE610NE
10,00041,000
140,00036,000(4)
10,00041,000
NA
SSL(3) TransfersFrom Soil to Air
lla380690140
6,900
350,000cNDND
6,900ND
Exposure point concentration; lesser of the UCL and the maximum detected concentrationsrounded to two significant numbers.Soil saturation soil.Concentrations are the average background concentrations times two.Background samples include: B19DB (3-5 ft) and B19DB (9-11 ft).Risk-Based Concentration, Industrial Soil Ingestion (USEPA, Region III, 1996).Soil Screening Levels, Residential Values (USEPA, 1994).Adult lead cleanup level calculated using a frequency of 28 d/yr exposure (USEPA, Region IV, 1995).
\vidptadm\wi0486\phaseii\tables\table6-2\soil.xls
GERAGHTY & MILLER, INC.
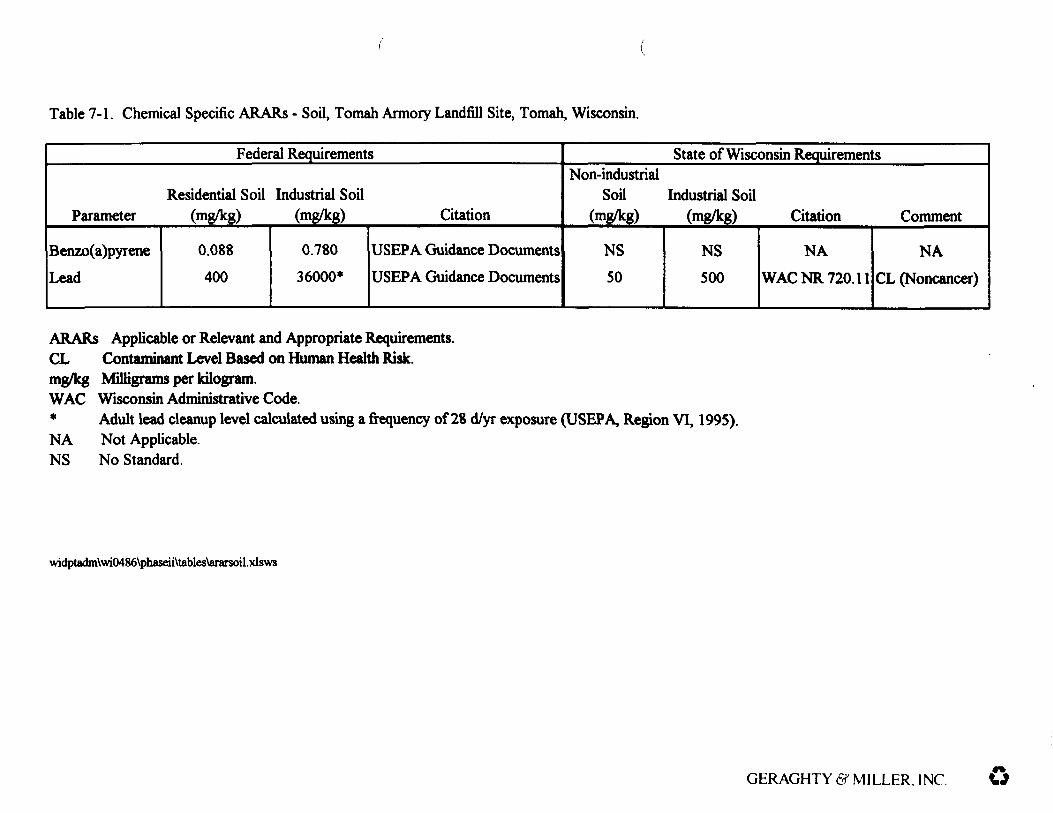
Table 7-1. Chemical Specific ARARs - Soil, Toman Armory Landfill Site, Tomah, Wisconsin.
Federal Requirements
Residential Soil Industrial SoilParameter (mg/kg) (mg/kg) Citation
Benzo(a)pyreneLead
0.088400
0.78036000*
USEPA Guidance DocumentsUSEPA Guidance Documents
State of Wisconsin RequirementsNon-industrial
Soil Industrial Soil(mg/kg) (mg/kg) Citation Comment
NS50
NS500
NAWACNR720.il
NACL (Noncancer)
ARARs Applicable or Relevant and Appropriate Requirements.CL Contaminant Level Based on Human Health Risk.mg/kg Milligrams per kilogram.WAC Wisconsin Administrative Code.* Adult lead cleanup level calculated using a frequency of 28 d/yr exposure (USEPA, Region VI, 1995).NA Not Applicable.NS No Standard.
widptadm\wi0486\phaseii\tables\ararsoil.xlsws
GERAGHTY & MILLER, INC. o

Table 7-2. Action Specific ARARs - Tomah Armory Landfill, Tomah, Wisconsin.
Alternative
Institutional Controls
Barrier
Removal
Agreed Upon Voluntary Action
Deed Restriction
Soil Cover
Limited Excavation andDisposal
Description
Legal Restrictions onDevelopment and Use
Placement of Coverin Museum Area
Removal andDisposal West ofWoodard Avenue
Citation
NR 506.08
NR 506.08
None
Comment
Can be applied at site with concurrence of otherproperty owners.
Agreed upon for undeveloped museum property withowner concurrence.
Agreed upon for exposed waste west of WoodardAvenue with owner concurrence. Excavated wastemanaged as solid waste.
ARARs - Applicable or Relevant and Appropriate Requirements
widptadm\wi0486\phaseii\tables\actnarar.xlsws
GERAGHTY & MILLER, INC

FIGURES
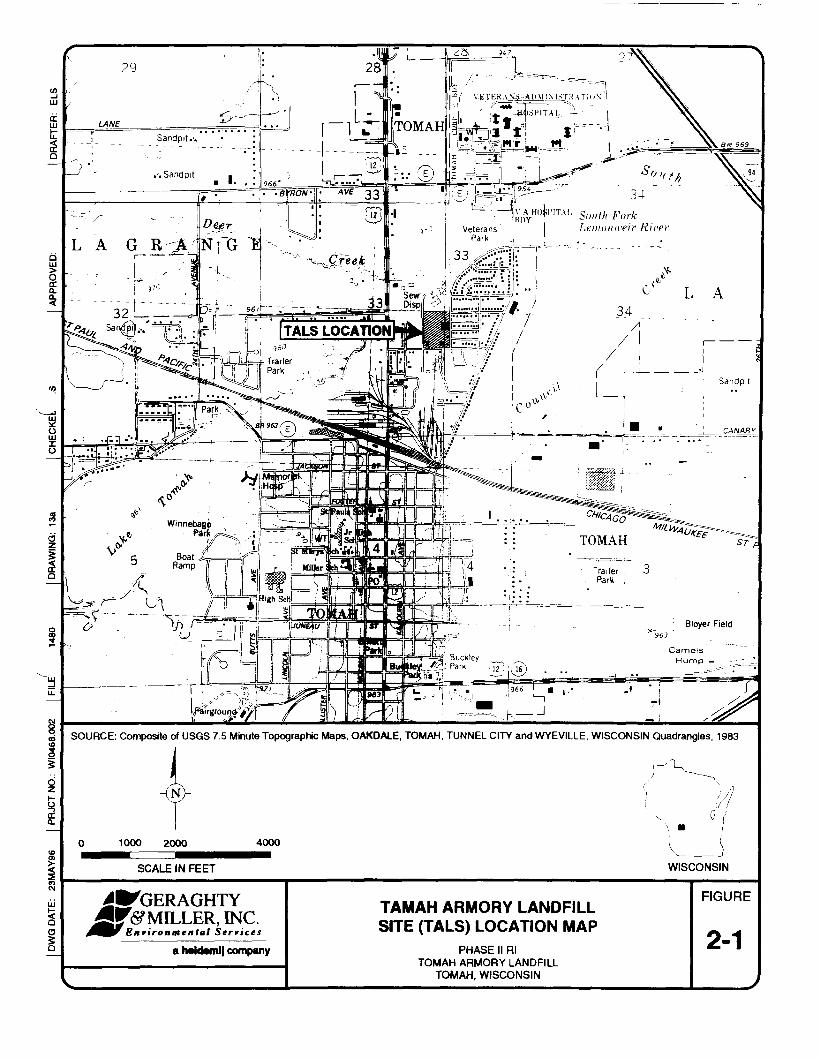
" swv^f'ItefS^H- "
SOURCE: Composite of USGS 7.5 Minute Topographic Maps, OAKDALE, TOMAH, TUNNEL CITY and WYEVILLE, WISCONSIN Quadrangles, 1983
1000 2000 4000
SCALE IN FEET WISCONSIN
^i^GERAGHTY^MILLER, INC.Environmental Services
a lMktoml| company
TAMAH ARMORY LANDFILLSITE (TALS) LOCATION MAP
PHASE II RlTOMAH ARMORY LANDFILL
TOMAH, WISCONSIN
FIGURE
2-1

TOMAH ARMORY LANDFILL STTETOMAH ARMORY LANDFILL SITE (TALS)

LEGEND
-13 • SOiL BOK.NG/NJMHt
W-21
GERAGH& MILLER, INC.TOMAH ARMORY LANDFILL SITE
PHASE I Rl SAMPLING LOCATIONS
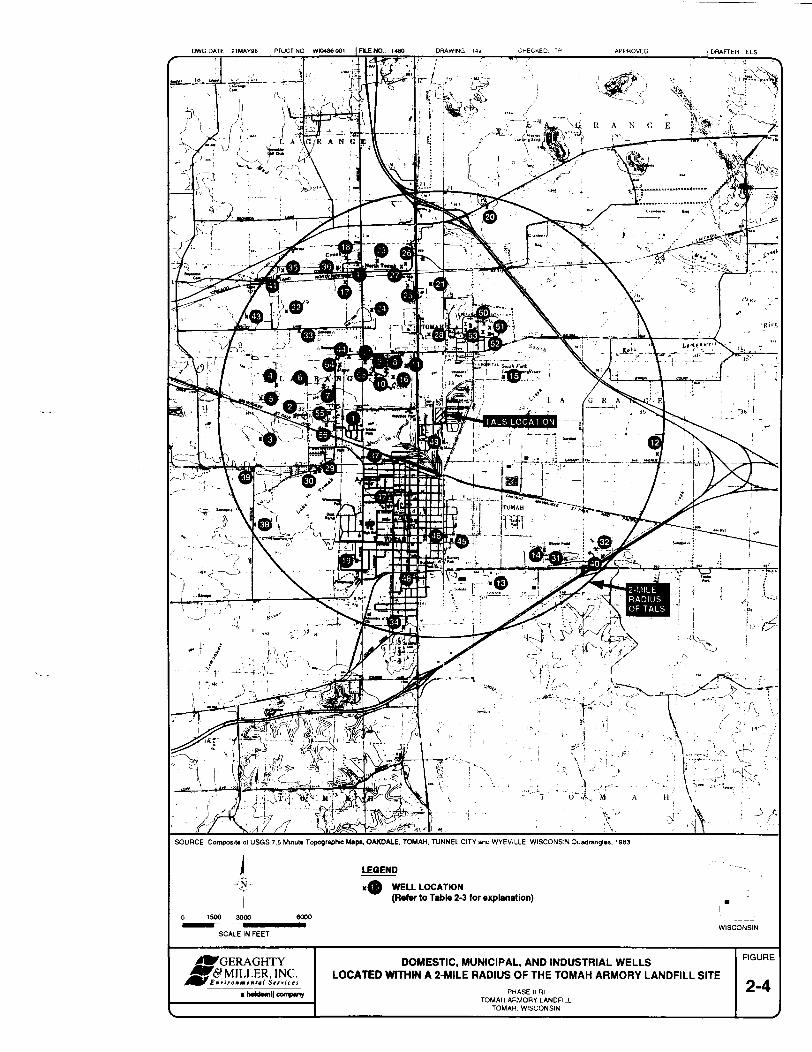
DWG DATE 21MAY96 PRJCT NO WIOM6001 I FILE NO. 1480 DRAWING Ua CHECKED: TP I DRAFTER ELS
SOURCE: Composite ol USGS 7.5 Minute Topographic M«p», OAKDALE. TOMAH, TUNNEL CITY and WYEVILLE WISCONSIN Quadrates, 1983
I LEGEND• N -
0 1500 3000
x A WELL LOCATION(Ftotar to Tabto 2-3 for wcplanation)
SCALE IN FEET
GERAGHTY'&MILLER, INC.
a hildimtl company
DOMESTIC, MUNICIPAL, AND INDUSTRIAL WELLSLOCATED WITHIN A 2-MILE RADIUS OF THE TOMAH ARMORY LANDFILL SITE
PHASE II RlTOMAH ARMORY LANDFILL
TOMAH. WISCONSIN
FIGURE
2-4
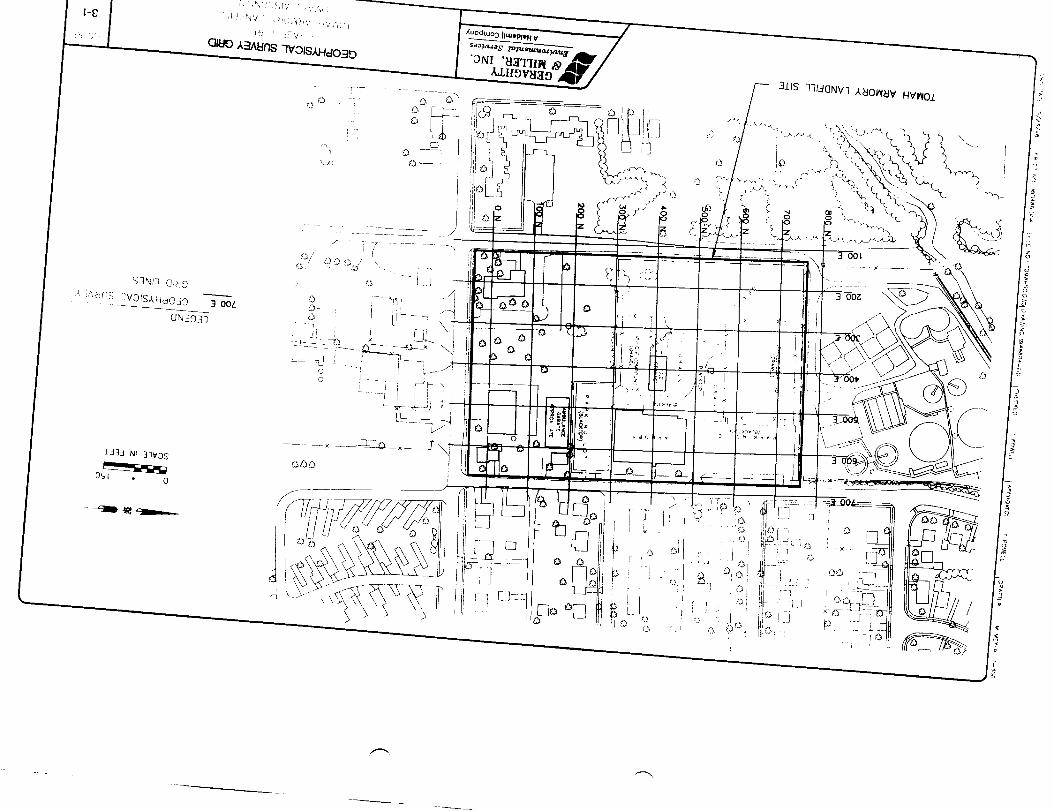
1-C

9,000 N
8,000 N
,10.000 E
SCALE IN FEET
J-EGEND_TF-2 r C 3 T
PIT LOCATION/Njn,;.; I,
.9.000 t:
TOMAH ARMORY LANDFILL SITE/J&GE£&&\L\
^^F Eninmn
GERAGHTY* MILLER, INC.
^mental Services* H.ldemtj Company
"TEST PIT LOCATIONS
3-2

SS-01 A SURFACE SOIL SAMPILLOCATION!
BKSS-01 A BACKGROUND SURFACI SCISAMPLC LOCATION
SS-°7GCO TECHNICAL SUR 'ACF srSAWPLF LOCATION "
TOMAH ARMORY LANDFILL SITE
I i j 0 V
J_.L--.- -—
LANDRLL COVER AND BACKGROUNDSURFACE SOIL SAMPLING LOCATIONS
l -HA^ f • •'"3-3

GERAGHTY& MILLER, INC.
Environmental Services
SCAEE IN FEET
LEGEN
SURFACE SOli, S A W P L f L O C A T CN
-—= BCSS-O1 A BACKGROUND SURF ACt SOkSAMPLE LOCATION
12101 CONCENTRATION OFBENZC(A)PYRENE (ug/kg)
J D A T A VALIDATION OUALIMLRESTIMATED CONCENTRATION
( BENZO(A)PYRENl \OT r / I IC IAT CONCENTRAT ON C K T A I L ^THAN THE INDICATED Wt ' r - O DDETECT ON LIWi l
TOMAH ARMORY LANDFILL SITECONCEMTRAT1ONS OF BEN2O(A)PYRENE DETECTED
IN SURFACE SOIL SAMPLESP-HASF , R
" O V A h ARMOR v [ ANtli ' I"CM A - 1 . '.V'-TONS'K
3-4
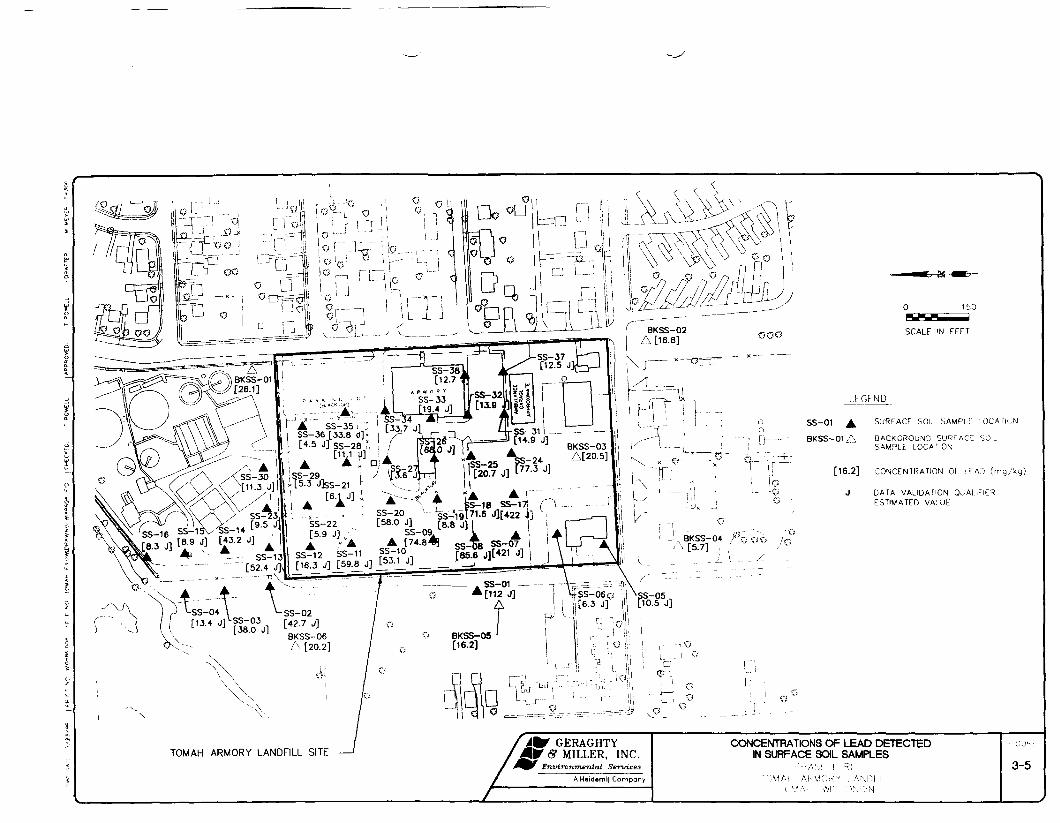
?
SCALE 'N FEET
SURFACE SOL SAMPLE LOCATICN
BKSS-01A BACKGROUND SURFACE SOLSAMPLE LOCATION
BKSS-02A [16.8]
~tr— ?) ----^---
SS-06Q ' | \SS-05l [10.5 J]
SS-02[42.7 J]BKSS-06A [20.2]
[16.2] CONCENTRATION 01 LEAD (nr-q/kg)
J DATA VALIDATION QUALIFIERESTIMATED VA'. UE
TOMAH ARMORY LANDFILL SITE_ ' GERAGHTY
I|T & MILLER, INC.Environmental Services
AHeidamij Company
f
CONCENTRATIONS OF LEAD DETECTEDIN SURFACE SOIL SAMPLES
: i - i A S : I '•?: 3-5
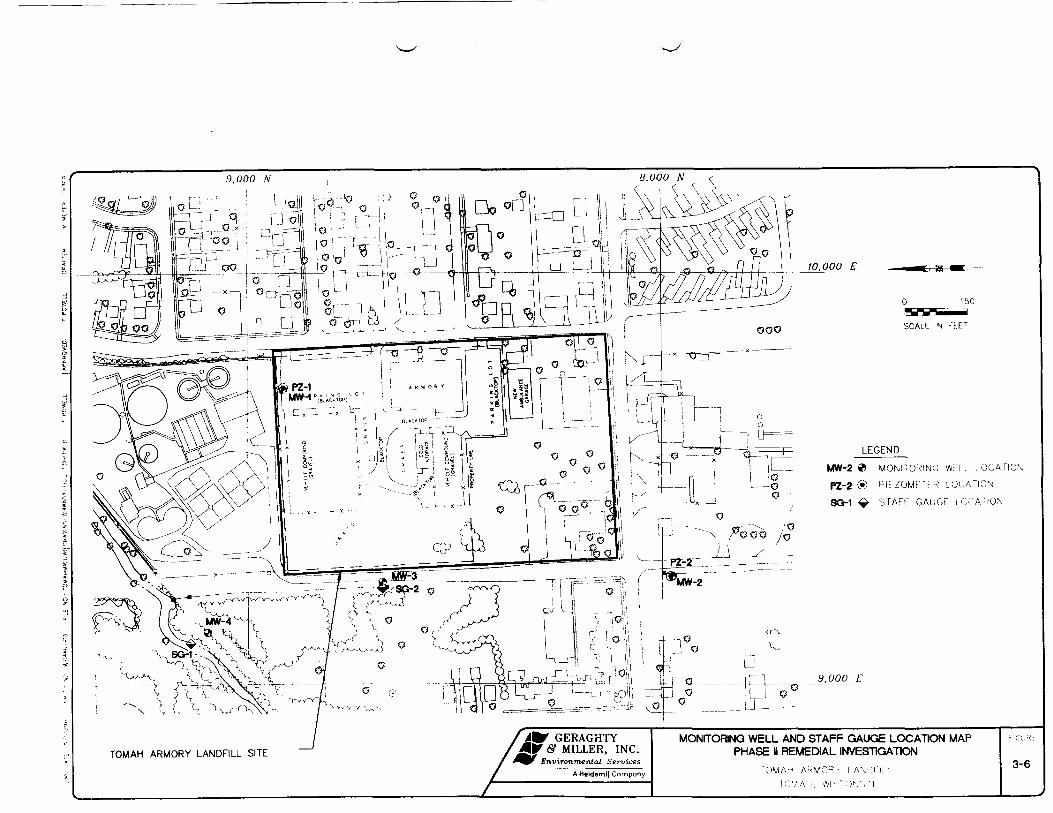
MW-2 « MONITORINC, Wi' l .L. ..CCATION
SQ-1 STAFF GAUGF LOCATION
TOMAH ARMORY LANDFILL SITEGERAGHTY
& MILLER, INC.Environmental Services
A Hcidemij Company
MONITORING WELL AND STAFF GAUGE LOCATION MAPPHASE II REMEDIAL INVESTIGATION
3-6

INTERPRETED BOUNDARY OF FILLBASED ON BY ANOMALOUSCONDUCTIVITY VALUES. DASHEDWHERE MFERREO.
EM-31 TERRAIN CONDUCTIVITY
PHASE II RlTOMAH ARMORY LANDFia
TOMAH. WISCONSIN
RGURE
4-1

6—— 5COE 600E 70 )E97770.9937683.3197540.9697400.2757371.0197314.249724*.27S71M.0457132.8757090.2357039.4758990.7558843.3756906.82
.1959817.4956774.1858740.3459687.7
.0759612.4358598.7996S3B.9656482.8458447.9758403.3
56386.7858319.3856270.6858216.6
56177.2656121.09
50 0 SO 100 15C
COLDSTORAGE
^ INTERPRETED BOUNDARY OF FILLS BASED ON ANOMALOUS TOTAL
f MAGNETIC FIELD VALUES./ DASHED WHERE INFERRED.
VEHICLECOMPOUND
56786.1755856.8255538.7455331.29
AMBULANCEGARAGE
APPROXIMATETOTAL MAGNETIC FIELD
S^GERAGHTY•TcSfMILLER, INC. TOTAL MAGNETIC FIELD INTENSITYAUTHOR STREET
PHASE II RlTOMAH ARMORY LANDFILL
TOMAH, WISCONSIN

150
SCALE IN FEET
LEGEND
EXTENT OF FILL(As determined by GeophysicalInvestigation and Test Pitcompletion)
_ _ _ _ APPROXIMATE PROPERTY LINE BOUNDARIES(COLOR VARIES)
TOMAH ARMORY LANDFILL SITEAS DEFINED IN THE ADMINISTRATIVEORDER ON CONSENT
WISCONSIN ARMORY NATIONALGUARD PROPERTY
HARRIS ALLEN TELECOMMUNICATION
MUSEUM PROPERTY
CITY OF TOMAH PROPERTY
MR. DAVID FILKINS PROPERTY
(LOTS 17, 18, 19, le 20)
GERAGHTY<ST MILLER, INC.
Sn-vvronmanialA Held emit Company
EXTENT OF FUL M RELATION TO EXBfTWQPROPSTTY BOUND ARES
PHASE II RlTOMAH ARMORY LANDFILL
TOMAH, WISCONSIN
FIGURE
4-3
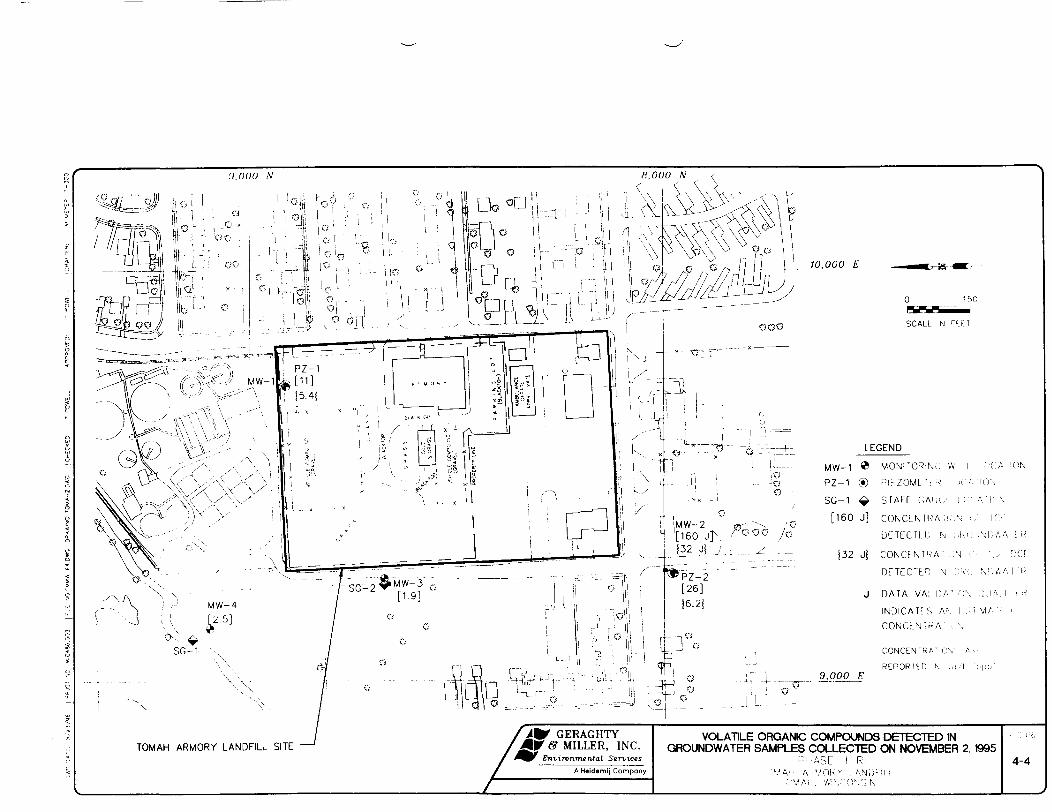
! 1.000 N 8.000 N
/O.OOO
LEGEND
MW-1 * MOMrcRiKi;; wi i . ::;'.APZ-1 ® Pl rZOML •; < , ;.".'.'.. ' U i N
SG-1 ^ STAFF GAL/./ I ; . : . .A ' l f ' i \
[160 J] CONCEMRA :'::\ • :•' ICT
DL'Tt'cn. i; N i'.K-';-..\i; 'v\'A|32 J j CONCEN1RA- v :N • . : • ' , /
DETECTED N • . ; : - / ; . . i \ ! / A A
9,000
CONCEN'RA: c\-REPORl tD A . . < ! •
TOMAH ARMORY LANDFILL SITE
A Heidemij Company
VOLATILE ORGANIC COMPOUNDS DETECTED INGROUNDWATER SAMPLES COLLECTED ON NOVEMBER 2, 1995
4-4

9.000 N
150
SCALE IN FEET
LEGENDMONITORING WE I.. ._CCA"ION
PIEZOMETER . C C A T I O N
STAFF GAUGE lOCAT lO \
[94 J] CONCENTRATION Cr TCE
DETECTED N vA'OLNDWAIER
J24 Jj CONCENTRA1IO\ 01 1,2 3Cf
DETECTED IN GROUNDWA1ER
(6.4 J) CONCENTRATION OF 1 , 2 - O C A
DETECTED IN GRO,ADrtAlE.R
J DATA V A U D A T O N Q J A L ; " ' E W
IND.GATES AN ESUMA^i- : ;CONCENTRATION
TOMAH ARMORY LANDFILL SITE 9_ GERAGHTY
lr & MILLER, INC.Environmental Sen/ices
AHaidemlj Compony
JL
VOLATILE ORGANIC COMPOUNDS DETECTED INGROUNDWATER SAMPLES COLLECTED ON FEBRUARY 13, 1996
- • .AST II Rli : . - M A r - VWORY . ANDF ILI
4-5

PZ-2 (i) PIEZOMETER LOCATION
SG-1 STAFF GAUGE LOCATION
A' CROSS-SECT IO
GERAGHTY& MILLER, INC.
Environmental Services
GEOLOGIC CROSS SECTION LOCATION MAPPHASf H Rl
"GMAH A R V O R Y LANDFILL' O V A * - . '/,5CONS :N
TOMAH ARMORY LANDFILL SITE

DWODATE: 22MAY96 PFUCTNO.: WI0486.004 FIL£ NO.: 1640 I DRAWING: OS CHECKED: RF APPROVED: DRAFTER: ELS
950
945
940
935
Z 930O
UJ 925UJ
920 -
915
910
SOUTH CROSS OVER POINTA WITH B-B'
PZ-02MW-2 MW-3 SG2 =
945.06
NORTHA1
MW-6
^•T-r^ '̂s '̂rr^sr^
150 300
HORIZONTAL SCALE IN FEETVERTICAL EXAGGERATION - 15X
LEGEND
SILT & SAND WITH VARIABLEAMOUNTS OF ORGANICS
943.62
SAND
SANDSTONE BEDROCK
WATER LEVELS MEASURED ONNOVEMBER 3,1995
WELL SCREEN
GROUNDWATER HEAD
BASE OF BOREHOLE
————— EXTRAPOLATEDGEOLOGIC CONTACT
— — — WATER TABLE
FT AMSL* = Feet Above Mean Sea Level.
^GERAGHTY& MILLER, INC.
Environmental Servicesa lwld*ml| company
GEOLOGICAL CROSS SECTION A-A1
PHASE II RlTOMAH ARMORY LANDFILL
TOMAH, WISCONSIN
FIGURE
4-7

SOUTHWESTB
CROSS OVER POINTWITH A-A'
PZ-02
NORTHEASTB'
LEGEND
847.12
915 H -.3zrrz:
910
HORIZONTAL SCALE IN FEETVERTICAL EXAGGERATION - 15X
TOPSOIUBLACKTOP
REFUSE
SILT & SAND WITH VARIABLEAMOUNTS OF ORGANICS
SAND
CLAY AND SILT
SANDSTONE BEDROCK
WATER LEVELS MEASURED ONNOVEMBER 3,1995
WELL SCREEN
GROUNDWATER HEAD
BASE OF BOREHOLE
EXTRAPOLATEDGEOLOGIC CONTACT
— — — WATER TABLE
FT AMSL- = Feet Above Mean Sea Level
jf. 'GERAGHTY'& MILLER, INC.Enrironmtittal Services
GEOLOGICAL CROSS SECTION B-B'
PHASE II RlTOMAH ARMORY LANDFILL
TOMAH, WISCONSIN
FIGURE
4-8
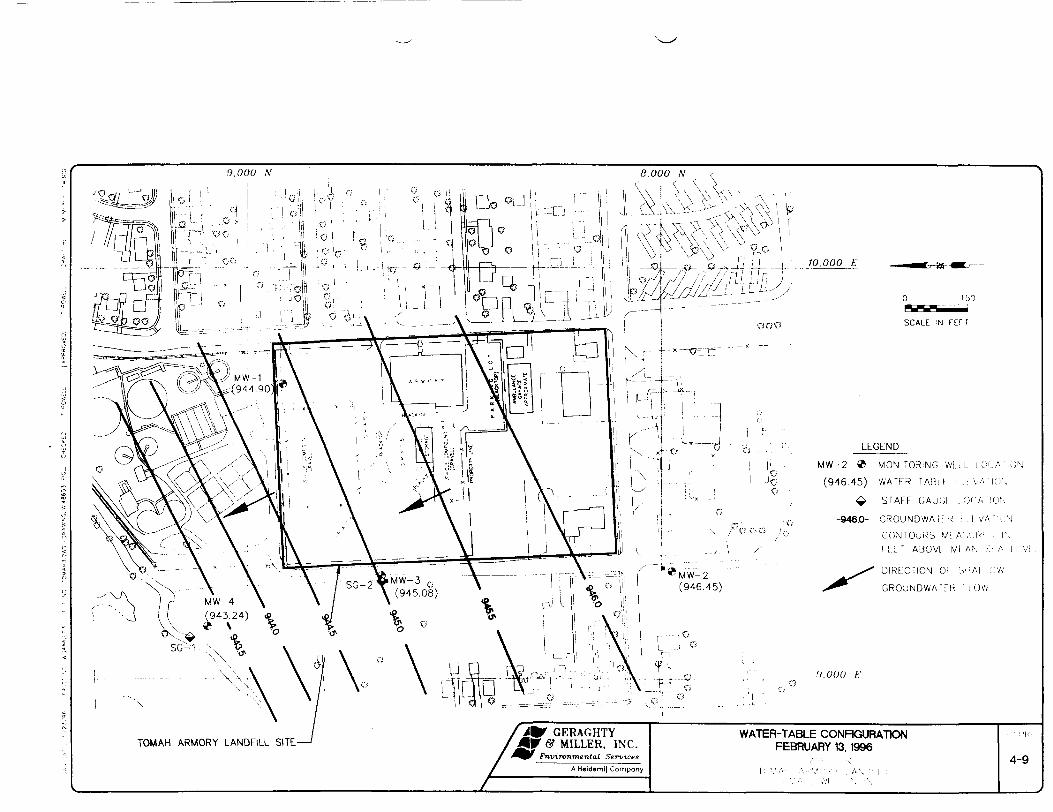
9,000 N
GERAGHTY& MILLER, INC.
Fnvironmental Services
70,000 £'
LEGEND
MW-2 » MONITORING Wl.: L I O L A " , O N
(946.45) WA*E :R TABU i ;.i v'A ~IC'K
V STAFF GAjGr ; OCA "ION
-946.0- GR OU N D WA i;' R 1 I VA -' 0 N
CONTOURS Mi A'.A.-K" J I',
K.i.'T A30VE N/l AN S: A 1 I VI
DIRECTION 01 SHAI CV;
GROJNDWAIFR : L O W
TOMAH ARMORY LANDFILL SITEWATER-TABLE CONFIGURATION
FEBRUARY 13, 19964-9

I DWG DATE: 5-10-96 IPPRJCT NO: W10486 002 I FILE NO: CAD-A1 I DRAWING: TOMAH1.DWG I CHECKED: RG I APPROVED: TP DRAFTER: MMEYER 1 = 13
r^
PFUMARYSOURCE
I '.-AN^'UCONTAMINATED ——
SOIL |
F XP[ANA rIDN
X INCOMP! FU F XPOSJRF_
• CUWPlF' f ( XPQSuRf (•
HUMAN RECEPTORS
PRWARY ON-SITE ON-SITE _. _.__RELEASE SECONDARY ^SSS"* EXPOSURE MAJNTENANCE TRESPASSER ,^^^0^
MECHANISMS SOURCES MEDIA tXPOSURE WORKER CHILD CONSTRUCTIONROUTE ADULT (6-15 YRS) WORKER
1 || — - • • v 1 1 0ERMAL 1 x x x
| [ ^ 1 1 U INHAIAHON X X X
SEEPS
t
-{ — ] —— -• s^ ——— LS^E — Bs-4 - - xx - 4 -;- : ^
L |[ OERWAL j • ~[ • [ X I
rnil i""-»t ^ ' >wi>i V { V | A |5011 JlNHAIATlON • • ) - " • - | • 1 X !
E DERMAL r X 1 X 1 •CQII INylb.lunj K K *
1 INHALATION X | X 1 •
3ATHWAV
ATHWAY
^^GEKAGHTY SITE CONCEPTUAL EXPOSURE MODEL FIGURF
4V&M\.\MR, INC. PTHASEI ii RI^K A-mnTtmTm-nMi Services TOM AH ARM OR Y [ AK DM H 5~1
lorrioh, W sconsir

EXTENT OF FILL(Ai determined by GeophysicalInvestigation and Test Pitcompletion)
500 YEAR FLOOD PLAIN
IDENTIFIED WETLAND LESSTHAN 2 ACRESSOURCE; WSCCNSN WETUMO NVENTDRT.MMR WREAU OF WATER REGULATIONAND 8MNO UAKCH 1068. RE9VED APRIL IM4
GERAGHTYMILLER, INC.
Awtammratai Sen/feu
FLOOD PLAN BOUNDAflES AND DENTFED WETLANDPHASE II Rl
TOM AH ARMORY LANDFlLLTOMAH, WISCONSIN
TOMAH ARMORY LANDFILL SITE
A H*H«nI Company