Embed Size (px)
Citation preview
January 29, 2018 | Sector Reports
Saudi Insurance Sector Q3 2017
albilad-capital.com/Research 1
The report depicts the performance of insurance sector in
Saudi Arabia during the third-quarter of 2017. The report
shows the main insurance indicators as gross premium
written, net premium earned, claims incurred and net
income for each of the sector and individual companies.
Research Scope: The report includes all the data of the
listed insurance companies in the Saudi Stock Market that
are licensed to issue insurance polices in any insurance
activity, except:
1. Saudi Reinsurance Company: The company is excluded
as its activity is not consistent with the remaining listed
insurance companies as the company operates in rein-
surance activity only.
Thus, the number of companies under coverage in this
report totaled 32 companies out of 33 listed companies.
For more information, please contact:
Turki Fadaak
Research & Advisory Manager
Insurance Sector Evolution with Growth Rates (SAR million)
Source: Insurance Companies filings, SAMA, Tadawul, CCHI, and
Albilad Capital.
Content
Overview 2
Insurance Structure 3
Insurance Sector Performance 4
Market Profitability 7
Health Insurance 8
General Insurance 9
Vehicle Insurance 10
Protection & Savings Insurance 11
Consolidated Financial Statements 12
Concentration of Insurance Segments 13
Financial Indicators 14
Appendixes 18
Executive Summary
The gross written premiums of the Saudi insurance sector edged down 1.2% in
9M 2017, hitting SAR 27.6 billion (USD 7.37 billion).
The insurance sector registered a 1.3% YoY decline in net claims incurred, posting
SAR 17.1 billion (USD 4.56bn) in 9M 2017.
The claims of health and vehicle lines of insurance captured 66% and 32%, respec-
tively of net claims incurred for the total market.
By the end of September 2017, insurance assets stretched 2.0% YoY, coming in at
SAR 55.95 billion (USD 14.92 billion).
The nine–month retention ratio climbed to 85.5% in 2017 compared with 83.2%
in 9M 2016. Likewise, the overall claims ratio of the insurance sector increased
slightly to 76.6% compared with 76.4% in the previous-year period.
Compulsory insurance lines - health and vehicle insurance - continues to dominate
the insurance sector, capturing 85% of the market’s total premiums.
The nine-month consolidated profit of the insurance sector tumbled 25% in 2017,
posting SAR 1.17 billion compared to SAR 1.55 billion in the same period of 2016.
There is still wide disparity in the individual performance of insurance companies,
with only three companies capturing 59% of the total insurance market.
-6.4%-1.4%
-2.4%
1.2%
-2.0%
-3.7%2.4%
3.1%
3.5%-2.8%
8.4%-1.5% 2.1% -1.0% 2.8%
0
2,000
4,000
6,000
8,000
10,000
12,000
Gross Written Premiums Net Written Premiums Net Claims Incurred
January 29, 2018 | Sector Reports
Saudi Insurance Sector
albilad-capital.com/Research 2
Overview
Real GDP edged down during the first and second quarters of 2017 by 0.53% and 1.03%, respectively. This economic slowdown was reflected in
overall premiums growth.
This comes after the insurance sector flourished during previous years with the support of improvement in the regulatory environment and enforce-
ment of the compulsory insurance for vehicles and health insurance, coupled with mounting awareness of the insurance ’s importance and the
growth of general insurance segment on new regulations.
Looking at the future, we expect that the government's direction to strengthen the non-oil sector will provide growth opportunities for the insurance
sector as a whole. The Ministry of Health is expected to start adding some government-owned hospitals into the insurance network, which will
significantly increase the number of accredited care providers. In addition, we believe that allowing women to drive could push up vehicle insurance
premiums even higher than current levels.
Furthermore, the Saudi Arabian Monetary Authority (SAMA) is expected to fasten insurance companies with the Traffic Police Department through
electronic terminals, to ensure enforcement of compulsory insurance on all vehicles and force motorists of illegally uninsured vehicles to buy insur-
ance coverage.
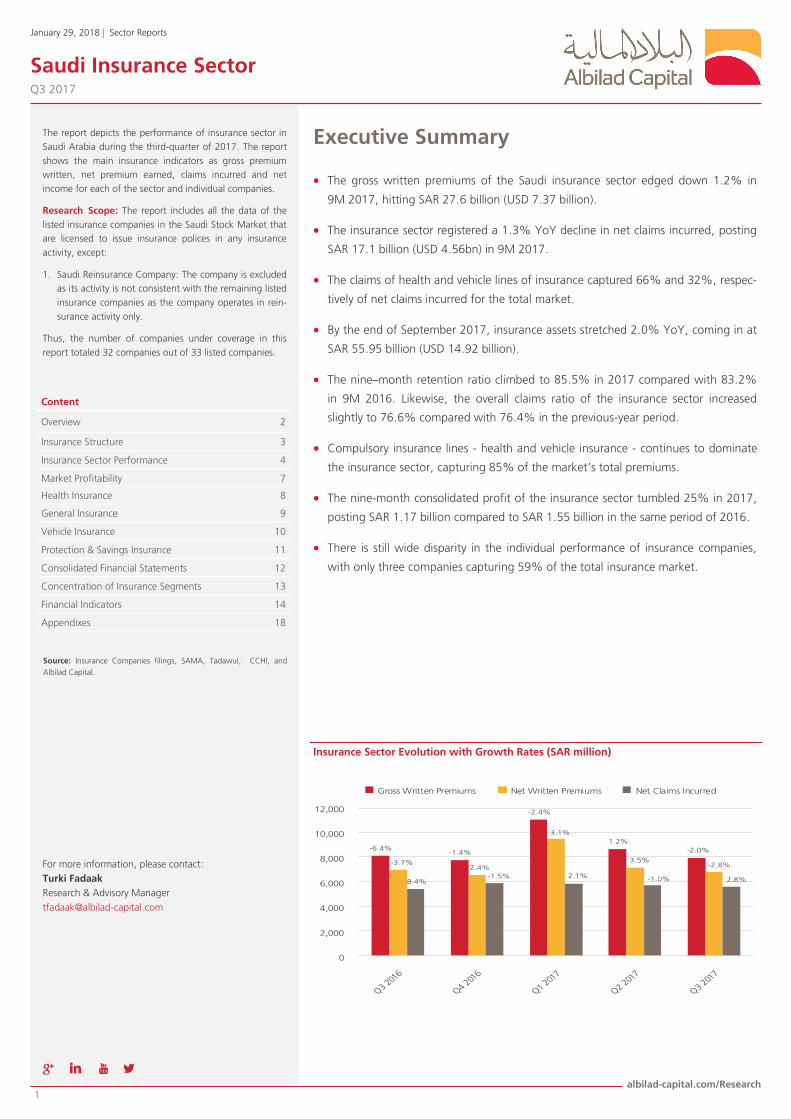
Contribution of the insurance sector to non-oil GDP remains low
The insurance penetration, which refers to the contribution of the insurance sector to non-oil GDP, came in at 2.3% in Q3 2017, which close to its
level in same period of 2016.
On the other hand, the insurance density rate — average insurance spending per capita — slipped 5.4% or SAR 14 to SAR 244 (USD 65) per capita
in Q3 2017 from SAR 258 (USD 68.8) per capita in Q3 2016.
Overall, the penetration and density rates of Saudi insurance are still relatively timid compared with mature insurance markets, which means that the
insurance sector is still in the process of growth and offer future opportunities that are unexploited yet.
Insurance Penetration Breakdown Insurance Density Breakdown (SAR)
Insurance sector penetration to non-oil GDP Insurance spending per capita (SAR)
258 245
340
266244
136 140 164 145 141
83 64
128
73 68
31 34
40
41 27
8 6
8
78
050
100150200250300350400
Health Vehicle General Insurance Protection & Saving
1.2% 1.2%1.5%
1.3% 1.2%
0.7%0.6%
1.1%
0.6% 0.6%
0.3% 0.3% 0.4% 0.4%0.2%
0.1% 0.1% 0.1% 0.1% 0.1%
Health Vehicle General Insurance Protection & Saving
2.35%2.10%
3.00%
2.5%2.3%
January 29, 2018 | Sector Reports
Saudi Insurance Sector
albilad-capital.com/Research 3
Insurance Structure
The Saudi Insurance consists of three business lines: health insurance, protection & savings
insurance, and general insurance, which in turn includes seven activities, namely: vehicle,
marine, aviation, energy, engineering, accidents & responsibilities, and property & fire insur-
ance.
Health insurance generated around 53% of the total market premiums
The health Insurance maintained its position as the largest insurance segment in the Saudi
market, with a market share of 52.9% in terms of gross premiums in 9M 2017, followed by
the vehicle insurance(1) which held 31.6%, then the general insurance with 12.8%. The
protection and savings insurance accounted for only 2.7% of the total market premiums.
Furthermore, the two compulsory insurance lines of health and vehicle insurance together
accounted for 85% of the market total premiums, leaving just 15% for the other segments.
Continue high concentration in the insurance sector
The insurance sector is still characterized by a high degree of concentration, as s result of an
overcrowded market by too many insurance companies. Bupa Arabia, Tawuniya, and AlRajhi
Takaful, the top three insurance companies in Saudi Arabia, enjoyed a combined market
share of 59% in Q3 2017. The ten largest companies by premiums seized 81% of total
premiums during the same period.
Service providers
The Saudi insurance sector has 33 listed insurers in the Saudi Stock Market, which operate
at least in one of the three major insurance lines. Moreover, all Saudi listed insurers operate
under the Takaful system or Islamic cooperative insurance scheme.
In general, there are twenty-seven companies qualified by Council of Cooperative Health
Insurance that offer health insurance services. Twenty-eight companies provide general in-
surance, while eleven companies offer protection and savings insurance.
(1) Vehicle Insurance was excluded from General Insurance due to its size.
Insurance Market Share - Q3 2017
Insurance Market Share Q3 2016 Q3 2017
1 Bupa Arabia 31.8% 31.7%
2 Tawuniya 15.3% 17.9%
3 AlRajhi Takaful 5.3% 9.3%
4 MEDGULF 6.3% 6.5%
5 AXA Cooperative 4.8% 4.6%
6 Walaa 3.3% 3.6%
7 Salama 1.6% 2.0%
8 SAICO 2.0% 2.0%
9 Wataniya 1.8% 1.9%
10 Allianz SF 2.2% 1.9%
11 ATC 1.4% 1.5%
12 U C A 0.8% 1.5%
13 Arabian Shield (1) 1.9% 1.5%
14 ACIG 1.7% 1.4%
15 METLIFE AIG ANB 0.4% 1.3%
16 Trade Union 3.4% 1.3%
17 WAFA Insurance (2) 1.1% 1.3%
18 Buruj 1.3% 1.2%
19 Malath Insuranc (3) 6.5% 0.8%
20 Sagr Insurance 0.2% 0.8%
21 Enaya 0.3% 0.7%
22 AICC 1.4% 0.7%
23 Al Alamiya 0.8% 0.7%
24 Al-Ahlia 0.5% 0.7%
25 Alinma Tokio M 0.6% 0.6%
26 SABB Takaful 0.5% 0.6%
27 CHUBB 0.5% 0.5%
28 Solidarity 0.7% 0.5%
29 Gulf Union 0.6% 0.4%
30 Jazira Takaful 0.3% 0.3%
31 Gulf General 0.5% 0.3%
32 Amana Insurance 0.1% 0.1%
Health
57.7%
Protection & Saving
3.3%
Vehicle
27.8%
Engineering
1.2%
Property
4.9%
Marine
0.6%
Others
4.5%
General Insurance
(1) It has banned from issuing, renewing or selling compulsory
vehicle insurance policies from Aug 8, 2017 until Nov 30,
2017.
(2) It has banned from issuing, renewing or selling compulsory
vehicle insurance policies from Aug 8, 2017 until now.
(3) It has banned from issuing, renewing or selling compulsory
vehicle insurance policies from Aug 8, 2017 until 6 Nov,
2017
January 29, 2018 | Sector Reports
Saudi Insurance Sector
albilad-capital.com/Research 4
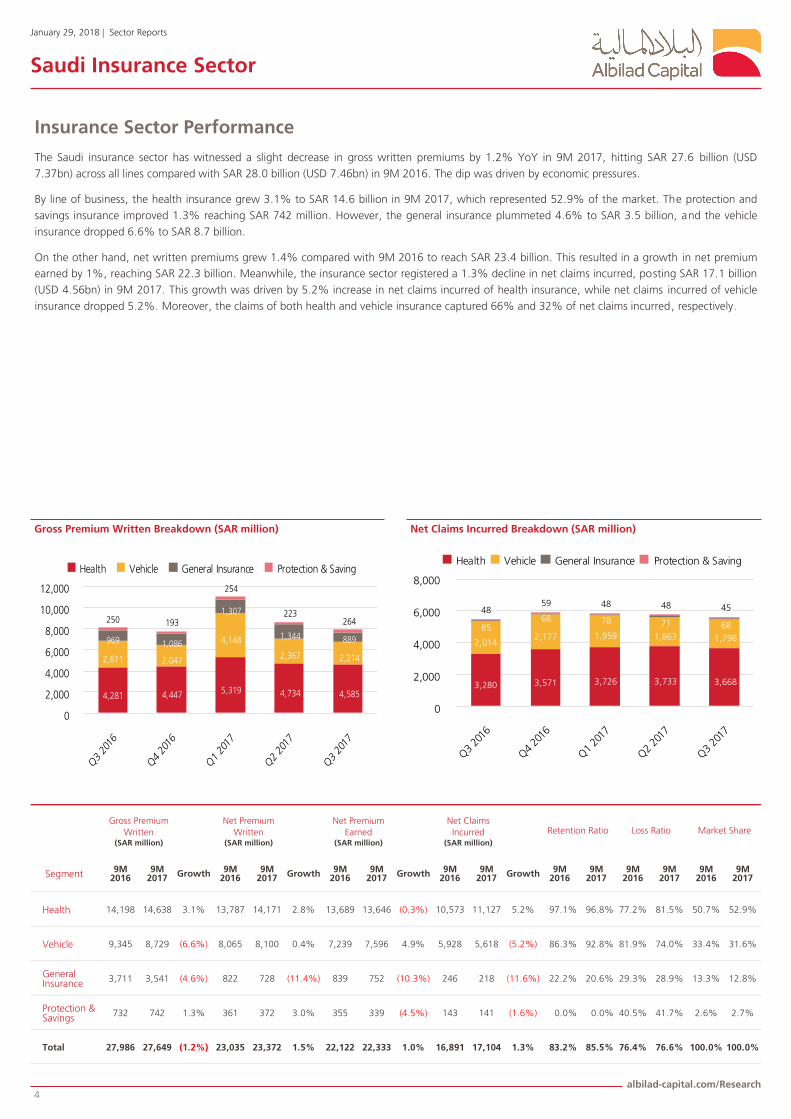
Insurance Sector Performance
The Saudi insurance sector has witnessed a slight decrease in gross written premiums by 1.2% YoY in 9M 2017, hitting SAR 27.6 billion (USD
7.37bn) across all lines compared with SAR 28.0 billion (USD 7.46bn) in 9M 2016. The dip was driven by economic pressures.
By line of business, the health insurance grew 3.1% to SAR 14.6 billion in 9M 2017, which represented 52.9% of the market. The protection and
savings insurance improved 1.3% reaching SAR 742 million. However, the general insurance plummeted 4.6% to SAR 3.5 billion, and the vehicle
insurance dropped 6.6% to SAR 8.7 billion.
On the other hand, net written premiums grew 1.4% compared with 9M 2016 to reach SAR 23.4 billion. This resulted in a growth in net premium
earned by 1%, reaching SAR 22.3 billion. Meanwhile, the insurance sector registered a 1.3% decline in net claims incurred, posting SAR 17.1 billion
(USD 4.56bn) in 9M 2017. This growth was driven by 5.2% increase in net claims incurred of health insurance, while net claims incurred of vehicle
insurance dropped 5.2%. Moreover, the claims of both health and vehicle insurance captured 66% and 32% of net claims incurred, respectively.
Gross Premium Written Breakdown (SAR million) Net Claims Incurred Breakdown (SAR million)
Gross Premium
Written (SAR million)
Net Premium
Written (SAR million)
Net Premium
Earned (SAR million)
Net Claims Incurred
(SAR million)
Retention Ratio Loss Ratio Market Share
Segment 9M 2016
9M 2017 Growth 9M
2016 9M
2017 Growth 9M 2016
9M 2017 Growth 9M
2016 9M
2017 Growth 9M 2016
9M 2017
9M 2016
9M 2017
9M 2016
9M 2017
Health 14,198 14,638 3.1% 13,787 14,171 2.8% 13,689 13,646 (0.3%) 10,573 11,127 5.2% 97.1% 96.8% 77.2% 81.5% 50.7% 52.9%
Vehicle 9,345 8,729 (6.6%) 8,065 8,100 0.4% 7,239 7,596 4.9% 5,928 5,618 (5.2%) 86.3% 92.8% 81.9% 74.0% 33.4% 31.6%
General Insurance
3,711 3,541 (4.6%) 822 728 (11.4%) 839 752 (10.3%) 246 218 (11.6%) 22.2% 20.6% 29.3% 28.9% 13.3% 12.8%
Protection & Savings
732 742 1.3% 361 372 3.0% 355 339 (4.5%) 143 141 (1.6%) 0.0% 0.0% 40.5% 41.7% 2.6% 2.7%
Total 27,986 27,649 (1.2%) 23,035 23,372 1.5% 22,122 22,333 1.0% 16,891 17,104 1.3% 83.2% 85.5% 76.4% 76.6% 100.0% 100.0%
4,281 4,447 5,319 4,734 4,585
2,611 2,047
4,148
2,367 2,214
969 1,086
1,307
1,344 889
250 193
254
223264
0
2,000
4,000
6,000
8,000
10,000
12,000
Health Vehicle General Insurance Protection & Saving
3,280 3,571 3,726 3,733 3,668
2,0142,177 1,959 1,863 1,796
8568 78 71 68
4859 48 48 45
0
2,000
4,000
6,000
8,000
Health Vehicle General Insurance Protection & Saving
January 29, 2018 | Sector Reports
Saudi Insurance Sector
albilad-capital.com/Research 5
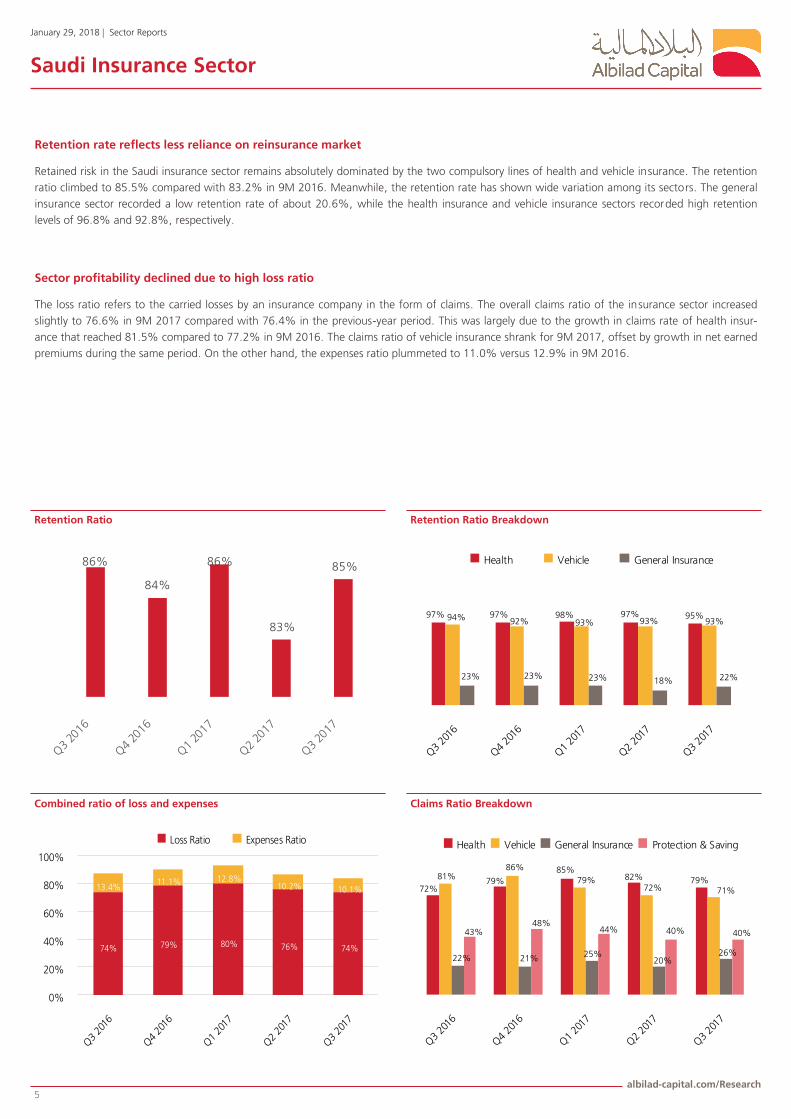
Retention rate reflects less reliance on reinsurance market
Retained risk in the Saudi insurance sector remains absolutely dominated by the two compulsory lines of health and vehicle insurance. The retention
ratio climbed to 85.5% compared with 83.2% in 9M 2016. Meanwhile, the retention rate has shown wide variation among its sectors. The general
insurance sector recorded a low retention rate of about 20.6%, while the health insurance and vehicle insurance sectors recorded high retention
levels of 96.8% and 92.8%, respectively.
Sector profitability declined due to high loss ratio
The loss ratio refers to the carried losses by an insurance company in the form of claims. The overall claims ratio of the insurance sector increased
slightly to 76.6% in 9M 2017 compared with 76.4% in the previous-year period. This was largely due to the growth in claims rate of health insur-
ance that reached 81.5% compared to 77.2% in 9M 2016. The claims ratio of vehicle insurance shrank for 9M 2017, offset by growth in net earned
premiums during the same period. On the other hand, the expenses ratio plummeted to 11.0% versus 12.9% in 9M 2016.
Combined ratio of loss and expenses Claims Ratio Breakdown
Retention Ratio Retention Ratio Breakdown
86%
84%
86%
83%
85%
97% 97% 98% 97% 95%94% 92% 93% 93% 93%
23% 23% 23% 18% 22%
Health Vehicle General Insurance
74% 79% 80% 76% 74%
13.4%11.1% 12.8%
10.2% 10.1%
0%
20%
40%
60%
80%
100%
Loss Ratio Expenses Ratio
72%79%
85%82% 79%81%
86%
79%72% 71%
22% 21% 25%20%
26%
43%48%
44% 40% 40%
Health Vehicle General Insurance Protection & Saving
January 29, 2018 | Sector Reports
Saudi Insurance Sector
albilad-capital.com/Research 6
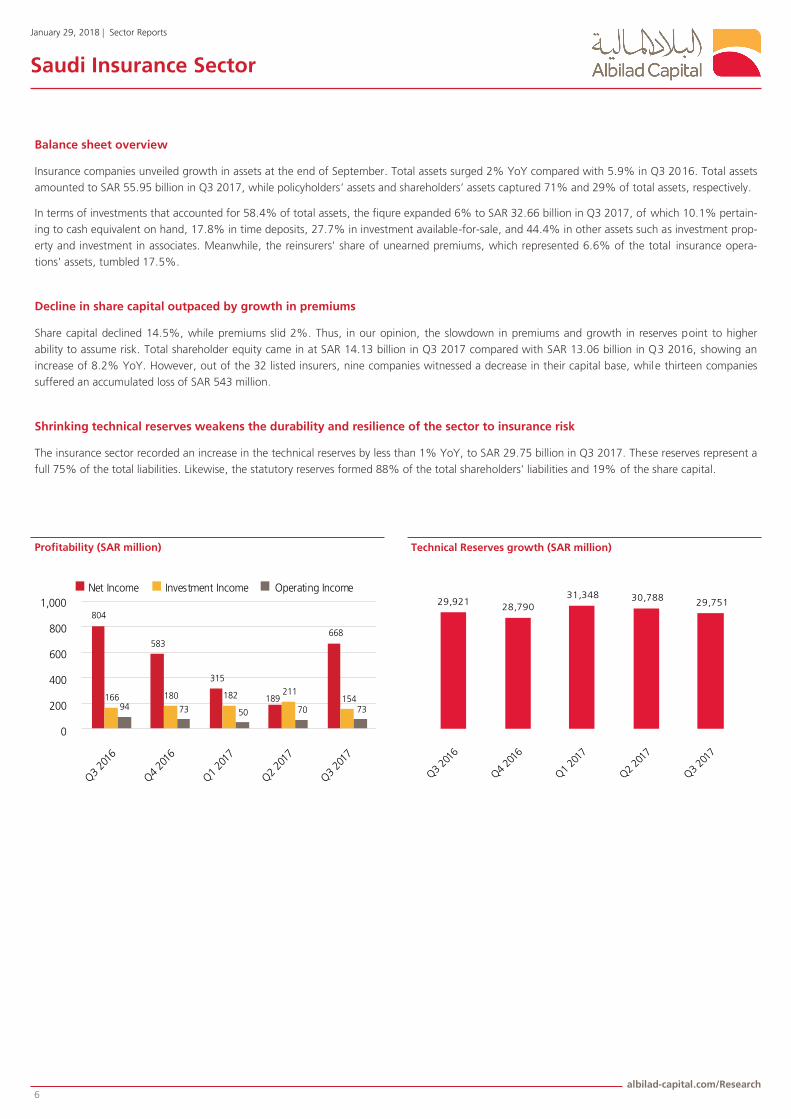
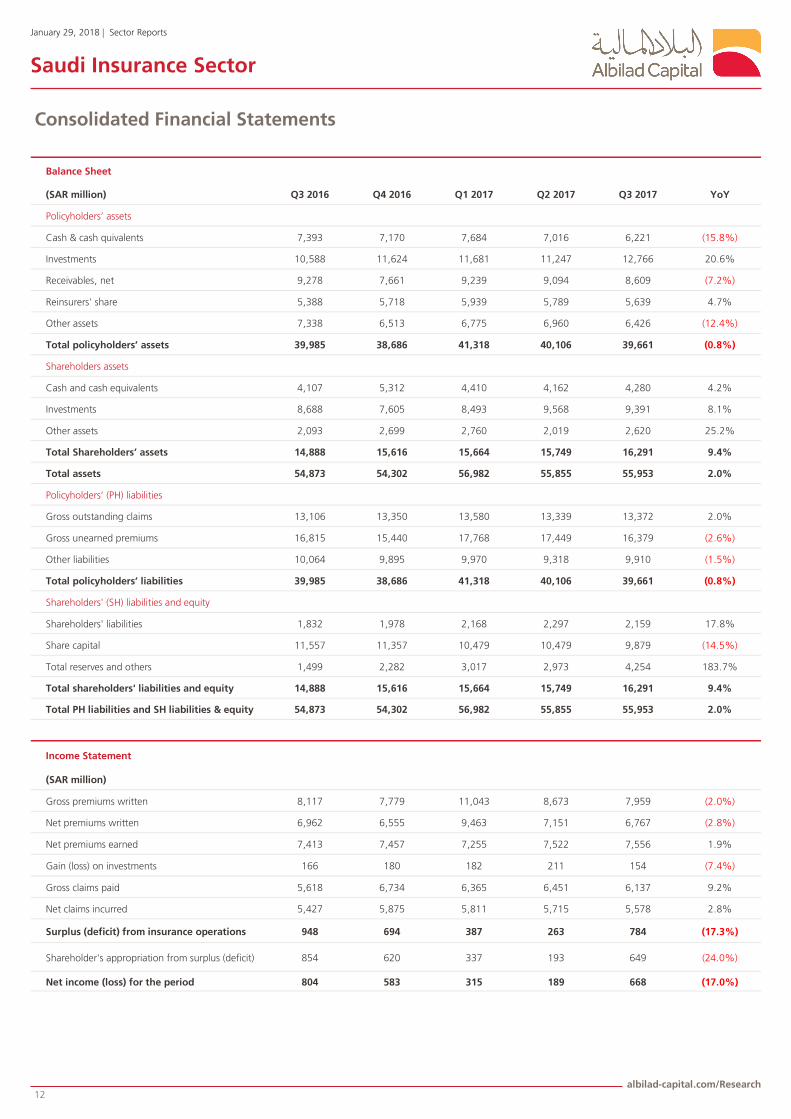
Balance sheet overview
Insurance companies unveiled growth in assets at the end of September. Total assets surged 2% YoY compared with 5.9% in Q3 2016. Total assets
amounted to SAR 55.95 billion in Q3 2017, while policyholders’ assets and shareholders’ assets captured 71% and 29% of total assets, respectively.
In terms of investments that accounted for 58.4% of total assets, the fiqure expanded 6% to SAR 32.66 billion in Q3 2017, of which 10.1% pertain-
ing to cash equivalent on hand, 17.8% in time deposits, 27.7% in investment available-for-sale, and 44.4% in other assets such as investment prop-
erty and investment in associates. Meanwhile, the reinsurers' share of unearned premiums, which represented 6.6% of the total insurance opera-
tions' assets, tumbled 17.5%.
Decline in share capital outpaced by growth in premiums
Share capital declined 14.5%, while premiums slid 2%. Thus, in our opinion, the slowdown in premiums and growth in reserves point to higher
ability to assume risk. Total shareholder equity came in at SAR 14.13 billion in Q3 2017 compared with SAR 13.06 billion in Q3 2016, showing an
increase of 8.2% YoY. However, out of the 32 listed insurers, nine companies witnessed a decrease in their capital base, while thirteen companies
suffered an accumulated loss of SAR 543 million.
Shrinking technical reserves weakens the durability and resilience of the sector to insurance risk
The insurance sector recorded an increase in the technical reserves by less than 1% YoY, to SAR 29.75 billion in Q3 2017. These reserves represent a
full 75% of the total liabilities. Likewise, the statutory reserves formed 88% of the total shareholders' liabilities and 19% of the share capital.
Technical Reserves growth (SAR million) Profitability (SAR million)
804
583
315
189
668
166 180 182 211154
94 73 50 70 73
0
200
400
600
800
1,000
Net Income Investment Income Operating Income29,921
28,790
31,348 30,78829,751
January 29, 2018 | Sector Reports
Saudi Insurance Sector
albilad-capital.com/Research 7
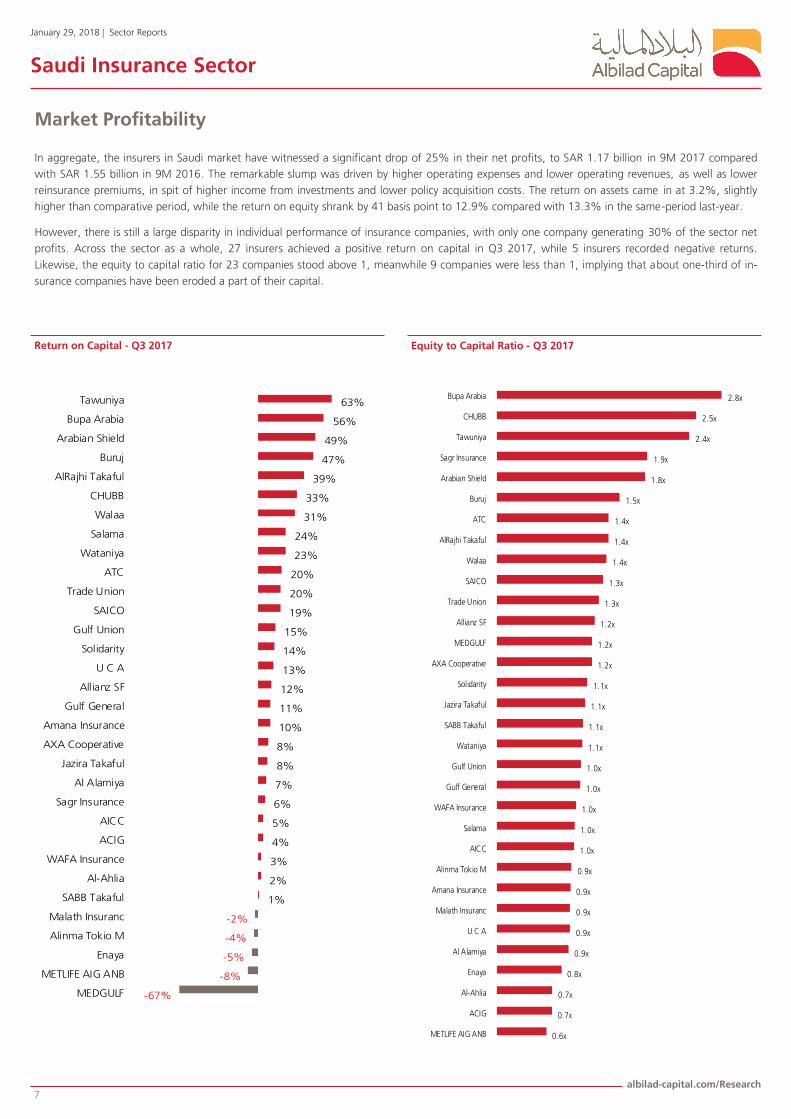
Market Profitability
In aggregate, the insurers in Saudi market have witnessed a significant drop of 25% in their net profits, to SAR 1.17 billion in 9M 2017 compared
with SAR 1.55 billion in 9M 2016. The remarkable slump was driven by higher operating expenses and lower operating revenues, as well as lower
reinsurance premiums, in spit of higher income from investments and lower policy acquisition costs. The return on assets came in at 3.2%, slightly
higher than comparative period, while the return on equity shrank by 41 basis point to 12.9% compared with 13.3% in the same-period last-year.
However, there is still a large disparity in individual performance of insurance companies, with only one company generating 30% of the sector net
profits. Across the sector as a whole, 27 insurers achieved a positive return on capital in Q3 2017, while 5 insurers recorded negative returns.
Likewise, the equity to capital ratio for 23 companies stood above 1, meanwhile 9 companies were less than 1, implying that about one-third of in-
surance companies have been eroded a part of their capital.
Return on Capital - Q3 2017 Equity to Capital Ratio - Q3 2017
-67%
-8%
-5%
-4%
-2%
1%
2%
3%
4%
5%
6%
7%
8%
8%
10%
11%
12%
13%
14%
15%
19%
20%
20%
23%
24%
31%
33%
39%
47%
49%
56%
63%
MEDGULF
METLIFE AIG ANB
Enaya
Alinma Tokio M
Malath Insuranc
SABB Takaful
Al-Ahlia
WAFA Insurance
ACIG
AICC
Sagr Insurance
Al Alamiya
Jazira Takaful
AXA Cooperative
Amana Insurance
Gulf General
Allianz SF
U C A
Solidarity
Gulf Union
SAICO
Trade Union
ATC
Wataniya
Salama
Walaa
CHUBB
AlRajhi Takaful
Buruj
Arabian Shield
Bupa Arabia
Tawuniya
0.6x
0.7x
0.7x
0.8x
0.9x
0.9x
0.9x
0.9x
0.9x
1.0x
1.0x
1.0x
1.0x
1.0x
1.1x
1.1x
1.1x
1.1x
1.2x
1.2x
1.2x
1.3x
1.3x
1.4x
1.4x
1.4x
1.5x
1.8x
1.9x
2.4x
2.5x
2.8x
METLIFE AIG ANB
ACIG
Al-Ahlia
Enaya
Al Alamiya
U C A
Malath Insuranc
Amana Insurance
Alinma Tokio M
AICC
Salama
WAFA Insurance
Gulf General
Gulf Union
Wataniya
SABB Takaful
Jazira Takaful
Solidarity
AXA Cooperative
MEDGULF
Allianz SF
Trade Union
SAICO
Walaa
AlRajhi Takaful
ATC
Buruj
Arabian Shield
Sagr Insurance
Tawuniya
CHUBB
Bupa Arabia

January 29, 2018 | Sector Reports
Saudi Insurance Sector
albilad-capital.com/Research 8
Health Insurance
A contraction of the insurance policies has reflected on the insurance premiums
The health insurance sector has registered an increase in gross written premiums by 3.1%,
posting SAR 14.6 billion in 9M 2017, in spite of a significant drop in the number of insur-
ance policies to 1.1 million policy during the same period, compared to 2.1 million policy in
9M 2016, primarily as a result of the introduction of employer unified document for the
private sector. The health insurance captured 52.9% of the total market size.
Despite the low reliance on reinsurance markets by insurers in the nine-month period of
2017, the retention ratio stood at the same level of the comparable period at around 97%.
Meantime, nine-month net claims incurred inflated 5.2% to SAR 11.1 billion. These factors
contributed to pushing the loss ratio to 81.5% in 9M 2017.
The largest companies continue to dominate the health insurance sector
Health insurance sector consisted of 27 listed insurers. However, Bupa Arabia, Tawuniya and
Medgulf have continued to dominate the sector, as they generated around 80.3% of the
total market premiums in Q3 2017. The other nine companies seized only 13.7% of the
market share, leaving just 6.1% for the remaining 15 listed insurers. This clearly indicates
that most insurers are unable to compete with larger peers in an overcrowded market.
Health providers
The number of accredited health care providers by the Health Insurance Council amounted
to 4,288 providers at the end of Q3 2017. Overall, the total number of accredited hospitals
reached 296 hospitals, and the number of hospital beds available to insured reached 51,411
beds. Furthermore, the number of doctors in all health care providers has rose to 47,203
doctors.
A decrease in the number of insured
The number of insured in health insurance has shrunk to 12.06 million at the end of Q3
2017. However, the number of Saudi nationals insured is estimated at 2.86 million, repre-
senting 22.3% of the total insureds, while the number of foreign residents hit nearly 9.37
million, or 77.7% of the total insureds.
Health Ins. Market Share Concentration - Q3 2017
Health Insurance Market Share Q3 2016 Q3 2017
1 Bupa Arabia 60.2% 55.0%
2 Tawuniya 15.5% 18.6%
3 MEDGULF 7.6% 6.6%
4 SAICO 2.1% 2.4%
5 AlRajhi Takaful 0.8% 2.0%
6 METLIFE AIG ANB 0.6% 1.7%
7 AXA Cooperative 2.1% 1.6%
8 Enaya 0.5% 1.3%
9 Arabian Shield 1.2% 1.3%
10 WAFA Insurance 0.7% 1.2%
11 Sagr Insurance 0.1% 1.1%
12 Trade Union 1.8% 1.1%
13 ACIG 1.3% 0.8%
14 Al-Ahlia 0.6% 0.7%
15 Buruj 0.6% 0.7%
16 Walaa 0.8% 0.7%
17 Allianz SF 0.6% 0.6%
18 AICC 0.7% 0.6%
19 Malath Insuranc 0.3% 0.5%
20 Solidarity 0.9% 0.4%
21 Salama 0.1% 0.3%
22 Gulf Union 0.4% 0.2%
23 U C A 0.4% 0.2%
24 Amana Insurance - 0.1%
25 Alinma Tokio M 0.0% 0.1%
26 Gulf General 0.1% 0.1%
27 Al Alamiya 0.0% 0.0%
Health Insurance (SAR million)
Q3 2016 Q3 2017 Growth 9M 2016 9M 2017 Growth
Gross Premium Written 4,281 4,585 %7.1 14,198 14,638 %3.1
Net Premium Written 4,140 4,378 %5.7 13,787 14,171 %2.8
Net Premium Earned 4,534 4,671 %3.0 13,689 13,646 %)0.3(
Net Claims Incurred 3,280 3,668 %11.8 10,573 11,127 %5.2
Retention Ratio 96.7% 95.5% %)1.2( 97.1% %96.8 %)0.3(
Claims Ratio 72.3% 78.5% %6.2 77.2% %81.5 %4.3
4 Companies
51%9 Companies
34%
15 Companies
15%
January 29, 2018 | Sector Reports
Saudi Insurance Sector
albilad-capital.com/Research 9
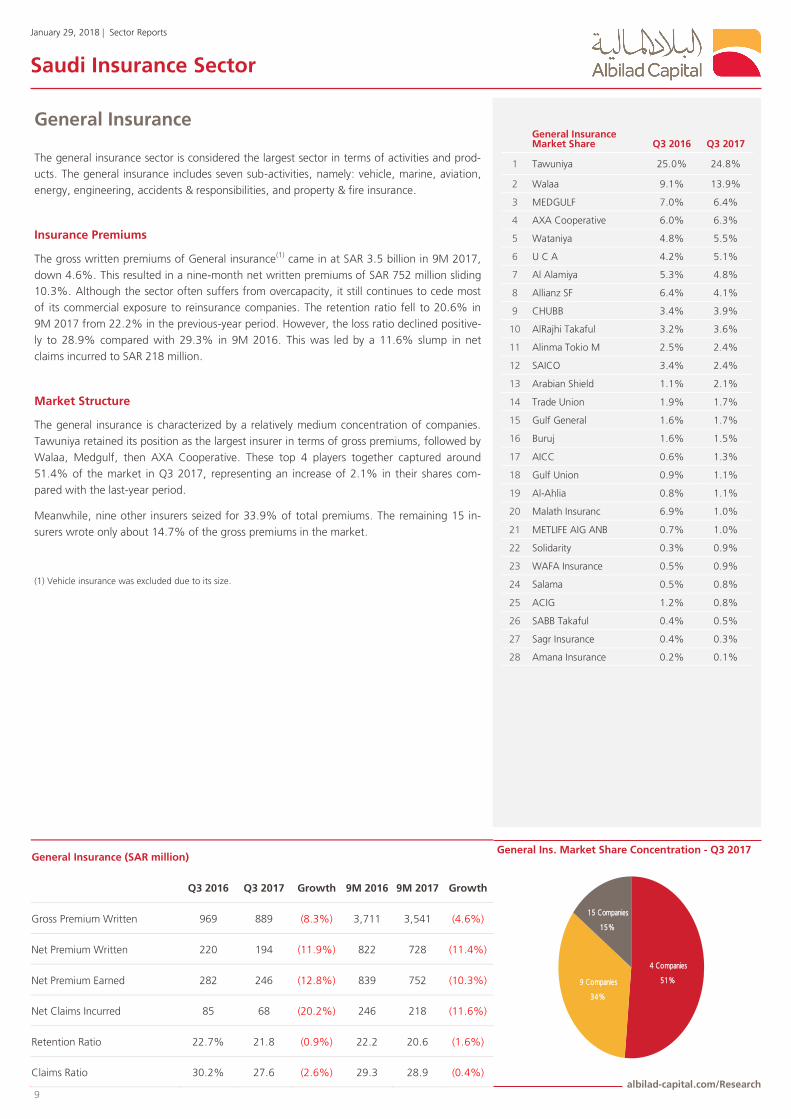
General Insurance
The general insurance sector is considered the largest sector in terms of activities and prod-
ucts. The general insurance includes seven sub-activities, namely: vehicle, marine, aviation,
energy, engineering, accidents & responsibilities, and property & fire insurance.
Insurance Premiums
The gross written premiums of General insurance(1) came in at SAR 3.5 billion in 9M 2017,
down 4.6%. This resulted in a nine-month net written premiums of SAR 752 million sliding
10.3%. Although the sector often suffers from overcapacity, it still continues to cede most
of its commercial exposure to reinsurance companies. The retention ratio fell to 20.6% in
9M 2017 from 22.2% in the previous-year period. However, the loss ratio declined positive-
ly to 28.9% compared with 29.3% in 9M 2016. This was led by a 11.6% slump in net
claims incurred to SAR 218 million.
Market Structure
The general insurance is characterized by a relatively medium concentration of companies.
Tawuniya retained its position as the largest insurer in terms of gross premiums, followed by
Walaa, Medgulf, then AXA Cooperative. These top 4 players together captured around
51.4% of the market in Q3 2017, representing an increase of 2.1% in their shares com-
pared with the last-year period.
Meanwhile, nine other insurers seized for 33.9% of total premiums. The remaining 15 in-
surers wrote only about 14.7% of the gross premiums in the market.
(1) Vehicle insurance was excluded due to its size.
General Ins. Market Share Concentration - Q3 2017 General Insurance (SAR million)
Q3 2016 Q3 2017 Growth 9M 2016 9M 2017 Growth
Gross Premium Written 969 889 %)8.3( 3,711 3,541 %)4.6(
Net Premium Written 220 194 %)11.9( 822 728 %)11.4(
Net Premium Earned 282 246 %)12.8( 839 752 %)10.3(
Net Claims Incurred 85 68 %)20.2( 246 218 %)11.6(
Retention Ratio %22.7 21.8 %)0.9( 22.2 20.6 %)1.6(
Claims Ratio %30.2 27.6 %)2.6( 29.3 28.9 %)0.4(
4 Companies
51%9 Companies
34%
15 Companies
15%
General Insurance Market Share Q3 2016 Q3 2017
1 Tawuniya 25.0% 24.8%
2 Walaa 9.1% 13.9%
3 MEDGULF 7.0% 6.4%
4 AXA Cooperative 6.0% 6.3%
5 Wataniya 4.8% 5.5%
6 U C A 4.2% 5.1%
7 Al Alamiya 5.3% 4.8%
8 Allianz SF 6.4% 4.1%
9 CHUBB 3.4% 3.9%
10 AlRajhi Takaful 3.2% 3.6%
11 Alinma Tokio M 2.5% 2.4%
12 SAICO 3.4% 2.4%
13 Arabian Shield 1.1% 2.1%
14 Trade Union 1.9% 1.7%
15 Gulf General 1.6% 1.7%
16 Buruj 1.6% 1.5%
17 AICC 0.6% 1.3%
18 Gulf Union 0.9% 1.1%
19 Al-Ahlia 0.8% 1.1%
20 Malath Insuranc 6.9% 1.0%
21 METLIFE AIG ANB 0.7% 1.0%
22 Solidarity 0.3% 0.9%
23 WAFA Insurance 0.5% 0.9%
24 Salama 0.5% 0.8%
25 ACIG 1.2% 0.8%
26 SABB Takaful 0.4% 0.5%
27 Sagr Insurance 0.4% 0.3%
28 Amana Insurance 0.2% 0.1%
January 29, 2018 | Sector Reports
Saudi Insurance Sector
albilad-capital.com/Research 10
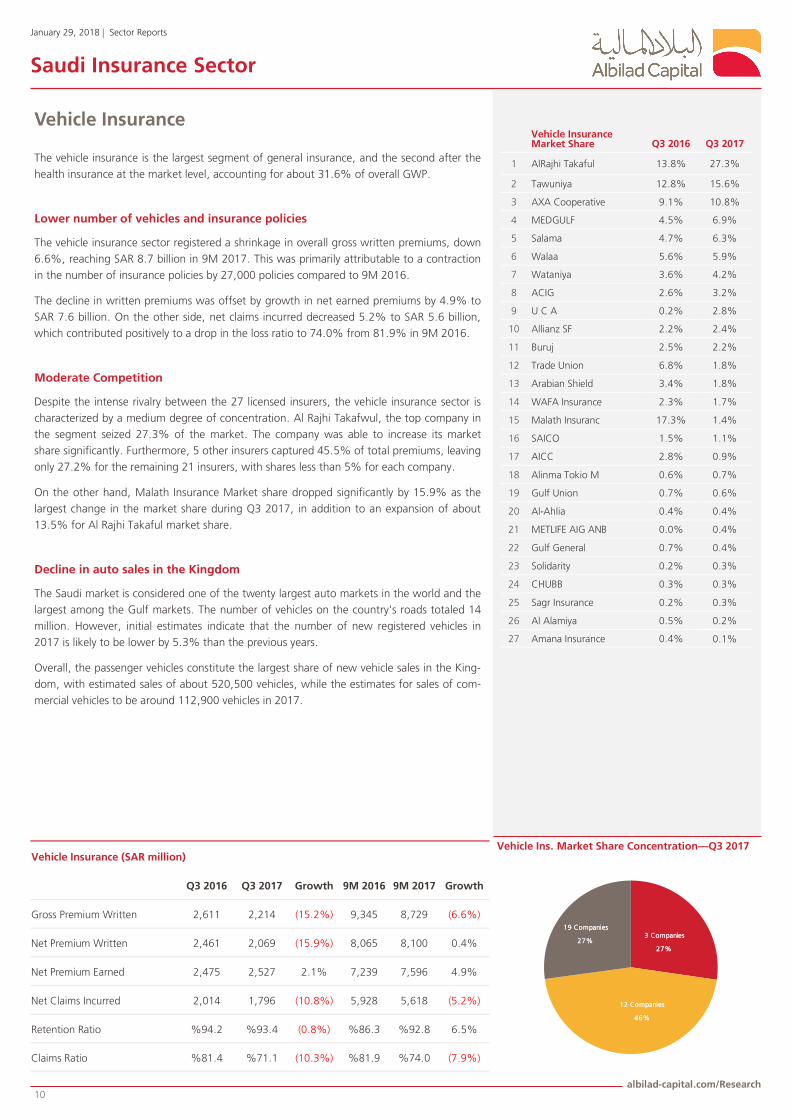
Vehicle Insurance
The vehicle insurance is the largest segment of general insurance, and the second after the
health insurance at the market level, accounting for about 31.6% of overall GWP.
Lower number of vehicles and insurance policies
The vehicle insurance sector registered a shrinkage in overall gross written premiums, down
6.6%, reaching SAR 8.7 billion in 9M 2017. This was primarily attributable to a contraction
in the number of insurance policies by 27,000 policies compared to 9M 2016.
The decline in written premiums was offset by growth in net earned premiums by 4.9% to
SAR 7.6 billion. On the other side, net claims incurred decreased 5.2% to SAR 5.6 billion,
which contributed positively to a drop in the loss ratio to 74.0% from 81.9% in 9M 2016.
Moderate Competition
Despite the intense rivalry between the 27 licensed insurers, the vehicle insurance sector is
characterized by a medium degree of concentration. Al Rajhi Takafwul, the top company in
the segment seized 27.3% of the market. The company was able to increase its market
share significantly. Furthermore, 5 other insurers captured 45.5% of total premiums, leaving
only 27.2% for the remaining 21 insurers, with shares less than 5% for each company.
On the other hand, Malath Insurance Market share dropped significantly by 15.9% as the
largest change in the market share during Q3 2017, in addition to an expansion of about
13.5% for Al Rajhi Takaful market share.
Decline in auto sales in the Kingdom
The Saudi market is considered one of the twenty largest auto markets in the world and the
largest among the Gulf markets. The number of vehicles on the country's roads totaled 14
million. However, initial estimates indicate that the number of new registered vehicles in
2017 is likely to be lower by 5.3% than the previous years.
Overall, the passenger vehicles constitute the largest share of new vehicle sales in the King-
dom, with estimated sales of about 520,500 vehicles, while the estimates for sales of com-
mercial vehicles to be around 112,900 vehicles in 2017.
Vehicle Ins. Market Share Concentration—Q3 2017
Vehicle Insurance Market Share Q3 2016 Q3 2017
1 AlRajhi Takaful 13.8% 27.3%
2 Tawuniya 12.8% 15.6%
3 AXA Cooperative 9.1% 10.8%
4 MEDGULF 4.5% 6.9%
5 Salama 4.7% 6.3%
6 Walaa 5.6% 5.9%
7 Wataniya 3.6% 4.2%
8 ACIG 2.6% 3.2%
9 U C A 0.2% 2.8%
10 Allianz SF 2.2% 2.4%
11 Buruj 2.5% 2.2%
12 Trade Union 6.8% 1.8%
13 Arabian Shield 3.4% 1.8%
14 WAFA Insurance 2.3% 1.7%
15 Malath Insuranc 17.3% 1.4%
16 SAICO 1.5% 1.1%
17 AICC 2.8% 0.9%
18 Alinma Tokio M 0.6% 0.7%
19 Gulf Union 0.7% 0.6%
20 Al-Ahlia 0.4% 0.4%
21 METLIFE AIG ANB 0.0% 0.4%
22 Gulf General 0.7% 0.4%
23 Solidarity 0.2% 0.3%
24 CHUBB 0.3% 0.3%
25 Sagr Insurance 0.2% 0.3%
26 Al Alamiya 0.5% 0.2%
27 Amana Insurance 0.4% 0.1%
Vehicle Insurance (SAR million)
Q3 2016 Q3 2017 Growth 9M 2016 9M 2017 Growth
Gross Premium Written 2,611 2,214 %)15.2( 9,345 8,729 %)6.6(
Net Premium Written 2,461 2,069 %)15.9( 8,065 8,100 %0.4
Net Premium Earned 2,475 2,527 %2.1 7,239 7,596 %4.9
Net Claims Incurred 2,014 1,796 %)10.8( 5,928 5,618 %)5.2(
Retention Ratio 94.2% 93.4% %)0.8( 86.3% 92.8% %6.5
Claims Ratio 81.4% 71.1% %)10.3( 81.9% 74.0% %)7.9(
3 Companies
27%
12 Companies
46%
19 Companies
27%

January 29, 2018 | Sector Reports
Saudi Insurance Sector
albilad-capital.com/Research 11
Protection & Savings Insurance
The share of protection and savings insurance is the lowest among all other insurance seg-
ments, which represented just 2.7% of overall gross written premiums.
The low market share for the protection and savings insurance is attributed to several factors
including the modernity of the Saudi insurance sector, poor savings culture, in addition to
religious considerations of many categories of the community towards the protection and
savings products as illegal.
Insurance Premiums
The sector saw gross premiums written increase by 1.3% to SAR 742 million in 9M 2017,
despite the reduction in the number of insurance policies by 6.9% (15.3 thousand policies).
On the other hand, the loss ratio grew to 41.7% in 9M 2017 compared with 40.5% in the
previous-year period, owing to the dip in premiums earned by 4.5%. Net claims incurred
declined to SAR 141 million during the nine-month of the current year.
Market Structure
The protection and savings insurance market consisted of 11 insurers. Yet, the top four
companies held over 81.9% of the market in Q3 2017. The remaining 7 insurers had
only about 18.1% of the gross premiums in the market.
Protect & Saving Inc. Market Share Concentration - Q3 2017
Market Share Q3 2016 Q3 2017
1 ATC 45.9% 45.3%
2 SABB Takaful 15.9% 15.3%
3 Allianz SF 12.6% 10.9%
4 Jazira Takaful 11.2% 10.5%
5 AlRajhi Takaful 2.8% 5.4%
6 Wataniya 3.2% 3.7%
7 Al Alamiya - 2.8%
8 Alinma Tokio M 2.7% 2.7%
9 METLIFE AIG ANB 1.7% 2.3%
10 AXA Cooperative 0.7% 0.7%
11 Solidarity 3.4% 0.5%
Protection & Savings Insurance (SAR million)
Q3 2016 Q3 2017 Growth 9M 2016 9M 2017 Growth
Gross Premium Written 250 264 %5.6 732 742 %1.3
Net Premium Written 124 126 %1.9 361 372 %3.0
Net Premium Earned 112 112 %0.2 355 339 %)4.5(
Net Claims Incurred 48 45 %)5.0( 143 141 %)1.6(
Claims Ratio 42.6% 40.4% %)2.2( 40.5% 41.7% %1.2
4 Companies
82%
7 Companies
18%
January 29, 2018 | Sector Reports
Saudi Insurance Sector
albilad-capital.com/Research 12
Consolidated Financial Statements
Balance Sheet
(SAR million) Q3 2016 Q4 2016 Q1 2017 Q2 2017 Q3 2017 YoY
Policyholders’ assets
Cash & cash quivalents 7,393 7,170 7,684 7,016 6,221 %)15.8(
Investments 10,588 11,624 11,681 11,247 12,766 %20.6
Receivables, net 9,278 7,661 9,239 9,094 8,609 %)7.2(
Reinsurers' share 5,388 5,718 5,939 5,789 5,639 %4.7
Other assets 7,338 6,513 6,775 6,960 6,426 %)12.4(
Total policyholders’ assets 39,985 38,686 41,318 40,106 39,661 %)0.8(
Shareholders assets
Cash and cash equivalents 4,107 5,312 4,410 4,162 4,280 %4.2
Investments 8,688 7,605 8,493 9,568 9,391 %8.1
Other assets 2,093 2,699 2,760 2,019 2,620 %25.2
Total Shareholders’ assets 14,888 15,616 15,664 15,749 16,291 %9.4
Total assets 54,873 54,302 56,982 55,855 55,953 %2.0
Policyholders’ (PH) liabilities
Gross outstanding claims 13,106 13,350 13,580 13,339 13,372 %2.0
Gross unearned premiums 16,815 15,440 17,768 17,449 16,379 %)2.6(
Other liabilities 10,064 9,895 9,970 9,318 9,910 %)1.5(
Total policyholders’ liabilities 39,985 38,686 41,318 40,106 39,661 %)0.8(
Shareholders' (SH) liabilities and equity
Shareholders' liabilities 1,832 1,978 2,168 2,297 2,159 %17.8
Share capital 11,557 11,357 10,479 10,479 9,879 %)14.5(
Total reserves and others 1,499 2,282 3,017 2,973 4,254 %183.7
Total shareholders' liabilities and equity 14,888 15,616 15,664 15,749 16,291 %9.4
Total PH liabilities and SH liabilities & equity 54,873 54,302 56,982 55,855 55,953 %2.0
Income Statement
(SAR million)
Gross premiums written 8,117 7,779 11,043 8,673 7,959 %)2.0(
Net premiums written 6,962 6,555 9,463 7,151 6,767 %)2.8(
Net premiums earned 7,413 7,457 7,255 7,522 7,556 %1.9
Gain (loss) on investments 166 180 182 211 154 %)7.4(
Gross claims paid 5,618 6,734 6,365 6,451 6,137 %9.2
Net claims incurred 5,427 5,875 5,811 5,715 5,578 %2.8
Surplus (deficit) from insurance operations 948 694 387 263 784 %)17.3(
Shareholder's appropriation from surplus (deficit) 854 620 337 193 649 %)24.0(
Net income (loss) for the period 804 583 315 189 668 %)17.0(
January 29, 2018 | Sector Reports
Saudi Insurance Sector
albilad-capital.com/Research 13
Concentration of Insurance Segments per Company
Concentration of Insurance Segments per Company
Company Health Insurance Vehicle Insurance General Insurance Protection & Savings Total
Health Insurance
Bupa Arabia 100.0% 0.0% 0.0% 0.0% 100.0%
Enaya 100.0% 0.0% 0.0% 0.0% 100.0%
Sagr Insurance 85.5% 10.2% 4.3% 0.0% 100.0%
METLIFE AIG ANB 77.6% 7.7% 8.7% 6.0% 100.0%
SAICO 71.3% 15.4% 13.3% 0.0% 100.0%
Amana Insurance 67.6% 21.3% 11.1% 0.0% 100.0%
Al-Ahlia 64.0% 18.4% 17.7% 0.0% 100.0%
Tawuniya 60.1% 24.3% 15.5% 0.0% 100.0%
MEDGULF 59.0% 29.9% 11.1% 0.0% 100.0%
WAFA Insurance 53.5% 38.3% 8.2% 0.0% 100.0%
Solidarity 53.2% 20.7% 22.2% 3.9% 100.0%
Arabian Shield 50.4% 33.7% 16.0% 0.0% 100.0%
Vehicle Insurance
Salama 8.0% 87.4% 4.6% 0.0% 100.0%
AlRajhi Takaful 12.3% 81.4% 4.3% 1.9% 100.0%
AXA Cooperative 19.5% 64.8% 15.1% 0.5% 100.0%
ACIG 31.7% 62.3% 6.1% 0.0% 100.0%
Wataniya 0.0% 61.5% 32.1% 6.4% 100.0%
U C A 7.8% 53.0% 39.3% 0.0% 100.0%
Malath Insuranc 34.1% 51.5% 14.4% 0.0% 100.0%
Buruj 35.1% 50.7% 14.2% 0.0% 100.0%
General Insurance
CHUBB 0.0% 17.6% 82.4% 0.0% 100.0%
Al Alamiya 2.2% 9.6% 75.3% 12.9% 100.0%
Gulf General 11.4% 30.9% 57.7% 0.0% 100.0%
Protection & Savings
Jazira Takaful 0.0% 0.0% 0.0% 100.0% 100.0%
ATC 0.0% 0.0% 0.0% 100.0% 100.0%
SABB Takaful 0.0% 0.0% 10.3% 89.7% 100.0%
Multi Insurance
Allianz SF 20.0% 35.8% 24.7% 19.5% 100.0%
Alinma Tokio M 11.3% 32.4% 42.3% 14.1% 100.0%
AICC 47.7% 33.2% 19.1% 0.0% 100.0%
Walaa 10.5% 46.0% 43.5% 0.0% 100.0%
Trade Union 47.2% 37.8% 14.9% 0.0% 100.0%
Gulf Union 28.1% 41.4% 30.5% 0.0% 100.0%
January 29, 2018 | Sector Reports
Saudi Insurance Sector
albilad-capital.com/Research 14
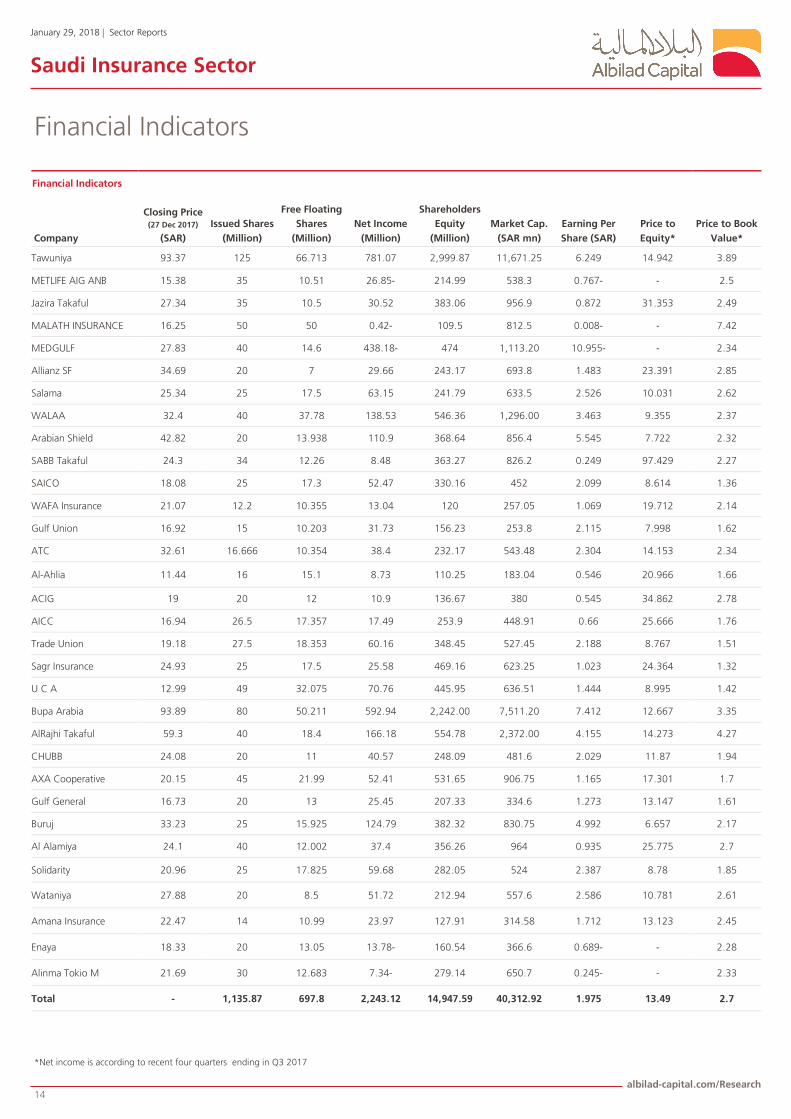
Financial Indicators
Financial Indicators
Company
Closing Price(27 Dec 2017)
(SAR)
Issued Shares
(Million)
Free Floating
Shares
(Million)
Net Income
(Million)
Shareholders
Equity
(Million)
Market Cap.
(SAR mn)
Earning Per
Share (SAR)
Price to
Equity*
Price to Book
Value*
Tawuniya 93.37 125 66.713 781.07 2,999.87 11,671.25 6.249 14.942 3.89
METLIFE AIG ANB 15.38 35 10.51 -26.85 214.99 538.3 -0.767 - 2.5
Jazira Takaful 27.34 35 10.5 30.52 383.06 956.9 0.872 31.353 2.49
MALATH INSURANCE 16.25 50 50 -0.42 109.5 812.5 -0.008 - 7.42
MEDGULF 27.83 40 14.6 -438.18 474 1,113.20 -10.955 - 2.34
Allianz SF 34.69 20 7 29.66 243.17 693.8 1.483 23.391 2.85
Salama 25.34 25 17.5 63.15 241.79 633.5 2.526 10.031 2.62
WALAA 32.4 40 37.78 138.53 546.36 1,296.00 3.463 9.355 2.37
Arabian Shield 42.82 20 13.938 110.9 368.64 856.4 5.545 7.722 2.32
SABB Takaful 24.3 34 12.26 8.48 363.27 826.2 0.249 97.429 2.27
SAICO 18.08 25 17.3 52.47 330.16 452 2.099 8.614 1.36
WAFA Insurance 21.07 12.2 10.355 13.04 120 257.05 1.069 19.712 2.14
Gulf Union 16.92 15 10.203 31.73 156.23 253.8 2.115 7.998 1.62
ATC 32.61 16.666 10.354 38.4 232.17 543.48 2.304 14.153 2.34
Al-Ahlia 11.44 16 15.1 8.73 110.25 183.04 0.546 20.966 1.66
ACIG 19 20 12 10.9 136.67 380 0.545 34.862 2.78
AICC 16.94 26.5 17.357 17.49 253.9 448.91 0.66 25.666 1.76
Trade Union 19.18 27.5 18.353 60.16 348.45 527.45 2.188 8.767 1.51
Sagr Insurance 24.93 25 17.5 25.58 469.16 623.25 1.023 24.364 1.32
U C A 12.99 49 32.075 70.76 445.95 636.51 1.444 8.995 1.42
Bupa Arabia 93.89 80 50.211 592.94 2,242.00 7,511.20 7.412 12.667 3.35
AlRajhi Takaful 59.3 40 18.4 166.18 554.78 2,372.00 4.155 14.273 4.27
CHUBB 24.08 20 11 40.57 248.09 481.6 2.029 11.87 1.94
AXA Cooperative 20.15 45 21.99 52.41 531.65 906.75 1.165 17.301 1.7
Gulf General 16.73 20 13 25.45 207.33 334.6 1.273 13.147 1.61
Buruj 33.23 25 15.925 124.79 382.32 830.75 4.992 6.657 2.17
Al Alamiya 24.1 40 12.002 37.4 356.26 964 0.935 25.775 2.7
Solidarity 20.96 25 17.825 59.68 282.05 524 2.387 8.78 1.85
Wataniya 27.88 20 8.5 51.72 212.94 557.6 2.586 10.781 2.61
Amana Insurance 22.47 14 10.99 23.97 127.91 314.58 1.712 13.123 2.45
Enaya 18.33 20 13.05 -13.78 160.54 366.6 -0.689 - 2.28
Alinma Tokio M 21.69 30 12.683 -7.34 279.14 650.7 -0.245 - 2.33
Total - 1,135.87 697.8 2,243.12 14,947.59 40,312.92 1.975 13.49 2.7
Net income is according to recent four quarters ending in Q3 2017*
January 29, 2018 | Sector Reports
Saudi Insurance Sector
albilad-capital.com/Research 15
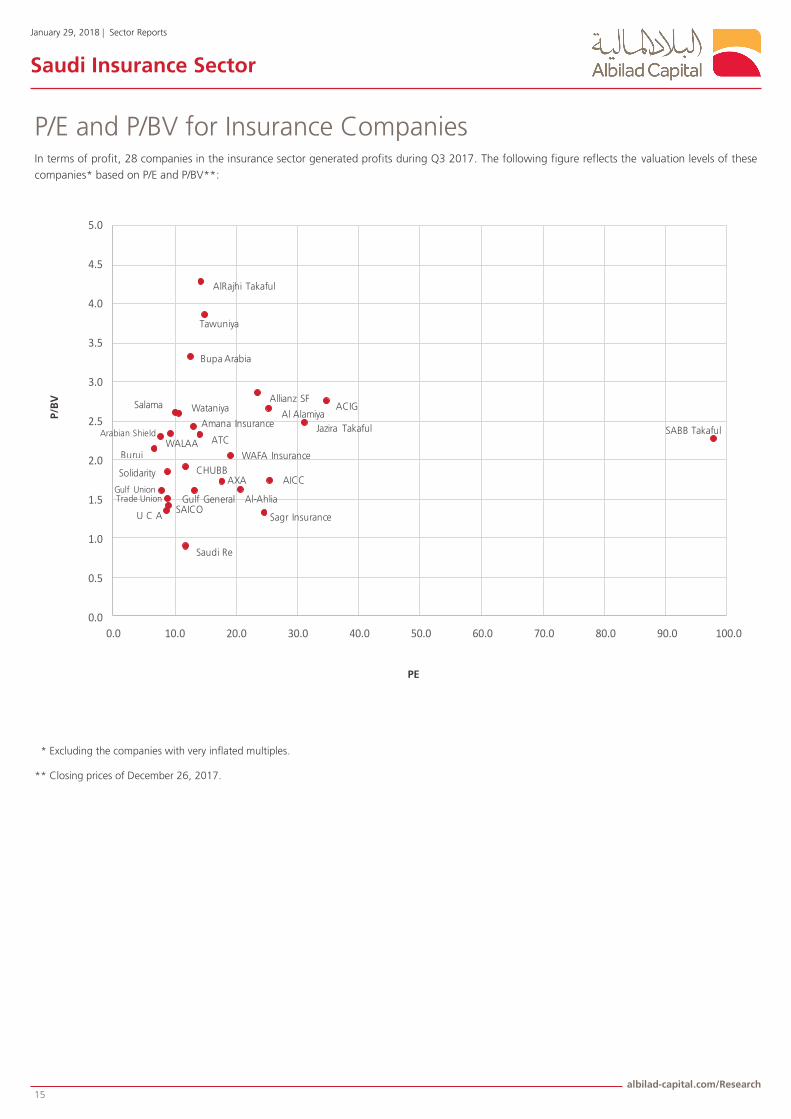
P/E and P/BV for Insurance Companies In terms of profit, 28 companies in the insurance sector generated profits during Q3 2017. The following figure reflects the valuation levels of these
companies* based on P/E and P/BV**:
* Excluding the companies with very inflated multiples.
** Closing prices of December 26, 2017.
PE
P/B
V
Tawuniya
Jazira Takaful
Allianz SFSalama
WALAAArabian Shield SABB Takaful
SAICO
WAFA Insurance
Gulf Union
ATC
Al-Ahlia
ACIG
AICC
Trade Union
Sagr InsuranceU C A
Saudi Re
Bupa Arabia
AlRajhi Takaful
CHUBBAXA
Gulf General
Buruj
Al Alamiya
Solidarity
Wataniya
Amana Insurance
0.0
0.5
1.0
1.5
2.0
2.5
3.0
3.5
4.0
4.5
5.0
0.0 10.0 20.0 30.0 40.0 50.0 60.0 70.0 80.0 90.0 100.0
January 29, 2018 | Sector Reports
Saudi Insurance Sector
albilad-capital.com/Research 16
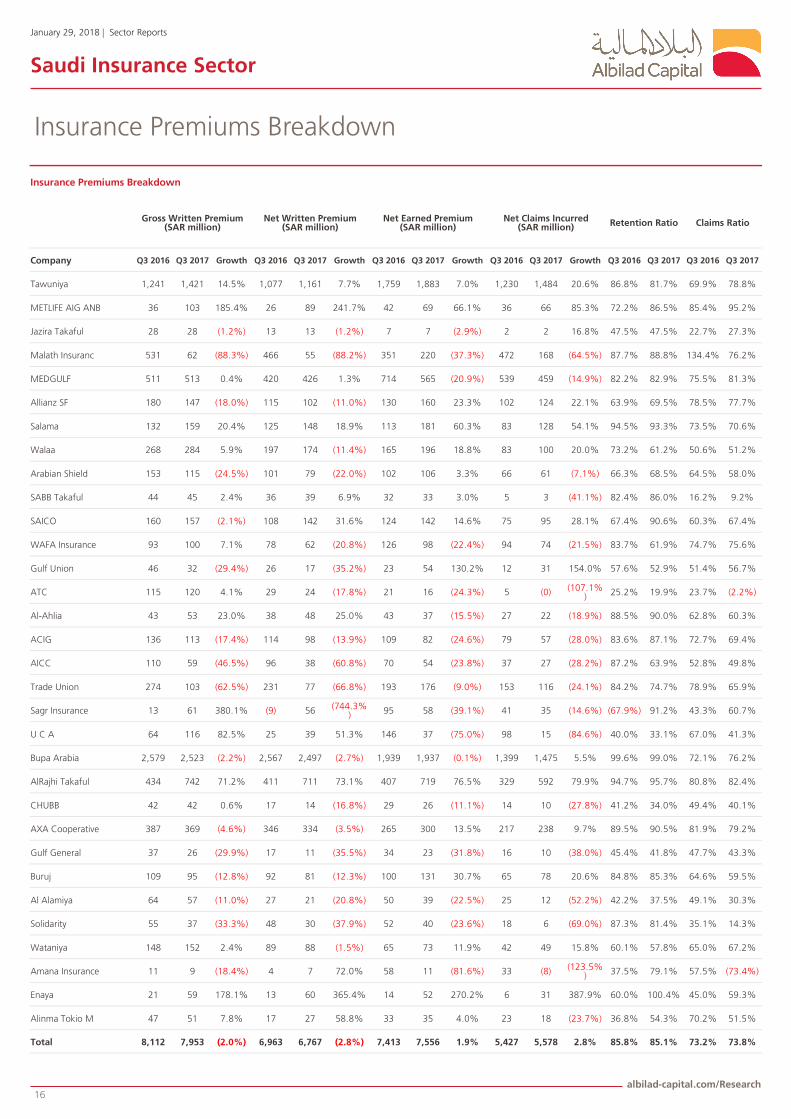
Insurance Premiums Breakdown
Insurance Premiums Breakdown
Gross Written Premium (SAR million)
Net Written Premium (SAR million)
Net Earned Premium (SAR million)
Net Claims Incurred (SAR million) Retention Ratio Claims Ratio
Company Q3 2016 Q3 2017 Growth Q3 2016 Q3 2017 Growth Q3 2016 Q3 2017 Growth Q3 2016 Q3 2017 Growth Q3 2016 Q3 2017 Q3 2016 Q3 2017
Tawuniya 1,241 1,421 14.5% 1,077 1,161 7.7% 1,759 1,883 7.0% 1,230 1,484 20.6% 86.8% 81.7% 69.9% 78.8%
METLIFE AIG ANB 36 103 185.4% 26 89 241.7% 42 69 66.1% 36 66 85.3% 72.2% 86.5% 85.4% 95.2%
Jazira Takaful 28 28 (1.2%) 13 13 (1.2%) 7 7 (2.9%) 2 2 16.8% 47.5% 47.5% 22.7% 27.3%
Malath Insuranc 531 62 (88.3%) 466 55 (88.2%) 351 220 (37.3%) 472 168 (64.5%) 87.7% 88.8% 134.4% 76.2%
MEDGULF 511 513 0.4% 420 426 1.3% 714 565 (20.9%) 539 459 (14.9%) 82.2% 82.9% 75.5% 81.3%
Allianz SF 180 147 (18.0%) 115 102 (11.0%) 130 160 23.3% 102 124 22.1% 63.9% 69.5% 78.5% 77.7%
Salama 132 159 20.4% 125 148 18.9% 113 181 60.3% 83 128 54.1% 94.5% 93.3% 73.5% 70.6%
Walaa 268 284 5.9% 197 174 (11.4%) 165 196 18.8% 83 100 20.0% 73.2% 61.2% 50.6% 51.2%
Arabian Shield 153 115 (24.5%) 101 79 (22.0%) 102 106 3.3% 66 61 (7.1%) 66.3% 68.5% 64.5% 58.0%
SABB Takaful 44 45 2.4% 36 39 6.9% 32 33 3.0% 5 3 (41.1%) 82.4% 86.0% 16.2% 9.2%
SAICO 160 157 (2.1%) 108 142 31.6% 124 142 14.6% 75 95 28.1% 67.4% 90.6% 60.3% 67.4%
WAFA Insurance 93 100 7.1% 78 62 (20.8%) 126 98 (22.4%) 94 74 (21.5%) 83.7% 61.9% 74.7% 75.6%
Gulf Union 46 32 (29.4%) 26 17 (35.2%) 23 54 130.2% 12 31 154.0% 57.6% 52.9% 51.4% 56.7%
ATC 115 120 4.1% 29 24 (17.8%) 21 16 (24.3%) 5 (0) (107.1%) 25.2% 19.9% 23.7% (2.2%)
Al-Ahlia 43 53 23.0% 38 48 25.0% 43 37 (15.5%) 27 22 (18.9%) 88.5% 90.0% 62.8% 60.3%
ACIG 136 113 (17.4%) 114 98 (13.9%) 109 82 (24.6%) 79 57 (28.0%) 83.6% 87.1% 72.7% 69.4%
AICC 110 59 (46.5%) 96 38 (60.8%) 70 54 (23.8%) 37 27 (28.2%) 87.2% 63.9% 52.8% 49.8%
Trade Union 274 103 (62.5%) 231 77 (66.8%) 193 176 (9.0%) 153 116 (24.1%) 84.2% 74.7% 78.9% 65.9%
Sagr Insurance 13 61 380.1% (9) 56 (744.3%) 95 58 (39.1%) 41 35 (14.6%) (67.9%) 91.2% 43.3% 60.7%
U C A 64 116 82.5% 25 39 51.3% 146 37 (75.0%) 98 15 (84.6%) 40.0% 33.1% 67.0% 41.3%
Bupa Arabia 2,579 2,523 (2.2%) 2,567 2,497 (2.7%) 1,939 1,937 (0.1%) 1,399 1,475 5.5% 99.6% 99.0% 72.1% 76.2%
AlRajhi Takaful 434 742 71.2% 411 711 73.1% 407 719 76.5% 329 592 79.9% 94.7% 95.7% 80.8% 82.4%
CHUBB 42 42 0.6% 17 14 (16.8%) 29 26 (11.1%) 14 10 (27.8%) 41.2% 34.0% 49.4% 40.1%
AXA Cooperative 387 369 (4.6%) 346 334 (3.5%) 265 300 13.5% 217 238 9.7% 89.5% 90.5% 81.9% 79.2%
Gulf General 37 26 (29.9%) 17 11 (35.5%) 34 23 (31.8%) 16 10 (38.0%) 45.4% 41.8% 47.7% 43.3%
Buruj 109 95 (12.8%) 92 81 (12.3%) 100 131 30.7% 65 78 20.6% 84.8% 85.3% 64.6% 59.5%
Al Alamiya 64 57 (11.0%) 27 21 (20.8%) 50 39 (22.5%) 25 12 (52.2%) 42.2% 37.5% 49.1% 30.3%
Solidarity 55 37 (33.3%) 48 30 (37.9%) 52 40 (23.6%) 18 6 (69.0%) 87.3% 81.4% 35.1% 14.3%
Wataniya 148 152 2.4% 89 88 (1.5%) 65 73 11.9% 42 49 15.8% 60.1% 57.8% 65.0% 67.2%
Amana Insurance 11 9 (18.4%) 4 7 72.0% 58 11 (81.6%) 33 (8) (123.5%) 37.5% 79.1% 57.5% (73.4%)
Enaya 21 59 178.1% 13 60 365.4% 14 52 270.2% 6 31 387.9% 60.0% 100.4% 45.0% 59.3%
Alinma Tokio M 47 51 7.8% 17 27 58.8% 33 35 4.0% 23 18 (23.7%) 36.8% 54.3% 70.2% 51.5%
Total 8,112 7,953 (2.0%) 6,963 6,767 (2.8%) 7,413 7,556 1.9% 5,427 5,578 2.8% 85.8% 85.1% 73.2% 73.8%
January 29, 2018 | Sector Reports
Saudi Insurance Sector
albilad-capital.com/Research 17
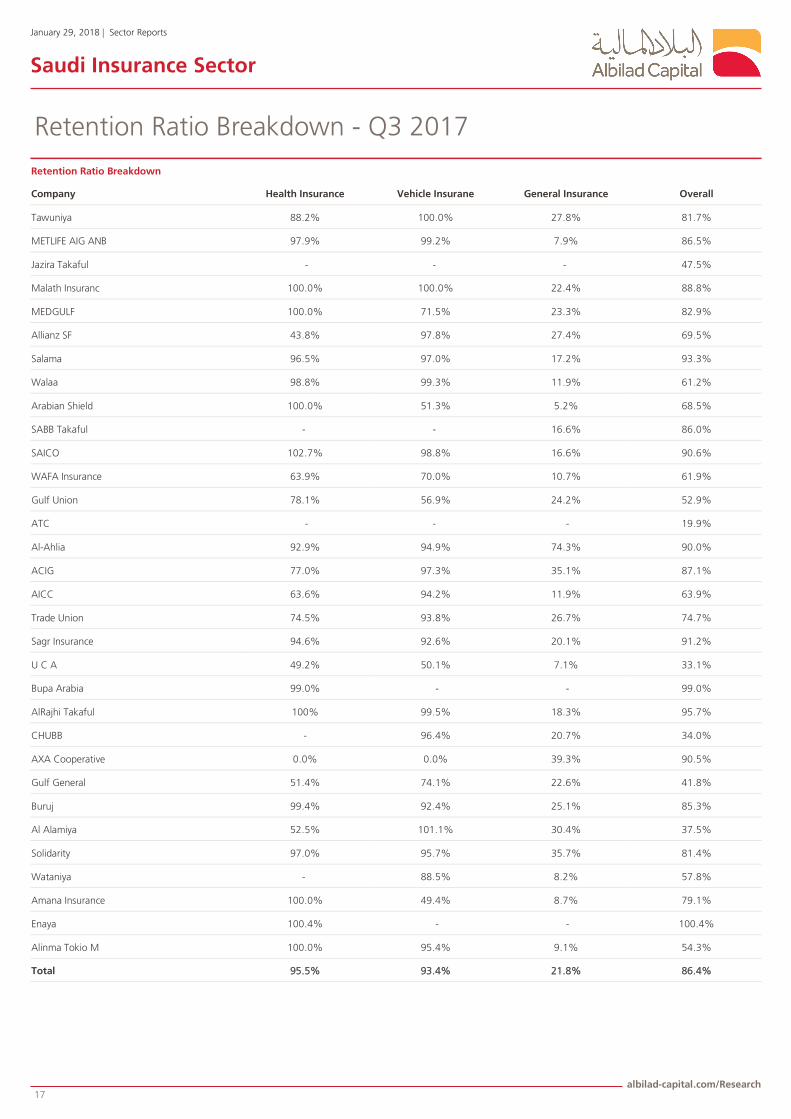
Retention Ratio Breakdown - Q3 2017
Retention Ratio Breakdown
Overall General Insurance Vehicle Insurane Health Insurance Company
81.7% 27.8% 100.0% 88.2% Tawuniya
86.5% 7.9% 99.2% 97.9% METLIFE AIG ANB
47.5% - - - Jazira Takaful
88.8% 22.4% 100.0% 100.0% Malath Insuranc
82.9% 23.3% 71.5% 100.0% MEDGULF
69.5% 27.4% 97.8% 43.8% Allianz SF
93.3% 17.2% 97.0% 96.5% Salama
61.2% 11.9% 99.3% 98.8% Walaa
68.5% 5.2% 51.3% 100.0% Arabian Shield
86.0% 16.6% - - SABB Takaful
90.6% 16.6% 98.8% 102.7% SAICO
61.9% 10.7% 70.0% 63.9% WAFA Insurance
52.9% 24.2% 56.9% 78.1% Gulf Union
19.9% - - - ATC
90.0% 74.3% 94.9% 92.9% Al-Ahlia
87.1% 35.1% 97.3% 77.0% ACIG
63.9% 11.9% 94.2% 63.6% AICC
74.7% 26.7% 93.8% 74.5% Trade Union
91.2% 20.1% 92.6% 94.6% Sagr Insurance
33.1% 7.1% 50.1% 49.2% U C A
99.0% - - 99.0% Bupa Arabia
95.7% 18.3% 99.5% 100% AlRajhi Takaful
34.0% 20.7% 96.4% - CHUBB
90.5% 39.3% 0.0% 0.0% AXA Cooperative
41.8% 22.6% 74.1% 51.4% Gulf General
85.3% 25.1% 92.4% 99.4% Buruj
37.5% 30.4% 101.1% 52.5% Al Alamiya
81.4% 35.7% 95.7% 97.0% Solidarity
57.8% 8.2% 88.5% - Wataniya
79.1% 8.7% 49.4% 100.0% Amana Insurance
100.4% - - 100.4% Enaya
54.3% 9.1% 95.4% 100.0% Alinma Tokio M
86.4% 21.8% 93.4% 95.5% Total

January 29, 2018 | Sector Reports
Saudi Insurance Sector
albilad-capital.com/Research 18
Definitions
Gross Written Premium:
The total premiums on policies issued by an insurance company during a specific period of time regardless of what portions have been earned. Writ-
ten premiums are the amount of premium charged for a policy that has already become effective.
Net Written Premium:
It is equal to gross premium written minus the amount the company allocated for reinsurance, as well as premium losses surplus.
Net Earned Premium :
The amount of total premiums collected by an insurance company over a period that have been earned based on the ratio of the time passed on the
policies to their effective life and adjusted to reinsurance. This pro-rated amount of paid-in-advance premiums have been "earned" and now belong
to the insurer. It can be calculated as net premiums written minus changes in net premiums unearned.
Net Claims Paid:
Total amount of paid liabilities for a policy over a given valuation period minus reinsurers share.
Net Claims Incurred:
Net claims paid plus a reasonable estimate of unpaid liabilities. It is calculated by adding paid claims and unpaid claims minus the estimate of unpaid
claims at the end of the prior valuation period.
Retention Ratio:
Percentage of net premium written to gross premium written.
Claims Ratio:
Claims owed as a percentage of net premium earned.
January 29, 2018 | Sector Reports
Saudi Insurance Sector
albilad-capital.com/Research 19
Albilad Capital
Client Services
E-mail: [email protected]
Tel: +966-11-203-9888
Toll-free: 800-116-0001
Asset Management
E-mail: [email protected]
Tel: +966-11-290-6280
Research & Advisory
E-mail: [email protected]
Tel: +966-11-290-6520
Website: www.albilad-capital.com/
Brokerage
E-mail: [email protected]
Tel: +966-11-290-6230
Investment Banking
E-mail: [email protected]
Tel: +966-11-290-6256
Disclaimer
AlBilad Capital exerted utmost efforts to ensure that the information included in this report is accurate and correct. However, Albilad Capital, its managers,
and staff bear no liability whether explicitly or implicitly for the content of the report and no legal responsibility, whether directly or indirectly, for any results
based on it.
This report should not be reproduced, redistributed, or sent directly or indirectly to any other party or published in full or in part for any purpose whatsoever
without a prior written permission from AlBilad Capital.
We would also like to note that this information in no way constitutes a recommendation to buy or sell banknotes or make any investment decisions.
Any investment act taken by an investor based fully or partially on this report is the complete responsibility of the investor.
This report is not meant to be used or seen as advice or an option or any other measure to be taken in the future. We recommend consulting a qualified in-
vestment advisor before investing in these investment tools.
AlBilad Capital preserves all rights associated with this report.
CMA Authorization Number 08100-37


![Takaful Insurance final for print out [Read-Only]€¦ · What is Takaful Insurance ? • Takaful—“bear ye one another’s burden.” Takaful insurance is based on the concept](https://img.pdfslide.us/doc/110x75/5f09a9447e708231d427e84c/takaful-insurance-final-for-print-out-read-only-what-is-takaful-insurance-a.jpg)