Embed Size (px)
Citation preview

60 years of average annual temperature rise …
cooler
warmer

Since 1955 • Average Annual mean temperature has risen by 1.60C • Average Spring mean temperature has risen by 1.90C • Average Winter mean temperature has risen by 2.40C
Sudbury

• Average Annual min temp has risen by 1.40C • Average Spring min temp has risen by 10C • Average Winter min temp has risen by 2.40C

Since 1955 • Average Spring max temp has risen by 2.4 0C ... Days are warmer • Average Summer max temp has risen by 10C

Since 1955 • Average annual max temp has risen by 1.80C • Average Fall max temp has risen by 10C

Warming is not uniform geographically …

Regional distribution of linear annual precipitation trends (% change) between 1948 and 2003. "X" indicates areas where the trend is statistically significant. .
Zhang et al. (2000), updated in 2005 NRCan 2007
Annual precipitation


Since 1955 • Total annual precipitation has increased by about 12% or 100m • Total summer precipitation has not changed • Total winter precipitation has increased by about 25% or 40mm • Total Fall precipitation has increased by about 4% or 10mm • Total Spring precipitation has increased by about 30% or 50mm

The global situation - the Earth is getting warmer …
John Holdren


Chiras, 2001
The greenhouse effect Most radiation (short wave) from the very hot sun penetrates the atmosphere and warms the Earth’s surface
Some radiation from a warmed Earth (long wave) is captured by water vapour and gases (e.g.CO2) in the atmosphere forming a warm “blanket” around the planet. More CO2 increases H2O
through evaporation

1961-1990 average temperature
temperature
aerosol cooling
CO2 warming
Variability in Sun + volcanoes+ CO2
CO2 warming
CO2 now the dominant factor
CO2 is one of several factors affecting global temperature
rising carbon dioxide
IPCC
280 ppm
380 ppm

Vostok Drilling Station Antarctica

Vostok

Vostok

450,000 year record of CO2 and temperature in an Antarctic ice core (Vostok)
First rise in temp comes before CO2 increase until release of ocean CO2 drives warming about 600 yrs later
interglacial warming
cold
warm
cold
Interglacial warming because of
1. Changes in geometry of Earth’s orbit
2. Release of CO2 from warmer ocean water

Geometry of Earth’s orbit
Earth’s orbit changes from nearly circular to elliptical and back over about 100,000 years. We are now about 5 million km (3%) closer to the Sun in January than in July
The tilt of the axis of rotation changes from an angle of 21.5o to 24.5o and back over 41,000 years. It is currently 23.4o
The Earth’s axis wobbles like a top over a cycle of 26,000 yrs, shifting the seasons around the orbit. Vega was the “North Star” 13,000 years ago.
Low tilt + more distance in summer = cool temp = survival of snow = Ice Age

Atlantic Ocean current system
• deep currents take 500 yrs to travel the length of the ocean
• cold deep water loses dissolved CO2 at warm ocean surface

“Massive changes in climate have occurred in the past - today’s trend is nothing new”…
Sounds good but is it really ?
45 million years ago • Redwood forests in the Arctic • Temperate climate plant fossils in Alaska and Greenland
70 million years ago • Dinosaur fossils found within 15 degrees of the South Pole • Earth was 9 – 12 o C warmer • Sea level was much higher • No ice at poles

Global geography in the geological past
Little water between South America and Antarctica
Australia joined to Antarctica
Efficient equatorial currents deliver energy to polar North Atlantic
Open water connects
Pacific to Atlantic
Himalayan Seaway
open
66 mill yrs ago

Pacific
Atlantic
Panama land bridge
The Panama land bridge formed from a chain of volcanoes 3 million yrs ago cutting circulation between the Atlantic and Pacific. Ice caps formed in the N. Hemisphere 2 million yrs ago

Melting Arctic icecap

29 April 2006 NASA/Goddard Space Flight Center Scientific Visualization Studio

NASA/Goddard Space Flight Center Scientific Visualization Studio
14 Nov 2005

Jeff Schmaltz NASA
21 May, 2005
Day of the year when the Western Hudson Bay ice cover decreased to 50% or less
July 3
June 13
Jeff Schmaltz NASA
Hudson Bay Earlier break up in south and west
0.5 to 1.25 days / yr
Later freeze up in north and north east 0.3 to 0.5 days / yr
Gagnon, A.S. and W.A. Gough ARCTIC 58, 4. 2005
NASA Nimbus 7
Trend shows ice breaking up 7-8 days earlier per decade

Magali Lesauvage
GSC Harvey Thorleifson
Polar feedback

Precipitation trends are also not uniform … and may be shifting
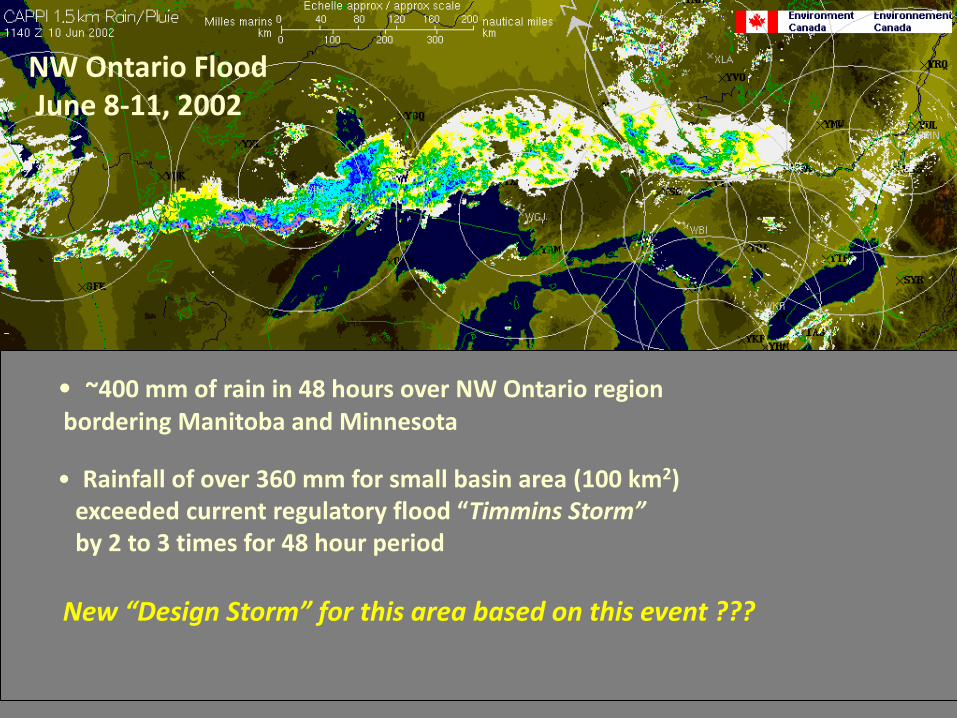
• ~400 mm of rain in 48 hours over NW Ontario region
bordering Manitoba and Minnesota
• Rainfall of over 360 mm for small basin area (100 km2) exceeded current regulatory flood “Timmins Storm” by 2 to 3 times for 48 hour period
New “Design Storm” for this area based on this event ???
NW Ontario Flood June 8-11, 2002

Frequency or
Probability of
occurrence
(e.g.1 in 80 yrs)
Values of Climatic Attribute (X)
X
Coping Range
Current Climate
Greater
probability of
extremes beyond
the coping
range under
changed climate
Xcc
Changed Climate
After Barry Smit 2001
But will the tail of extremes
really be this shape ?
Monitor events
Shifting averages shift extremes too …

crazyjew.net
Finch Avenue washout, August 2005 Damaging 2 high pressure gas mains, drinking water
main, telephone, hydro, and cable lines.

Egginton and Lavender
Projecting the trend of yesterday’s climate …

Projected change in average seasonal air temperature (0 C ) over Ontario for 2050s compared with 1961 – 1990 under MODERATE GHG emissions (average of A1B and B2 emission scenarios using ensemble of 24 GCMs) CCCSN / Environment Canada. Courtesy Neil Comer
Winter
Spring
Summer
Fall
(Environment Canada CCCSN 2009)

UKCIP
Vulnerability evident Adaptation
Coping range
Residual risk

Guelph SmartCentres Walmart parking lot
Daily Commercial News. 24 Aug 2007
Artist’s rendering of the parking lot
subsurface
Parking lot drains to collection system that
allows removal of oil and grease followed by
infiltration into groundwater. Avoids adding load to the
stormwater system while helping recharge the underlying aquifer.
CULTEC


beyond collective adaptation
Limits to adaptation - cumulative critical impacts
EU goal “dangerous”
Inevitable intolerable


Boundary of Far North for illustration only
No time to lose ...
finding a framework for change, change
and more change
David Pearson Laurentian University
1 March 2011


Change in highest 5 day pptn amount (%) 1950 - 2003
“Overall, these results suggest that the increase in the annual total precipitation observed during the second half of the century is due mostly to more days with precipitation with no consistent changes being found in most extreme precipitation indices.” Vincent and Mekis (2006)
However, it is important to note that the footprint of extreme rain events can be very small and not observed by met stations – e.g. Finch Avenue, 2005
Vincent and Mekis, 2006

Climate change needs a two part response …
• Adapting to changing weather patterns that have begun and future changes that are bound to occur because of past and near future emissions
• Limiting (mitigating) future climate change by reducing ghg emissions to the atmosphere … including green energy, conservation, carbon capture and storage and protecting existing carbon stores – e.g. peatlands of Far North Ontario

http://www.adaptation.nrcan.gc/change/pdf/cciad.highlights_e.pdf

Where we might be headed:
The next 100 years compared to the last 400
Coloured lines pre-2000 are proxy-based average temperature reconstructions by different groups. Gray wedge 2010-2100 shows the range of temperature scenarios for the future developed by the Inter-governmental Panel on Climate Change.
Continuation of recent trends (middle of band) leads by 2100 to temperatures not reached since ~30 million years ago, when sea level was 20-30 m higher.
European Union goal, adopted 2002, is not to exceed 20C above pre-industrial temperature.
John Holdren, 2007

U West Aus
MEGA ADAPTATION
The Thames Barrier. To protect London, U.K., from
extreme floods caused by rain, spring tide and storm surges
compounded by rising sea level in the English Channel


Holdren 2010
As water warms it expands and sea level rises …

Potential impact of sea level rise on the Nile delta Impact of sea level rise is not only loss of homes but also •Destruction of sand bars protecting lagoons and reclaimed land •One third of Egypt’s fish catch comes from the lagoons
•Agricultural land lost •Alexandria, Port Said plus tourist resorts flooded •Ground water becomes salty (Dykes could lessen flooding from 0.5m rise but not the salination of ground water)

Karl Schiefer EcoMetrix Georgian Bay “Dry Docks”

NASA

Great Lakes Atlas EPA / EC 1995 3rd edition

Lake effect snow - December 26, 2009

Extent of the 1998 Ice Storm in eastern Ontario, southwest Quebec, New Brunswick, and parts of New York, Vermont, New Hampshire, and Maine. Colours show the accumulation of ice in mm from January 4th to 10th, 1998.
Norman Einstein from Env. Canada data
… and January, 1998

Mich Tech
Air masses “teleconnect” the Great Lakes to El Nino and La
Nina ocean cycles in the Pacific and to the North
Atlantic Oscillation
(Wang, B.J., X. Bai, G. Leshkevich, M. Colton, A. Clites, and B. Lorgren. 2010. Severe Ice Cover on Great Lakes During Winter 2008–2009. Eos, Transactions of the American Geophysical Union, 91, 41-52.)

Conservation Ontario

Lorraine Maclauchlan, BC Ministry of Forests
Mountain pine beetle damage in lodgepole pine, B.C.


European Union policy recognizes 2 0C as onset of “dangerous” climate change
Dangerous and globally destabilizing impacts
What were they thinking ?

NO, NO, NO. Climate change
is NOT a path to
prosperity